annual site environmental report · rights. reference herein to any specific commercial product,...
TRANSCRIPT
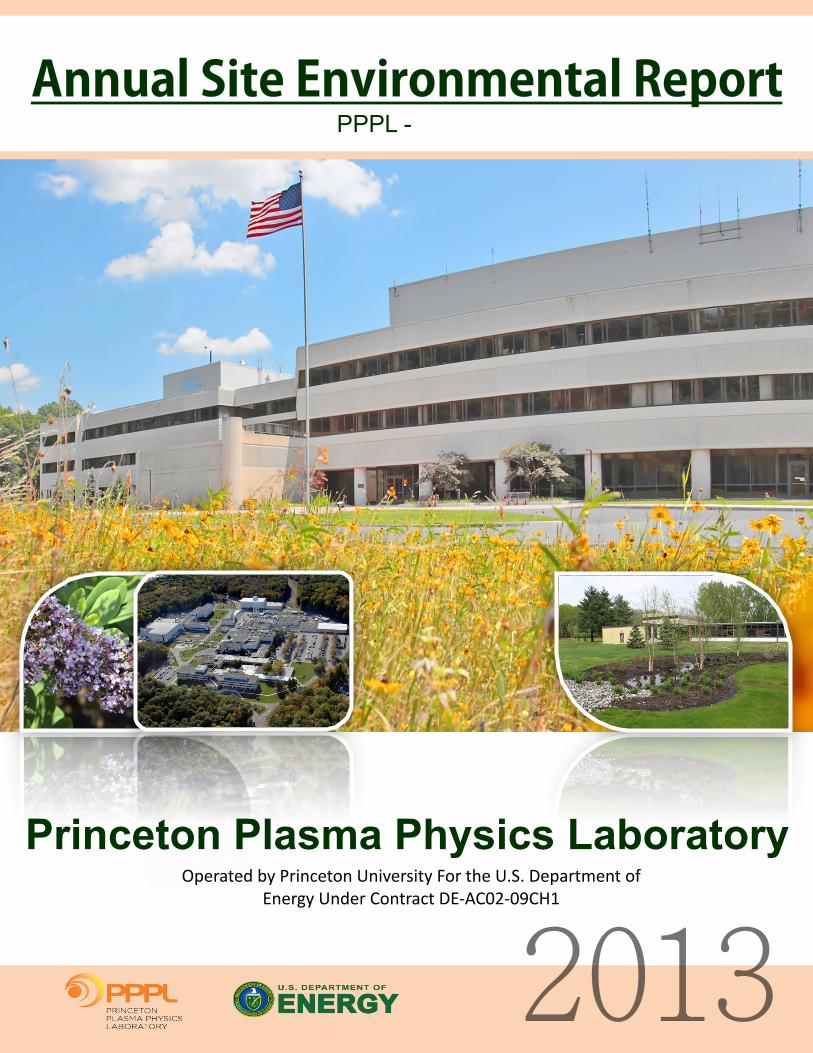
2013
PPPL - Annual Site Environmental Report
Princeton Plasma Physics Laboratory Operated by Princeton University For the U.S. Department of
Energy Under Contract DE-‐AC02-‐09CH1
Princeton Plasma Physics Laboratory Report Disclaimers
Full Legal Disclaimer
This report was prepared as an account of work sponsored by an agency of the United States Government. Neither the United States Government nor any agency thereof, nor any of their employees, nor any of their contractors, subcontractors or their employees, makes any warranty, express or implied, or assumes any legal liability or responsibility for the accuracy, completeness, or any third party’s use or the results of such use of any information, apparatus, product, or process disclosed, or represents that its use would not infringe privately owned rights. Reference herein to any specific commercial product, process, or service by trade name, trademark, manufacturer, or otherwise, does not necessarily constitute or imply its endorsement, recommendation, or favoring by the United States Government or any agency thereof or its contractors or subcontractors. The views and opinions of authors expressed herein do not necessarily state or reflect those of the United States Government or any agency thereof.
Trademark Disclaimer
Reference herein to any specific commercial product, process, or service by trade name, trademark, manufacturer, or otherwise, does not necessarily constitute or imply its endorsement, recommendation, or favoring by the United States Government or any agency thereof or its contractors or subcontractors.
PPPL Report Availability
Princeton Plasma Physics Laboratory:
http://www.pppl.gov/techreports.cfm Office of Scientific and Technical Information (OSTI):
http://www.osti.gov/scitech/
Related Links: U.S. Department of Energy Office of Scientific and Technical Information
2013 Annual Site Environmental Report Table of Contents
Table of Contents Page i
EXECUTIVE SUMMARY ......................................................................................................................... 1
1.0 INTRODUCTION ........................................................................................................................... 5 1.1 Site Mission ................................................................................................................................. 5 1.2 Site Location ................................................................................................................................ 5 1.3 General Environmental Setting ................................................................................................... 8 1.4 Primary Operations and Activities ............................................................................................... 9 1.5 Relevant Demographic Information ............................................................................................ 9
2.0 2013 COMPLIANCE SUMMARY AND COMMUNITY INVOLVEMENT ......................................... 10 2.1 Laws and Regulations .................................................................................................................. 10 2.2 Site Compliance and Environmental Management System (EMS) Assessments ........................ 10 2.3 Environmental Permits ................................................................................................................ 10 2.4 External Oversight and Assessments .......................................................................................... 17 2.5 Emergency Reporting of Spills and Releases ............................................................................... 17 2.6 Notice of Violations and Penalities ............................................................................................. 17 2.7 Community Involvement ............................................................................................................. 18
2.7.1 Earth Week and America Recycles Day at PPPL .......................................................... 18 2.7.2 PPPL's Open House ‐ June 2013 .................................................................................. 19 3.0 ENVIRONMENTAL MANAGEMENT SYSTEM (EMS) .................................................................... 21 3.1 DOE Sustainability Goals ............................................................................................................. 21
3.1.1 Energy Efficiency ......................................................................................................... 21 3.1.2 Renewable Energy ....................................................................................................... 22 3.1.3 Greenhouse Gas Emssions .......................................................................................... 22 3.1.4 Fleet Management ...................................................................................................... 23 3.1.5 Water Efficiency .......................................................................................................... 24 3.2 Energy Efficient "Green" Buildings .............................................................................................. 25 3.3 Sustainability Awards .................................................................................................................. 25
4.0 ENVIRONMENTAL NON‐RADIOLOGICAL PROGRAM INFORMATION ....................................... 28 4.1 Non‐Radiological Water Programs .............................................................................................. 29
4.1.1 New Jersey Pollutant Discharge Elimination System (NJPDES) Program .................... 29 A. Monthly Discharge Monitoring Reports (DMR) ..................................................... 29 B. Acute Toxicity Study ............................................................................................... 31 C. Chronic Whole Effluent Toxicity Study ................................................................... 31
D. Waste Characterization Report (WCR) ................................................................. 31 4.1.2 Lined Surface Impoundment Permit (LSI) ................................................................... 32 4.1.3 Ground Water ............................................................................................................. 32
A. NJPDES Ground Water Program ............................................................................ 32 B. Regional Ground Water Monitoring Program ....................................................... 33
4.1.4 Metered Water ........................................................................................................... 33 A. Drinking (Potable) Water ....................................................................................... 33
B. Process (Non‐potable) Water ................................................................................ 33 C. Surface Water ........................................................................................................ 34
D. Sanitary Sewage ..................................................................................................... 34
2013 Annual Site Environmental Report Table of Contents
Page ii Table of Contents
4.2 Non‐Radiological Waste Programs .............................................................................................. 34
4.2.1 Hazardous Waste Program ......................................................................................... 34 A. Toxic Substance Control Act (TSCA) ....................................................................... 34 B. Hazardous Waste/Universal Waste ....................................................................... 35
C. Recycled Hazardous Waste ................................................................................... 35 4.3 Environmental Protection Programs ........................................................................................... 35
4.3.1 Release Programs ....................................................................................................... 35 A. Spill Prevention Control and Countermeasure (SPCC) .......................................... 35 B. Comprehensive Environmental Response, Compensation, and Liability Act (CERCLA) Continuous Release Reporting ........................................... 35
C. Superfund Amendment Reauthorization Act (SARA) Title III Reporting Requirements ......................................................................................................... 35
4.3.2 Environmental Releases .............................................................................................. 36 4.3.3 Pollution Prevention Program .................................................................................... 37
4.4 Non‐Radiological Emissions Monitoring Programs ..................................................................... 37 4.5 Land Resources and Conservation .............................................................................................. 39
4.5.1 Wetlands Letter of Interpretation (LOI) ...................................................................... 39 4.5.2 Soil Erosion and Landscaping ...................................................................................... 39 4.5.3 Herbicides and Fertilizers ............................................................................................ 39 4.5.4 Stormwater Pollution Prevention ............................................................................... 39
4.6 Safety ........................................................................................................................................... 40 5.0 ENVIRONMENTAL RADIOLOGICAL PROGRAM INFORMATION ................................................. 41 5.1 Radiological Emissions and Doses ............................................................................................... 41
5.1.1 Penetrating Radiation ................................................................................................. 42 5.1.2 Sanitary Sewage ......................................................................................................... 42 5.1.3 Radioactive Waste ..................................................................................................... 44 5.1.4 Airborne Emissions ‐ Differential Atmospheric Tritium Samplers (DATS) ................. 44
5.2 Release of Property Containing Residual Radioactive Material .................................................. 45 5.3 Protection of Biota ...................................................................................................................... 43 5.4 Unplanned Releases .................................................................................................................... 45 5.5 Environmental Radiological Monitoring ..................................................................................... 45
5.5.1 Waterborne Radioactivity ........................................................................................... 45 A. Surface Water ........................................................................................................ 45 B. Ground Water ........................................................................................................ 45
C. Drinking (Potable) Water ........................................................................................ 46 5.5.2 Foodstuffs, Soil, and Vegetation ................................................................................. 46
6.0 SITE HYDROLOGY, GROUNDWATER MONITORING, AND DRINKING WATER PROTECTION .... 47 6.1 Lower Raritan River Watershed .................................................................................................. 47 6.2 Geology and Topography ............................................................................................................ 48 6.3 Biota ............................................................................................................................................ 49 6.4 Flood Plain ................................................................................................................................... 49 6.5 Groundwater Monitoring ........................................................................................................... 50
6.5.1 Monitoring Wells ........................................................................................................ 50 6.5.2 Sampling Events .......................................................................................................... 51 6.5.3 Remedial Action Work Plan (RAWP) ........................................................................... 53
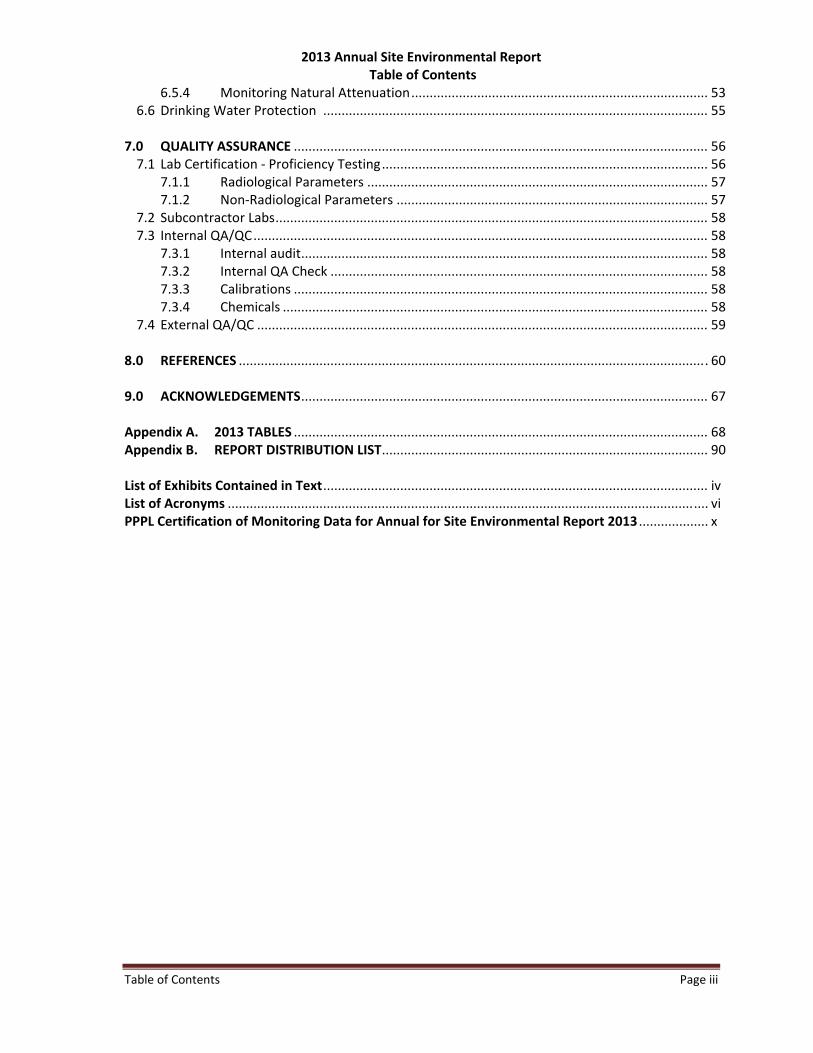
2013 Annual Site Environmental Report Table of Contents
Table of Contents Page iii
6.5.4 Monitoring Natural Attenuation ................................................................................. 53 6.6 Drinking Water Protection ......................................................................................................... 55
7.0 QUALITY ASSURANCE ................................................................................................................. 56 7.1 Lab Certification ‐ Proficiency Testing ......................................................................................... 56
7.1.1 Radiological Parameters ............................................................................................. 57 7.1.2 Non‐Radiological Parameters ..................................................................................... 57
7.2 Subcontractor Labs ...................................................................................................................... 58 7.3 Internal QA/QC ............................................................................................................................ 58
7.3.1 Internal audit ............................................................................................................... 58 7.3.2 Internal QA Check ....................................................................................................... 58 7.3.3 Calibrations ................................................................................................................. 58 7.3.4 Chemicals .................................................................................................................... 58
7.4 External QA/QC ........................................................................................................................... 59 8.0 REFERENCES ................................................................................................................................ 60 9.0 ACKNOWLEDGEMENTS ............................................................................................................... 67 Appendix A. 2013 TABLES ................................................................................................................. 68 Appendix B. REPORT DISTRIBUTION LIST ......................................................................................... 90 List of Exhibits Contained in Text ......................................................................................................... iv List of Acronyms ................................................................................................................................... vi PPPL Certification of Monitoring Data for Annual for Site Environmental Report 2013 ................... x
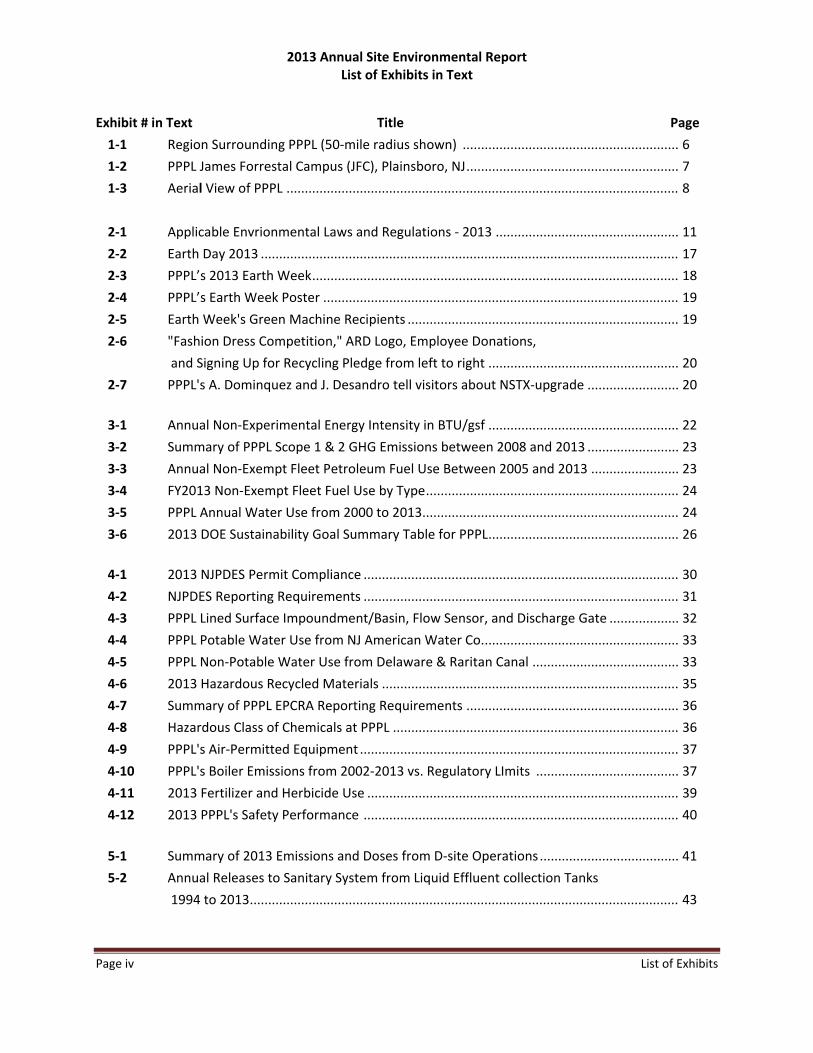
2013 Annual Site Environmental Report List of Exhibits in Text
Page iv List of Exhibits
Exhibit # in Text Title Page
1‐1 Region Surrounding PPPL (50‐mile radius shown) ........................................................... 6
1‐2 PPPL James Forrestal Campus (JFC), Plainsboro, NJ .......................................................... 7
1‐3 Aerial View of PPPL ........................................................................................................... 8
2‐1 Applicable Envrionmental Laws and Regulations ‐ 2013 .................................................. 11
2‐2 Earth Day 2013 .................................................................................................................. 17
2‐3 PPPL’s 2013 Earth Week .................................................................................................... 18
2‐4 PPPL’s Earth Week Poster ................................................................................................. 19
2‐5 Earth Week's Green Machine Recipients .......................................................................... 19
2‐6 "Fashion Dress Competition," ARD Logo, Employee Donations,
and Signing Up for Recycling Pledge from left to right .................................................... 20
2‐7 PPPL's A. Dominquez and J. Desandro tell visitors about NSTX‐upgrade ......................... 20
3‐1 Annual Non‐Experimental Energy Intensity in BTU/gsf .................................................... 22
3‐2 Summary of PPPL Scope 1 & 2 GHG Emissions between 2008 and 2013 ......................... 23
3‐3 Annual Non‐Exempt Fleet Petroleum Fuel Use Between 2005 and 2013 ........................ 23
3‐4 FY2013 Non‐Exempt Fleet Fuel Use by Type ..................................................................... 24
3‐5 PPPL Annual Water Use from 2000 to 2013 ...................................................................... 24
3‐6 2013 DOE Sustainability Goal Summary Table for PPPL .................................................... 26
4‐1 2013 NJPDES Permit Compliance ...................................................................................... 30
4‐2 NJPDES Reporting Requirements ...................................................................................... 31
4‐3 PPPL Lined Surface Impoundment/Basin, Flow Sensor, and Discharge Gate ................... 32
4‐4 PPPL Potable Water Use from NJ American Water Co. ..................................................... 33
4‐5 PPPL Non‐Potable Water Use from Delaware & Raritan Canal ........................................ 33
4‐6 2013 Hazardous Recycled Materials ................................................................................. 35
4‐7 Summary of PPPL EPCRA Reporting Requirements .......................................................... 36
4‐8 Hazardous Class of Chemicals at PPPL .............................................................................. 36
4‐9 PPPL's Air‐Permitted Equipment ....................................................................................... 37
4‐10 PPPL's Boiler Emissions from 2002‐2013 vs. Regulatory LImits ....................................... 37
4‐11 2013 Fertilizer and Herbicide Use ..................................................................................... 39
4‐12 2013 PPPL's Safety Performance ...................................................................................... 40
5‐1 Summary of 2013 Emissions and Doses from D‐site Operations ...................................... 41
5‐2 Annual Releases to Sanitary System from Liquid Effluent collection Tanks
1994 to 2013 ..................................................................................................................... 43
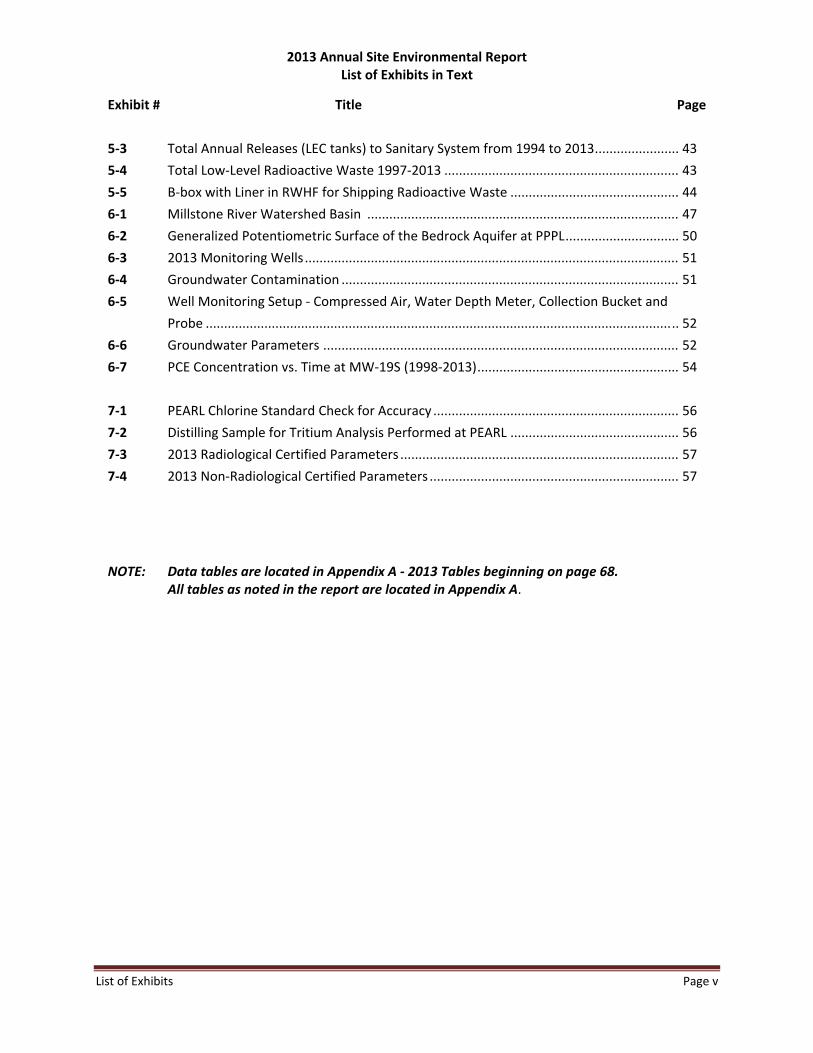
2013 Annual Site Environmental Report List of Exhibits in Text
List of Exhibits Page v
Exhibit # Title Page
5‐3 Total Annual Releases (LEC tanks) to Sanitary System from 1994 to 2013 ....................... 43
5‐4 Total Low‐Level Radioactive Waste 1997‐2013 ................................................................ 43
5‐5 B‐box with Liner in RWHF for Shipping Radioactive Waste .............................................. 44
6‐1 Millstone River Watershed Basin ..................................................................................... 47
6‐2 Generalized Potentiometric Surface of the Bedrock Aquifer at PPPL ............................... 50
6‐3 2013 Monitoring Wells ...................................................................................................... 51
6‐4 Groundwater Contamination ............................................................................................ 51
6‐5 Well Monitoring Setup ‐ Compressed Air, Water Depth Meter, Collection Bucket and
Probe ................................................................................................................................. 52
6‐6 Groundwater Parameters ................................................................................................. 52
6‐7 PCE Concentration vs. Time at MW‐19S (1998‐2013) ....................................................... 54
7‐1 PEARL Chlorine Standard Check for Accuracy ................................................................... 56
7‐2 Distilling Sample for Tritium Analysis Performed at PEARL .............................................. 56
7‐3 2013 Radiological Certified Parameters ............................................................................ 57
7‐4 2013 Non‐Radiological Certified Parameters .................................................................... 57
NOTE: Data tables are located in Appendix A ‐ 2013 Tables beginning on page 68.
All tables as noted in the report are located in Appendix A.
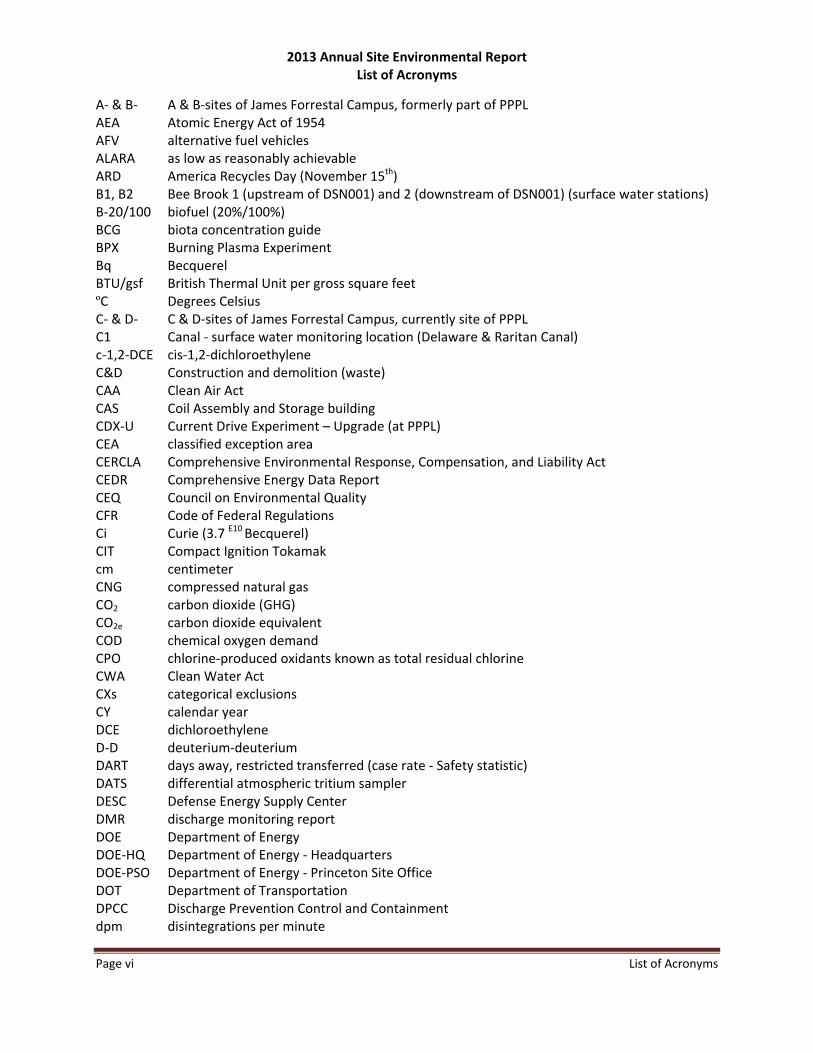
2013 Annual Site Environmental Report List of Acronyms
Page vi List of Acronyms
A‐ & B‐ A & B‐sites of James Forrestal Campus, formerly part of PPPL AEA Atomic Energy Act of 1954 AFV alternative fuel vehicles ALARA as low as reasonably achievable ARD America Recycles Day (November 15th) B1, B2 Bee Brook 1 (upstream of DSN001) and 2 (downstream of DSN001) (surface water stations) B‐20/100 biofuel (20%/100%) BCG biota concentration guide BPX Burning Plasma Experiment Bq Becquerel BTU/gsf British Thermal Unit per gross square feet ºC Degrees Celsius C‐ & D‐ C & D‐sites of James Forrestal Campus, currently site of PPPL C1 Canal ‐ surface water monitoring location (Delaware & Raritan Canal) c‐1,2‐DCE cis‐1,2‐dichloroethylene C&D Construction and demolition (waste) CAA Clean Air Act CAS Coil Assembly and Storage building CDX‐U Current Drive Experiment – Upgrade (at PPPL) CEA classified exception area CERCLA Comprehensive Environmental Response, Compensation, and Liability Act CEDR Comprehensive Energy Data Report CEQ Council on Environmental Quality CFR Code of Federal Regulations Ci Curie (3.7 E10 Becquerel) CIT Compact Ignition Tokamak cm centimeter CNG compressed natural gas CO2 carbon dioxide (GHG) CO2e carbon dioxide equivalent COD chemical oxygen demand CPO chlorine‐produced oxidants known as total residual chlorine CWA Clean Water Act CXs categorical exclusions CY calendar year DCE dichloroethylene D‐D deuterium‐deuterium DART days away, restricted transferred (case rate ‐ Safety statistic) DATS differential atmospheric tritium sampler DESC Defense Energy Supply Center DMR discharge monitoring report DOE Department of Energy DOE‐HQ Department of Energy ‐ Headquarters DOE‐PSO Department of Energy ‐ Princeton Site Office DOT Department of Transportation DPCC Discharge Prevention Control and Containment dpm disintegrations per minute
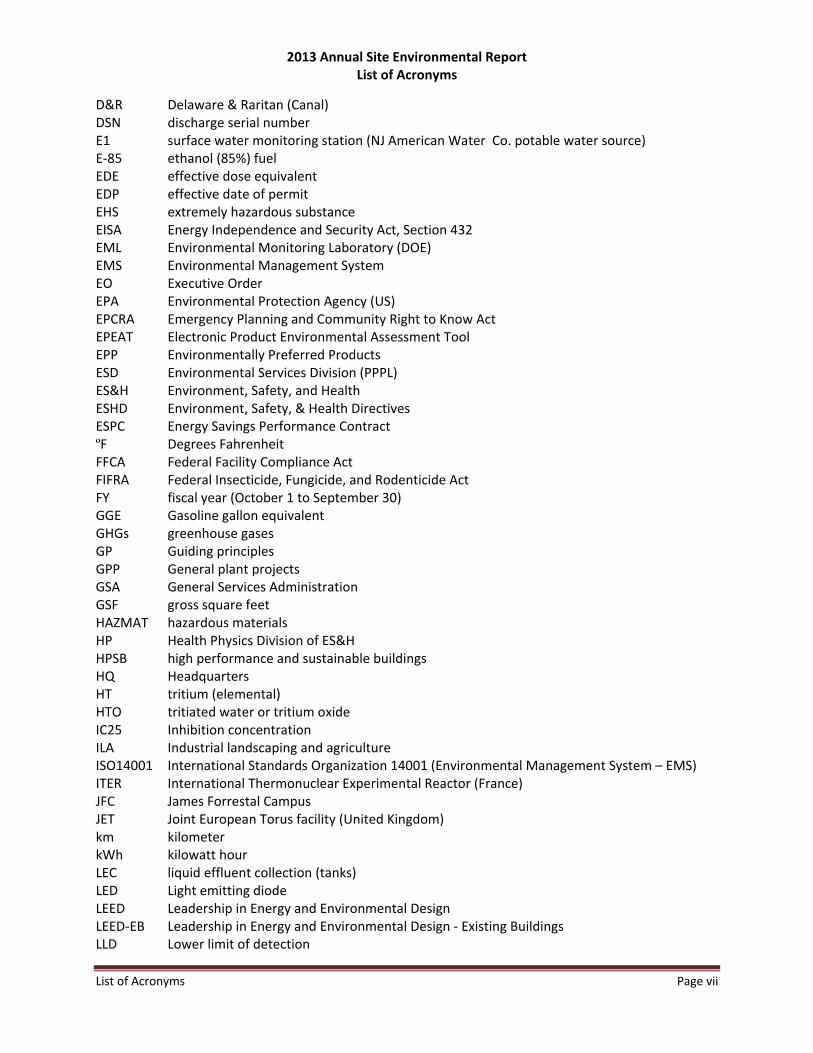
2013 Annual Site Environmental Report List of Acronyms
List of Acronyms Page vii
D&R Delaware & Raritan (Canal) DSN discharge serial number E1 surface water monitoring station (NJ American Water Co. potable water source) E‐85 ethanol (85%) fuel EDE effective dose equivalent EDP effective date of permit EHS extremely hazardous substance EISA Energy Independence and Security Act, Section 432 EML Environmental Monitoring Laboratory (DOE) EMS Environmental Management System EO Executive Order EPA Environmental Protection Agency (US) EPCRA Emergency Planning and Community Right to Know Act EPEAT Electronic Product Environmental Assessment Tool EPP Environmentally Preferred Products ESD Environmental Services Division (PPPL) ES&H Environment, Safety, and Health ESHD Environment, Safety, & Health Directives ESPC Energy Savings Performance Contract ºF Degrees Fahrenheit FFCA Federal Facility Compliance Act FIFRA Federal Insecticide, Fungicide, and Rodenticide Act FY fiscal year (October 1 to September 30) GGE Gasoline gallon equivalent GHGs greenhouse gases GP Guiding principles GPP General plant projects GSA General Services Administration GSF gross square feet HAZMAT hazardous materials HP Health Physics Division of ES&H HPSB high performance and sustainable buildings HQ Headquarters HT tritium (elemental) HTO tritiated water or tritium oxide IC25 Inhibition concentration ILA Industrial landscaping and agriculture ISO14001 International Standards Organization 14001 (Environmental Management System – EMS) ITER International Thermonuclear Experimental Reactor (France) JFC James Forrestal Campus JET Joint European Torus facility (United Kingdom) km kilometer kWh kilowatt hour LEC liquid effluent collection (tanks) LED Light emitting diode LEED Leadership in Energy and Environmental Design LEED‐EB Leadership in Energy and Environmental Design ‐ Existing Buildings LLD Lower limit of detection
2013 Annual Site Environmental Report List of Acronyms
Page viii List of Acronyms
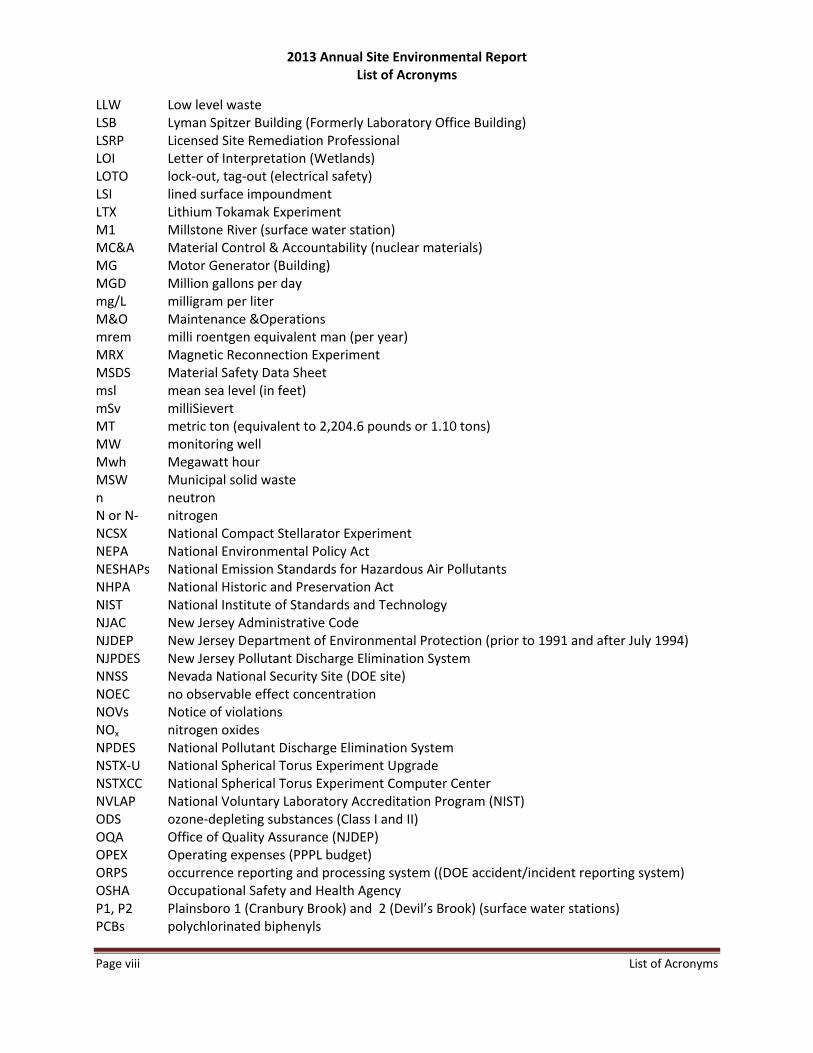
LLW Low level waste LSB Lyman Spitzer Building (Formerly Laboratory Office Building) LSRP Licensed Site Remediation Professional LOI Letter of Interpretation (Wetlands) LOTO lock‐out, tag‐out (electrical safety) LSI lined surface impoundment LTX Lithium Tokamak Experiment M1 Millstone River (surface water station) MC&A Material Control & Accountability (nuclear materials) MG Motor Generator (Building) MGD Million gallons per day mg/L milligram per liter M&O Maintenance &Operations mrem milli roentgen equivalent man (per year) MRX Magnetic Reconnection Experiment MSDS Material Safety Data Sheet msl mean sea level (in feet) mSv milliSievert MT metric ton (equivalent to 2,204.6 pounds or 1.10 tons) MW monitoring well Mwh Megawatt hour MSW Municipal solid waste n neutron N or N‐ nitrogen NCSX National Compact Stellarator Experiment NEPA National Environmental Policy Act NESHAPs National Emission Standards for Hazardous Air Pollutants NHPA National Historic and Preservation Act NIST National Institute of Standards and Technology NJAC New Jersey Administrative Code NJDEP New Jersey Department of Environmental Protection (prior to 1991 and after July 1994) NJPDES New Jersey Pollutant Discharge Elimination System NNSS Nevada National Security Site (DOE site) NOEC no observable effect concentration NOVs Notice of violations NOx nitrogen oxides NPDES National Pollutant Discharge Elimination System NSTX‐U National Spherical Torus Experiment Upgrade NSTXCC National Spherical Torus Experiment Computer Center NVLAP National Voluntary Laboratory Accreditation Program (NIST) ODS ozone‐depleting substances (Class I and II) OQA Office of Quality Assurance (NJDEP) OPEX Operating expenses (PPPL budget) ORPS occurrence reporting and processing system ((DOE accident/incident reporting system) OSHA Occupational Safety and Health Agency P1, P2 Plainsboro 1 (Cranbury Brook) and 2 (Devil’s Brook) (surface water stations) PCBs polychlorinated biphenyls
2013 Annual Site Environmental Report List of Acronyms
List of Acronyms Page ix
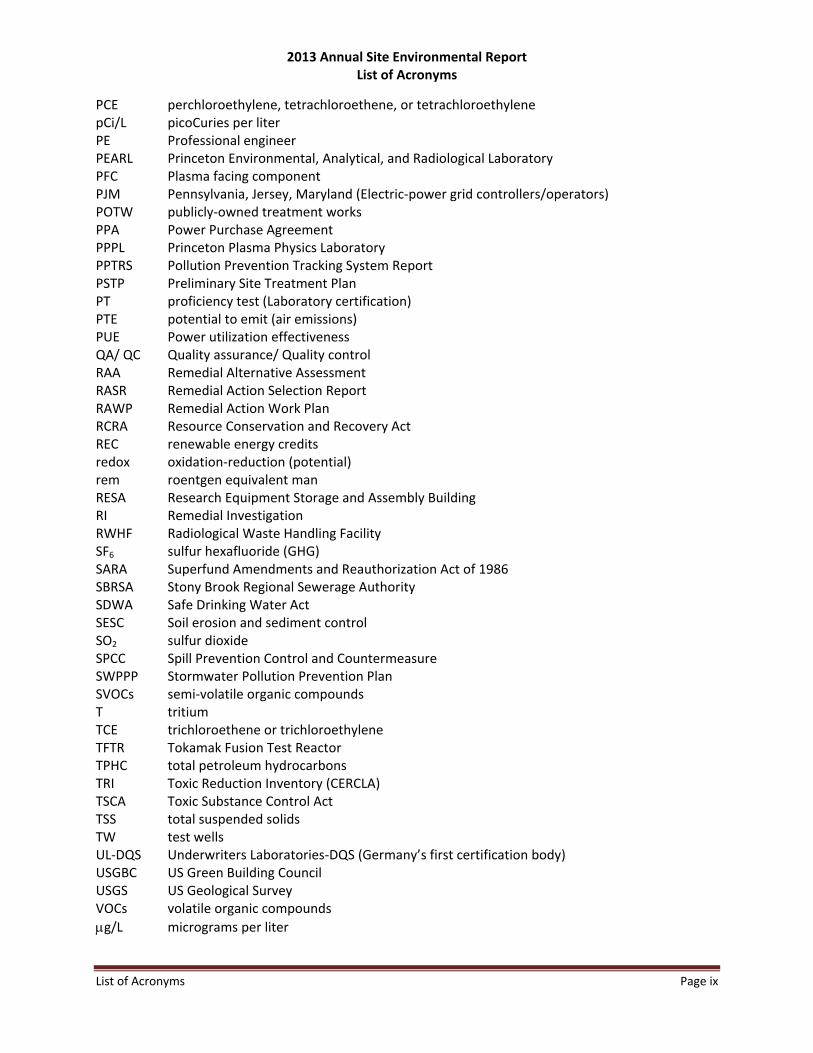
PCE perchloroethylene, tetrachloroethene, or tetrachloroethylene pCi/L picoCuries per liter PE Professional engineer PEARL Princeton Environmental, Analytical, and Radiological Laboratory PFC Plasma facing component PJM Pennsylvania, Jersey, Maryland (Electric‐power grid controllers/operators) POTW publicly‐owned treatment works PPA Power Purchase Agreement PPPL Princeton Plasma Physics Laboratory PPTRS Pollution Prevention Tracking System Report PSTP Preliminary Site Treatment Plan PT proficiency test (Laboratory certification) PTE potential to emit (air emissions) PUE Power utilization effectiveness QA/ QC Quality assurance/ Quality control RAA Remedial Alternative Assessment RASR Remedial Action Selection Report RAWP Remedial Action Work Plan RCRA Resource Conservation and Recovery Act REC renewable energy credits redox oxidation‐reduction (potential) rem roentgen equivalent man RESA Research Equipment Storage and Assembly Building RI Remedial Investigation RWHF Radiological Waste Handling Facility SF6 sulfur hexafluoride (GHG) SARA Superfund Amendments and Reauthorization Act of 1986 SBRSA Stony Brook Regional Sewerage Authority SDWA Safe Drinking Water Act SESC Soil erosion and sediment control SO2 sulfur dioxide SPCC Spill Prevention Control and Countermeasure SWPPP Stormwater Pollution Prevention Plan SVOCs semi‐volatile organic compounds T tritium TCE trichloroethene or trichloroethylene TFTR Tokamak Fusion Test Reactor TPHC total petroleum hydrocarbons TRI Toxic Reduction Inventory (CERCLA) TSCA Toxic Substance Control Act TSS total suspended solids TW test wells UL‐DQS Underwriters Laboratories‐DQS (Germany’s first certification body) USGBC US Green Building Council USGS US Geological Survey VOCs volatile organic compounds
g/L micrograms per liter
2013 Annual Site Environmental Report
Executive Summary
Princeton Plasma Physics Laboratory
Annual Site Environmental Report for
Calendar Year 2013
This report presents the results of environmental activities and monitoring programs at the
Princeton Plasma Physics Laboratory (PPPL) for Calendar Year 2013. The report provides
the U.S. Department of Energy (DOE) and the public with information on the level of
radioactive and non‐radioactive pollutants, if any, that are released into the environment as
a result of PPPL operations. The report also summarizes environmental initiatives,
assessments, and programs that were undertaken in 2013. The objective of the Site
Environmental Report is to document PPPL’s efforts to protect the public’s health and the
environment through its environmental protection, safety, and health programs.
Since 1951, the Princeton Plasma Physics Laboratory has engaged in fusion energy research.
Fusion is the reaction that occurs in our sun as well as in other stars. During fusion
reactions, the nuclei of hydrogen atoms in a plasma state, i.e. as an ionized gas, fuse or join
forming helium atoms and releasing of neutrons and energy. Unlike the sun, PPPL’s fusion
reactions are magnetically confined within a vessel or reactor under vacuum conditions.
The long‐range goal of the U.S. Magnetic Fusion Energy Science program is to develop and
demonstrate the practical application of fusion power as a safe, alternative energy source
replacing power plants that burn fossil fuels. Energy from fusion power plants would boil
water for steam that drives electric‐generating turbines without the production of
greenhouse gases and other air pollutants.
National Spherical Torus Experiment ‐ Upgrade Though 2013 marked the fifthteenth year of the National Spherical Torus Experiment
(NSTX), NSTX did not operate nor conduct experiments. After a thorough review in 2010,
PPPL and DOE jointly decided to commence the planned NSTX upgrade project, in lieu of
making repairs to the magnetic coils that confine the plasma and continuing operations in
2012. The upgrade plan for NSTX includes the redesign of the center stack magnets and the
addition of a second neutral beam box from the former Tokamak Fusion Test Reactor
(TFTR). In NSTX, the plasma is heated by radio‐frequency waves and deuterium (hydrogen
isotope with one neutron) neutral beam injection, which adding a second neutral beam will
allow for greater heat capacity and hotter experimental plasmas. The new center stack
design will increase the field strength to one tesla ‐ or 20,000 times the strength of Earthʹs
magnetic field. The magnetic field generated by the polodial field coils is used to control the
Page 2 2013 ASER Executive Summary
plasma shape with in the vacuum vessel. For the NSTX research collaborators from 30 U.S.
institutions and 11 other countries, the project is a major effort to produce a smaller, more
economical fusion reactor.
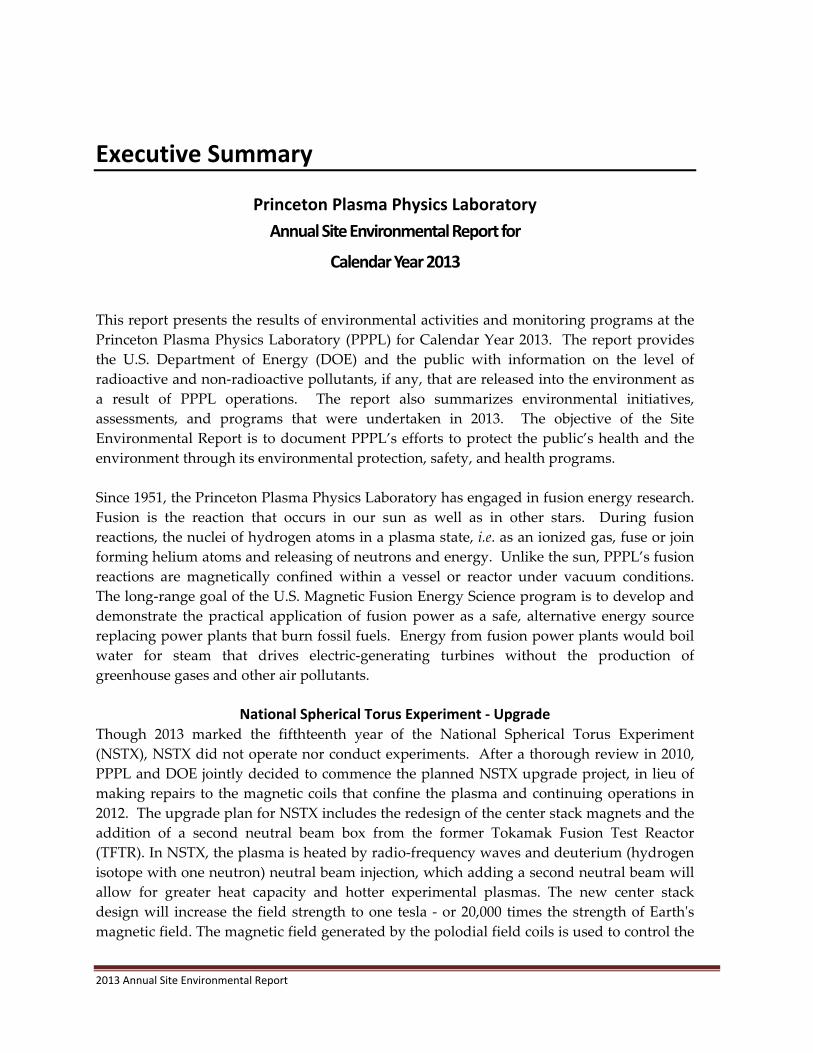
The National Spherical Torus Experiment Heated by Neutral Beam Injection (NBI)
The new center column or stack is shown in a yellow outline, the vacuum vessel is spherical
in shape and produces a ʺroundʺ plasma, and the person standing next to the right‐hand
base illustrates the scale of this device. In the drawing on the right, the two neutral beam
injectors (NBI) are shown.
ITER Cadarache, France
ITER in Latin means ʺthe wayʺ and is the name of the large international fusion experiment
located in the Provence‐Alpes‐Côte‐dʹAzur region in southeastern France. Construction
began in 2007 with a completion date in the early 2020ʹs. When operational ITER will
generate 10 times the external power delivered to heat the plasma. PPPL, partnering with
Oak Ridge National Laboratory, leads the U.S. ITER Project that coordinates U.S. ITER
activities ‐ lending to the project design, construction, and technical expertise.
PPPL Maximum Off‐site Dose in 2013
When the total maximum off‐site dose for 2013 was calculated, PPPL’s radiological
contribution was a fraction of the 10 mrem/year PPPL objective and the 100‐mrem/year DOE
limit. Based on the radiological monitoring program data, the dose results for 2013 were:
1. Total maximum off‐site dose from all sources—airborne and liquid releases—was
6.36 x10‐3mrem per year (6.36x10‐5 mSv per year).
2. Dose at the nearest business (at the site boundary) due to airborne releases was 6.0 x
10‐4 mrem per year (6.0x10‐6 mSv per year).
3. The collective effective dose equivalent for the population living within 80
kilometers was 0.0236 person‐rem (2.36x 10‐4 person‐Sv).
2013 ASER Executive Summary Page 3
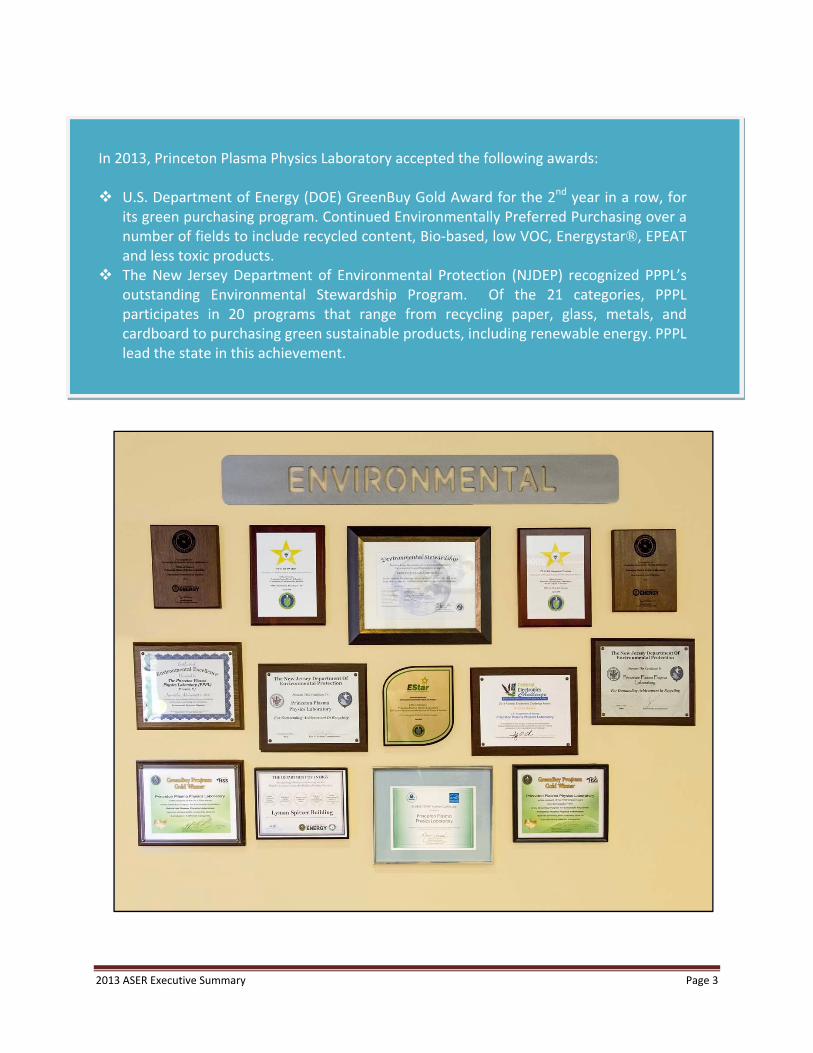
In 2013, Princeton Plasma Physics Laboratory accepted the following awards: U.S. Department of Energy (DOE) GreenBuy Gold Award for the 2nd year in a row, for
its green purchasing program. Continued Environmentally Preferred Purchasing over a number of fields to include recycled content, Bio‐based, low VOC, Energystar®, EPEAT and less toxic products.
The New Jersey Department of Environmental Protection (NJDEP) recognized PPPL’s outstanding Environmental Stewardship Program. Of the 21 categories, PPPL participates in 20 programs that range from recycling paper, glass, metals, and cardboard to purchasing green sustainable products, including renewable energy. PPPL lead the state in this achievement.
Page 4 2013 ASER Executive Summary
PPPL Achievements and Activities in 2013
PPPL encourages its employees to practice environmental stewardship principles in their
daily lives through their personal purchases and recycling activities as well as at PPPL.
Each year, the Laboratory hosts events such as Earth Week and America Recycles Day when
information on green products and recycling opportunities are provided. PPPLʹs ʺGreen
Teamʺ designs programs and activities to help green PPPL and the whole community. In
June 2013, PPPL opened its door and invited the public to a Day at PPPL. Over 3,000
visitors toured the experimental areas, experienced hands‐on activities in science education
laboratory, and viewed presentations given by PPPL’s scientists, engineers, and technical
staff.
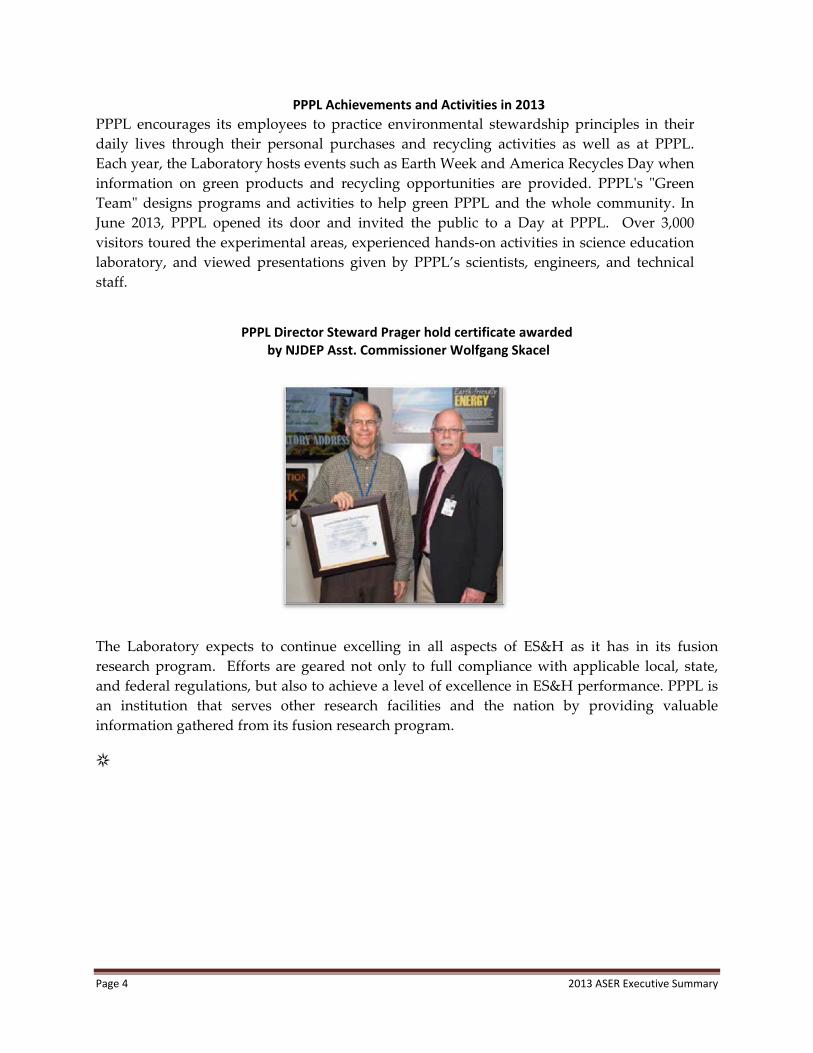
PPPL Director Steward Prager hold certificate awarded by NJDEP Asst. Commissioner Wolfgang Skacel
The Laboratory expects to continue excelling in all aspects of ES&H as it has in its fusion
research program. Efforts are geared not only to full compliance with applicable local, state,
and federal regulations, but also to achieve a level of excellence in ES&H performance. PPPL is
an institution that serves other research facilities and the nation by providing valuable
information gathered from its fusion research program.
Chapter 1 ‐ Introduction Page 5
Chapter
1 Introduction
1.1 Site Mission
The U.S. Department of Energy’s Princeton Plasma Physics Laboratory (PPPL) is a Collaborative
National Center for plasma and fusion science. Its primary mission is to develop scientific
understandings and key innovations leading to an attractive fusion energy source [PPPL08a].
Related missions include conducting world‐class research along the broad frontier of plasma
science, providing the highest quality of scientific education and experimentation, and
participating in technology transfer and science education projects/programs within the local
community and nation‐wide.
The National Spherical Torus Experiment (NSTX) is a collaborative project among 30 U.S.
laboratories, including Department of Energy National Laboratories, universities, and
institutions, and 28 international institutes from 11 countries. Also located at PPPL are smaller
experimental devices, the Magnetic Reconnection Experiment (MRX), the Lithium Tokamak
Experiment (LTX) and Hall Thruster, which investigate plasma physics phenomena.
As a part of both off and on‐site collaborative projects, PPPL scientists assist fusion programs
within the United States and in Europe and Asia. To further fusion science in 2013, PPPL
collaborated with other fusion research laboratories across the globe on the Joint European
Torus (JET) facility located in the United Kingdom, and the International Thermonuclear
Experimental Reactor or ITER, which in Latin means “The Way,” located in Cadarache, France.
PPPLʹs main fusion experiment, the National Stellarator Tokamak Experiment Upgrade project
(NSTX‐U), began in 2011 and is scheduled for completion in late 2014. 1.2 Site Location
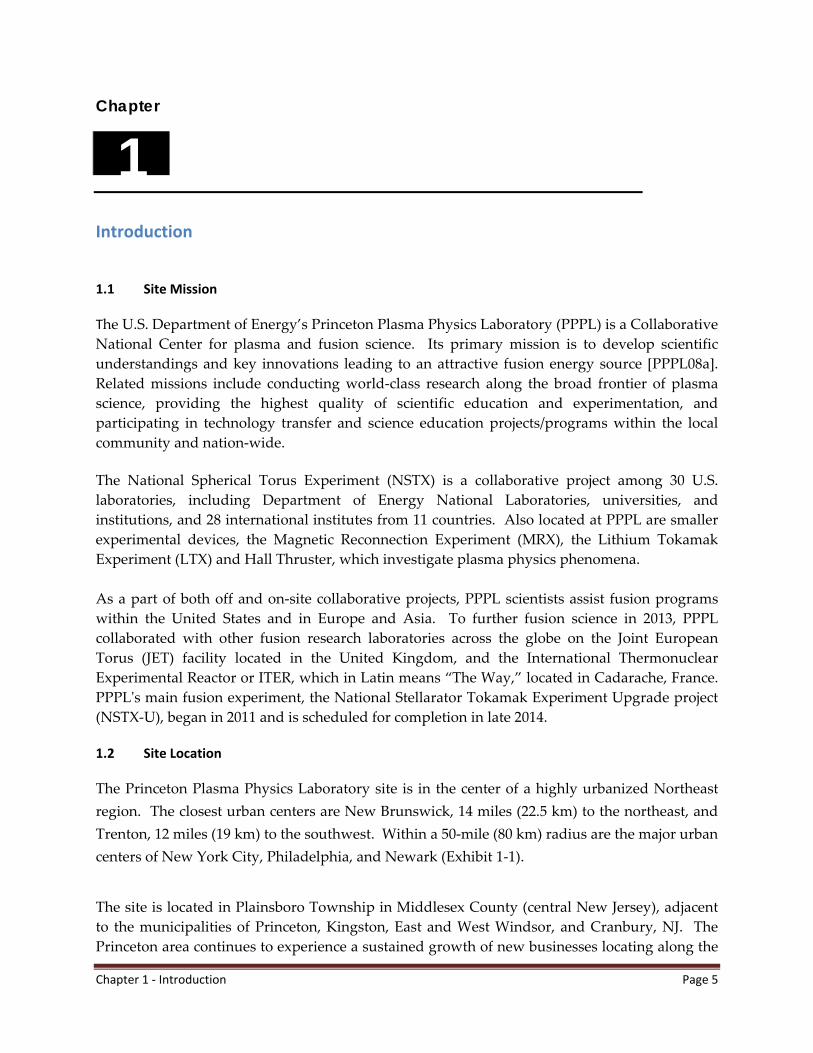
The Princeton Plasma Physics Laboratory site is in the center of a highly urbanized Northeast
region. The closest urban centers are New Brunswick, 14 miles (22.5 km) to the northeast, and
Trenton, 12 miles (19 km) to the southwest. Within a 50‐mile (80 km) radius are the major urban
centers of New York City, Philadelphia, and Newark (Exhibit 1‐1).
The site is located in Plainsboro Township in Middlesex County (central New Jersey), adjacent
to the municipalities of Princeton, Kingston, East and West Windsor, and Cranbury, NJ. The
Princeton area continues to experience a sustained growth of new businesses locating along the
Page 6 Chapter 1 ‐ Introduction
Route 1 corridor near the site. In 2012 construction was completed on the new University
Medical Center of Princeton Center at Plainsboro, which is located less than 2 miles south of
PPPL. Princeton Universityʹs main campus is approximately three miles west of the site.
Exhibit 1‐1. Region Surrounding PPPL (50‐mile radius shown)
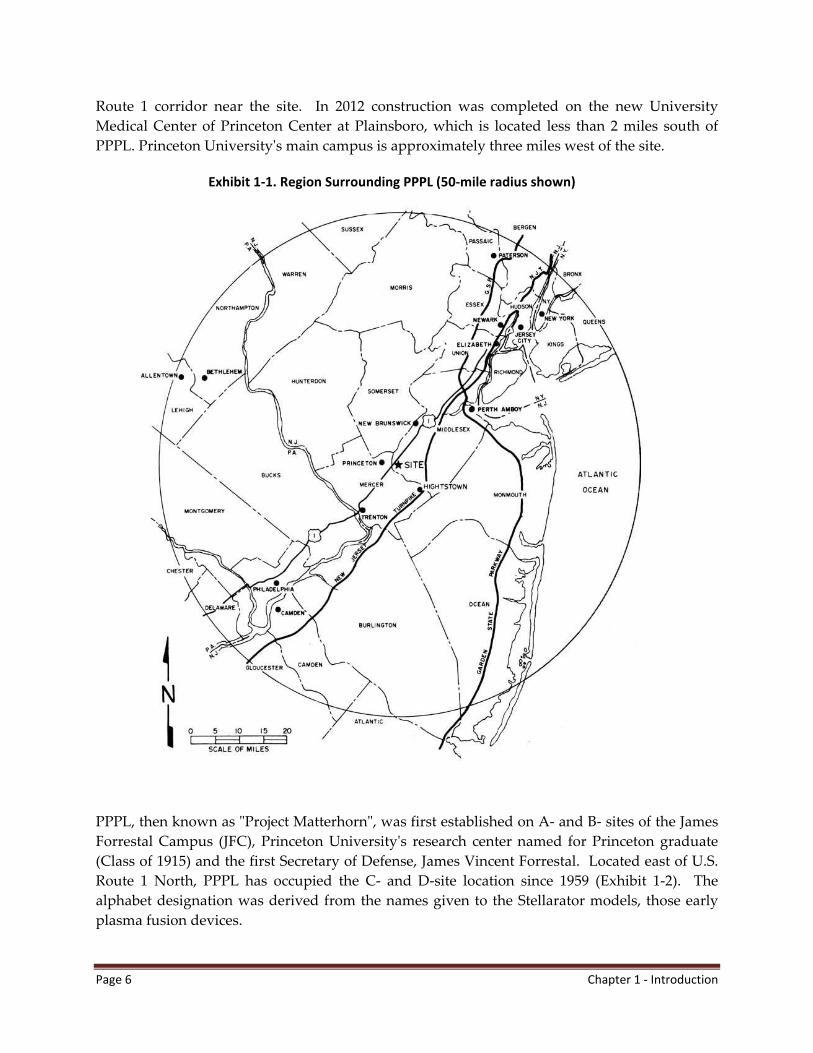
PPPL, then known as ʺProject Matterhornʺ, was first established on A‐ and B‐ sites of the James
Forrestal Campus (JFC), Princeton Universityʹs research center named for Princeton graduate
(Class of 1915) and the first Secretary of Defense, James Vincent Forrestal. Located east of U.S.
Route 1 North, PPPL has occupied the C‐ and D‐site location since 1959 (Exhibit 1‐2). The
alphabet designation was derived from the names given to the Stellarator models, those early
plasma fusion devices.
Chapter 1 ‐ Introduction Page 7
Exhibit 1‐2. PPPL James Forrestal Campus (JCF), Plainsboro, NJ
Surrounding the site are lands of preserved and undisturbed areas including upland forest,
wetlands, open grassy areas, and a minor stream, Bee Brook, which flows along PPPL’s eastern
boundary. These areas are designated as open space in the James Forrestal Campus (JFC) site
development plan.
D‐site is fully surrounded by a chain‐linked fence topped with barbed wire for security
purposes. Access to D‐site is limited to authorized personnel through the use of card readers.
Page 8 Chapter 1 ‐ Introduction
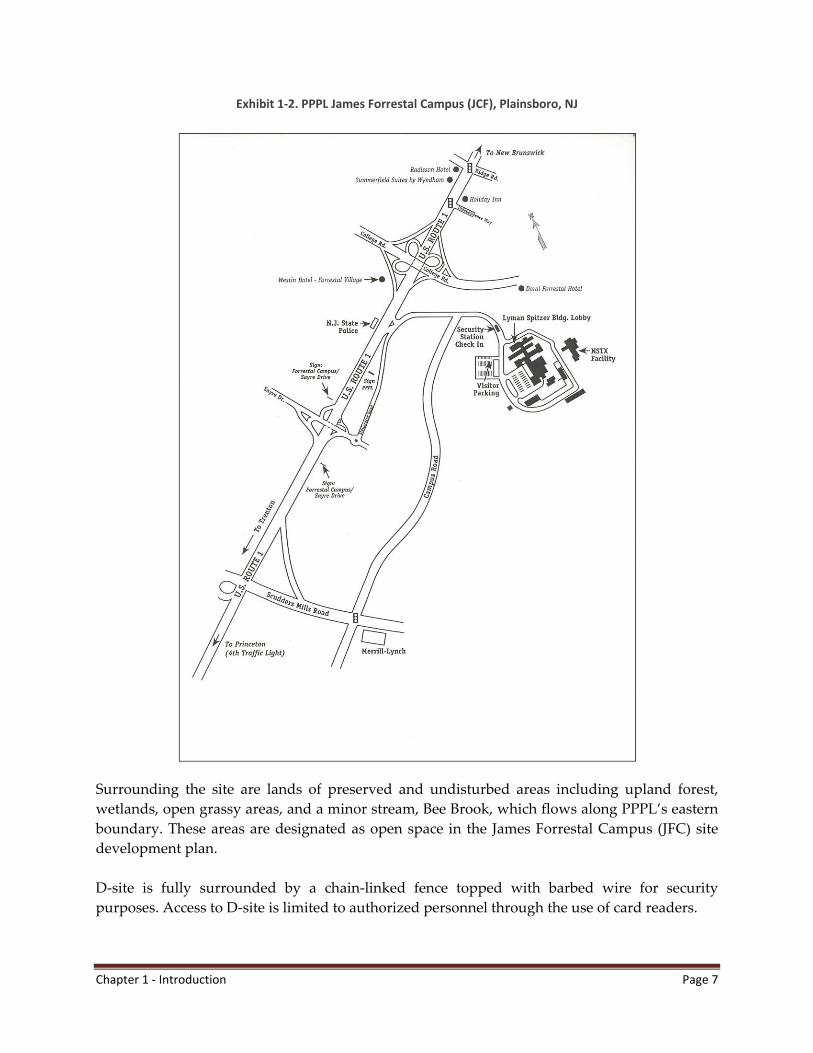
PPPLʹs Site Protection Division controls access to C‐site allowing the public and visitor access
following an identification check. Vehicle inspections may occur prior to entrance.
Exhibit 1‐3. Aerial View of PPPL
1.3 General Environmental Setting
The climate of central New Jersey is classified as mid‐latitude, rainy climate with mild
winters, hot summers, and no dry season. Temperatures may range from below zero to above
100 degrees Fahrenheit (°F) (17.8°Celsius (C) to 37.8° C); extreme temperatures typically occur
once every five years. Approximately half the year, from late April until mid‐October, the
days are freeze‐free.
The typical regional climate is moderately humid with a total average precipitation about 46
inches (116 cm) evenly distributed throughout the year. Droughts typically occur about once
every 15 years [PSAR78]. In 2013, the annual rainfall total was 43.25 inches (109.85 cm), just
below the average rainfall for central New Jersey.
The most recent archaeological survey was conducted in 1978 as part of the TFTR site
environmental assessment study. Through historical records reviews, personal interviews, and
field investigations, one projectile point and a stone cistern were found. Apparently, the site
had limited occupation during prehistoric time and has only in recent times been actively
Chapter 1 ‐ Introduction Page 9
used for farming. No significant archeological resources were identified on‐site. There are
more significant examples of prehistoric occupation in areas closer to the Millstone River,
which are within two miles of the site [Gr77]. 1.4 Primary Operations and Activities
Several magnetic fusion experiments, including NSTX, Magnetic Reconnection Experiment
(MRX), or Lithium Tokamak Experiment (LTX), currently operate at PPPL. NSTX is the
Laboratoryʹs largest experiment and it is located on D‐site. NSTX has produced one million
amperes of plasma current, setting a new world record for a spherical torus device. This
device is designed to test the physics principles of spherical‐shaped plasmas forming a sphere
with a hole through its center. Plasma shaping is an important parameter for plasma stability
and performance enabling viable fusion power. NSITX ceased operations in 2011 and was
partially dismantled for major upgrades which are scheduled to be finished in 2014. The
upgraded experiment, known as NSTX‐U, will have twice the plasma heating power and
magnetic confinement and be able to extent the pulse duration by five times.
The former TFTR Test Cell was named the National Compact Stellarator Experiment (NCSX)
Coil Winding Facility, where the magnetic coils were wound with copper coils, taped, and
baked with an epoxy. In May 2008, when the DOE Office of Science halted NCSX
construction, PPPLʹs staff began decommissioning the experiment. All the fabricated parts of
the NCSX are stored into the Test Cell on C‐site that would have housed the experiment.
LTX continues to explore new paths for plasma energy efficiency and sustainability. The
primary goal of LTX is to investigate the properties of a lithium liquid coating for plasma
surfaces or plasma‐facing component (PFC). The previous experiment, Current Drive
Experiment‐Upgrade (CDX‐U) held the lithium in a circular tray at the base of the vacuum
vessel. The LTX liquid lithium was evaporated and deposited a thin layer inside the vacuum
vessel and kept liquid by heater in the shell. 1.5 Relevant Demographic Information
A demographic study of the surrounding 31.1 miles (50 kilometers) was completed in 1987 as
part of the environmental assessment for the proposed Burning Plasma Experiment (BPX),
which was also known as Compact Ignition Tokamak (CIT) [Be87a]. From the 2013 US Census
Bureau Statistics, Middlesex County has a population of 828,919; adjacent counties of Mercer,
Monmouth, Somerset, and Union have populations of 370,414, 629,672, 330,585, and, 548,256
respectively [US13]. Other information gathered and updated from previous ITER studies
include socioeconomic information [Be87b] and an ecological survey, which were studies
describing pre‐TFTR conditions [En87].
Page 10 Chapter 2 – 2013 Compliance Summary and Community Involvement
Chapter
2
2013 COMPLIANCE SUMMARY and COMMUNITY INVOLVEMENT
Princeton Plasma Physics Laboratory’s (PPPL) environmental goals are to fully comply with
applicable state, federal, and local environmental regulations and to conduct our scientific
research and operate the Laboratory facilities in a manner that protects and preserves human
health and the environment. PPPL initiates actions, which enhance and document compliance
with these requirements. Compliance with applicable environmental statutes or regulations,
and Executive or DOE Orders is an important piece of PPPL’s primary mission.
2.1 Laws and Regulations
Exhibit 2.1 summarizes the environmental statutes and regulations applicable to PPPL’s
activities as well as summarizes the 2013 compliance status and provides the ASER sections
where further details are located. The list of “Applicable Environmental Laws and Regulations
– 2013 Status” conforms to PPPL’s Environmental Management System (EMS) Appendix B,
“Summary of Legal and Other Requirements” [PPPL14a].
2.2 Site Compliance and Environmental Management System (EMS) Assessments
In 2013, PPPL’s Quality Assurance (QA) Division performed one environmental audit of
PPPL’s Environmental Compliance ‐ Air Program (permits). This audit included records
examination and requirements compliance and is tracked through PPPL’s internal QA Audit
Database. PPPL participated in the New Jersey Department of Environmental Protection
(NJDEP) audits of the PPPL Environmental, Analytical and Radiological Laboratory (PEARL)
and Surface and Ground Water discharge permits [Cu14].
In 2013, UL‐DQS, Inc. was scheduled to conduct an annual surveillance audit of PPPL’s EMS
against the International Organization for Standards (ISO) standard 14001:2004 –
“Environmental Management Systems – Requirements with guidance for use.” Due to
schedule conflicts, the surveillance audit was postponed until early 2014. 2.3 Environmental Permits
PPPL’s environmental permits are incorporated into Exhibit 2‐1 as appropriate. All PPPL’s permits
are current and in compliance.
Exhibit 2‐1. Applicable Environmental Laws and Regulations – 2013 Status
Page 11 Chapter 2 – 2013 Compliance Summary and Community Involvement
Environmental Restoration and Waste Management 2013 Status ASER section(s)
Comprehensive Environmental Response, Compensation,
and Liability Act (CERCLA) provides the regulatory
framework for identification, assessment, and if needed
remediation of contaminated sites – either recent or inactive.
The CERCLA inventory completed in 1993 [Dy93] warranted no
further CERCLA actions. In 2013, PPPL had no involvement with
CERCLA‐mandated clean‐up actions. A New Jersey‐regulated
ground water remediation project is discussed in Chapters 4 and 6.
4.3.1 B 6.5
Superfund Amendment and Reauthorization Act (SARA)
Title III requires planning, release reporting, chemical
inventory.
PPPL has 6 hazardous chemicals under the threshold quantities,
maintains material safety data sheets, has no extremely hazardous
substance, and is exempt from Toxic Release Inventory submittal.
4.3.1 C
Resource Conservation and Recovery Act (RCRA) regulates
the generation, storage, treatment, and disposal of hazardous
wastes. RCRA also includes underground storage tanks
containing petroleum and hazardous substances, universal
waste, and recyclable used oil. (NJ‐delegated program)
In 2013, PPPL shipped 7.49 tons (6.80 metric tons, MT) of hazardous
waste of which 1.71 tons (1.55 MT) were recycled (22.8% recycling
rate). The types of waste are highly variable each year; in 2013,
majority of incinerated quantities came from, flammable liquids,
scintillation vials, and non‐PCB capacitors [Pue14a].
4.2.1 B 4.2.1 C
Federal Facility Compliance Act (FFCA) requires the
Department of Energy (DOE) to prepare “Site Treatment
Plans” for the treatment of mixed waste, which is waste
containing both hazardous and radioactive components.
In 1995, PPPL prepared a Preliminary Site Treatment Plan (PSTP).
PPPL does not generate mixed waste nor has any future plans to
generate mixed waste. Regulators agreed to treat in the
accumulation container any potential mixed waste [PPPL95].
National Environmental Policy Act (NEPA) covers how
federal actions may impact the environment and an
examination of alternatives to those actions
In 2013, PPPL performed NEPA reviews of 16 proposed activities,
and the NEPA reviews for 5 previous activities were revised. All of
these activities were determined to be categorical exclusions (CXs) in
accordance with the NEPA regulations/guidelines of the Council on
Environmental Quality (CEQ) [Stra14].
Toxic Substance Control Act (TSCA) governs the manufacture,
use, and distribution of regulated chemicals listed.
PPPL shipped in 2013 –170 pounds of PCB TSCA Hazardous
Substances. Five PCB capacitors remain on‐site. Asbestos removals
in 2013 were 40 cubic yards [Pue14a].
4.2.1A
Federal Insecticide, Fungicide, and Rodenticide Act (FIFRA)
regulates the user and application of insecticides, fungicides,
and rodenticides. (NJ‐delegated program)
PPPL used limited quantities of insecticides, herbicides, and
fertilizers. A certified subcontractor performs the application under
the direction of PPPL’s Facilities personnel [Kin14b].
Exhibit 4‐ 11 4.5.3
Exhibit 2‐1. Applicable Environmental Laws and Regulations – 2013 Status (continued)
Page 12 Chapter 2 – 2013 Compliance Summary and Community Involvement
Radiation Protection 2013 Status ASER section(s) DOE Order 435.1, Change 1, Radioactive Waste Management, provides guidance to ensure that DOE radioactive waste is
properly managed to protect workers, the public and the
environment.
DOE Order 458.1, Radiation Protection, provides protection of the public and the environment from exposure to radiation
from any DOE facility. Operations and its contractors comply
with standards and requirements in this Order.
Atomic Energy Act (AEA) of 1954 (42USC 2011 et seq.) governs plans for the control of radioactive materials
PPPL developed a new Low‐Level Radioactive Waste Program Basis
document to meet the requirements of DOE Order 435.1 and enable
shipments to the Energy Solutions disposal facility in Clive, UT.
Approval was granted by DOE in July 2012. [DOE01, PPPL13e].
PPPL’s policy is to maintain all radiation exposures “As Low as
Reasonably Achievable” (ALARA). PPPL implements its radiation
protection program as discussed in the Environmental Monitoring
Plan Section 6, “Radiological Monitoring Plan.” PPPL‘s contribution
to radiation exposure is well below the DOE and PPPL limits
[10CFR835, DOE01, DOE11b, PPPL07, 09b, 09c ,09f,10b & 11a].
PPPL’s “Nuclear Materials Control and Accountability (MC&A)
Plan” describes the control and accountability system of nuclear
material at PPPL. This plan provides a system of checks and
balances to prevent/detect unauthorized use or removal of nuclear
material from PPPL [PPPL08b].
5.1.3 5.1
Exhibit 5‐1 5.2
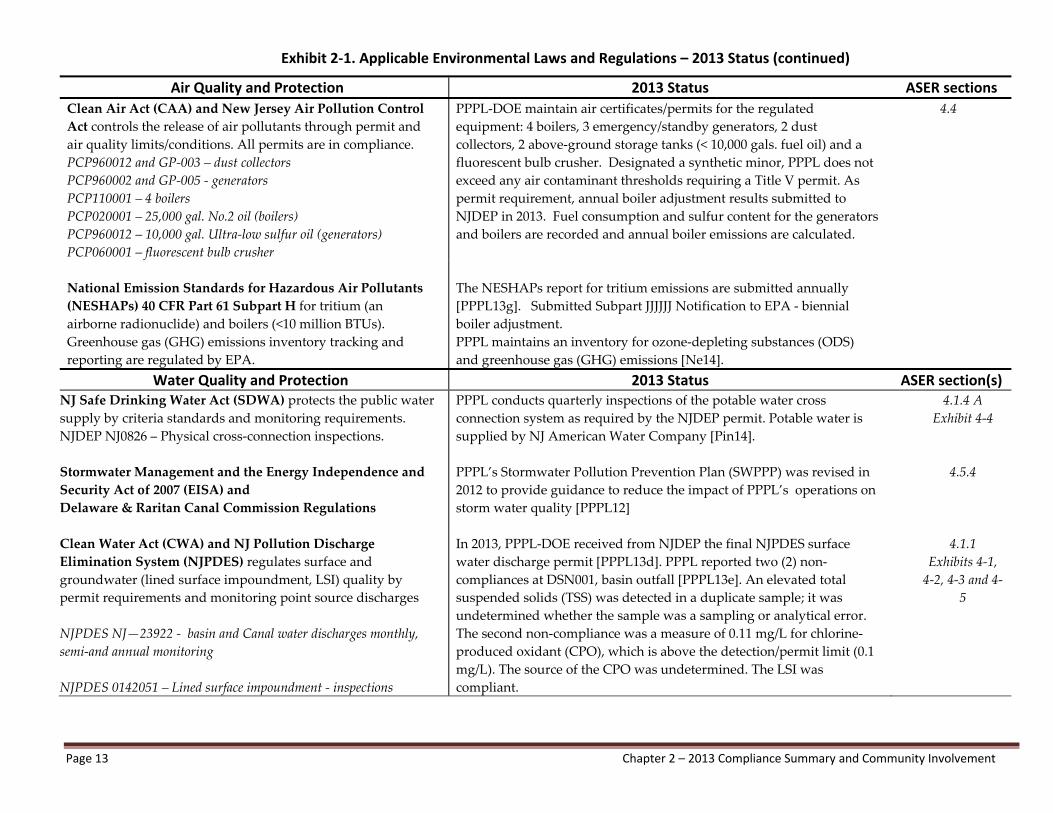
Exhibit 2‐1. Applicable Environmental Laws and Regulations – 2013 Status (continued)
Page 13 Chapter 2 – 2013 Compliance Summary and Community Involvement
Air Quality and Protection 2013 Status ASER sections
Clean Air Act (CAA) and New Jersey Air Pollution Control
Act controls the release of air pollutants through permit and
air quality limits/conditions. All permits are in compliance.
PCP960012 and GP‐003 – dust collectors PCP960002 and GP‐005 ‐ generators PCP110001 – 4 boilers PCP020001 – 25,000 gal. No.2 oil (boilers) PCP960012 – 10,000 gal. Ultra‐low sulfur oil (generators) PCP060001 – fluorescent bulb crusher
PPPL‐DOE maintain air certificates/permits for the regulated
equipment: 4 boilers, 3 emergency/standby generators, 2 dust
collectors, 2 above‐ground storage tanks (< 10,000 gals. fuel oil) and a
fluorescent bulb crusher. Designated a synthetic minor, PPPL does not
exceed any air contaminant thresholds requiring a Title V permit. As
permit requirement, annual boiler adjustment results submitted to
NJDEP in 2013. Fuel consumption and sulfur content for the generators
and boilers are recorded and annual boiler emissions are calculated.
4.4
National Emission Standards for Hazardous Air Pollutants
(NESHAPs) 40 CFR Part 61 Subpart H for tritium (an
airborne radionuclide) and boilers (<10 million BTUs).
Greenhouse gas (GHG) emissions inventory tracking and
reporting are regulated by EPA.
The NESHAPs report for tritium emissions are submitted annually
[PPPL13g]. Submitted Subpart JJJJJJ Notification to EPA ‐ biennial
boiler adjustment.
PPPL maintains an inventory for ozone‐depleting substances (ODS)
and greenhouse gas (GHG) emissions [Ne14].
Water Quality and Protection 2013 Status ASER section(s) NJ Safe Drinking Water Act (SDWA) protects the public water
supply by criteria standards and monitoring requirements.
NJDEP NJ0826 – Physical cross‐connection inspections.
Stormwater Management and the Energy Independence and
Security Act of 2007 (EISA) and
Delaware & Raritan Canal Commission Regulations
PPPL conducts quarterly inspections of the potable water cross
connection system as required by the NJDEP permit. Potable water is
supplied by NJ American Water Company [Pin14].
PPPL’s Stormwater Pollution Prevention Plan (SWPPP) was revised in
2012 to provide guidance to reduce the impact of PPPL’s operations on
storm water quality [PPPL12]
4.1.4 A Exhibit 4‐4
4.5.4
Clean Water Act (CWA) and NJ Pollution Discharge
Elimination System (NJPDES) regulates surface and
groundwater (lined surface impoundment, LSI) quality by
permit requirements and monitoring point source discharges
NJPDES NJ—23922 ‐ basin and Canal water discharges monthly, semi‐and annual monitoring NJPDES 0142051 – Lined surface impoundment ‐ inspections
In 2013, PPPL‐DOE received from NJDEP the final NJPDES surface
water discharge permit [PPPL13d]. PPPL reported two (2) non‐
compliances at DSN001, basin outfall [PPPL13e]. An elevated total
suspended solids (TSS) was detected in a duplicate sample; it was
undetermined whether the sample was a sampling or analytical error.
The second non‐compliance was a measure of 0.11 mg/L for chlorine‐
produced oxidant (CPO), which is above the detection/permit limit (0.1
mg/L). The source of the CPO was undetermined. The LSI was
compliant.
4.1.1 Exhibits 4‐1, 4‐2, 4‐3 and 4‐
5
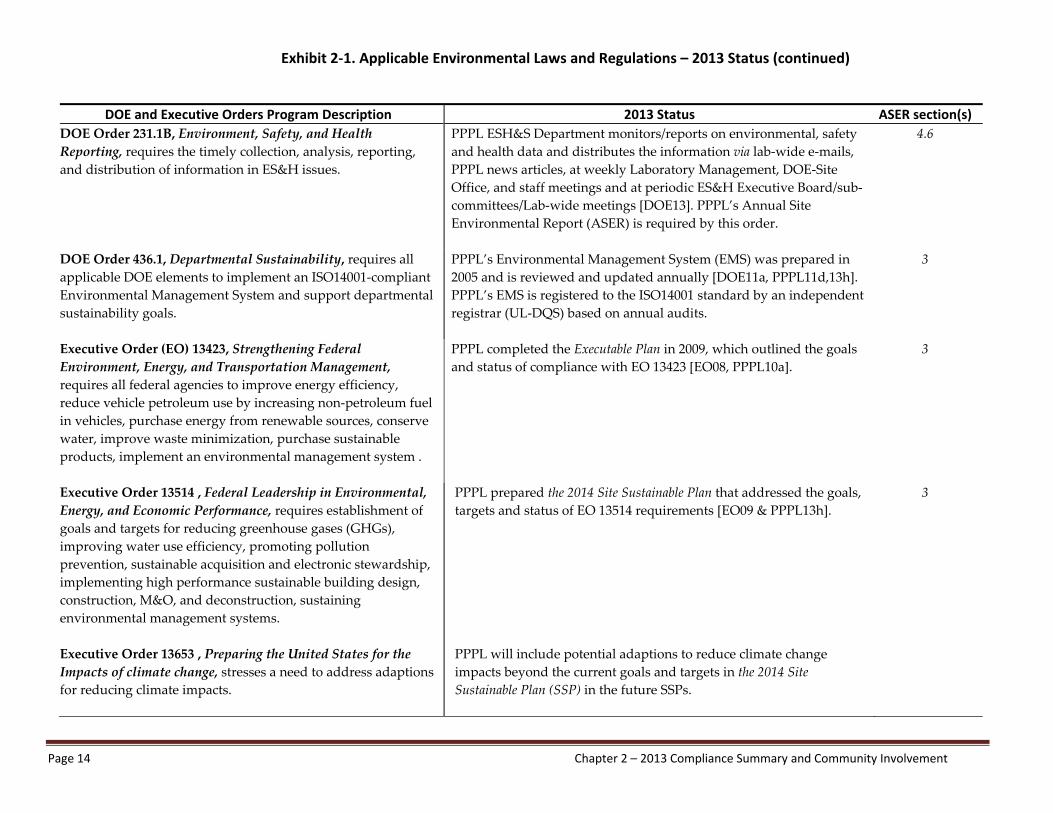
Exhibit 2‐1. Applicable Environmental Laws and Regulations – 2013 Status (continued)
Page 14 Chapter 2 – 2013 Compliance Summary and Community Involvement
DOE and Executive Orders Program Description 2013 Status ASER section(s)
DOE Order 231.1B, Environment, Safety, and Health Reporting, requires the timely collection, analysis, reporting,
and distribution of information in ES&H issues.
PPPL ESH&S Department monitors/reports on environmental, safety
and health data and distributes the information via lab‐wide e‐mails,
PPPL news articles, at weekly Laboratory Management, DOE‐Site
Office, and staff meetings and at periodic ES&H Executive Board/sub‐
committees/Lab‐wide meetings [DOE13]. PPPL’s Annual Site
Environmental Report (ASER) is required by this order.
4.6
DOE Order 436.1, Departmental Sustainability, requires all applicable DOE elements to implement an ISO14001‐compliant
Environmental Management System and support departmental
sustainability goals.
PPPL’s Environmental Management System (EMS) was prepared in
2005 and is reviewed and updated annually [DOE11a, PPPL11d,13h].
PPPL’s EMS is registered to the ISO14001 standard by an independent
registrar (UL‐DQS) based on annual audits.
3
Executive Order (EO) 13423, Strengthening Federal Environment, Energy, and Transportation Management, requires all federal agencies to improve energy efficiency,
reduce vehicle petroleum use by increasing non‐petroleum fuel
in vehicles, purchase energy from renewable sources, conserve
water, improve waste minimization, purchase sustainable
products, implement an environmental management system .
PPPL completed the Executable Plan in 2009, which outlined the goals
and status of compliance with EO 13423 [EO08, PPPL10a].
3
Executive Order 13514 , Federal Leadership in Environmental, Energy, and Economic Performance, requires establishment of
goals and targets for reducing greenhouse gases (GHGs),
improving water use efficiency, promoting pollution
prevention, sustainable acquisition and electronic stewardship,
implementing high performance sustainable building design,
construction, M&O, and deconstruction, sustaining
environmental management systems.
Executive Order 13653 , Preparing the United States for the Impacts of climate change, stresses a need to address adaptions for reducing climate impacts.
PPPL prepared the 2014 Site Sustainable Plan that addressed the goals, targets and status of EO 13514 requirements [EO09 & PPPL13h].
PPPL will include potential adaptions to reduce climate change
impacts beyond the current goals and targets in the 2014 Site Sustainable Plan (SSP) in the future SSPs.
3
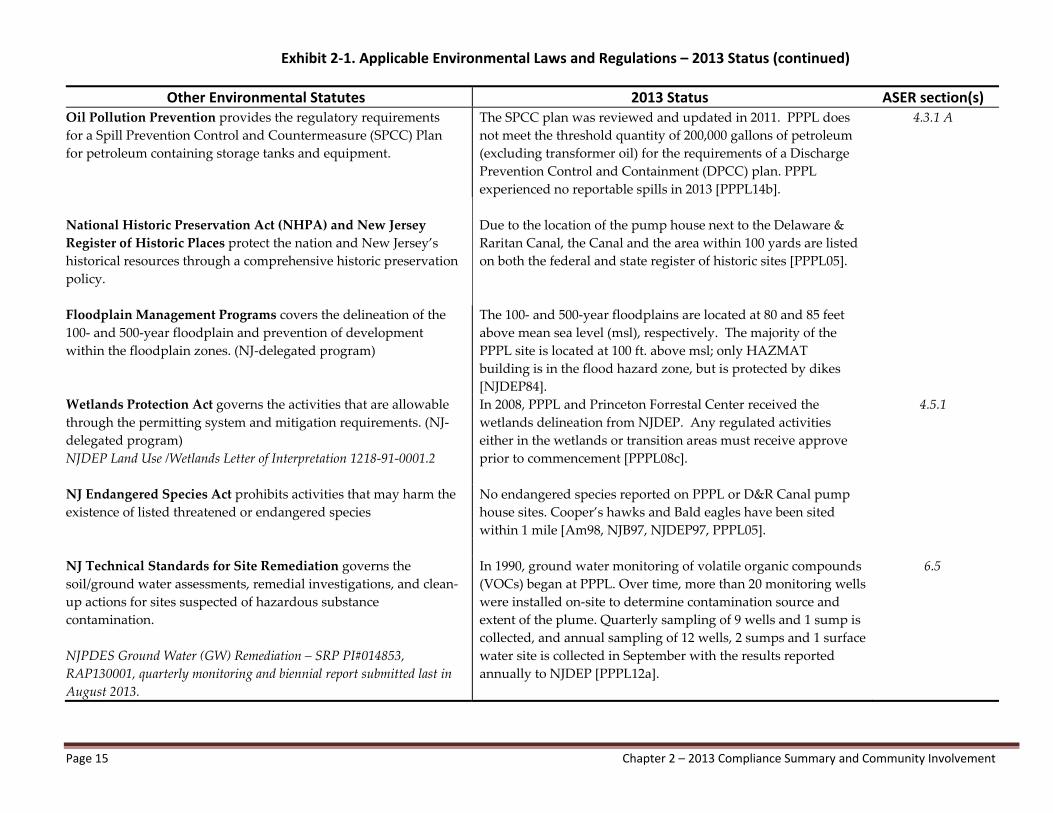
Exhibit 2‐1. Applicable Environmental Laws and Regulations – 2013 Status (continued)
Page 15 Chapter 2 – 2013 Compliance Summary and Community Involvement
Other Environmental Statutes 2013 Status ASER section(s) Oil Pollution Prevention provides the regulatory requirements
for a Spill Prevention Control and Countermeasure (SPCC) Plan
for petroleum containing storage tanks and equipment.
The SPCC plan was reviewed and updated in 2011. PPPL does
not meet the threshold quantity of 200,000 gallons of petroleum
(excluding transformer oil) for the requirements of a Discharge
Prevention Control and Containment (DPCC) plan. PPPL
experienced no reportable spills in 2013 [PPPL14b].
4.3.1 A
National Historic Preservation Act (NHPA) and New Jersey
Register of Historic Places protect the nation and New Jersey’s
historical resources through a comprehensive historic preservation
policy.
Due to the location of the pump house next to the Delaware &
Raritan Canal, the Canal and the area within 100 yards are listed
on both the federal and state register of historic sites [PPPL05].
Floodplain Management Programs covers the delineation of the
100‐ and 500‐year floodplain and prevention of development
within the floodplain zones. (NJ‐delegated program)
The 100‐ and 500‐year floodplains are located at 80 and 85 feet
above mean sea level (msl), respectively. The majority of the
PPPL site is located at 100 ft. above msl; only HAZMAT
building is in the flood hazard zone, but is protected by dikes
[NJDEP84].
Wetlands Protection Act governs the activities that are allowable
through the permitting system and mitigation requirements. (NJ‐
delegated program)
NJDEP Land Use /Wetlands Letter of Interpretation 1218‐91‐0001.2
In 2008, PPPL and Princeton Forrestal Center received the
wetlands delineation from NJDEP. Any regulated activities
either in the wetlands or transition areas must receive approve
prior to commencement [PPPL08c].
4.5.1
NJ Endangered Species Act prohibits activities that may harm the
existence of listed threatened or endangered species
No endangered species reported on PPPL or D&R Canal pump
house sites. Cooper’s hawks and Bald eagles have been sited
within 1 mile [Am98, NJB97, NJDEP97, PPPL05].
NJ Technical Standards for Site Remediation governs the
soil/ground water assessments, remedial investigations, and clean‐
up actions for sites suspected of hazardous substance
contamination.
NJPDES Ground Water (GW) Remediation – SRP PI#014853, RAP130001, quarterly monitoring and biennial report submitted last in August 2013.
In 1990, ground water monitoring of volatile organic compounds
(VOCs) began at PPPL. Over time, more than 20 monitoring wells
were installed on‐site to determine contamination source and
extent of the plume. Quarterly sampling of 9 wells and 1 sump is
collected, and annual sampling of 12 wells, 2 sumps and 1 surface
water site is collected in September with the results reported
annually to NJDEP [PPPL12a].
6.5
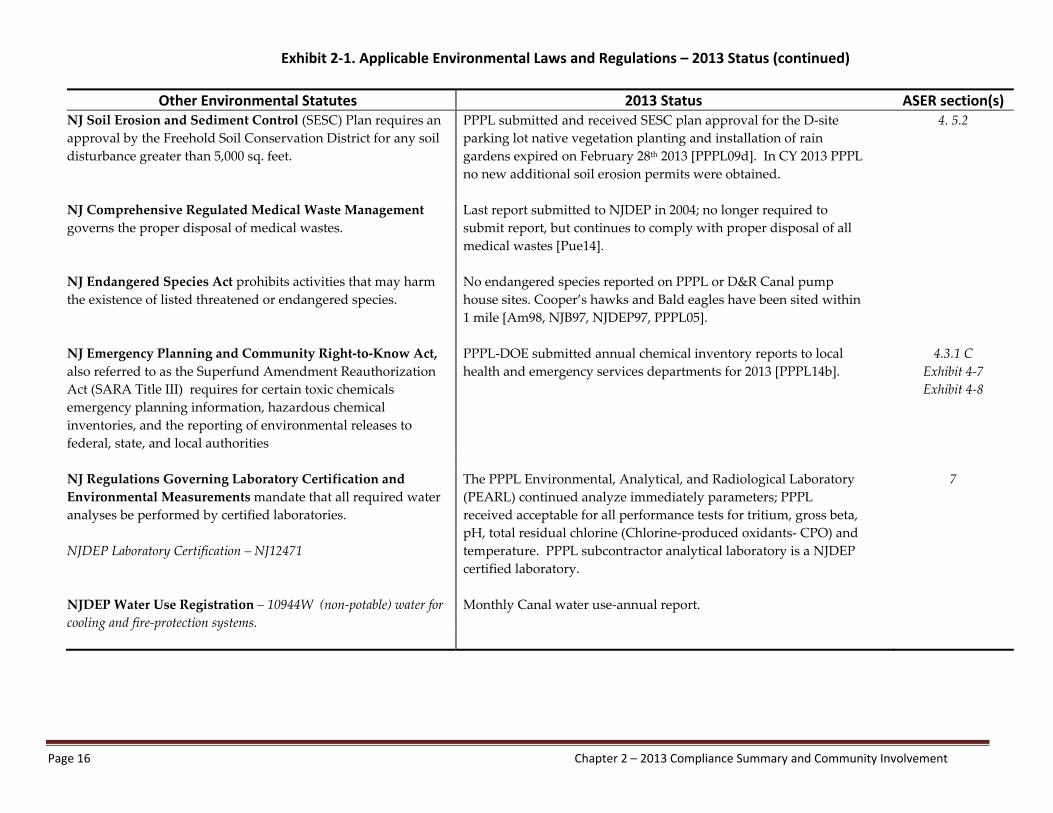
Exhibit 2‐1. Applicable Environmental Laws and Regulations – 2013 Status (continued)
Page 16 Chapter 2 – 2013 Compliance Summary and Community Involvement
Other Environmental Statutes 2013 Status ASER section(s) NJ Soil Erosion and Sediment Control (SESC) Plan requires an
approval by the Freehold Soil Conservation District for any soil
disturbance greater than 5,000 sq. feet.
PPPL submitted and received SESC plan approval for the D‐site
parking lot native vegetation planting and installation of rain
gardens expired on February 28th 2013 [PPPL09d]. In CY 2013 PPPL
no new additional soil erosion permits were obtained.
4. 5.2
NJ Comprehensive Regulated Medical Waste Management
governs the proper disposal of medical wastes.
Last report submitted to NJDEP in 2004; no longer required to
submit report, but continues to comply with proper disposal of all
medical wastes [Pue14].
NJ Endangered Species Act prohibits activities that may harm
the existence of listed threatened or endangered species.
NJ Emergency Planning and Community Right‐to‐Know Act,
also referred to as the Superfund Amendment Reauthorization
Act (SARA Title III) requires for certain toxic chemicals
emergency planning information, hazardous chemical
inventories, and the reporting of environmental releases to
federal, state, and local authorities
No endangered species reported on PPPL or D&R Canal pump
house sites. Cooper’s hawks and Bald eagles have been sited within
1 mile [Am98, NJB97, NJDEP97, PPPL05].
PPPL‐DOE submitted annual chemical inventory reports to local
health and emergency services departments for 2013 [PPPL14b].
4.3.1 C Exhibit 4‐7 Exhibit 4‐8
NJ Regulations Governing Laboratory Certification and
Environmental Measurements mandate that all required water
analyses be performed by certified laboratories.
NJDEP Laboratory Certification – NJ12471
The PPPL Environmental, Analytical, and Radiological Laboratory
(PEARL) continued analyze immediately parameters; PPPL
received acceptable for all performance tests for tritium, gross beta,
pH, total residual chlorine (Chlorine‐produced oxidants‐ CPO) and
temperature. PPPL subcontractor analytical laboratory is a NJDEP
certified laboratory.
7
NJDEP Water Use Registration – 10944W (non‐potable) water for cooling and fire‐protection systems.
Monthly Canal water use‐annual report.
Page 17 Chapter 2 – 2013l Compliance Summary and Community Involvement
2.4 External Oversight and Assessments
In January 2013, NJDEP Central Region Office, Water
Compliance & Enforcement, audited PPPL’s New Jersey
Pollution Discharge Elimination System (NJPDES) permit
requirements for retention
basin outfall (DSN001) and
the Delaware & Raritan
(D&R) Canal pump house
filter backwash outfall
(DSN003). PPPL monitors
these outfalls each month for
conventional pollutants, e.g.,
total petroleum hydrocarbons,
total residual chlorine, ph,
temperature, etc. (Appendix
A, Tables 17 & 18).
Additional parameters are
monitored and reported
quarterly, semi‐annually, and annually. No findings resulted
from this audit.
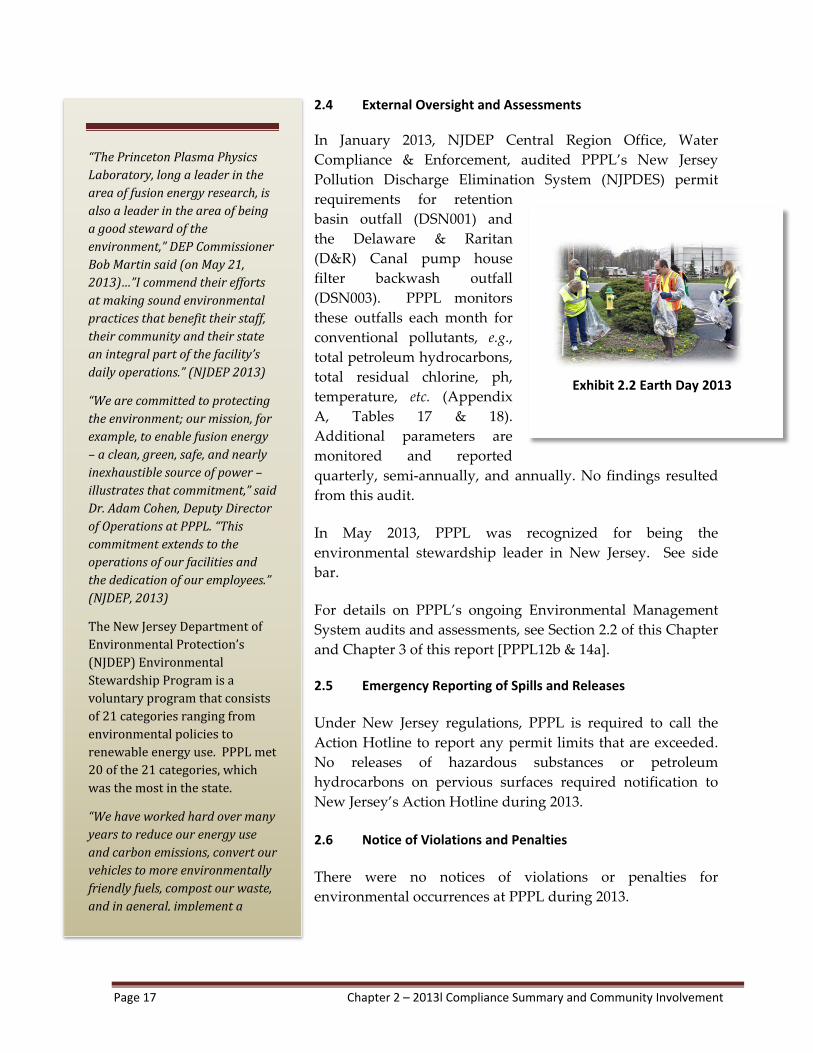
In May 2013, PPPL was recognized for being the
environmental stewardship leader in New Jersey. See side
bar.
For details on PPPL’s ongoing Environmental Management
System audits and assessments, see Section 2.2 of this Chapter
and Chapter 3 of this report [PPPL12b & 14a]. 2.5 Emergency Reporting of Spills and Releases
Under New Jersey regulations, PPPL is required to call the
Action Hotline to report any permit limits that are exceeded.
No releases of hazardous substances or petroleum
hydrocarbons on pervious surfaces required notification to
New Jersey’s Action Hotline during 2013.
2.6 Notice of Violations and Penalties
There were no notices of violations or penalties for
environmental occurrences at PPPL during 2013.
“ThePrincetonPlasmaPhysicsLaboratory,longaleaderintheareaoffusionenergyresearch,isalsoaleaderintheareaofbeingagoodstewardoftheenvironment,”DEPCommissionerBobMartinsaid(onMay21,2013)…”Icommendtheireffortsatmakingsoundenvironmentalpracticesthatbenefittheirstaff,theircommunityandtheirstateanintegralpartofthefacility’sdailyoperations.”(NJDEP2013)
“Wearecommittedtoprotectingtheenvironment;ourmission,forexample,toenablefusionenergy–aclean,green,safe,andnearlyinexhaustiblesourceofpower–illustratesthatcommitment,”saidDr.AdamCohen,DeputyDirectorofOperationsatPPPL.“Thiscommitmentextendstotheoperationsofourfacilitiesandthededicationofouremployees.”(NJDEP,2013)
TheNewJerseyDepartmentofEnvironmentalProtection’s(NJDEP)EnvironmentalStewardshipProgramisavoluntaryprogramthatconsistsof21categoriesrangingfromenvironmentalpoliciestorenewableenergyuse.PPPLmet20ofthe21categories,whichwasthemostinthestate.
“Wehaveworkedhardovermanyyearstoreduceourenergyuseandcarbonemissions,convertourvehiclestomoreenvironmentallyfriendlyfuels,compostourwaste,andingeneral,implementa
Exhibit 2.2 Earth Day 2013

Page 18 Chapter 2 – 2013 Compliance Summary and Community Involvement
2.7 Community Involvement
2.7.1 Earth Week and American Recycles Day at PPPL
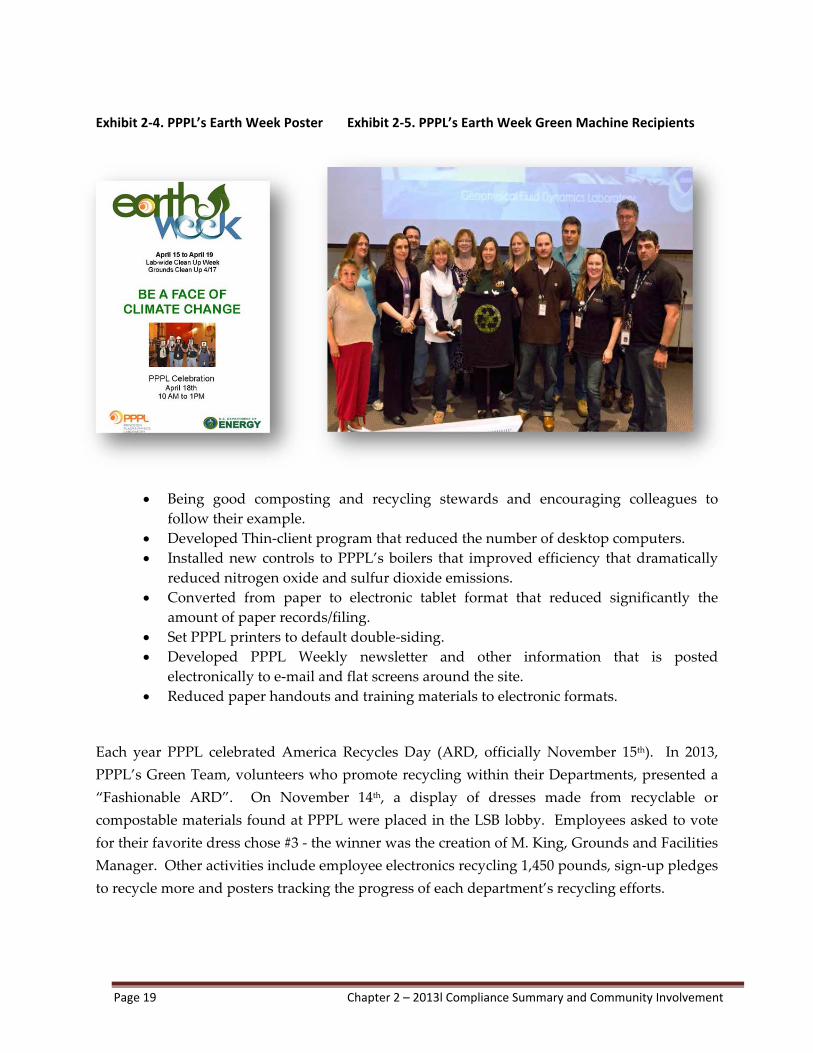
“Be a Face of Climate Change” was the theme of PPPL’s
2013 Earth Week celebration (See box and Exhibit 2‐4).
On April 18h, PPPL employees and members of the
public were invited to view displays on sustainable
renovations and projects: Mercer County Improvement
Authority, and PPPL’s subcontractors for landscaping,
office and janitorial supply, cafeteria, sustainable
furniture supply, and electronic waste removal
companies. PPPL’s electronic recycling vendor provided
recycling for employees’ personal e‐waste that weighed
2,480 pounds.
Thirty‐two PPPL employees took two‐hours from their
normal tasks to improve the environment. Four teams
patrolled the grounds by removing recyclables and trash
that had escaped the dumpsters.
Included in the Earth Week celebration activities, Emelie
Jeffries, a DOE consultant, who with her fellow Native‐
Americans, known as Raven Wings, performed
traditional dances. These dances are an expression of
their culture honoring both their people and Mother
Earth.
The colloquium speaker, Dr. John Dunne, research
oceanographer with the National oceanic and
atmospheric Administration’s Geophysical Fluid
Dynamic Laboratory, presented “How Climate Changes
Affects Your Work.”
Each year, employees nominate their co‐workers for their
exceptional efforts to minimize waste, improve energy
efficiency, and promote sustainable practices at PPPL.
There were seventeen employees who received the 2012
PPPL Green Machine Awards for the following projects:
Exhibit 2.3 PPPL’s 2013 Earth Week
Page 19 Chapter 2 – 2013l Compliance Summary and Community Involvement
Exhibit 2‐4. PPPL’s Earth Week Poster Exhibit 2‐5. PPPL’s Earth Week Green Machine Recipients
Being good composting and recycling stewards and encouraging colleagues to
follow their example.
Developed Thin‐client program that reduced the number of desktop computers.
Installed new controls to PPPL’s boilers that improved efficiency that dramatically
reduced nitrogen oxide and sulfur dioxide emissions.
Converted from paper to electronic tablet format that reduced significantly the
amount of paper records/filing.
Set PPPL printers to default double‐siding.
Developed PPPL Weekly newsletter and other information that is posted
electronically to e‐mail and flat screens around the site.
Reduced paper handouts and training materials to electronic formats.
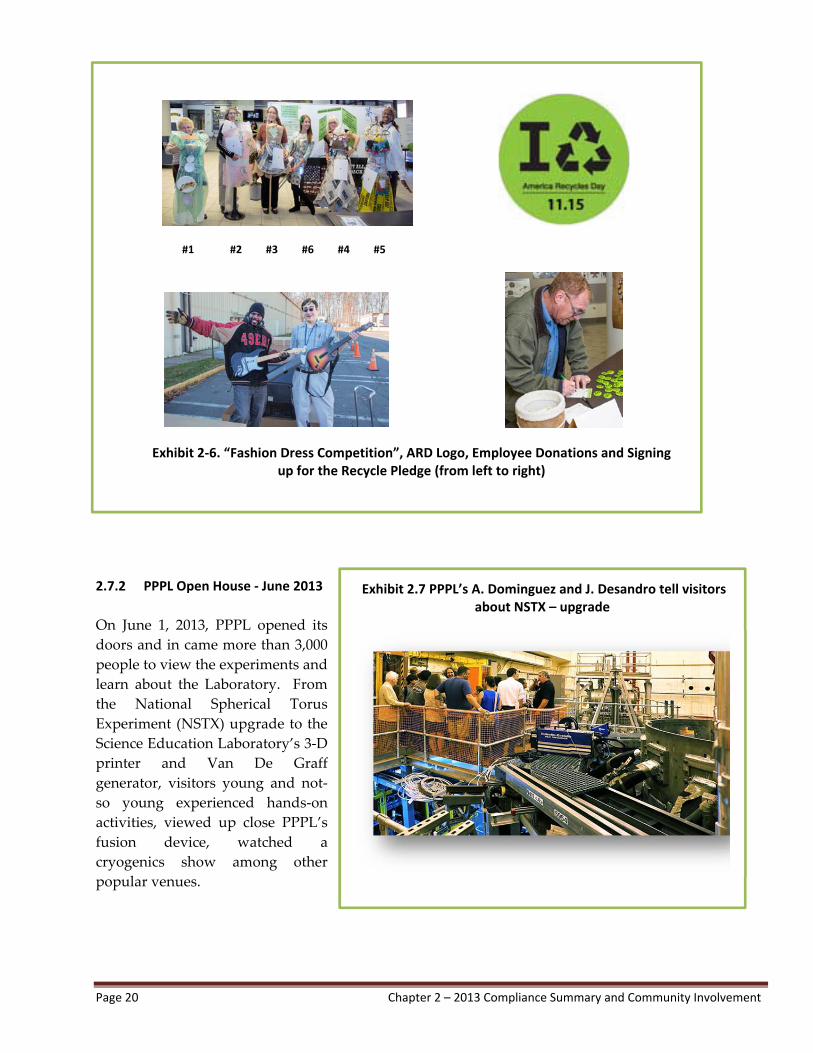
Each year PPPL celebrated America Recycles Day (ARD, officially November 15th). In 2013,
PPPL’s Green Team, volunteers who promote recycling within their Departments, presented a
“Fashionable ARD”. On November 14th, a display of dresses made from recyclable or
compostable materials found at PPPL were placed in the LSB lobby. Employees asked to vote
for their favorite dress chose #3 ‐ the winner was the creation of M. King, Grounds and Facilities
Manager. Other activities include employee electronics recycling 1,450 pounds, sign‐up pledges
to recycle more and posters tracking the progress of each department’s recycling efforts.
Page 20 Chapter 2 – 2013 Compliance Summary and Community Involvement
2.7.2 PPPL Open House ‐ June 2013
On June 1, 2013, PPPL opened its
doors and in came more than 3,000
people to view the experiments and
learn about the Laboratory. From
the National Spherical Torus
Experiment (NSTX) upgrade to the
Science Education Laboratory’s 3‐D
printer and Van De Graff
generator, visitors young and not‐
so young experienced hands‐on
activities, viewed up close PPPL’s
fusion device, watched a
cryogenics show among other
popular venues.
#1 #2 #3 #6 #4 #5
Exhibit 2‐6. “Fashion Dress Competition”, ARD Logo, Employee Donations and Signing up for the Recycle Pledge (from left to right)
Exhibit 2.7 PPPL’s A. Dominguez and J. Desandro tell visitors about NSTX – upgrade
Chapter 3– Environmental Management System (EMS) Page 21
Chapter
3 ENVIRONMENTAL MANAGEMENT SYSTEM (EMS)
PPPL has been successful in meeting the sustainability goals established by Presidential Executive
Orders (EO) 13423 and 13514 and DOE Order 436.1 by integrating these goals into its site‐wide
Environmental Management System (EMS). Since 2005, PPPL has focused on improving the
sustainability of Laboratory operations and improving environmental performance. “Sustainable
PPPL” is a program that capitalizes on PPPL’s existing EMS to move the Laboratory toward more
sustainable operations. The EMS includes energy management, water conservation, renewable
energy, greenhouse gas management, waste minimization, environmentally preferable purchasing,
and facility operation programs to reduce environmental impacts and improve performance
[PPPL12b]. PPPL will continue to proactively implement sustainability practices aimed at meeting,
or exceeding, the sustainability goals in its EMS, DOE Orders and Executive Orders [EO08, 09].
In 2013, PPPL maintained the registration of its Environmental Management System against the
International Standard Organization ISO‐14001:2004. The second annual surveillance audit,
required to maintain ISO 14001:2004 certification, is scheduled for February 2014.
3.1 DOE Sustainability Goals
In 2013, PPPL continued to address the aggressive new sustainability and greenhouse gas
management goals of EO 13514, Federal Leadership in Environmental, Energy, and Economic Performance. PPPL completed its third annual Site Sustainability Plan, which summarized progress
and outlined future plans for meeting the departmental sustainability goals under EOs 13423 and
13514, and submitted the Comprehensive Energy Data Report (CEDR) and Pollution Prevention
Tracking System Report [PPPL13f & g]. 3.1.1 Energy Efficiency
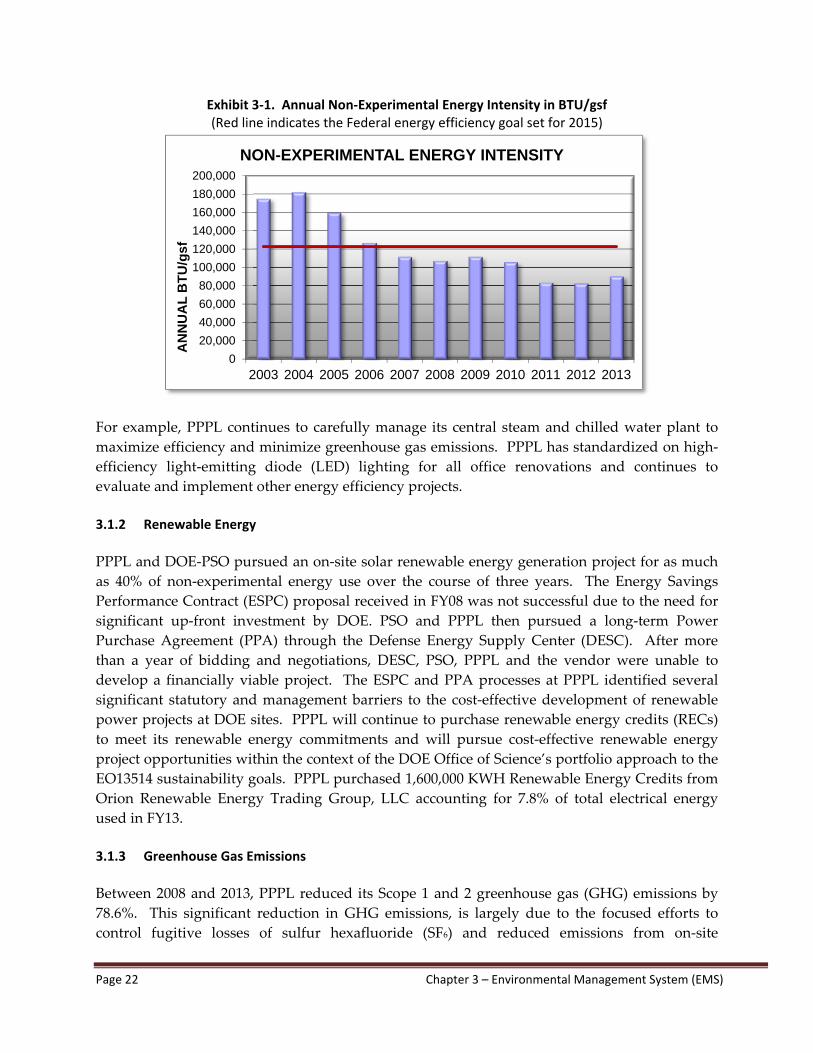
In 2013, PPPL maintained a reduction of 48.3% in energy intensity (British Thermal Unit per gross
square feet, BTU/gsf) for non‐experimental energy use compared to the 2003 baseline year (see
Exhibit 3‐1). This value represents a modest increase over 2012, but PPPL’s non‐experimental
buildings still use approximately one‐half of the energy consumed in 2003. This was achieved
through building automation, energy conservation measures, and equipment upgrades.
PPPL continues to emphasize energy management as part of its facility operations and continues to
leverage the success in non‐experimental energy management to improve experimental efficiency.
Page 22 Chapter 3 – Environmental Management System (EMS)
Exhibit 3‐1. Annual Non‐Experimental Energy Intensity in BTU/gsf (Red line indicates the Federal energy efficiency goal set for 2015)
For example, PPPL continues to carefully manage its central steam and chilled water plant to
maximize efficiency and minimize greenhouse gas emissions. PPPL has standardized on high‐
efficiency light‐emitting diode (LED) lighting for all office renovations and continues to
evaluate and implement other energy efficiency projects.
3.1.2 Renewable Energy
PPPL and DOE‐PSO pursued an on‐site solar renewable energy generation project for as much
as 40% of non‐experimental energy use over the course of three years. The Energy Savings
Performance Contract (ESPC) proposal received in FY08 was not successful due to the need for
significant up‐front investment by DOE. PSO and PPPL then pursued a long‐term Power
Purchase Agreement (PPA) through the Defense Energy Supply Center (DESC). After more
than a year of bidding and negotiations, DESC, PSO, PPPL and the vendor were unable to
develop a financially viable project. The ESPC and PPA processes at PPPL identified several
significant statutory and management barriers to the cost‐effective development of renewable
power projects at DOE sites. PPPL will continue to purchase renewable energy credits (RECs)
to meet its renewable energy commitments and will pursue cost‐effective renewable energy
project opportunities within the context of the DOE Office of Science’s portfolio approach to the
EO13514 sustainability goals. PPPL purchased 1,600,000 KWH Renewable Energy Credits from
Orion Renewable Energy Trading Group, LLC accounting for 7.8% of total electrical energy
used in FY13.
3.1.3 Greenhouse Gas Emissions
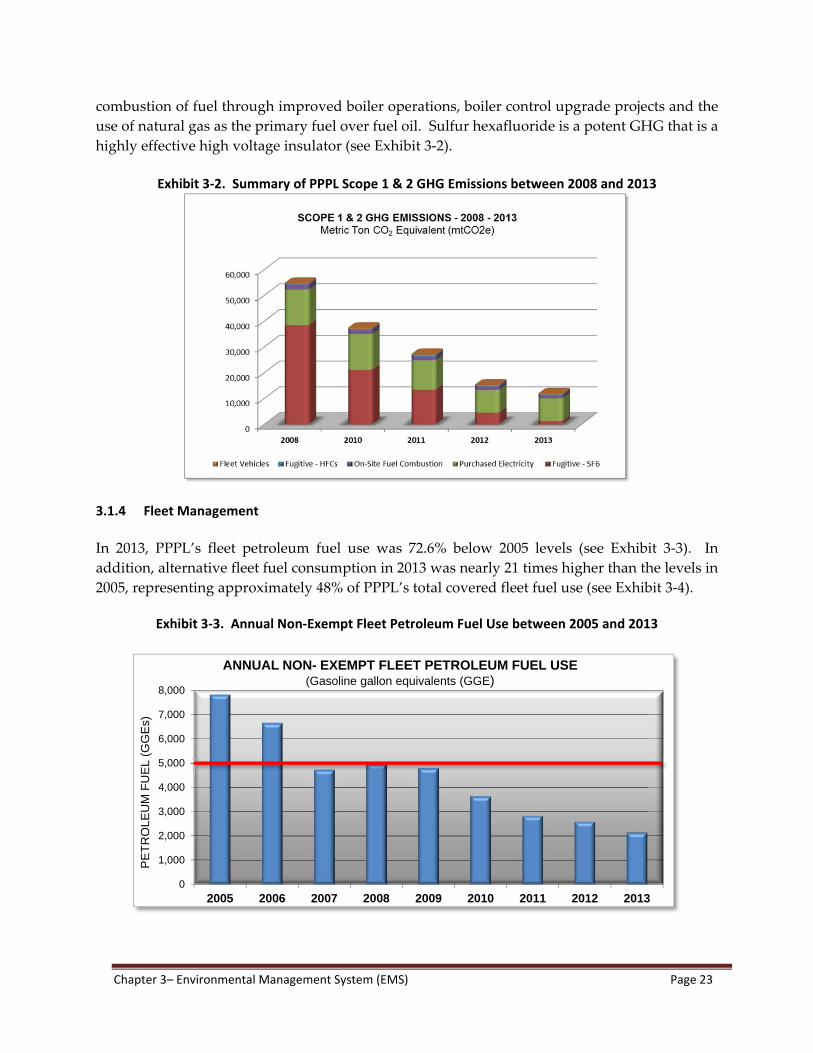
Between 2008 and 2013, PPPL reduced its Scope 1 and 2 greenhouse gas (GHG) emissions by
78.6%. This significant reduction in GHG emissions, is largely due to the focused efforts to
control fugitive losses of sulfur hexafluoride (SF6) and reduced emissions from on‐site
0
20,000
40,000
60,000
80,000
100,000
120,000
140,000
160,000
180,000
200,000
2003 2004 2005 2006 2007 2008 2009 2010 2011 2012 2013
AN
NU
AL
BT
U/g
sf
NON-EXPERIMENTAL ENERGY INTENSITY
Chapter 3– Environmental Management System (EMS) Page 23
combustion of fuel through improved boiler operations, boiler control upgrade projects and the
use of natural gas as the primary fuel over fuel oil. Sulfur hexafluoride is a potent GHG that is a
highly effective high voltage insulator (see Exhibit 3‐2).
Exhibit 3‐2. Summary of PPPL Scope 1 & 2 GHG Emissions between 2008 and 2013
3.1.4 Fleet Management
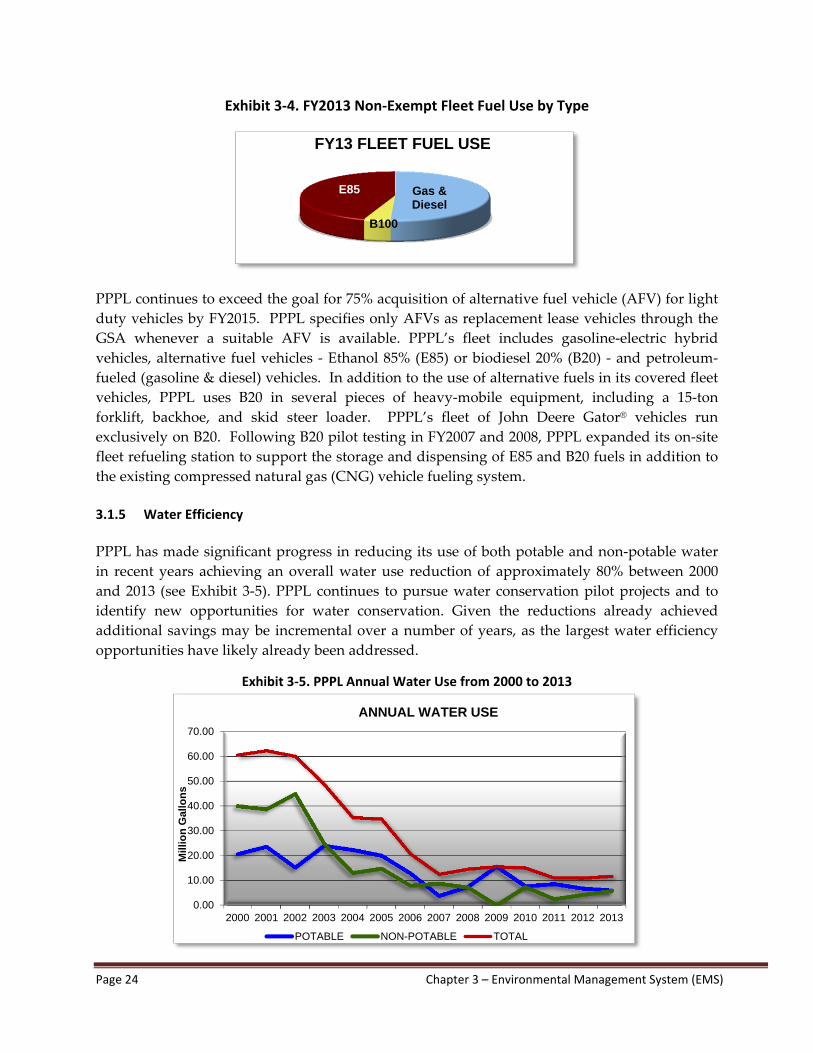
In 2013, PPPL’s fleet petroleum fuel use was 72.6% below 2005 levels (see Exhibit 3‐3). In
addition, alternative fleet fuel consumption in 2013 was nearly 21 times higher than the levels in
2005, representing approximately 48% of PPPL’s total covered fleet fuel use (see Exhibit 3‐4).
Exhibit 3‐3. Annual Non‐Exempt Fleet Petroleum Fuel Use between 2005 and 2013
0
1,000
2,000
3,000
4,000
5,000
6,000
7,000
8,000
2005 2006 2007 2008 2009 2010 2011 2012 2013
PE
TR
OLE
UM
FU
EL
(GG
Es)
ANNUAL NON- EXEMPT FLEET PETROLEUM FUEL USE(Gasoline gallon equivalents (GGE)
Page 24 Chapter 3 – Environmental Management System (EMS)
Exhibit 3‐4. FY2013 Non‐Exempt Fleet Fuel Use by Type
PPPL continues to exceed the goal for 75% acquisition of alternative fuel vehicle (AFV) for light
duty vehicles by FY2015. PPPL specifies only AFVs as replacement lease vehicles through the
GSA whenever a suitable AFV is available. PPPL’s fleet includes gasoline‐electric hybrid
vehicles, alternative fuel vehicles ‐ Ethanol 85% (E85) or biodiesel 20% (B20) ‐ and petroleum‐
fueled (gasoline & diesel) vehicles. In addition to the use of alternative fuels in its covered fleet
vehicles, PPPL uses B20 in several pieces of heavy‐mobile equipment, including a 15‐ton
forklift, backhoe, and skid steer loader. PPPL’s fleet of John Deere Gator® vehicles run
exclusively on B20. Following B20 pilot testing in FY2007 and 2008, PPPL expanded its on‐site
fleet refueling station to support the storage and dispensing of E85 and B20 fuels in addition to
the existing compressed natural gas (CNG) vehicle fueling system.
3.1.5 Water Efficiency
PPPL has made significant progress in reducing its use of both potable and non‐potable water
in recent years achieving an overall water use reduction of approximately 80% between 2000
and 2013 (see Exhibit 3‐5). PPPL continues to pursue water conservation pilot projects and to
identify new opportunities for water conservation. Given the reductions already achieved
additional savings may be incremental over a number of years, as the largest water efficiency
opportunities have likely already been addressed.
Exhibit 3‐5. PPPL Annual Water Use from 2000 to 2013
Gas & Diesel
B100
E85
FY13 FLEET FUEL USE
0.00
10.00
20.00
30.00
40.00
50.00
60.00
70.00
2000 2001 2002 2003 2004 2005 2006 2007 2008 2009 2010 2011 2012 2013
Mill
ion
Gal
lon
s
ANNUAL WATER USE
POTABLE NON-POTABLE TOTAL
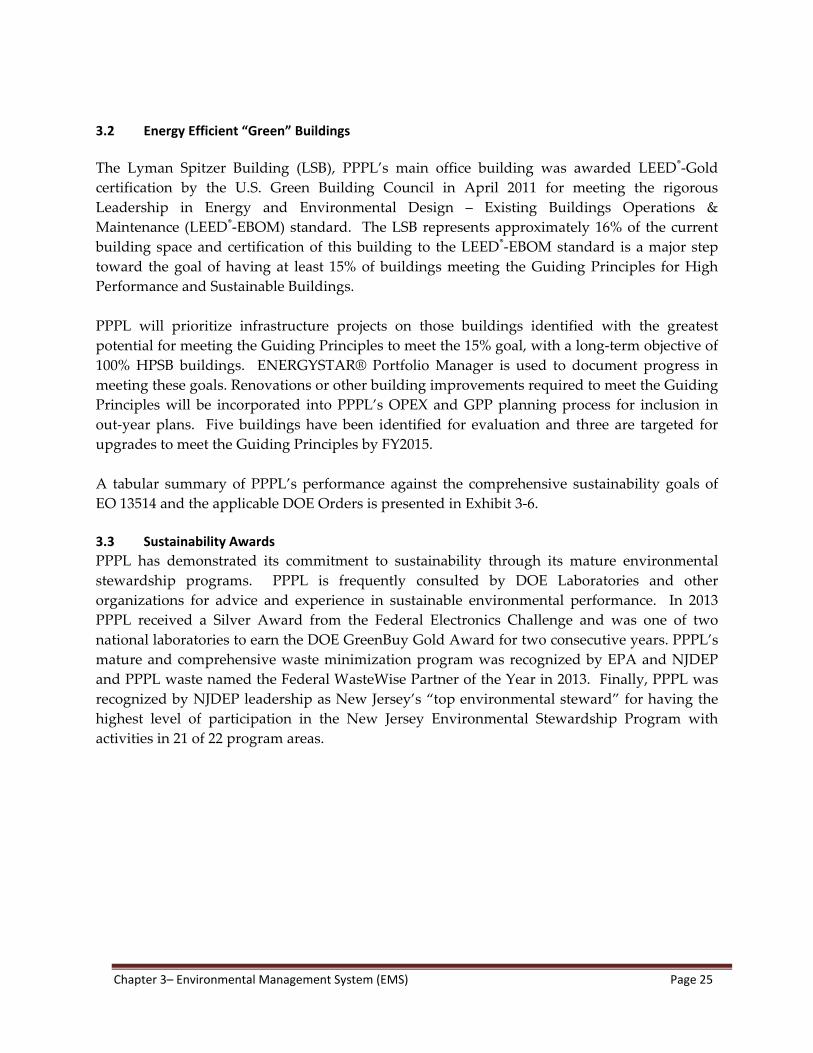
Chapter 3– Environmental Management System (EMS) Page 25
3.2 Energy Efficient “Green” Buildings
The Lyman Spitzer Building (LSB), PPPL’s main office building was awarded LEED®‐Gold
certification by the U.S. Green Building Council in April 2011 for meeting the rigorous
Leadership in Energy and Environmental Design – Existing Buildings Operations &
Maintenance (LEED®‐EBOM) standard. The LSB represents approximately 16% of the current
building space and certification of this building to the LEED®‐EBOM standard is a major step
toward the goal of having at least 15% of buildings meeting the Guiding Principles for High
Performance and Sustainable Buildings.
PPPL will prioritize infrastructure projects on those buildings identified with the greatest
potential for meeting the Guiding Principles to meet the 15% goal, with a long‐term objective of
100% HPSB buildings. ENERGYSTAR® Portfolio Manager is used to document progress in
meeting these goals. Renovations or other building improvements required to meet the Guiding
Principles will be incorporated into PPPL’s OPEX and GPP planning process for inclusion in
out‐year plans. Five buildings have been identified for evaluation and three are targeted for
upgrades to meet the Guiding Principles by FY2015.
A tabular summary of PPPL’s performance against the comprehensive sustainability goals of
EO 13514 and the applicable DOE Orders is presented in Exhibit 3‐6.
3.3 Sustainability Awards
PPPL has demonstrated its commitment to sustainability through its mature environmental
stewardship programs. PPPL is frequently consulted by DOE Laboratories and other
organizations for advice and experience in sustainable environmental performance. In 2013
PPPL received a Silver Award from the Federal Electronics Challenge and was one of two
national laboratories to earn the DOE GreenBuy Gold Award for two consecutive years. PPPL’s
mature and comprehensive waste minimization program was recognized by EPA and NJDEP
and PPPL waste named the Federal WasteWise Partner of the Year in 2013. Finally, PPPL was
recognized by NJDEP leadership as New Jersey’s “top environmental steward” for having the
highest level of participation in the New Jersey Environmental Stewardship Program with
activities in 21 of 22 program areas.
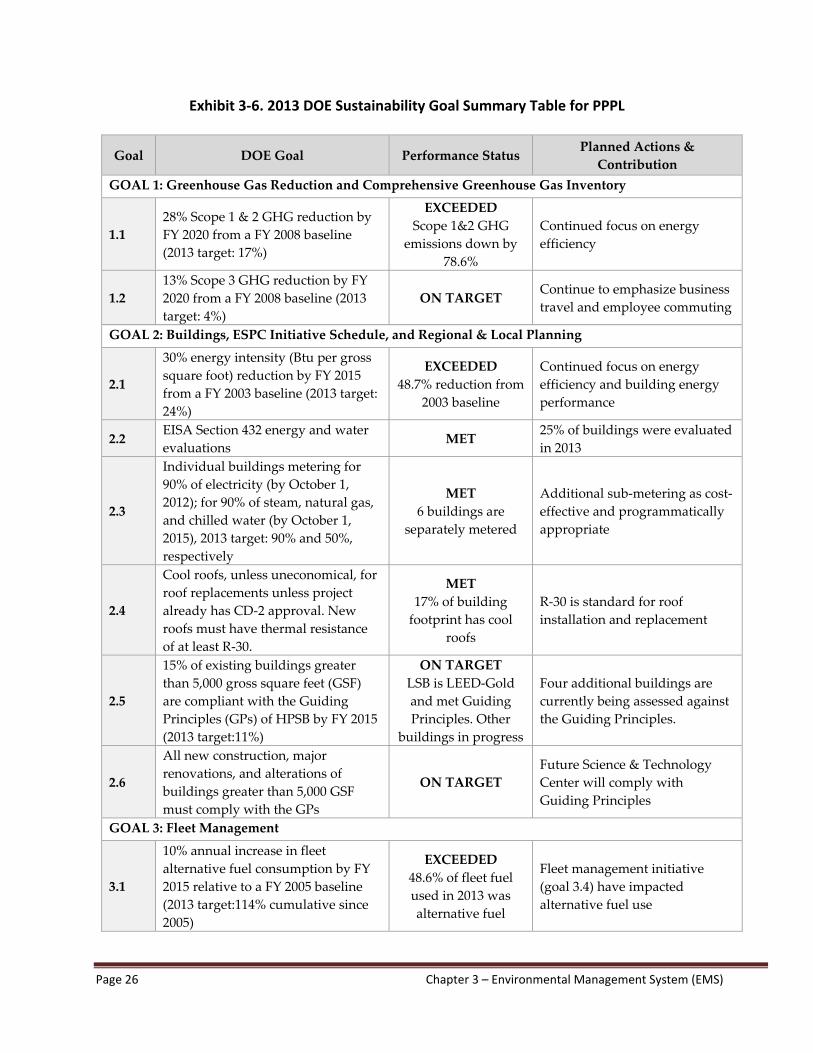
Page 26 Chapter 3 – Environmental Management System (EMS)
Exhibit 3‐6. 2013 DOE Sustainability Goal Summary Table for PPPL
Goal DOE Goal Performance Status Planned Actions &
Contribution
GOAL 1: Greenhouse Gas Reduction and Comprehensive Greenhouse Gas Inventory
1.1
28% Scope 1 & 2 GHG reduction by
FY 2020 from a FY 2008 baseline
(2013 target: 17%)
EXCEEDED
Scope 1&2 GHG
emissions down by
78.6%
Continued focus on energy
efficiency
1.2
13% Scope 3 GHG reduction by FY
2020 from a FY 2008 baseline (2013
target: 4%)
ON TARGET Continue to emphasize business
travel and employee commuting
GOAL 2: Buildings, ESPC Initiative Schedule, and Regional & Local Planning
2.1
30% energy intensity (Btu per gross
square foot) reduction by FY 2015
from a FY 2003 baseline (2013 target:
24%)
EXCEEDED
48.7% reduction from
2003 baseline
Continued focus on energy
efficiency and building energy
performance
2.2 EISA Section 432 energy and water
evaluations MET
25% of buildings were evaluated
in 2013
2.3
Individual buildings metering for
90% of electricity (by October 1,
2012); for 90% of steam, natural gas,
and chilled water (by October 1,
2015), 2013 target: 90% and 50%,
respectively
MET
6 buildings are
separately metered
Additional sub‐metering as cost‐
effective and programmatically
appropriate
2.4
Cool roofs, unless uneconomical, for
roof replacements unless project
already has CD‐2 approval. New
roofs must have thermal resistance
of at least R‐30.
MET
17% of building
footprint has cool
roofs
R‐30 is standard for roof
installation and replacement
2.5
15% of existing buildings greater
than 5,000 gross square feet (GSF)
are compliant with the Guiding
Principles (GPs) of HPSB by FY 2015
(2013 target:11%)
ON TARGET
LSB is LEED‐Gold
and met Guiding
Principles. Other
buildings in progress
Four additional buildings are
currently being assessed against
the Guiding Principles.
2.6
All new construction, major
renovations, and alterations of
buildings greater than 5,000 GSF
must comply with the GPs
ON TARGET
Future Science & Technology
Center will comply with
Guiding Principles
GOAL 3: Fleet Management
3.1
10% annual increase in fleet
alternative fuel consumption by FY
2015 relative to a FY 2005 baseline
(2013 target:114% cumulative since
2005)
EXCEEDED
48.6% of fleet fuel
used in 2013 was
alternative fuel
Fleet management initiative
(goal 3.4) have impacted
alternative fuel use
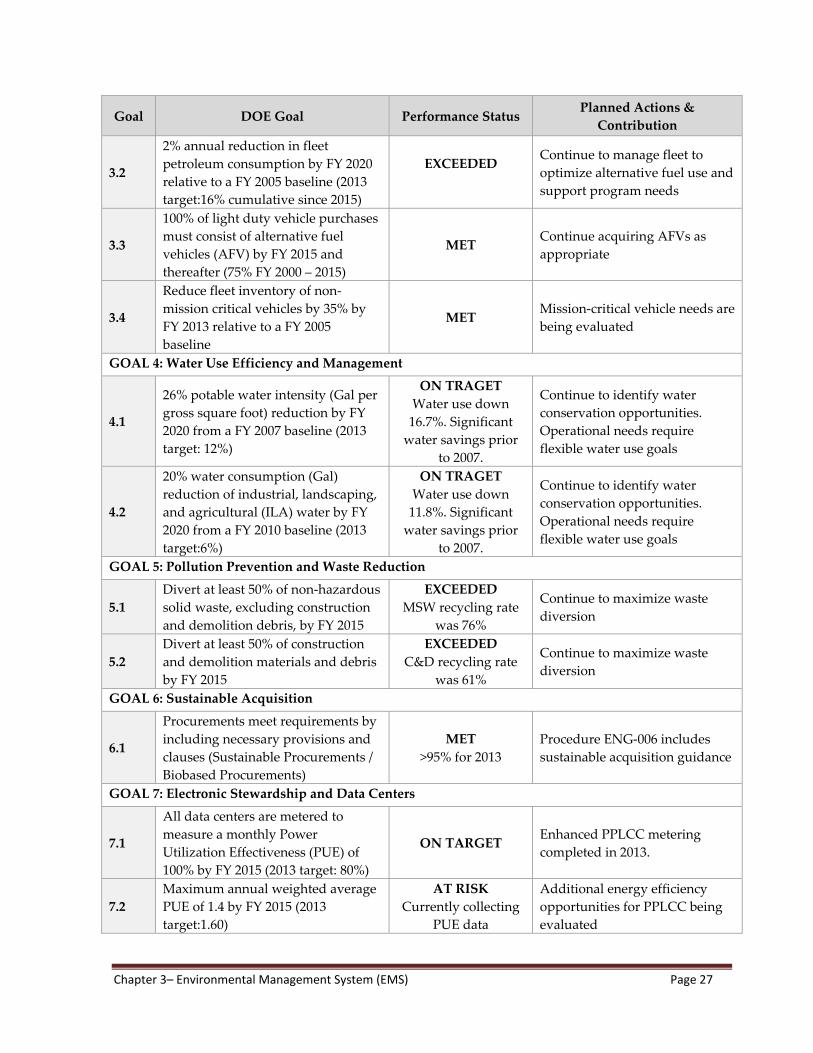
Chapter 3– Environmental Management System (EMS) Page 27
Goal DOE Goal Performance Status Planned Actions &
Contribution
3.2
2% annual reduction in fleet
petroleum consumption by FY 2020
relative to a FY 2005 baseline (2013
target:16% cumulative since 2015)
EXCEEDED
Continue to manage fleet to
optimize alternative fuel use and
support program needs
3.3
100% of light duty vehicle purchases
must consist of alternative fuel
vehicles (AFV) by FY 2015 and
thereafter (75% FY 2000 – 2015)
MET Continue acquiring AFVs as
appropriate
3.4
Reduce fleet inventory of non‐
mission critical vehicles by 35% by
FY 2013 relative to a FY 2005
baseline
MET Mission‐critical vehicle needs are
being evaluated
GOAL 4: Water Use Efficiency and Management
4.1
26% potable water intensity (Gal per
gross square foot) reduction by FY
2020 from a FY 2007 baseline (2013
target: 12%)
ON TRAGET
Water use down
16.7%. Significant
water savings prior
to 2007.
Continue to identify water
conservation opportunities.
Operational needs require
flexible water use goals
4.2
20% water consumption (Gal)
reduction of industrial, landscaping,
and agricultural (ILA) water by FY
2020 from a FY 2010 baseline (2013
target:6%)
ON TRAGET
Water use down
11.8%. Significant
water savings prior
to 2007.
Continue to identify water
conservation opportunities.
Operational needs require
flexible water use goals
GOAL 5: Pollution Prevention and Waste Reduction
5.1
Divert at least 50% of non‐hazardous
solid waste, excluding construction
and demolition debris, by FY 2015
EXCEEDED
MSW recycling rate
was 76%
Continue to maximize waste
diversion
5.2
Divert at least 50% of construction
and demolition materials and debris
by FY 2015
EXCEEDED
C&D recycling rate
was 61%
Continue to maximize waste
diversion
GOAL 6: Sustainable Acquisition
6.1
Procurements meet requirements by
including necessary provisions and
clauses (Sustainable Procurements /
Biobased Procurements)
MET
>95% for 2013
Procedure ENG‐006 includes
sustainable acquisition guidance
GOAL 7: Electronic Stewardship and Data Centers
7.1
All data centers are metered to
measure a monthly Power
Utilization Effectiveness (PUE) of
100% by FY 2015 (2013 target: 80%)
ON TARGET Enhanced PPLCC metering
completed in 2013.
7.2
Maximum annual weighted average
PUE of 1.4 by FY 2015 (2013
target:1.60)
AT RISK
Currently collecting
PUE data
Additional energy efficiency
opportunities for PPLCC being
evaluated
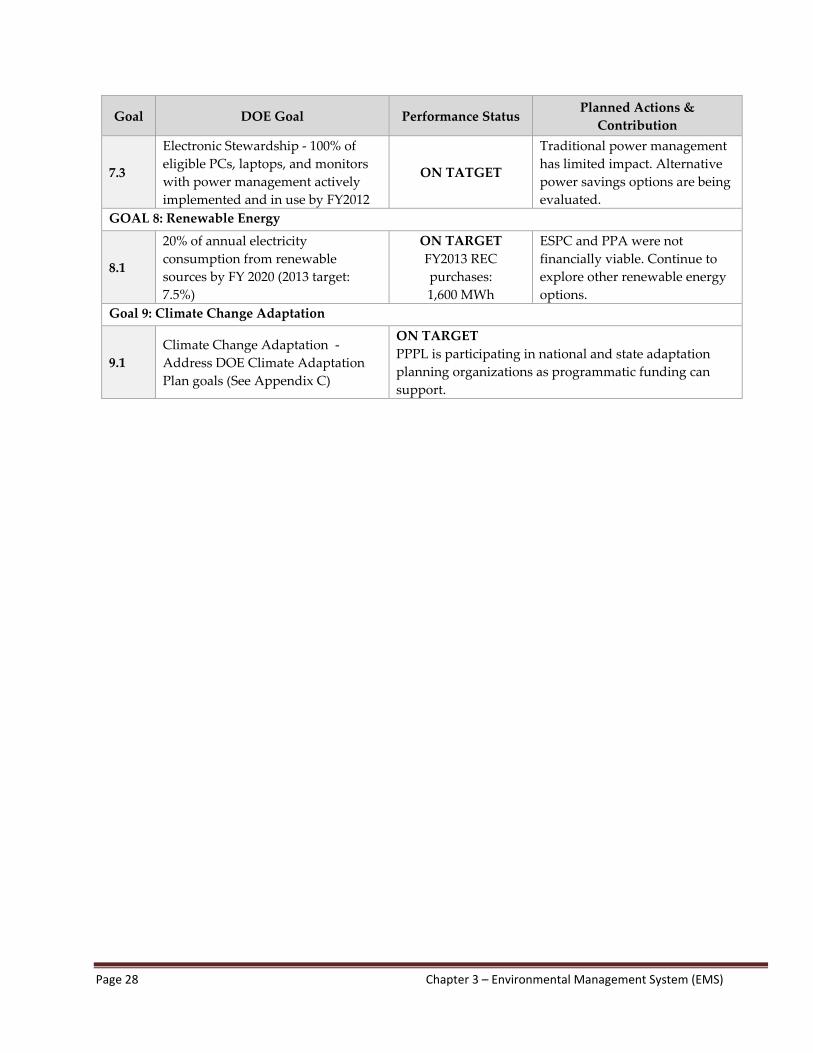
Page 28 Chapter 3 – Environmental Management System (EMS)
Goal DOE Goal Performance Status Planned Actions &
Contribution
7.3
Electronic Stewardship ‐ 100% of
eligible PCs, laptops, and monitors
with power management actively
implemented and in use by FY2012
ON TATGET
Traditional power management
has limited impact. Alternative
power savings options are being
evaluated.
GOAL 8: Renewable Energy
8.1
20% of annual electricity
consumption from renewable
sources by FY 2020 (2013 target:
7.5%)
ON TARGET
FY2013 REC
purchases:
1,600 MWh
ESPC and PPA were not
financially viable. Continue to
explore other renewable energy
options.
Goal 9: Climate Change Adaptation
9.1
Climate Change Adaptation ‐
Address DOE Climate Adaptation
Plan goals (See Appendix C)
ON TARGET
PPPL is participating in national and state adaptation
planning organizations as programmatic funding can
support.
Chapter 4 – Environmental Non‐Radiological Program Information Page 29
Chapter
4
ENVIRONMENTAL NON-RADIOLOGICAL PROGRAM INFORMATION
The following sections briefly describe PPPL’s environmental programs required by federal,
state, or local agencies. These programs were developed to comply with regulations governing
air, water, waste water, soil, land use, and hazardous materials, as well as with DOE orders or
programs.
4.1 Non‐Radiological Water Programs 4.1.1 New Jersey Pollutant Discharge Elimination System (NJPDES) Program A. Monthly Discharge Monitoring Reports (DMR)
In compliance with permit requirements of the New Jersey Pollutant Discharge Elimination
System (NJPDES) permit, NJ0023922, PPPL and DOE‐PSO submitted to NJDEP monthly
discharge monitoring reports (DMRs) for Discharge Serial Number (DSN)—DSN001, retention
basin outfall, and DSN003, Delaware & Raritan (D&R) Canal pump house filter backwash
discharge (Appendix Tables 17 , 18, & 21).
In 2013, PPPL received the final NJPDES permit with the effective date of October 1, 2013. In
February 2008, NJDEP issued a Final Surface Water Minor Modification Permit Action report. Key changes to the permit included eliminating loading requirements and quarterly monitoring for
Total nitrogen at DSN001, additional annual and semi‐annual Waste Characterization Reports
(WCR) from DSN001 and DSN003 and an annual chronic toxicity test for Ceriodaphnia dubia (Water flea) [NJDEP13a]. Changes to PPPL’s reporting requirements are noted in Exhibit 4‐2. Under the current NJPDES
permit effective date October 1, 2013, PPPL is required to provide an annual WCR for both DSN001
and DSN003. DSN001 also requires additional semi‐annual WCR monitoring for particular metals
and semi‐volatile organic compounds (SVOC). DSN003 is still required to complete a full WCR once
per permit cycle. During 2013, PPPLʹs discharges were within allowable limits for all tested parameters (Exhibit
4‐1), with the exception of the following. All permit exceedances were reported to NJDEP
within the allowable time frame.
February 5, 2013, Total Suspended Solid (TSS) 50 mg/L limit was exceeded at DSN001
NJDEP Case Number 13‐03‐18‐0940‐57 Op 44. Two samples were analyzed for TSS by
PPPL’s subcontractor laboratory with one sample result below the limit at 2.0 mg/L
while the exceedance was 240 mg/L. While the analytical laboratory advised PPPL that
there was no demonstrable error in the laboratory analyses, the collection at the same
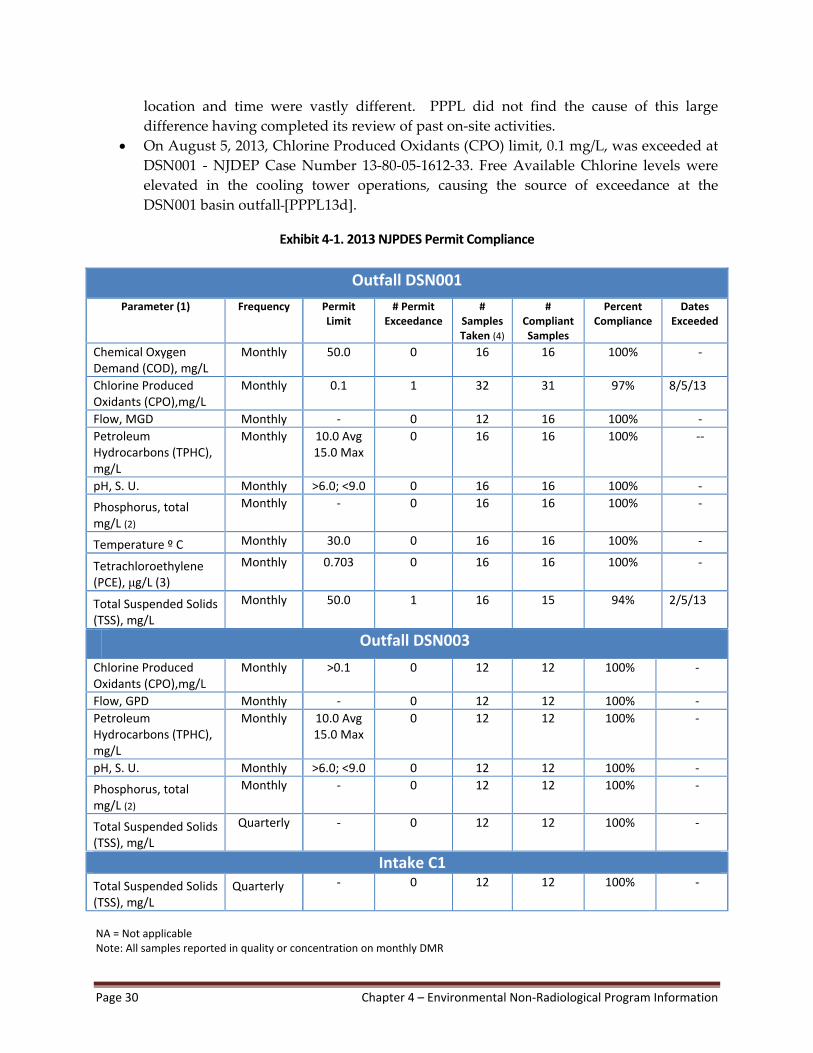
Page 30 Chapter 4 – Environmental Non‐Radiological Program Information
location and time were vastly different. PPPL did not find the cause of this large
difference having completed its review of past on‐site activities. On August 5, 2013, Chlorine Produced Oxidants (CPO) limit, 0.1 mg/L, was exceeded at
DSN001 ‐ NJDEP Case Number 13‐80‐05‐1612‐33. Free Available Chlorine levels were
elevated in the cooling tower operations, causing the source of exceedance at the
DSN001 basin outfall [PPPL13d].
Exhibit 4‐1. 2013 NJPDES Permit Compliance
NA = Not applicable Note: All samples reported in quality or concentration on monthly DMR
Outfall DSN001
Parameter (1) Frequency Permit Limit
# Permit Exceedance
# Samples Taken (4)
# Compliant Samples
Percent Compliance
Dates Exceeded
Chemical Oxygen Demand (COD), mg/L
Monthly 50.0 0 16 16 100% ‐
Chlorine Produced Oxidants (CPO),mg/L
Monthly 0.1 1 32 31 97% 8/5/13
Flow, MGD Monthly ‐ 0 12 16 100% ‐
Petroleum Hydrocarbons (TPHC), mg/L
Monthly 10.0 Avg15.0 Max
0 16 16 100% ‐‐
pH, S. U. Monthly >6.0; <9.0 0 16 16 100% ‐
Phosphorus, total mg/L (2)
Monthly ‐ 0 16 16 100% ‐
Temperature º C Monthly 30.0 0 16 16 100% ‐
Tetrachloroethylene (PCE), μg/L (3)
Monthly 0.703 0 16 16 100% ‐
Total Suspended Solids (TSS), mg/L
Monthly 50.0 1 16 15 94% 2/5/13
Outfall DSN003
Chlorine Produced Oxidants (CPO),mg/L
Monthly >0.1 0 12 12 100% ‐
Flow, GPD Monthly ‐ 0 12 12 100% ‐
Petroleum Hydrocarbons (TPHC), mg/L
Monthly 10.0 Avg15.0 Max
0 12 12 100% ‐
pH, S. U. Monthly >6.0; <9.0 0 12 12 100% ‐
Phosphorus, total mg/L (2)
Monthly ‐ 0 12 12 100% ‐
Total Suspended Solids (TSS), mg/L
Quarterly ‐ 0 12 12 100% ‐
Intake C1
Total Suspended Solids (TSS), mg/L
Quarterly ‐ 0 12 12 100% ‐
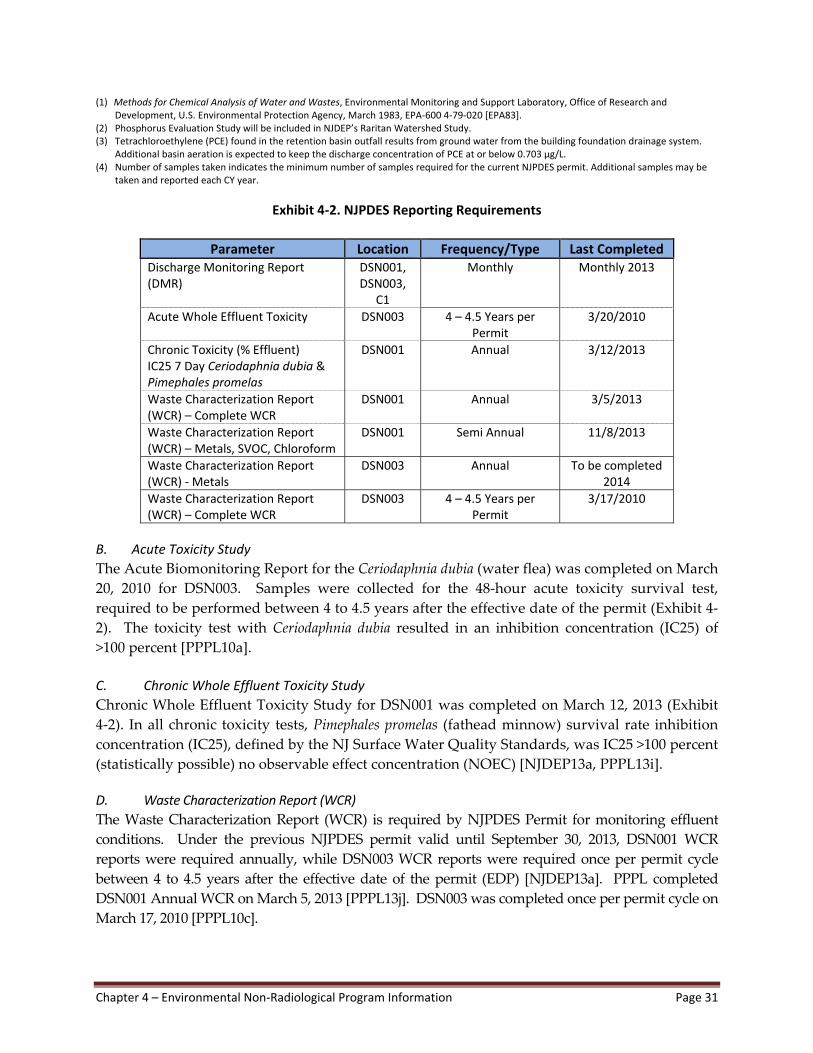
Chapter 4 – Environmental Non‐Radiological Program Information Page 31
(1) Methods for Chemical Analysis of Water and Wastes, Environmental Monitoring and Support Laboratory, Office of Research and Development, U.S. Environmental Protection Agency, March 1983, EPA‐600 4‐79‐020 [EPA83].
(2) Phosphorus Evaluation Study will be included in NJDEP’s Raritan Watershed Study. (3) Tetrachloroethylene (PCE) found in the retention basin outfall results from ground water from the building foundation drainage system.
Additional basin aeration is expected to keep the discharge concentration of PCE at or below 0.703 μg/L. (4) Number of samples taken indicates the minimum number of samples required for the current NJPDES permit. Additional samples may be
taken and reported each CY year.
Exhibit 4‐2. NJPDES Reporting Requirements
B. Acute Toxicity Study
The Acute Biomonitoring Report for the Ceriodaphnia dubia (water flea) was completed on March
20, 2010 for DSN003. Samples were collected for the 48‐hour acute toxicity survival test,
required to be performed between 4 to 4.5 years after the effective date of the permit (Exhibit 4‐
2). The toxicity test with Ceriodaphnia dubia resulted in an inhibition concentration (IC25) of >100 percent [PPPL10a].
C. Chronic Whole Effluent Toxicity Study
Chronic Whole Effluent Toxicity Study for DSN001 was completed on March 12, 2013 (Exhibit
4‐2). In all chronic toxicity tests, Pimephales promelas (fathead minnow) survival rate inhibition
concentration (IC25), defined by the NJ Surface Water Quality Standards, was IC25 >100 percent
(statistically possible) no observable effect concentration (NOEC) [NJDEP13a, PPPL13i]. D. Waste Characterization Report (WCR)
The Waste Characterization Report (WCR) is required by NJPDES Permit for monitoring effluent
conditions. Under the previous NJPDES permit valid until September 30, 2013, DSN001 WCR
reports were required annually, while DSN003 WCR reports were required once per permit cycle
between 4 to 4.5 years after the effective date of the permit (EDP) [NJDEP13a]. PPPL completed
DSN001 Annual WCR on March 5, 2013 [PPPL13j]. DSN003 was completed once per permit cycle on
March 17, 2010 [PPPL10c].
Parameter Location Frequency/Type Last Completed Discharge Monitoring Report (DMR)
DSN001,DSN003,
C1
Monthly Monthly 2013
Acute Whole Effluent Toxicity DSN003 4 – 4.5 Years per Permit
3/20/2010
Chronic Toxicity (% Effluent) IC25 7 Day Ceriodaphnia dubia & Pimephales promelas
DSN001 Annual 3/12/2013
Waste Characterization Report (WCR) – Complete WCR
DSN001 Annual 3/5/2013
Waste Characterization Report (WCR) – Metals, SVOC, Chloroform
DSN001 Semi Annual 11/8/2013
Waste Characterization Report (WCR) ‐ Metals
DSN003 Annual To be completed 2014
Waste Characterization Report (WCR) – Complete WCR
DSN003 4 – 4.5 Years per Permit
3/17/2010
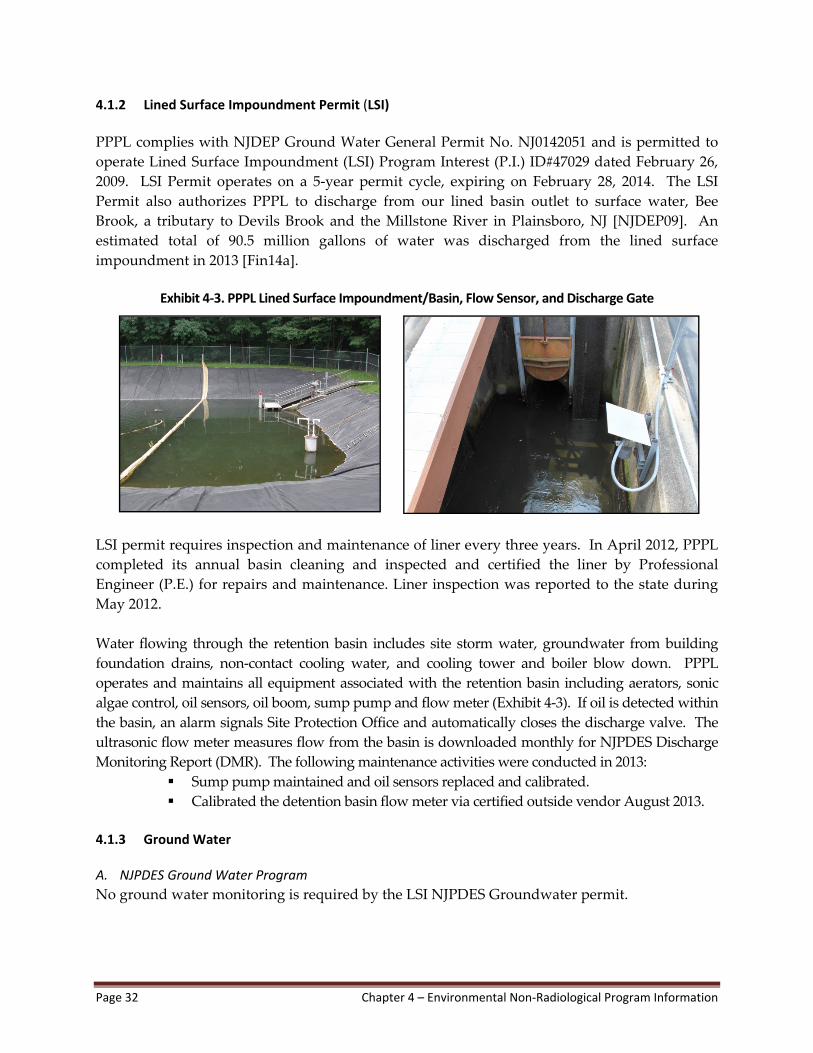
Page 32 Chapter 4 – Environmental Non‐Radiological Program Information
4.1.2 Lined Surface Impoundment Permit (LSI)
PPPL complies with NJDEP Ground Water General Permit No. NJ0142051 and is permitted to
operate Lined Surface Impoundment (LSI) Program Interest (P.I.) ID#47029 dated February 26,
2009. LSI Permit operates on a 5‐year permit cycle, expiring on February 28, 2014. The LSI
Permit also authorizes PPPL to discharge from our lined basin outlet to surface water, Bee
Brook, a tributary to Devils Brook and the Millstone River in Plainsboro, NJ [NJDEP09]. An estimated total of 90.5 million gallons of water was discharged from the lined surface
impoundment in 2013 [Fin14a].
Exhibit 4‐3. PPPL Lined Surface Impoundment/Basin, Flow Sensor, and Discharge Gate
LSI permit requires inspection and maintenance of liner every three years. In April 2012, PPPL
completed its annual basin cleaning and inspected and certified the liner by Professional
Engineer (P.E.) for repairs and maintenance. Liner inspection was reported to the state during
May 2012.
Water flowing through the retention basin includes site storm water, groundwater from building
foundation drains, non‐contact cooling water, and cooling tower and boiler blow down. PPPL
operates and maintains all equipment associated with the retention basin including aerators, sonic
algae control, oil sensors, oil boom, sump pump and flow meter (Exhibit 4‐3). If oil is detected within
the basin, an alarm signals Site Protection Office and automatically closes the discharge valve. The
ultrasonic flow meter measures flow from the basin is downloaded monthly for NJPDES Discharge
Monitoring Report (DMR). The following maintenance activities were conducted in 2013:
Sump pump maintained and oil sensors replaced and calibrated.
Calibrated the detention basin flow meter via certified outside vendor August 2013.
4.1.3 Ground Water A. NJPDES Ground Water Program No ground water monitoring is required by the LSI NJPDES Groundwater permit.
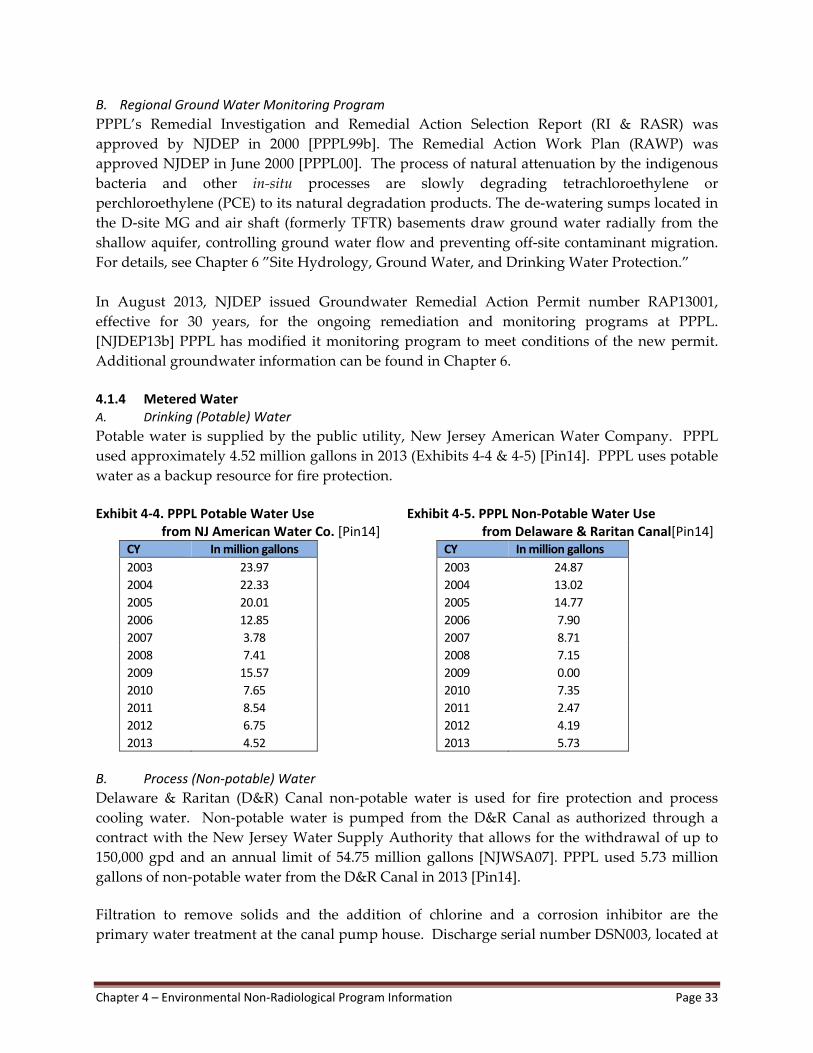
Chapter 4 – Environmental Non‐Radiological Program Information Page 33
B. Regional Ground Water Monitoring Program
PPPL’s Remedial Investigation and Remedial Action Selection Report (RI & RASR) was
approved by NJDEP in 2000 [PPPL99b]. The Remedial Action Work Plan (RAWP) was
approved NJDEP in June 2000 [PPPL00]. The process of natural attenuation by the indigenous
bacteria and other in‐situ processes are slowly degrading tetrachloroethylene or
perchloroethylene (PCE) to its natural degradation products. The de‐watering sumps located in
the D‐site MG and air shaft (formerly TFTR) basements draw ground water radially from the
shallow aquifer, controlling ground water flow and preventing off‐site contaminant migration.
For details, see Chapter 6 ”Site Hydrology, Ground Water, and Drinking Water Protection.”
In August 2013, NJDEP issued Groundwater Remedial Action Permit number RAP13001,
effective for 30 years, for the ongoing remediation and monitoring programs at PPPL.
[NJDEP13b] PPPL has modified it monitoring program to meet conditions of the new permit.
Additional groundwater information can be found in Chapter 6.
4.1.4 Metered Water A. Drinking (Potable) Water
Potable water is supplied by the public utility, New Jersey American Water Company. PPPL
used approximately 4.52 million gallons in 2013 (Exhibits 4‐4 & 4‐5) [Pin14]. PPPL uses potable
water as a backup resource for fire protection.
Exhibit 4‐4. PPPL Potable Water Use Exhibit 4‐5. PPPL Non‐Potable Water Use from NJ American Water Co. [Pin14] from Delaware & Raritan Canal[Pin14]
CY In million gallons CY In million gallons
2003 23.97 2003 24.87
2004
2005
2006
22.33
20.01
12.85
2004
2005
2006
13.02
14.77
7.90
2007 3.78 2007 8.71
2008
2009
2010
2011
2012
2013
7.41
15.57
7.65
8.54
6.75
4.52
2008
2009
2010
2011
2012
2013
7.15
0.00
7.35
2.47
4.19
5.73
B. Process (Non‐potable) Water
Delaware & Raritan (D&R) Canal non‐potable water is used for fire protection and process
cooling water. Non‐potable water is pumped from the D&R Canal as authorized through a
contract with the New Jersey Water Supply Authority that allows for the withdrawal of up to
150,000 gpd and an annual limit of 54.75 million gallons [NJWSA07]. PPPL used 5.73 million
gallons of non‐potable water from the D&R Canal in 2013 [Pin14].
Filtration to remove solids and the addition of chlorine and a corrosion inhibitor are the
primary water treatment at the canal pump house. Discharge serial number DSN003, located at
Page 34 Chapter 4 – Environmental Non‐Radiological Program Information
the canal pump house filter‐backwash, is a separate discharge point in the NJPDES surface‐
water permit and is monitored monthly (Appendix Table 18). A sampling point (C1) was
established to provide baseline data for surface water that is pumped from the D&R Canal for
non‐potable uses. Appendix Table 12 summarizes the results of water quality analysis at the
water intake C1, at the D&R Canal.
C. Surface Water
Surface water is monitored for potential non‐radioactive pollutants both on‐site and at surface‐water
discharge pathways upstream and downstream off‐site. Other sampling locations—Bee Brook (B1 &
B2), New Jersey American Water Company (potable water supplier‐E1), Delaware & Raritan Canal
(C1), Millstone River (M1), and Cranbury and Devil’s Brooks in Plainsboro (P1 & P2) sampling
points (Appendix Tables 10 ‐16)—are not required by regulation, but are a part of PPPL’s
environmental surveillance program.
D. Sanitary Sewage
Sanitary sewage is discharged to the Publicly‐Owned Treatment Works (POTW) operated by
South Brunswick Township, which is part of the Stony Brook Regional Sewerage Authority
(SBRSA). SBRSA requires quarterly reporting of total volume discharged from the Liquid
Effluent Collection (LEC) tanks on D‐Site. PPPL continued to collect radioactive Tritium
samples and non‐radioactive data (pH and temperature) during 2013 (Appendix Table 8).
Detailed radiological and discharge quantities for LEC tanks can be found in Chapter 5
“Environmental Radiological Program Information”.
For 2013, PPPL estimated a total annual sanitary sewage discharge of 4.77 million gallons to the
South Brunswick sewerage treatment plant [Pin14].
4.2 Non‐Radiological Waste Programs 4.2.1 Hazardous Waste Programs
A. Toxic Substance Control Act (TSCA)
In 2013, PPPL shipped 315 pounds of PCB waste and 40 cubic yards of asbestos waste. The PCB
contents were recycled or incinerated as TSCA Hazardous Waste. Asbestos was landfilled at a
permitted facility [Pue14].
B. Hazardous Waste
PPPL submitted a Biennial Hazardous Waste Generator Report to NJDEP for waste generated
in CY2013. A description of Resource Conservation and Recovery Act (RCRA) compliance is
found in Exhibit 2‐1 of this report [Pue14]. PPPL continues to evaluate opportunities to remove
hazardous materials from the workplace that have the potential to become hazardous wastes by
substituting them with non‐hazardous materials that has the added benefit of reducing
employee exposure.
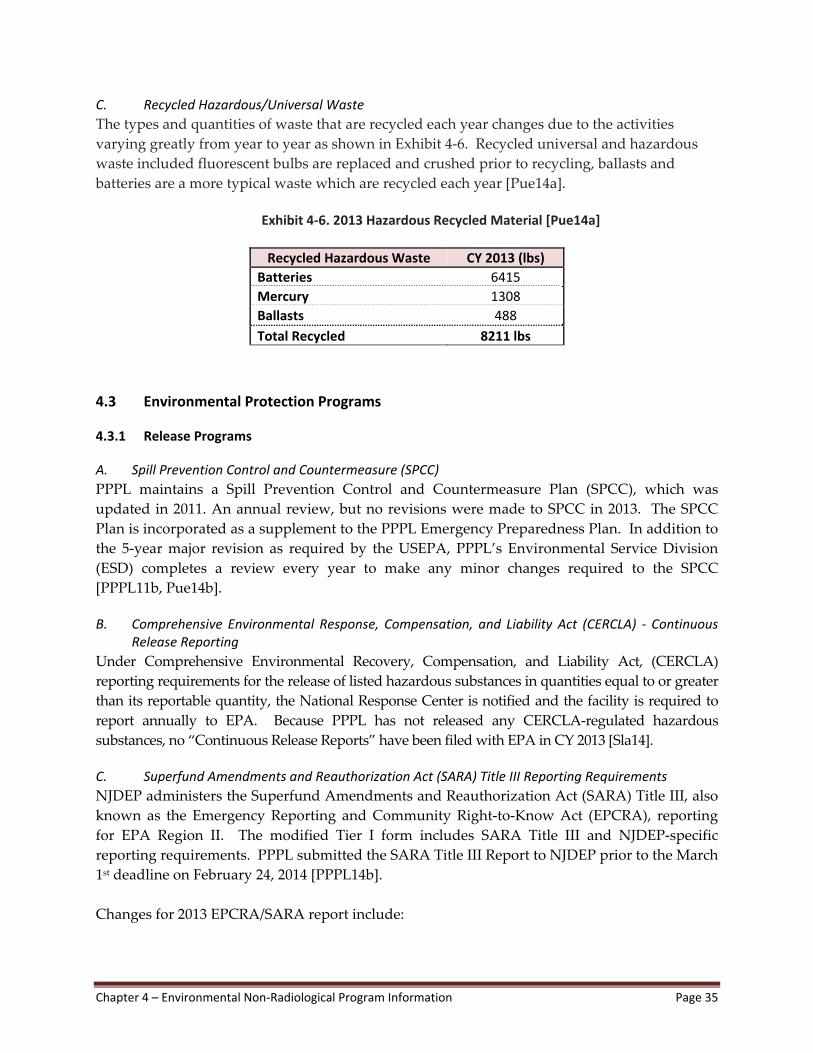
Chapter 4 – Environmental Non‐Radiological Program Information Page 35
C. Recycled Hazardous/Universal Waste
The types and quantities of waste that are recycled each year changes due to the activities
varying greatly from year to year as shown in Exhibit 4‐6. Recycled universal and hazardous
waste included fluorescent bulbs are replaced and crushed prior to recycling, ballasts and
batteries are a more typical waste which are recycled each year [Pue14a].
Exhibit 4‐6. 2013 Hazardous Recycled Material [Pue14a]
4.3 Environmental Protection Programs
4.3.1 Release Programs
A. Spill Prevention Control and Countermeasure (SPCC)
PPPL maintains a Spill Prevention Control and Countermeasure Plan (SPCC), which was
updated in 2011. An annual review, but no revisions were made to SPCC in 2013. The SPCC
Plan is incorporated as a supplement to the PPPL Emergency Preparedness Plan. In addition to
the 5‐year major revision as required by the USEPA, PPPL’s Environmental Service Division
(ESD) completes a review every year to make any minor changes required to the SPCC
[PPPL11b, Pue14b].
B. Comprehensive Environmental Response, Compensation, and Liability Act (CERCLA) ‐ Continuous Release Reporting
Under Comprehensive Environmental Recovery, Compensation, and Liability Act, (CERCLA)
reporting requirements for the release of listed hazardous substances in quantities equal to or greater
than its reportable quantity, the National Response Center is notified and the facility is required to
report annually to EPA. Because PPPL has not released any CERCLA‐regulated hazardous
substances, no “Continuous Release Reports” have been filed with EPA in CY 2013 [Sla14].
C. Superfund Amendments and Reauthorization Act (SARA) Title III Reporting Requirements
NJDEP administers the Superfund Amendments and Reauthorization Act (SARA) Title III, also
known as the Emergency Reporting and Community Right‐to‐Know Act (EPCRA), reporting
for EPA Region II. The modified Tier I form includes SARA Title III and NJDEP‐specific
reporting requirements. PPPL submitted the SARA Title III Report to NJDEP prior to the March
1st deadline on February 24, 2014 [PPPL14b].
Changes for 2013 EPCRA/SARA report include:
Recycled Hazardous Waste CY 2013 (lbs)
Batteries 6415
Mercury 1308
Ballasts 488
Total Recycled 8211 lbs

Page 36 Chapter 4 – Environmental Non‐Radiological Program Information
1. The cover page has additional information as required by the EPA for the EPCRA
Section 302.
2. The printout no longer shows the codes, rather it writes out the inventory information. SARA Title III reports included information about twelve compounds used at PPPL as listed in
Exhibits 4‐7and 4‐8.
Exhibit 4‐7. 2013 Summary of PPPL EPCRA Reporting Requirements
SARA YES NO NOT REQUIRED
EPCRA 302‐303: Planning Notification
EPCRA 304: EHS Release Notification
EPCRA 311‐312: MSDS/Chemical Inventory
EPCRA 313: TRI Report [ ] EHS – Extremely hazardous substances (No EHS are on‐site at PPPL) MSDS – Material Safety Data Sheets TRI – Toxic Release Inventory
Exhibit 4‐8. 2013 Hazard Class of Chemicals at PPPL
Compound Category Compound Category
Bromochlorodifluoro‐methane (Halon 1211)
Sudden release of pressure & Acute health effects
Lead Chronic health effects
Carbon dioxide Sudden release of pressure & Reactive
Nitrogen Sudden release of pressure
Diesel Fuel Oil Fire Propane Sudden release of pressure
Gasoline Fire & Chronic Health Hazard
Petroleum Oil Fire
Helium Sudden release of pressure Sulfur Hexafluoride
Sudden release of pressure
Sulfuric acid Acute Health Hazard & Reactive
Though PPPL does not exceed threshold amounts for chemicals listed on the Toxic Release
Inventory (TRI), PPPL completed the TRI cover page and laboratory exemptions report for 1996,
and submitted these documents to DOE. Since PPPL did not exceed the threshold amounts, no
TRI submittal was completed for 2013.
4.3.2 Environmental Releases
PPPL reported no oil or chemical spills in CY 2013[Pue14b]. Due to New Jersey’s no de minimus thresholds, all oil released to unpaved surfaces must be reported. If spills occur, PPPL removes
dirt and tests the soil to ensure adequate cleanup of petroluem hydrocarbons and any other
chemicals.
Chapter 4 – Environmental Non‐Radiological Program Information Page 37
4.3.3 Pollution Prevention Program In 2013, PPPL continued to pursue waste minimization and pollution prevention opportunities
through active recycling efforts and through the purchasing of recycled‐content and other
environmentally‐preferable products (EPP).
In FY 2013, PPPL’s office recycling rate was 76.1%; this rate reflects over 83 tons of municipal
solid waste (MSW) that were diverted from landfills. The DOE EO 13514 goal of 50% recycle
versus disposal rate was met and accomplished by active participation of Laboratory employees.
PPPL’s FY 2013 rate for recycling of construction materials including wood, concrete, and stone
was 73.5% by weight [Kin14a].
In September 2010, PPPL initiated the collection and recycling of food waste from the cafeteria
kitchen and the trash bins located in the cafeteria and select locations around the laboratory. In
FY2013, PPPL composted 15.3 tons of food waste. Changes in from non‐compostable products
(cups, plates and corn starch food containers) to compostable ones, new color‐coded signs and
bins increased composting across the laboratory [Kin14a].
4.4 Non‐Radiological Emissions Monitoring Programs Air Permits
PPPL maintains New Jersey Department of Environmental Protection (NJDEP) air
permits/certificates for the equipment as listed in Exhibit 4‐9. PPPL is classified as a synthetic‐ minor
facility and does not exceed the Potential to Emit (PTE) limits for any of the Criteria Air Pollutants.
PPPL tracks NJDEP Air Quality Conditions Alerts. Unhealthy conditions are noted and all
generator repairs and maintenance are postponed until normal air quality is reinstated. During
those times, the standby (emergency) generators may be used only in an emergency (power
outage) or when a voltage reduction issued by Pennsylvania, Jersey, Maryland Interconnect
(PJM – electric‐power grid controllers) and posted on the PJM internet website under the
“emergency procedures” menu.
In 2008, NJDEP reduced the regulatory limits for the Criteria air pollutants for operating the
boilers; PPPL’s operated these four boilers were well below those limits in 2013 (Exhibit 4‐10 &
Appendix Table 9). With the installation of digital controls and high‐efficiency, lower nitrogen
oxide (NOx) burners, the NOx , volatile organic compounds (VOCs), particulates, sulfur dioxide
(SO2), and carbon monoxide (CO) emissions are being further reduced [Nem14].
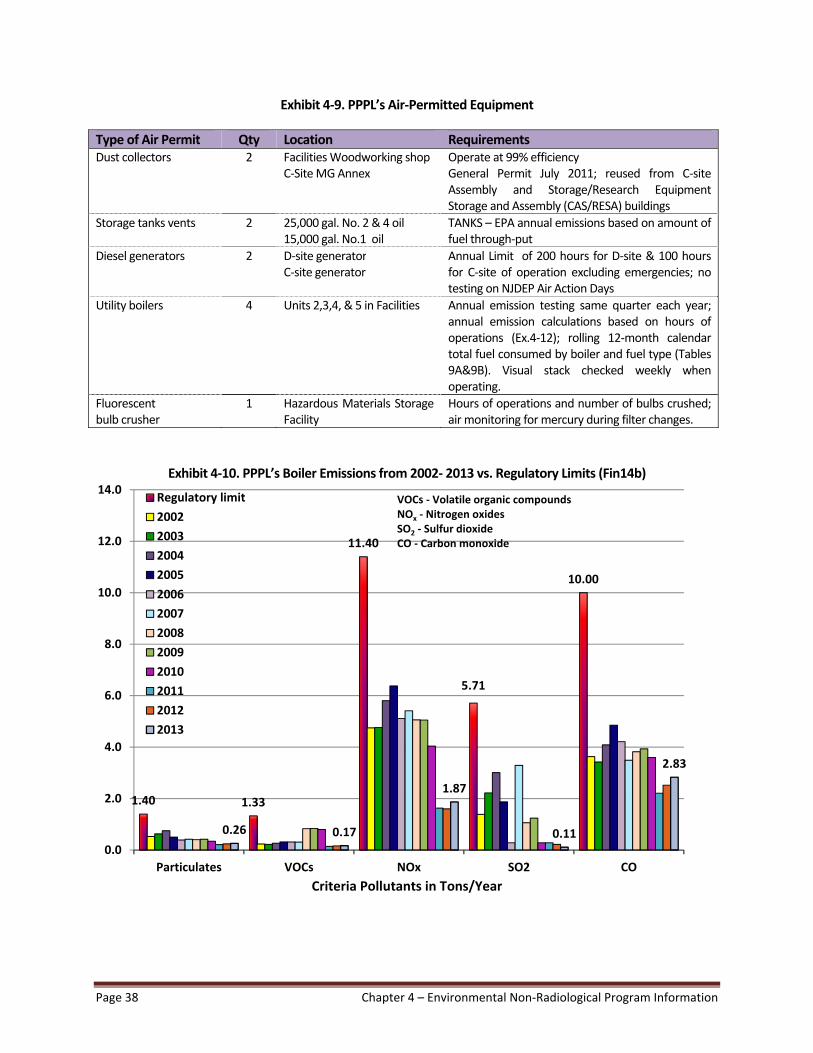
Page 38 Chapter 4 – Environmental Non‐Radiological Program Information
Exhibit 4‐9. PPPL’s Air‐Permitted Equipment
Type of Air Permit Qty Location Requirements Dust collectors 2 Facilities Woodworking shop
C‐Site MG Annex Operate at 99% efficiency General Permit July 2011; reused from C‐site Assembly and Storage/Research Equipment Storage and Assembly (CAS/RESA) buildings
Storage tanks vents 2 25,000 gal. No. 2 & 4 oil15,000 gal. No.1 oil
TANKS – EPA annual emissions based on amount of fuel through‐put
Diesel generators 2 D‐site generatorC‐site generator
Annual Limit of 200 hours for D‐site & 100 hours for C‐site of operation excluding emergencies; no testing on NJDEP Air Action Days
Utility boilers 4 Units 2,3,4, & 5 in Facilities Annual emission testing same quarter each year; annual emission calculations based on hours of operations (Ex.4‐12); rolling 12‐month calendar total fuel consumed by boiler and fuel type (Tables 9A&9B). Visual stack checked weekly when operating.
Fluorescent bulb crusher
1 Hazardous Materials Storage Facility
Hours of operations and number of bulbs crushed; air monitoring for mercury during filter changes.
Exhibit 4‐10. PPPL’s Boiler Emissions from 2002‐ 2013 vs. Regulatory Limits (Fin14b)
Criteria Pollutants in Tons/Year
1.40 1.33
11.40
5.71
10.00
0.26 0.17
1.87
0.11
2.83
0.0
2.0
4.0
6.0
8.0
10.0
12.0
14.0
Particulates VOCs NOx SO2 CO
Regulatory limit
2002
2003
2004
2005
2006
2007
2008
2009
2010
2011
2012
2013
VOCs ‐ Volatile organic compoundsNOx ‐ Nitrogen oxidesSO2 ‐ Sulfur dioxideCO ‐ Carbon monoxide
Chapter 4 – Environmental Non‐Radiological Program Information Page 39
4.5 Land Resources and Conservation 4.5.1 Wetlands Letter of Interpretation (LOI)
PPPL operates under NJDEP Land Use Wetlands (LOI). Under permit No. 1218‐06‐
0002.2FWW070001 NJDEP has line verified LOI PPPL’s freshwater boundaries in 2008. PPPL’s
permit expired in 2013. NJDEP’s Permit Extension Act of 2001 as Amended though 2012 extends
all NJDEP LOI’s until December 31, 2014. No construction or alterations to existing vegetation
can commence without state notification. Freshwater line verifications must be present on all
future site development drawings [PPPL08c].
4.5.2. Soil Erosion and Landscaping
In 2009, PPPL applied for Soil Erosion Permit through Freehold Soil Conservation District.
Permit No. 2009‐0343 for PPPL’s D‐Site Parking Lot rain garden conversion was issued on
August 28, 2009, expired on February 28, 2013. In CY 2013 PPPL no new additional soil erosion
permits were obtained. Draft internal soil erosion and sediment control guidelines were for
inclusion in PPPL’s Engineering Standards. PPPL continued to reduce the grassed acreage that
required mowing and other maintenance by planting native meadow grasses that are allowed
to grow tall through PPPL’s Storm water Pollution Prevention Plan [PPPL12a].
4.5.3 Herbicides and Fertilizers
During 2013, PPPL’s Facilities Division used herbicides, insecticide and fertilizer on campus
grounds (Exhibit 4‐11). These materials are applied in accordance with state and federal FIFRA
regulations. Chemicals are applied by certified applicators. No herbicides or fertilizers are
stored on site; therefore, no disposal of these types of regulated chemicals is required by PPPL
[Kin14b].
Exhibit 4‐11. 2013 Fertilizer and Herbicide Use
Type of Material
Name of Material Registered EPA No.
2013 Applied
Herbicide Trimaec Bentgrass Broadleaf
2217‐529 261 Oz.
Herbicide Produece 228‐509 448 Oz.
Insecticide None ‐ ‐
Fertilizer None ‐ ‐
Page 40 Chapter 4 – Environmental Non‐Radiological Program Information
4.5.4 Stormwater Pollution Prevention
PPPL’s Stormwater Pollution Prevention Plan (SWPPP) was revised in 2012 to provide guidance
to reduce the impact of PPPL’s operations on stormwater quality [PPPL12a]. As summarized
in Exhibit 8 of SWPPP, PPPL reduces stormwater quantity by utilizing best management
practices, such as limiting the mowing areas with rain gardens and native grass meadows
plantings.
4.6 Safety
PPPL’s 2013 performance with respect to worker safety is noted in Exhibit 4‐12 [Lev14a].
Exhibit 4‐12. 2013 PPPL’s Safety Performance
Total OSHA recordable case rate1
Days away, restricted transferred (DART) case rate1
2013 0.88 0.44
Number of radioactive contaminations
(external)
Number of Safety report OSHA (ORPS) Occurrence confined space, chemical exposure and (LOTO) incidents
2013 0 0
OSHA – Occupational Safety and Health Administration 1 Per 200,000 hours worked
Chapter 5 – Environmental Radiological Program Information Page 41
Chapter
5
ENVIRONMENTAL RADIOLOGICAL PROGRAM INFORMATION
5.1 Radiological Emissions and Doses For 2013, the releases of tritium in air and water and the total effective dose equivalent (EDE)
contribution at the site boundary and for the population within 80 kilometers of PPPL are
summarized in Exhibit 5‐1 below. The calculated EDEs at the site boundary are less than 0.009 milli
radition equivalent man (mrem) per year, far below the annual limit of 10 mrem per year [Lev14a &
14b]. Exhibit 5‐1. Summary of 2013 Emissions and Doses from D‐Site Operations
Radionuclide &
Pathway
Source
Source Term Curies (Ci)
(Bequerel, Bq)
EDE in mrem/yr (mSv/yr) at
Site Boundary
Percent of Total
Collective EDE w/in 80 km in
person‐rem ( person‐Sv)
Tritium (air) D‐site stack
HTO – 2.21 (8.18 x 10¹⁰)
HT ‐ 27.51 (1.02 x 10¹²)
6.5 x 10‐3
(6.5 x 10‐5)
69.6 0.60
(6.0 x 10‐3)
Tritium (water) LEC tank HTO ‐ 0.0099
(3.66 x 10⁸)
1.99 x 10‐4
(1.99 x 10‐6)
2.1 2.73 x 10‐4
(2.73 x 10‐6)
Tritium
(water)
Surface Ground
1331 pCi/L (DR Canal)
140 pCi/L( TW‐5)
2.61 x 10‐3
(2.61 x 10‐5)
28.3
2.64 x 10‐3
(2.64 x 10‐5)
Direct/Scattered neutron & Gamma Radiation
NSTX
0 DD neutrons
N/A
0
N/A
Argon‐41 (Air) NSTX N/A N/A 0 N/A
Total 9.28 x 10‐3
(9.28 x 10‐5) 100 0.603
(6.03 x 10‐3) [Lev14a & Rul14a]
Bq = Bequerel Ci = Curie DD=deuterium‐deuterium EDE = effective dose equivalent HT = elemental tritium HTO = tritium oxide LEC =liquid effluent collection mrem/yr = milli radiation equivalent man/year mSv/yr = milli Sievert/year NSTX = National Spherical Torus Experiment pCi/L=picoCuries/liter Sv=Sievert
Estimated dose equivalent (EDE)at the nearest business 1.81 x 10‐3 mrem (1.81 x 10‐5 mSv) due to tritium air emissions from the
D‐site stack.
Airborne doses assume maximum exposed individual is in continuous residence at the site boundary; waterborne doses assume that maximum exposed individual uses the ultimate destination of liquid discharges (Millstone River) as sole source of drinking water.[Rul14]
Annual limit is 10 mrem/year; background is about 360 mrem/year. Half life of tritium (HTO & HT) is 12.3 years.
Page 42 Chapter 5 – Environmental Radiological Program Information
Laboratory policy states that when occupational exposures have the potential to exceed 1,000
mrem (1 rem) per year (10 mSv/y), the PPPL Environment, Safety, and Health (ES&H) Executive
Board must approve an exemption. This value (1,000 mrem per year limit) is 20 percent of the
DOE legal limit for occupational exposure. In addition, the Laboratory applies the “ALARA”
(As Low As Reasonably Achievable) policy to its operations. This philosophy for control of
occupational exposure means that environmental radiation levels for device operation are also
very low. From all operational sources of radiation, the ALARA goal for maximum individual
occupational exposure was less than 100 mrem per year (1.0 mSv/year) above natural
background at PPPL. The average annual dose to a member of the general population is
considered to be about 360 mrem/year:
Cosmic radiation – 28 mrem/yr
Terrestrial sources /earth’s crust – 28 mrem/yr
Food – 40 mrem/yr
Radon – ~200 mrem/yr
Medical sources: x‐rays – 40 mrem/yr
Other medical sources –14 mrem/yr 5.1.1 Penetrating Radiation Due to the upgrade project, the NSTX reactor did not conduct experiments during 2013, and therefore, did not generate neutrons. The upgrade project includes installation of a new center stack and additional diagnostic instruments among other upgrades. 5.1.2 Sanitary Sewage
Drainage from D‐site sumps in radiological areas is collected in the one of the three liquid
effluent collection (LEC) tanks; each tank has a capacity of 15,000 gallons. Prior to release of
these tanks to the sanitary sewer system, i.e., Stony Brook Regional Sewerage Authority
(SBRSA), a sample is collected and analyzed for tritium concentration and gross beta. All
samples for 2013 showed effluent quantity and concentrations of radionuclides (tritium) to be
within allowable limits established in New Jersey regulations (1 Ci/y for all radionuclides), the
National Safe Drinking Water regulations (40 CFR 141.16 limit of 20,000 pCi/L) and DOE Order
5400.5 (2 x 10⁶ pCi/liter for tritium) (Exhibit 5‐2).
As shown in Exhibits 5‐2 and 5‐3, the 2013 total amount of tritium released to the sanitary sewer
was 0.0099 Curies, 0.990 curies less than the allowable 1.0‐Curie per year limit. In Appendix
Table 8, the gross beta activity is reported; the gross beta activity ranges from <1680 pCi/L. The
continued drop off in activity can presumably be attributed to the upgrade of NSTX that is
currently in progress.
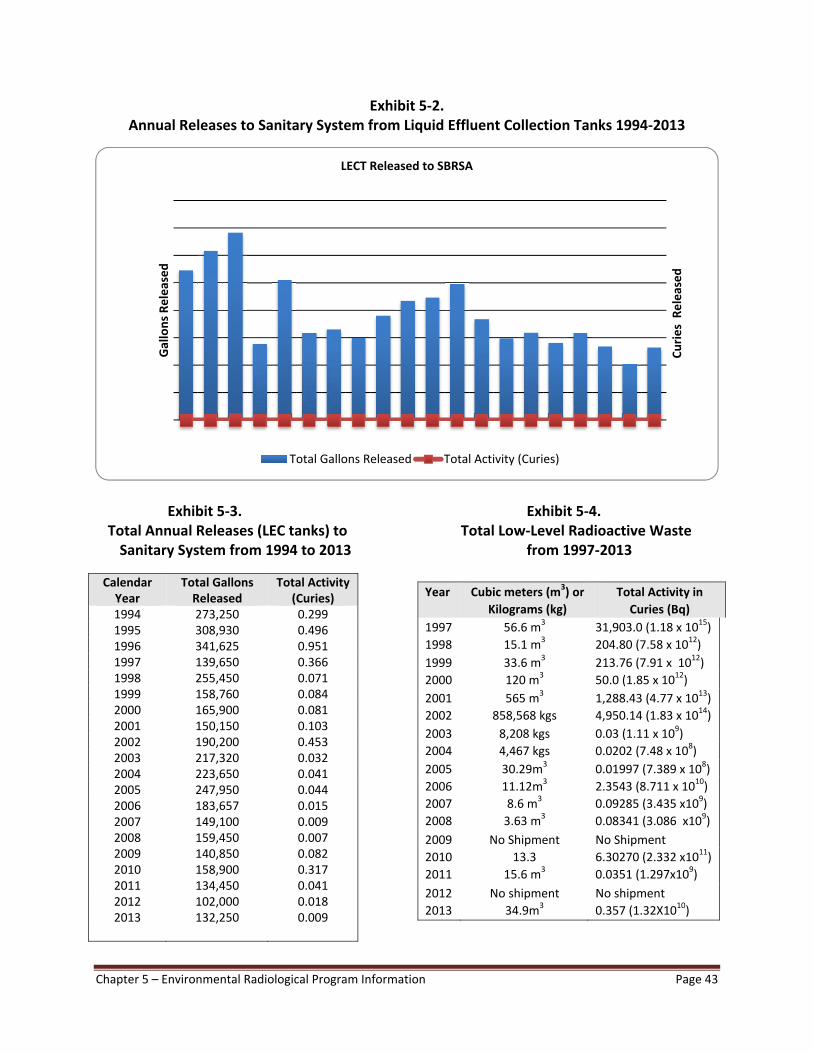
Chapter 5 – Environmental Radiological Program Information Page 43
Exhibit 5‐2. Annual Releases to Sanitary System from Liquid Effluent Collection Tanks 1994‐2013
Exhibit 5‐3. Exhibit 5‐4. Total Annual Releases (LEC tanks) to Total Low‐Level Radioactive Waste Sanitary System from 1994 to 2013 from 1997‐2013 Calendar Year
Total Gallons Released
Total Activity (Curies)
1994 273,250 0.2991995 308,930 0.4961996 341,625 0.9511997 139,650 0.3661998 255,450 0.0711999 158,760 0.0842000 165,900 0.0812001 150,150 0.1032002 190,200 0.4532003 217,320 0.0322004 223,650 0.0412005 247,950 0.0442006 2007 2008
183,657 149,100 159,450
0.015 0.009 0.007
2009 140,850 0.0822010 2011
158,900 134,450
0.317 0.041
2012 2013
102,000 132,250
0.018 0.009
Curies Released
Gallons Released
LECT Released to SBRSA
Total Gallons Released Total Activity (Curies)
Year Cubic meters (m3) or
Kilograms (kg)
Total Activity in
Curies (Bq)
1997 56.6 m3 31,903.0 (1.18 x 10¹⁵)
1998 15.1 m3 204.80 (7.58 x 10¹²)
1999 33.6 m3 213.76 (7.91 x 10¹²)
2000 120 m3 50.0 (1.85 x 10¹²)
2001 565 m3 1,288.43 (4.77 x 10¹³)
2002 858,568 kgs 4,950.14 (1.83 x 10¹⁴)
2003 8,208 kgs 0.03 (1.11 x 10⁹)
2004 4,467 kgs 0.0202 (7.48 x 10⁸)
2005 30.29m3 0.01997 (7.389 x 10⁸)
2006
2007
2008
11.12m3
8.6 m3
3.63 m3
2.3543 (8.711 x 10¹⁰)
0.09285 (3.435 x10⁹)
0.08341 (3.086 x10⁹)
2009 No Shipment No Shipment
2010
2011
13.3
15.6 m3
6.30270 (2.332 x10¹¹)
0.0351 (1.297x10⁹)
2012
2013
No shipment
34.9m3
No shipment
0.357 (1.32X10¹⁰)
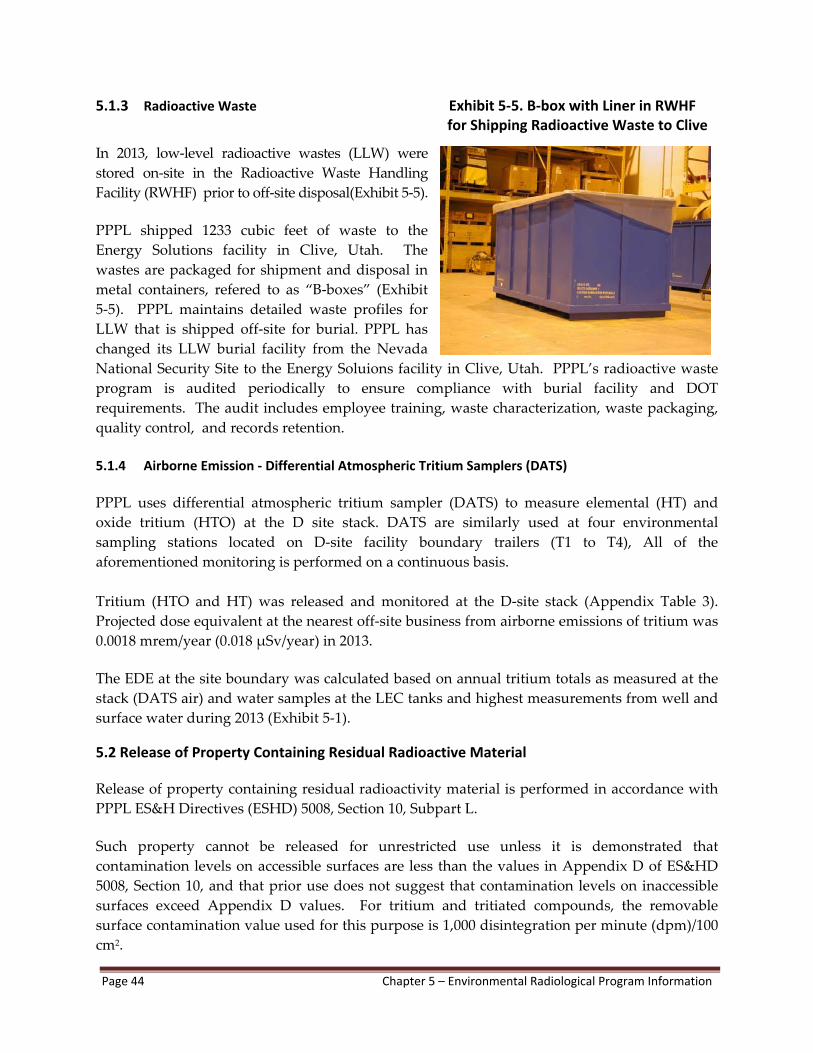
Page 44 Chapter 5 – Environmental Radiological Program Information
5.1.3 Radioactive Waste Exhibit 5‐5. B‐box with Liner in RWHF for Shipping Radioactive Waste to Clive
In 2013, low‐level radioactive wastes (LLW) were
stored on‐site in the Radioactive Waste Handling
Facility (RWHF) prior to off‐site disposal(Exhibit 5‐5).
PPPL shipped 1233 cubic feet of waste to the
Energy Solutions facility in Clive, Utah. The
wastes are packaged for shipment and disposal in
metal containers, refered to as “B‐boxes” (Exhibit
5‐5). PPPL maintains detailed waste profiles for
LLW that is shipped off‐site for burial. PPPL has
changed its LLW burial facility from the Nevada
National Security Site to the Energy Soluions facility in Clive, Utah. PPPL’s radioactive waste
program is audited periodically to ensure compliance with burial facility and DOT
requirements. The audit includes employee training, waste characterization, waste packaging,
quality control, and records retention.
5.1.4 Airborne Emission ‐ Differential Atmospheric Tritium Samplers (DATS) PPPL uses differential atmospheric tritium sampler (DATS) to measure elemental (HT) and
oxide tritium (HTO) at the D site stack. DATS are similarly used at four environmental
sampling stations located on D‐site facility boundary trailers (T1 to T4), All of the
aforementioned monitoring is performed on a continuous basis.
Tritium (HTO and HT) was released and monitored at the D‐site stack (Appendix Table 3).
Projected dose equivalent at the nearest off‐site business from airborne emissions of tritium was
0.0018 mrem/year (0.018 μSv/year) in 2013.
The EDE at the site boundary was calculated based on annual tritium totals as measured at the
stack (DATS air) and water samples at the LEC tanks and highest measurements from well and
surface water during 2013 (Exhibit 5‐1). 5.2 Release of Property Containing Residual Radioactive Material Release of property containing residual radioactivity material is performed in accordance with
PPPL ES&H Directives (ESHD) 5008, Section 10, Subpart L.
Such property cannot be released for unrestricted use unless it is demonstrated that
contamination levels on accessible surfaces are less than the values in Appendix D of ES&HD
5008, Section 10, and that prior use does not suggest that contamination levels on inaccessible
surfaces exceed Appendix D values. For tritium and tritiated compounds, the removable
surface contamination value used for this purpose is 1,000 disintegration per minute (dpm)/100
cm2.
Chapter 5 – Environmental Radiological Program Information Page 45
5.3 Protection of Biota The highest measured concentrations of tritium in ground water in 2013, was 140 pCi/L (Well
TW‐5 in April ‐ Appendix Table 4) and for 1331 pCi/L surface water (D&R Canal C1 ‐ Appendix
Table 5). This concentration is a small fraction of the water biota concentration guide (BCG) for
HTO of 3 x10⁸ pCi/L for aquatic system evaluations, and the water BCG for HTO of 2 x 10⁸ pCi/L
for terrestrial system evaluations, per DOE Standard STD‐1153‐2002, “A Graded Approach for
Evaluating Radiation Doses to Aquatic and Terrestrial Biota” [Lev13a & 13b]. Because of these low doses, PPPL does not conduct direct biota monitoring. 5.4 Unplanned Releases There were no unplanned radiological releases in 2013.
5.5 Environmental Radiological Monitoring 5.5.1 Waterborne Radioactivity A. Surface Water
Surface‐water samples at eleven locations (two building foundation sumps: D‐Site Airshaft, and
D‐Site MG; two on‐site locations: DSN001, and E1; and seven off‐site locations: B1, B2, C1,
DSN003, M1, P1, and P2) have been analyzed for tritium (Appendix Table 5).
In October 2013 at C1 D&R Canal, the tritium concentration was detected at 1331 pCi/L, which
was the highest for surface water sample (Appendix Table 5).
Rain water samples, which will eventually reach surface waters, were collected and analyzed
and ranged from below detection to 258 pCi/L in 2013 (Appendix Table 6). With the end of
TFTR D&D project in September 2002, tritium concentrations in rain, surface, and ground water
samples have decreased, reflecting the decreased atmospheric tritium releases measured at the
D‐site stack.
In April 1988, PPPL began on‐site precipitation measurements as part of its environmental
surveillance program. On a weekly basis, precipitation is measured by an on‐site rain gauge.
The 2013 weekly precipitation amounts are shown on Appendix Table 2. Based on the average
rainfall, a comparison of dry or wet years shows that 2013 was just below the average rainfall
total at 43.25 inches (109.86 cm) (Appendix Table 7). B. Ground Water
The highest concentration of tritium in ground water was found in well TW‐5 at 140 pCi/L in
December 2013 (Appendix Table 4). These tritium concentrations are well below the Drinking
Water Standard of 20,000 pCi/L. The three on‐site wells used to monitoring for tritium in the
ground water (TW‐1, TW‐5, TW‐8) were tested for tritium in 2013. Ground water monitoring
Page 46 Chapter 5 – Environmental Radiological Program Information
continued in 2013 based on increased stack releases due to ongoing neutral beam cleaning in
preparation for the NSTX upgrade project.
Based on PPPL’s environmental monitoring data and the available scientific literature [Jo74,
Mu77, Mu82, Mu90], the most likely source of the tritium detected in the on‐site ground water
samples is from the atmospheric releases of tritium from the D‐site stack and the resulting
“wash‐out” during precipitation. Monitoring of ground water from wells and the building
foundation sump (dewatering sump for D‐site buildings) will continue as on‐going atmospheric
releases necessitate. C. Drinking (Potable) Water
Potable water is supplied by the public utility, New Jersey American Water Company, formerly
Elizabethtown Water Company. In April 1984, a sampling point at the input to PPPL (E1
location) was established to provide baseline data for water coming onto the site. Radiological
analysis has included gamma spectroscopy and tritium‐concentration determination. In 2013,
tritium concentrations at this location were less than the lower limit of detection (Appendix
Tables 5) 5.5.2 Foodstuffs, Soil, and Vegetation There were no foodstuffs, soil, or vegetation samples gathered for analysis in 2013. In 1996, the
Health Physics (HP) Manager reviewed the requirement for soil/biota sampling. At that time, a
decision was made to discontinue the sampling program. Tritium was not detected in almost all
samples and these data were not adding to the understanding of tritium transport in the
environment. Greater emphasis was placed on water sampling and monitoring, which
produced more relevant results.
Chapter 6 – Site Hydrology, Ground Water, and Drinking Water Protection Page 47
Chapter
6
SITE HYDROLOGY, GROUND WATER, AND DRINKING WATER PROTECTION 6.1 Lower Raritan River Watershed
PPPL is located within the Bee Brook Watershed. Bee Brook is a tributary to the
Millstone River, which is part of the Raritan River Watershed (Exhibit 6‐1). NJDEP has
developed a watershed‐based management program for prospective environmental
planning and has divided the State of New Jersey into twenty watershed basins.
Locally, the Bee Brook Watershed encompasses approximately 700 acres within the
Princeton Forrestal Center and James Forrestal Campus tracts. It begins at College Road
East (approximately 1600 feet east of US Route 1), flows south in a wide flood plain, and
discharges into Devil’s Brook at the entrance to Mill Pond [Sa80].
Exhibit 6‐1. Millstone River Watershed Basin
Page 48 Chapter 6 – Site Hydrology, Ground Water, and Drinking Water Protection
6.2 Geology & Topography
PPPL is situated on the eastern edge of the Piedmont Physiographic Province,
approximately one‐half mile from the western edge of the Atlantic Coastal Plain
Province. The site is underlain largely by gently dipping and faulted sedimentary rock
of the Newark Basin. The Newark Basin is one of several rift basins that were filled with
sedimentary material during the Triassic Period, about 250‐200 Ma (million years ago).
At PPPL, bedrock is part of the Stockton Formation, which is reportedly more than 500
feet thick and consists of fractured red siltstone and sandstone [Lew87]. Regionally, the
formation strikes approximately north 65 degrees east, and dips approximately 8
degrees to the northwest. The occurrence of limited amounts of clean sand near the
surface indicates the presence of the Pennsauken Formation. This alluvial material was
probably deposited during the Aftonian Interglacial period of the Pleistocene Epoch
(approximately 2.6 million to 12,000 years ago).
Within 25 miles, there are a number of documented faults; the closest of which is the
Hopewell fault located about 8 miles from the site. The Flemington Fault and Ramapo
Faults are located within 20 miles. None of these faults are determined to be “active” by
the U.S. Geological Survey. This area of the country (eastern central US) is not
earthquake‐prone, despite the occurrence of minor earthquakes that have caused little or
no damage.
The Millstone River and its supporting tributaries geographically dominate the region.
The well‐watered soils of the area have provided a wealth of natural resources including
good agricultural lands from prehistoric times to the present. Land use was
characterized by several small early centers of historic settlement and dispersed
farmland. It has now been developed into industrial parks, housing developments,
apartment complexes and shopping centers [Gr 77].
The topography of the site is relatively flat and open with elevations ranging from 110
feet in the northwestern corner to 80 feet above mean sea level (msl) along the southern
boundary. The low‐lying topography of the Millstone River drainage reflects the glacial
origins of the surface soils; sandy loams with varying percentages of clay predominate.
Two soil series are recognized in the immediate vicinity of the site. Each reflects
differences in drainage and subsurface water tables. Along the low‐lying banks of
stream tributary, Bee Brook, the soils are classified Nixon‐Nixon Variant and Fallsington
Variant Association and Urban Land [Lew87].
This series is characterized by nearly level to gently sloping upland soils, deep,
moderate to well drained, with a loamy subsoil and substratum. The yellowish‐white
sands contain patches of mottled coloring caused by prolonged wetness. On a regional
Chapter 6 – Site Hydrology, Ground Water, and Drinking Water Protection Page 49
scale, the water table fluctuates between 1.5 and 2.5 feet below the surface in wet periods
and drops below 5 feet during drier months.
In the slightly higher elevations (above 70 feet msl), the sandy loams are better drained
and belong to the Sassafras series. Extensive historic farmlands and nurseries in the
area indicate this soil provides a good environment for agricultural purposes, both
today and in the past. 6.3 Biota
An upland forest type with dominant Oak forest characterizes vegetation of the site.
Associated with the various oaks are Red Maple, Hickories, Sweetgums, Beech, Scarlet
Oak, and Ash. Red, White, and Black Oaks are isolated in the lower poorly drained
areas. Along the damp borders of Bee Brook, a bank of Sweetgum, Hickory, Beech,
and Red Maple define the watercourse. The forest throughout most of the site has
been removed either for farmland during the last century or recently for the
construction of new facilities. Grass has replaced much of the open areas.
The under‐story of the wooded areas is partially open with isolated patches of shrubs,
vines, and saplings occurring mostly in the uplands area. The poorly drained areas
have a low ground cover of ferns, grasses, and leaf litter. 6.4 Flood Plain
All of PPPL’s storm water runoff flows to Bee Brook, either directly via the lined surface
impoundment/retention basin (DSN001) or along the western swale to the wetlands
south of the site. Approximately 45% of the site’s total area is covered by impervious
surfaces – buildings, roadways and parking lots, and storage trailers.
PPPL’s Stormwater Management Plan allows for a maximum impervious coverage of
60% of the developable land. Eighteen acres of PPPL’s 88.5‐acre site are wetlands, 14.5
acres grass, and 18.4 acres upland forest. Gravel, which is semi‐impervious, covers
approximately 11.1 acres, resulting in an impervious cover (buildings, roadways,
sidewalks, etc.) of 26.5 acres. PPPL’s current site impervious cover is well under
SWPPP’s Best Management Practice of 60 percent of total developable coverage.
[PPPL12a & SE96].
Page 50 Chapter 6 – Site Hydrology, Ground Water, and Drinking Water Protection
Exhibit 6‐2. Generalized Potentiometric Surface of the Bedrock Aquifer at PPPL [Le87]
Also, the 500‐year flood plain elevation (85 ft above mean sea level, msl) delineates the storm
protection corridor, which is vital to the flood and water quality control program for PPPL as
well as the Princeton Forrestal Center site. This “corridor” is preserved and protected from
development by Princeton Forrestal Center in the Site Development Plan [PFC80].
The general direction of ground‐water flow on the site is from the northwest of PPPL toward
the southeast in the direction of Bee and Devil’s Brooks. The operation of several building
foundation drain sump pumps creates a local and shallow cone of depression radially toward
the sumps (Exhibit 6‐2).
Ground water is pumped from the sumps into the basin, which flows into Bee Brook. Bee
Brook is hydraulically connected with ground water; during flooding stages, the brook
recharges ground water and during low‐flow periods, ground water discharges to the brook.
6.5 Groundwater Monitoring
6.5.1 Monitoring Wells
PPPL has installed a total of 46 wells to monitor ground‐water quality under various regulatory
programs (Exhibit 6‐3), although many wells have since been decommissioned. PPPL has 32 active
monitoring wells for environmental monitoring and surveillance purposes. Remedial Investigation
and Remedial Alternatives Analysis (RI/RAA) studies were conducted to delineate shallow ground
water contamination and identify a suitable remedy for ground water contamination under the New
Jersey Site Remediation Program [PPPL99a & b]. A Remedial Action Work Plan (RAWP) was
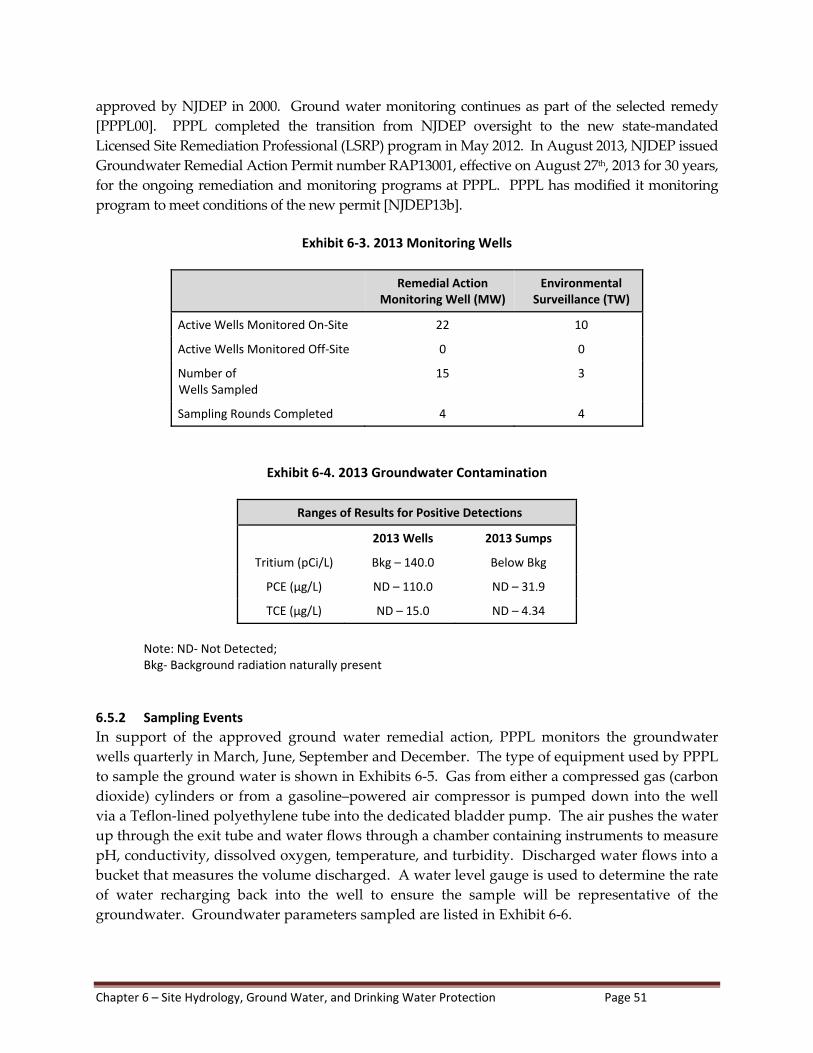
Chapter 6 – Site Hydrology, Ground Water, and Drinking Water Protection Page 51
approved by NJDEP in 2000. Ground water monitoring continues as part of the selected remedy
[PPPL00]. PPPL completed the transition from NJDEP oversight to the new state‐mandated
Licensed Site Remediation Professional (LSRP) program in May 2012. In August 2013, NJDEP issued
Groundwater Remedial Action Permit number RAP13001, effective on August 27th, 2013 for 30 years,
for the ongoing remediation and monitoring programs at PPPL. PPPL has modified it monitoring
program to meet conditions of the new permit [NJDEP13b].
Exhibit 6‐3. 2013 Monitoring Wells
Remedial Action
Monitoring Well (MW) Environmental
Surveillance (TW)
Active Wells Monitored On‐Site 22 10
Active Wells Monitored Off‐Site 0 0
Number of Wells Sampled
15 3
Sampling Rounds Completed 4 4
Exhibit 6‐4. 2013 Groundwater Contamination
Ranges of Results for Positive Detections
2013 Wells 2013 Sumps
Tritium (pCi/L) Bkg – 140.0 Below Bkg
PCE (µg/L) ND – 110.0 ND – 31.9
TCE (µg/L) ND – 15.0 ND – 4.34
Note: ND‐ Not Detected; Bkg‐ Background radiation naturally present
6.5.2 Sampling Events
In support of the approved ground water remedial action, PPPL monitors the groundwater
wells quarterly in March, June, September and December. The type of equipment used by PPPL
to sample the ground water is shown in Exhibits 6‐5. Gas from either a compressed gas (carbon
dioxide) cylinders or from a gasoline–powered air compressor is pumped down into the well
via a Teflon‐lined polyethylene tube into the dedicated bladder pump. The air pushes the water
up through the exit tube and water flows through a chamber containing instruments to measure
pH, conductivity, dissolved oxygen, temperature, and turbidity. Discharged water flows into a
bucket that measures the volume discharged. A water level gauge is used to determine the rate
of water recharging back into the well to ensure the sample will be representative of the
groundwater. Groundwater parameters sampled are listed in Exhibit 6‐6.
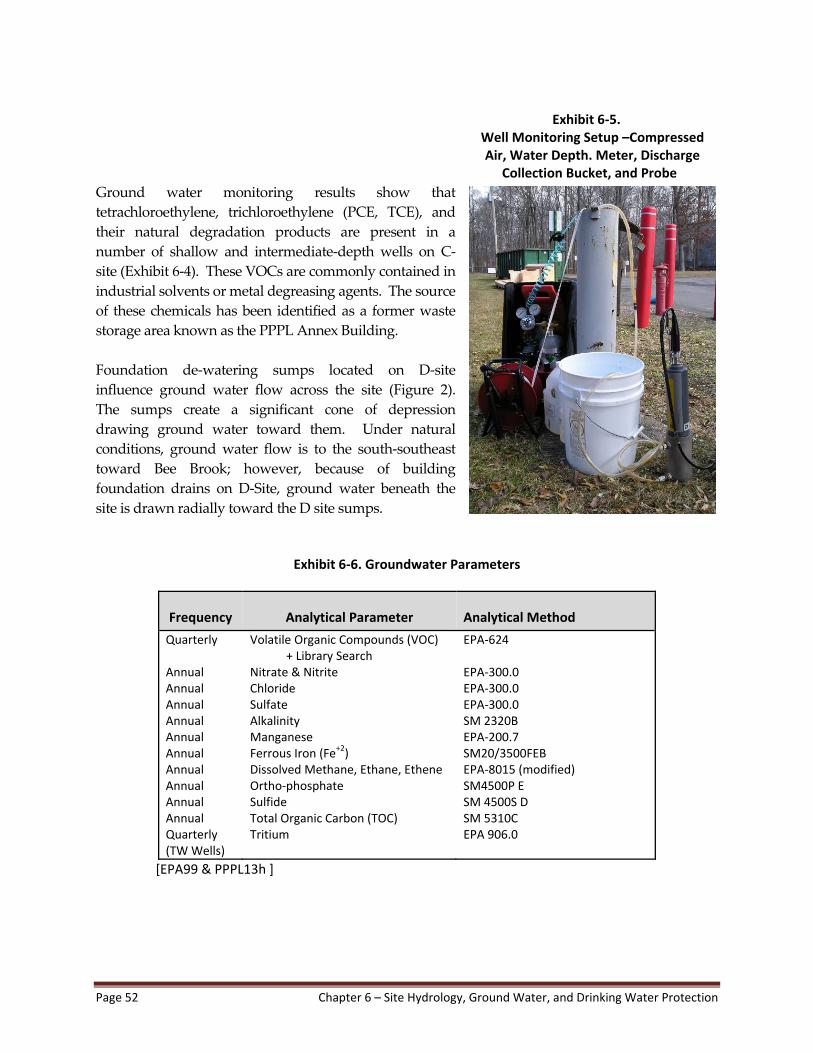
Page 52 Chapter 6 – Site Hydrology, Ground Water, and Drinking Water Protection
Exhibit 6‐5.
Well Monitoring Setup –Compressed Air, Water Depth. Meter, Discharge
Collection Bucket, and Probe Ground water monitoring results show that
tetrachloroethylene, trichloroethylene (PCE, TCE), and
their natural degradation products are present in a
number of shallow and intermediate‐depth wells on C‐
site (Exhibit 6‐4). These VOCs are commonly contained in
industrial solvents or metal degreasing agents. The source
of these chemicals has been identified as a former waste
storage area known as the PPPL Annex Building.
Foundation de‐watering sumps located on D‐site
influence ground water flow across the site (Figure 2).
The sumps create a significant cone of depression
drawing ground water toward them. Under natural
conditions, ground water flow is to the south‐southeast
toward Bee Brook; however, because of building
foundation drains on D‐Site, ground water beneath the
site is drawn radially toward the D site sumps.
Exhibit 6‐6. Groundwater Parameters
Frequency Analytical Parameter Analytical Method
Quarterly Annual Annual Annual Annual Annual Annual Annual Annual Annual Annual Quarterly (TW Wells)
Volatile Organic Compounds (VOC) + Library Search Nitrate & Nitrite Chloride Sulfate Alkalinity Manganese Ferrous Iron (Fe+2) Dissolved Methane, Ethane, Ethene Ortho‐phosphate Sulfide Total Organic Carbon (TOC) Tritium
EPA‐624 EPA‐300.0 EPA‐300.0 EPA‐300.0 SM 2320B EPA‐200.7 SM20/3500FEB EPA‐8015 (modified) SM4500P E SM 4500S D SM 5310C EPA 906.0
[EPA99 & PPPL13h ]
Chapter 6 – Site Hydrology, Ground Water, and Drinking Water Protection Page 53
6.5.3 Remedial Action Work Plan (RAWP)
Following a site‐wide RI/RAA study and remedy selection process, PPPL prepared and
submitted a Remedial Action Work Plan (RAWP) outlining continual operation of the ground
water extraction system and a long‐term monitoring program [Sh00]. The RAWP was
submitted to NJDEP in May 2000, which was implemented until the Ground Water Remedial
Action permit was issued in August 2013 [HLA97, HLA98, Sh00‐01, Sh03, Sh05‐13].
In January 2002, an Aquifer Classification Exception Area (CEA) Designation was submitted to
NJDEP. The CEA designation identifies specific areas where state‐wide Ground Water Quality
Standards are not met and will not be met for some time. The CEAs was granted for a specific
area of an aquifer to address specific VOCs in the shallow (<60 feet deep) aquifer. The CEA
request was approved by NJDEP in August 2002. The CEA was recertified in 2013, with
submittal of a Biennial Remedial Action and Ground Water Classification Exception Area
Recertification Report (PPPL13b).
General RAWP activities monitored:
Examination of analytical data and water level measurements indicates an
inverse relationship between ground water level and VOC concentration.
Natural attenuation (anaerobic biodegradation) occurs in the wetlands adjacent
to CAS/RESA.
Contaminated ground water is captured by building sumps and is not migrating
off‐site.
RAWP 2013 activities include:
NJDEP issued PPPL’s Groundwater Remedial Action Permit No. RAP13001,
effective for 30 years starting August 27, 2013.
Quarterly and Annual sampling JM Sorge subcontractor sampled March, June,
September, and December.
Starting in December 2013, PPPL Quarterly sampling will only include VOC +
library search.
Annual sampling will be conducted with VOC + library search and monitored
natural attenuation (MNA) parameters in September 2014, and occurring in
March in following subsequent years.
Submittal of the Remedial Action Progress Report in May 2013 and Remedial Action Biennial Certification for Ground Water to NJDEP in 2013.
Bladder pumps and monitoring well casings were refurbished as necessary.
Groundwater monitoring equipment repairs.
6.5.4 Monitored Natural Attenuation
Examination of analytical data and water level measurements during the Remedial Investigation and
the beginning of the Remedial Action indicated an inverse relationship between ground water level
and VOC concentration (particularly PCE). Periods of higher water level generally corresponded
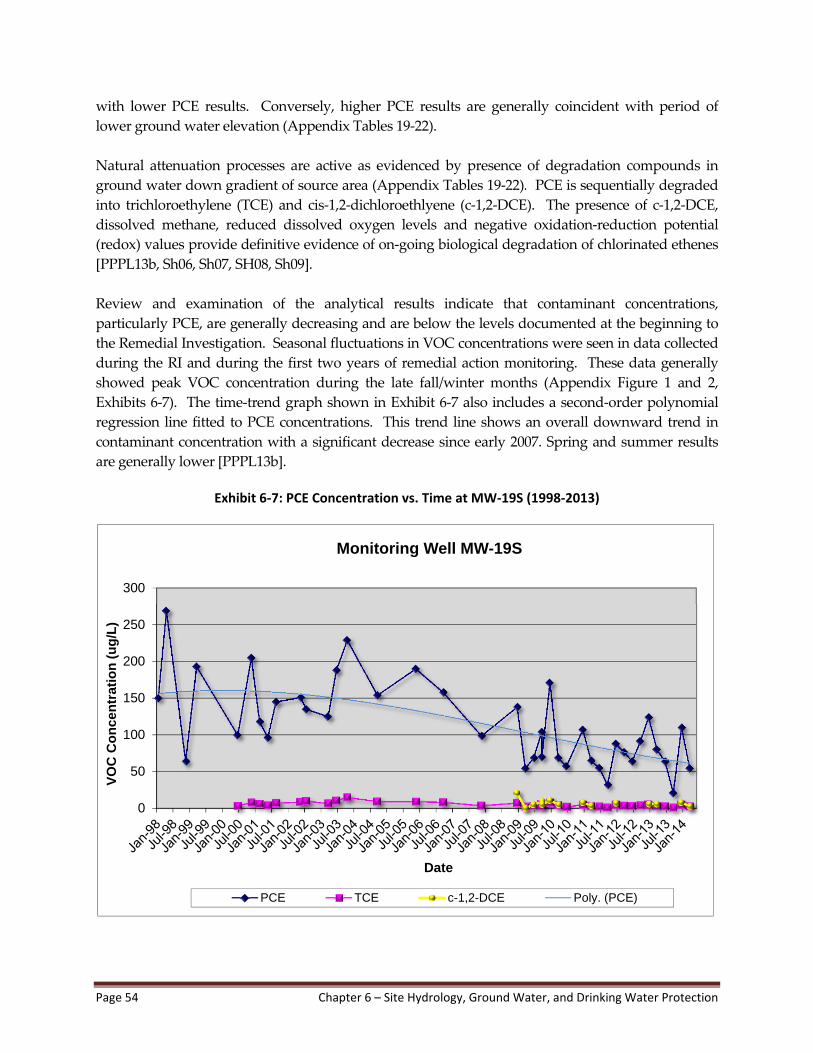
Page 54 Chapter 6 – Site Hydrology, Ground Water, and Drinking Water Protection
with lower PCE results. Conversely, higher PCE results are generally coincident with period of
lower ground water elevation (Appendix Tables 19‐22).
Natural attenuation processes are active as evidenced by presence of degradation compounds in
ground water down gradient of source area (Appendix Tables 19‐22). PCE is sequentially degraded
into trichloroethylene (TCE) and cis‐1,2‐dichloroethlyene (c‐1,2‐DCE). The presence of c‐1,2‐DCE,
dissolved methane, reduced dissolved oxygen levels and negative oxidation‐reduction potential
(redox) values provide definitive evidence of on‐going biological degradation of chlorinated ethenes
[PPPL13b, Sh06, Sh07, SH08, Sh09].
Review and examination of the analytical results indicate that contaminant concentrations,
particularly PCE, are generally decreasing and are below the levels documented at the beginning to
the Remedial Investigation. Seasonal fluctuations in VOC concentrations were seen in data collected
during the RI and during the first two years of remedial action monitoring. These data generally
showed peak VOC concentration during the late fall/winter months (Appendix Figure 1 and 2,
Exhibits 6‐7). The time‐trend graph shown in Exhibit 6‐7 also includes a second‐order polynomial
regression line fitted to PCE concentrations. This trend line shows an overall downward trend in
contaminant concentration with a significant decrease since early 2007. Spring and summer results
are generally lower [PPPL13b].
Exhibit 6‐7: PCE Concentration vs. Time at MW‐19S (1998‐2013)
0
50
100
150
200
250
300
VO
C C
on
cen
trat
ion
(u
g/L
)
Date
Monitoring Well MW-19S
PCE TCE c-1,2-DCE Poly. (PCE)
Chapter 6 – Site Hydrology, Ground Water, and Drinking Water Protection Page 55
6.6 Drinking Water Protection PPPL and the surrounding area do not rely on on‐site or shallow supply wells for potable water. All
potable water in the immediate area of the Laboratory is provided by New Jersey American Water
Company. New Jersey American Water Company is supplied by a variety of sources, including
surface water intakes and deep supply wells located throughout its service area. The nearest wells
supplying water to New Jersey American are located approximately 2 miles south‐southwest of the
Laboratory near the Millstone River. As discussed above, ground water contaminated with PCE and
other organic chemicals is captured by the building foundation drains and is not migrating offsite.
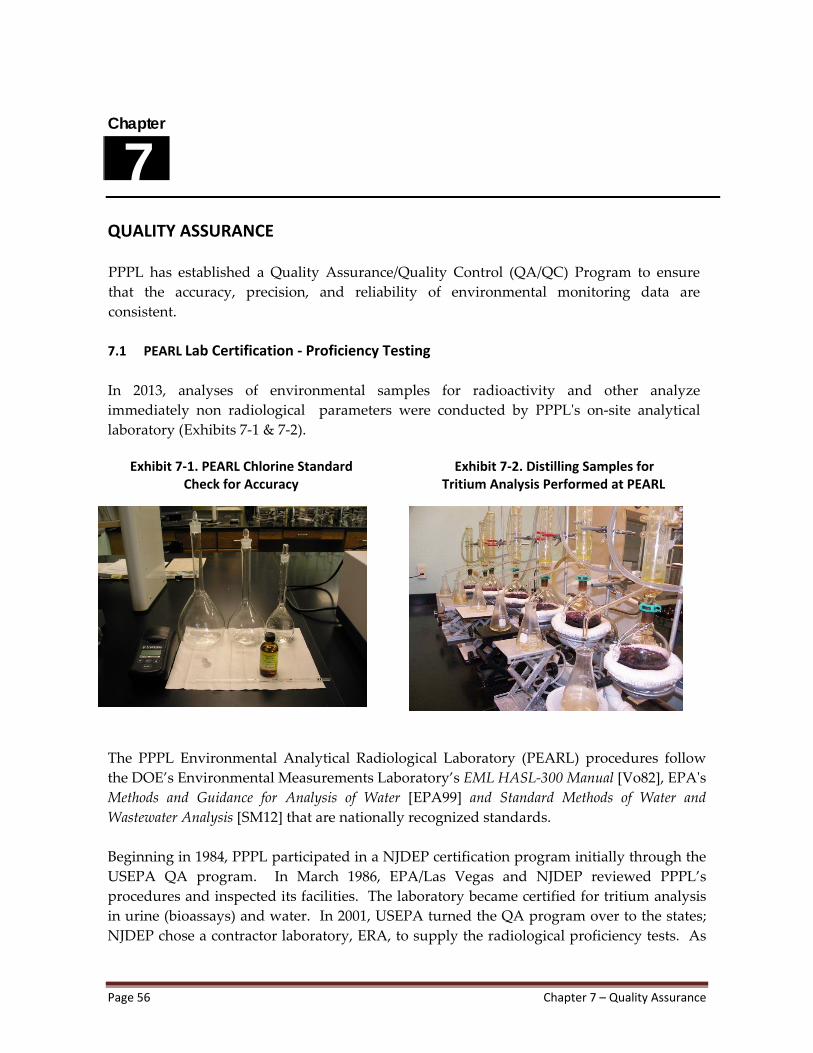
Page 56 Chapter 7 – Quality Assurance
Chapter
7
QUALITY ASSURANCE
PPPL has established a Quality Assurance/Quality Control (QA/QC) Program to ensure
that the accuracy, precision, and reliability of environmental monitoring data are
consistent.
7.1 PEARL Lab Certification ‐ Proficiency Testing
In 2013, analyses of environmental samples for radioactivity and other analyze
immediately non radiological parameters were conducted by PPPLʹs on‐site analytical
laboratory (Exhibits 7‐1 & 7‐2). Exhibit 7‐1. PEARL Chlorine Standard Exhibit 7‐2. Distilling Samples for Check for Accuracy Tritium Analysis Performed at PEARL
The PPPL Environmental Analytical Radiological Laboratory (PEARL) procedures follow
the DOE’s Environmental Measurements Laboratory’s EML HASL‐300 Manual [Vo82], EPAʹs Methods and Guidance for Analysis of Water [EPA99] and Standard Methods of Water and Wastewater Analysis [SM12] that are nationally recognized standards.
Beginning in 1984, PPPL participated in a NJDEP certification program initially through the
USEPA QA program. In March 1986, EPA/Las Vegas and NJDEP reviewed PPPL’s
procedures and inspected its facilities. The laboratory became certified for tritium analysis
in urine (bioassays) and water. In 2001, USEPA turned the QA program over to the states;
NJDEP chose a contractor laboratory, ERA, to supply the radiological proficiency tests. As
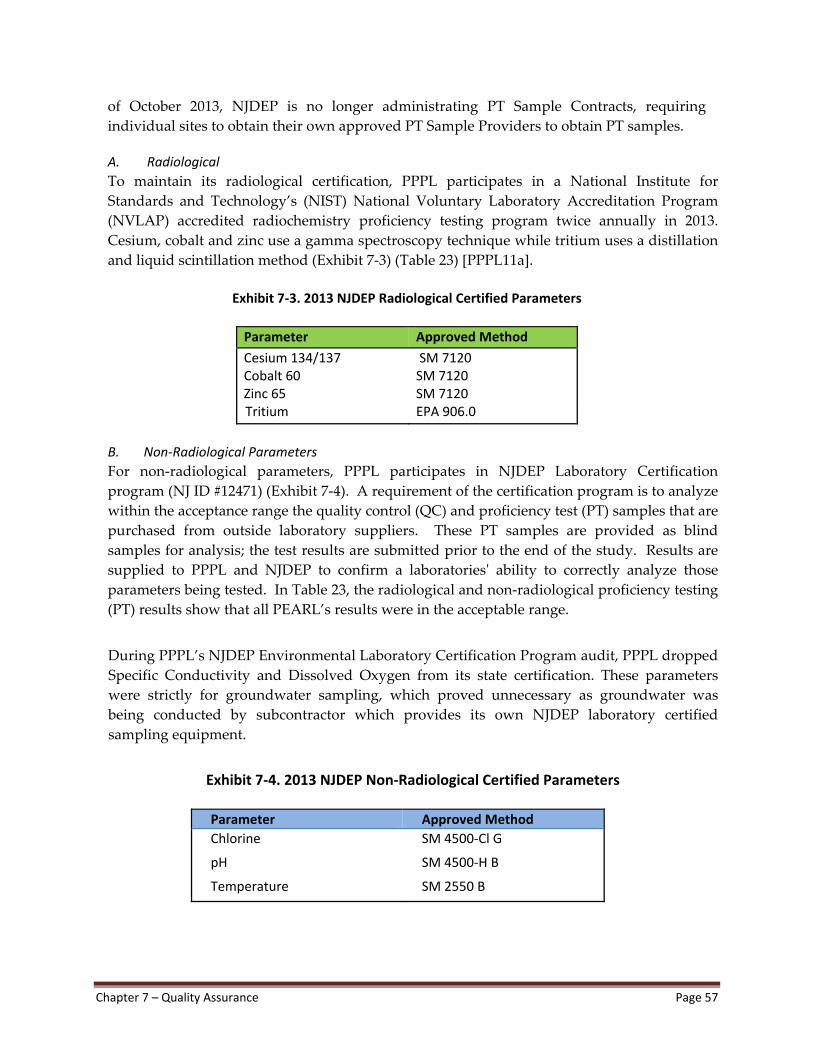
Chapter 7 – Quality Assurance Page 57
of October 2013, NJDEP is no longer administrating PT Sample Contracts, requiring
individual sites to obtain their own approved PT Sample Providers to obtain PT samples. A. Radiological
To maintain its radiological certification, PPPL participates in a National Institute for
Standards and Technology’s (NIST) National Voluntary Laboratory Accreditation Program
(NVLAP) accredited radiochemistry proficiency testing program twice annually in 2013.
Cesium, cobalt and zinc use a gamma spectroscopy technique while tritium uses a distillation
and liquid scintillation method (Exhibit 7‐3) (Table 23) [PPPL11a].
Exhibit 7‐3. 2013 NJDEP Radiological Certified Parameters
Parameter Approved Method
Cesium 134/137 Cobalt 60 Zinc 65
SM 7120 SM 7120 SM 7120
Tritium EPA 906.0
B. Non‐Radiological Parameters
For non‐radiological parameters, PPPL participates in NJDEP Laboratory Certification
program (NJ ID #12471) (Exhibit 7‐4). A requirement of the certification program is to analyze
within the acceptance range the quality control (QC) and proficiency test (PT) samples that are
purchased from outside laboratory suppliers. These PT samples are provided as blind
samples for analysis; the test results are submitted prior to the end of the study. Results are
supplied to PPPL and NJDEP to confirm a laboratoriesʹ ability to correctly analyze those
parameters being tested. In Table 23, the radiological and non‐radiological proficiency testing
(PT) results show that all PEARL’s results were in the acceptable range.
During PPPL’s NJDEP Environmental Laboratory Certification Program audit, PPPL dropped
Specific Conductivity and Dissolved Oxygen from its state certification. These parameters
were strictly for groundwater sampling, which proved unnecessary as groundwater was
being conducted by subcontractor which provides its own NJDEP laboratory certified
sampling equipment.
Exhibit 7‐4. 2013 NJDEP Non‐Radiological Certified Parameters
Parameter Approved Method
Chlorine SM 4500‐Cl G
pH SM 4500‐H B
Temperature SM 2550 B
Page 58 Chapter 7 – Quality Assurance
7.2 Subcontractor Labs PPPL followed its internal procedures, HP‐LAB‐03‐ “Methods for Measuring Analyze
Immediately Parameters,” EM‐OP‐31—“Surface Water Sampling,” and EM‐OP‐38—“Low‐
Flow Ground Water Sampling” procedures. These procedures provide detailed descriptions
of all NJPDES permit‐required sampling and analytical methods for collection of samples,
analyses of these samples, and quality assurance/quality control requirements. Chain‐of‐
custody forms are required for all samples; holding times are closely checked to ensure that
analyses are performed within established holding times and that the data is valid; trip blanks
are required for all volatile organic compound analyses.
Subcontractor laboratories used by PPPL are certified by NJDEP and participate in the state’s
QA program; the subcontractor laboratories must also follow their own internal quality
assurance plans. QC Laboratories and Accutest Laboratories where used in 2013 for
environmental laboratory analysis. Hazardous waste sample analyses were conducted by
Precision Testing Laboratories. 7.3 Internal QA/QC A. Internal Audit
PPPL did not participate in any internal audits for PEARL operations in 2013.
B. Internal QA Check
PPPL’s PEARL ensures QA/QC through HP‐ENV‐12 “Quality Assurance/Quality Control
Plan for Analyze Immediately Parameters .” Temperature calibrations are conducted
quarterly with NIST Thermometer. Temperature on all pH and dissolved oxygen meters are
calibrated against NIST. Chlorine field meters are calibrated at least annually by chlorine
standard concentrations. Annual Accuracy and Precisions Reports are generated to evaulate
concentration standards data. Prior use, the chlorine field meter is checked once monthly
verified prior to NJPDES sampling by calibrated LaMotte Secondary Standards.
C. Calibrations
PPPL calibrates all equipment per equipment manual and following HP‐LAB‐03 and HP‐
ENV‐12 Procedures. Calibrations are recorded in lab calibration log and reported to Head QA
Officer for review.
D. Chemicals
Chemical inventories are performed quarterly to insure proper storage, expiration and
quantity checks. Chemical name, stock number, lot number, date received, date opened and
expiration date are all checked to ensure chemical quality for calibration.
Chapter 7 – Quality Assurance Page 59
7.4 External QA/QC
In July 2013, NJDEP Office of Quality Assurance (OQA) audited PPPL’s Princeton
Environmental, Analytical and Radiological Laboratory, PEARL. PPPL completed corrective
actions and recommendations on May 24, 2014. PEARL conducts analyses for Analyze‐
Immediately parameters to support the New Jersey Pollutant Discharge Elimination System
(NJPDES) permit requirements and radiological parameters for internal samples.
Page 60 Chapter 8 ‐ References
Chapter
8 REFERENCES
10CFR835 Title 10, Code of Federal Register, Part 835, Occupational Radiation Protection, Appendix D – Surface Radioactivity Values.
Am98 Amy S. Greene Environmental Consultants, Inc., 1998, Baseline Ecological Evaluation Princeton Plasma Physics Laboratory, Plainsboro Township, Middlesex County, New Jersey.
Be87a Bentz, L. K., and Bender, D. S., 1987, Population Projections, 0‐50 Mile Radius from the CIT Facility: Supplementary Documentation for an Environmental Assessment for the CIT at PPPL, EGG‐EP‐7751, INEL, Idaho Falls, Idaho.
Be87b Bentz, L. K., and Bender, D. S., 1987, Socioeconomic Information, Plainsboro Area, New Jersey: Supplementary Documentation for an Environmental Assessment for the CIT at PPPL, EGG‐EP‐7752, INEL, Idaho Falls, Idaho.
Cu14 Cummings, C., 2014, PPPL Audits, personal communications.
DOE01 DOE Order 435.1, 2001, Radioactive Waste Management.
DOE11a DOE Order 436.1, 2011, Department Sustainability.
DOE11b DOE Order 458.1, 2011, Radiation Protection of the Public and the Environment.
Dy93 Dynamac Corporation, August 1993, CERCLA Inventory Report, prepared for Princeton Plasma Physics Laboratory.
En87 Envirosphere Company, 1987, Ecological Survey of Compact Ignition Tokamak Site and Surroundings at Princeton Universityʹs Forrestal Campus, Envirosphere Company,
Division of Ebasco, Report to INEL for the CIT.
EO08 Executive Order 13423, 2008, Strengthening Federal Environmental, Energy and Transportation Management.
EO09 Executive Order 13514, 2009, Federal Leadership in Environmental, Energy and Economic Performance.
Chapter 8 ‐ References Page 61
EPA83 Environmental Protection Agency, Office of Research and Development,
Environmental Monitoring and Support, March 1983, Methods for Chemical Analysis of Water and Waste, EPA 600‐U‐79‐020.
EPA99 Environmental Protection Agency, Office of Water, June 1999, Methods and Guidance for Analysis of Water, EPA 821‐C‐99‐004.
Fin14a Finley, V.L., 2014, 2013 Total Flow Discharged from DSN001, Basin Outfall, personal communication.
Fin14b Finley, V.L., 2014, 2013 PPPL Boiler Emission Calculations for Criteria Air Pollutants, personal communication.
Gr77 Grossman, J. W., 1977, Archaeological and Historical Survey of the Proposed Tokamak
Fusion Test Reactor, Rutgers University.
HLA 97 Harding Lawson Associates, March 28, 1997, Remedial Investigation/Remedial Action Report Phase I and II, Princeton University Plasma Physics Laboratory, James Forrestal Campus, Plainsboro, New Jersey.
HLA98 Harding Lawson Associates, September 25, 1998, Remedial Investigation/Remedial
Action Report Addendum, Phase 3 Activities, Princeton Plasma Physics
Laboratory, James Forrestal Campus, Plainsboro, New Jersey, 17 volumes.
Jo74 Jordan, C. F., Stewart, M., and Kline, J., 1974, Tritium Movement in Soils: The Importance of Exchange and High Initial Dispersion, Health Physics 27: 37‐43.
Kin14a King, M., 2014, 2013 Solid Waste Data, worksheet.
Kin14b King, M., 2014, 2013 PPPL Fertilizer, Pesticide, and Herbicide Report, personal communication.
Lev14a Levine, J., 2014, 2013 Safety Statistics, personal communication.
Lev14b Levine, J., 2014, 2013 Tritium Environmental Data and D site Stack Tritium Release Data, personal communication.
Lew87 Lewis, J. C. and Spitz, F. J., 1987, Hydrogeology, Ground‐Water Quality, and The Possible Effects of a Hypothetical Radioactive‐Water Spill, Plainsboro Township, New Jersey, U.S. Geological Survey Water‐Resources Investigations Report 87‐4092,
West Trenton, NJ.
Page 62 Chapter 8 ‐ References
Mu77 Murphy, C. E., Jr., Watts, J. R., and Corey, J. C., 1977, Environmental Tritium Transport from Atmospheric Release of Molecular Tritium, Health Physics 33:325‐331.
Mu82 Murphy, C. E., Jr., Sweet, C. W., and Fallon, R. D., 1982, Tritium Transport Around Nuclear Facilities, Nuclear Safety 23:667‐685.
Mu90 Murphy, C. E., Jr., 1990, The Transport, Dispersion, and Cycling of Tritium in the Environment, Savannah River Site Report, WSRC‐RP‐90‐462, UC702, 70 pp.
Nem14 Nemeth, J. 2014, 2013 Boiler Stack Efficiency Test Results and Subpart JJJJJJ form submittal.
NJB97 NJ Breeding Bird Atlas Report, 1997, A New Jersey Breeding Bird Atlas Data Base Inquiry for Plainsboro Township, Middlesex County, New Jersey, Cape May Bird
Observatory (Letter), January 13, 1998.
NJDEP84 NJ Department of Environmental Protection, December 1984, Bee Brook ‐ Delineation of Floodway and Flood Hazard Area.
NJDEP97 New Jersey Department of Environmental Protection, Natural Heritage Program,
1997, A Natural Heritage Data Base Inquiry for Plainsboro Township, Middlesex County, New Jersey, NJDEP Natural Heritage Program (Letter), NHP file No. 97‐
4007435.
NJDEP09 New Jersey Department of Environmental Protection, 2009, NJPDES Ground Water General Permit No. NJ0142051 (Lined Surface Impoundment)
NJDEP13a New Jersey Department of Environmental Protection, 2013, Final Surface Water Permit, New Jersey Pollutant Discharge Elimination System (NJPDES), NJ0023922.
NJDEP13b New Jersey Department of Environmental Protection, 2013, NJPDES Ground Water Remedial Monitoring Permit
NJDEP13c New Jersey Department of Environmental Protection, 2013, Press Release on NJ Stewardship Program Awards
NJWSA07 New Jersey Water Supply Authority, 2007, Withdrawal Agreement of Water from the Delaware & Raritan Canal.
NNSS1 Nevada National Security Site, 2011, Surveillance Report Number RWAP‐S‐12‐04.
PFC80 Princeton Forrestal Center, 1980, Storm Water Management Plan Phase I, prepared by Sasaki Associates, Inc.
Chapter 8 ‐ References Page 63
Pin14 Pinto, A., 2014, 2013 Water Data for Potable and Non‐Potable Sources, personal communication.
PPPL95 Princeton Plasma Physics Laboratory, March 1995, Proposed Site Treatment Plan [PSTP] for Princeton Plasma Physics Laboratory [PPPL].
PPPL99a Princeton Plasma Physics Laboratory. 1999, Phase IV Remedial Investigation Report. PPPL99b Princeton Plasma Physics Laboratory. 1999, Remedial Action Selection Report.
PPPL00 Princeton Plasma Physics Laboratory, 2000, Remedial Action Work Plan.
PPPL05 Princeton Plasma Physics Laboratory, August 2005, Cultural Resource Management Plan.
PPPL07 Princeton Plasma Physics Laboratory, 2007, Environmental Monitoring Plan, Rev. 4.
PPPL08a Princeton Plasma Physics Laboratory, January 22, 2008, Laboratory Mission, O‐001, TCR R‐1‐002, Rev. 4.
PPPL08b Princeton Plasma Physics Laboratory, 2008, Nuclear Materials Control and Accountability (MC&A) Plan, HP‐PP‐06. Rev 6.
PPPL08c Princeton Plasma Physics Laboratory, 2008, Letter of Interpretation (LOI) Wetlands Delineation.
PPPL09 Princeton Plasma Physics Laboratory, 2009, Freehold Soil Conservation District Permit
No.2009‐0343 (D‐site rain garden and landscaping).
PPPL10a Princeton Plasma Physics Laboratory, 2010, Acute Toxicity Bio‐monitoring Tests for DSN003 Report.
PPPL10b Princeton Plasma Physics Laboratory, 2010, PPPL Executable Plan (EO 13423). PPPL10c Princeton Plasma Physics Laboratory, 2010, NJPDES Waste Characterization Report
for DSN003. PPPL11a Princeton Plasma Physics Laboratory, 2011, Health Physics Procedures (Calibration,
Dosimetry, Environmental, Field Operations, Laboratory, Material Control and Accountability, and Radiological Laboratory).
PPPL11b Princeton Plasma Physics Laboratory, 2011, Spill Prevention Countermeasure and Control Plan (SPCC Plan).
Page 64 Chapter 8 ‐ References
PPPL11c Princeton Plasma Physics Laboratory, 2011, Biennial Remedial Action and Ground
Water Classification Exception Area Recertification Report. PPPL11d Princeton Plasma Physics Laboratory, November 2011, Environmental Management
System Description, Revision 3.
PPPL12a Princeton Plasma Physics Laboratory, 2012, Storm Water Pollution Prevention Plan.
PPPL12b Princeton Plasma Physics Laboratory, December 2012, Appendix A, Summary of Environmental Aspects and Impacts by Facility.
PPPL12c Princeton Plasma Physics Laboratory, 2012, Low‐Level Radioactive Waste Program.
PPPL13a Princeton Plasma Physics Laboratory, 2013, EM‐OP‐46 Environmental Aspects and Impacts Evaluation, Rev. 3.
PPPL13b Princeton Plasma Physics Laboratory, 2013, 2013 Remedial Action Progress Report
and Ground Water Classification Exception Area Reclassification Report.
PPPL13c Princeton Plasma Physics Laboratory, 2013, Total Suspended Solids Exceeded Report‐ February 2013(NJDEP Case Number 13‐03‐08‐0940‐57).
PPPL13d Princeton Plasma Physics Laboratory, 2013, Chlorine‐Produced Oxidants Exceeded
Report‐ August 2013 (NJDEP Case Number 13‐08‐05‐1612‐33).
PPPL13e Princeton Plasma Physics Laboratory, December 2013, DOE Order 13514, PPPL Site Sustainable Plan.
PPPL13f Princeton Plasma Physics Laboratory, December 2013, PPPL 2013 Comprehensive
Energy Data Report (CEDR). PPPL13g Princeton Plasma Physics Laboratory, December 2013, PPPL 2013 Pollution
Prevention Tracking System Report (PPTRS).
PPPL13h Princeton Plasma Physics Laboratory, 2013, NJDEP Ground Water Remedial Monitoring Permit.
PPPL13i Princeton Plasma Physics Laboratory, 2013, Chronic Toxicity Bio‐monitoring Tests for
DSN001 Report.
PPPL13j Princeton Plasma Physics Laboratory, 2013, NJPDES Waste Characterization Report for DSN001.
Chapter 8 ‐ References Page 65
PPPL14a Princeton Plasma Physics Laboratory, January 2014, Environmental Management System Summary of Legal and Other Requirements, Appendix B, Rev. 4.
PPPL14b Princeton Plasma Physics Laboratory, 2013, SARA Title III Annual Report for 2012.
PPPL14c Princeton Plasma Physics Laboratory, 2012, NESHAPs Annual Report for Tritium Emissions.
Pue14a Pueyo, M., 2013, 2012 Hazardous, TSCA, and Medical Waste Data, personal communication.
Pue14b Pueyo, M., 2013, 2013 Spill Release Number of Incidents, personal communication.
PSAR78 Preliminary Safety Analysis Report, Princeton Plasma Physics Laboratory Tokamak
Fusion Test Reactor, 1978.
Rul14 Rule, K., 2014, 2013 Effective Dose Equivalent Calculations for PPPL Operations, personal communication.
Sa80 Sasaki Associates, February 1980, Princeton Forrestal Center, Storm Water Management Plan for Bee Brook Watershed, prepared for Delaware & Raritan Canal
Commission.
SE96 Smith Environmental Technologies, Corp., February 29, 1996, Final Site‐Wide Storm Water Management Plan, Princeton Plasma Physics Laboratory, James Forrestal Campus, Plainsboro Township, Middlesex County, New Jersey.
Sh00 Sheneman, R., May 2000, Princeton Plasma Physics Laboratory ‐‐ Remedial Action Work Plan.
Sh01 Sheneman, R., August 2001, Princeton Plasma Physics Laboratory Remedial Action Monitoring Report.
Sh03 Sheneman, R., July 2003, Princeton Plasma Physics Laboratory ‐ Remedial Action Monitoring Report.
Sh06 Sheneman, R., July 2006, Princeton Plasma Physics Laboratory ‐ Remedial Action Monitoring Report.
Sh07 Sheneman, R., July 2007, Princeton Plasma Physics Laboratory ‐ Remedial Action Monitoring Report.
Page 66 Chapter 8 ‐ References
Sh08 Sheneman, R., July 2008, Princeton Plasma Physics Laboratory ‐ Remedial Action Monitoring Report.
Sh09 Sheneman, R., July 2009, Princeton Plasma Physics Laboratory ‐ Remedial Action Monitoring Report.
Sh10‐13 Sheneman, R., 2010‐2013, Princeton Plasma Physics Laboratory ‐ Remedial Action
Monitoring Report. Sla14 Slavin, W., 2014, No continuous releases, person communication.
SM12 American Public Health Association, American Water Works Association, and
Water Environment Federation, 2012 (22nd edition),
Standard Methods for the Examination of Water and Wastewater.
Stra13 Strauss, D., 2013, NEPA Statistics for 2012, personal communication.
UL11 UL‐DQS, Inc., 2011 « Stage 2 Report Initial ISO 14001:2004 Evaluation of PPPL’s International Standard Organization (ISO) – Environmental Management System.”
US13 US Census Bureau Statistics, 2013 Census Data for the State of New Jersey, http://www.census.gov/census2000/states/nj.html
Vo82 Volchok, H. L., and de Planque, G., 1982, EML Procedures Manual HASL 300, Department of Energy, Environmental Measurements Laboratory, 376 Hudson
St., NY, NY 10014.
Chapter 8 ‐ References Page 67
Chapter
9 ACKNOWLEDGMENTS Engineering and Infrastructure Department:
Fran Cargill and Matt Lawson – transportation/vehicle fuel use
Margaret Kevin‐King ‐ fertilizer, herbicide, and pesticide data and municipal solid waste
and recycling data
Ana Pinto – energy and water‐utilization data
Jules Nemeth – boiler fuel use, run time, and test data
Information Services Division:
Elle Starkman ‐ Photos of NSTX and photos from the “PPPL Hotline”
Kitta MacPherson – “PPPL Weekly” articles
Quality Assurance Division: Connie Cummings – audit status
Environment, Safety & Health Department: Jerry Levine ‐ NEPA data and safety statistics
Industrial Safety Division: Bill Slavin ‐ SARA Title III and Toxic Release Inventory information
Health Physics Division: George Ascione ‐ radiological and calibration data
Patti Bruno ‐ in‐house radiochemical and water analyses
Environmental Services Division: Mark Hughes – cover design, acronym list, introduction chapter
Leanna Meyer –non‐radiological programs, groundwater and quality assurance chapters
Maria Pueyo – RCRA, TSCA, SPCC and radiological waste data
Keith Rule – radiological program chapter and dose calculations
Rob Sheneman ‐ ground water data, environmental management system/ISO chapter
This work is supported by the U.S. Department of Energy Contract No. DE‐AC02‐09CH11466.
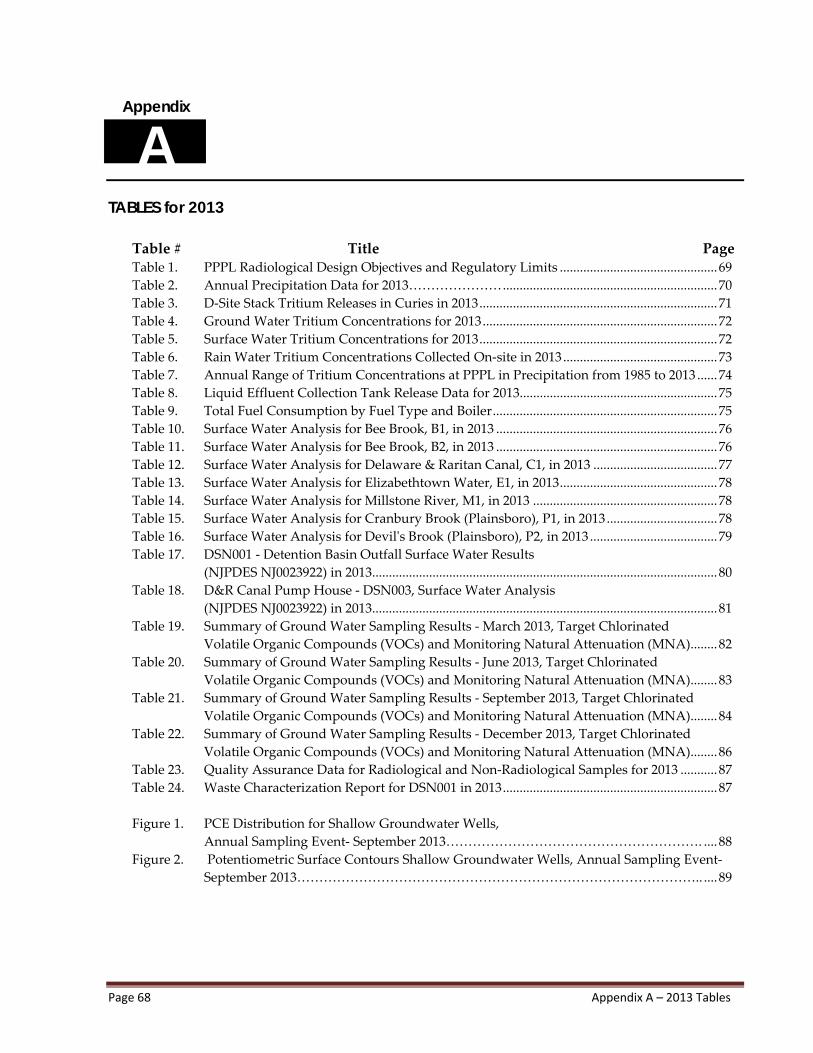
Page 68 Appendix A – 2013 Tables
Appendix
A TABLES for 2013
Table # Title Page Table 1. PPPL Radiological Design Objectives and Regulatory Limits ............................................... 69
Table 2. Annual Precipitation Data for 2013………………… ................................................................ 70
Table 3. D‐Site Stack Tritium Releases in Curies in 2013 ....................................................................... 71
Table 4. Ground Water Tritium Concentrations for 2013 ...................................................................... 72
Table 5. Surface Water Tritium Concentrations for 2013 ....................................................................... 72
Table 6. Rain Water Tritium Concentrations Collected On‐site in 2013 .............................................. 73
Table 7. Annual Range of Tritium Concentrations at PPPL in Precipitation from 1985 to 2013 ...... 74
Table 8. Liquid Effluent Collection Tank Release Data for 2013........................................................... 75
Table 9. Total Fuel Consumption by Fuel Type and Boiler ................................................................... 75
Table 10. Surface Water Analysis for Bee Brook, B1, in 2013 .................................................................. 76
Table 11. Surface Water Analysis for Bee Brook, B2, in 2013 .................................................................. 76
Table 12. Surface Water Analysis for Delaware & Raritan Canal, C1, in 2013 ..................................... 77
Table 13. Surface Water Analysis for Elizabethtown Water, E1, in 2013 ............................................... 78
Table 14. Surface Water Analysis for Millstone River, M1, in 2013 ....................................................... 78
Table 15. Surface Water Analysis for Cranbury Brook (Plainsboro), P1, in 2013 ................................. 78
Table 16. Surface Water Analysis for Devilʹs Brook (Plainsboro), P2, in 2013 ...................................... 79
Table 17. DSN001 ‐ Detention Basin Outfall Surface Water Results
(NJPDES NJ0023922) in 2013 ....................................................................................................... 80
Table 18. D&R Canal Pump House ‐ DSN003, Surface Water Analysis
(NJPDES NJ0023922) in 2013 ....................................................................................................... 81
Table 19. Summary of Ground Water Sampling Results ‐ March 2013, Target Chlorinated
Volatile Organic Compounds (VOCs) and Monitoring Natural Attenuation (MNA) ........ 82
Table 20. Summary of Ground Water Sampling Results ‐ June 2013, Target Chlorinated
Volatile Organic Compounds (VOCs) and Monitoring Natural Attenuation (MNA) ........ 83
Table 21. Summary of Ground Water Sampling Results ‐ September 2013, Target Chlorinated
Volatile Organic Compounds (VOCs) and Monitoring Natural Attenuation (MNA) ........ 84
Table 22. Summary of Ground Water Sampling Results ‐ December 2013, Target Chlorinated
Volatile Organic Compounds (VOCs) and Monitoring Natural Attenuation (MNA) ........ 86
Table 23. Quality Assurance Data for Radiological and Non‐Radiological Samples for 2013 ........... 87
Table 24. Waste Characterization Report for DSN001 in 2013 ................................................................ 87
Figure 1. PCE Distribution for Shallow Groundwater Wells,
Annual Sampling Event‐ September 2013…………………………………………………. .... 88
Figure 2. Potentiometric Surface Contours Shallow Groundwater Wells, Annual Sampling Event‐
September 2013……………………………………………………………………………….. .... 89
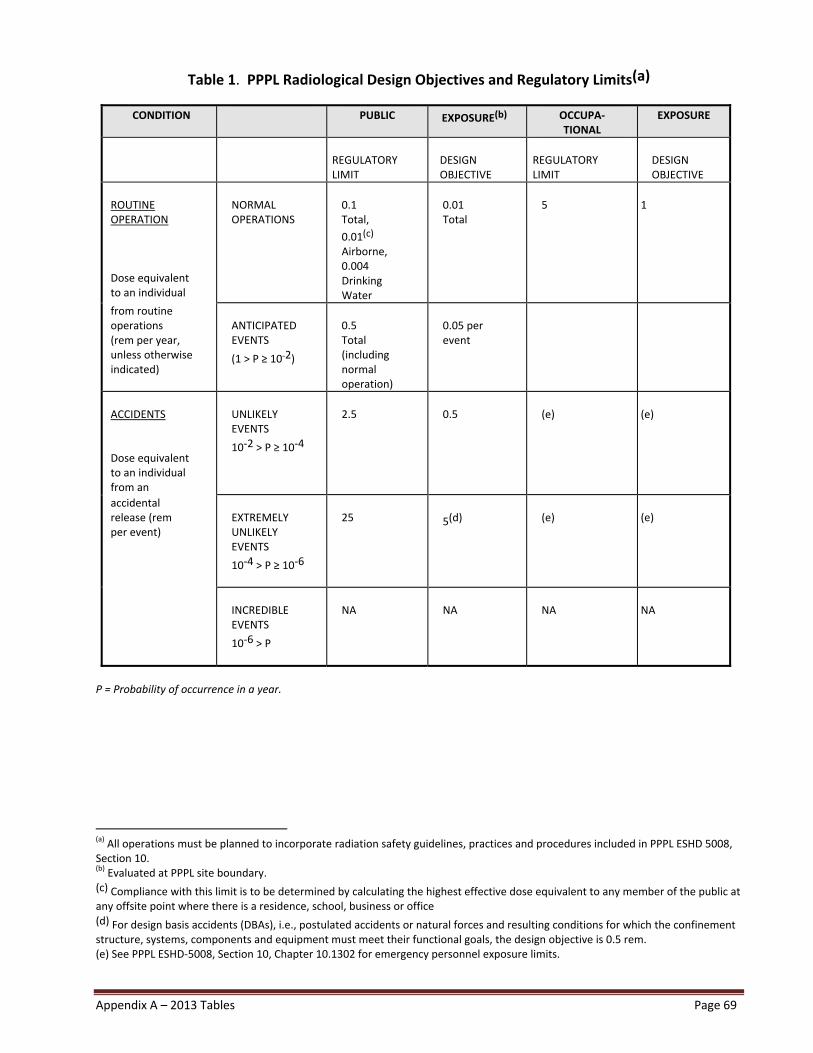
Appendix A – 2013 Tables Page 69
Table 1. PPPL Radiological Design Objectives and Regulatory Limits(a)
CONDITION PUBLIC EXPOSURE(b) OCCUPA‐
TIONAL EXPOSURE
REGULATORY LIMIT
DESIGN OBJECTIVE
REGULATORY LIMIT
DESIGN OBJECTIVE
ROUTINE OPERATION Dose equivalent to an individual
NORMAL OPERATIONS
0.1 Total,
0.01(c) Airborne, 0.004 Drinking Water
0.01 Total
5
1
from routine operations (rem per year, unless otherwise indicated)
ANTICIPATED EVENTS
(1 > P ≥ 10‐2)
0.5 Total (including normal operation)
0.05 per event
ACCIDENTS Dose equivalent to an individual from an
UNLIKELY EVENTS
10‐2 > P ≥ 10‐4
2.5
0.5
(e)
(e)
accidental release (rem per event)
EXTREMELY UNLIKELY EVENTS
10‐4 > P ≥ 10‐6
25
5(d)
(e)
(e)
INCREDIBLE EVENTS
10‐6 > P
NA
NA
NA
NA
P = Probability of occurrence in a year.
(a) All operations must be planned to incorporate radiation safety guidelines, practices and procedures included in PPPL ESHD 5008, Section 10. (b) Evaluated at PPPL site boundary. (c) Compliance with this limit is to be determined by calculating the highest effective dose equivalent to any member of the public at any offsite point where there is a residence, school, business or office (d) For design basis accidents (DBAs), i.e., postulated accidents or natural forces and resulting conditions for which the confinement structure, systems, components and equipment must meet their functional goals, the design objective is 0.5 rem. (e) See PPPL ESHD‐5008, Section 10, Chapter 10.1302 for emergency personnel exposure limits.
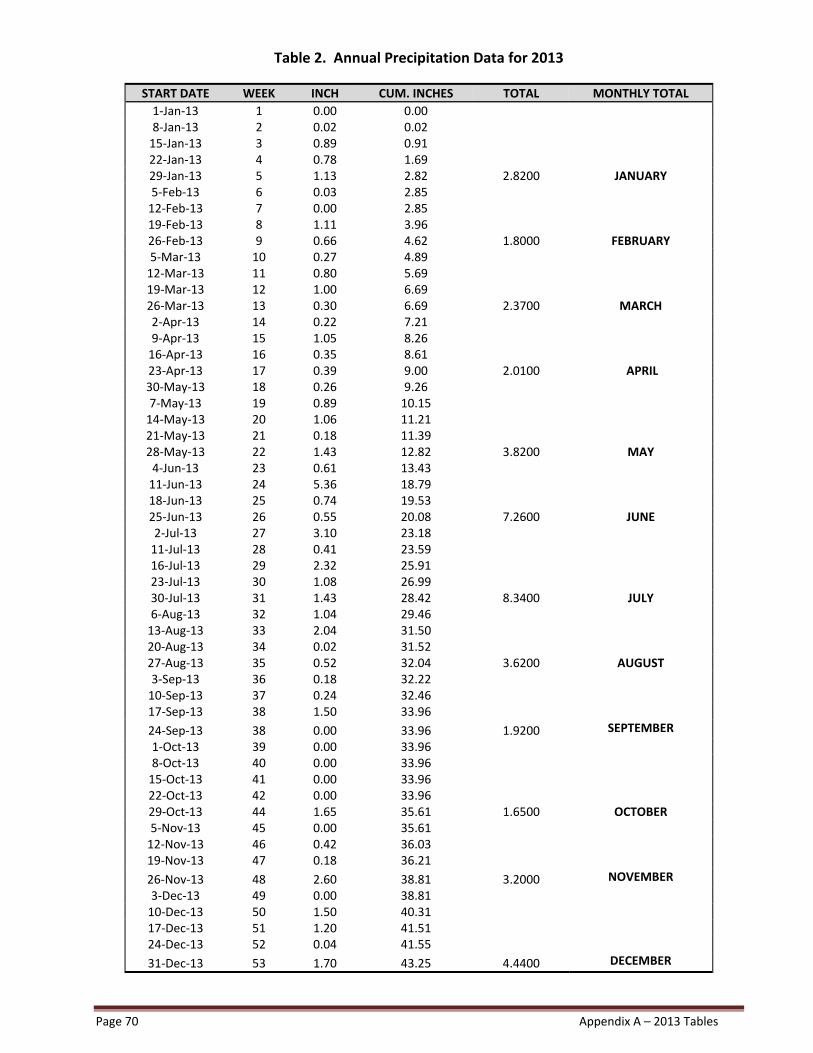
Page 70 Appendix A – 2013 Tables
Table 2. Annual Precipitation Data for 2013
START DATE WEEK INCH CUM. INCHES TOTAL MONTHLY TOTAL
1‐Jan‐13 1 0.00 0.00 8‐Jan‐13 2 0.02 0.02 15‐Jan‐13 3 0.89 0.91 22‐Jan‐13 4 0.78 1.69 29‐Jan‐13 5 1.13 2.82 2.8200 JANUARY5‐Feb‐13 6 0.03 2.85 12‐Feb‐13 7 0.00 2.85 19‐Feb‐13 8 1.11 3.96 26‐Feb‐13 9 0.66 4.62 1.8000 FEBRUARY5‐Mar‐13 10 0.27 4.89 12‐Mar‐13 11 0.80 5.69 19‐Mar‐13 12 1.00 6.69 26‐Mar‐13 13 0.30 6.69 2.3700 MARCH2‐Apr‐13 14 0.22 7.21 9‐Apr‐13 15 1.05 8.26 16‐Apr‐13 16 0.35 8.61 23‐Apr‐13 17 0.39 9.00 2.0100 APRIL30‐May‐13 18 0.26 9.26 7‐May‐13 19 0.89 10.15 14‐May‐13 20 1.06 11.21 21‐May‐13 21 0.18 11.39 28‐May‐13 22 1.43 12.82 3.8200 MAY4‐Jun‐13 23 0.61 13.43 11‐Jun‐13 24 5.36 18.79 18‐Jun‐13 25 0.74 19.53 25‐Jun‐13 26 0.55 20.08 7.2600 JUNE2‐Jul‐13 27 3.10 23.18 11‐Jul‐13 28 0.41 23.59 16‐Jul‐13 29 2.32 25.91 23‐Jul‐13 30 1.08 26.99 30‐Jul‐13 31 1.43 28.42 8.3400 JULY 6‐Aug‐13 32 1.04 29.46 13‐Aug‐13 33 2.04 31.50 20‐Aug‐13 34 0.02 31.52 27‐Aug‐13 35 0.52 32.04 3.6200 AUGUST3‐Sep‐13 36 0.18 32.22 10‐Sep‐13 37 0.24 32.46 17‐Sep‐13 38 1.50 33.96
24‐Sep‐13 38 0.00 33.96 1.9200 SEPTEMBER
1‐Oct‐13 39 0.00 33.96 8‐Oct‐13 40 0.00 33.96 15‐Oct‐13 41 0.00 33.96 22‐Oct‐13 42 0.00 33.96 29‐Oct‐13 44 1.65 35.61 1.6500 OCTOBER5‐Nov‐13 45 0.00 35.61 12‐Nov‐13 46 0.42 36.03 19‐Nov‐13 47 0.18 36.21
26‐Nov‐13 48 2.60 38.81 3.2000 NOVEMBER
3‐Dec‐13 49 0.00 38.81 10‐Dec‐13 50 1.50 40.31 17‐Dec‐13 51 1.20 41.51 24‐Dec‐13 52 0.04 41.55
31‐Dec‐13 53 1.70 43.25 4.4400 DECEMBER
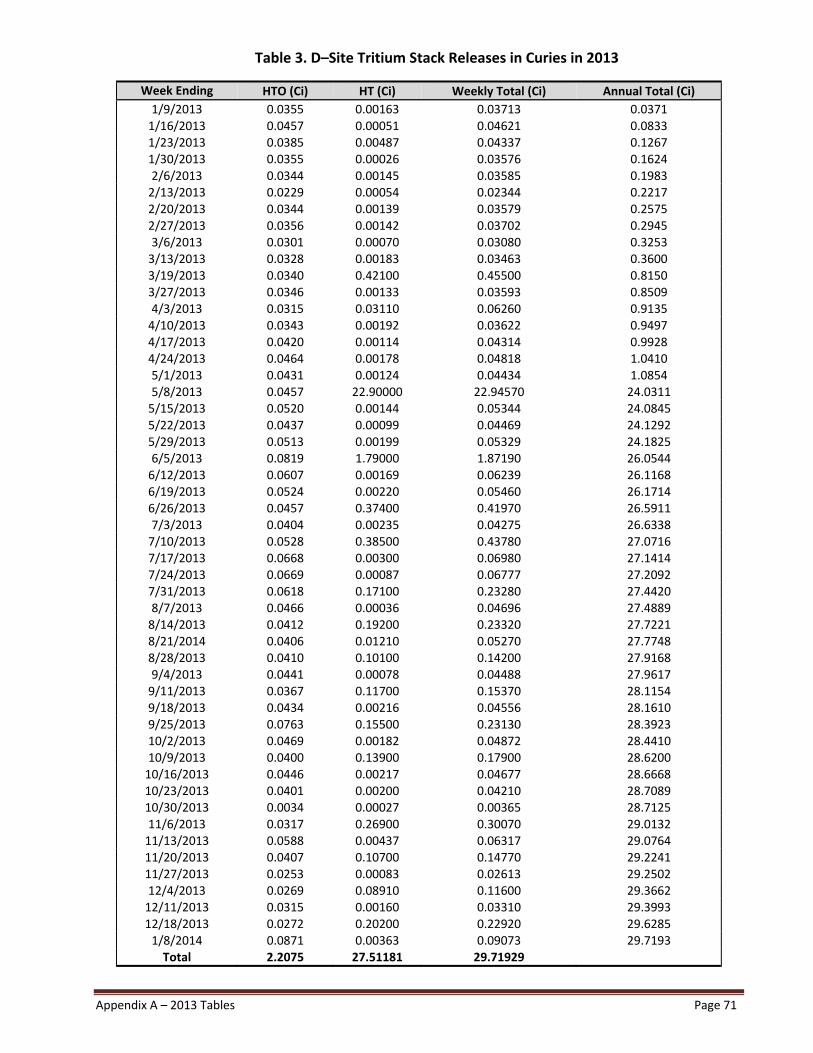
Appendix A – 2013 Tables Page 71
Table 3. D–Site Tritium Stack Releases in Curies in 2013
Week Ending HTO (Ci) HT (Ci) Weekly Total (Ci) Annual Total (Ci)
1/9/2013 0.0355 0.00163 0.03713 0.0371
1/16/2013 0.0457 0.00051 0.04621 0.0833 1/23/2013 0.0385 0.00487 0.04337 0.1267 1/30/2013 0.0355 0.00026 0.03576 0.1624
2/6/2013 0.0344 0.00145 0.03585 0.1983 2/13/2013 0.0229 0.00054 0.02344 0.2217 2/20/2013 0.0344 0.00139 0.03579 0.2575
2/27/2013 0.0356 0.00142 0.03702 0.2945 3/6/2013 0.0301 0.00070 0.03080 0.3253 3/13/2013 0.0328 0.00183 0.03463 0.3600
3/19/2013 0.0340 0.42100 0.45500 0.8150 3/27/2013 0.0346 0.00133 0.03593 0.8509 4/3/2013 0.0315 0.03110 0.06260 0.9135
4/10/2013 0.0343 0.00192 0.03622 0.9497 4/17/2013 0.0420 0.00114 0.04314 0.9928 4/24/2013 0.0464 0.00178 0.04818 1.0410
5/1/2013 0.0431 0.00124 0.04434 1.0854 5/8/2013 0.0457 22.90000 22.94570 24.0311 5/15/2013 0.0520 0.00144 0.05344 24.0845
5/22/2013 0.0437 0.00099 0.04469 24.1292 5/29/2013 0.0513 0.00199 0.05329 24.1825 6/5/2013 0.0819 1.79000 1.87190 26.0544
6/12/2013 0.0607 0.00169 0.06239 26.1168 6/19/2013 0.0524 0.00220 0.05460 26.1714 6/26/2013 0.0457 0.37400 0.41970 26.5911
7/3/2013 0.0404 0.00235 0.04275 26.6338 7/10/2013 0.0528 0.38500 0.43780 27.0716 7/17/2013 0.0668 0.00300 0.06980 27.1414
7/24/2013 0.0669 0.00087 0.06777 27.2092 7/31/2013 0.0618 0.17100 0.23280 27.4420 8/7/2013 0.0466 0.00036 0.04696 27.4889
8/14/2013 0.0412 0.19200 0.23320 27.7221 8/21/2014 0.0406 0.01210 0.05270 27.7748 8/28/2013 0.0410 0.10100 0.14200 27.9168
9/4/2013 0.0441 0.00078 0.04488 27.9617 9/11/2013 0.0367 0.11700 0.15370 28.1154 9/18/2013 0.0434 0.00216 0.04556 28.1610
9/25/2013 0.0763 0.15500 0.23130 28.3923 10/2/2013 0.0469 0.00182 0.04872 28.4410 10/9/2013 0.0400 0.13900 0.17900 28.6200
10/16/2013 0.0446 0.00217 0.04677 28.6668 10/23/2013 0.0401 0.00200 0.04210 28.7089 10/30/2013 0.0034 0.00027 0.00365 28.7125
11/6/2013 0.0317 0.26900 0.30070 29.0132 11/13/2013 0.0588 0.00437 0.06317 29.0764 11/20/2013 0.0407 0.10700 0.14770 29.2241
11/27/2013 0.0253 0.00083 0.02613 29.2502 12/4/2013 0.0269 0.08910 0.11600 29.3662 12/11/2013 0.0315 0.00160 0.03310 29.3993
12/18/2013 0.0272 0.20200 0.22920 29.6285 1/8/2014 0.0871 0.00363 0.09073 29.7193 Total 2.2075 27.51181 29.71929
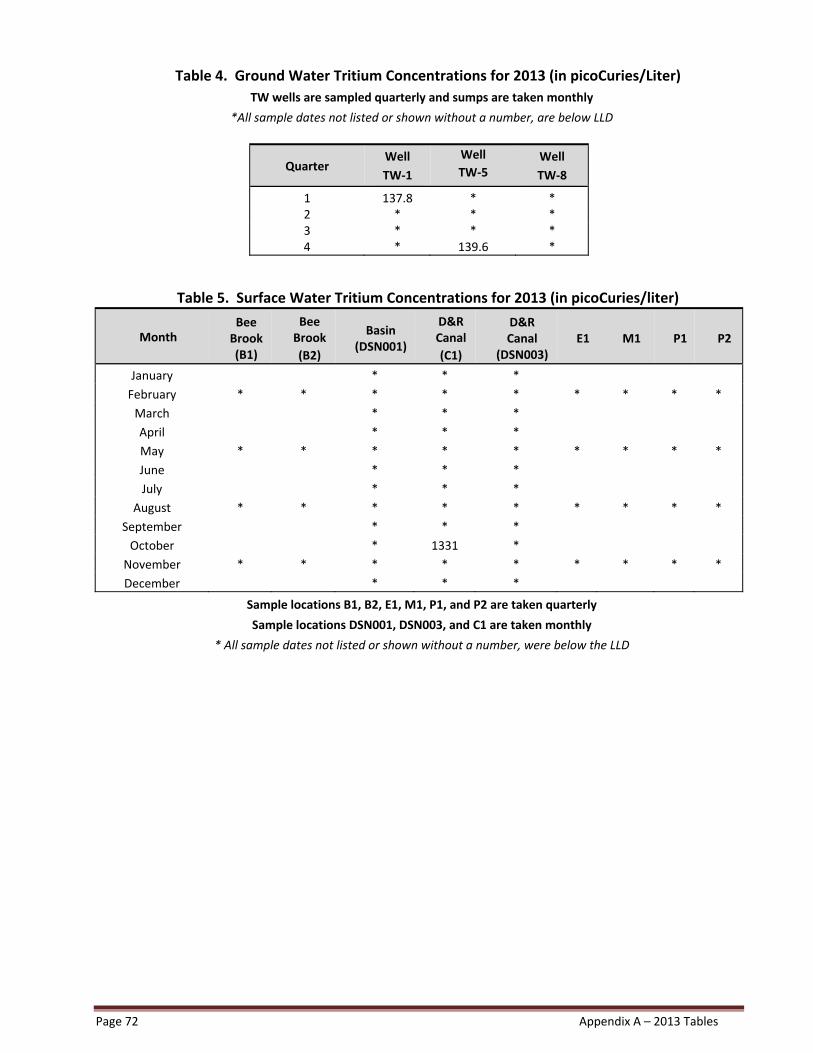
Page 72 Appendix A – 2013 Tables
Table 4. Ground Water Tritium Concentrations for 2013 (in picoCuries/Liter)
TW wells are sampled quarterly and sumps are taken monthly
*All sample dates not listed or shown without a number, are below LLD
Table 5. Surface Water Tritium Concentrations for 2013 (in picoCuries/liter)
Month Bee Brook (B1)
Bee Brook
(B2)
Basin (DSN001)
D&R Canal
(C1)
D&R Canal
(DSN003) E1 M1 P1 P2
January * * *
February * * * * * * * * *
March * * *
April * * *
May * * * * * * * * *
June * * *
July * * *
August * * * * * * * * *
September * * *
October * 1331 *
November * * * * * * * * *
December * * *
Sample locations B1, B2, E1, M1, P1, and P2 are taken quarterly
Sample locations DSN001, DSN003, and C1 are taken monthly
* All sample dates not listed or shown without a number, were below the LLD
Quarter Well
TW‐1
Well
TW‐5 Well
TW‐8
1 137.8 * * 2 * * *3 4
**
*139.6
**
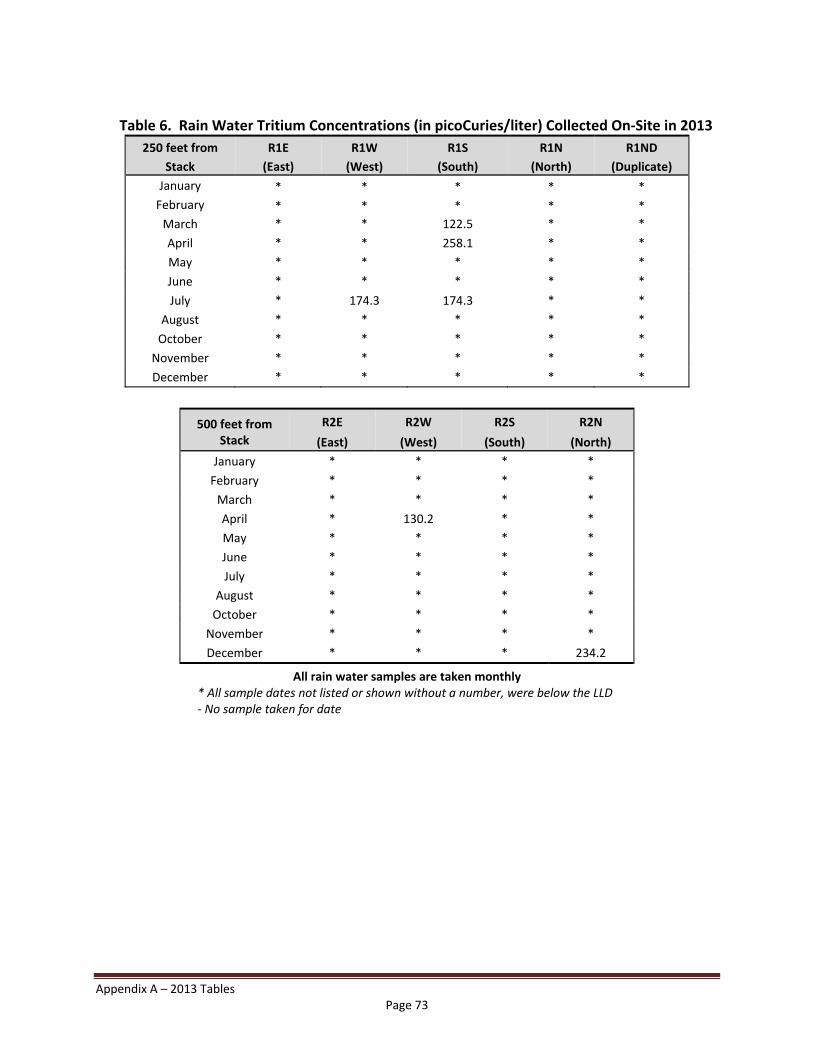
Appendix A – 2013 Tables Page 73
Table 6. Rain Water Tritium Concentrations (in picoCuries/liter) Collected On‐Site in 2013
250 feet from
Stack
R1E
(East)
R1W
(West)
R1S
(South)
R1N
(North)
R1ND
(Duplicate)
January * * * * *
February * * * * *
March * * 122.5 * *
April * * 258.1 * *
May * * * * *
June * * * * *
July * 174.3 174.3 * *
August * * * * *
October * * * * *
November * * * * *
December * * * * *
500 feet from Stack
R2E
(East)
R2W
(West)
R2S
(South)
R2N
(North)
January * * * *
February * * * *
March * * * *
April * 130.2 * *
May * * * *
June * * * *
July * * * *
August * * * *
October * * * *
November * * * *
December * * * 234.2
All rain water samples are taken monthly * All sample dates not listed or shown without a number, were below the LLD ‐ No sample taken for date
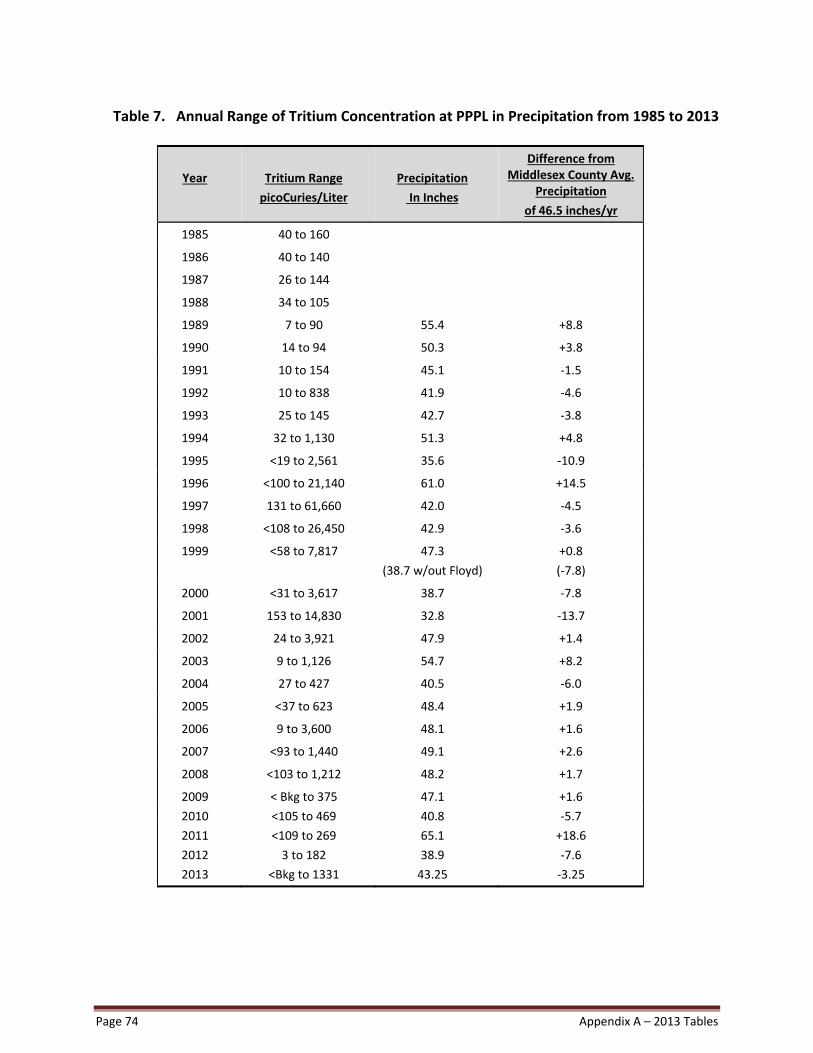
Page 74 Appendix A – 2013 Tables
Table 7. Annual Range of Tritium Concentration at PPPL in Precipitation from 1985 to 2013
Year
Tritium Range
picoCuries/Liter
Precipitation
In Inches
Difference from Middlesex County Avg.
Precipitation
of 46.5 inches/yr
1985 40 to 160
1986 40 to 140
1987 26 to 144
1988 34 to 105
1989 7 to 90 55.4 +8.8
1990 14 to 94 50.3 +3.8
1991 10 to 154 45.1 ‐1.5
1992 10 to 838 41.9 ‐4.6
1993 25 to 145 42.7 ‐3.8
1994 32 to 1,130 51.3 +4.8
1995 <19 to 2,561 35.6 ‐10.9
1996 <100 to 21,140 61.0 +14.5
1997 131 to 61,660 42.0 ‐4.5
1998 <108 to 26,450 42.9 ‐3.6
1999 <58 to 7,817 47.3
(38.7 w/out Floyd)
+0.8
(‐7.8)
2000 <31 to 3,617 38.7 ‐7.8
2001 153 to 14,830 32.8 ‐13.7
2002 24 to 3,921 47.9 +1.4
2003 9 to 1,126 54.7 +8.2
2004 27 to 427 40.5 ‐6.0
2005 <37 to 623 48.4 +1.9
2006 9 to 3,600 48.1 +1.6
2007 <93 to 1,440 49.1 +2.6
2008 <103 to 1,212 48.2 +1.7
2009 < Bkg to 375 47.1 +1.6
2010 <105 to 469 40.8 ‐5.7
2011
2012
2013
<109 to 269
3 to 182
<Bkg to 1331
65.1
38.9
43.25
+18.6
‐7.6
‐3.25
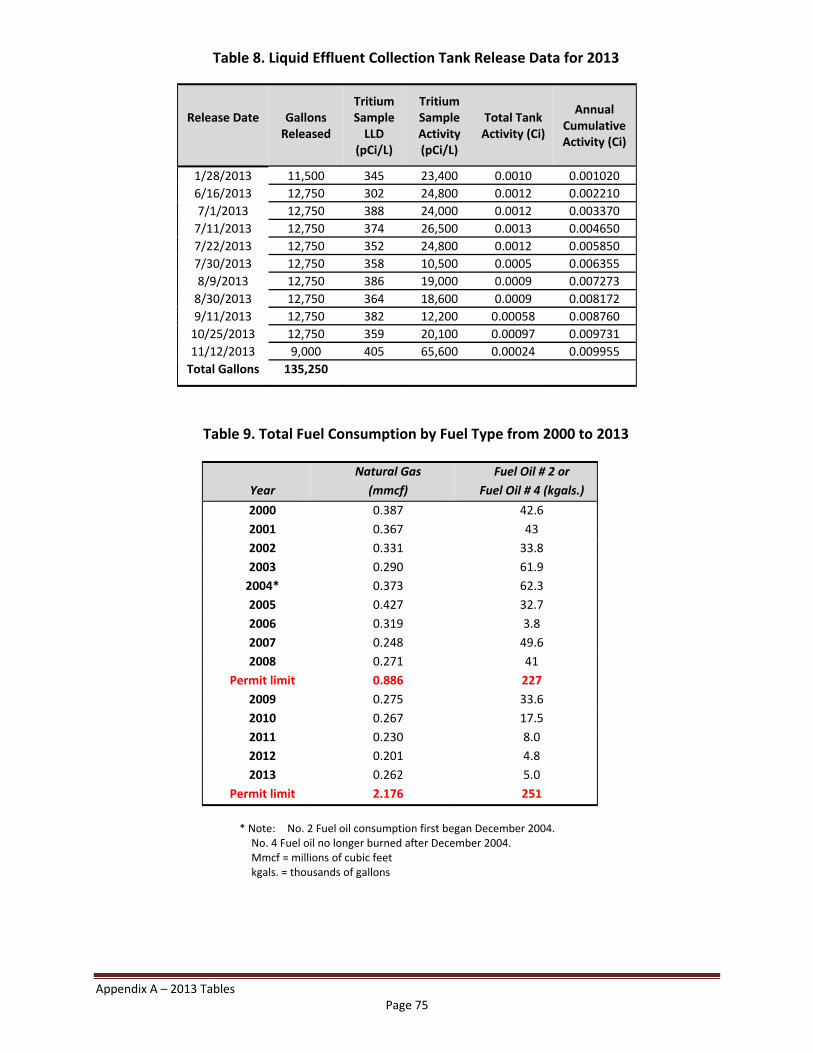
Appendix A – 2013 Tables Page 75
Table 8. Liquid Effluent Collection Tank Release Data for 2013
Release Date
Gallons Released
Tritium Sample LLD
(pCi/L)
Tritium Sample Activity (pCi/L)
Total Tank Activity (Ci)
Annual Cumulative Activity (Ci)
1/28/2013 11,500 345 23,400 0.0010 0.001020
6/16/2013 12,750 302 24,800 0.0012 0.002210
7/1/2013 12,750 388 24,000 0.0012 0.003370
7/11/2013 12,750 374 26,500 0.0013 0.004650
7/22/2013 12,750 352 24,800 0.0012 0.005850
7/30/2013 12,750 358 10,500 0.0005 0.006355
8/9/2013 12,750 386 19,000 0.0009 0.007273
8/30/2013 12,750 364 18,600 0.0009 0.008172
9/11/2013 12,750 382 12,200 0.00058 0.008760
10/25/2013 12,750 359 20,100 0.00097 0.009731
11/12/2013 9,000 405 65,600 0.00024 0.009955
Total Gallons 135,250
Table 9. Total Fuel Consumption by Fuel Type from 2000 to 2013
Year
Natural Gas
(mmcf)
Fuel Oil # 2 or
Fuel Oil # 4 (kgals.)
2000 0.387 42.6
2001 0.367 43
2002 0.331 33.8
2003 0.290 61.9
2004* 0.373 62.3
2005 0.427 32.7
2006 0.319 3.8
2007 0.248 49.6
2008 0.271 41
Permit limit 0.886 227
2009 0.275 33.6
2010 0.267 17.5
2011
2012
0.230
0.201
8.0
4.8
2013 0.262 5.0
Permit limit 2.176 251
* Note: No. 2 Fuel oil consumption first began December 2004. No. 4 Fuel oil no longer burned after December 2004. Mmcf = millions of cubic feet kgals. = thousands of gallons
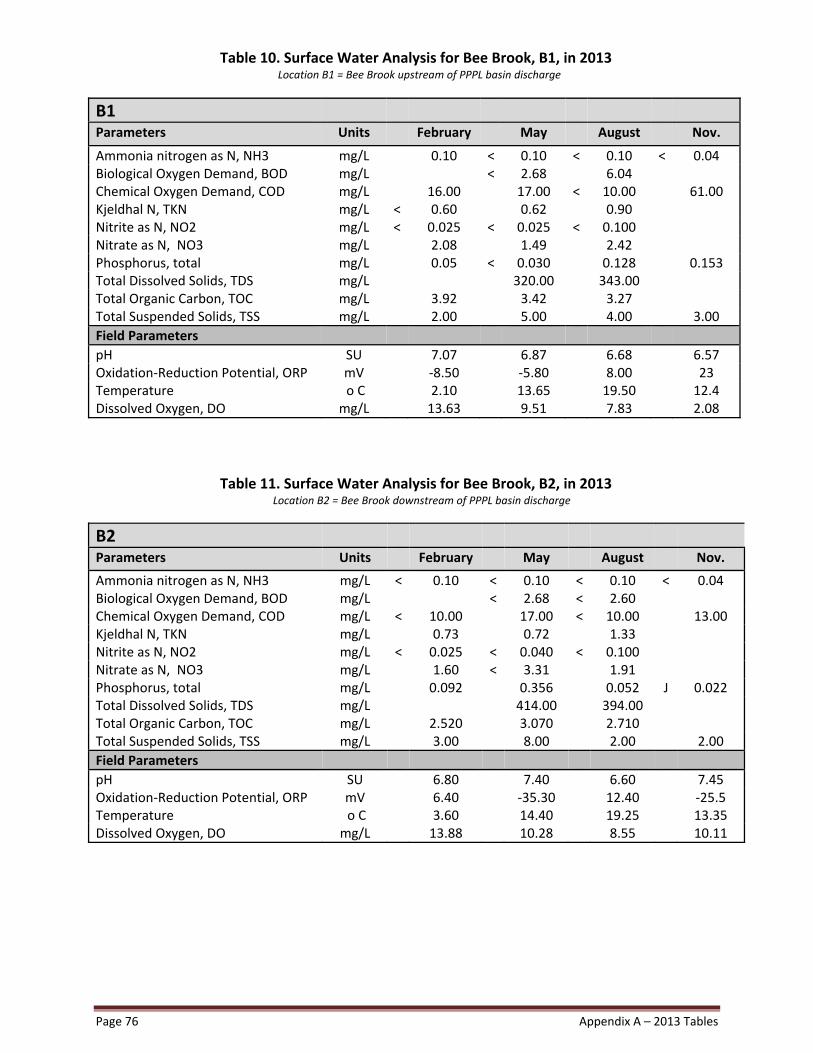
Page 76 Appendix A – 2013 Tables
Table 10. Surface Water Analysis for Bee Brook, B1, in 2013 Location B1 = Bee Brook upstream of PPPL basin discharge
B1
Parameters Units February May August Nov.
Ammonia nitrogen as N, NH3 mg/L 0.10 < 0.10 < 0.10 < 0.04 Biological Oxygen Demand, BOD mg/L < 2.68 6.04 Chemical Oxygen Demand, COD mg/L 16.00 17.00 < 10.00 61.00 Kjeldhal N, TKN mg/L < 0.60 0.62 0.90 Nitrite as N, NO2 mg/L < 0.025 < 0.025 < 0.100 Nitrate as N, NO3 mg/L 2.08 1.49 2.42 Phosphorus, total mg/L 0.05 < 0.030 0.128 0.153 Total Dissolved Solids, TDS mg/L 320.00 343.00 Total Organic Carbon, TOC mg/L 3.92 3.42 3.27 Total Suspended Solids, TSS mg/L 2.00 5.00 4.00 3.00
Field Parameters
pH SU 7.07 6.87 6.68 6.57 Oxidation‐Reduction Potential, ORP mV ‐8.50 ‐5.80 8.00 23 Temperature o C 2.10 13.65 19.50 12.4 Dissolved Oxygen, DO mg/L 13.63 9.51 7.83 2.08
Table 11. Surface Water Analysis for Bee Brook, B2, in 2013 Location B2 = Bee Brook downstream of PPPL basin discharge
B2
Parameters Units February May August Nov.
Ammonia nitrogen as N, NH3 mg/L < 0.10 < 0.10 < 0.10 < 0.04 Biological Oxygen Demand, BOD mg/L < 2.68 < 2.60 Chemical Oxygen Demand, COD mg/L < 10.00 17.00 < 10.00 13.00 Kjeldhal N, TKN mg/L 0.73 0.72 1.33 Nitrite as N, NO2 mg/L < 0.025 < 0.040 < 0.100 Nitrate as N, NO3 mg/L 1.60 < 3.31 1.91 Phosphorus, total mg/L 0.092 0.356 0.052 J 0.022 Total Dissolved Solids, TDS mg/L 414.00 394.00 Total Organic Carbon, TOC mg/L 2.520 3.070 2.710 Total Suspended Solids, TSS mg/L 3.00 8.00 2.00 2.00
Field Parameters
pH SU 6.80 7.40 6.60 7.45 Oxidation‐Reduction Potential, ORP mV 6.40 ‐35.30 12.40 ‐25.5 Temperature o C 3.60 14.40 19.25 13.35 Dissolved Oxygen, DO mg/L 13.88 10.28 8.55 10.11
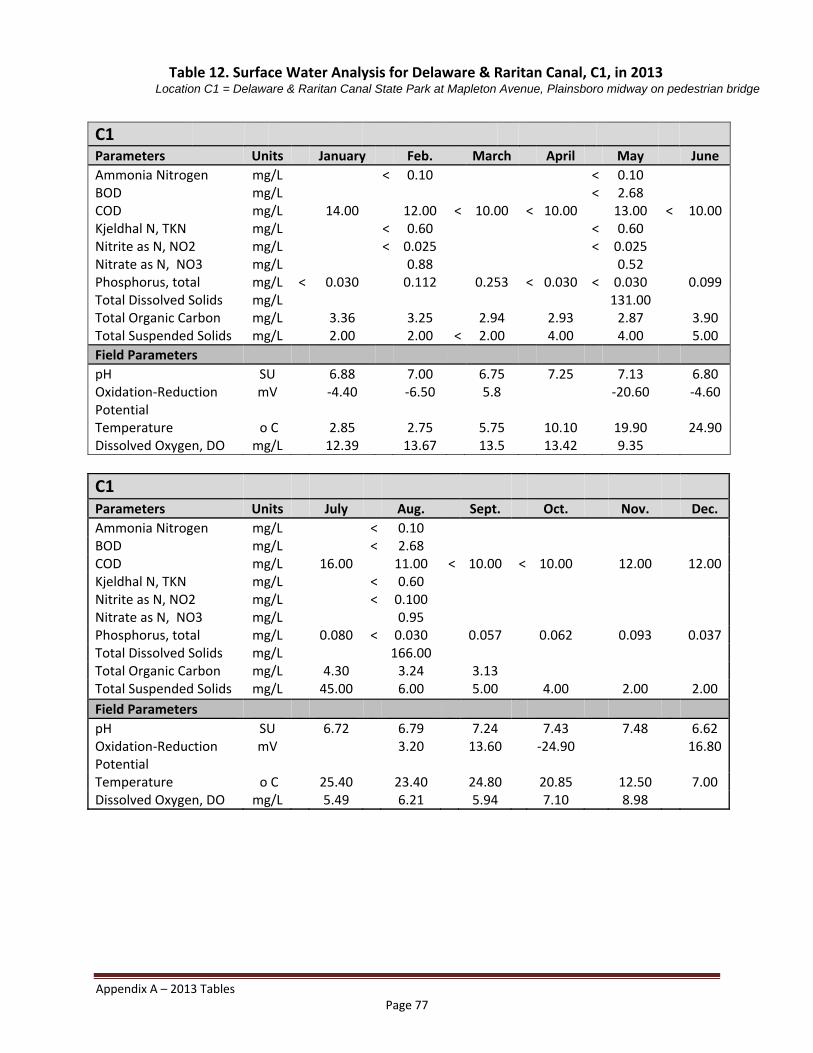
Appendix A – 2013 Tables Page 77
Table 12. Surface Water Analysis for Delaware & Raritan Canal, C1, in 2013 Location C1 = Delaware & Raritan Canal State Park at Mapleton Avenue, Plainsboro midway on pedestrian bridge
C1
Parameters Units January Feb. March April May June
Ammonia Nitrogen mg/L < 0.10 < 0.10 BOD mg/L < 2.68 COD mg/L 14.00 12.00 < 10.00 < 10.00 13.00 < 10.00 Kjeldhal N, TKN mg/L < 0.60 < 0.60 Nitrite as N, NO2 mg/L < 0.025 < 0.025 Nitrate as N, NO3 mg/L 0.88 0.52 Phosphorus, total mg/L < 0.030 0.112 0.253 < 0.030 < 0.030 0.099 Total Dissolved Solids mg/L 131.00 Total Organic Carbon mg/L 3.36 3.25 2.94 2.93 2.87 3.90 Total Suspended Solids mg/L 2.00 2.00 < 2.00 4.00 4.00 5.00
Field Parameters
pH SU 6.88 7.00 6.75 7.25 7.13 6.80 Oxidation‐Reduction Potential
mV ‐4.40 ‐6.50 5.8 ‐20.60 ‐4.60
Temperature o C 2.85 2.75 5.75 10.10 19.90 24.90 Dissolved Oxygen, DO mg/L 12.39 13.67 13.5 13.42 9.35
C1
Parameters Units July Aug. Sept. Oct. Nov. Dec.
Ammonia Nitrogen mg/L < 0.10 BOD mg/L < 2.68 COD mg/L 16.00 11.00 < 10.00 < 10.00 12.00 12.00Kjeldhal N, TKN mg/L < 0.60 Nitrite as N, NO2 mg/L < 0.100 Nitrate as N, NO3 mg/L 0.95 Phosphorus, total mg/L 0.080 < 0.030 0.057 0.062 0.093 0.037Total Dissolved Solids mg/L 166.00 Total Organic Carbon mg/L 4.30 3.24 3.13 Total Suspended Solids mg/L 45.00 6.00 5.00 4.00 2.00 2.00
Field Parameters
pH SU 6.72 6.79 7.24 7.43 7.48 6.62 Oxidation‐Reduction Potential
mV 3.20 13.60 ‐24.90 16.80
Temperature o C 25.40 23.40 24.80 20.85 12.50 7.00 Dissolved Oxygen, DO mg/L 5.49 6.21 5.94 7.10 8.98
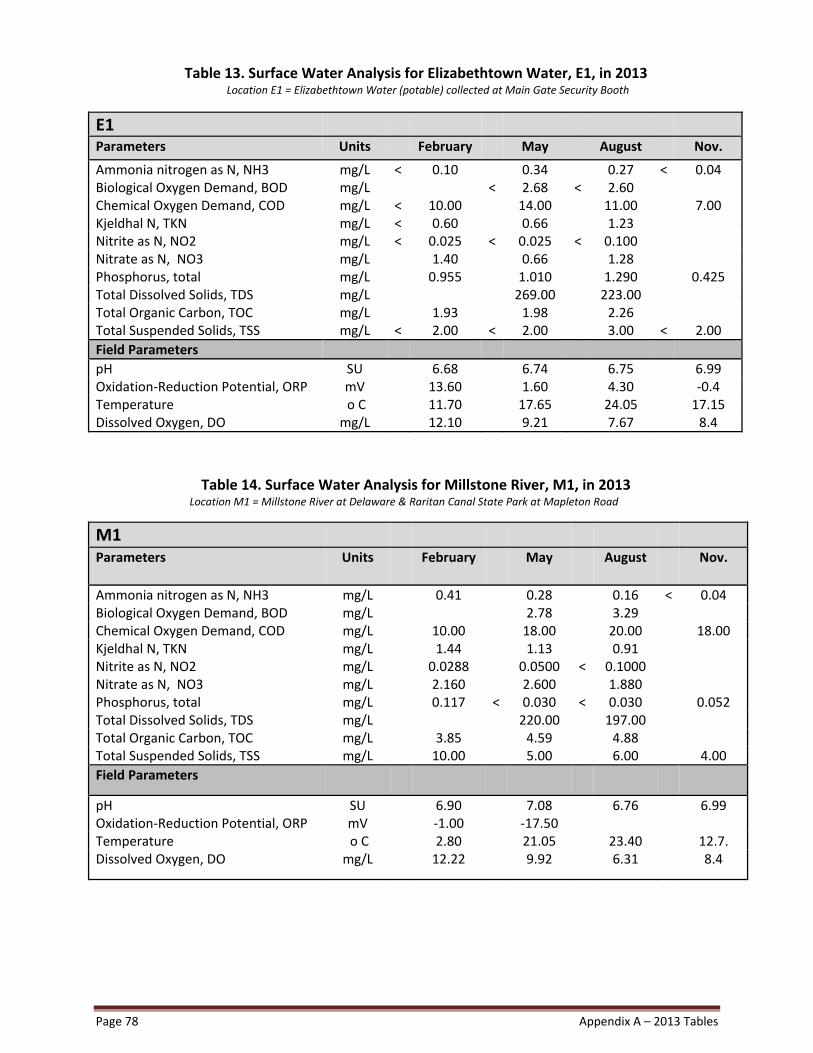
Page 78 Appendix A – 2013 Tables
Table 13. Surface Water Analysis for Elizabethtown Water, E1, in 2013
Location E1 = Elizabethtown Water (potable) collected at Main Gate Security Booth
E1
Parameters Units February May August Nov.
Ammonia nitrogen as N, NH3 mg/L < 0.10 0.34 0.27 < 0.04 Biological Oxygen Demand, BOD mg/L < 2.68 < 2.60 Chemical Oxygen Demand, COD mg/L < 10.00 14.00 11.00 7.00 Kjeldhal N, TKN mg/L < 0.60 0.66 1.23 Nitrite as N, NO2 mg/L < 0.025 < 0.025 < 0.100 Nitrate as N, NO3 mg/L 1.40 0.66 1.28 Phosphorus, total mg/L 0.955 1.010 1.290 0.425 Total Dissolved Solids, TDS mg/L 269.00 223.00 Total Organic Carbon, TOC mg/L 1.93 1.98 2.26 Total Suspended Solids, TSS mg/L < 2.00 < 2.00 3.00 < 2.00
Field Parameters
pH SU 6.68 6.74 6.75 6.99 Oxidation‐Reduction Potential, ORP mV 13.60 1.60 4.30 ‐0.4 Temperature o C 11.70 17.65 24.05 17.15 Dissolved Oxygen, DO mg/L 12.10 9.21 7.67 8.4
Table 14. Surface Water Analysis for Millstone River, M1, in 2013 Location M1 = Millstone River at Delaware & Raritan Canal State Park at Mapleton Road
M1
Parameters Units February May August Nov.
Ammonia nitrogen as N, NH3 mg/L 0.41 0.28 0.16 < 0.04 Biological Oxygen Demand, BOD mg/L 2.78 3.29 Chemical Oxygen Demand, COD mg/L 10.00 18.00 20.00 18.00 Kjeldhal N, TKN mg/L 1.44 1.13 0.91 Nitrite as N, NO2 mg/L 0.0288 0.0500 < 0.1000 Nitrate as N, NO3 mg/L 2.160 2.600 1.880 Phosphorus, total mg/L 0.117 < 0.030 < 0.030 0.052 Total Dissolved Solids, TDS mg/L 220.00 197.00 Total Organic Carbon, TOC mg/L 3.85 4.59 4.88 Total Suspended Solids, TSS mg/L 10.00 5.00 6.00 4.00
Field Parameters
pH SU 6.90 7.08 6.76 6.99 Oxidation‐Reduction Potential, ORP mV ‐1.00 ‐17.50 Temperature o C 2.80 21.05 23.40 12.7. Dissolved Oxygen, DO mg/L 12.22 9.92 6.31 8.4
Appendix A – 2013 Tables Page 79
Table 15. Surface Water Analysis for Cranbury Brook (Plainsboro), P1, in 2013 Location P1 = Cranbury Brook at George Davison Road, Plainsboro mid‐span on bridge southbound
P1
Parameters Units February May August Nov.
Ammonia nitrogen as N, NH3 mg/L 0.19 < 0.10 < 0.10 < 0.04 Biological Oxygen Demand, BOD mg/L < 2.68 < 2.60 Chemical Oxygen Demand, COD mg/L 19.00 30.00 13.00 11.00 Kjeldhal N, TKN mg/L 1.24 < 0.06 0.94 Nitrite as N, NO2 mg/L < 0.025 < 0.025 < 0.100 Nitrate as N, NO3 mg/L 1.650 2.050 1.240 Phosphorus, total mg/L 0.152 < 0.030 0.186 J 0.027 Total Dissolved Solids, TDS mg/L 131.00 154.00 Total Organic Carbon, TOC mg/L 4.02 9.30 5.43 Total Suspended Solids, TSS mg/L 17.00 7.00 4.00 3.00
Field Parameters
pH SU 6.94 6.74 6.55 6.42 Oxidation‐Reduction Potential, ORP mV ‐1.10 1.70 15.40 31.10 Temperature o C 4.10 17.00 23.20 12.75 Dissolved Oxygen, DO mg/L 11.16 7.25 5.57 5.55
Table 16. Surface Water Analysis for Devil’s Brook (Plainsboro), P2, in 2013
Location P2 = Devil’s Brook at Schalks Road overpass, adjacent to Amtrak railroad tracks
P2
Parameters Units February May August Nov.
Ammonia nitrogen as N, NH3 mg/L 0.14 < 0.10 < 0.10 7.46 Biological Oxygen Demand, BOD mg/L < 2.68 < 2.60 Chemical Oxygen Demand, COD mg/L 27.00 22.00 23.00 10.00 Kjeldhal N, TKN mg/L < 0.60 1.04 1.32 Nitrite as N, NO2 mg/L < 0.025 < 0.025 < 0.100 Nitrate as N, NO3 mg/L 1.22 2.18 2.150 Phosphorus, total mg/L 0.171 < 0.030 < 0.030 < 0.018 Total Dissolved Solids, TDS mg/L 166.00 149.00 Total Organic Carbon, TOC mg/L 7.13 4.42 8.38 Total Suspended Solids, TSS mg/L 5.00 14.00 4.00 < 2.00
Field Parameters
pH SU 6.91 6.91 6.67 6.44 Oxidation‐Reduction Potential, ORP mV Temperature o C 3.50 15.45 21.50 13.15 Dissolved Oxygen, DO mg/L 11.79 9.15 6.68 4.81
Page 80 Appendix A – 2013 Tables
Table 17. DSN001 – Retention Basin Outfall Surface Water Analysis (NJPDES NJ0023922) in 2013
DSN001
Parameters Units January Feb. March April May June
Ammonia nitrogen as N, NH3 mg/L < 0.10 < 0.10 Biological Oxygen Demand, BOD mg/L < 2.68 Chemical Oxygen Demand, COD mg/L 12.00 10.00 < 10.00 < 10.00 17.00 < 10.00 Kjeldhal N, TKN mg/L < 0.60 1.02 Nitrogen, total mg/L 1.83 5.96 Nitrite as N, NO2 mg/L 0.028 0.088 Nitrate as N, NO3 mg/L 1.25 4.85 Phosphorus, total mg/L 0.052 0.132 0.322 < 0.030 0.742 0.050 Tetrachloroethylene, PCE ug/L < 0.31 J 0.37 < 0.31 < 0.31 J 0.48 J 0.43 Total Petroleum Hydrocarbon mg/L < 5.00 < 5.00 < 5.00 < 5.00 < 5.00 < 5.00 Total Dissolved Solids, TDS mg/L 474.00 Total Organic Carbon, TOC mg/L 2.330 1.160 1.020 1.270 2.560 3.110 Total Suspended Solids, TSS mg/L < 2.00 2.00 2.00 5.00 5.00 8.00
Field Parameters
Chlorine Produced Oxidants, CPO mg/L < 0.10 < 0.10 < 0.10 < 0.10 < 0.10 < 0.10 pH SU 7.42 7.16 6.67 7.75 6.97 6.90 Oxidation‐Reduction Potential, mV ‐33.60 ‐137 10.80 ‐11.60 ‐10.60 Temperature o C 8.55 7.15 10.6 10.50 16.20 18.45 Dissolved Oxygen, DO mg/L 11.14 11.00 12.52 13.32 10.40 8.90
DSN001
Parameters Units July August Sept. Oct. Nov. Dec.
Ammonia nitrogen as N, NH3 mg/L < 0.1 Biological Oxygen Demand, BOD mg/L 3.86 Chemical Oxygen Demand, COD mg/L < 10.00 17.00 < 10.00 < 10.00 < 10.00 8.00 Kjeldhal N, TKN mg/L 0.65 Nitrogen, total mg/L 1.96 Nitrite as N, NO2 mg/L < 0.100 Nitrate as N, NO3 mg/L 1.26 Phosphorus, total mg/L 0.041 0.049 0.057 < 0.030 0.032 0.037 Tetrachloroethylene, PCE ug/L < 0.31 <
0.17 <
0.13 < 0.11 < 0.13 J 0.26
Total Petroleum Hydrocarbon, TPHC mg/L < 5.00 < 5.00 < 5.00 < 5.00 < 1.89 < 1.89 Total Dissolved Solids, TDS mg/L 389.00 Total Organic Carbon, TOC mg/L 2.720 2.500 1.650 Total Suspended Solids, TSS mg/L 4.00 4.00 5.00 6.00 8.00 4.00
Field Parameters
Chlorine Produced Oxidants, CPO mg/L < 0.10 0.11 < 0.10 < 0.10 < 0.10 < 0.10 pH SU 6.90 6.76 8.08 8.36 8.19 8.03 Oxidation‐Reduction Potential, ORP mV 16.00 3.90 ‐61.20 ‐77.10 ‐66.70 ‐52.90 Temperature o C 20.25 18.65 18.60 17.70 13.40 9.55 Dissolved Oxygen, DO mg/L 8.52 8.97 8.91 9.81 9.32 10.71
Appendix A – 2013 Tables Page 81
Table 18. D&R Canal Pump House – DSN003 Monthly Surface Water Analysis (NJPDES NJ0023922) in 2013
DSN003
Parameters Units January Feb. March April May June
Ammonia nitrogen as N, NH3 mg/L < 0.10 < 0.10 Biological Oxygen Demand mg/L < 2.68 Chemical Oxygen Demand mg/L < 10.00 16.00 13.00 10.00 12.00 13.00Kjeldhal N, TKN mg/L < 0.60 < 0.60 Nitrite as N, NO2 mg/L < 0.025 < 0.025 Nitrate as N, NO3 mg/L 0.820 0.515 Phosphorus, total mg/L 0.03 0.087 0.311 0.030 < 0.030 0.139Total Petroleum Hydrocarbon mg/L < 5.00 < 5.00 < 5.00 < 5.00 < 5.00 < 5.00 Total Dissolved Solids, TDS mg/L 140.00 Total Organic Carbon, TOC mg/L 2.88 3.59 3.94 2.72 2.86 3.54 Total Suspended Solids, TSS mg/L 2.00 6.00 4.00 3.00 6.00 6.00
Field Parameters
Chlorine Produced Oxidants mg/L < 0.10 < 0.10 < 0.10 < 0.10 < 0.10 < 0.10 pH SU 6.91 6.97 6.92 7.04 6.99 6.69 Oxidation‐Reduction Potential mV ‐5.90 ‐3.5 ‐9.60 ‐12.60 4.90 Temperature o C 4.60 5.55 6.65 12.05 19.80 25.20Dissolved Oxygen, DO mg/L 9.79 9.49 9.41 8.63 6.07 4.64
DSN003
Parameters Units July Aug. Sept. Oct. Nov. Dec.
Ammonia nitrogen as N, NH3 mg/L < 0.10 Biological Oxygen Demand mg/L < 2.68 Chemical Oxygen Demand mg/L 22.00 21.00 10.00 < 10.00 < 10.00 12.00 Kjeldhal N, TKN mg/L < 0.60 Nitrite as N, NO2 mg/L < 0.100 Nitrate as N, NO3 mg/L 0.801 Phosphorus, total mg/L 0.095 0.032 0.092 0.241 0.123 0.138 Total Petroleum Hydrocarbon mg/L < 5.00 < 5.00 < 5.00 < 5.00 < 1.89 < 1.89 Total Dissolved Solids, TDS mg/L 169.00 Total Organic Carbon, TOC mg/L 5.47 5.330 3.24 Total Suspended Solids, TSS mg/L 6.00 8.00 8.00 3.00 4.00 3.00
Field Parameters
Chlorine Produced Oxidants mg/L < 0.10 < 0.10 < 0.10 < 0.10 < 0.10 < 0.10 pH SU 6.61 6.69 6.99 7.45 7.09 6.86 Oxidation‐Reduction Potential mV 9.20 0.60 ‐25.60 ‐5.50 4.10 Temperature o C 25.40 25.00 24.70 22.00 12.90 8.40 Dissolved Oxygen, DO mg/L 4.00 3.67 4.18 5.09 7.28 7.84
Blank indicates no measurement NA = not applicable NL = no limit
Page 82 Appendix A – 2013 Tables
Table 19. Summary of Ground Water Sampling Results – March 2013 Target Chlorinated Volatile Organic Compounds (VOC), Monitored Natural Attenuation (MNA)
Well No. MW-3S MW-5I MW-5S MW-9S MW-13S MW-17 MW-18 MW-19S MW-25 D-MG SUMP MW-26 * TB-1 TB-2 TB-3 NJ Ground PPPL Sample No. 13-120 13-122 13-121 13-123 13-124 13-125 13-126 13-127 13-128 13-130 13-129 13-131 13-131 13-131 WaterLab Sample No. L3480488-1 L3480488-2 L3480488-3 L4491829-3 L4491829-1 L4491828-3 L4491828-2 L4491828-4 L4491828-1 L4491828-5 L4491829-2 L4491828-6 L4491829-4 L3480488-4 Standard
Target Volatile Organic Compounds (ug/L)Tetrachloroethylene <0.110 <0.110 0.510 J 0.480 J 19.5 15.7 0.190 J 80.1 0.140 J 20 20.1 <0.110 <0.110 <0.110 1Trichloroethylene <0.0800 2.06 <0.0800 0.130 J 14.4 0.960 J <0.0800 2.84 <0.0800 1.73 14.7 <0.0800 <0.0800 <0.0800 1c-1,2-Dichloroethylene ND 7.86 JN ND ND 22.1 JN ND ND 5.84 JN ND ND 22.5 JN ND ND ND 70t-1,2-Dichloroethylene <0.160 <0.160 <0.160 <0.160 0.170 J <0.160 <0.160 <0.160 <0.160 <0.160 0.190 J <0.160 <0.160 <0.160 1001,1,1-Trichloroethane <0.130 <0.130 <0.130 <0.130 <0.130 <0.130 <0.130 <0.130 <0.130 <0.130 <0.130 <0.130 <0.130 <0.130 301,1-Dichloroethylene <0.150 <0.150 <0.150 <0.150 0.240 J <0.150 <0.150 <0.150 <0.150 0.360 J 0.280 J <0.150 <0.150 <0.150 2Chloroform <0.120 <0.120 <0.120 <0.120 0.390 J 0.150 J 0.120 J <0.120 <0.120 0.140 J 0.400 J <0.120 <0.120 <0.120 6Vinyl Chloride <0.140 <0.140 <0.140 <0.140 <0.140 <0.140 <0.140 <0.140 <0.140 <0.140 <0.140 <0.140 <0.140 <0.140 2
Tentatively Identified Compounds (ug/L)Unknown 9.90 JB 11.6 JB ND 3.71 J 10.8 JB 7.85 J 10.6 JB 13.09 JB 6.22 JB ND 9.35 JB ND ND ND --1,1,2-Trichloro-1,2,2-Trifluoroetha ND ND ND ND 56.3 JN ND ND ND ND ND 58.5 JN ND ND ND --1,2-Dichloro-1,1,2-Trifluoroethane ND ND ND ND 5.80 JN ND ND ND ND ND 4.76 JN ND ND ND --
Natural Attenuation IndicatorsChloride mg/L 8.55 260 125 <5.00 52.3 11.3 14.3 5.61 120 148 52.1 - - - 250Manganese mg/L 1.8 0.274 0.00550 J 0.0074 0.4 0.0843 0.217 0.0163 5.08 3.18 0.335 - - - 0.05Alkalinity mg/L 227 57.6 22.8 63.3 56.3 33.2 9.68 23 94.4 105 55.5 - - - --Nitrate as N mg/L 0.15 <0.100 1.29 0.1 <0.100 0.12 <0.100 0.45 <0.100 1.11 0.74 - - - 10Nitrite mg/L <0.0250 <0.0250 <0.0250 <0.0250 <0.0250 <0.0250 0.0262 <0.0250 <0.0250 <0.0250 <0.0250 - - - 1Sulfide mg/L <0.100 <0.100 <0.100 <0.100 <0.100 <0.100 <0.100 <0.100 <0.100 <0.100 <0.100 - - - --Sulfate mg/L 22.3 <5.00 9.79 6.22 16.5 25.9 24.8 29.5 20.9 17.5 16.3 - - - 250Total Organic Carbon mg/L 19.7 0.732 0.807 6.89 1.6 1.72 1.55 1.49 2.09 1.86 1.69 - - - --Ferrous Iron mg/L <0.2 <0.2 <0.2 <0.2 <0.2 <0.2 <0.2 <0.2 <0.2 <0.2 <0.2 - - - --Dissolved Methane ug/L 2.8 0.99 <0.11 0 0.24 <0.11 <0.11 1.6 2.9 6.2 0.23 0.54 0.63 <0.11 --Dissolved Ethane ug/L <0.23 <0.23 <0.23 <0.23 <0.23 <0.23 <0.23 <0.23 <0.23 <0.23 <0.23 <0.23 <0.23 <0.23 --Dissolved Ethene ug/L <0.31 <0.31 <0.31 <0.31 <0.31 <0.31 <0.31 <0.31 <0.31 <0.31 <0.31 <0.31 <0.31 <0.31 --Dissolved Oxygen mg/L 0.81 0.24 - 7.07 3.93 0.29 1.46 6.33 0.24 - 3.93 - - - --pH Std. Units 5.42 6.9 - 6.33 6.13 5.97 5.92 5.48 6.83 - 6.13 - - - --Redox Potential mVe 187.1 -57.1 - 145.7 142.2 180.6 153 246.8 90.2 - 142.2 - - - --
NOTES B - Compound found in blank as well as sampleJ - Estimated, concentration listed greater than the MDL but lower than the lowest standard. N - Indicates presumptive evidence of the compound's presence.* MW-26 is duplicate sample from well MW-13S.Ground water quality standards as published in N.J.A.C. 7:9-6.9.-- Compound-specific Ground Water Quality Standard not published.

Appendix A – 2013 Tables Page 83
Table 20. Summary of Ground Water Sampling Results –June 2013 Target Chlorinated Volatile Organic Compounds (VOC), Monitored Natural Attenuation (MNA)
Well No. MW-3S MW-5I MW-5S MW-9S MW-13S MW-17 MW-18 MW-19S MW-25 D-MG Sump MW-26 * TB-1 (6/17) TB-2 (6/18) TB-3 (6/19) NJ GroundPPPL Sample No. 13-169 13-171 13-170 13-172 13-173 13-174 13-175 13-176 13-177 13-179 13-178 13-180 13-180 13-180 Water Lab Sample No. L4653022-4 L4599351-3 L4599351-4 L4653022-1 L4653022-2 L4599353-2 L4599353-1 L4653022-5 L4599351-1 L4599351-2 L4653022-3 L4599353-9 L4599351-7 L4653022-6 Standard
Target Volatile Organic Compounds (ug/L) Tetrachloroethylene <0.310 <0.310 <0.310 11.2 27.2 9.46 <0.310 63.7 <0.310 17.6 28.5 <0.310 <0.310 <0.310 1 Trichloroethylene <0.340 2.58 <0.340 14.6 13 0.740 J <0.340 2.62 <0.340 1.78 13.4 <0.340 <0.340 <0.340 1 c-1,2-Dichloroethylene ND 4.54 JN ND 3.73 JN 13.7 JN ND ND ND ND ND 14.1 JN ND ND ND 70 t-1,2-Dichloroethylene <0.290 <0.290 <0.290 <0.290 <0.290 <0.290 <0.290 <0.290 <0.290 <0.290 <0.290 <0.290 <0.290 <0.290 100 1,1,1-Trichloroethane <0.260 <0.260 <0.260 <0.260 <0.260 <0.260 <0.260 <0.260 <0.260 <0.260 <0.260 <0.260 <0.260 <0.260 30 1,1-Dichloroethylene <0.320 <0.320 <0.320 <0.320 <0.320 <0.320 <0.320 <0.320 <0.320 <0.320 <0.320 <0.320 <0.320 <0.320 2 Chloroform <0.290 <0.290 <0.290 <0.290 0.450 J <0.290 1.07 <0.290 <0.290 <0.290 0.530 J <0.290 <0.290 <0.290 6 Vinyl Chloride <0.380 <0.380 <0.380 <0.380 0.480 J <0.380 <0.380 <0.380 <0.380 <0.380 0.520 J <0.380 <0.380 <0.380 2
Tentatively Identified Compounds (ug/L)Unknown ND ND ND 5.79 J 6.14 J ND ND ND ND ND 6.25 J ND ND ND --1,1,2-Trichloro-1,2,2-Trifluoroethan ND ND ND ND 44.3 J ND ND ND ND ND 44.3 J ND ND ND --1,2-Dichloro-1,1,2-Trifluoroethane ND ND ND ND ND ND ND ND ND ND ND ND ND ND --
Natural Attenuation Indicators Chloride mg/L <5.00 411 77.9 8.45 65.3 9.05 17.6 5.66 114 123 65.9 - - - 250 Manganese mg/L 0.565 0.654 0.00140 B 0.0984 1.91 0.125 0.135 0.0333 5.52 52.9 2.07 - - - 0.05 Alkalinity mg/L 188 139 32.2 97.1 47 72.6 16.5 13.7 95.1 112 47.9 - - - -- Nitrate as N mg/L - <0.500 2.65 - - <0.500 <0.500 - <0.100 1.46 - - - - 10 Nitrite mg/L <0.0250 <0.0250 <0.0250 <0.0250 <0.0250 <0.200 <0.200 <0.0250 <0.0250 <0.0250 <0.0250 - - - 1 Sulfide mg/L <0.100 <0.100 <0.100 <0.100 <0.100 <0.100 <0.100 <0.100 <0.100 <0.250 <0.100 - - - -- Sulfate mg/L 18.2 17.4 9.41 14.2 15.3 16.7 28.9 33.3 20.2 20.1 15.2 - - - 250 Total Organic Carbon mg/L 11.3 0.984 1.17 4.62 1.69 1.42 2.05 1.98 2.18 5.72 1.63 - - - -- Ferrous Iron mg/L <0.20 1.1 <0.20 <0.20 2.1 0.2 0.37 <0.20 <0.20 <0.20 2.8 - - - -- Dissolved Methane ug/L 0.55 2.2 <0.030 2.5 25.4 <0.030 <0.030 <0.030 8.6 3.8 24.5 0.18 0.34 0.46 -- Dissolved Ethane ug/L <0.090 <0.090 <0.090 <0.090 <0.090 <0.090 <0.090 <0.090 <0.090 <0.090 <0.090 <0.090 <0.090 <0.090 -- Dissolved Ethene ug/L <0.095 <0.095 <0.095 <0.095 <0.095 <0.095 <0.095 <0.095 <0.095 <0.095 <0.095 <0.095 <0.095 <0.095 -- Dissolved Oxygen mg/L 0.51 0.37 820 0.19 1.09 0.04 0.68 7.19 0.04 - 1.09 - - - -- pH Std. Units 5.09 6.67 7.08 6.07 5.58 6.17 5.51 5.01 6.48 - 5.58 - - - -- Redox Potential mVe 163.1 -88.3 667 136.2 97.2 143.7 195.4 256.1 45.9 - 97.2 - - - --
NOTES: J - Estimated, concentration listed greater than the MDL but lower than the lowest standard.N - Indicates presumptive evidence of the compound's presence.* MW-26 is duplicate sample from well MW-13S.Ground water quality standards as published in N.J.A.C. 7:9-6.9.-- Compound-specific Ground Water Quality Standard not published.
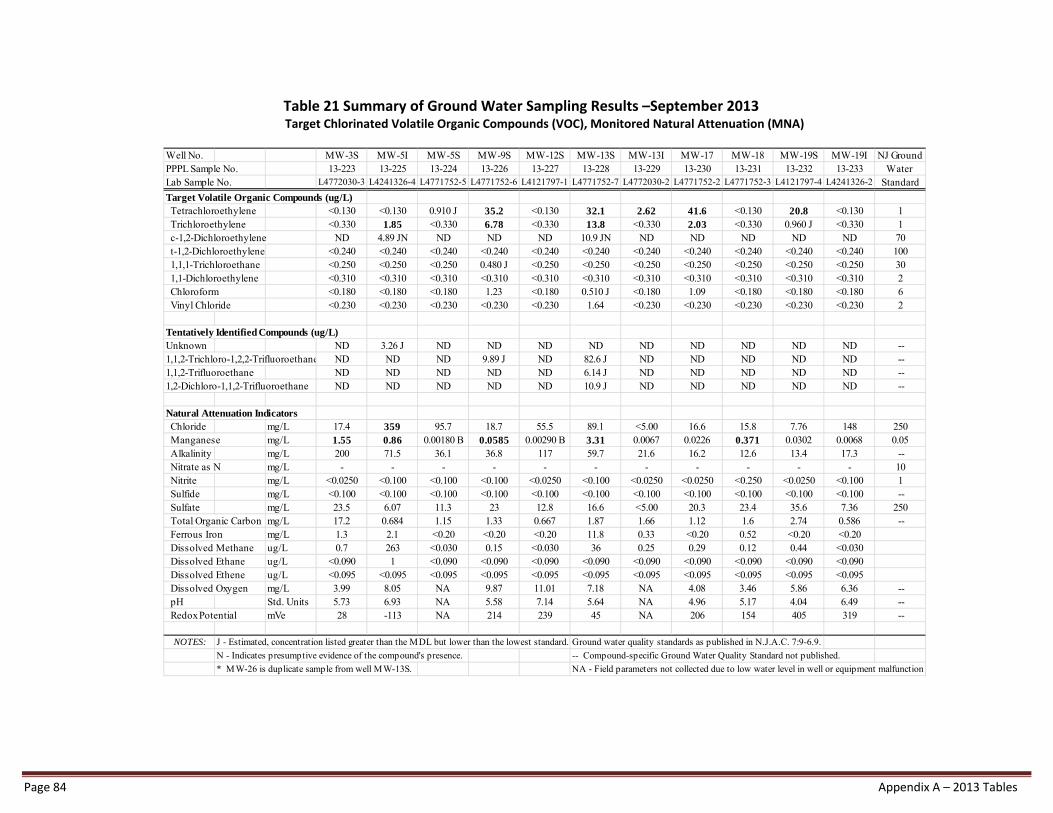
Page 84 Appendix A – 2013 Tables
Table 21 Summary of Ground Water Sampling Results –September 2013
Target Chlorinated Volatile Organic Compounds (VOC), Monitored Natural Attenuation (MNA)
Well No. MW-3S MW-5I MW-5S MW-9S MW-12S MW-13S MW-13I MW-17 MW-18 MW-19S MW-19I NJ GroundPPPL Sample No. 13-223 13-225 13-224 13-226 13-227 13-228 13-229 13-230 13-231 13-232 13-233 Water Lab Sample No. L4772030-3 L4241326-4 L4771752-5 L4771752-6 L4121797-1 L4771752-7 L4772030-2 L4771752-2 L4771752-3 L4121797-4 L4241326-2 Standard
Target Volatile Organic Compounds (ug/L) Tetrachloroethylene <0.130 <0.130 0.910 J 35.2 <0.130 32.1 2.62 41.6 <0.130 20.8 <0.130 1 Trichloroethylene <0.330 1.85 <0.330 6.78 <0.330 13.8 <0.330 2.03 <0.330 0.960 J <0.330 1 c-1,2-Dichloroethylene ND 4.89 JN ND ND ND 10.9 JN ND ND ND ND ND 70 t-1,2-Dichloroethylene <0.240 <0.240 <0.240 <0.240 <0.240 <0.240 <0.240 <0.240 <0.240 <0.240 <0.240 100 1,1,1-Trichloroethane <0.250 <0.250 <0.250 0.480 J <0.250 <0.250 <0.250 <0.250 <0.250 <0.250 <0.250 30 1,1-Dichloroethylene <0.310 <0.310 <0.310 <0.310 <0.310 <0.310 <0.310 <0.310 <0.310 <0.310 <0.310 2 Chloroform <0.180 <0.180 <0.180 1.23 <0.180 0.510 J <0.180 1.09 <0.180 <0.180 <0.180 6 Vinyl Chloride <0.230 <0.230 <0.230 <0.230 <0.230 1.64 <0.230 <0.230 <0.230 <0.230 <0.230 2
Tentatively Identified Compounds (ug/L)Unknown ND 3.26 J ND ND ND ND ND ND ND ND ND --1,1,2-Trichloro-1,2,2-Trifluoroethane ND ND ND 9.89 J ND 82.6 J ND ND ND ND ND --1,1,2-Trifluoroethane ND ND ND ND ND 6.14 J ND ND ND ND ND --1,2-Dichloro-1,1,2-Trifluoroethane ND ND ND ND ND 10.9 J ND ND ND ND ND --
Natural Attenuation Indicators Chloride mg/L 17.4 359 95.7 18.7 55.5 89.1 <5.00 16.6 15.8 7.76 148 250 Manganese mg/L 1.55 0.86 0.00180 B 0.0585 0.00290 B 3.31 0.0067 0.0226 0.371 0.0302 0.0068 0.05 Alkalinity mg/L 200 71.5 36.1 36.8 117 59.7 21.6 16.2 12.6 13.4 17.3 -- Nitrate as N mg/L - - - - - - - - - - - 10 Nitrite mg/L <0.0250 <0.100 <0.100 <0.100 <0.0250 <0.100 <0.0250 <0.0250 <0.250 <0.0250 <0.100 1 Sulfide mg/L <0.100 <0.100 <0.100 <0.100 <0.100 <0.100 <0.100 <0.100 <0.100 <0.100 <0.100 -- Sulfate mg/L 23.5 6.07 11.3 23 12.8 16.6 <5.00 20.3 23.4 35.6 7.36 250 Total Organic Carbon mg/L 17.2 0.684 1.15 1.33 0.667 1.87 1.66 1.12 1.6 2.74 0.586 -- Ferrous Iron mg/L 1.3 2.1 <0.20 <0.20 <0.20 11.8 0.33 <0.20 0.52 <0.20 <0.20 Dissolved Methane ug/L 0.7 263 <0.030 0.15 <0.030 36 0.25 0.29 0.12 0.44 <0.030 Dissolved Ethane ug/L <0.090 1 <0.090 <0.090 <0.090 <0.090 <0.090 <0.090 <0.090 <0.090 <0.090 Dissolved Ethene ug/L <0.095 <0.095 <0.095 <0.095 <0.095 <0.095 <0.095 <0.095 <0.095 <0.095 <0.095 Dissolved Oxygen mg/L 3.99 8.05 NA 9.87 11.01 7.18 NA 4.08 3.46 5.86 6.36 -- pH Std. Units 5.73 6.93 NA 5.58 7.14 5.64 NA 4.96 5.17 4.04 6.49 -- Redox Potential mVe 28 -113 NA 214 239 45 NA 206 154 405 319 --
NOTES: J - Estimated, concentration listed greater than the MDL but lower than the lowest standard. Ground water quality standards as published in N.J.A.C. 7:9-6.9.
N - Indicates presumptive evidence of the compound's presence. -- Compound-specific Ground Water Quality Standard not published.
* MW-26 is duplicate sample from well MW-13S. NA - Field parameters not collected due to low water level in well or equipment malfunction
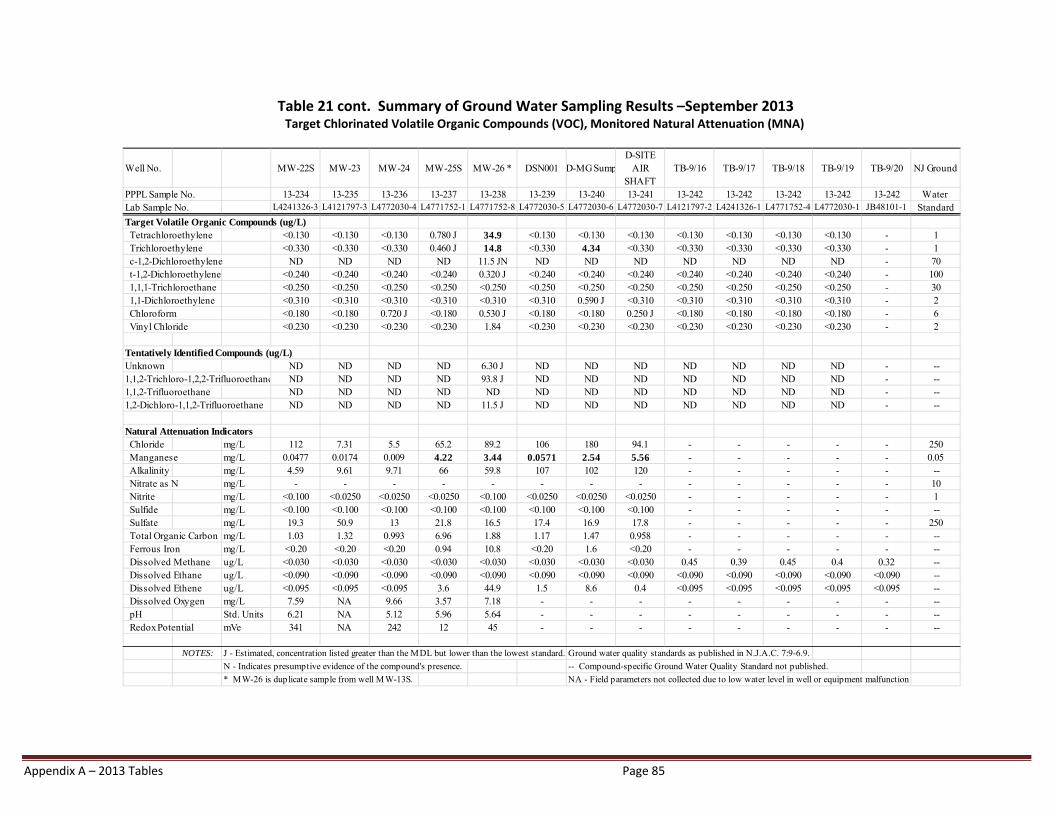
Appendix A – 2013 Tables Page 85
Table 21 cont. Summary of Ground Water Sampling Results –September 2013 Target Chlorinated Volatile Organic Compounds (VOC), Monitored Natural Attenuation (MNA)
Well No. MW-22S MW-23 MW-24 MW-25S MW-26 * DSN001 D-MG SumpD-SITE
AIR SHAFT
TB-9/16 TB-9/17 TB-9/18 TB-9/19 TB-9/20 NJ Ground
PPPL Sample No. 13-234 13-235 13-236 13-237 13-238 13-239 13-240 13-241 13-242 13-242 13-242 13-242 13-242 Water Lab Sample No. L4241326-3 L4121797-3 L4772030-4 L4771752-1 L4771752-8 L4772030-5 L4772030-6 L4772030-7 L4121797-2 L4241326-1 L4771752-4 L4772030-1 JB48101-1 Standard
Target Volatile Organic Compounds (ug/L) Tetrachloroethylene <0.130 <0.130 <0.130 0.780 J 34.9 <0.130 <0.130 <0.130 <0.130 <0.130 <0.130 <0.130 - 1 Trichloroethylene <0.330 <0.330 <0.330 0.460 J 14.8 <0.330 4.34 <0.330 <0.330 <0.330 <0.330 <0.330 - 1 c-1,2-Dichloroethylene ND ND ND ND 11.5 JN ND ND ND ND ND ND ND - 70 t-1,2-Dichloroethylene <0.240 <0.240 <0.240 <0.240 0.320 J <0.240 <0.240 <0.240 <0.240 <0.240 <0.240 <0.240 - 100 1,1,1-Trichloroethane <0.250 <0.250 <0.250 <0.250 <0.250 <0.250 <0.250 <0.250 <0.250 <0.250 <0.250 <0.250 - 30 1,1-Dichloroethylene <0.310 <0.310 <0.310 <0.310 <0.310 <0.310 0.590 J <0.310 <0.310 <0.310 <0.310 <0.310 - 2 Chloroform <0.180 <0.180 0.720 J <0.180 0.530 J <0.180 <0.180 0.250 J <0.180 <0.180 <0.180 <0.180 - 6 Vinyl Chloride <0.230 <0.230 <0.230 <0.230 1.84 <0.230 <0.230 <0.230 <0.230 <0.230 <0.230 <0.230 - 2
Tentatively Identified Compounds (ug/L)Unknown ND ND ND ND 6.30 J ND ND ND ND ND ND ND - --1,1,2-Trichloro-1,2,2-Trifluoroethane ND ND ND ND 93.8 J ND ND ND ND ND ND ND - --1,1,2-Trifluoroethane ND ND ND ND ND ND ND ND ND ND ND ND - --1,2-Dichloro-1,1,2-Trifluoroethane ND ND ND ND 11.5 J ND ND ND ND ND ND ND - --
Natural Attenuation Indicators Chloride mg/L 112 7.31 5.5 65.2 89.2 106 180 94.1 - - - - - 250 Manganese mg/L 0.0477 0.0174 0.009 4.22 3.44 0.0571 2.54 5.56 - - - - - 0.05 Alkalinity mg/L 4.59 9.61 9.71 66 59.8 107 102 120 - - - - - -- Nitrate as N mg/L - - - - - - - - - - - - - 10 Nitrite mg/L <0.100 <0.0250 <0.0250 <0.0250 <0.100 <0.0250 <0.0250 <0.0250 - - - - - 1 Sulfide mg/L <0.100 <0.100 <0.100 <0.100 <0.100 <0.100 <0.100 <0.100 - - - - - -- Sulfate mg/L 19.3 50.9 13 21.8 16.5 17.4 16.9 17.8 - - - - - 250 Total Organic Carbon mg/L 1.03 1.32 0.993 6.96 1.88 1.17 1.47 0.958 - - - - - -- Ferrous Iron mg/L <0.20 <0.20 <0.20 0.94 10.8 <0.20 1.6 <0.20 - - - - - -- Dissolved Methane ug/L <0.030 <0.030 <0.030 <0.030 <0.030 <0.030 <0.030 <0.030 0.45 0.39 0.45 0.4 0.32 -- Dissolved Ethane ug/L <0.090 <0.090 <0.090 <0.090 <0.090 <0.090 <0.090 <0.090 <0.090 <0.090 <0.090 <0.090 <0.090 -- Dissolved Ethene ug/L <0.095 <0.095 <0.095 3.6 44.9 1.5 8.6 0.4 <0.095 <0.095 <0.095 <0.095 <0.095 -- Dissolved Oxygen mg/L 7.59 NA 9.66 3.57 7.18 - - - - - - - - -- pH Std. Units 6.21 NA 5.12 5.96 5.64 - - - - - - - - -- Redox Potential mVe 341 NA 242 12 45 - - - - - - - - --
NOTES: J - Estimated, concentration listed greater than the MDL but lower than the lowest standard. Ground water quality standards as published in N.J.A.C. 7:9-6.9.
N - Indicates presumptive evidence of the compound's presence. -- Compound-specific Ground Water Quality Standard not published.
* MW-26 is duplicate sample from well MW-13S. NA - Field parameters not collected due to low water level in well or equipment malfunction
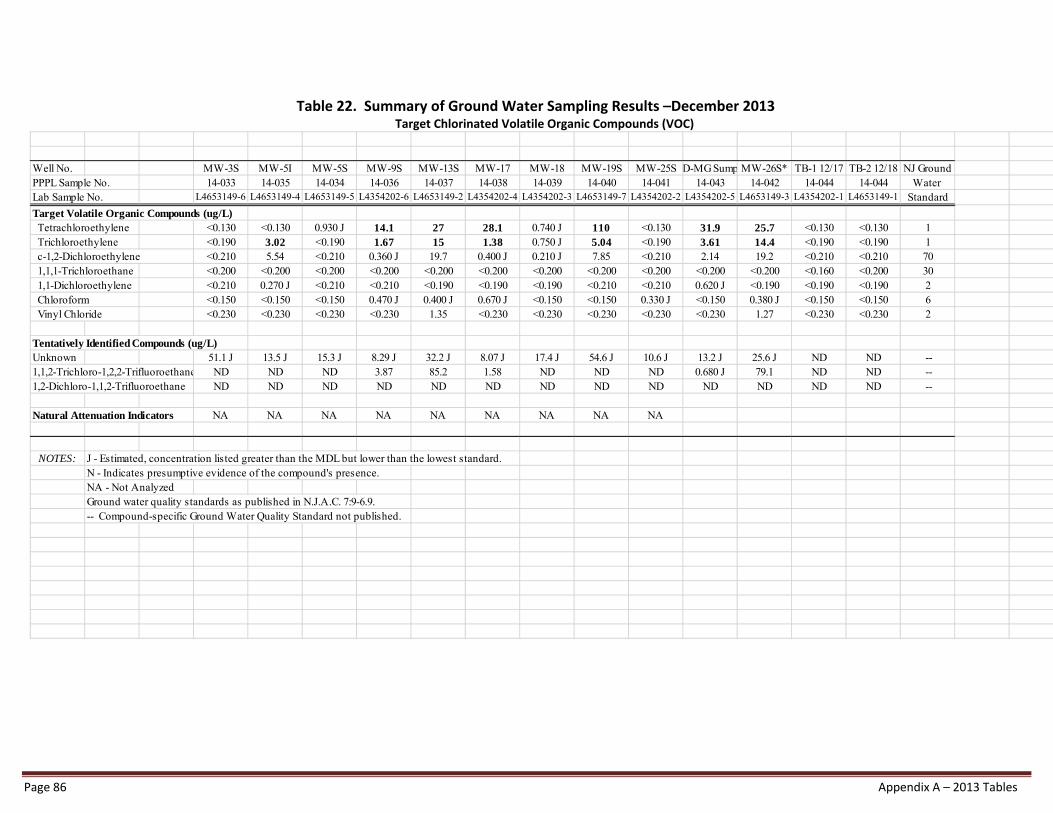
Page 86 Appendix A – 2013 Tables
Table 22. Summary of Ground Water Sampling Results –December 2013 Target Chlorinated Volatile Organic Compounds (VOC)
Well No. MW-3S MW-5I MW-5S MW-9S MW-13S MW-17 MW-18 MW-19S MW-25S D-MG Sump MW-26S* TB-1 12/17 TB-2 12/18 NJ GroundPPPL Sample No. 14-033 14-035 14-034 14-036 14-037 14-038 14-039 14-040 14-041 14-043 14-042 14-044 14-044 Water Lab Sample No. L4653149-6 L4653149-4 L4653149-5 L4354202-6 L4653149-2 L4354202-4 L4354202-3 L4653149-7 L4354202-2 L4354202-5 L4653149-3 L4354202-1 L4653149-1 Standard
Target Volatile Organic Compounds (ug/L) Tetrachloroethylene <0.130 <0.130 0.930 J 14.1 27 28.1 0.740 J 110 <0.130 31.9 25.7 <0.130 <0.130 1 Trichloroethylene <0.190 3.02 <0.190 1.67 15 1.38 0.750 J 5.04 <0.190 3.61 14.4 <0.190 <0.190 1 c-1,2-Dichloroethylene <0.210 5.54 <0.210 0.360 J 19.7 0.400 J 0.210 J 7.85 <0.210 2.14 19.2 <0.210 <0.210 70 1,1,1-Trichloroethane <0.200 <0.200 <0.200 <0.200 <0.200 <0.200 <0.200 <0.200 <0.200 <0.200 <0.200 <0.160 <0.200 30 1,1-Dichloroethylene <0.210 0.270 J <0.210 <0.210 <0.190 <0.190 <0.190 <0.210 <0.210 0.620 J <0.190 <0.190 <0.190 2 Chloroform <0.150 <0.150 <0.150 0.470 J 0.400 J 0.670 J <0.150 <0.150 0.330 J <0.150 0.380 J <0.150 <0.150 6 Vinyl Chloride <0.230 <0.230 <0.230 <0.230 1.35 <0.230 <0.230 <0.230 <0.230 <0.230 1.27 <0.230 <0.230 2
Tentatively Identified Compounds (ug/L)Unknown 51.1 J 13.5 J 15.3 J 8.29 J 32.2 J 8.07 J 17.4 J 54.6 J 10.6 J 13.2 J 25.6 J ND ND --1,1,2-Trichloro-1,2,2-Trifluoroethane ND ND ND 3.87 85.2 1.58 ND ND ND 0.680 J 79.1 ND ND --1,2-Dichloro-1,1,2-Trifluoroethane ND ND ND ND ND ND ND ND ND ND ND ND ND --
Natural Attenuation Indicators NA NA NA NA NA NA NA NA NA
NOTES: J - Estimated, concentration listed greater than the MDL but lower than the lowest standard.N - Indicates presumptive evidence of the compound's presence.NA - Not AnalyzedGround water quality standards as published in N.J.A.C. 7:9-6.9.-- Compound-specific Ground Water Quality Standard not published.
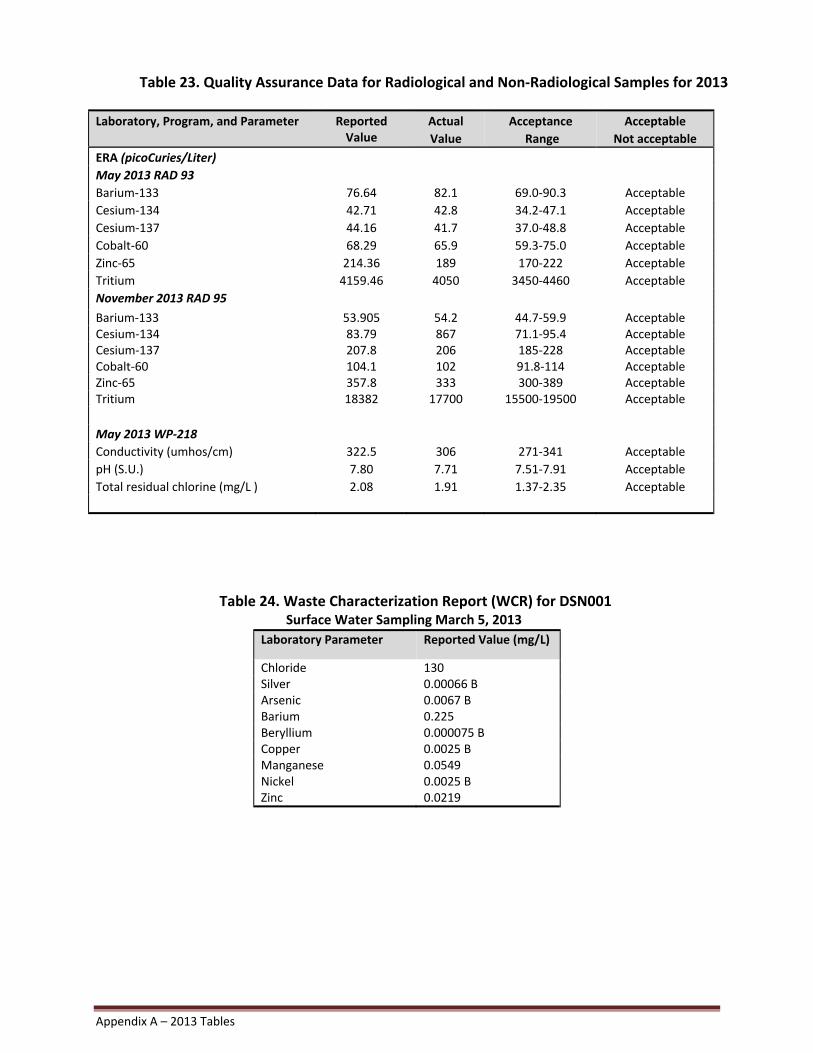
Appendix A – 2013 Tables
Table 23. Quality Assurance Data for Radiological and Non‐Radiological Samples for 2013
Laboratory, Program, and Parameter Reported Value
Actual
Value
Acceptance
Range
Acceptable
Not acceptable
ERA (picoCuries/Liter)
May 2013 RAD 93
Barium‐133 76.64 82.1 69.0‐90.3 Acceptable
Cesium‐134 42.71 42.8 34.2‐47.1 Acceptable
Cesium‐137 44.16 41.7 37.0‐48.8 Acceptable
Cobalt‐60 68.29 65.9 59.3‐75.0 Acceptable
Zinc‐65 214.36 189 170‐222 Acceptable
Tritium 4159.46 4050 3450‐4460 Acceptable
November 2013 RAD 95
Barium‐133 53.905 54.2 44.7‐59.9 AcceptableCesium‐134 83.79 867 71.1‐95.4 AcceptableCesium‐137 207.8 206 185‐228 AcceptableCobalt‐60 104.1 102 91.8‐114 AcceptableZinc‐65 357.8 333 300‐389 AcceptableTritium 18382 17700 15500‐19500 Acceptable
May 2013 WP‐218
Conductivity (umhos/cm) 322.5 306 271‐341 Acceptable
pH (S.U.) 7.80 7.71 7.51‐7.91 Acceptable
Total residual chlorine (mg/L ) 2.08 1.91 1.37‐2.35 Acceptable
Table 24. Waste Characterization Report (WCR) for DSN001
Surface Water Sampling March 5, 2013
Laboratory Parameter Reported Value (mg/L)
Chloride 130Silver 0.00066 BArsenic 0.0067 BBarium 0.225Beryllium 0.000075 BCopper 0.0025 BManganese 0.0549Nickel 0.0025 BZinc 0.0219
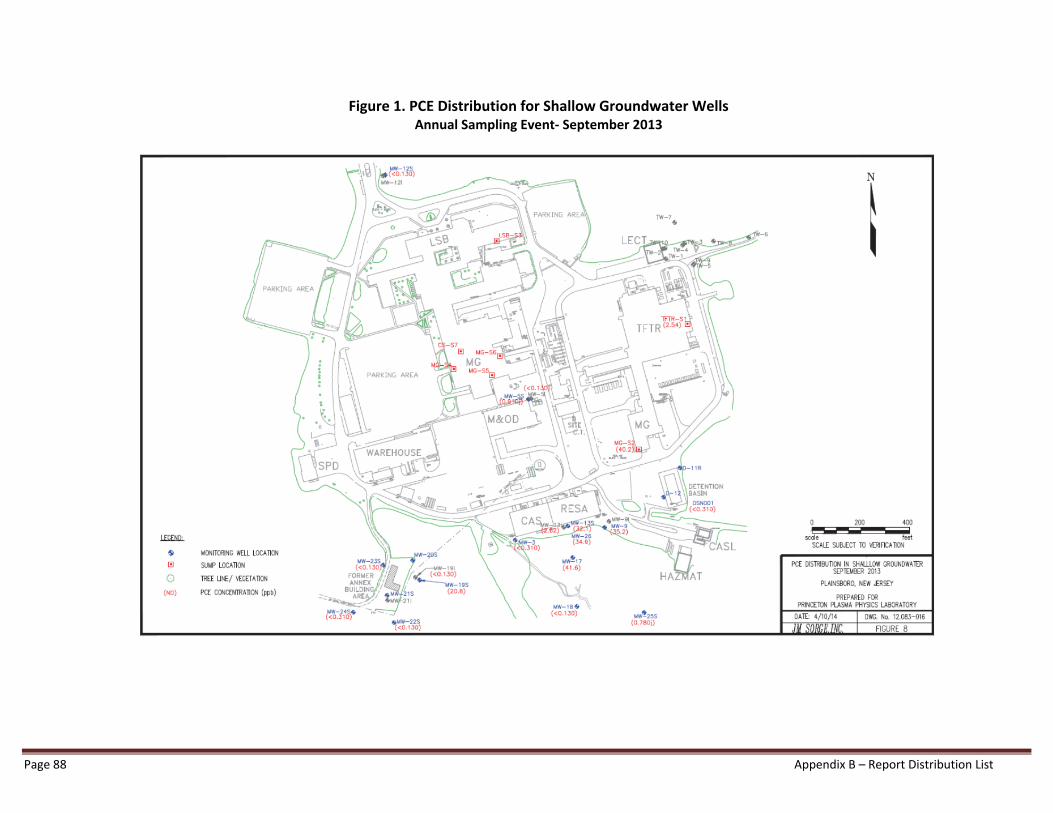
Page 88 Appendix B – Report Distribution List
Figure 1. PCE Distribution for Shallow Groundwater Wells Annual Sampling Event‐ September 2013
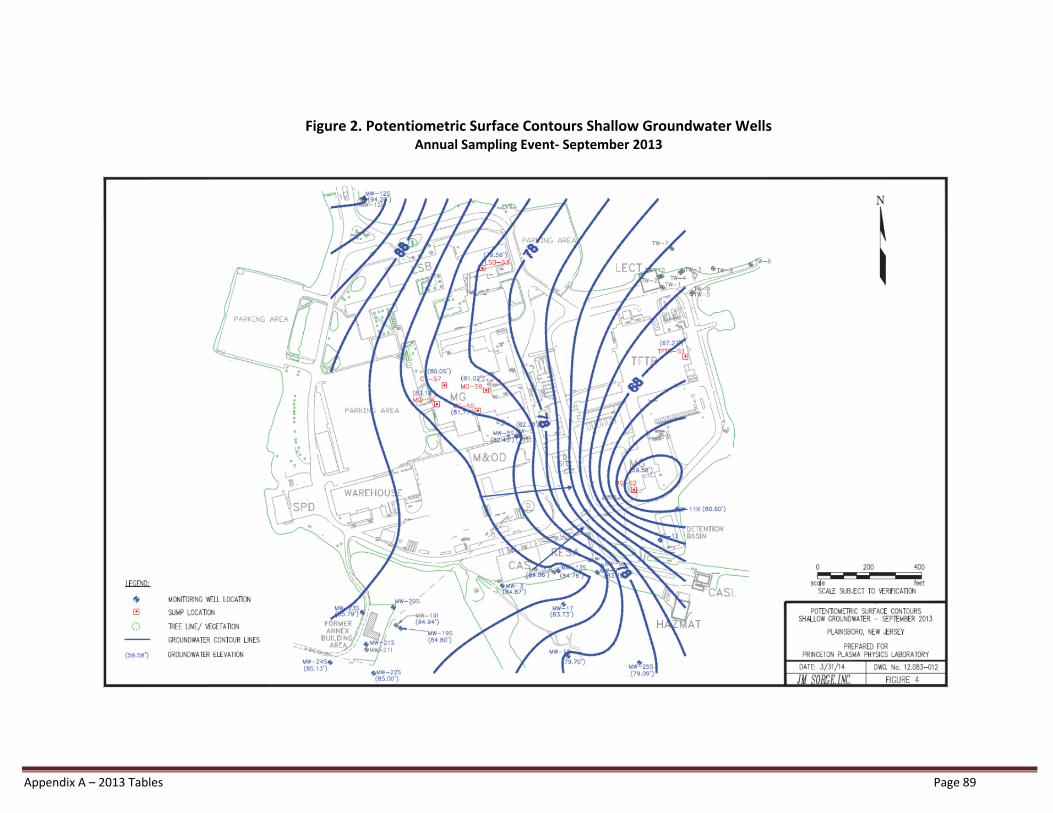
Appendix A – 2013 Tables Page 89
Figure 2. Potentiometric Surface Contours Shallow Groundwater Wells
Annual Sampling Event‐ September 2013
Page 90 Appendix B – Report Distribution List
Appendix
B REPORT DISTRIBUTION LIST Italics indicate Report in hard copy; notice of Report availability via Web; and [#] copies, if more than one. Domestic External Distribution: Argonne National Laboratory (R. Kolzow) Battelle Pacific Northwest Laboratory (E. Eckert Hickey) Brookhaven National Laboratory (K. Ratel, D. Paquette) Congress (Sen. C. Booker, Sen. R. Menendez, Rep. R. Frelinghuysen, Rep. R. Holt) Congressional Information Service (P. Weiss) DOE Chicago Field Operations DOE Office of Analysis, EH-32 (P. Lin) DOE Office of Corporate Safety and Assurance, EH-2, R. Hardwick, Deputy Assistant Secretary DOE Office of Environmental Audit, EH-24 DOE Office of Environmental Policy and Analysis, EH-41 (R. Natoli) [3] DOE Office of Environmental Guidance, EH-23 DOE Office of Independent Oversight and Performance Assurance, OA-1, G. Podonsky, Director DOE Office of NEPA Project Assistance, EH-25 DOE Office of Science, SC-10 (I. Thomas), SC-50, SC-55 (J. Willis), SC-83 (V.Nguyen) [2] EPA/Region II (J. Kenny, K. Malone) DOE Princeton Site Office (R. Snyder, T. Estes) [3] Fermilab (J. D. Cossairt) Forrestal Development Center (R. Wolfe) General Atomics (R. Savercool) Hanford National Laboratory Lawrence Livermore National Laboratory (E. B. Hooper, A. Foster) Los Alamos National Laboratory (T. Morgan) Idaho National Laboratory (L. Cadwallader) Massachusetts Institute of Technology (C. Fiore) Middlesex County Health Department (A. Trimpet) National Nevada Test Site (C. Wills) NJDEP, Central Bureau of Water Compliance and Enforcement (G. Pritchard) NJDEP, Bureau of Environmental Radiation (G. Nicholls) NJDEP, Bureau of Groundwater Pollution Abatement (G. Nicholas) NJDEP, Bureau of Hazardous Waste Management NJDEP, Bureau of Planning and Site Assessment (L. Adams) NJDEP, Bureau of Standard Permitting (M. Carasia Auriti, H. Genievich) NJDEP, Bureau of State Case Management (M. Walters) NJOEM, Division of Law & Public Safety (C. Williams) Oak Ridge National Laboratory (J. Hughes) Plainsboro Public Library Plainsboro Township Environmental Advisory Committee (E. Mosley), Sandia National Laboratory (R. Sanchez) Savannah River Stony Brook Regional Sewerage Authority Thomas Jefferson National Accelerator Facility
Appendix B – Report Distribution List Page 91
PPPL/Princeton University Distribution G. Ascione R. J. Hawryluk N. Atnafu J. C. Hosea M. Ono A. Bhattacharjee M. Hughes R. Ortego W. Blanchard J. Jackson-Devoe D. Parente A. Cohen B. Jedic PPPL Library B. Davis D. W. Johnson S. Prager R. Davidson M. Kevin-King K. Rule J. De Looper C. Kircher R. S. Sheneman C. Eisgruber J. Lacenere W. Slavin V. L. Finley J. D. Levine A. J. S. Smith N. J. Fisch K. MacPherson D. Stevenson K. A. Fischer J. A. Malsbury T. Stevenson C. Gentile A. Massry M. Viola P. Gangemi J. Menard M. A. Williams R. J. Goldston L. Meyer M. Zarnstorff J. Graham G. H. Neilson S. J. Zweben
Princeton Plasma Physics Laboratory Office of Reports and Publications
Managed by Princeton University
under contract with the
U.S. Department of Energy (DE-AC02-09CH11466)
P.O. Box 451, Princeton, NJ 08543 E-mail: [email protected] Phone: 609-243-2245 Fax: 609-243-2751 Website: http://www.pppl.gov