annual status of education report
DESCRIPTION
TRANSCRIPT
Annual Status of Education Report
2012 Report Card: Uttar Pradesh
About the ASER survey
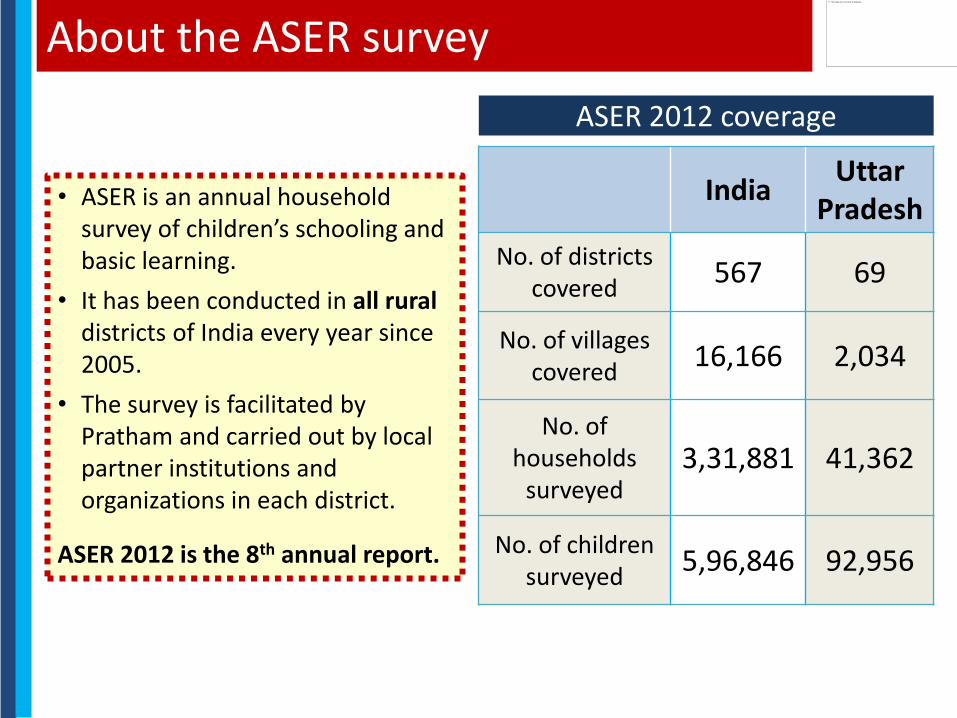
• ASER is an annual household survey of children’s schooling and basic learning.
• It has been conducted in all rural districts of India every year since 2005.
• The survey is facilitated by Pratham and carried out by local partner institutions and organizations in each district.
ASER 2012 is the 8th annual report.
India Uttar
Pradesh
No. of districts covered
567 69
No. of villages covered
16,166 2,034
No. of households
surveyed 3,31,881 41,362
No. of children surveyed
5,96,846 92,956
ASER 2012 coverage
High enrollment but out of school numbers not going down
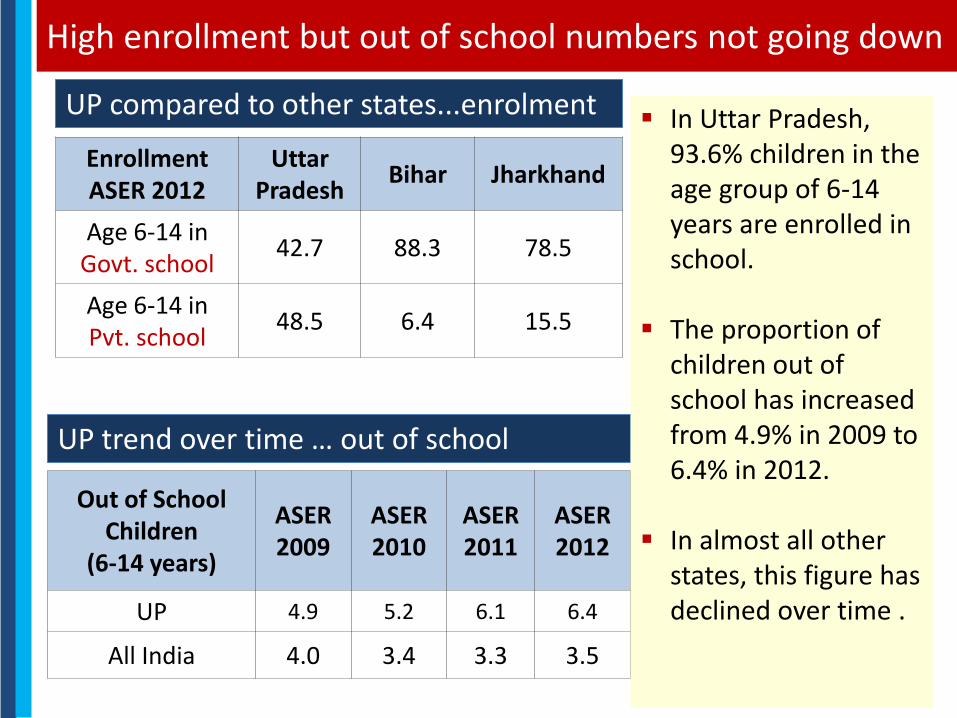
Out of School Children
(6-14 years)
ASER 2009
ASER 2010
ASER 2011
ASER 2012
UP 4.9 5.2 6.1 6.4
All India 4.0 3.4 3.3 3.5
UP trend over time … out of school
Enrollment ASER 2012
Uttar Pradesh
Bihar Jharkhand
Age 6-14 in Govt. school
42.7 88.3 78.5
Age 6-14 in Pvt. school
48.5 6.4 15.5
UP compared to other states...enrolment In Uttar Pradesh,
93.6% children in the age group of 6-14 years are enrolled in school.
The proportion of children out of school has increased from 4.9% in 2009 to 6.4% in 2012.
In almost all other states, this figure has declined over time .
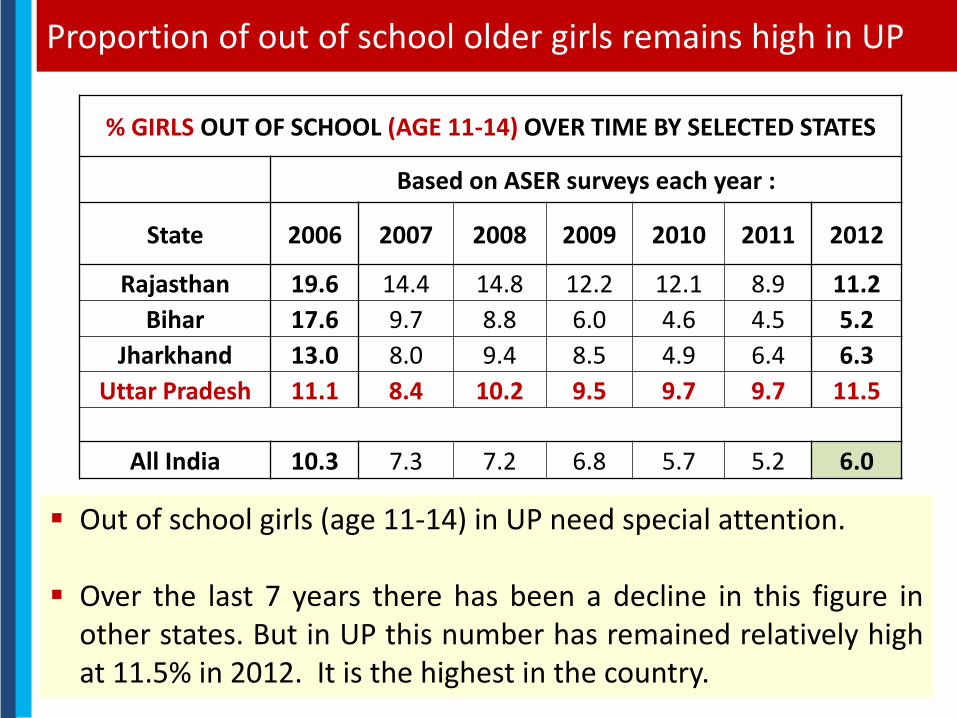
Proportion of out of school older girls remains high in UP
% GIRLS OUT OF SCHOOL (AGE 11-14) OVER TIME BY SELECTED STATES
Based on ASER surveys each year :
State 2006 2007 2008 2009 2010 2011 2012
Rajasthan 19.6 14.4 14.8 12.2 12.1 8.9 11.2
Bihar 17.6 9.7 8.8 6.0 4.6 4.5 5.2
Jharkhand 13.0 8.0 9.4 8.5 4.9 6.4 6.3
Uttar Pradesh 11.1 8.4 10.2 9.5 9.7 9.7 11.5
All India 10.3 7.3 7.2 6.8 5.7 5.2 6.0
Out of school girls (age 11-14) in UP need special attention. Over the last 7 years there has been a decline in this figure in
other states. But in UP this number has remained relatively high at 11.5% in 2012. It is the highest in the country.

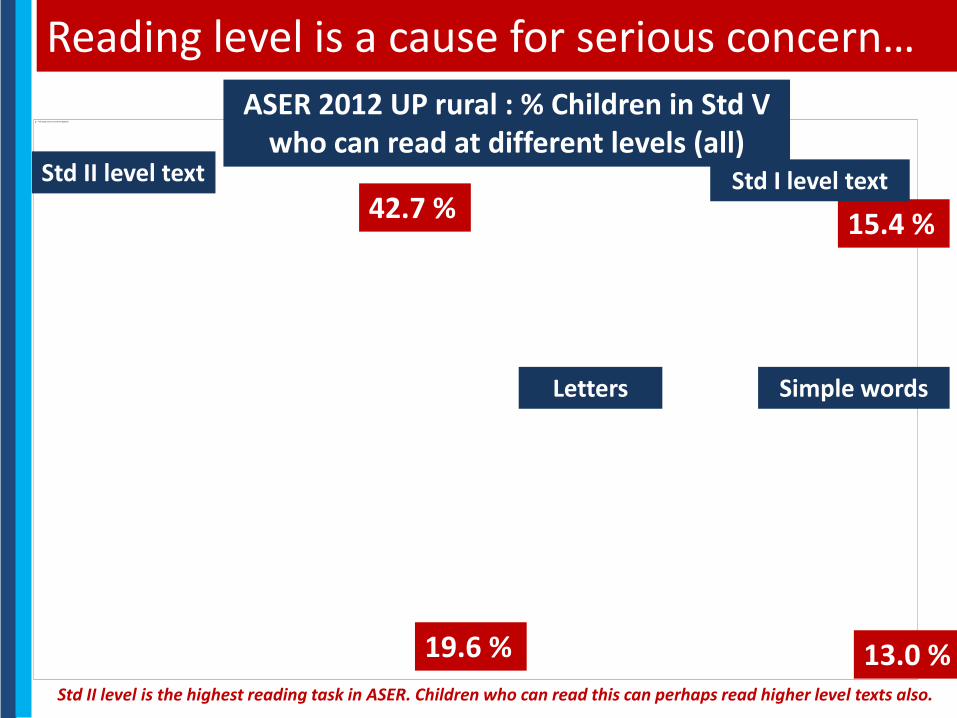
Reading level is a cause for serious concern…
ASER 2012 UP rural : % Children in Std V who can read at different levels (all)
42.7 % 15.4 %
13.0 % 19.6 %
Std II level text Std I level text
Simple words Letters
Std II level is the highest reading task in ASER. Children who can read this can perhaps read higher level texts also.

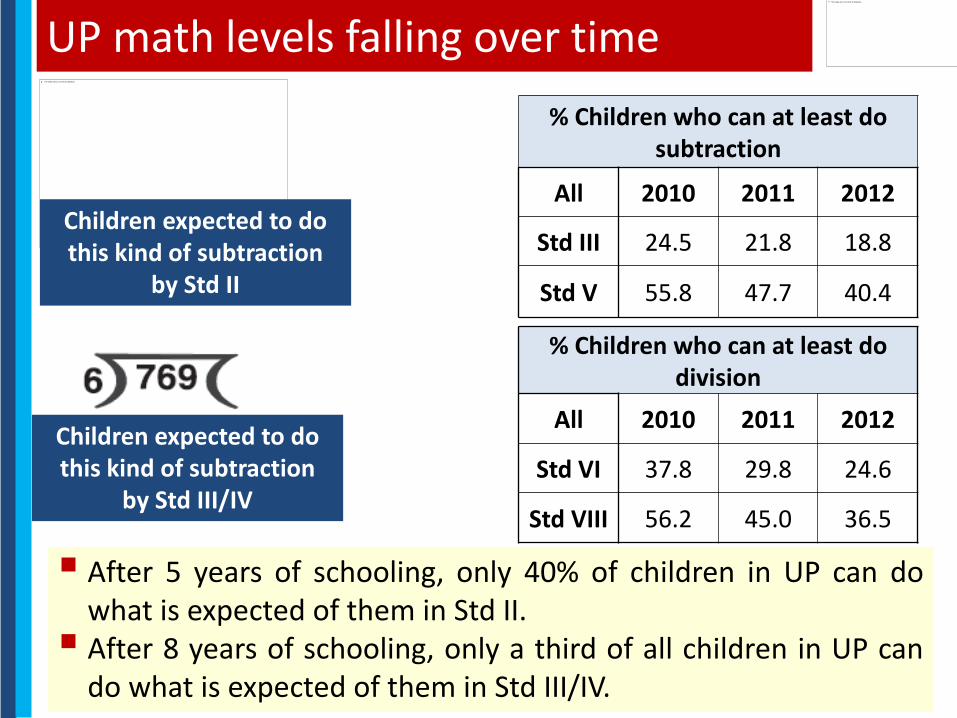
UP math levels falling over time
After 5 years of schooling, only 40% of children in UP can do what is expected of them in Std II.
After 8 years of schooling, only a third of all children in UP can do what is expected of them in Std III/IV.
Children expected to do this kind of subtraction
by Std II
Children expected to do this kind of subtraction
by Std III/IV
% Children who can at least do subtraction
All 2010 2011 2012
Std III 24.5 21.8 18.8
Std V 55.8 47.7 40.4
% Children who can at least do division
All 2010 2011 2012
Std VI 37.8 29.8 24.6
Std VIII 56.2 45.0 36.5
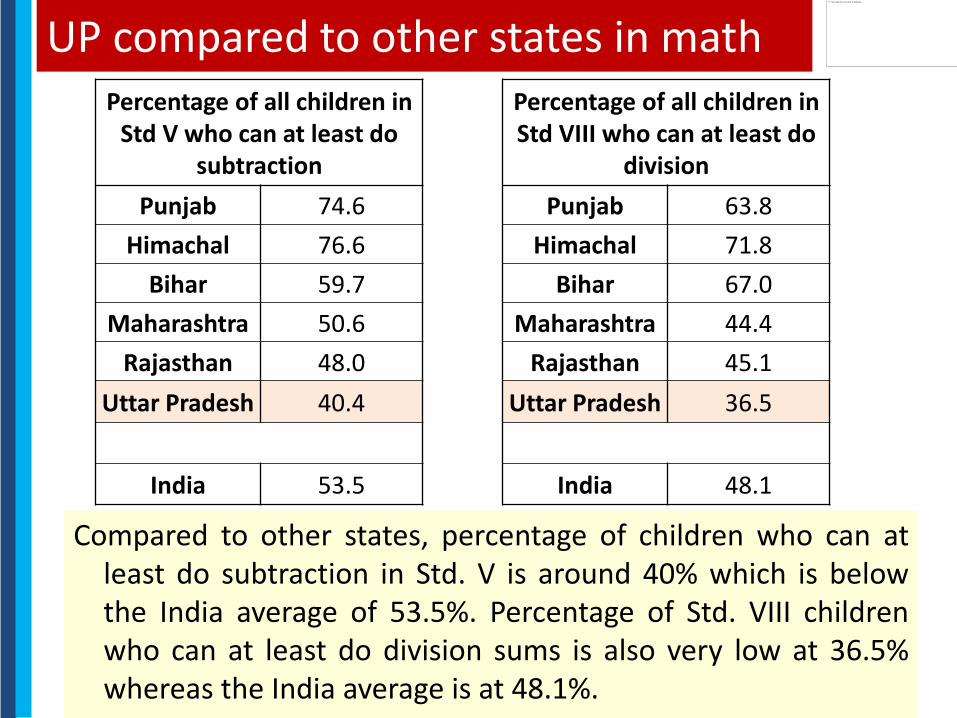
UP compared to other states in math Percentage of all children in
Std V who can at least do subtraction
Punjab 74.6
Himachal 76.6
Bihar 59.7
Maharashtra 50.6
Rajasthan 48.0
Uttar Pradesh 40.4
India 53.5
Percentage of all children in Std VIII who can at least do
division
Punjab 63.8
Himachal 71.8
Bihar 67.0
Maharashtra 44.4
Rajasthan 45.1
Uttar Pradesh 36.5
India 48.1
Compared to other states, percentage of children who can at least do subtraction in Std. V is around 40% which is below the India average of 53.5%. Percentage of Std. VIII children who can at least do division sums is also very low at 36.5% whereas the India average is at 48.1%.
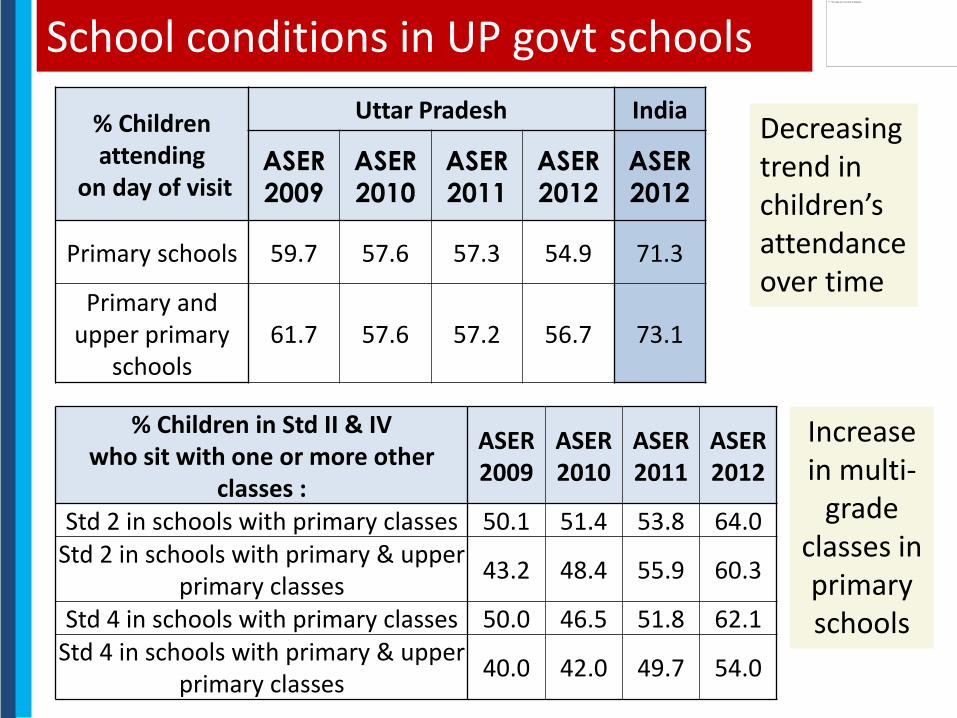
School conditions in UP govt schools
% Children attending
on day of visit
Uttar Pradesh India
ASER
2009
ASER
2010
ASER
2011
ASER
2012
ASER
2012
Primary schools 59.7 57.6 57.3 54.9 71.3
Primary and upper primary
schools 61.7 57.6 57.2 56.7 73.1
% Children in Std II & IV who sit with one or more other
classes :
ASER 2009
ASER 2010
ASER 2011
ASER 2012
Std 2 in schools with primary classes 50.1 51.4 53.8 64.0 Std 2 in schools with primary & upper
primary classes 43.2 48.4 55.9 60.3
Std 4 in schools with primary classes 50.0 46.5 51.8 62.1 Std 4 in schools with primary & upper
primary classes 40.0 42.0 49.7 54.0
Decreasing trend in children’s attendance over time
Increase in multi-
grade classes in primary schools
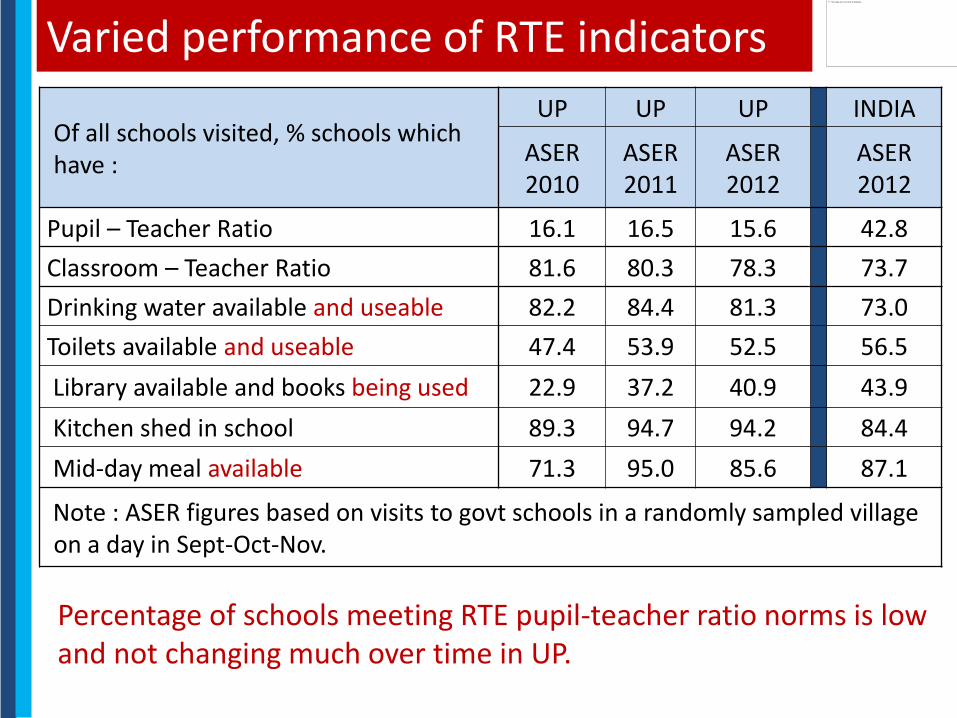
Varied performance of RTE indicators
Of all schools visited, % schools which have :
UP UP UP INDIA
ASER 2010
ASER 2011
ASER 2012
ASER 2012
Pupil – Teacher Ratio 16.1 16.5 15.6 42.8
Classroom – Teacher Ratio 81.6 80.3 78.3 73.7
Drinking water available and useable 82.2 84.4 81.3 73.0
Toilets available and useable 47.4 53.9 52.5 56.5
Library available and books being used 22.9 37.2 40.9 43.9
Kitchen shed in school 89.3 94.7 94.2 84.4
Mid-day meal available 71.3 95.0 85.6 87.1
Note : ASER figures based on visits to govt schools in a randomly sampled village on a day in Sept-Oct-Nov.
Percentage of schools meeting RTE pupil-teacher ratio norms is low and not changing much over time in UP.
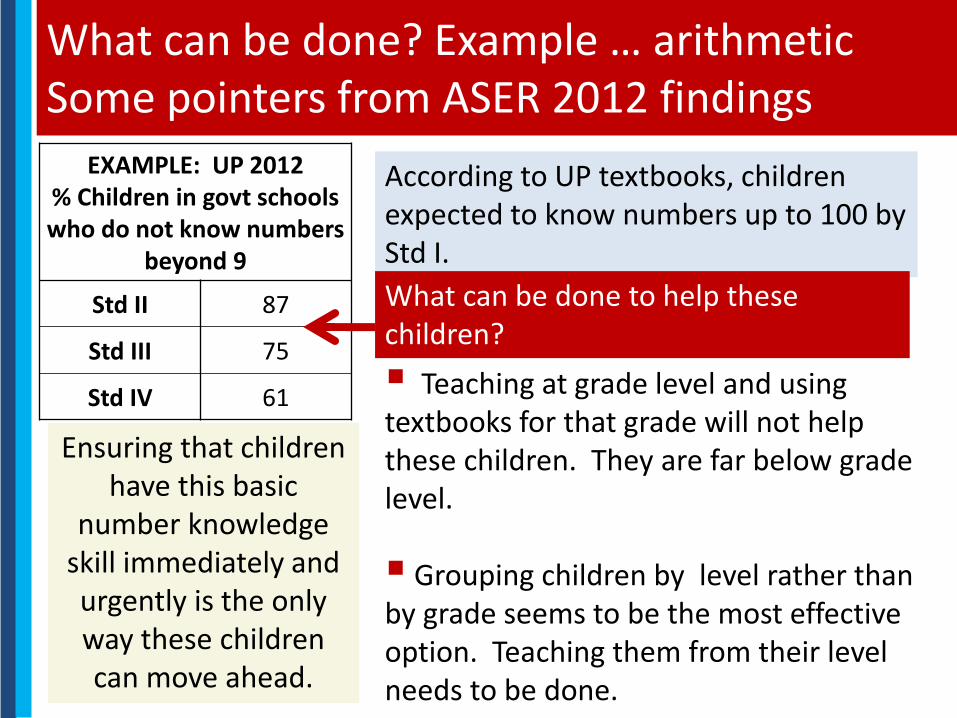
What can be done? Example … arithmetic Some pointers from ASER 2012 findings
EXAMPLE: UP 2012 % Children in govt schools who do not know numbers
beyond 9
Std II 87
Std III 75
Std IV 61 Teaching at grade level and using textbooks for that grade will not help these children. They are far below grade level.
Grouping children by level rather than by grade seems to be the most effective option. Teaching them from their level needs to be done.
Ensuring that children have this basic
number knowledge skill immediately and urgently is the only way these children can move ahead.
According to UP textbooks, children expected to know numbers up to 100 by Std I.
What can be done to help these children?
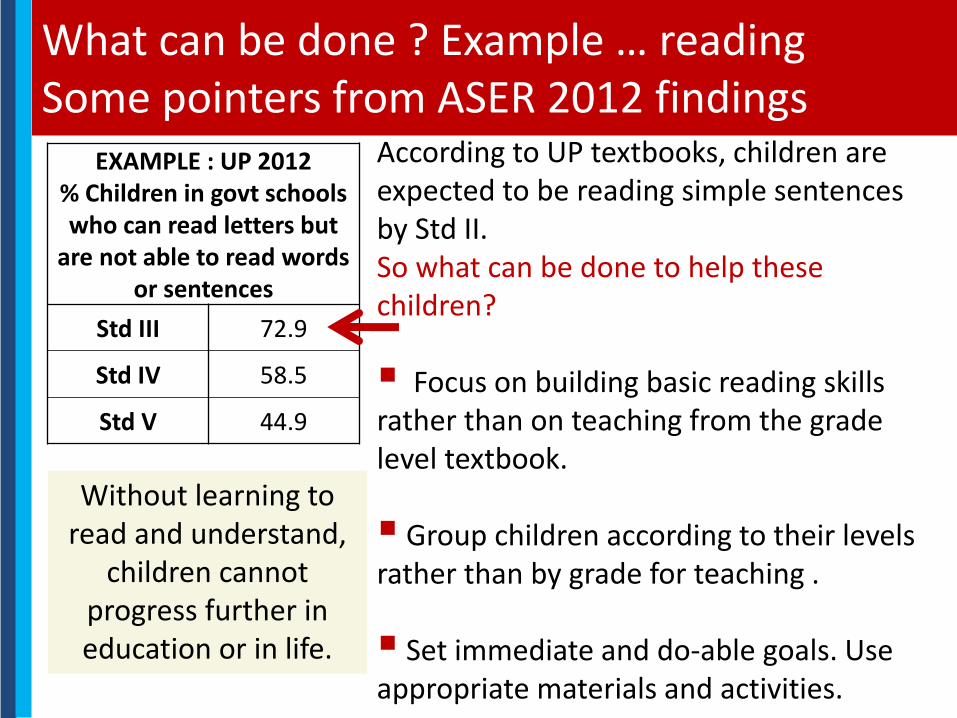
What can be done ? Example … reading Some pointers from ASER 2012 findings
EXAMPLE : UP 2012 % Children in govt schools who can read letters but
are not able to read words or sentences
Std III 72.9
Std IV 58.5
Std V 44.9
According to UP textbooks, children are expected to be reading simple sentences by Std II. So what can be done to help these children? Focus on building basic reading skills rather than on teaching from the grade level textbook.
Group children according to their levels rather than by grade for teaching .
Set immediate and do-able goals. Use appropriate materials and activities.
Without learning to read and understand,
children cannot progress further in education or in life.
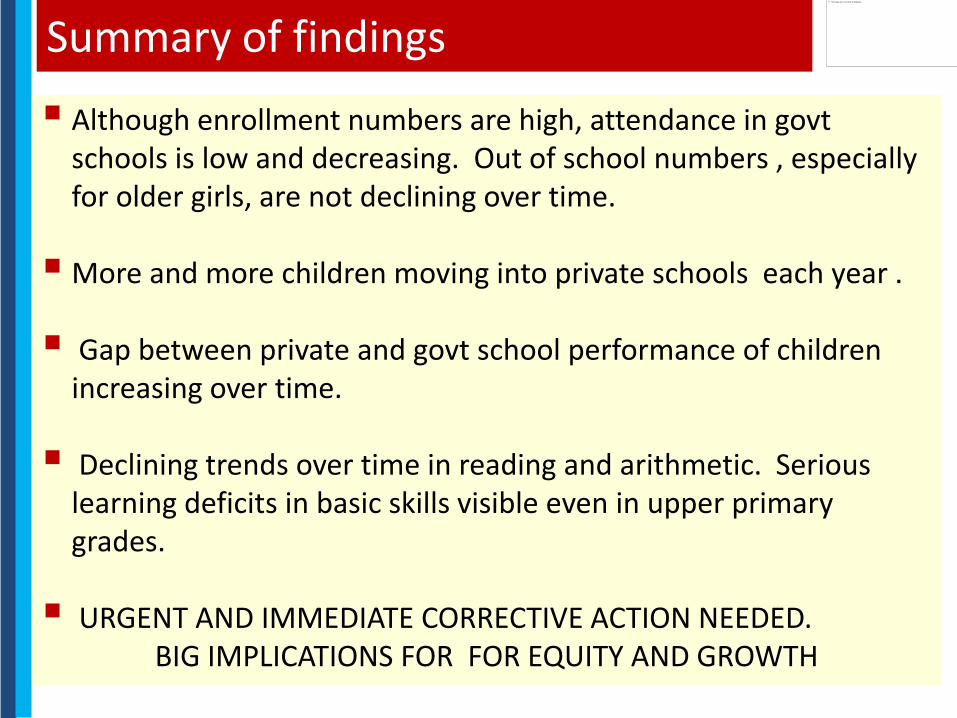
Although enrollment numbers are high, attendance in govt schools is low and decreasing. Out of school numbers , especially for older girls, are not declining over time.
More and more children moving into private schools each year .
Gap between private and govt school performance of children
increasing over time.
Declining trends over time in reading and arithmetic. Serious learning deficits in basic skills visible even in upper primary grades.
URGENT AND IMMEDIATE CORRECTIVE ACTION NEEDED.
BIG IMPLICATIONS FOR FOR EQUITY AND GROWTH
Summary of findings
Urgent and immediate action is needed
Learning outcomes were low but steady prior to 2010. Since 2010, declining trends are visible. Learning deficits from primary grades influence learning outcomes in secondary schools too.
In line with the 12th Plan document, phase wise learning outcome goals need to be immediately articulated for 2013-14 school year. These goals need to be do-able. All systems – teacher training, monitoring and assessment need to be aligned to these goals.
Guarantee of education meaningless without satisfactory learning. Huge implications for equity and growth for UP and for India if basic learning outcomes do not improve soon.
For more information :
www.asercentre.org www.pratham.org
Email :