annual survey of industries 2012 - sri lanka 2012 report.pdf · industries and covers all...
TRANSCRIPT

SRI LANKA
ANNUAL SURVEY OF INDUSTRIES
2012
FINAL REPORT
Department of Census & Statistics
ANNUAL SURVEY OF INDUSTRIES
2012
FINAL REPORT
Department of Census and Statistics
March 2014

Published in 2014.
ISBN 978 - 955 -577-863-3

PREFACE
The Department of Census and Statistics continues to conduct the Annual Survey
of Industries (ASI) which commenced in 1984, replacing the Annual Survey of Manufacturing
Industries and covers all activities categorised under the three industrial divisions, namely Mining
and Quarrying, Manufacturing and Generation and Distribution of Electricity, Gas and Water.
This report provides estimates for important industrial indicators in respect of all
the industrial establishments which had been included in the register of industrial establishments
for the year 2012. Information has been adjusted for non-responding establishments and the
sample data have been inflated.
Any suggestion to improve this survey is most welcome.
Department of Census & Statistics,4th floor & 5th Floor,No 109, Rotunda Tower,Galle Road,Colombo 03.March, 2014
D.C.A. Gunawardena Director General of Census and Statistics
i

ACKNOWLEDGEMENT
The planning, data collection, data processing, tabulation and preparation of this report were done
by the staff of the Industry, Construction, Trade & Services Division under the overall guidance of
Mrs.H.D.E. Somarathne, the Additional Director General (acting). Data collection and manual data pro-
cessing were done under the supervision of Mr. U.S. Wanapushpa, Deputy Director (acting) and Mr.
M.D.M. Fernando, Mr.D.M.N. Bandara, Mrs. B.G. Kumari Premalatha, Senior Statisticians, and Mr.
R.D.N. Premawansa, , Mr. H.R.S.L. Ranathunga, Mrs. G..K.D.H. Menike Statisticians.
Mr. U.S. Wanapushpa, Deputy Director (acting) performed a crucial role in planning and super-
vising of survey work. The Computer assisted Data Processing using the software package SQL Server
was done by Mr. R.M.P.Dharmapriya, ICTA and the Statistical tables were obtained using the SPSS/
PC+.by Mr. R.D.N. Premawansa, Statistician and Mrs. U.V.R.S. Gunawardana, Statistical Officer. Maps
with the important indicators on industries in the country were prepared by Mr. Chaminda Weerasingha,
Statistical Officer, under the Supervision of Mrs. U. Maheshwaran,Deputy Director(acting). Mrs U.V.R.S.
Gunawardana was totally responsible for correction of error printouts, preparing the statistical tables for
report and finalizing the report under the Supervision of Mr. U.S. Wanapushpa, Deputy Director (acting).
Data collection at the follow up stage was done by the field staff attached to the Divisional Secre-
tariat Divisions and Districts under the supervision of District Heads. In addition, the Statistical Officers/
Statistical Assistants/Data Entry Operators/Coding Clerks of the Industry , Construction, Trade & Ser-
vice Division of the Department also engaged in data collection activities under the supervision of Senior
Statisticians/ Statisticians.
The corporation given by the responding establishments by way of providing their information to
make this survey success, is very much appreciated.
iii

CONTENTS
1. INTRODUCTION 1
2. OBJECTIVES 1
3. SCOPE AND COVERAGE 1
4. METHODOLOGY 1
5. CONCEPTS AND DEFINITIONS 4
6. TABLES & CHARTS
PAGE NO.
Table I. Principal indicators of industrial activity classified by industry sector- 2011 (Establishments with 5 or more persons engaged)
Table I.1. Principal indicators of industrial activity classified by industry sector- 2011 (Establishments with 25 or more persons engaged)
Table I.2. Principal indicators of industrial activity classified by industry sector- 2011 (Establishments with less than 25 persons engaged)
Chart 1. Number of establishments by industry sector - 2011(Establishments with 5 or more persons engaged)
Chart 2. Persons engaged by industry sector - 2011(Establishments with 5 or more persons engaged)
Table II. Principal indicators of industrial activity classified by industrydivision - 2011 (Establishments with 5 or more persons engaged)
Table II.1. Principal indicators of industrial activity classified by industrydivision -2011 (Establishments with 25 or more persons engaged)
Table II.2. Principal indicators of industrial activity classified by industrydivision -2011 (Establishments with less than 25 persons engaged)
Chart 3. No. of establishments by industry division -2011(Establishments with 5 or more persons engaged)
Chart 4. Persons engaged by industry division -2011(Establishments with 5 or more persons engaged)
9
9
9
12
13
14
15
v
10
11
10

Chart 5. Input & output values by industry division -2011 (Establishments with 5 16 or more persons engaged)
Chart 6. Value added by industry division - 2011 ( Establishments with 5 or more 17 persons engaged)
Map 1. Number of establishments by district and major industry group- 2011 18 ( Establishments with 5 or more persons engaged)
Map 2. Distribution of persons engaged by district and major industry group- 2011 19 ( Establishments with 5 or more persons engaged)
Map 3. Comparison of value of input and output by district- 2011 20 ( Establishments with 5 or more persons engaged)
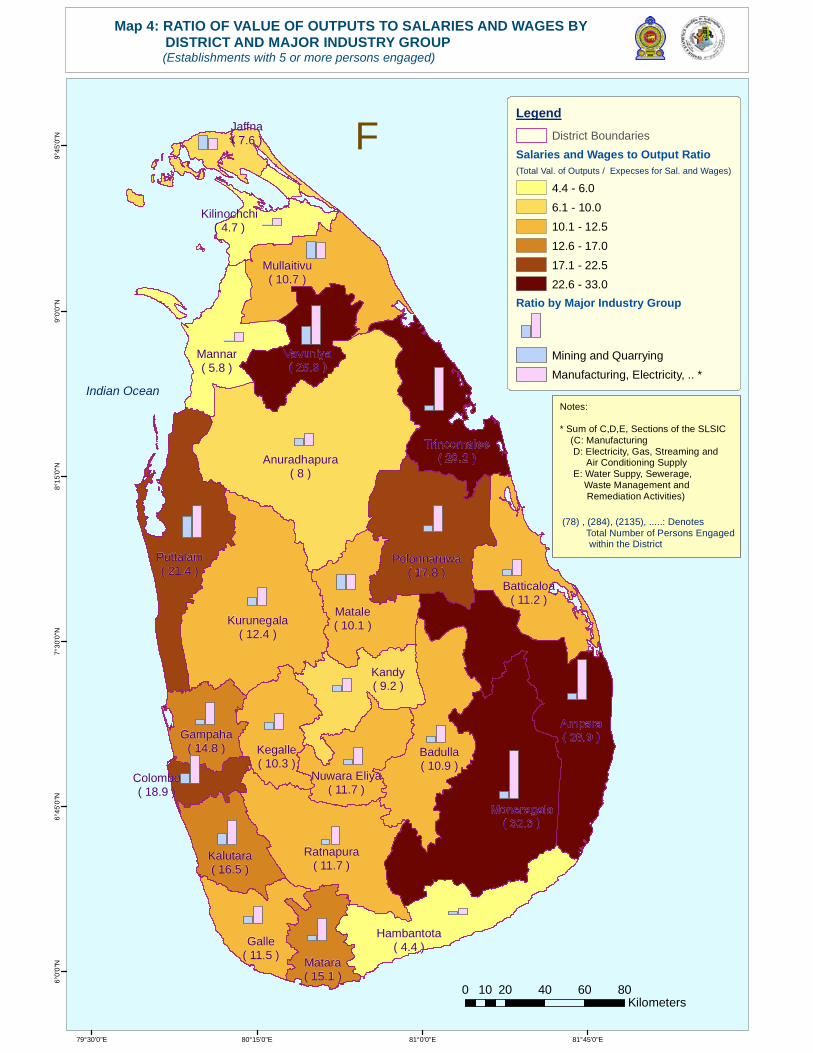
Map 4. Ratio of value of outputs to salaries & wages by district & major 21 industry group- 2011 ( Establishments with 5 or more persons engaged)
Table 1. Principal indicators of industrial activity classified by industry- 2011 22 ( Establishments with 25 or more persons engaged)
Table 2. Principal indicators of industrial activity classified by industry sector & 26 persons engaged size class- 2011 ( Establishments with 5 or more persons engaged)
Tabale 3. Principal indicators of industrial activity classified by industry division & 27 persons engaged size class- 2011 (for manufacturing sector) ( Establishments with 5 or more persons engaged)
Table 4. Principal indicators of industrial activity classified by province & 30 industry division- 2011 ( Establishments with 5 or more persons engaged)
Chart 7. Precentage of covered establishments by province - 2011 35 (Establishments with 5 or more persons engaged)
Table 5. Principal indicators of industrial activity classified by district -2011 36 (Establishments with 5 or more persons engaged) (for manufacturing sector)
Table 6. Principal indicators of industrial activity classified by district -2011 37 (Establishments with 25 or more persons engaged) (for manufacturing sector)
Table 7. Principal indicators of industrial activity classified by district - 2011 38 (Establishments with less than 25 persons engaged) (for manufacturing sector)
Table 8. Establishments classified by persons engaged size class & industry 39 division - 2011 (Establishments with 5 or more persons engaged)
vi
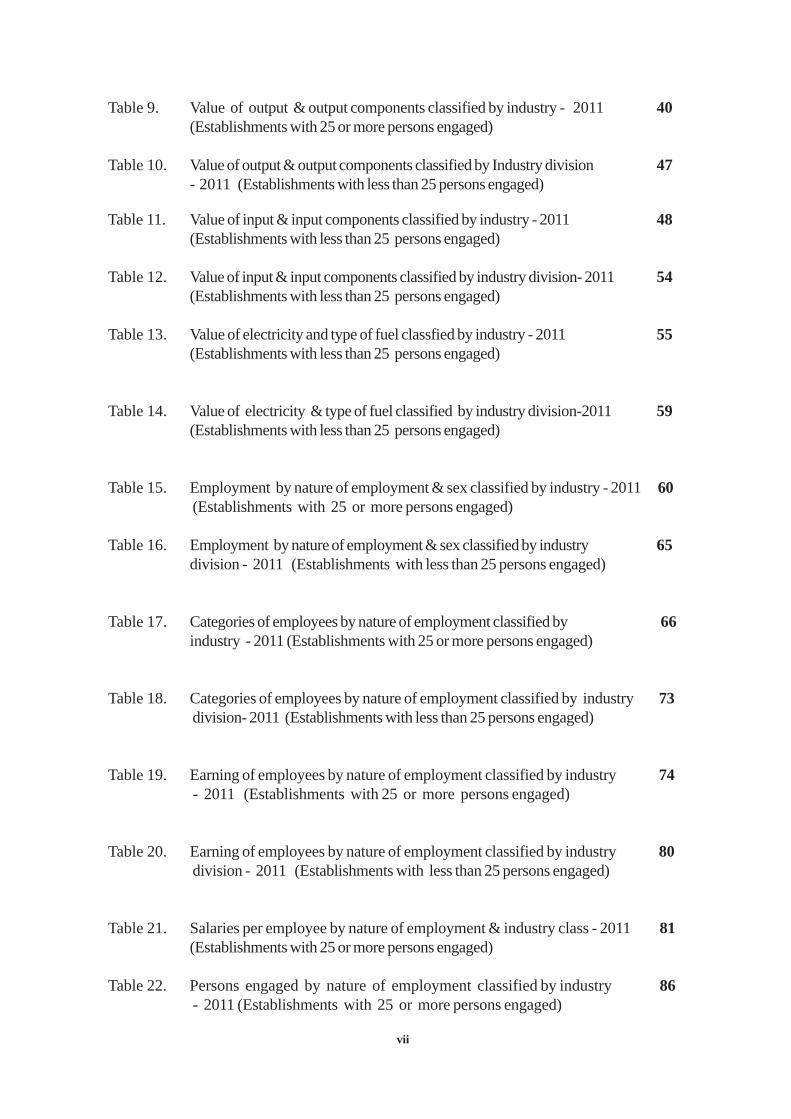
Table 11. Value of input & input components classified by industry - 2011 48(Establishments with less than 25 persons engaged)
Table 12. Value of input & input components classified by industry division- 2011 54(Establishments with less than 25 persons engaged)
Table 13. Value of electricity and type of fuel classfied by industry - 2011 55(Establishments with less than 25 persons engaged)
Table 14. Value of electricity & type of fuel classified by industry division-2011 59(Establishments with less than 25 persons engaged)
Table 15. Employment by nature of employment & sex classified by industry - 2011 60 (Establishments with 25 or more persons engaged)
Table 16. Employment by nature of employment & sex classified by industry 65division - 2011 (Establishments with less than 25 persons engaged)
Table 17. Categories of employees by nature of employment classified by 66industry - 2011 (Establishments with 25 or more persons engaged)
Table 18. Categories of employees by nature of employment classified by industry 73 division- 2011 (Establishments with less than 25 persons engaged)
Table 19. Earning of employees by nature of employment classified by industry 74 - 2011 (Establishments with 25 or more persons engaged)
Table 20. Earning of employees by nature of employment classified by industry 80 division - 2011 (Establishments with less than 25 persons engaged)
Table 21. Salaries per employee by nature of employment & industry class - 2011 81(Establishments with 25 or more persons engaged)
Table 22. Persons engaged by nature of employment classified by industry 86 - 2011 (Establishments with 25 or more persons engaged)
vii
Table 9. Value of output & output components classified by industry - 2011 40(Establishments with 25 or more persons engaged)
Table 10. Value of output & output components classified by Industry division 47- 2011 (Establishments with less than 25 persons engaged)

Table 23. Persons engaged by nature of employment classified by industrydivision 93- 2011(Establishments with less than 25 persons engaged)
Table 24. Value of assets (at the beginning of the year) classified by industry - 2011 94(Establishments with 25 or more persons engaged)
Table 25. Value of assets (at the beginning of the year) classified by industry division 99- 2011 (Establishments with less than 25 persons engaged)
Table 26. Value of gross additions to the fixed assets during the year classified by 100industry - 2011 (Establishments with 25 or more persons engaged)
Table 27. Value of gross additions to the fixed assets during the year classified by 105industry division - 2011 (Establishments with less than 25 persons engaged)
Table 28. Economic indicators of industrial activity classified by industry class- 2011 106(Establishments with 25 or more persons engaged)
Table 29. Economic indicators of industrial activity classified by industry division 112- 2011 (Establishments with less than 25 persons engaged)
Table 30. Principal indicators of industrial activity classified by investment size 113class - 2011 (Establishments with 25 or more persons engaged)
Table 31. Principal indicators of industrial activity classified by investment size 119class - 2011 (Establishments with less than 25 persons engaged)
APPENDIX
Appendix 1. Industry division code & description (2 digit level) 124
Appendix 2. Group of industry code & description (3 digit level) 125
Appendix 3. Class of industry code & description (4 digit level) 127
viii

Annual Survey of Industries - 2012
1. Introduction
The Department of Census and Statistics (DCS) started to conduct its series of AnnualSurvey of Manufacturing Industries (ASMI) in 1979 with the reference year as the previous year1978. The frame of this survey was restricted to manufacturing establishments registered with theMinistry of Industries and the State owned industrial establishments. (i.e. Public Corporations, De-partmental undertakings, Govt. owned Business undertakings). The last survey of this series wascarried out in 1982. After the Census of Industry conducted in 1983, the ASMI was replaced by theAnnual Survey of Industries (ASI)covering Mining and Quarrying, Manufacturing and Generationand Distribution of Electricity, Gas and Water. The Industrial frame generated from the Census ofIndustry 1983 was used to conduct the series of Annual Survey of Industries from 1984 to 2003.The frame of the new series is the register of industrial establishments which is a product of Census ofIndustry 2003/2004.
This survey is the 27th of the ASI series, conducted in 2012 and the reference period is 2011. Thereport contains important industrial indicators relevant to all establishments with 5 or more persons en-gaged.
2. Objectives
The objectives of the survey arei. to provide indicators of the performance and the structure of the industrial sector.ii. to update the list of industrial establishments already available.
3. Scope and coverage
The scope of the ASI is all activities categorised under three industry divisions namely,Mining and Quarrying, Manufacturing and Generation and Distribution of Electricity, Gas andWater of the International Standard Industrial Classification Revision 3 (ISIC) of the UnitedNations. All private sector establishments, state owned industries and industries coming within the purviewof Board of Investment with 5 or more persons engaged have been covered in this survey.
4. Methodology
ASI is predominantly a postal survey. But the field officers of the Department were sent to the nonresponding establishments to get higher percentage of responses.
1

4.1 The Questionnaire
There were 21 questions in the questionnaire. The first 14 questions were on identification infor-mation. Questions 15 to 18 were on Input and Output and question number 19 and 20 were about theInvestment and Labour of the establishment. Question number 21 was about the Research & Develop-ment. The value of goods moved out, receipts from industrial services done for others and opening andclosing stocks of output were collected to compile the gross output. Inputs were the addition of value ofraw materials consumed for the year 2011, (i.e. Cost of raw materials adjusted for stocks) and the con-sumption of Electricity, Fuel and Water. Book value at the beginning of the year, Gross additions during theyear, and Depreciation were canvassed under the four components of fixed assets namely, Land, Buildingsand Other Constructions, Machinery and Other Equipment and Transport Equipment. The information onemployment and earnings, was collected under two sub categories Nationals and Non nationals. Thenumber of male and female national persons engaged were collected separately, but salaries were can-vassed only for the total number of employees. In addition to the above, non national employees and theirsalaries also were canvassed.
4.2 Data Collection
The questionnaires and instruction manuals along with covering letters were posted to each estab-lishment. For the non responding establishments of all districts, field officers had to visit quite a number oftimes to get the questionnaire completed. The collection of accurate data from industrial establishments isvery tedious and time consuming. Sometimes officers had to visit them several times in order to get a goodresponse.
4.3 Reference Period
Reference period of the survey was the calendar year 2011 (i.e. 1st of January to 31st of Decem-ber). But in some cases, establishments keep records not for the calendar year but for the financial year.(1st of April 2011 to 31st of March 2012) In those situations, financial year data were accepted when therewas no significant differences between two 1st quarters of both years (2011 and 2012). Otherwise esti-mates for the calendar year were accepted.
4.4 Sample Survey Design and Estimation
All industrial establishments with 5 or more persons as in the Census of Industry 2003/2004 wasthe frame (sample population) of ASI.
The whole frame was divided into two sectors as establishments with 25 or more persons engagedand establishments with 5 - 24 persons engaged. All establishments in the 25 or more sector (census part)and a probability sample of 5 to 24 sector (survey part) were canvassed.
This survey part was further stratified according to geographical location, industrial activity andsize. Geographical strata were 25 administrative districts. Industrial activities were defined as the industrydivision levels, (2 digit level of ISIC). The persons engaged size classes which were defined as 5-9, 10-14, 15-19, 20-24, 25 or more persons engaged were used as the size strata.
2
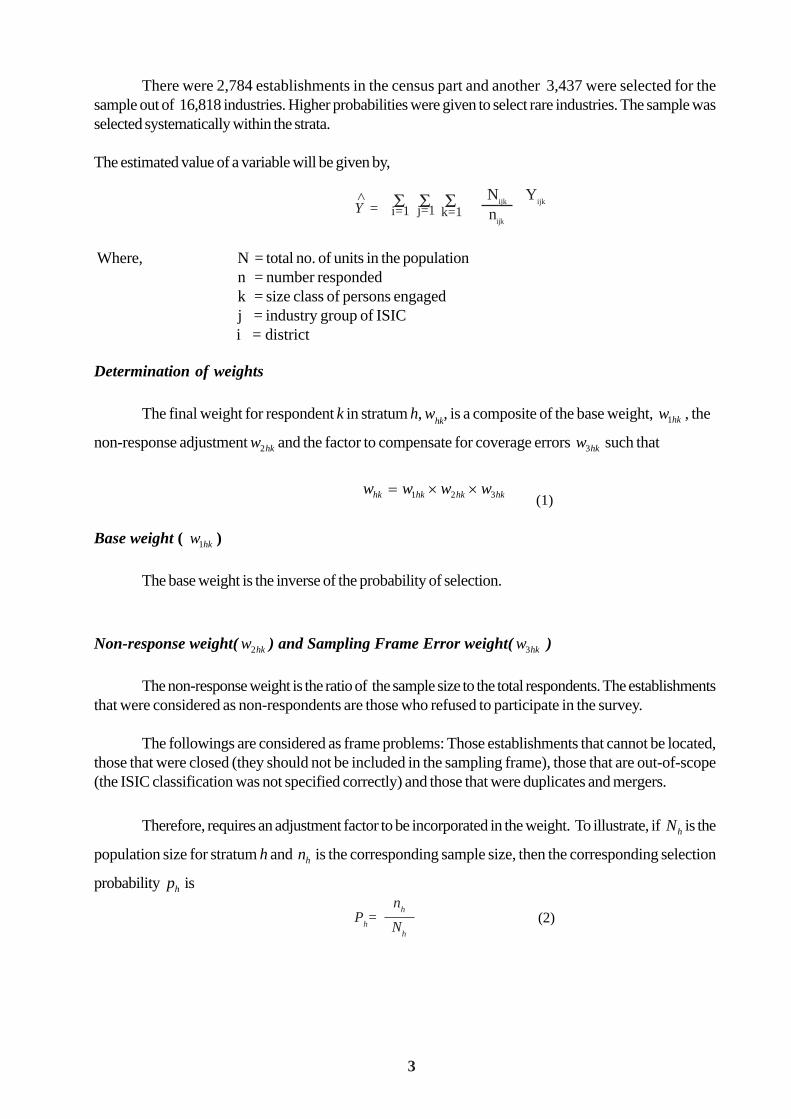
There were 2,784 establishments in the census part and another 3,437 were selected for thesample out of 16,818 industries. Higher probabilities were given to select rare industries. The sample wasselected systematically within the strata.
The estimated value of a variable will be given by,
Where, N = total no. of units in the populationn = number respondedk = size class of persons engagedj = industry group of ISIC
i = district
Determination of weights
The final weight for respondent k in stratum h, whk
, is a composite of the base weight, hkw1 , the
non-response adjustment hkw2 and the factor to compensate for coverage errors hkw3 such that
hkhkhkhk wwww 321
Base weight ( hkw1 )
The base weight is the inverse of the probability of selection.
Non-response weight( hkw2 ) and Sampling Frame Error weight( hkw3 )
The non-response weight is the ratio of the sample size to the total respondents. The establishmentsthat were considered as non-respondents are those who refused to participate in the survey.
The followings are considered as frame problems: Those establishments that cannot be located,those that were closed (they should not be included in the sampling frame), those that are out-of-scope(the ISIC classification was not specified correctly) and those that were duplicates and mergers.
Therefore, requires an adjustment factor to be incorporated in the weight. To illustrate, if hN is the
population size for stratum h and hn is the corresponding sample size, then the corresponding selection
probability hp is
3
Ph=
nh
Nh
(2)
>
Y =
i=1 j=1 k=1N
ijk Y
ijk
nijk
(1)

If given the stratum h, hq1 is the proportion of establishments with frame problems (proportion of
those that should not be included in the frame) and hq2 is the proportion of establishments that were missed
in the frame (those that should be listed but were not included), then the true population size of stratum hshould be
)1( 211
hhhh qqNN (3)
and the frame adjustment weight, hkw3
In the case of this survey, we do not have a measure for q2h.
Please note that we could onlyassume that q
2h is almost 0 because list was updated recently. The final weight as defined by
equation (1).
Estimation
Estimates for each of the strata described above could be derived separately. For example,the estimator for a total in stratum h is
where yhk
is the observed value from the kth sample in stratum h.
4
5. Concepts and Definitions
(5)
The concepts and definitions used in ASI-2012 were broadly in accordance with the UnitedNations recommendations.
5.1 Statistical Unit
Statistical unit of ASI is the establishment which is defined as an unit engaged in single or relatedactivities of Mining and Quarrying, Manufacturing and Generation and Distribution of Electricity, Gas andWater in one location under a single ownership or control. However, industrial enterprises, which areengaged in production of more than one related activity in one location or one activity in several locations,were treated as one unit of enumeration whenever no separate records are available.
Any way in the analysis, the ideal definition of the establishment was followed. The informationcollected at enterprise level was disaggregated into establishment level using the proportion of output.Ancillary units such as warehouses, garages, etc. were treated as part of the main establishments.
5.2 Output
Information on output has been collected on shipment basis. The variables canvassed werethe value of products moved out from the establishment, value of stocks of finished goods andreceipts from industrial services rendered to others.
W3hk
= (1 - q1h
+ q2h
)
Yh = w
hk y
hk
^ k
(4)
5
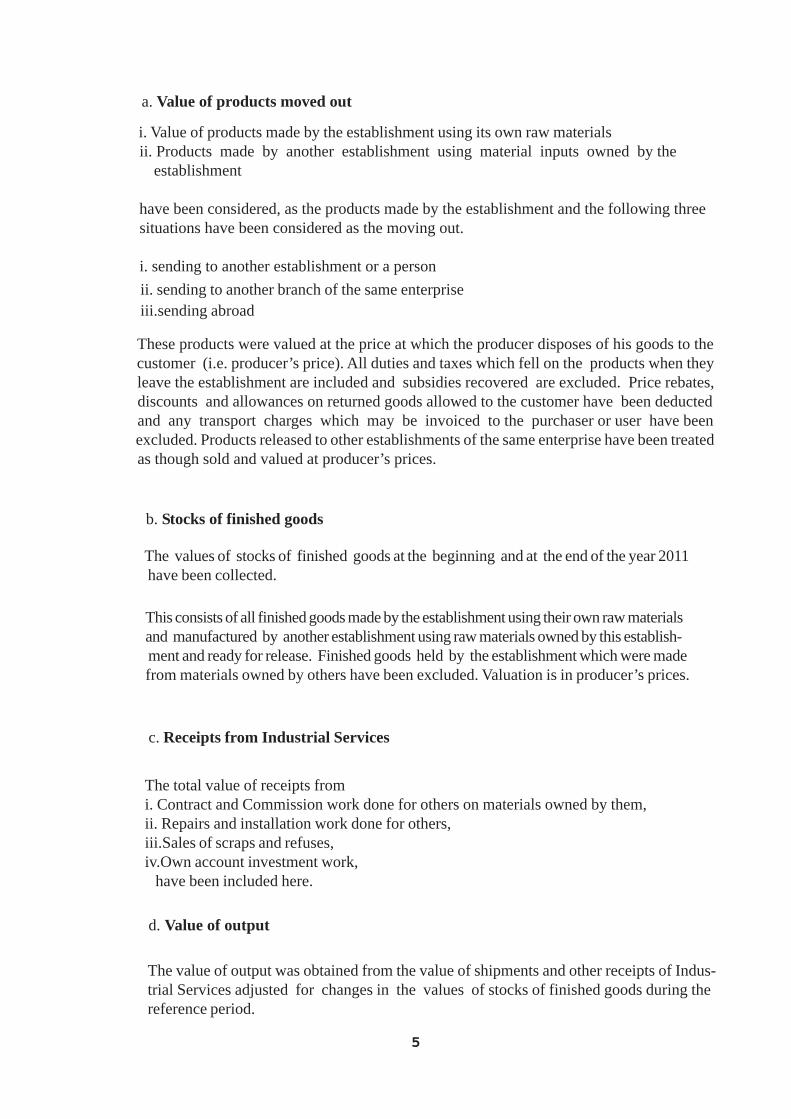
a. Value of products moved out
i. Value of products made by the establishment using its own raw materials ii. Products made by another establishment using material inputs owned by the establishment
have been considered, as the products made by the establishment and the following three situations have been considered as the moving out.
i. sending to another establishment or a person
ii. sending to another branch of the same enterpriseiii.sending abroad
These products were valued at the price at which the producer disposes of his goods to the customer (i.e. producer’s price). All duties and taxes which fell on the products when they leave the establishment are included and subsidies recovered are excluded. Price rebates, discounts and allowances on returned goods allowed to the customer have been deducted and any transport charges which may be invoiced to the purchaser or user have been excluded. Products released to other establishments of the same enterprise have been treated as though sold and valued at producer’s prices.
b. Stocks of finished goods
The values of stocks of finished goods at the beginning and at the end of the year 2011 have been collected.
This consists of all finished goods made by the establishment using their own raw materialsand manufactured by another establishment using raw materials owned by this establish- ment and ready for release. Finished goods held by the establishment which were madefrom materials owned by others have been excluded. Valuation is in producer’s prices.
c. Receipts from Industrial Services
The total value of receipts fromi. Contract and Commission work done for others on materials owned by them,ii. Repairs and installation work done for others,iii.Sales of scraps and refuses,iv.Own account investment work, have been included here.
d. Value of output
The value of output was obtained from the value of shipments and other receipts of Indus-trial Services adjusted for changes in the values of stocks of finished goods during thereference period.

5.3 Inputs
Information on inputs has been collected covering the costs ofa. Raw materials, parts and components and packing materials (Imported and Indigenous) con-
sumed,b. Industrial services done by others for the establishment,c. Fuel, Electricity & Water consumed.
a. Cost of raw materials, parts and components and packing materials
i. Cost of raw materials, packing materials purchased
All material inputs ( Raw materials, parts, components containers and supplies) purchased by the establishment for the production process either in this establishment or in another establishment have been included. All materials have been valued at purchaser’s prices.
6
Value of Output = (Value of products moved out) +(Closing stocks of finished goods) -(Opening stocks of finished goods) +(Receipts from Industrial Services)
ii.Values of stocks of raw materials and packing materials etc.
The opening and closing stocks of all input materials (imported and indigenous) including packing materials which are purchased (or treated as purchased) have been included.
The valuation was at purchaser’s prices. The stocks of raw material used for own account work for producing own fixed assets have been excluded.
i.e. The delivered value at the establishment, including the purchase price transport charges, cost of insurance, all taxes and duties on the goods. Discounts or rebates allowed to the pur- chaser and the value of packing materials returned to the supplier have been deducted.
The value of materials owned by others and received by the establishment for production process have been excluded and material inputs received by the establishment from other establishments of the same enterprise (not purchased) for processing have been valued as if purchased.
b. Cost of industrial services done by others
The total cost ofi. Contract and commission work done by others on materials supplied by the establishments andii. Repairs and maintenance services provided by others are included.
c. Fuel, electricity and water consumed
The total of the values of Fuel (LP Gas, Coal and Charcoal, Petrol, Diesel Oil, Furnace Oil, Kerosene Oil, Firewood and others) Electricity and Water consumed has been included.

5.3.1 Raw Materials Consumed
Raw materials consumed (i.e. actually used) has been computed by adjusting stocks of raw materials to the total value of raw materials (imported and indigenous) and packing materials purchased.
Raw materials and packing materials consumed = (Raw materials and packing materials purchased) (Imported + Indigenous) +
(Opening stocks of materials) - (Closing stocks of materials)
7
5.3.2 Value of Inputs
The total value of raw materials consumed, cost of industrial services done by others andFuel, Electricity and Water consumed have been defined as the value of Inputs.
5.4 Value Added
Value added has been defined as the difference of the value of output and value of inputsi.e. value of Output - value of Inputs.
5.5 Fixed Capital Assets
The book value at the beginning of the year, value of gross additions during the year anddepreciation of all assets with productive life of one year or more, owned by the establishment (i.e.Land, Buildings, Other constructions and Land imporvements, Machinery and Other equipment,Transport equipment) have been collected. Leased or rented assets have not been included.
a. Book value at the beginning of the year
This refers to the original cost price of the item less its depreciation, less assets retired andsold upto the beginning of the year.
This is defined as the total of the costs of new and second hand fixed assets acquired during theyear and alterations, renovations and improvements purchased, cost of own account work less thevalue of sales of used fixed assets.
Valuation of fixed assets acquired from others was to be at the delivered price plus cost ofinstallation and any necessary fees and taxes. Valuation of fixed assets produced own account had tobe valued with imputation for own labour and materials used and an allocation for overhead costs.Value of sales of used assets were to be at actual amounts realise.
5.6 Employment and Earnings
The information obtained on employment related to the number of persons engaged in theestablishment.
a. Number of persons engaged
This is defined as the total number of persons who work in or for the establishment, includingworking proprietors, active partners, unpaid family workers, operatives and all other employees.
b. Gross additions to fixed assets during the year

b. Working proprietors and active partners
All individual proprietors and partners who are actively engaged in the work of the estab-lishment have been included here.
8
c. Unpaid family workers
All persons living in the household of the owners and working in the establishment, with out aregular pay, for at least one third of the normal working time of the establishment and non house-hold members who do work without pay were included.
d. Operatives
All paid employees who were directly engaged in the production or related activities of the establish-ment including any clerical or working supervisory personnel whose function was to record or expediteany step in the production process have been considered as operatives.
e. Other Employees
All paid employees excluding those covered as operatives are reported here, eg. Managers,Directors, Laboratory and Research workers, Clerks, Typists etc.
f. Wages and Salaries
All payments whether in cash or in kind made by the employers during the year 2009 inconnection with the work done to all “ employees” had been included here.
i.e.
i. All regular and overtime cash payments houses and cost of living allowances. ii. Wages and salaries paid during vacation sick leaves iii. Taxes and social insurance contribution iv. Payments in kind.
Note :- Please note that statistical tables referred as establishments with less than 25 persons en-gaged are covered only establishments with 5-24 persons engaged.

Table I : Principal indicators of industrial activity classified by industry sector - 2011(Establishments with 5 or more persons engaged)
2,191 20,392 18,512 2,319,005,242 11,662,142,160 4,094,929,280 7,567,212,879 2,846,202,902
16,341 681,179 666,430 117,005,465,769 1,897,366,715,457 1,119,677,867,953 777,688,847,504 115,537,387,329
37 26,406 26,356 18,994,963,828 266,089,426,761 119,378,551,226 146,710,875,535 31,098,945,835
18,569 727,978 711,297 138,319,434,839 2,175,118,284,378 1,243,151,348,459 931,966,935,919 149,482,536,066
C Mining and Quarrying
D Manufacturing
E Electricity, Gas and Watersupply Total
Industry sector No. ofestablishments
Personsengaged (No.)
Employees(No.)
Salaries &Wages (Rs.)
Value of output(Rs.) Value of input (Rs.) Value added (Rs.)
Gross additionsto fixed assets
(Rs.)
Table I.1 : Principal indicators of industrial activity classified by industry sector - 2011(Establishments with 25 or more persons engaged)
33 4,666 4,610 852,411,966 4,335,779,035 1,574,189,241 2,761,589,794 2,710,670,2442,554 568,171 566,213 104,861,369,716 1,719,832,744,538 1,040,301,335,919 679,531,408,619 112,875,893,623
8 26,103 26,103 18,946,883,053 265,315,645,275 119,305,784,255 146,009,861,020 30,513,910,000
2,595 598,940 596,925 124,660,664,735 1,989,484,168,848 1,161,181,309,415 828,302,859,433 146,100,473,867
C Mining and Quarrying D Manufacturing E Electricity, Gas and Water supply
Total
Industry sector No. ofestablishments
Personsengaged (No.)
Employees(No.)
Salaries &Wages (Rs.)
Value of output(Rs.) Value of input (Rs.) Value added (Rs.)
Gross additionsto fixed assets
(Rs.)
Table I.2 : Principal indicators of industrial activity classified by industry sector - 2011(Establishments with less than 25 persons engaged)
2,158 15,726 13,902 1,466,593,276 7,326,363,125 2,520,740,039 4,805,623,085 135,532,65813,787 113,008 100,217 12,144,096,053 177,533,970,919 79,376,532,034 98,157,438,885 2,661,493,707
29 303 253 48,080,775 773,781,486 72,766,971 701,014,515 585,035,83515,974 129,038 114,372 13,658,770,105 185,634,115,530 81,970,039,045 103,664,076,486 3,382,062,199
C Mining and Quarrying D Manufacturing E Electricity, Gas and Water supply Total
Industry sector No. ofestablishments
Personsengaged (No.)
Employees(No.)
Salaries &Wages (Rs.)
Value of output(Rs.) Value of input (Rs.) Value added (Rs.)
Gross additionsto fixed assets
(Rs.)
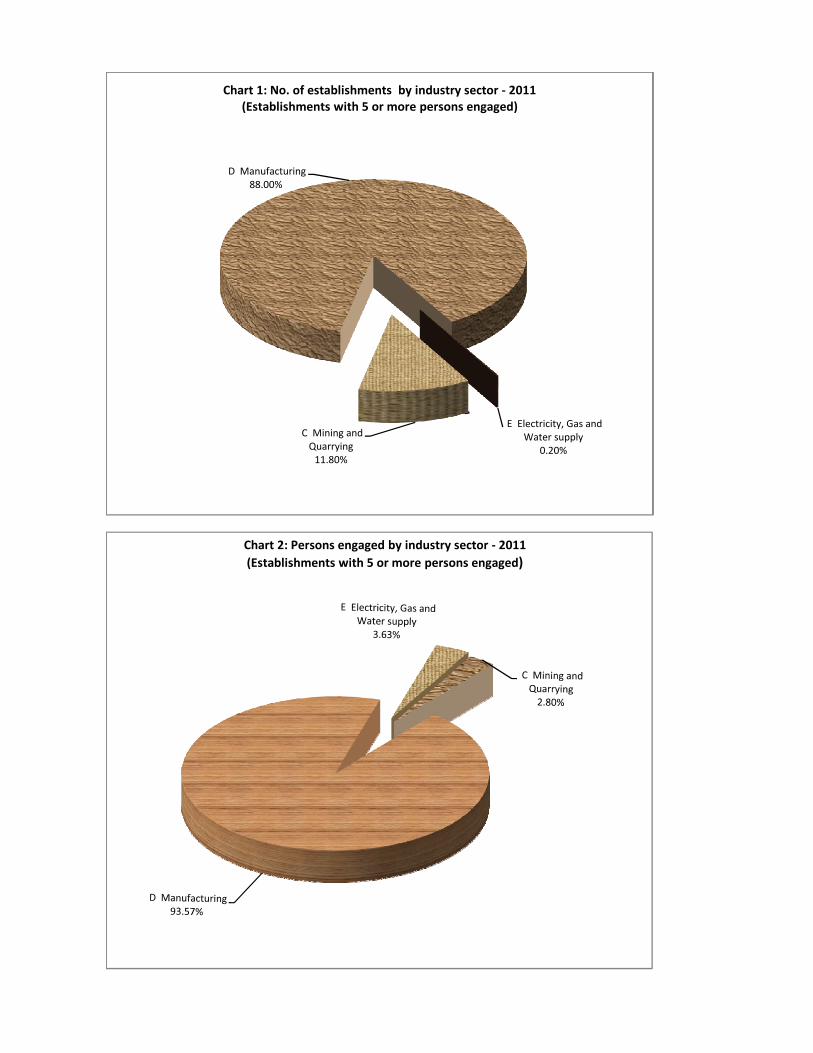
C Mining and Quarrying11.80%
D Manufacturing88.00%
E Electricity, Gas and Water supply
0.20%
Chart 1: No. of establishments by industry sector ‐ 2011(Establishments with 5 or more persons engaged)
Chart 2: Persons engaged by industry sector ‐ 2011
(Establishments with 5 or more persons engaged)

Table II : Principal indicators of industrial activity classified by industry division - 2011(Establishments with 5 or more persons engaged)
2,191 20,392 18,512 2,319,005,242 11,662,142,160 4,094,929,280 7,567,212,879 2,846,202,9024,265 127,131 122,931 22,675,936,653 620,559,858,714 351,627,100,734 268,932,757,980 93,783,185,086
122 5,189 5,038 1,529,172,995 68,932,692,127 3,273,406,724 65,659,285,404 142,175,5171,977 54,342 52,428 9,181,152,820 90,140,591,208 49,952,134,948 40,188,456,260 2,649,999,3201,553 282,254 280,872 41,907,985,736 366,398,311,748 200,599,156,478 165,799,155,270 4,069,802,007
282 10,896 10,638 1,499,397,719 11,499,093,073 7,630,584,922 3,868,508,151 457,545,5191,388 13,188 11,937 1,584,447,667 14,947,023,369 7,817,519,974 7,129,503,395 364,787,159
146 5,716 5,584 944,098,855 12,034,934,041 6,179,117,070 5,855,816,971 271,962,869470 17,856 17,649 4,850,615,031 38,780,942,795 23,537,898,540 15,243,044,255 3,099,659,330
4 2,821 2,792 1,885,565,818 193,500,988,876 188,161,659,151 5,339,329,725 699,548,689511 15,487 15,082 2,857,383,497 73,385,993,156 49,967,477,819 23,418,515,336 770,127,147600 50,152 49,624 9,678,514,129 135,543,828,348 76,960,699,185 58,583,129,163 1,696,741,944
2,275 30,437 28,735 5,374,801,167 101,967,857,712 54,668,828,423 47,299,029,289 2,587,059,715153 4,792 4,677 1,330,159,813 31,461,920,446 24,643,335,003 6,818,585,443 3,476,415,482688 10,007 9,216 1,483,697,937 12,978,336,576 7,144,353,517 5,833,983,059 348,392,348109 3,120 3,036 656,715,502 7,326,445,763 3,935,021,358 3,391,424,406 28,632,124
5 1,872 1,872 299,866,058 1,418,821,827 285,952,810 1,132,869,017 7,224,33377 5,882 5,844 1,497,282,800 23,885,428,142 14,944,009,560 8,941,418,582 100,561,33425 2,941 2,928 657,816,483 10,301,936,258 6,770,324,296 3,531,611,962 67,265,518
4 146 141 25,252,787 158,743,509 33,492,161 125,251,348 2,530,37645 1,414 1,385 285,769,318 3,026,885,728 1,412,456,623 1,614,429,106 19,386,28629 5,316 5,300 1,820,206,932 18,329,589,743 10,538,986,334 7,790,603,409 61,129,485
1,603 29,888 28,403 4,935,005,694 58,847,583,580 28,164,189,214 30,683,394,366 831,887,99210 332 318 44,620,357 1,938,908,717 1,430,163,110 508,745,607 1,367,75015 16,492 16,482 13,762,254,819 252,352,460,353 116,587,512,329 135,764,948,024 17,741,821,03522 9,914 9,874 5,232,709,009 13,736,966,408 2,791,038,897 10,945,927,511 13,357,124,800
18,569 727,978 711,297 138,319,434,839 2,175,118,284,378 1,243,151,348,459 931,966,935,919 149,482,536,066
14 Other Mining and Quarrying 15 Manu.of food products and beverages 16 Manu.of tobacco products 17 Manu.of Textiles 18 Manu.of wearing Apparel, dressing & dyeing of fur 19 Tanning and dressing of leather; manu. of luggage, handbags & footwear 20 Manu.of wood & products of wood & cork except furniture 21 Manu.of paper and paper products 22 Publishing, printing and reproduction of recorded media 23 Manu.of coke refined petroleum products and nuclear fuel 24 Manu.of chemicals & chemical products 25 Manu.of rubber & plastic products 26 Manu. of other non metallic mineral products 27 Manu.of basic metals 28 Manu.of fabricated metal products except machinery equipments 29 Manu.of Machinery & equipments (n.e.c.) 30 Manu.of office, accounting and computing machinery 31 Manu.of Electrical machinery and apparatus n.e.c. 32 Manu.of Radio, TV & communication equipment and apparatus 33 Manu.of medical, precision & optical instruments, watches & clocks 34 Manu.of motor vehicles, trailers and semi-trailers 35 Manu.of other transport equipment 36 Manu.of furniture, Manufacturing of n.e.c. 37 Recycling 40 Electricity, Gas, Steam and Hot water supply 41 Collection, purification and distribution of water Total
Industry division No. ofestablishments
Personsengaged (No.)
Employees(No.)
Salaries &Wages (Rs.)
Value of output(Rs.) Value of input (Rs.) Value added (Rs.)
Gross additionsto fixed assets
(Rs.)

Table II.1 : Principal indicators of industrial activity classified by industry division - 2011(Establishments with 25 or more persons engaged)
33 4,666 4,610 852,411,966 4,335,779,035 1,574,189,241 2,761,589,794 2,710,670,244881 99,578 99,002 19,541,713,428 532,486,602,750 314,056,484,997 218,430,117,753 91,987,756,955
17 4,204 4,180 1,478,961,795 68,562,920,736 3,100,585,830 65,462,334,906 105,375,517186 38,640 38,547 8,077,031,770 82,578,781,387 46,310,510,816 36,268,270,571 2,630,221,535482 273,207 272,883 40,937,707,548 361,925,639,800 198,551,801,233 163,373,838,568 4,059,977,827
38 8,861 8,833 1,308,921,060 10,368,881,235 7,048,096,588 3,320,784,647 455,255,51941 2,979 2,938 483,060,381 6,276,250,996 4,400,958,743 1,875,292,253 238,264,98957 4,814 4,785 841,547,129 11,537,052,838 5,931,043,303 5,606,009,535 268,313,55378 14,330 14,271 4,389,899,177 33,207,888,398 21,594,471,675 11,613,416,723 3,079,567,246
104 11,877 11,798 2,432,560,275 66,049,887,618 45,208,054,601 20,841,833,017 644,055,994253 46,404 46,054 9,134,750,005 125,449,507,277 70,713,725,963 54,735,781,314 1,571,092,410
74 13,701 13,642 3,845,081,170 86,319,357,949 48,517,095,598 37,802,262,351 2,237,571,54736 3,791 3,744 1,154,456,377 29,371,038,077 23,344,344,417 6,026,693,660 3,476,415,48263 5,380 5,284 918,135,127 9,878,114,231 5,824,649,576 4,053,464,655 324,265,34826 2,248 2,225 526,335,594 6,655,399,083 3,619,429,272 3,035,969,811 19,246,124
5 1,872 1,872 299,866,058 1,418,821,827 285,952,810 1,132,869,017 7,224,33332 5,409 5,395 1,412,916,674 22,782,962,306 14,083,594,075 8,699,368,231 99,061,334
9 2,748 2,745 625,932,304 9,965,710,545 6,713,555,782 3,252,154,763 67,162,51811 988 987 227,115,152 2,794,303,051 1,363,206,719 1,431,096,332 18,314,56316 5,154 5,147 1,798,525,682 18,193,432,694 10,453,449,654 7,739,983,040 60,979,485
136 18,793 18,729 3,485,870,690 38,899,050,383 19,878,846,244 19,020,204,139 823,546,1764 259 248 34,592,504 1,495,536,442 1,126,841,978 368,694,464 367,7505 16,364 16,364 13,736,800,432 251,810,915,740 116,544,131,993 135,266,783,747 17,733,000,0008 12,675 12,647 7,116,472,438 207,120,334,450 190,936,288,307 16,184,046,143 13,482,767,417
2,595 598,940 596,925 124,660,664,735 1,989,484,168,848 1,161,181,309,415 828,302,859,433 146,100,473,867
14 Other Mining and Quarrying 15 Manu.of food products and beverages 16 Manu.of tobacco products 17 Manu.of Textiles 18 Manu.of wearing Apparel, dressing & dyeing of fur 19 Tanning and dressing of leather; manu. of luggage, handbags & footwear 20 Manu.of wood & products of wood & cork except furniture 21 Manu.of paper and paper products 22 Publishing, printing and reproduction of recorded media 24 Manu.of chemicals & chemical products 25 Manu.of rubber & plastic products 26 Manu. of other non metallic mineral products 27 Manu.of basic metals 28 Manu.of fabricated metal products except machinery equipments 29 Manu.of Machinery & equipments (n.e.c.) 30 Manu.of office, accounting and computing machinery 31 Manu.of Electrical machinery and apparatus n.e.c. 32 Manu.of Radio, TV & communication equipment and apparatus 34 Manu.of motor vehicles, trailers and semi-trailers 35 Manu.of other transport equipments 36 Manu.of furniture, Manufacturing of n.e.c. 37 Recycling 40 Electricity, Gas, Steam and Hot water supply 99 Other Industry Total
Industry division No. ofestablishments
Personsengaged (No.)
Employees(No.)
Salaries &Wages (Rs.)
Value of output(Rs.) Value of input (Rs.) Value added (Rs.)
Gross additionsto fixed assets

Table II.2 : Principal indicators of industrial activity classified by industry division - 2011(Establishments with less than 25 persons engaged)
2,158 15,726 13,902 1,466,593,276 7,326,363,125 2,520,740,039 4,805,623,085 135,532,6583,384 27,552 23,929 3,134,223,224 88,073,255,964 37,570,615,737 50,502,640,227 1,795,428,131
105 985 858 50,211,200 369,771,391 172,820,894 196,950,498 36,800,0001,791 15,702 13,881 1,104,121,049 7,561,809,821 3,641,624,132 3,920,185,689 19,777,7841,071 9,047 7,990 970,278,189 4,472,671,948 2,047,355,245 2,425,316,703 9,824,180
244 2,035 1,806 190,476,659 1,130,211,838 582,488,334 547,723,504 2,290,0001,347 10,209 8,999 1,101,387,286 8,670,772,373 3,416,561,231 5,254,211,142 126,522,170
89 902 799 102,551,727 497,881,203 248,073,768 249,807,436 3,649,316392 3,526 3,377 460,715,854 5,573,054,397 1,943,426,865 3,629,627,532 20,092,084407 3,611 3,285 424,823,222 7,336,105,538 4,759,423,219 2,576,682,319 126,071,153347 3,748 3,570 543,764,124 10,094,321,071 6,246,973,222 3,847,347,849 125,649,533
2,201 16,736 15,093 1,529,719,997 15,648,499,763 6,151,732,825 9,496,766,938 349,488,168117 1,001 933 175,703,437 2,090,882,370 1,298,990,586 791,891,784 0625 4,627 3,932 565,562,810 3,100,222,345 1,319,703,941 1,780,518,404 24,127,00083 872 811 130,379,908 671,046,680 315,592,086 355,454,595 9,386,00045 473 450 84,366,126 1,102,465,836 860,415,485 242,050,351 1,500,00016 193 183 31,884,179 336,225,713 56,768,514 279,457,199 103,00034 426 398 58,654,166 232,582,677 49,249,904 183,332,774 1,071,72313 162 153 21,681,250 136,157,049 85,536,680 50,620,369 150,000
1,467 11,096 9,675 1,449,135,005 19,948,533,197 8,285,342,970 11,663,190,227 8,341,8176 73 70 10,027,853 443,372,275 303,321,132 140,051,143 1,000,000
10 128 118 25,454,387 541,544,613 43,380,336 498,164,277 8,821,03519 175 135 22,626,388 232,236,873 29,386,635 202,850,238 576,214,8003 31 25 4,428,788 44,127,470 20,515,267 23,612,203 221,648
15,974 129,038 114,372 13,658,770,105 185,634,115,530 81,970,039,045 103,664,076,486 3,382,062,199
14 Other Mining and Quarrying 15 Manu.of food products and beverages 16 Manu.of tobacco products 17 Manu.of Textiles 18 Manu.of wearing Apparel, dressing & dyeing of fur 19 Tanning and dressing of leather; manu. of luggage, handbags & footwear 20 Manu.of wood & products of wood & cork except furniture 21 Manu.of paper and paper products 22 Publishing, printing and reproduction of recorded media 24 Manu.of chemicals & chemical products 25 Manu.of rubber & plastic products 26 Manu. of other non metallic mineral products 27 Manu.of basic metals 28 Manu.of fabricated metal products except machinery equipments 29 Manu.of Machinery & equipments (n.e.c.) 31 Manu.of Electrical machinery and apparatus n.e.c. 32 Manu.of Radio, TV & communication equipment and apparatus 34 Manu.of motor vehicles, trailers and semi-trailers 35 Manu.of other transport equipment 36 Manu.of furniture, Manufacturing of n.e.c. 37 Recycling 40 Electricity, Gas, Steam and Hot water supply 41 Collection, purification and distribution of water 99 Other Industry Total
Industry division No. ofestablishments
Personsengaged (No.)
Employees(No.)
Salaries &Wages (Rs.)
Value of output(Rs.)
Value of input(Rs.)
Value added(Rs.)
Grossadditions tofixed assets

2000
2500
3000
3500
4000
4500 4265
2275
2191
1977
1603
1553
Chart 3: No. of establishments by industry division‐2011(Establishments with 5 or more persons engaged)No. of establishmen
ts
0
500
1000
15001553
1388
688600
511 470
282153 146 122 109 77 45 29 25 22 34
N

282
127
150
200
250
300
No.of persons engaged
(Thousands)
Chart 4: Persons engaged by industry division‐2011(Establishments with 5 or more persons engaged)
54 50
30 3020 18 16 15 13 11 10 10 6 6 5 5 5 3 3 3 4
0
50
100N

36 Manu.of furniture, Manufacturing of n.e.c.
16 Manu.of tobacco products
24 Manu.of chemicals & chemical products
17 Manu.of Textiles
26 Manu. of other non metallic mineral products
25 Manu.of rubber & plastic products
23 Manu.of coke refined petroleum products and nuclear fuel
40 Electricity, Gas, Steam and Hot water supply
18 Manu.of wearing Apparel, dressing & dyeing of fur
15 Manu.of food products and beverages
59
69
73
90
102
136
194
252
366
621
28
3
50
50
55
77
188
117
201
352
Chart 5: Input & output values by industry division‐2011 (Establishments with 5 or more persons engaged)
0 500
99 Other industries
32 Manu.of Radio, TV & communication equipment and apparatu
19 Tanning and dressing of leather; manu. of luggage, hand
14 Other Mining and Quarrying
21 Manu.of paper and paper products
28 Manu.of fabricated metal products except machinery equip
41 Collection, purification and distribution of water
20 Manu.of wood & products of wood & cork except furniture
35 Manu.of other transport equipment
31 Manu.of Electrical machinery and apparatus n.e.c.
27 Manu.of basic metals
22 Publishing, printing and reproduction of recorded media
36 Manu.of furniture, Manufacturing of n.e.c.
0
10
11
12
12
13
14
15
18
24
31
39
59
7
7
8
4
6
7
3
8
11
15
25
24
BillionsValue of input (Rs.) Value of output (Rs.)
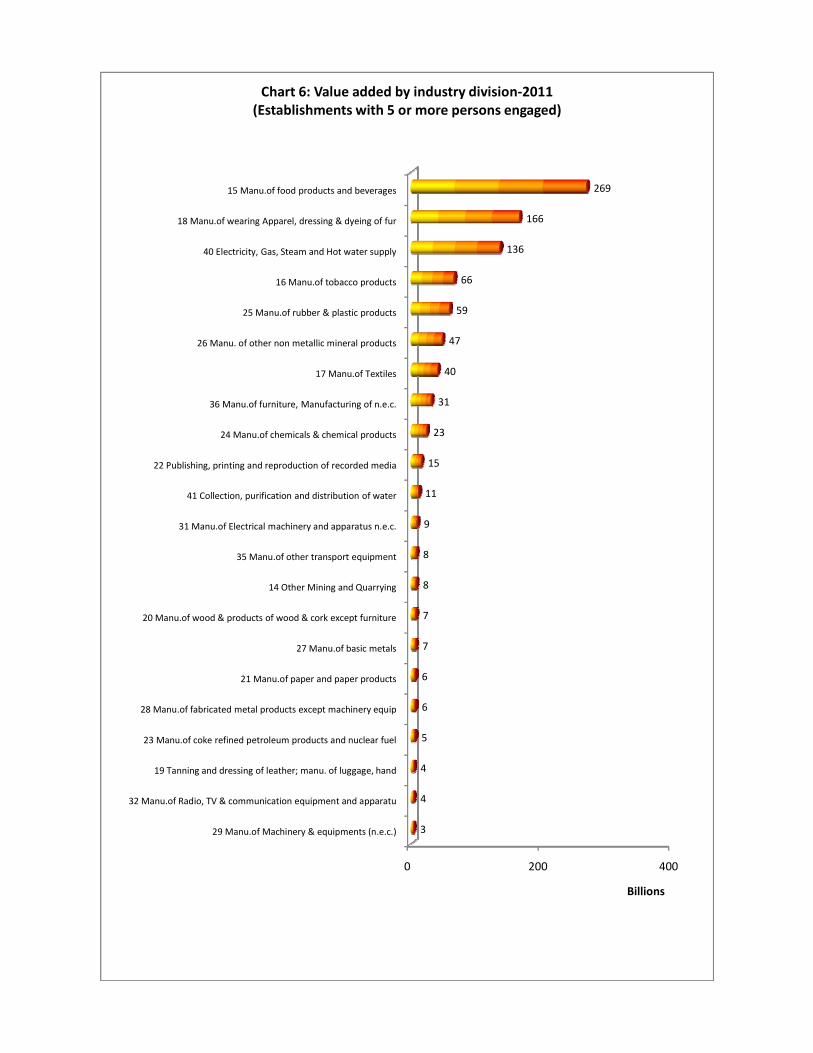
22 Publishing, printing and reproduction of recorded media
24 Manu.of chemicals & chemical products
36 Manu.of furniture, Manufacturing of n.e.c.
17 Manu.of Textiles
26 Manu. of other non metallic mineral products
25 Manu.of rubber & plastic products
16 Manu.of tobacco products
40 Electricity, Gas, Steam and Hot water supply
18 Manu.of wearing Apparel, dressing & dyeing of fur
15 Manu.of food products and beverages
11
15
23
31
40
47
59
66
136
166
269
Chart 6: Value added by industry division‐2011 (Establishments with 5 or more persons engaged)
0 200 400
29 Manu.of Machinery & equipments (n.e.c.)
32 Manu.of Radio, TV & communication equipment and apparatu
19 Tanning and dressing of leather; manu. of luggage, hand
23 Manu.of coke refined petroleum products and nuclear fuel
28 Manu.of fabricated metal products except machinery equip
21 Manu.of paper and paper products
27 Manu.of basic metals
20 Manu.of wood & products of wood & cork except furniture
14 Other Mining and Quarrying
35 Manu.of other transport equipment
31 Manu.of Electrical machinery and apparatus n.e.c.
41 Collection, purification and distribution of water
3
4
4
5
6
6
7
7
8
8
9
11
Billions

Ampara(435)
Anuradhapura(363)
Moneragala(99)
Kurunegala(2,135)
Badulla(299)
Puttalam(1,373)
Ratnapura(844)
Galle(955)
Matale(426)
Mullaitivu(29)
Kandy(1,385)
Polonnaruwa(284)
Mannar(27)
Batticaloa(258)
Kegalle(491)
Trincomalee(78)
Hambantota(206)
Vavuniya(28)
Kalutara(1,129)
Matara(459)
Gampaha(3,278)
Nuwara Eliya(296)
Kilinochchi(3)
Colombo(3,429)
Jaffna(260)
81°45'0"E81°0'0"E80°15'0"E79°30'0"E
9°45
'0"N
9°0'
0"N
8°15
'0"N
7°30
'0"N
6°45
'0"N
6°0'
0"N
F
Indian Ocean
0 20 40 60 8010Kilometers
LegendDistrict Boundaries
Number of Establishments
770
Mining and QuarryingManufacturing, Electricity, .. *
Notes:
* Sum of C,D,E, Sections of the SLSIC (C: Manufacturing D: Electricity, Gas, Streaming and Air Conditioning Supply E: Water Suppy, Sewerage, Waste Management and Remediation Activities)
(78) , (284), (2135), .....: Denotes Total Number of Establishments within the District
Map 1: NUMBER OF ESTABLISHMENTS BY DISTRICT AND MAJOR INDUSTRY GROUP
(Establishments with 5 or more persons engaged)

Ampara(5,563)
Anuradhapura(8,942)
Moneragala(2,036)
Kurunegala(61,364)
Badulla(9,826)
Ratnapura(32,919)
Matale(9,178)
Mullaitivu(215)
Polonnaruwa(7,136)
Mannar(294)
Batticaloa(2,246)
Kandy(39,535)
Trincomalee(1,937)
Hambantota(9,260)
Vavuniya(357)
Puttalam(21,928)
Kegalle(14,713)
Kalutara(51,634)
Galle(39,237)
Matara(14,748)
Gampaha(190,710) Nuwara Eliya
(18,128)
Jaffna(2,549)
Kilinochchi(28)
Colombo(183,498)
81°45'0"E81°0'0"E80°15'0"E79°30'0"E
9°45
'0"N
9°0'
0"N
8°15
'0"N
7°30
'0"N
6°45
'0"N
6°0'
0"N
F
Indian Ocean
0 20 40 60 8010Kilometers
LegendDistrict Boundaries
Number of Persons Engaged
29,000
Mining and QuarryingManufacturing, Electricity, .. *
Notes:
* Sum of C,D,E, Sections of the SLSIC (C: Manufacturing D: Electricity, Gas, Streaming and Air Conditioning Supply E: Water Suppy, Sewerage, Waste Management and Remediation Activities)
(78) , (284), (2135), .....: Denotes Total Number of Persons Engaged within the District
Map 2: DISTRIBUTION OF PERSONS ENGAGED BY DISTRICT AND MAJOR INDUSTRY GROUP
(Establishments with 5 or more persons engaged)

Ampara281
Anuradhapura173
Moneragala318.9
Kurunegala195.4
Badulla198.7
Puttalam355.6
Ratnapura246.9
Matale170.1
Kandy197.8
Galle152.9
Mullaitivu211
Polonnaruwa150.9
Mannar282.2
Batticaloa147.9
Trincomalee133.1
Hambantota225.7
Vavuniya242.7
Kegalle173
Kalutara182.8
Matara288.7
Gampaha156.1
Jaffna221.3
Nuwara Eliya201.5
Kilinochchi150.3
Colombo173
82°30'0"E81°45'0"E81°0'0"E80°15'0"E79°30'0"E
9°45
'0"N
9°0'
0"N
8°15
'0"N
7°30
'0"N
6°45
'0"N
6°0'
0"N
F
Indian Ocean
0 20 40 60 8010Kilometers
Legend
District BoundariesInput, Output Ratio (%)(Val. of Outputs / Val. of Inputs) * 100
130.1 - 140.0
140.1 - 160.0
160.1 - 190.0
190.1 - 270.0
270.1 - 360.0
Percentage Distribution (%)
0.5
Value of Outputs
Value of Inputs
0
100,000
200,000
300,000
400,000
500,000
600,000
700,000
800,000
900,000
1,000,000
Colombo
Gampaha
Kalutara
Kurunegala
Galle
Kan
dy
Ratnap
ura
Nuwara‐Eliya
Puttalam
Kegalle
Matara
Polonnaruwa
Bad
ulla
Ampara
Trincomalee
Matale
Anuradhap
ura
Moneragala
Ham
ban
tota
Batticaloa
Jaffna
Vavuniya
Man
nar
Mullaitivu
Killinochchi
(Output Value ‐Rs. M
illions)
District
VALUE OF TOTAL OUTPUT BY DISTRICT
Notes:
147.9 , 318.9, 201.5, ...: Denotes Total Number of Establishments within the District
of Input and Output
Map 3: COMPARISON OF VALUE OF INPUT AND OUTPUT BY DISTRICT(Establishments with 5 or more persons engaged)
Ampara( 26.9 )
Anuradhapura( 8 )
Moneragala( 32.3 )
Kurunegala( 12.4 )
Badulla( 10.9 )
Puttalam( 21.4 )
Ratnapura( 11.7 )
Kandy( 9.2 )
Matale( 10.1 )
Mullaitivu( 10.7 )
Polonnaruwa( 17.8 )
Mannar( 5.8 )
Batticaloa( 11.2 )
Galle( 11.5 )
Kegalle( 10.3 )
Trincomalee( 29.2 )
Hambantota( 4.4 )
Vavuniya( 25.9 )
Kalutara( 16.5 )
Matara( 15.1 )
Gampaha( 14.8 )
Jaffna( 7.6 )
Nuwara Eliya( 11.7 )
Kilinochchi( 4.7 )
Colombo( 18.9 )
81°45'0"E81°0'0"E80°15'0"E79°30'0"E
9°45
'0"N
9°0'
0"N
8°15
'0"N
7°30
'0"N
6°45
'0"N
6°0'
0"N
F
Map 4: RATIO OF VALUE OF OUTPUTS TO SALARIES AND WAGES BY DISTRICT AND MAJOR INDUSTRY GROUP
Indian Ocean
0 20 40 60 8010Kilometers
Legend
District BoundariesSalaries and Wages to Output Ratio(Total Val. of Outputs / Expecses for Sal. and Wages)
4.4 - 6.06.1 - 10.010.1 - 12.512.6 - 17.017.1 - 22.522.6 - 33.0
Ratio by Major Industry Group
16
Mining and QuarryingManufacturing, Electricity, .. *
(Establishments with 5 or more persons engaged)
Notes:
* Sum of C,D,E, Sections of the SLSIC (C: Manufacturing D: Electricity, Gas, Streaming and Air Conditioning Supply E: Water Suppy, Sewerage, Waste Management and Remediation Activities)
(78) , (284), (2135), .....: Denotes Total Number of Persons Engaged within the District

Table 1 : principal indicators of industrial activity classified by industry - 2011(Establishments with 25 or more persons engaged)
19 1,675 1,665 297,788,318 2,084,581,002 901,287,176 1,183,293,826 2,428,773,30214 1,349 1,340 233,312,632 1,899,106,924 832,820,249 1,066,286,675 2,399,852,654
5 326 325 64,475,686 185,474,078 68,466,927 117,007,151 28,920,64812 2,635 2,589 417,762,968 1,542,354,614 414,723,407 1,127,631,207 255,268,292
4 1,856 1,845 260,182,473 895,486,797 244,036,681 651,450,116 188,370,9225 426 391 30,566,280 77,035,500 11,262,240 65,773,260 184,000
3 353 353 127,014,215 569,832,317 159,424,486 410,407,831 66,713,370
94 11,108 11,044 1,961,965,640 36,146,991,273 19,804,123,488 16,342,867,785 86,677,539,14110 2,655 2,646 550,429,614 7,457,058,490 3,511,512,932 3,945,545,558 3,500,00015 1,230 1,228 221,734,541 9,133,232,797 3,615,822,056 5,517,410,741 10,433,22418 2,166 2,156 395,230,443 5,963,392,019 3,249,550,342 2,713,841,677 86,572,298,56251 5,057 5,014 794,571,042 13,593,307,967 9,427,238,158 4,166,069,809 91,307,35529 4,321 4,307 1,338,391,876 50,561,224,791 36,937,158,277 13,624,066,514 1,154,205,06529 4,321 4,307 1,338,391,876 50,561,224,791 36,937,158,277 13,624,066,514 1,154,205,06531 4,230 4,207 994,927,001 140,248,309,716 104,140,511,126 36,107,798,590 555,864,61626 3,738 3,715 824,863,664 127,031,028,682 96,989,644,942 30,041,383,740 316,042,546
5 492 492 170,063,337 13,217,281,034 7,150,866,184 6,066,414,850 239,822,070693 75,063 74,605 13,591,499,865 269,009,331,393 135,858,855,390 133,150,476,004 3,417,924,517
65 10,646 10,596 2,548,689,785 32,741,765,731 13,260,104,416 19,481,661,315 1,365,734,7413 337 337 67,994,010 7,570,618,980 2,614,772,025 4,955,846,955 7,928,000
13 1,930 1,923 314,187,837 3,814,316,861 2,268,193,576 1,546,123,285 58,373,27217 1,920 1,917 415,118,553 6,425,128,339 3,215,367,882 3,209,760,457 59,850,231
574 58,627 58,260 10,060,485,957 213,229,454,599 111,697,492,484 101,531,962,115 1,882,596,98914 1,254 1,238 139,421,623 4,854,831,134 2,609,057,737 2,245,773,397 43,436,285
7 349 334 45,602,100 373,215,750 193,867,270 179,348,480 5,00029 4,357 4,342 1,428,909,407 27,273,512,350 13,349,747,755 13,923,764,595 167,463,62313 2,464 2,460 925,519,160 21,089,657,427 10,130,746,489 10,958,910,938 106,649,83016 1,893 1,882 503,390,247 6,183,854,923 3,219,001,266 2,964,853,657 60,813,79316 2,664 2,640 1,146,654,679 67,726,690,172 2,783,769,654 64,942,920,518 63,200,347
3 1,368 1,367 404,177,430 771,704,922 221,818,923 549,885,999 51,207,04513 1,296 1,273 742,477,249 66,954,985,250 2,561,950,731 64,393,034,519 11,993,30296 14,051 14,002 2,978,633,287 44,388,748,893 26,089,181,093 18,299,567,800 828,023,64671 7,987 7,945 1,437,685,422 19,176,040,079 13,883,192,262 5,292,847,817 620,501,99825 6,064 6,057 1,540,947,865 25,212,708,814 12,205,988,831 13,006,719,983 207,521,64856 5,332 5,305 1,119,800,410 7,832,676,647 4,245,237,409 3,587,439,238 484,360,25411 984 975 126,695,307 874,178,438 448,850,952 425,327,486 -
3 230 230 29,750,417 169,210,841 100,164,346 69,046,495 -14 1,541 1,533 446,143,567 3,145,964,627 2,345,371,915 800,592,712 832,75416 1,420 1,414 269,630,794 2,226,526,797 694,775,232 1,531,751,565 458,435,000
8 1,013 1,009 230,924,085 1,357,790,944 634,721,154 723,069,790 25,092,5004 145 144 16,656,240 59,005,000 21,353,810 37,651,190 -
32 19,144 19,130 3,966,116,074 30,177,733,148 15,872,183,614 14,305,549,534 1,317,837,63514 10,323 10,321 1,931,113,663 15,649,088,787 8,516,949,117 7,132,139,670 279,004,592
7 5,315 5,315 1,201,583,328 5,431,732,065 2,901,339,220 2,530,392,845 578,910,37211 3,506 3,494 833,419,083 9,096,912,296 4,453,895,277 4,643,017,019 459,922,671
481 273,071 272,747 40,907,472,921 361,797,394,500 198,505,992,762 163,291,401,739 4,059,915,070481 273,071 272,747 40,907,472,921 361,797,394,500 198,505,992,762 163,291,401,739 4,059,915,070
Group Total 1411 Quarrying of stone Clay and Sand 1412 Braking of Granite
141 Quarrying of stone Clay and Sand
Group Total 1422 Extraction of salt 1423 Mining of precious and semi precious stones 1429 Other Mining & Quarrying N.e.c
142 Mining and Quarrying n.e.c
Group Total 1511 Processing and Preserving of Meat and Meat Products 1512 Processing and Preserving of fish and fish Products 1513 Processing & Preserving of fruits & Vegetables 1514 Manufacture of Vegetable oils animal oils & fats
151 Produ., proce. & preserving ofmeat, fish,fruit, vegetables, oils & fats
Group Total 1520 Manufacture of Dairy Products
152 Manufacture of Dairy Products
Group Total 1531 Manufacture of Grain Mill Products 1533 Preparation of Animal food from milling waist
153 Manu.of grain mill products andprepared animal feeds
Group Total 1541 Manufacture of bakery products 1542 Manufacture of Cane sugar and molasses 1543 Manu.of cocoa, chocolate and sugar confectionary 1544 Manu. of macaroni, noodles couscous and similar farinaceous 1546 Manu.of tea and tea products 1547 Manu.of chilly-power, condiments powder, proce.of spices 1549 Manu.of other food products n.e.c
154 Manu.of other food products
Group Total 1551 Manufacture of beverages 1554 Manu.of beverages such as soft drinks, soda etc
155 Manu.of beverags
Group Total 1601 Manu.of tabacco products 1602 Manu.of Cigarette, Cigar & Beedi
160 Manu.of tobacco products
Group Total 1711 Prepa. & spinning of Textiles fibres, weaving of textiles 1712 Finishing of Textiles
171 Spinning, weaving and finishing ofTextiles
Group Total 1721 Manu.of made-up textile article, except apparel 1722 Manu.of carpets and rugs 1723 Manu.of Cordage, Rope, twine & netting 1726 Manu. of Laces and embroidered cloths 1727 Manu. of Labels, badges (cloth based) 1729 Cloth and coir based other products
172 Manu.of other Textiles
Group Total 1731 Manufacture of knitted Garments 1732 Manufacture of knitted socks, purses and Hand glouses 1739 Elastomeric Yarn & other rubber thread based products
173 Manu.of knitted and crochetedfabrics and articles
Group Total 1810 Manufacture of weaving Apparel, except fur apparels
181 Manu.of weaving Apparel exceptfur apparels
Type of industryNo. of
establishmentsPersons
engaged (No.)Employees
(No.)Salaries &
Wages (Rs.)Value of output
(Rs.)Value of input
(Rs.)Value added
(Rs.)Gross additionsto fixed assets
(cont.)
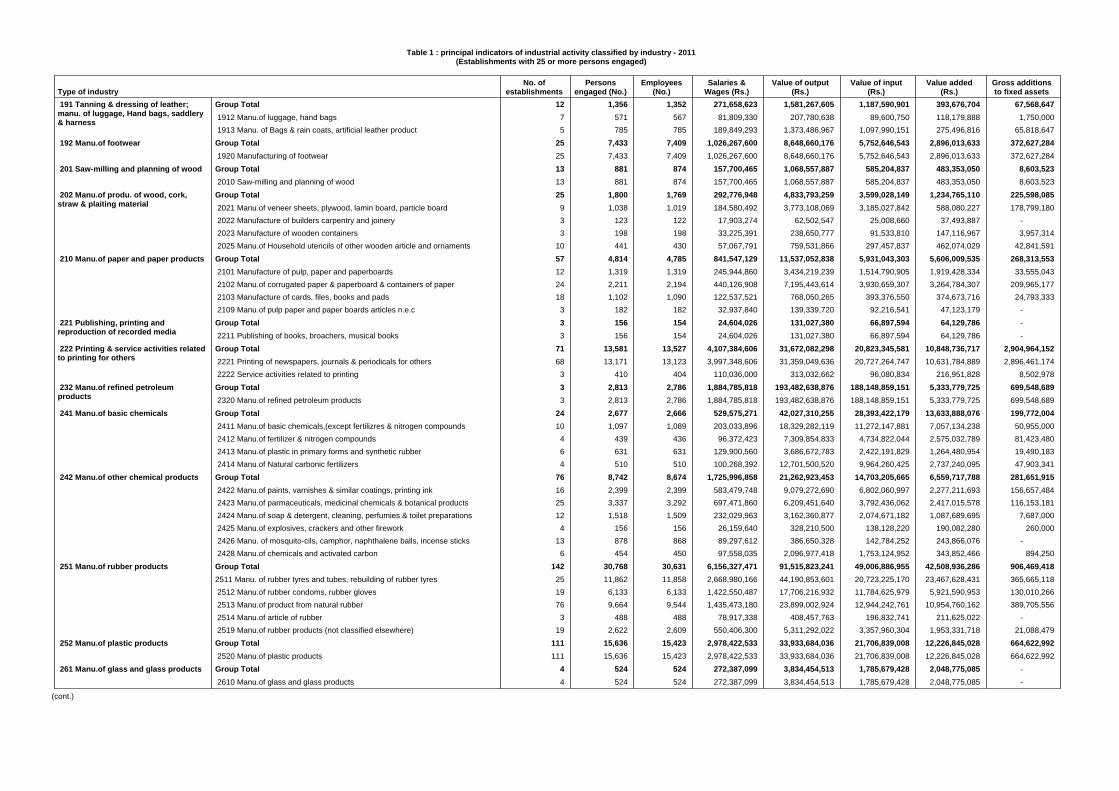
Table 1 : principal indicators of industrial activity classified by industry - 2011(Establishments with 25 or more persons engaged)
12 1,356 1,352 271,658,623 1,581,267,605 1,187,590,901 393,676,704 67,568,6477 571 567 81,809,330 207,780,638 89,600,750 118,179,888 1,750,0005 785 785 189,849,293 1,373,486,967 1,097,990,151 275,496,816 65,818,647
25 7,433 7,409 1,026,267,600 8,648,660,176 5,752,646,543 2,896,013,633 372,627,28425 7,433 7,409 1,026,267,600 8,648,660,176 5,752,646,543 2,896,013,633 372,627,28413 881 874 157,700,465 1,068,557,887 585,204,837 483,353,050 8,603,52313 881 874 157,700,465 1,068,557,887 585,204,837 483,353,050 8,603,52325 1,800 1,769 292,776,948 4,833,793,259 3,599,028,149 1,234,765,110 225,598,085
9 1,038 1,019 184,580,492 3,773,108,069 3,185,027,842 588,080,227 178,799,1803 123 122 17,903,274 62,502,547 25,008,660 37,493,887 -3 198 198 33,225,391 238,650,777 91,533,810 147,116,967 3,957,314
10 441 430 57,067,791 759,531,866 297,457,837 462,074,029 42,841,59157 4,814 4,785 841,547,129 11,537,052,838 5,931,043,303 5,606,009,535 268,313,55312 1,319 1,319 245,944,860 3,434,219,239 1,514,790,905 1,919,428,334 33,555,04324 2,211 2,194 440,126,908 7,195,443,614 3,930,659,307 3,264,784,307 209,965,17718 1,102 1,090 122,537,521 768,050,265 393,376,550 374,673,716 24,793,333
3 182 182 32,937,840 139,339,720 92,216,541 47,123,179 -3 156 154 24,604,026 131,027,380 66,897,594 64,129,786 -3 156 154 24,604,026 131,027,380 66,897,594 64,129,786 -
71 13,581 13,527 4,107,384,606 31,672,082,298 20,823,345,581 10,848,736,717 2,904,964,15268 13,171 13,123 3,997,348,606 31,359,049,636 20,727,264,747 10,631,784,889 2,896,461,174
3 410 404 110,036,000 313,032,662 96,080,834 216,951,828 8,502,9783 2,813 2,786 1,884,785,818 193,482,638,876 188,148,859,151 5,333,779,725 699,548,6893 2,813 2,786 1,884,785,818 193,482,638,876 188,148,859,151 5,333,779,725 699,548,689
24 2,677 2,666 529,575,271 42,027,310,255 28,393,422,179 13,633,888,076 199,772,00410 1,097 1,089 203,033,896 18,329,282,119 11,272,147,881 7,057,134,238 50,955,000
4 439 436 96,372,423 7,309,854,833 4,734,822,044 2,575,032,789 81,423,4806 631 631 129,900,560 3,686,672,783 2,422,191,829 1,264,480,954 19,490,1834 510 510 100,268,392 12,701,500,520 9,964,260,425 2,737,240,095 47,903,341
76 8,742 8,674 1,725,996,858 21,262,923,453 14,703,205,665 6,559,717,788 281,651,91516 2,399 2,399 583,479,748 9,079,272,690 6,802,060,997 2,277,211,693 156,657,48425 3,337 3,292 697,471,860 6,209,451,640 3,792,436,062 2,417,015,578 116,153,18112 1,518 1,509 232,029,963 3,162,360,877 2,074,671,182 1,087,689,695 7,687,000
4 156 156 26,159,640 328,210,500 138,128,220 190,082,280 260,00013 878 868 89,297,612 386,650,328 142,784,252 243,866,076 -
6 454 450 97,558,035 2,096,977,418 1,753,124,952 343,852,466 894,250142 30,768 30,631 6,156,327,471 91,515,823,241 49,006,886,955 42,508,936,286 906,469,418
25 11,862 11,858 2,668,980,166 44,190,853,601 20,723,225,170 23,467,628,431 365,665,11819 6,133 6,133 1,422,550,487 17,706,216,932 11,784,625,979 5,921,590,953 130,010,26676 9,664 9,544 1,435,473,180 23,899,002,924 12,944,242,761 10,954,760,162 389,705,556
3 488 488 78,917,338 408,457,763 196,832,741 211,625,022 -19 2,622 2,609 550,406,300 5,311,292,022 3,357,960,304 1,953,331,718 21,088,479
111 15,636 15,423 2,978,422,533 33,933,684,036 21,706,839,008 12,226,845,028 664,622,992111 15,636 15,423 2,978,422,533 33,933,684,036 21,706,839,008 12,226,845,028 664,622,992
4 524 524 272,387,099 3,834,454,513 1,785,679,428 2,048,775,085 -4 524 524 272,387,099 3,834,454,513 1,785,679,428 2,048,775,085 -
Group Total 1912 Manu.of luggage, hand bags 1913 Manu. of Bags & rain coats, artificial leather product
191 Tanning & dressing of leather;manu. of luggage, Hand bags, saddlery& harness
Group Total 1920 Manufacturing of footwear
192 Manu.of footwear
Group Total 2010 Saw-milling and planning of wood
201 Saw-milling and planning of wood
Group Total 2021 Manu.of veneer sheets, plywood, lamin board, particle board 2022 Manufacture of builders carpentry and joinery 2023 Manufacture of wooden containers 2025 Manu.of Household utencils of other wooden article and ornaments
202 Manu.of produ. of wood, cork,straw & plaiting material
Group Total 2101 Manufacture of pulp, paper and paperboards 2102 Manu.of corrugated paper & paperboard & containers of paper 2103 Manufacture of cards, files, books and pads 2109 Manu.of pulp paper and paper boards articles n.e.c
210 Manu.of paper and paper products
Group Total 2211 Publishing of books, broachers, musical books
221 Publishing, printing andreproduction of recorded media
Group Total 2221 Printing of newspapers, journals & periodicals for others 2222 Service activities related to printing
222 Printing & service activities relatedto printing for others
Group Total 2320 Manu.of refined petroleum products
232 Manu.of refined petroleumproducts
Group Total 2411 Manu.of basic chemicals,(except fertilizres & nitrogen compounds 2412 Manu.of fertilizer & nitrogen compounds 2413 Manu.of plastic in primary forms and synthetic rubber 2414 Manu.of Natural carbonic fertilizers
241 Manu.of basic chemicals
Group Total 2422 Manu.of paints, varnishes & similar coatings, printing ink 2423 Manu.of parmaceuticals, medicinal chemicals & botanical products 2424 Manu.of soap & detergent, cleaning, perfumies & toilet preparations 2425 Manu.of explosives, crackers and other firework 2426 Manu. of mosquito-cils, camphor, naphthalene balls, incense sticks 2428 Manu.of chemicals and activated carbon
242 Manu.of other chemical products
Group Total2511 Manu. of rubber tyres and tubes, rebuilding of rubber tyres 2512 Manu.of rubber condoms, rubber gloves 2513 Manu.of product from natural rubber 2514 Manu.of article of rubber 2519 Manu.of rubber products (not classified elsewhere)
251 Manu.of rubber products
Group Total 2520 Manu.of plastic products
252 Manu.of plastic products
Group Total 2610 Manu.of glass and glass products
261 Manu.of glass and glass products
Type of industryNo. of
establishmentsPersons
engaged (No.)Employees
(No.)Salaries &
Wages (Rs.)Value of output
(Rs.)Value of input
(Rs.)Value added
(Rs.)Gross additionsto fixed assets
(cont.)

Table 1 : principal indicators of industrial activity classified by industry - 2011(Establishments with 25 or more persons engaged)
67 12,917 12,860 3,522,207,678 81,953,799,545 46,580,828,912 35,372,970,633 2,223,743,82210 4,190 4,190 1,005,820,652 5,846,144,620 3,047,226,503 2,798,918,117 38,169,20417 3,907 3,902 711,717,239 8,555,496,817 4,967,425,255 3,588,071,562 1,658,748,278
8 1,729 1,728 800,726,135 48,897,570,577 26,947,168,585 21,950,401,992 471,962,14526 2,762 2,731 961,547,460 18,387,779,913 11,527,025,425 6,860,754,488 41,643,941
6 329 309 42,396,192 266,807,618 91,983,144 174,824,474 13,220,25414 1,321 1,319 439,344,817 14,853,978,417 12,254,038,338 2,599,940,079 3,151,586,12014 1,321 1,319 439,344,817 14,853,978,417 12,254,038,338 2,599,940,079 3,151,586,12021 2,420 2,375 708,847,560 13,787,784,660 10,579,007,079 3,208,777,581 324,829,362
9 652 607 189,563,551 5,324,914,938 4,107,905,261 1,217,009,677 55,685,52012 1,768 1,768 519,284,009 8,462,869,722 6,471,101,818 1,991,767,904 269,143,84223 2,429 2,423 437,489,353 5,263,484,756 2,957,916,084 2,305,568,672 209,910,93917 1,916 1,910 310,846,334 4,303,550,223 2,553,502,045 1,750,048,178 127,295,561
6 513 513 126,643,019 959,934,533 404,414,039 555,520,494 82,615,37835 2,744 2,660 441,598,830 3,826,467,531 2,314,472,517 1,511,995,014 114,349,06910 625 621 141,855,512 690,928,187 359,429,749 331,498,439 46,788,650
4 378 378 49,179,070 506,148,192 263,868,323 242,279,869 26,482,0614 330 325 53,104,395 842,899,716 650,399,473 192,500,243 -3 311 308 43,417,723 448,149,637 322,446,118 125,703,519 40,139,887
14 1,100 1,028 154,042,130 1,338,341,799 718,328,855 620,012,945 938,4714 478 475 93,710,178 1,661,393,262 839,224,759 822,168,503 7,817,9534 478 475 93,710,178 1,661,393,262 839,224,759 822,168,503 7,817,9537 439 432 93,351,032 449,979,037 273,022,348 176,956,689 277,5664 232 230 63,348,000 308,067,005 172,063,780 136,003,225 -3 207 202 30,003,032 141,912,032 100,958,568 40,953,464 277,5666 714 710 185,569,465 3,288,139,458 1,792,789,869 1,495,349,589 9,148,7876 714 710 185,569,465 3,288,139,458 1,792,789,869 1,495,349,589 9,148,7875 1,872 1,872 299,866,058 1,418,821,827 285,952,810 1,132,869,017 7,224,3335 1,872 1,872 299,866,058 1,418,821,827 285,952,810 1,132,869,017 7,224,3338 1,841 1,837 621,003,608 9,382,953,668 5,705,804,679 3,677,148,989 28,440,3758 1,841 1,837 621,003,608 9,382,953,668 5,705,804,679 3,677,148,989 28,440,375
13 2,099 2,097 515,827,155 7,442,995,292 5,039,662,299 2,403,332,993 25,224,77213 2,099 2,097 515,827,155 7,442,995,292 5,039,662,299 2,403,332,993 25,224,772
4 1,027 1,027 171,375,179 3,199,492,956 1,354,464,466 1,845,028,490 216,0004 1,027 1,027 171,375,179 3,199,492,956 1,354,464,466 1,845,028,490 216,0003 256 251 75,139,240 2,564,171,265 1,849,441,540 714,729,725 43,890,0093 256 251 75,139,240 2,564,171,265 1,849,441,540 714,729,725 43,890,0094 186 183 29,571,492 193,349,125 134,221,091 59,128,034 1,290,1784 186 183 29,571,492 193,349,125 134,221,091 59,128,034 1,290,1785 1,306 1,306 279,754,704 6,236,735,625 4,296,088,538 1,940,647,087 44,082,5185 1,306 1,306 279,754,704 6,236,735,625 4,296,088,538 1,940,647,087 44,082,5183 404 403 112,886,826 1,526,959,736 925,257,256 601,702,480 18,110,4783 404 403 112,886,826 1,526,959,736 925,257,256 601,702,480 18,110,4786 411 411 76,492,329 303,175,508 193,459,481 109,716,027 -6 411 411 76,492,329 303,175,508 193,459,481 109,716,027 -
10 3,905 3,902 1,567,388,646 13,210,543,594 6,400,275,257 6,810,268,337 39,882,3316 2,159 2,156 1,216,437,546 10,990,000,241 4,887,076,566 6,102,923,675 39,869,2954 1,746 1,746 350,951,100 2,220,543,353 1,513,198,691 707,344,662 13,036
Group Total 2691 Manu.of non-structural non-refractory ceramic ware 2693 Manu.of structural non refractory clay & ceramic products 2694 Manu.of cement lime, and plaster 2695 Manu.of articles of concrete, cement & plaster 2696 Cutting, shaping & finishing of rough stones
269 Manu.of Non metallic mineralproducts(Not elsewhere classified
Group Total 2710 Manu.of basic iron & steel
271 Manu.of basic iron & steel
Group Total 2731 Casting of iron & steel 2732 Casting of Non ferrous metals
273 Casting of metals
Group Total 2811 Manu.of structural metal products 2812 Manu.of tanks, resorvoirs & containers of metal except packing containers
281 Manu.of structural metal products,tanks, reservoirs & steam generators
Group Total 2892 Treatment & coating of metal general mechanical engine 2893 Manu.of cutlery, hand tools & general hardware 2895 Manu.of non threaded metal products 2898 Manu.of Containers used for the packing or conveyance 2899 Manu.of other fabricated metal products
289 Manu.of other fabricated metalproducts
Group Total 2912 Manu.of pumps, compressors, taps and valves
291 Manu.of general purposemachinery
Group Total 2921 Manu.of agricultural & forestry machinery 2925 Manu.of machinery for Food, beverage & tobacco proce.
292 Manu.of special purposemachinery
Group Total 2930 Manu.of domestic appliance n.e.c.
293 Manu.of domestic appliance n.e.c.
Group Total 3000 Manu.of office, accounting and computing machinery
300 Manu.of office, accounting andcomputing machinery
Group Total 3110 Manu.of electric motors, generators and transformers
311 Manu.of electronic motors,generators and transformers
Group Total 3120 Manu.of electricity distribution and control apparatus
312 Manu.of electricity distribution andcontrol apparatus
Group Total 3130 Manu.of insulated wire and cables
313 Manu.of insulated wire and cables
Group Total 3140 Manu.of accumulators primary cells and primary batteries
314 Manu.of accumulators primarycells and primary batteries
Group Total 3150 Manu.of electric lamps and lighting equipments
315 Manu.of electric lamps andlighting equipments
Group Total 3210 Manu.of electronic valves, tubes & other
321 Manu.of electronic valves, tubes &other
Group Total 3410 Manu.of motor vehicles
341 Manu.of motor vehicles
Group Total 3420 Manu.of bodies for Motor vehicles, Manu. of trailers &semi-trailers
342 Manu.of bodies for Motor vehicles,Manu. of trailers & semi-trailers
Group Total 3511 Building and repairing of ships 3512 Building and repairing of pleasure & sporting boats
351 Building and repairing of shipsand boats
Type of industryNo. of
establishmentsPersons
engaged (No.)Employees
(No.)Salaries &
Wages (Rs.)Value of output
(Rs.)Value of input
(Rs.)Value added
(Rs.)Gross additionsto fixed assets
(cont.)

Table 1 : principal indicators of industrial activity classified by industry - 2011(Establishments with 25 or more persons engaged)
6 1,249 1,245 231,137,036 4,982,889,100 4,053,174,397 929,714,703 21,097,1546 1,249 1,245 231,137,036 4,982,889,100 4,053,174,397 929,714,703 21,097,154
45 4,811 4,783 811,764,341 16,858,646,950 7,988,886,345 8,869,760,606 220,251,66945 4,811 4,783 811,764,341 16,858,646,950 7,988,886,345 8,869,760,606 220,251,66988 11,290 11,255 2,187,551,985 19,855,278,231 10,814,641,877 9,040,636,354 568,912,90527 2,756 2,749 742,488,217 6,805,122,640 3,516,357,923 3,288,764,717 106,866,08161 8,535 8,506 1,445,063,768 13,050,155,591 7,298,283,954 5,751,871,637 462,046,824
5 16,364 16,364 13,736,800,432 251,810,915,740 116,544,131,993 135,266,783,747 17,733,000,0005 16,364 16,364 13,736,800,432 251,810,915,740 116,544,131,993 135,266,783,747 17,733,000,0003 9,739 9,739 5,210,082,621 13,504,729,535 2,761,652,262 10,743,077,273 12,780,910,0003 9,739 9,739 5,210,082,621 13,504,729,535 2,761,652,262 10,743,077,273 12,780,910,000
56 9,888 9,844 2,392,547,279 27,588,659,716 14,649,474,775 12,939,184,941 516,161,75556 9,888 9,844 2,392,547,279 27,588,659,716 14,649,474,775 12,939,184,941 516,161,755
2,595 598,940 596,925 124,660,664,735 1,989,484,168,848 1,161,181,309,415 828,302,859,433 146,100,473,867
Group Total 3592 Manu.of bicycles & invalid carraiges
359 Manu.of transport equipment n.e.c.
Group Total 3610 Manu.of furniture
361 Manu.of furniture
Group Total 3691 Manu.of jewellery and related articles 3699 Other manufacturing not elsewhere classified
369 Manu.of other product notelsewhere classified
Group Total 4010 Production, collection & distribution of electricity
401 Production, collection &distribution of electricity
Group Total 4100 Collection, purification and distribution of water
410 Collection, purification anddistribution of water
Group Total 9999 Other Industry
999 Other Industry
Total
Type of industryNo. of
establishmentsPersons
engaged (No.)Employees
(No.)Salaries &
Wages (Rs.)Value of output
(Rs.)Value of input
(Rs.)Value added
(Rs.)Gross additionsto fixed assets

Table 2 : Principal indicators of industrial activity classified by Industry sector & persons engaged size class - 2011(Establishments with 5 or more persons engaged)
2,191 20,392 18,512 2,319,005,242 11,662,142,160 4,094,929,280 7,567,212,879 2,846,202,9021,894 12,348 10,997 1,206,334,015 6,136,237,531 2,121,352,216 4,014,885,315 96,543,443
250 3,075 2,612 230,684,621 1,080,495,593 363,708,394 716,787,199 28,939,21426 648 597 68,759,554 271,116,732 77,880,903 193,235,828 41,116,84111 550 541 89,932,692 1,155,331,027 642,598,726 512,732,302 2,314,089,13210 3,770 3,764 723,294,360 3,018,961,277 889,389,041 2,129,572,236 365,514,271
16,341 681,179 666,430 117,005,465,769 1,897,366,715,457 1,119,677,867,953 777,688,847,504 115,537,387,32910,864 71,345 61,155 7,320,019,446 97,155,840,378 43,798,113,709 53,357,726,669 1,892,336,5352,573 34,011 31,734 3,748,340,065 64,818,488,905 28,451,565,992 36,366,922,913 460,382,470
820 22,551 21,794 3,246,305,314 63,192,580,733 33,434,963,425 29,757,617,307 1,534,569,0271,048 67,343 66,816 11,583,402,930 219,756,672,591 117,817,743,849 101,938,928,742 88,554,072,7331,036 485,930 484,930 91,107,398,013 1,452,443,132,850 896,175,480,978 556,267,651,872 23,096,026,564
37 26,406 26,356 18,994,963,828 266,089,426,761 119,378,551,226 146,710,875,535 31,098,945,83517 111 96 8,256,230 76,418,681 7,231,705 69,186,976 848,8009 124 107 24,708,145 515,518,309 47,626,786 467,891,523 8,821,0356 156 138 38,516,056 450,617,400 174,483,742 276,133,658 603,046,0003 185 185 37,407,556 917,871,371 70,183,680 847,687,691 -2 25,830 25,830 18,886,075,841 264,129,001,000 119,079,025,313 145,049,975,687 30,486,230,000
18,569 727,978 711,297 138,319,434,839 2,175,118,284,378 1,243,151,348,459 931,966,935,919 149,482,536,066
Group Totalless than 1010 - 1920 - 3940 - 99100 & above
C Mining andQuarrying
Group Totalless than 1010 - 1920 - 3940 - 99100 & above
D Manufacturing
Group Totalless than 1010 - 1920 - 3940 - 99100 & above
E Electricity, Gasand Water supply
Total
Industry sector & Persons engagedsize class No. of
establishmentsPersons
engaged (No.)Employees
(No.)Salaries &
Wages (Rs.) Value of output (Rs.) Value of input (Rs.) Value added (Rs.)
Gross additionsto fixed assets
(Rs.)

Table 3 : Principal indicators of industrial activity classified by industry division & persons engaged size class - 2011(for manufacturing sector)
(Establishments with 5 or more persons engaged)
4,265 127,131 122,931 22,675,936,653 620,559,858,714 351,627,100,734 268,932,757,980 93,783,185,0863,384 27,552 23,929 3,134,223,224 88,073,255,964 37,570,615,737 50,502,640,227 1,795,428,131
612 35,452 35,143 6,088,984,239 131,122,457,845 59,629,051,357 71,493,406,488 87,580,827,674269 64,126 63,859 13,452,729,189 401,364,144,905 254,427,433,640 146,936,711,265 4,406,929,281122 5,189 5,038 1,529,172,995 68,932,692,127 3,273,406,724 65,659,285,404 142,175,517105 985 858 50,211,200 369,771,391 172,820,894 196,950,498 36,800,000
9 328 311 17,975,714 111,765,006 36,669,167 75,095,839 11,778,3028 3,876 3,869 1,460,986,081 68,451,155,730 3,063,916,663 65,387,239,067 93,597,215
1,977 54,342 52,428 9,181,152,820 90,140,591,208 49,952,134,948 40,188,456,260 2,649,999,3201,791 15,702 13,881 1,104,121,049 7,561,809,821 3,641,624,132 3,920,185,689 19,777,784
125 6,294 6,216 892,518,693 7,552,782,349 4,342,260,696 3,210,521,653 50,861,90461 32,346 32,331 7,184,513,077 75,025,999,039 41,968,250,120 33,057,748,919 2,579,359,631
1,553 282,254 280,872 41,907,985,736 366,398,311,748 200,599,156,478 165,799,155,270 4,069,802,0071,071 9,047 7,990 970,278,189 4,472,671,948 2,047,355,245 2,425,316,703 9,824,180
147 8,195 8,101 959,943,562 3,704,415,726 1,396,940,331 2,307,475,394 14,264,640335 265,012 264,781 39,977,763,986 358,221,224,075 197,154,860,901 161,066,363,173 4,045,713,187282 10,896 10,638 1,499,397,719 11,499,093,073 7,630,584,922 3,868,508,151 457,545,519244 2,035 1,806 190,476,659 1,130,211,838 582,488,334 547,723,504 2,290,00026 1,185 1,161 172,602,006 866,214,465 455,039,059 411,175,406 29,737,86212 7,676 7,672 1,136,319,054 9,502,666,770 6,593,057,529 2,909,609,241 425,517,657
1,388 13,188 11,937 1,584,447,667 14,947,023,369 7,817,519,974 7,129,503,395 364,787,1591,347 10,209 8,999 1,101,387,286 8,670,772,373 3,416,561,231 5,254,211,142 126,522,170
32 1,431 1,405 209,943,047 1,350,919,031 762,719,190 588,199,841 17,505,8379 1,548 1,533 273,117,334 4,925,331,965 3,638,239,553 1,287,092,412 220,759,152
146 5,716 5,584 944,098,855 12,034,934,041 6,179,117,070 5,855,816,971 271,962,86989 902 799 102,551,727 497,881,203 248,073,768 249,807,436 3,649,31643 2,144 2,127 316,970,342 4,320,674,631 1,979,330,616 2,341,344,015 94,931,80814 2,670 2,658 524,576,787 7,216,378,207 3,951,712,687 3,264,665,520 173,381,745
470 17,856 17,649 4,850,615,031 38,780,942,795 23,537,898,540 15,243,044,255 3,099,659,330392 3,526 3,377 460,715,854 5,573,054,397 1,943,426,865 3,629,627,532 20,092,08454 2,879 2,822 624,693,984 6,356,556,891 3,616,282,977 2,740,273,915 344,036,32924 11,451 11,449 3,765,205,193 26,851,331,507 17,978,188,699 8,873,142,808 2,735,530,917
511 15,487 15,082 2,857,383,497 73,385,993,156 49,967,477,819 23,418,515,336 770,127,147407 3,611 3,285 424,823,222 7,336,105,538 4,759,423,219 2,576,682,319 126,071,15366 3,189 3,144 568,216,509 29,018,086,072 18,974,635,832 10,043,450,240 90,965,03738 8,688 8,654 1,864,343,766 37,031,801,546 26,233,418,769 10,798,382,777 553,090,957
Group Totalless than 2525 - 99100 & above
15 Manu.of food products andbeverages
Group Totalless than 2525 - 99100 & above
16 Manu.of tobacco products
Group Totalless than 2525 - 99100 & above
17 Manu.of Textiles
Group Totalless than 2525 - 99100 & above
18 Manu.of wearing Apparel,dressing & dyeing of fur
Group Totalless than 2525 - 99100 & above
19 Tanning & dressing of leather,manu. of luggage, hand bags,Saddlery, Harness & Footwear
Group Totalless than 2525 - 99100 & above
20 Manu.of wood & products ofwood & cork except furniture
Group Totalless than 2525 - 99100 & above
21 Manu.of paper and paperproducts
Group Totalless than 2525 - 99100 & above
22 Publishing, printing andreproduction of recorded media
Group Totalless than 2525 - 99100 & above
24 Manu.of chemicals & chemicalproducts
Industry division & Persons engaged size class No. ofestablishments
Personsengaged (No.)
Employees(No.)
Salaries &Wages (Rs.)
Value of output(Rs.) Value of input (Rs.)
Value added(Rs.)
Gross additionsto fixed assets
(cont.)

Table 3 : Principal indicators of industrial activity classified by industry division & persons engaged size class - 2011(for manufacturing sector)
(Establishments with 5 or more persons engaged)
600 50,152 49,624 9,678,514,129 135,543,828,348 76,960,699,185 58,583,129,163 1,696,741,944347 3,748 3,570 543,764,124 10,094,321,071 6,246,973,222 3,847,347,849 125,649,533137 7,343 7,257 1,160,843,226 21,524,958,817 11,197,961,296 10,326,997,521 314,116,629116 39,061 38,797 7,973,906,779 103,924,548,460 59,515,764,667 44,408,783,793 1,256,975,781
2,275 30,437 28,735 5,374,801,167 101,967,857,712 54,668,828,423 47,299,029,289 2,587,059,7152,201 16,736 15,093 1,529,719,997 15,648,499,763 6,151,732,825 9,496,766,938 349,488,168
45 2,335 2,278 422,008,570 15,696,169,330 11,192,472,676 4,503,696,654 178,828,50429 11,366 11,364 3,423,072,600 70,623,188,619 37,324,622,922 33,298,565,697 2,058,743,043
153 4,792 4,677 1,330,159,813 31,461,920,446 24,643,335,003 6,818,585,443 3,476,415,482117 1,001 933 175,703,437 2,090,882,370 1,298,990,586 791,891,784 -25 1,309 1,264 368,214,598 11,460,714,847 8,022,807,472 3,437,907,375 58,072,94811 2,482 2,480 786,241,779 17,910,323,230 15,321,536,945 2,588,786,285 3,418,342,534
688 10,007 9,216 1,483,697,937 12,978,336,576 7,144,353,517 5,833,983,059 348,392,348625 4,627 3,932 565,562,810 3,100,222,345 1,319,703,941 1,780,518,404 24,127,00046 2,295 2,282 442,206,391 3,745,822,554 2,177,176,158 1,568,646,396 162,060,48917 3,085 3,002 475,928,736 6,132,291,677 3,647,473,418 2,484,818,259 162,204,859
109 3,120 3,036 656,715,502 7,326,445,763 3,935,021,358 3,391,424,406 28,632,12483 872 811 130,379,908 671,046,680 315,592,086 355,454,595 9,386,00018 887 869 182,728,216 1,942,470,765 1,108,388,477 834,082,288 2,279,3848 1,361 1,356 343,607,378 4,712,928,318 2,511,040,795 2,201,887,523 16,966,7404 1,836 1,836 289,284,058 1,389,997,467 283,092,473 1,106,904,994 7,224,3334 1,836 1,836 289,284,058 1,389,997,467 283,092,473 1,106,904,994 7,224,333
77 5,882 5,844 1,497,282,800 23,885,428,142 14,944,009,560 8,941,418,582 100,561,33445 473 450 84,366,126 1,102,465,836 860,415,485 242,050,351 1,500,00019 1,038 1,026 226,130,999 6,184,429,044 3,645,391,188 2,539,037,856 3,890,17813 4,371 4,369 1,186,785,675 16,598,533,262 10,438,202,887 6,160,330,375 95,171,15625 2,941 2,928 657,816,483 10,301,936,258 6,770,324,296 3,531,611,962 67,265,51816 193 183 31,884,179 336,225,713 56,768,514 279,457,199 103,0004 228 225 19,486,500 121,390,859 48,952,769 72,438,090 30,2405 2,520 2,520 606,445,804 9,844,319,686 6,664,603,013 3,179,716,673 67,132,278
45 1,414 1,385 285,769,318 3,026,885,728 1,412,456,623 1,614,429,106 19,386,28634 426 398 58,654,166 232,582,677 49,249,904 183,332,774 1,071,7236 267 267 34,568,378 227,664,093 165,071,199 62,592,894 204,0855 721 720 192,546,774 2,566,638,958 1,198,135,520 1,368,503,438 18,110,478
Group Totalless than 2525 - 99100 & above
25 Manu.of rubber & plasticproducts
Group Totalless than 2525 - 99100 & above
26 Manu. of other non metallicmineral products
Group Totalless than 2525 - 99100 & above
27 Manu.of basic metals
Group Totalless than 2525 - 99100 & above
28 Manu.of fabricated metalproducts except machineryequipments
Group Totalless than 2525 - 99100 & above
29 Manu.of Machinery & equipments(n.e.c.)
Group Total100 & above
30 Manu.of office, accounting andcomputing machinery
Group Totalless than 2525 - 99100 & above
31 Manu.of Electrical machinery andapparatus n.e.c.
Group Totalless than 2525 - 99100 & above
32 Manu.of Radio, TV &communication equipment andapparatus
Group Totalless than 2525 - 99100 & above
34 Manu.of motor vehicles, trailersand semi-trailers
Industry division & Persons engaged size class No. ofestablishments
Personsengaged (No.)
Employees(No.)
Salaries &Wages (Rs.)
Value of output(Rs.) Value of input (Rs.)
Value added(Rs.)
Gross additionsto fixed assets
(cont.)

Table 3 : Principal indicators of industrial activity classified by industry division & persons engaged size class - 2011(for manufacturing sector)
(Establishments with 5 or more persons engaged)
29 5,316 5,300 1,820,206,932 18,329,589,743 10,538,986,334 7,790,603,409 61,129,48513 162 153 21,681,250 136,157,049 85,536,680 50,620,369 150,0005 313 313 55,060,788 496,698,540 353,147,860 143,550,680 6,241,989
11 4,841 4,834 1,743,464,894 17,696,734,154 10,100,301,794 7,596,432,360 54,737,4961,603 29,888 28,403 4,935,005,694 58,847,583,580 28,164,189,214 30,683,394,366 831,887,9921,467 11,096 9,675 1,449,135,005 19,948,533,197 8,285,342,970 11,663,190,227 8,341,817
91 4,697 4,652 789,786,120 9,806,193,108 5,905,298,124 3,900,894,985 152,183,05245 14,096 14,076 2,696,084,570 29,092,857,275 13,973,548,121 15,119,309,155 671,363,1249 228 214 32,657,857 1,631,908,717 1,153,661,110 478,247,607 1,367,7506 73 70 10,027,853 443,372,275 303,321,132 140,051,143 1,000,0003 155 144 22,630,004 1,188,536,442 850,339,978 338,196,464 367,750
10 3,107 3,073 1,933,363,105 193,995,556,745 188,474,513,649 5,521,043,096 702,079,0653 31 25 4,428,788 44,127,470 20,515,267 23,612,203 221,6485 279 278 178,459,817 10,590,691,275 8,265,918,520 2,324,772,755 666,682,4172 2,797 2,770 1,750,474,500 183,360,738,000 180,188,079,862 3,172,658,138 35,175,000
16,341 681,179 666,430 117,005,465,769 1,897,366,715,457 1,119,677,867,953 777,688,847,504 115,537,387,329
Group Totalless than 2525 - 99100 & above
35 Manu.of other transportequipments
Group Totalless than 2525 - 99100 & above
36 Manu.of furniture, Manufacturingof n.e.c.
Group Totalless than 2525 - 99
37 Recycling
Group Totalless than 2525 - 99100 & above
99 Other Industry
Total
Industry division & Persons engaged size class No. ofestablishments
Personsengaged (No.)
Employees(No.)
Salaries &Wages (Rs.)
Value of output(Rs.) Value of input (Rs.)
Value added(Rs.)
Gross additionsto fixed assets
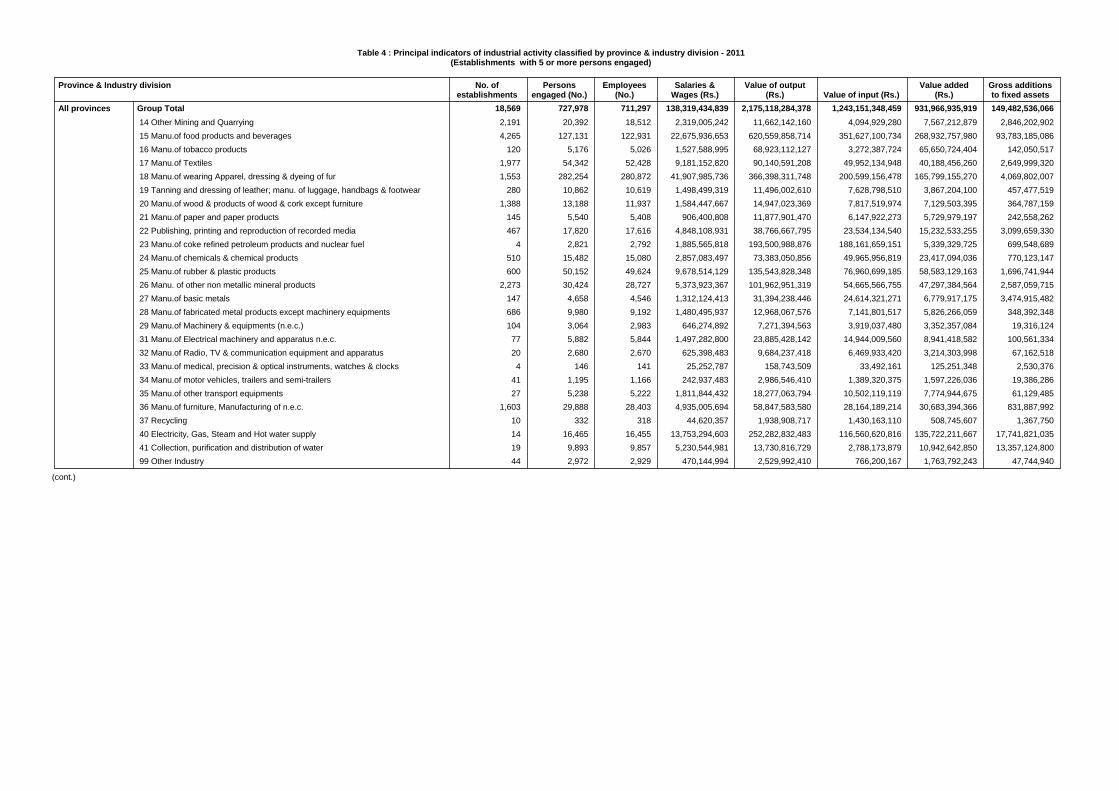
Table 4 : Principal indicators of industrial activity classified by province & industry division - 2011(Establishments with 5 or more persons engaged)
18,569 727,978 711,297 138,319,434,839 2,175,118,284,378 1,243,151,348,459 931,966,935,919 149,482,536,0662,191 20,392 18,512 2,319,005,242 11,662,142,160 4,094,929,280 7,567,212,879 2,846,202,9024,265 127,131 122,931 22,675,936,653 620,559,858,714 351,627,100,734 268,932,757,980 93,783,185,086
120 5,176 5,026 1,527,588,995 68,923,112,127 3,272,387,724 65,650,724,404 142,050,5171,977 54,342 52,428 9,181,152,820 90,140,591,208 49,952,134,948 40,188,456,260 2,649,999,3201,553 282,254 280,872 41,907,985,736 366,398,311,748 200,599,156,478 165,799,155,270 4,069,802,007
280 10,862 10,619 1,498,499,319 11,496,002,610 7,628,798,510 3,867,204,100 457,477,5191,388 13,188 11,937 1,584,447,667 14,947,023,369 7,817,519,974 7,129,503,395 364,787,159
145 5,540 5,408 906,400,808 11,877,901,470 6,147,922,273 5,729,979,197 242,558,262467 17,820 17,616 4,848,108,931 38,766,667,795 23,534,134,540 15,232,533,255 3,099,659,330
4 2,821 2,792 1,885,565,818 193,500,988,876 188,161,659,151 5,339,329,725 699,548,689510 15,482 15,080 2,857,083,497 73,383,050,856 49,965,956,819 23,417,094,036 770,123,147600 50,152 49,624 9,678,514,129 135,543,828,348 76,960,699,185 58,583,129,163 1,696,741,944
2,273 30,424 28,727 5,373,923,367 101,962,951,319 54,665,566,755 47,297,384,564 2,587,059,715147 4,658 4,546 1,312,124,413 31,394,238,446 24,614,321,271 6,779,917,175 3,474,915,482686 9,980 9,192 1,480,495,937 12,968,067,576 7,141,801,517 5,826,266,059 348,392,348104 3,064 2,983 646,274,892 7,271,394,563 3,919,037,480 3,352,357,084 19,316,12477 5,882 5,844 1,497,282,800 23,885,428,142 14,944,009,560 8,941,418,582 100,561,33420 2,680 2,670 625,398,483 9,684,237,418 6,469,933,420 3,214,303,998 67,162,5184 146 141 25,252,787 158,743,509 33,492,161 125,251,348 2,530,376
41 1,195 1,166 242,937,483 2,986,546,410 1,389,320,375 1,597,226,036 19,386,28627 5,238 5,222 1,811,844,432 18,277,063,794 10,502,119,119 7,774,944,675 61,129,485
1,603 29,888 28,403 4,935,005,694 58,847,583,580 28,164,189,214 30,683,394,366 831,887,99210 332 318 44,620,357 1,938,908,717 1,430,163,110 508,745,607 1,367,75014 16,465 16,455 13,753,294,603 252,282,832,483 116,560,620,816 135,722,211,667 17,741,821,03519 9,893 9,857 5,230,544,981 13,730,816,729 2,788,173,879 10,942,642,850 13,357,124,80044 2,972 2,929 470,144,994 2,529,992,410 766,200,167 1,763,792,243 47,744,940
Group Total 14 Other Mining and Quarrying 15 Manu.of food products and beverages 16 Manu.of tobacco products 17 Manu.of Textiles 18 Manu.of wearing Apparel, dressing & dyeing of fur 19 Tanning and dressing of leather; manu. of luggage, handbags & footwear 20 Manu.of wood & products of wood & cork except furniture 21 Manu.of paper and paper products 22 Publishing, printing and reproduction of recorded media 23 Manu.of coke refined petroleum products and nuclear fuel 24 Manu.of chemicals & chemical products 25 Manu.of rubber & plastic products 26 Manu. of other non metallic mineral products 27 Manu.of basic metals 28 Manu.of fabricated metal products except machinery equipments 29 Manu.of Machinery & equipments (n.e.c.) 31 Manu.of Electrical machinery and apparatus n.e.c. 32 Manu.of Radio, TV & communication equipment and apparatus 33 Manu.of medical, precision & optical instruments, watches & clocks 34 Manu.of motor vehicles, trailers and semi-trailers 35 Manu.of other transport equipments 36 Manu.of furniture, Manufacturing of n.e.c. 37 Recycling 40 Electricity, Gas, Steam and Hot water supply 41 Collection, purification and distribution of water 99 Other Industry
All provinces
Province & Industry division No. ofestablishments
Personsengaged (No.)
Employees(No.)
Salaries &Wages (Rs.)
Value of output(Rs.) Value of input (Rs.)
Value added(Rs.)
Gross additionsto fixed assets
(cont.)

Table 4 : Principal indicators of industrial activity classified by province & industry division - 2011(Establishments with 5 or more persons engaged)
7,836 425,841 420,650 97,737,327,968 1,668,420,682,999 998,061,171,079 670,359,511,920 137,668,003,583542 3,862 3,658 394,622,546 2,045,211,730 987,724,066 1,057,487,664 5,250,000
1,244 42,162 41,556 10,435,716,776 391,828,980,324 247,092,161,482 144,736,818,842 89,324,476,70533 3,463 3,428 1,450,472,246 68,412,647,864 3,017,027,666 65,395,620,198 93,382,215
561 35,506 35,026 7,545,878,397 74,297,928,944 44,485,833,532 29,812,095,412 2,582,008,4851,012 165,101 164,382 25,569,424,573 224,470,558,301 126,662,970,214 97,807,588,087 2,234,327,073
212 6,346 6,201 1,050,264,676 6,553,499,304 3,855,405,937 2,698,093,367 274,962,519668 6,733 6,076 811,653,530 9,842,502,748 5,430,347,147 4,412,155,601 258,595,159115 4,631 4,543 808,281,758 10,992,502,861 5,503,759,544 5,488,743,317 215,130,292386 16,796 16,639 4,760,869,596 37,997,285,877 23,289,322,520 14,707,963,357 3,083,450,330
4 2,821 2,792 1,885,565,818 193,500,988,876 188,161,659,151 5,339,329,725 699,548,689302 12,168 11,993 2,506,508,652 69,640,349,069 47,878,164,281 21,762,184,788 713,203,796426 39,131 38,861 7,928,455,765 109,246,504,398 60,577,013,427 48,669,490,972 1,178,346,887618 11,337 11,106 2,648,076,043 53,657,645,247 32,463,523,265 21,194,121,982 1,885,216,810143 4,271 4,161 1,205,352,892 27,752,679,221 21,389,175,974 6,363,503,247 3,434,726,468427 7,442 7,076 1,196,725,981 10,640,019,151 6,295,209,502 4,344,809,650 301,832,34885 2,552 2,489 578,967,532 6,836,520,003 3,614,338,077 3,222,181,927 19,087,35873 5,797 5,773 1,486,586,000 23,551,803,161 14,724,391,828 8,827,411,333 99,061,33420 2,680 2,670 625,398,483 9,684,237,418 6,469,933,420 3,214,303,998 67,162,5184 146 141 25,252,787 158,743,509 33,492,161 125,251,348 2,530,376
33 1,055 1,031 228,453,462 2,951,725,695 1,377,382,378 1,574,343,318 18,110,47827 5,238 5,222 1,811,844,432 18,277,063,794 10,502,119,119 7,774,944,675 61,129,485
881 19,895 19,156 3,749,061,207 49,608,666,811 23,604,601,908 26,004,064,903 621,276,17610 332 318 44,620,357 1,938,908,717 1,430,163,110 508,745,607 1,367,7503 16,230 16,230 13,700,636,216 250,902,207,870 116,480,468,000 134,421,739,870 17,733,000,0005 9,681 9,657 5,198,692,241 13,348,502,696 2,651,527,843 10,696,974,853 12,753,596,0002 464 464 89,946,000 282,999,409 83,455,529 199,543,880 7,224,333
2,107 66,840 64,784 9,541,130,256 97,888,274,330 50,033,657,162 47,854,617,169 1,048,650,443266 2,626 2,404 329,595,597 2,120,440,503 746,173,726 1,374,266,777 84,803,010633 23,219 22,591 3,745,125,177 51,430,095,835 25,356,582,963 26,073,512,872 657,405,02533 361 316 31,432,000 121,386,406 72,421,374 48,965,033 -
165 2,833 2,765 208,890,212 1,179,229,988 500,926,366 678,303,623 10,389,48582 21,137 21,108 3,290,515,288 27,429,496,719 14,353,416,109 13,076,080,610 83,738,12227 2,586 2,555 266,019,198 1,396,508,000 732,788,265 663,719,735 -
197 1,711 1,471 230,592,400 2,491,509,033 1,452,812,584 1,038,696,449 600,0004 238 234 28,086,000 390,432,165 294,049,189 96,382,976 2,767,970
33 282 266 24,498,400 75,226,395 35,586,447 39,639,948 320,00051 831 777 60,528,462 500,250,013 163,000,464 337,249,549 4,408,84817 1,425 1,403 168,578,350 2,832,415,512 2,206,031,286 626,384,226 19,757,841
316 3,543 3,217 430,935,001 3,506,620,769 2,272,429,977 1,234,190,792 112,860,845116 822 537 88,961,000 848,981,520 195,823,155 653,158,365 9,040,000
6 335 331 44,748,400 344,530,270 250,479,225 94,051,045 -151 3,396 3,314 358,885,992 1,856,709,437 1,070,788,070 785,921,367 34,879,297
3 40 40 8,781,850 70,118,675 8,959,933 61,158,742 -3 107 107 13,534,780 162,044,535 111,935,149 50,109,386 27,680,0004 1,350 1,350 211,422,150 1,132,278,557 209,452,882 922,825,675 -
Group Total 14 Other Mining and Quarrying 15 Manu.of food products and beverages 16 Manu.of tobacco products 17 Manu.of Textiles 18 Manu.of wearing Apparel, dressing & dyeing of fur 19 Tanning and dressing of leather; manu. of luggage, handbags & footwear 20 Manu.of wood & products of wood & cork except furniture 21 Manu.of paper and paper products 22 Publishing, printing and reproduction of recorded media 23 Manu.of coke refined petroleum products and nuclear fuel 24 Manu.of chemicals & chemical products 25 Manu.of rubber & plastic products 26 Manu. of other non metallic mineral products 27 Manu.of basic metals 28 Manu.of fabricated metal products except machinery equipments 29 Manu.of Machinery & equipments (n.e.c.) 31 Manu.of Electrical machinery and apparatus n.e.c. 32 Manu.of Radio, TV & communication equipment and apparatu 33 Manu.of medical, precision & optical instruments, watches & clocks 34 Manu.of motor vehicles, trailers and semi-trailers 35 Manu.of other transport equipment 36 Manu.of furniture, Manufacturing of n.e.c. 37 Recycling 40 Electricity, Gas, Steam and Hot water supply 41 Collection, purification and distribution of water 99 Other Industry
Western
Group Total 14 Other Mining and Quarrying 15 Manu.of food products and beverages 16 Manu.of tobacco products 17 Manu.of Textiles 18 Manu.of wearing Apparel, dressing & dyeing of fur 19 Tanning and dressing of leather; manu. of luggage, handbags & footwear 20 Manu.of wood & products of wood & cork except furniture 21 Manu.of paper and paper products 22 Publishing, printing and reproduction of recorded media 24 Manu.of chemicals & chemical products 25 Manu.of rubber & plastic products 26 Manu. of other non metallic mineral products 28 Manu.of fabricated metal products except machinery equipments 29 Manu.of Machinery & equipments (n.e.c.) 36 Manu.of furniture, Manufacturing of n.e.c. 40 Electricity, Gas, Steam and Hot water supply 41 Collection, purification and distribution of water 99 Other Industry
Central
Province & Industry division No. ofestablishments
Personsengaged (No.)
Employees(No.)
Salaries &Wages (Rs.)
Value of output(Rs.) Value of input (Rs.)
Value added(Rs.)
Gross additionsto fixed assets
(cont.)

Table 4 : Principal indicators of industrial activity classified by province & industry division - 2011(Establishments with 5 or more persons engaged)
1,620 63,244 61,130 8,217,428,223 92,909,479,081 49,944,791,589 42,964,687,492 1,955,566,058150 2,524 2,400 352,201,562 1,005,910,831 361,387,284 644,523,547 138,683,026492 21,311 20,637 2,990,602,248 45,191,491,175 23,390,232,268 21,801,258,907 766,561,813
3 138 134 3,238,400 12,689,200 6,517,115 6,172,085 190,000185 2,424 2,169 204,198,444 807,903,592 425,955,343 381,948,249 4,055,926151 26,536 26,224 3,294,356,309 23,013,114,853 11,627,097,519 11,386,017,334 76,882,67817 1,646 1,617 157,513,800 3,275,993,578 2,869,202,004 406,791,574 182,365,000
137 1,212 1,134 116,003,788 477,208,419 210,490,895 266,717,524 4,247,50018 322 283 25,588,450 257,650,700 204,316,054 53,334,647 860,0009 79 70 7,897,250 26,766,205 12,182,095 14,584,110 -
49 627 553 90,648,672 963,136,800 466,137,468 496,999,332 -39 3,150 3,105 612,033,681 7,849,975,212 5,245,059,083 2,604,916,129 193,039,445
190 1,474 1,219 177,996,299 7,985,843,604 4,579,268,675 3,406,574,929 11,751,20315 151 149 15,436,000 56,620,451 25,012,663 31,607,788 -6 113 108 14,538,240 68,436,826 45,936,398 22,500,428 228,7663 92 92 10,639,571 20,710,229 7,488,799 13,221,430 204,085
149 1,257 1,058 111,393,500 1,193,661,940 188,482,042 1,005,179,897 1,344,8173 49 42 13,387,610 171,217,718 15,733,887 155,483,831 575,148,8004 140 137 19,754,400 531,147,750 264,291,997 266,855,753 3,000
347 3,442 2,928 378,443,420 3,650,049,068 1,584,684,981 2,065,364,087 654,975,18232 276 228 36,384,332 346,710,600 128,710,935 217,999,665 24,700,000
184 1,764 1,452 189,342,632 2,172,389,777 1,007,890,030 1,164,499,747 483,550,71914 139 131 10,049,610 173,026,140 110,242,466 62,783,674 16,775,00011 152 148 13,132,293 41,090,515 22,247,482 18,843,033 1,888,38835 226 137 20,204,550 110,490,295 66,033,240 44,457,055 7,627,00024 153 144 15,935,048 73,262,300 43,705,950 29,556,350 29,112,0009 375 369 28,403,460 569,402,745 155,207,168 414,195,577 7,914,0003 127 127 27,075,085 39,469,380 3,094,997 36,374,383 49,972,0755 59 55 11,755,000 45,248,723 32,563,867 12,684,856 21,000,000
26 130 104 20,280,000 33,280,000 1,762,800 31,517,200 3,120,0004 42 34 5,881,410 45,678,593 13,226,046 32,452,547 9,316,000
771 9,746 9,018 1,257,569,464 31,280,513,650 15,553,256,581 15,727,257,070 1,061,811,97345 982 924 120,231,333 398,599,733 229,117,467 169,482,267 50,200,000
346 3,287 2,856 416,207,636 19,515,762,268 7,158,229,950 12,357,532,318 726,951,7716 371 360 4,304,875 33,404,350 14,685,420 18,718,930 19,900,000
46 350 337 11,074,367 11,380,345 2,263,650 9,116,696 4,420,00042 1,890 1,889 289,957,933 1,963,305,008 1,341,425,947 621,879,061 148,835,0933 26 21 2,892,800 15,286,250 5,294,800 9,991,450 -
50 333 308 44,846,450 139,629,233 50,869,896 88,759,337 69,112,5008 65 60 4,732,145 17,576,508 6,107,493 11,469,015 5,175,0003 19 18 2,783,500 17,631,600 11,581,964 6,049,636 785,000
142 1,681 1,590 260,448,530 8,691,474,813 6,540,674,997 2,150,799,816 1,746,33528 194 167 21,958,500 180,168,300 104,586,000 75,582,300 4,295,00048 347 289 37,222,348 122,457,171 47,941,886 74,515,285 986,6674 200 200 40,909,047 173,838,071 40,477,112 133,360,959 29,404,607
Group Total 14 Other Mining and Quarrying 15 Manu.of food products and beverages 16 Manu.of tobacco products 17 Manu.of Textiles 18 Manu.of wearing Apparel, dressing & dyeing of fur 19 Tanning and dressing of leather; manu. of luggage, handbags & footwear 20 Manu.of wood & products of wood & cork except furniture 21 Manu.of paper and paper products 22 Publishing, printing and reproduction of recorded media 24 Manu.of chemicals & chemical products 25 Manu.of rubber & plastic products 26 Manu. of other non metallic mineral products 28 Manu.of fabricated metal products except machinery equipments 29 Manu.of Machinery & equipments (n.e.c.) 34 Manu.of motor vehicles, trailers and semi-trailers 36 Manu.of furniture, Manufacturing of n.e.c. 41 Collection, purification and distribution of water 99 Other Industry
Southern
Group Total 14 Other Mining and Quarrying 15 Manu.of food products and beverages 16 Manu.of tobacco products 17 Manu.of Textiles 18 Manu.of wearing Apparel, dressing & dyeing of fur 20 Manu.of wood & products of wood & cork except furniture 22 Publishing, printing and reproduction of recorded media 24 Manu.of chemicals & chemical products 28 Manu.of fabricated metal products except machinery equipments 36 Manu.of furniture, Manufacturing of n.e.c. 99 Other Industry
Northern
Group Total 14 Other Mining and Quarrying 15 Manu.of food products and beverages 16 Manu.of tobacco products 17 Manu.of Textiles 18 Manu.of wearing Apparel, dressing & dyeing of fur 19 Tanning and dressing of leather; manu. of luggage, handbags & footwear 20 Manu.of wood & products of wood & cork except furniture 22 Publishing, printing and reproduction of recorded media 24 Manu.of chemicals & chemical products 26 Manu. of other non metallic mineral products 28 Manu.of fabricated metal products except machinery equipments 36 Manu.of furniture, Manufacturing of n.e.c. 99 Other Industry
Eastern
Province & Industry division No. ofestablishments
Personsengaged (No.)
Employees(No.)
Salaries &Wages (Rs.)
Value of output(Rs.) Value of input (Rs.)
Value added(Rs.)
Gross additionsto fixed assets
(cont.)

Table 4 : Principal indicators of industrial activity classified by province & industry division - 2011(Establishments with 5 or more persons engaged)
3,508 83,292 79,685 10,900,116,267 157,485,942,952 68,235,417,527 89,250,525,425 4,112,603,413304 2,596 2,343 288,162,798 2,574,292,428 902,252,425 1,672,040,003 2,383,332,855626 8,211 7,560 841,896,749 35,468,095,194 11,633,636,100 23,834,459,094 240,605,43715 347 332 4,679,400 38,852,480 6,699,990 32,152,490 25,000
892 10,928 9,837 1,052,192,598 13,506,487,298 4,366,096,362 9,140,390,936 38,399,969129 40,950 40,814 5,964,504,982 64,284,998,339 33,225,991,747 31,059,006,592 766,960,552
5 78 69 3,886,405 17,665,553 8,364,786 9,300,767 -271 1,952 1,763 225,689,889 1,108,041,658 306,758,546 801,283,111 2,560,000
4 194 194 23,808,000 147,831,792 96,437,555 51,394,237 23,000,00016 172 166 16,723,680 66,829,268 30,675,900 36,153,368 -78 1,331 1,247 125,717,427 1,849,055,736 1,232,771,262 616,284,474 560,00025 1,901 1,734 282,916,329 4,479,560,251 2,935,540,119 1,544,020,132 41,299,150
795 8,802 8,159 1,226,112,010 23,587,557,152 6,669,104,114 16,918,453,038 391,048,0114 387 385 106,771,521 3,641,559,225 3,225,145,297 416,413,928 40,189,014
76 1,201 1,106 136,779,886 1,150,864,631 464,609,622 686,255,008 11,800,0004 28 25 3,059,200 9,933,714 5,023,210 4,910,504 -4 85 71 10,696,800 333,624,981 219,617,732 114,007,249 1,500,0005 48 43 3,844,450 14,110,486 4,449,198 9,661,288 1,071,723
252 3,926 3,687 567,340,044 5,131,907,602 2,847,921,161 2,283,986,441 170,251,7033 155 151 15,334,100 74,675,164 54,322,399 20,352,765 -
647 16,078 15,160 2,154,608,164 25,793,961,323 16,221,474,443 9,572,486,879 1,123,191,303177 1,537 1,255 225,093,487 1,034,766,625 249,705,097 785,061,528 59,435,887321 4,249 3,796 591,028,396 17,542,789,204 11,905,988,039 5,636,801,165 839,763,42621 179 179 7,391,183 9,765,662 4,215,524 5,550,137 666,66719 7,784 7,768 1,033,623,966 5,613,649,671 3,165,714,010 2,447,935,661 26,459,8124 58 56 6,939,000 42,931,775 18,846,999 24,084,776 -5 477 475 67,699,162 746,797,152 459,657,604 287,139,548 22,300,000
61 1,272 1,167 153,694,176 607,111,123 315,748,484 291,362,639 174,561,5113 36 30 4,961,520 11,973,750 3,260,570 8,713,180 -
28 299 254 28,812,260 134,848,000 71,933,000 62,915,000 -8 187 180 35,365,014 49,328,361 26,405,116 22,923,245 4,000
398 11,861 11,517 1,743,538,177 25,319,435,088 10,944,192,457 14,375,242,630 271,883,83694 604 509 76,382,125 300,335,375 73,686,638 226,648,738 27,300,000
149 5,580 5,465 872,063,208 18,306,960,276 6,925,004,429 11,381,955,847 80,134,00029 203 203 9,452,915 74,087,614 45,330,090 28,757,525 -12 4,067 4,062 622,288,267 5,310,844,833 3,250,245,323 2,060,599,510 158,031,8369 296 272 41,713,718 320,540,295 107,354,460 213,185,835 125,0003 102 90 6,406,200 140,147,929 117,871,060 22,276,869 -4 85 77 10,143,156 121,125,550 7,426,788 113,698,762 -
60 516 507 60,415,886 201,857,739 74,524,422 127,333,317 3,475,0005 34 30 3,314,570 10,110,752 3,754,472 6,356,280 425,000
18 184 135 14,409,567 376,884,612 290,950,652 85,933,960 -8 56 51 4,930,350 49,051,780 8,977,000 40,074,780 700,0007 136 117 22,018,216 107,488,333 39,067,125 68,421,208 1,693,000
Group Total 14 Other Mining and Quarrying 15 Manu.of food products and beverages 16 Manu.of tobacco products 17 Manu.of Textiles 18 Manu.of wearing Apparel, dressing & dyeing of fur 19 Tanning and dressing of leather; manu. of luggage, handbags & footwear 20 Manu.of wood & products of wood & cork except furniture 21 Manu.of paper and paper products 22 Publishing, printing and reproduction of recorded media 24 Manu.of chemicals & chemical products 25 Manu.of rubber & plastic products 26 Manu. of other non metallic mineral products 27 Manu.of basic metals 28 Manu.of fabricated metal products except machinery equipments 29 Manu.of Machinery & equipments (n.e.c.) 31 Manu.of Electrical machinery and apparatus n.e.c. 34 Manu.of motor vehicles, trailers and semi-trailers 36 Manu.of furniture, Manufacturing of n.e.c. 99 Other Industry
North-West
Group Total 14 Other Mining and Quarrying 15 Manu.of food products and beverages 17 Manu.of Textiles 18 Manu.of wearing Apparel, dressing & dyeing of fur 20 Manu.of wood & products of wood & cork except furniture 25 Manu.of rubber & plastic products 26 Manu. of other non metallic mineral products 29 Manu.of Machinery & equipments (n.e.c.) 36 Manu.of furniture, Manufacturing of n.e.c. 99 Other Industry
North-Central
Group Total 14 Other Mining and Quarrying 15 Manu.of food products and beverages 17 Manu.of Textiles 18 Manu.of wearing Apparel, dressing & dyeing of fur 20 Manu.of wood & products of wood & cork except furniture 24 Manu.of chemicals & chemical products 25 Manu.of rubber & plastic products 26 Manu. of other non metallic mineral products 28 Manu.of fabricated metal products except machinery equipments 36 Manu.of furniture, Manufacturing of n.e.c. 41 Collection, purification and distribution of water 99 Other Industry
Uva
Province & Industry division No. ofestablishments
Personsengaged (No.)
Employees(No.)
Salaries &Wages (Rs.)
Value of output(Rs.) Value of input (Rs.)
Value added(Rs.)
Gross additionsto fixed assets
(cont.)

Table 4 : Principal indicators of industrial activity classified by province & industry division - 2011(Establishments with 5 or more persons engaged)
1,335 47,633 46,425 6,389,272,900 72,369,945,887 32,572,702,640 39,797,243,246 1,585,850,276581 5,385 4,792 496,331,463 1,835,874,336 416,171,643 1,419,702,693 72,498,123270 17,348 17,018 2,593,953,830 39,103,294,661 17,157,375,474 21,945,919,187 663,736,19116 358 326 23,412,464 131,105,687 44,793,693 86,311,994 11,778,30267 1,768 1,765 128,942,412 212,717,251 99,266,600 113,450,651 8,170,40171 14,563 14,488 1,823,109,869 14,201,853,730 6,906,262,369 7,295,591,361 566,939,84216 180 156 17,922,440 237,049,926 157,742,718 79,307,208 150,00028 740 714 91,073,844 451,397,909 196,333,497 255,064,413 435,0004 155 154 20,636,600 89,483,952 49,359,932 40,124,020 800,0006 52 45 4,984,400 13,580,797 5,052,917 8,527,880 2,800,000
21 278 276 37,415,499 233,010,329 93,335,324 139,675,005 1,193,42884 3,982 3,968 608,687,687 10,267,450,272 5,529,970,878 4,737,479,395 241,998,62191 1,800 1,762 416,245,423 3,724,840,871 1,750,292,821 1,974,548,050 6,400,00014 77 72 5,565,000 36,054,048 20,242,236 15,811,812 -50 454 407 47,600,776 389,168,008 39,807,695 349,360,313 29,3338 195 185 43,876,537 1,310,505,938 71,192,883 1,239,313,055 8,821,0358 298 296 29,514,657 132,558,172 35,501,961 97,056,211 100,000
18,569 727,978 711,297 138,319,434,839 2,175,118,284,378 1,243,151,348,459 931,966,935,919 149,482,536,066
Group Total 14 Other Mining and Quarrying 15 Manu.of food products and beverages 16 Manu.of tobacco products 17 Manu.of Textiles 18 Manu.of wearing Apparel, dressing & dyeing of fur 19 Tanning and dressing of leather; manu. of luggage, handbags & footwear 20 Manu.of wood & products of wood & cork except furniture 21 Manu.of paper and paper products 22 Publishing, printing and reproduction of recorded media 24 Manu.of chemicals & chemical products 25 Manu.of rubber & plastic products 26 Manu. of other non metallic mineral products 28 Manu.of fabricated metal products except machinery equipments 36 Manu.of furniture, Manufacturing of n.e.c. 40 Electricity, Gas, Steam and Hot water supply 99 Other Industry
Sabaragamuwa
Total
Province & Industry division No. ofestablishments
Personsengaged (No.)
Employees(No.)
Salaries &Wages (Rs.)
Value of output(Rs.) Value of input (Rs.)
Value added(Rs.)
Gross additionsto fixed assets

North‐Central4%
Uva2%
Sabaragamuwa7%
Chart 7: Percentage of establishments by province ‐ 2011
(Establishments with 5 or more persons engaged)
Western42%
Central11%
Southern9%
Northern2%
Eastern4%
North‐West19%

Table 5 : Principal indicators of industrial activity classified by district - 2011(Establishments with 5 or more persons engaged)
(for manufacturing sector)
3,243 156,119 154,686 32,430,334,202 707,374,196,902 442,537,584,829 264,836,612,073 94,750,452,493
3,090 189,349 186,959 39,619,394,127 588,584,590,627 377,263,266,923 211,321,323,704 9,957,441,641
953 50,601 49,461 6,393,648,635 106,165,973,175 58,140,599,418 48,025,373,757 2,468,263,449
1,234 38,235 37,046 4,702,437,562 44,199,710,034 22,513,720,884 21,685,989,150 506,286,835
328 7,986 7,480 988,116,937 9,982,191,382 6,107,764,416 3,874,426,966 36,788,765
273 17,846 17,707 3,498,663,531 41,353,769,202 20,545,103,053 20,808,666,149 393,091,833
857 38,534 37,300 4,769,116,838 55,469,378,566 36,444,778,119 19,024,600,446 707,622,870
431 14,553 14,078 2,052,478,082 31,234,714,019 10,810,333,096 20,424,380,923 517,352,890
179 7,585 7,310 1,030,244,131 5,028,257,948 2,312,559,203 2,715,698,745 16,758,472
231 2,308 1,947 236,072,615 1,735,692,388 802,841,696 932,850,693 569,769,773
27 294 232 45,492,946 265,698,310 94,161,407 171,536,903 49,812,075
26 327 314 43,021,279 1,142,360,190 474,864,693 667,495,497 10,645,333
28 210 181 13,205,000 139,557,580 70,782,700 68,774,880 -
3 28 26 4,267,248 20,030,000 13,323,550 6,706,450 48,000
253 2,213 1,899 205,086,280 2,304,701,571 1,561,832,606 742,868,966 306,017,385
404 5,272 4,996 716,893,172 19,605,521,568 6,986,968,302 12,618,553,267 699,290,399
69 1,279 1,199 215,358,679 8,971,690,778 6,775,338,207 2,196,352,571 6,304,189
1,880 59,627 57,468 8,212,934,639 102,861,544,712 52,862,793,855 49,998,750,857 1,105,449,902
1,323 21,060 19,871 2,398,920,830 52,050,003,667 14,470,371,247 37,579,632,420 623,820,656
227 7,715 7,385 1,084,025,157 9,379,918,545 5,760,298,461 3,619,620,085 410,929,192
242 6,820 6,514 844,640,925 15,377,223,532 10,210,283,235 5,166,940,297 652,826,224
228 9,432 9,287 1,393,082,658 15,633,505,478 7,936,573,717 7,696,931,761 230,158,939
67 1,743 1,643 260,182,829 9,266,914,585 2,898,063,590 6,368,850,995 13,724,897
415 28,710 28,361 4,229,810,750 51,318,842,409 21,455,407,615 29,863,434,794 1,242,873,765
330 13,336 13,081 1,618,036,718 17,900,728,290 10,628,253,132 7,272,475,158 261,657,35316,341 681,179 666,430 117,005,465,769 1,897,366,715,457 1,119,677,867,953 777,688,847,504 115,537,387,329
Colombo Gampaha Kalutara Kandy Matale Nuwara-Eliya Galle Matara Hambantota Jaffna Mannar Vavuniya Mullaitivu Killinochchi Batticaloa Ampara Trincomalee Kurunegala Puttalam Anuradhapura Polonnaruwa Badulla Moneragala Ratnapura KegalleTotal
District No. ofestablishments
Personsengaged (No.)
Employees(No.)
Salaries &Wages (Rs.)
Value of output(Rs.)
Value of input(Rs.)
Value added(Rs.)
Gross additionsto fixed assets
(Rs.)

Table 6 : Principal indicators of industrial activity classified by district - 2011(Establishments with 25 or more persons engaged)
(for manufacturing sector)
658 133,618 133,375 29,284,212,419 672,898,404,138 427,349,153,205 245,549,250,933 94,708,894,053
554 168,669 168,272 36,963,685,768 559,081,042,550 360,566,904,335 198,514,138,215 9,953,390,620
169 44,050 43,792 5,994,706,035 96,795,996,220 54,527,827,306 42,268,168,914 2,269,050,384
155 29,168 29,070 3,865,262,440 36,005,060,513 18,427,847,165 17,577,213,349 268,418,983
24 5,821 5,804 846,291,861 8,607,840,330 5,321,462,039 3,286,378,291 33,897,765
149 16,744 16,728 3,354,425,970 39,510,051,491 19,602,211,099 19,907,840,392 313,119,466
182 33,219 33,116 4,379,509,500 51,651,158,997 34,562,026,546 17,089,132,451 702,098,652
105 11,969 11,873 1,761,820,401 26,102,301,753 9,247,788,128 16,854,513,625 499,908,036
16 6,445 6,307 909,850,811 4,258,417,039 1,827,300,623 2,431,116,416 11,244,722
16 753 741 82,599,802 564,932,870 360,834,982 204,097,888 60,787,540
5 226 222 36,025,446 264,896,099 133,004,739 131,891,360 60,036,075
5 301 274 47,468,427 304,008,367 121,183,255 182,825,112 39,704,607
5 2,149 2,146 295,445,347 1,906,429,756 1,308,251,447 598,178,309 149,019,685
4 911 908 183,065,263 8,793,884,415 6,705,247,384 2,088,637,031 6,304,189
123 45,489 45,266 6,881,814,884 87,485,002,707 45,230,871,048 42,254,131,659 1,027,151,562
64 10,526 10,471 1,660,830,472 28,356,792,670 9,257,706,642 19,099,086,029 483,619,778
19 6,122 6,109 933,902,381 5,192,161,632 2,946,003,552 2,246,158,080 133,452,763
17 4,745 4,724 538,397,448 5,780,583,519 3,618,987,674 2,161,595,845 568,944,648
77 8,338 8,302 1,291,499,332 14,476,532,758 7,204,860,309 7,271,672,449 207,336,839
9 1,343 1,334 231,428,162 9,157,896,287 2,837,021,358 6,320,874,929 10,121,897
139 26,424 26,272 3,942,375,114 47,225,870,016 20,228,514,512 26,997,355,505 1,109,344,004
59 11,142 11,107 1,376,752,435 15,413,480,410 8,916,328,572 6,497,151,839 260,047,353
2,554 568,171 566,213 104,861,369,716 1,719,832,744,538 1,040,301,335,919 679,531,408,619 112,875,893,623
Colombo Gampaha Kalutara Kandy Matale Nuwara-Eliya Galle Matara Hambantota Jaffna Mannar& Vavuniya Batticaloa Ampara Trincomalee Kurunegala Puttalam Anuradhapura Polonnaruwa Badulla Moneragala Ratnapura Kegalle Total
District No. ofestablishments
Personsengaged (No.)
Employees(No.)
Salaries &Wages (Rs.)
Value of output(Rs.)
Value of input(Rs.)
Value added(Rs.)
Gross additionsto fixed assets
(Rs.)
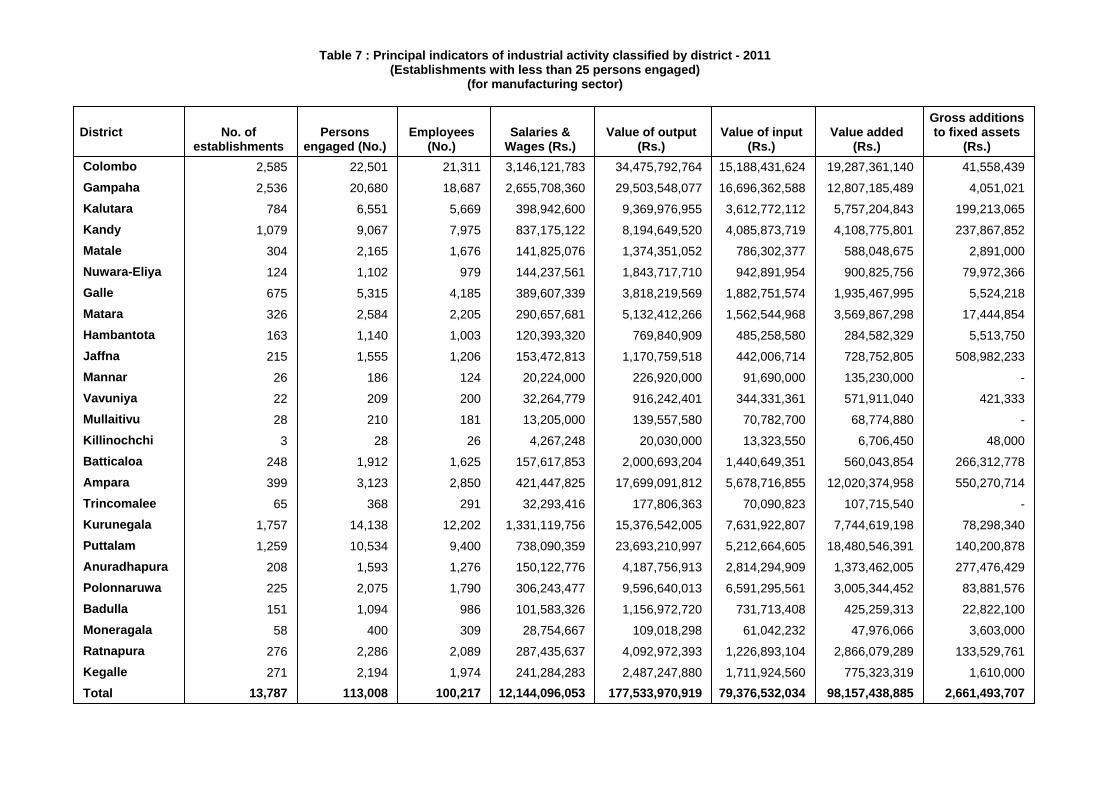
Table 7 : Principal indicators of industrial activity classified by district - 2011(Establishments with less than 25 persons engaged)
(for manufacturing sector)
2,585 22,501 21,311 3,146,121,783 34,475,792,764 15,188,431,624 19,287,361,140 41,558,439
2,536 20,680 18,687 2,655,708,360 29,503,548,077 16,696,362,588 12,807,185,489 4,051,021
784 6,551 5,669 398,942,600 9,369,976,955 3,612,772,112 5,757,204,843 199,213,065
1,079 9,067 7,975 837,175,122 8,194,649,520 4,085,873,719 4,108,775,801 237,867,852
304 2,165 1,676 141,825,076 1,374,351,052 786,302,377 588,048,675 2,891,000
124 1,102 979 144,237,561 1,843,717,710 942,891,954 900,825,756 79,972,366
675 5,315 4,185 389,607,339 3,818,219,569 1,882,751,574 1,935,467,995 5,524,218
326 2,584 2,205 290,657,681 5,132,412,266 1,562,544,968 3,569,867,298 17,444,854
163 1,140 1,003 120,393,320 769,840,909 485,258,580 284,582,329 5,513,750
215 1,555 1,206 153,472,813 1,170,759,518 442,006,714 728,752,805 508,982,233
26 186 124 20,224,000 226,920,000 91,690,000 135,230,000 -
22 209 200 32,264,779 916,242,401 344,331,361 571,911,040 421,333
28 210 181 13,205,000 139,557,580 70,782,700 68,774,880 -
3 28 26 4,267,248 20,030,000 13,323,550 6,706,450 48,000
248 1,912 1,625 157,617,853 2,000,693,204 1,440,649,351 560,043,854 266,312,778
399 3,123 2,850 421,447,825 17,699,091,812 5,678,716,855 12,020,374,958 550,270,714
65 368 291 32,293,416 177,806,363 70,090,823 107,715,540 -
1,757 14,138 12,202 1,331,119,756 15,376,542,005 7,631,922,807 7,744,619,198 78,298,340
1,259 10,534 9,400 738,090,359 23,693,210,997 5,212,664,605 18,480,546,391 140,200,878
208 1,593 1,276 150,122,776 4,187,756,913 2,814,294,909 1,373,462,005 277,476,429
225 2,075 1,790 306,243,477 9,596,640,013 6,591,295,561 3,005,344,452 83,881,576
151 1,094 986 101,583,326 1,156,972,720 731,713,408 425,259,313 22,822,100
58 400 309 28,754,667 109,018,298 61,042,232 47,976,066 3,603,000
276 2,286 2,089 287,435,637 4,092,972,393 1,226,893,104 2,866,079,289 133,529,761
271 2,194 1,974 241,284,283 2,487,247,880 1,711,924,560 775,323,319 1,610,00013,787 113,008 100,217 12,144,096,053 177,533,970,919 79,376,532,034 98,157,438,885 2,661,493,707
Colombo Gampaha Kalutara Kandy Matale Nuwara-Eliya Galle Matara Hambantota Jaffna Mannar Vavuniya Mullaitivu Killinochchi Batticaloa Ampara Trincomalee Kurunegala Puttalam Anuradhapura Polonnaruwa Badulla Moneragala Ratnapura Kegalle Total
District No. ofestablishments
Personsengaged (No.)
Employees(No.)
Salaries &Wages (Rs.)
Value of output(Rs.)
Value of input(Rs.)
Value added(Rs.)
Gross additionsto fixed assets
(Rs.)

Table 8 : Establishments classified by persons engaged size class & industry division - 2011(Establishments with 5 or more persons engaged)
2,177 4 10 2,1913,628 368 269 4,265
113 1 8 1221,860 56 61 1,9771,142 76 335 1,553
261 9 12 2821,371 8 9 1,388
115 17 14 146423 23 24 470
2 1 1 4449 24 38 511414 70 116 600
2,224 22 29 2,275129 13 11 153653 18 17 688
93 8 8 1091 0 4 5
54 10 13 7718 2 5 25
3 1 0 437 3 5 4515 3 11 29
1,516 42 45 1,6037 2 1 10
12 2 1 1520 1 1 22
16,737 784 1,048 18,569
14 Other Mining and Quarrying 15 Manu.of food products and beverages 16 Manu.of tobacco products 17 Manu.of Textiles 18 Manu.of wearing Apparel, dressing & dyeing of fur 19 Tanning and dressing of leather; manu. of luggage, handbags & footwear 20 Manu.of wood & products of wood & cork except furniture 21 Manu.of paper and paper products 22 Publishing, printing and reproduction of recorded media 23 Manu.of coke refined petroleum products and nuclear fuel 24 Manu.of chemicals & chemical products 25 Manu.of rubber & plastic products 26 Manu. of other non metallic mineral products 27 Manu.of basic metals 28 Manu.of fabricated metal products except machinery equipments 29 Manu.of Machinery & equipments (n.e.c.) 30 Manu.of office, accounting and computing machinery 31 Manu.of Electrical machinery and apparatus n.e.c. 32 Manu.of Radio, TV & communication equipment and apparatus 33 Manu.of medical, precision & optical instruments, watches & clocks 34 Manu.of motor vehicles, trailers and semi-trailers 35 Manu.of other transport equipments 36 Manu.of furniture, Manufacturing of n.e.c. 37 Recycling 40 Electricity, Gas, Steam and Hot water supply 41 Collection, purification and distribution of water Total
Industry divisionless than 50 50 - 99 100 & above
Persons engaged size class Total

Table 9 : Value of output & output components classified by industry - 2011(Establishments with 25 or more persons engaged)
2,289,510,191 2,218,665,052 - 70,845,139
1,899,106,924 1,808,142,780 - 90,964,144
185,474,078 183,489,928 - 1,984,150
204,929,189 227,032,344 - -22,103,1552,046,268,844 2,019,069,312 - 27,199,532
503,914,230 491,698,782 - 12,215,448
895,486,797 930,441,479 - -34,954,682
77,035,500 77,035,500 - -
569,832,317 519,893,551 - 49,938,76636,146,991,273 34,303,888,644 1,680,747,305 162,355,323
7,457,058,490 7,456,001,487 - 1,057,0039,133,232,797 7,796,689,700 1,285,901,225 50,641,872
5,963,392,019 5,969,936,088 - -6,544,06913,593,307,967 13,081,261,369 394,846,080 117,200,51750,561,224,791 50,976,575,379 36,050,000 -451,400,58850,561,224,791 50,976,575,379 36,050,000 -451,400,588
140,274,559,716 139,727,238,681 38,155,000 509,166,035127,031,028,682 126,498,887,646 38,155,000 493,986,036
13,217,281,034 13,202,101,035 - 15,179,999
26,250,000 26,250,000 - -269,046,199,271 263,923,791,601 222,305,978 4,900,101,692
32,741,765,731 32,680,962,543 - 60,803,187
7,570,618,980 5,918,249,550 - 1,652,369,430
3,814,316,861 3,805,126,663 - 9,190,198
6,425,128,339 6,424,869,493 - 258,846213,229,454,599 210,487,099,897 222,305,978 2,520,048,725
4,854,831,134 4,209,635,009 - 645,196,125
36,867,878 36,992,946 - -125,068
373,215,750 360,855,500 - 12,360,25036,457,627,700 35,764,071,419 - 693,556,281
21,089,657,427 20,562,645,257 - 527,012,170
23,219,798 22,296,700 - 923,098
9,160,895,552 9,005,003,631 - 155,891,921
6,183,854,923 6,174,125,831 - 9,729,092
Group Total 1411 Quarrying of stone Clay and Sand
1412 Braking of Granite
1413 Quarrying of Sand & Gravel
141 Quarrying of stone Clay and Sand
Group Total 1421 Mining of chemical and Fertilizer minerals
1422 Extraction of salt
1423 Mining of precious and semi precious stones
1429 Other Mining & Quarrying N.e.c
142 Mining and Quarrying n.e.c
Group Total 1511 Processing and Preserving of Meat and Meat Products
1512 Processing and Preserving of fish and fish Products 1513 Processing & Preserving of fruits & Vegetables
1514 Manufacture of Vegetable oils animal oils & fats
151 Produ., proce. & preserving ofmeat, fish,fruit, vegetables, oils & fats
Group Total 1520 Manufacture of Dairy Products
152 Manufacture of Dairy Products
Group Total 1531 Manufacture of Grain Mill Products 1533 Preparation of Animal food from milling waist
1538 Packeting of Cereal, grains, yarm and their preparations
153 Manu.of grain mill products andprepared animal feeds
Group Total 1541 Manufacture of bakery products
1542 Manufacture of Cane sugar and molasses
1543 Manu.of cocoa, chocolate and sugar confectionary
1544 Manu.of macaroni, noodles couscous and similar farinaceous
1546 Manu.of tea and tea products 1547 Manu.of chilly-power, condiments powder, proce.of spices
1548 Manu.of viniger and similar products
1549 Manu.of other food products n.e.c
154 Manu.of other food products
Group Total 1551 Manufacture of beverages
1552 Manu.of wine, bottled toddy and similar products
1553 Manu.of all other beverages such as beer and stout
1554 Manu.of beverages such as soft drinks, soda etc
155 Manu.of beverags
Type of industryValue of output (Rs.)
Products shipped(Rs)
Industrialservices (Rs)
Changes instocks (Rs)
(cont.)

Table 9 : Value of output & output components classified by industry - 2011(Establishments with 25 or more persons engaged)
68,562,920,736 68,454,906,109 - 108,014,627
771,704,922 771,881,837 - -176,915
66,954,985,250 66,880,020,928 - 74,964,322
836,230,564 803,003,344 - 33,227,22044,388,748,893 43,203,541,353 1,060,116,539 125,091,00119,176,040,079 18,945,151,929 287,976,539 -57,088,38925,212,708,814 24,258,389,424 772,140,000 182,179,3907,841,706,347 7,485,152,865 383,974,942 -27,421,460
874,178,438 862,212,908 3,826,800 8,138,730
169,210,841 168,461,320 - 749,5213,145,964,627 3,157,043,026 2,948,615 -14,027,014
9,029,700 11,755,200 - -2,725,5002,226,526,797 1,919,146,967 326,937,027 -19,557,197
1,357,790,944 1,307,528,444 50,262,500 -
59,005,000 59,005,000 - -30,348,326,148 29,821,644,268 389,110,764 137,571,11615,649,088,787 15,274,830,039 233,527,764 140,730,9845,431,732,065 5,288,633,979 155,583,000 -12,484,914
170,593,000 170,593,000 - -
9,096,912,296 9,087,587,250 - 9,325,046361,797,394,500 345,044,884,390 15,667,378,211 1,085,131,900361,797,394,500 345,044,884,390 15,667,378,211 1,085,131,900
128,245,300 - 128,245,300 -
128,245,300 - 128,245,300 -1,720,221,059 1,772,116,219 - -51,895,160
138,953,454 137,832,228 - 1,121,226
207,780,638 206,987,362 - 793,276
1,373,486,967 1,427,296,629 - -53,809,6628,648,660,176 8,501,160,200 21,315,079 126,184,8978,648,660,176 8,501,160,200 21,315,079 126,184,8971,068,557,887 740,141,456 247,525,000 80,891,4311,068,557,887 740,141,456 247,525,000 80,891,431
Group Total 1601 Manu.of tabacco products
1602 Manu.of Cigarette, Cigar & Beedi
1609 Tobacco based products
160 Manu.of tobacco products
Group Total 1711 Prepa. & spinning of Textiles fibres, weaving of textiles 1712 Finishing of Textiles
171 Spinning, weaving and finishing ofTextiles
Group Total 1721 Manu.of made-up textile article, except apparels 1722 Manu.of carpets and rugs
1723 Manu.of Cordage, Rope, twine & netting 1724 Manufacture of Sanitary Towels & Pampers
1726 Manu. of Laces and embroidered cloths 1727 Manu. of Labels, badges (cloth based)
1729 Cloth and coir based other products
172 Manu.of other Textiles
Group Total 1731 Manufacture of knitted Garments 1732 Manufacture of knitted socks, purses and Hand glouses 1733 Manufacture of Knitted Lace
1739 Elastomeric Yarn & other rubber thread based products
173 Manu.of knitted and crochetedfabrics and articles
Group Total 1810 Manufacture of weaving Apparel, except fur apparels
181 Manu.of weaving Apparel except furapparels
Group Total 1820 Dressing and dyeing of fur, manu. articles of fur
182 Dressing and dyeing of fur,manufacture articles of fur
Group Total 1911 Tanning and dressing of leather
1912 Manu.of luggage, hand bags
1913 Manu. of Bags & rain coats, artificial leather products
191 Tanning & dressing of leather;manu. of luggage, Hand bags
Group Total 1920 Manufacturing of footwear
192 Manu.of footwear
Group Total 2010 Saw-milling and planning of wood
201 Saw-milling and planning of wood
Type of industryValue of output (Rs.)
Products shipped(Rs)
Industrialservices (Rs)
Changes instocks (Rs)
(cont.)

Table 9 : Value of output & output components classified by industry - 2011(Establishments with 25 or more persons engaged)
5,207,693,109 5,107,556,723 480,000 99,656,386
3,773,108,069 3,781,402,147 - -8,294,07862,502,547 61,322,547 480,000 700,000
238,650,777 238,650,777 - -
759,531,866 619,206,942 - 140,324,924
360,939,850 394,014,310 - -33,074,460
12,960,000 12,960,000 - -11,537,052,838 11,534,019,513 24,827,200 -21,793,876
3,434,219,239 3,467,273,939 - -33,054,700
7,195,443,614 7,200,191,049 - -4,747,436768,050,265 727,214,805 24,827,200 16,008,260
139,339,720 139,339,720 - -1,225,709,777 1,218,464,851 14,519,926 -7,275,000
131,027,380 136,755,580 1,546,800 -7,275,000
296,432,397 283,459,271 12,973,126 -
798,250,000 798,250,000 - -31,711,426,158 30,407,002,514 1,279,277,365 25,146,28031,359,049,636 30,057,754,373 1,279,277,365 22,017,899
313,032,662 311,212,662 - 1,820,000
39,343,860 38,035,479 - 1,308,381270,752,463 - 270,752,463 -
270,752,463 - 270,752,463 -193,482,638,876 193,527,297,623 - -44,658,747
193,482,638,876 193,527,297,623 - -44,658,74742,027,310,255 41,614,423,391 388,073,476 24,813,388
18,329,282,119 18,300,858,202 - 28,423,9177,309,854,833 6,929,525,211 388,073,476 -7,743,854
3,686,672,783 3,684,093,378 - 2,579,405
12,701,500,520 12,699,946,600 - 1,553,920
Group Total 2021 Manu.of veneer sheets, plywood, lamin board, particle board
2022 Manufacture of builders carpentry and joinery 2023 Manufacture of wooden containers
2025 Manu.of Household utencils of other wooden article & ornaments
2026 Manu.of tools, coffins, other equipments used in funerals
2029 Manu.of all kinds of other wood products
202 Manu.of produ. of wood, cork,straw & plaiting material
Group Total 2101 Manufacture of pulp, paper and paperboards
2102 Manu.of corrugated paper & paperboard & containers of paper
2103 Manufacture of cards, files, books and pads 2109 Manu.of pulp paper and paper boards articles n.e.c
210 Manu.of paper and paper products
Group Total 2211 Publishing of books, broachers, musical books 2212 Publishing of newspapers, journals and periodicals
2219 Other publishing
221 Publishing, printing andreproduction of recorded media
Group Total 2221 Printing of newspapers, journals & periodicals for others 2222 Service activities related to printing
2223 Photocopies, computer print out etc.
222 Printing & service activities relatedto printing for others
Group Total 2230 Reproduction of recorded media
223 Reproduction of recorded media
Group Total 2320 Manu.of refined petroleum products
232 Manu.of refined petroleum products
Group Total 2411 Manu.of basic chemicals,(except fertilizres & nitrogen
2412 Manu.of fertilizer & nitrogen compounds 2413 Manu.of plastic in primary forms and synthetic rubber
2414 Manu.of Natural carbonic fertilizers
241 Manu.of basic chemicals
Type of industryValue of output (Rs.)
Products shipped(Rs)
Industrialservices (Rs)
Changes instocks (Rs)
(cont.)

Table 9 : Value of output & output components classified by industry - 2011(Establishments with 25 or more persons engaged)
24,022,577,363 23,328,658,556 404,714,538 289,204,269
2,711,728,000 2,711,728,000 - -
9,079,272,690 8,853,585,466 - 225,687,2246,209,451,640 5,826,162,054 358,677,936 24,611,6503,162,360,877 3,063,200,643 46,036,602 53,123,632
328,210,500 328,210,500 - -
386,650,328 386,967,320 - -316,992
47,925,910 48,163,575 - -237,665
2,096,977,418 2,110,640,998 - -13,663,58091,515,823,241 90,759,130,572 221,018,664 535,674,00644,190,853,601 43,919,512,269 164,685,627 106,655,70617,706,216,932 17,767,861,420 56,333,037 -117,977,526
23,899,002,924 23,393,447,772 - 505,555,152
408,457,763 409,290,860 - -833,097
5,311,292,022 5,269,018,251 - 42,273,77133,933,684,036 33,696,981,020 140,053,798 96,649,21833,933,684,036 33,696,981,020 140,053,798 96,649,218
3,834,454,513 3,836,585,593 - -2,131,080
3,834,454,513 3,836,585,593 - -2,131,08082,484,903,436 82,561,098,007 73,864,178 -150,058,749
5,846,144,620 6,462,989,935 - -616,845,3158,555,496,817 8,228,278,785 11,864,178 315,353,854
48,897,570,577 48,791,814,828 62,000,000 43,755,749
18,387,779,913 18,284,674,731 - 103,105,182
266,807,618 258,027,118 - 8,780,500
191,581,641 195,790,360 - -4,208,719
339,522,250 339,522,250 - -14,853,978,417 14,665,720,921 - 188,257,496
14,853,978,417 14,665,720,921 - 188,257,496729,275,000 729,275,000 - -
729,275,000 729,275,000 - -13,787,784,660 13,078,910,675 631,576,860 77,297,1265,324,914,938 4,783,716,959 560,143,876 -18,945,8978,462,869,722 8,295,193,716 71,432,984 96,243,023
Group Total 2421 Manu.of pesticides and other agro-chemical products
2422 Manu.of paints, varnishes & similar coatings, printing ink
2423 Manu.of parmaceuticals, medicinal chemicals & botanical products 2424 Manu.of soap & detergent, cleaning, perfumies & toilet preparations 2425 Manu.of explosives, crackers and other firework
2426 Manu.of mosquito-coils, camphor, napthaline balls, incense sticks
2427 Manu.of processed salt (for food)
2428 Manu.of chemicals and activated carbon
242 Manu.of other chemical products
Group Total 2511 Manu.of rubber tyres and tubes, rebuilding of rubber tyres 2512 Manu.of rubber condoms, rubber gloves 2513 Manu.of product from natural rubber
2514 Manu.of article of rubber
2519 Manu.of rubber products (not classified elsewhere)
251 Manu.of rubber products
Group Total 2520 Manu.of plastic products
252 Manu.of plastic products
Group Total
2610 Manu.of glass and glass products
261 Manu.of glass and glass products
Group Total 2691 Manu.of non-structural non-refractory ceramic ware
2693 Manu.of structural non refractory clay & ceramic products 2694 Manu.of cement lime, and plaster 2695 Manu.of articles of concrete, cement & plaster
2696 Cutting, shaping & finishing of rough stones
2697 Refining of Ilmanite, surcon & refinding of plumbago
2699 Manu.of other non-metalic mineral products n.e.c
269 Manu.of Non metallic mineralproducts(n.e.c.)
Group Total 2710 Manu.of basic iron & steel
271 Manu.of basic iron & steel
Group Total 2720 Manu.of basic precious & non-ferrous metal
272 Manu.of basic precious &non-ferrous metal
Group Total 2731 Casting of iron & steel 2732 Casting of Non ferrous metals
273 Casting of metals
Type of industryValue of output (Rs.)
Products shipped(Rs)
Industrialservices (Rs)
Changes instocks (Rs)
(cont.)

Table 9 : Value of output & output components classified by industry - 2011(Establishments with 25 or more persons engaged)
5,263,484,756 4,928,458,098 200,812,350 134,214,3084,303,550,223 4,174,000,779 812,350 128,737,094
959,934,533 754,457,319 200,000,000 5,477,214
4,614,629,475 4,422,694,133 161,544,349 30,390,993
690,928,187 529,383,838 161,544,349 -
506,148,192 505,557,256 - 590,936
42,353,832 42,344,832 - 9,000
842,899,716 842,899,716 - -
63,239,112 63,239,112 - -
682,569,000 669,047,000 - 13,522,000
448,149,637 430,429,129 - 17,720,508
1,338,341,799 1,339,793,250 - -1,451,4511,800,464,762 1,788,964,762 11,500,000 -
11,500,000 - 11,500,000 -
1,661,393,262 1,661,393,262 - -
127,571,500 127,571,500 - -1,566,794,863 1,529,693,980 36,361,472 739,411
308,067,005 277,197,005 30,870,000 -29,702,377 24,588,994 5,491,472 -378,089
16,956,000 16,956,000 - -
276,996,000 276,996,000 - -
141,912,032 140,794,532 - 1,117,500
748,295,000 748,295,000 - -
44,866,449 44,866,449 - -3,288,139,458 3,203,939,008 - 84,200,450
3,288,139,458 3,203,939,008 - 84,200,4501,418,821,827 1,414,495,769 4,326,058 -
1,418,821,827 1,414,495,769 4,326,058 -9,382,953,668 9,351,974,491 9,374,036 21,605,1419,382,953,668 9,351,974,491 9,374,036 21,605,1417,442,995,292 7,509,093,658 4,514,000 -70,612,3667,442,995,292 7,509,093,658 4,514,000 -70,612,3663,199,492,956 3,163,544,636 - 35,948,320
3,199,492,956 3,163,544,636 - 35,948,320
Group Total 2811 Manu.of structural metal products 2812 Manu.of tanks, resorvoirs & containers of metal except packingcontainers
281 Manu.of structural metal products,tanks, reservoirs & steam generators
Group Total 2892 Treatment & coating of metal general mechanical engine
2893 Manu.of cutlery, hand tools & general hardware
2894 Manu.of other brass articles
2895 Manu.of non threaded metal products
2896 Manu.of Metal cooking utensils, household appliances & sanitary articles
2897 Manu.of Metal cables and similar articles
2898 Manu.of Containers used for the packing or conveyance
2899 Manu.of other fabricated metal products
289 Manu.of other fabricated metalproducts
Group Total 2911 Manu.of engine and turbines, except aircraft, vehicle
2912 Manu.of pumps, compressors, taps and valves
2919 Manu.of other general purpose machinery
291 Manu.of general purpose machinery
Group Total 2921 Manu.of agricultural & forestry machinery
2922 Manu.of machine tools 2923 Manu.of machinery for metallurgy
2924 Manu.of machinery for mining, quarrying & construction
2925 Manu.of machinery for Food, beverage & tobacco proce.
2926 Manu.of machinery for textile, apparel & leather products
2929 Manu.of other special purpose machinery (n.e.c.)
292 Manu.of special purpose machinery
Group Total 2930 Manu.of domestic appliance n.e.c.
293 Manu.of domestic appliance n.e.c.
Group Total 3000 Manu.of office, accounting and computing machinery
300 Manu.of office, accounting andcomputing machinery
Group Total 3110 Manu.of electric motors, generators and transformers
311 Manu.of electronic motors,generators and transformers
Group Total 3120 Manu.of electricity distribution and control apparatus
312 Manu.of electricity distribution andcontrol apparatus
Group Total 3130 Manu.of insulated wire and cables
313 Manu.of insulated wire and cables
Type of industryValue of output (Rs.)
Products shipped(Rs)
Industrialservices (Rs)
Changes instocks (Rs)
(cont.)

Table 9 : Value of output & output components classified by industry - 2011(Establishments with 25 or more persons engaged)
2,564,171,265 2,551,304,820 36,861,445 -23,995,0002,564,171,265 2,551,304,820 36,861,445 -23,995,000
193,349,125 183,541,660 - 9,807,465
193,349,125 183,541,660 - 9,807,4656,236,735,625 6,212,863,861 23,715,764 156,0006,236,735,625 6,212,863,861 23,715,764 156,0003,672,801,350 3,672,801,350 - -
3,672,801,350 3,672,801,350 - -56,173,570 56,173,570 - -
56,173,570 56,173,570 - -132,966,039 132,966,039 - -
132,966,039 132,966,039 - -1,526,959,736 1,493,888,877 33,070,859 -
1,526,959,736 1,493,888,877 33,070,859 -303,175,508 178,041,965 126,189,441 -1,055,898303,175,508 178,041,965 126,189,441 -1,055,898964,167,807 963,572,950 - 594,857
964,167,807 963,572,950 - 594,85713,210,543,594 13,205,630,608 - 4,912,986
10,990,000,241 10,976,187,879 - 13,812,362
2,220,543,353 2,229,442,729 - -8,899,3764,982,889,100 4,996,027,587 - -13,138,487
4,982,889,100 4,996,027,587 - -13,138,48716,858,646,950 16,006,921,650 627,219,626 224,505,67416,858,646,950 16,006,921,650 627,219,626 224,505,67422,040,403,433 21,887,084,072 51,023,438 102,295,9236,805,122,640 6,752,823,820 51,023,438 1,275,382
162,750,000 162,750,000 - -
2,022,375,202 2,024,850,972 - -2,475,770
13,050,155,591 12,946,659,280 - 103,496,3111,160,746,442 1,167,863,083 - -7,116,641
1,160,746,442 1,167,863,083 - -7,116,641334,790,000 334,000,000 - 790,000
334,790,000 334,000,000 - 790,000
Group Total 3140 Manu.of accumulators primary cells and primary batteries
314 Manu.of accumulators primary cellsand primary batteries
Group Total 3150 Manu.of electric lamps and lighting equipments
315 Manu.of electric lamps and lightingequipments
Group Total 3210 Manu.of electronic valves, tubes & other
321 Manu.of electronic valves, tubes &others
Group Total 3220 Manu.of TV & radio transmitters & apparatus for line telephone
322 Manu.of TV & Radio transmitters
Group Total 3230 Manu.of TV & radio receivers sound or video recording
323 Manu.of TV & Radio receivers,sound or vedio recording
Group Total 3320 Manu.of optical instruments and photographic equipments
332 Manu.of optical instruments andphotographic equipments
Group Total 3410 Manu.of motor vehicles
341 Manu.of motor vehicles
Group Total 3420 Manu.of bodies for Motor vehicles, Manu. of trailers & semi trailers
342 Manu.of bodies for Motor vehicles,Manu. of trailers & semi-trailers
Group Total 3430 Manu.of spare parts and accessories for motor vehicles
343 Manu.of spare parts andaccessories for motor vehicles
Group Total 3511 Building and repairing of ships
3512 Building and repairing of pleasure & sporting boats
351 Building and repairing of ships andboats
Group Total 3592 Manu.of bicycles & invalid carraiges
359 Manu.of transport equipment n.e.c.
Group Total 3610 Manu.of furniture
361 Manu.of furniture
Group Total 3691 Manu.of jewellery and related articles 3693 Manu.of sports goods
3694 Manu.of toys & games
3699 Other manufacturing not elsewhere classified
369 Manu.of other product notelsewhere classified
Group Total 3710 Reycycling of metal waste and scrap
371 Recycling of metal waste and scrap
Group Total 3720 Reycycling of non-metal waste and scrap
372 Recycling of non-metal waste andscrap
Type of industryValue of output (Rs.)
Products shipped(Rs)
Industrialservices (Rs)
Changes instocks (Rs)
(cont.)

Table 9 : Value of output & output components classified by industry - 2011(Establishments with 25 or more persons engaged)
251,810,915,740 119,351,055,740 132,459,860,000 -
251,810,915,740 119,351,055,740 132,459,860,000 -13,504,729,535 13,504,729,535 - -
13,504,729,535 13,504,729,535 - -1,989,484,168,848 1,823,233,297,808 157,110,455,422 9,140,415,618
Group Total 4010 Production, collection & distribution of electricity
401 Production, collection &distribution of electricity
Group Total 4100 Collection, purification and distribution of water
410 Collection, purification anddistribution of water
Total
Type of industryValue of output (Rs.)
Products shipped(Rs)
Industrialservices (Rs)
Changes instocks (Rs)

Table10 : Value of output & output components classified by industry division - 2011(Establishments with less than 25 persons engaged)
7,326,363,125 7,418,701,256 8,893,880 -101,232,01188,073,255,964 87,558,560,248 129,489,882 385,205,834
369,771,391 360,757,507 4,770,000 4,243,8847,561,809,821 7,297,997,298 278,979,977 -15,167,4534,472,671,948 3,804,960,292 667,040,603 671,0541,130,211,838 1,051,455,173 43,763,525 34,993,1408,670,772,373 8,048,881,013 583,903,601 37,987,759
497,881,203 458,752,756 25,003,125 14,125,3225,573,054,397 4,160,812,285 1,410,316,036 1,926,076
18,350,000 18,350,000 - -7,336,105,538 7,242,953,799 - 93,151,739
10,094,321,071 10,051,695,202 32,162,500 10,463,36915,648,499,763 15,722,109,842 2,386,850 -75,996,930
2,090,882,370 2,028,798,643 62,500,346 -416,6193,100,222,345 1,866,973,607 1,234,232,238 -983,500
671,046,680 552,252,614 116,863,296 1,930,7701,102,465,836 1,099,198,461 3,267,375 -
336,225,713 311,666,195 25,773,455 -1,213,93725,777,470 25,777,470 - -
232,582,677 90,733,918 141,537,280 311,480136,157,049 115,601,149 17,100,000 3,455,900
19,948,533,197 12,708,314,175 7,109,543,220 130,675,802443,372,275 444,506,275 - -1,134,000541,544,613 541,544,613 - -232,236,873 225,515,755 6,721,118 -
185,634,115,530 173,206,869,545 11,904,248,307 522,997,679
14 Other Mining and Quarrying 15 Manu.of food products and beverages 16 Manu.of tobacco products 17 Manu.of Textiles 18 Manu.of wearing Apparel, dressing & dyeing of fur 19 Tanning and dressing of leather; manu. of luggage, handbags & footwear 20 Manu.of wood & products of wood & cork except furniture 21 Manu.of paper and paper products 22 Publishing, printing and reproduction of recorded media 23 Manu.of coke refined petroleum products and nuclear fuel 24 Manu.of chemicals & chemical products 25 Manu.of rubber & plastic products 26 Manu. of other non metallic mineral products 27 Manu.of basic metals 28 Manu.of fabricated metal products except machinery equipments 29 Manu.of Machinery & equipments (n.e.c.) 31 Manu.of Electrical machinery and apparatus n.e.c. 32 Manu.of Radio, TV & communication equipment and apparatus 33 Manu.of medical, precision & optical instruments, watches & clocks 34 Manu.of motor vehicles, trailers and semi-trailers 35 Manu.of other transport equipments 36 Manu.of furniture, Manufacturing of n.e.c. 37 Recycling 40 Electricity, Gas, Steam and Hot water supply 41 Collection, purification and distribution of water Total
Industry division Value of output(Rs.)
Productsshipped (Rs)
Industrialservices (Rs)
Changes instocks (Rs)

Table 11 : Value of input & input components classified by industry - 2011(Establishments with 25 or more persons engaged)
1,089,146,345 264,823,443 491,468,307 29,196,952 303,657,643832,820,249 262,269,043 287,237,991 28,839,952 254,473,26368,466,927 2,554,400 29,659,449 357,000 35,896,078
187,859,169 - 174,570,867 - 13,288,302485,042,896 43,299,873 302,802,116 - 138,940,90770,319,489 - 37,998,989 - 32,320,500
244,036,681 11,739,997 192,317,920 - 39,978,76411,262,240 - 3,709,340 - 7,552,900
159,424,486 31,559,876 68,775,867 - 59,088,743
19,804,123,488 2,973,095,574 14,539,285,260 1,152,902,465 1,138,840,1893,511,512,932 516,632,678 2,644,465,975 - 350,414,2793,615,822,056 23,660,000 2,365,415,189 1,132,589,118 94,157,7493,249,550,342 1,384,764,569 1,635,607,525 175,000 229,003,2489,427,238,158 1,048,038,327 7,893,796,571 20,138,347 465,264,913
36,937,158,277 30,509,071,457 5,652,127,914 10,401,482 765,557,42436,937,158,277 30,509,071,457 5,652,127,914 10,401,482 765,557,424
104,148,700,406 47,386,518,595 54,269,658,433 10,451,849 2,482,071,52996,989,644,942 42,749,499,788 51,995,162,592 10,164,549 2,234,818,0137,150,866,184 4,637,018,807 2,266,575,841 287,300 246,984,236
8,189,280 - 7,920,000 - 269,280135,878,530,932 12,816,652,151 113,195,960,625 609,091,190 9,256,826,96513,260,104,416 7,681,283,332 4,269,085,631 16,191,000 1,293,544,4532,614,772,025 - 2,366,489,705 213,065 248,069,2552,268,193,576 1,256,811,669 827,828,591 - 183,553,3163,215,367,882 811,254,766 2,183,924,268 - 220,188,848
111,697,492,484 2,800,560,720 101,083,757,645 587,187,125 7,225,986,9942,609,057,737 266,741,665 2,265,516,005 4,500,000 72,300,068
19,675,542 - 17,282,510 - 2,393,032193,867,270 - 182,076,270 1,000,000 10,791,000
17,287,971,895 11,887,549,874 4,497,101,569 23,528,079 879,792,37310,130,746,489 6,365,142,194 3,458,388,449 7,675,500 299,540,346
20,009,105 - 19,643,305 165,000 200,8003,918,215,035 3,595,000,000 70,150,714 - 253,064,3213,219,001,266 1,927,407,680 948,919,101 15,687,579 326,986,906
Group Total 1411 Quarrying of stone Clay and Sand 1412 Braking of Granite 1413 Quarrying of Sand & Gravel
141 Quarrying of stone Clay andSand
Group Total 1421 Mining of chemical and Fertilizer minerals 1422 Extraction of salt 1423 Mining of precious and semi precious stones 1429 Other Mining & Quarrying N.e.c
142 Mining and Quarrying n.e.c
Group Total 1511 Processing and Preserving of Meat and Meat Product 1512 Processing and Preserving of fish and fish Products 1513 Processing & Preserving of fruits & Vegetables 1514 Manufacture of Vegetable oils animal oils & fats
151 Produ., proce. & preserving ofmeat, fish,fruit, vegetable oils & fats
Group Total 1520 Manufacture of Dairy Products
152 Manufacture of Dairy Products
Group Total 1531 Manufacture of Grain Mill Products 1533 Preparation of Animal food from milling waist 1538 Packeting of Cereal, grains, yarm and their preparation & flour
153 Manu.of grain mill products andprepared animal feeds
Group Total 1541 Manufacture of bakery products 1542 Manufacture of Cane sugar and molasses 1543 Manu.of cocoa, chocolate and sugar confectionary1544 Manu. of macaroni, noodles couscous and similar farinaceous 1546 Manu.of tea and tea products 1547 Manu.of chilly-power, condiments powder, proce.of spices 1548 Manu.of viniger and similar products 1549 Manu.of other food products n.e.c
154 Manu.of other food products
Group Total 1551 Manufacture of beverages 1552 Manu.of wine, bottled toddy and similar products 1553 Manu.of all other beverages such as beer and stout 1554 Manu.of beverages such as soft drinks, soda etc
155 Manu.of beverags
Type of industry Value of input(Rs.)
Raw materialsconsumed
(imported) (Rs.)
Raw materialsconsumed (local)
(Rs.)
Cost of industrialservices done by
others (Rs.)
Electricity &Fuel consumed
(Rs.)
(cont.)

Table 11 : Value of input & input components classified by industry - 2011(Establishments with 25 or more persons engaged)
3,100,585,830 834,940,867 2,093,115,885 - 172,529,078221,818,923 121,894,667 50,671,978 - 49,252,278
2,561,950,731 713,046,200 1,792,443,907 - 56,460,624316,816,176 - 250,000,000 - 66,816,176
26,089,181,093 12,704,454,194 9,309,680,261 29,593,673 4,045,452,96513,883,192,262 10,385,302,000 2,126,778,154 29,593,673 1,341,518,43512,205,988,831 2,319,152,194 7,182,902,107 - 2,703,934,5304,249,235,109 1,146,350,441 2,590,284,679 106,760,872 405,839,117
448,850,952 238,878,957 170,962,960 1,188,416 37,820,619100,164,346 15,652,926 80,931,280 - 3,580,140
2,345,371,915 48,607,587 2,179,615,994 20,600 117,127,7343,997,700 3,942,400 25,300 - 30,000
694,775,232 391,316,577 52,066,865 89,101,856 162,289,934634,721,154 447,951,994 88,923,750 16,450,000 81,395,41021,353,810 - 17,758,530 - 3,595,280
15,972,094,614 9,926,020,356 4,038,871,262 19,453,505 1,987,749,4928,516,949,117 5,101,467,670 2,383,534,513 19,453,505 1,012,493,4292,901,339,220 1,682,343,438 821,057,552 - 397,938,230
99,911,000 22,332,000 60,000,000 - 17,579,0004,453,895,277 3,119,877,248 774,279,197 - 559,738,833
198,505,992,762 127,534,911,863 49,888,579,180 11,784,972,267 9,297,529,452198,505,992,762 127,534,911,863 49,888,579,180 11,784,972,267 9,297,529,452
45,808,471 - 12,865,510 - 32,942,96145,808,471 - 12,865,510 - 32,942,961
1,295,450,045 1,014,208,722 254,059,360 3,341,302 23,840,661107,859,144 - 97,853,965 3,062,852 6,942,32789,600,750 70,269,364 16,405,601 278,450 2,647,335
1,097,990,151 943,939,358 139,799,794 - 14,250,9995,752,646,543 2,079,182,075 3,483,971,288 12,485,449 177,007,7325,752,646,543 2,079,182,075 3,483,971,288 12,485,449 177,007,732
585,204,837 30,515,612 308,216,655 195,453,793 51,018,778585,204,837 30,515,612 308,216,655 195,453,793 51,018,778
Group Total 1601 Manu.of tabacco products 1602 Manu.of Cigarette, Cigar & Beedi 1609 Tobacco based products
160 Manu.of tobacco products
Group Total 1711 Prepa. & spinning of Textiles fibres, weaving of textiles 1712 Finishing of Textiles
171 Spinning, weaving and finishingof Textiles
Group Total 1721 Manu.of made-up textile article, except apparel 1722 Manu.of carpets and rugs 1723 Manu.of Cordage, Rope, twine & netting 1724 Manufacture of Sanitary Towels & Pampers 1726 Manu. of Laces and embroidered cloths 1727 Manu. of Labels, badges (cloth based) 1729 Cloth and coir based other products
172 Manu.of other Textiles
Group Total 1731 Manufacture of knitted Garments 1732 Manufacture of knitted socks, purses and Hand glouses 1733 Manufacture of Knitted Lace 1739 Elastomeric Yarn & other rubber thread based products
173 Manu.of knitted and crochetedfabrics and articles
Group Total 1810 Manufacture of weaving Apparel, except fur apparels
181 Manu.of weaving Apparel exceptfur apparels
Group Total 1820 Dressing and dyeing of fur, manu. articles of fur
182 Dressing and dyeing of fur,manufacture articles of fur
Group Total 1911 Tanning and dressing of leather 1912 Manu.of luggage, hand bags 1913 Manu. of Bags & rain coats, artificial leather product
191 Tanning & dressing of leather;manu. of luggage, Handbags,Saddlery & harness
Group Total 1920 Manufacturing of footwear
192 Manu.of footwear
Group Total 2010 Saw-milling and planning of wood
201 Saw-milling and planning ofwood
Type of industry Value of input(Rs.)
Raw materialsconsumed
(imported) (Rs.)
Raw materialsconsumed (local)
(Rs.)
Cost of industrialservices done by
others (Rs.)
Electricity &Fuel consumed
(Rs.)
(cont.)

Table 11 : Value of input & input components classified by industry - 2011(Establishments with 25 or more persons engaged)
3,815,753,906 286,552,750 1,948,864,250 351,336 1,579,985,5703,185,027,842 -18,557,030 1,678,755,859 - 1,524,829,013
25,008,660 - 19,960,969 175,000 4,872,69191,533,810 60,407,905 21,877,301 42,840 9,205,764
297,457,837 213,665,826 66,044,253 133,496 17,614,262210,504,557 25,474,049 162,225,868 - 22,804,640
6,221,200 5,562,000 - - 659,2005,931,043,303 4,951,980,572 507,642,569 23,082,920 448,337,2421,514,790,905 1,453,522,112 -59,924,073 - 121,192,8663,930,659,307 3,220,254,525 427,760,916 3,332,253 279,311,613
393,376,550 194,365,529 139,805,726 19,750,667 39,454,62892,216,541 83,838,406 - - 8,378,135
734,081,505 475,504,051 220,774,104 1,043,804 36,759,54666,897,594 12,678,878 48,359,779 130,000 5,728,937
211,419,911 155,825,173 42,414,325 913,804 12,266,609455,764,000 307,000,000 130,000,000 - 18,764,000
20,852,988,664 18,018,375,626 2,001,877,097 7,279,260 825,456,68120,727,264,747 18,008,615,626 1,903,516,743 7,279,260 807,853,118
96,080,834 9,760,000 69,597,668 - 16,723,16629,643,083 - 28,762,686 - 880,3977,401,506 - - - 7,401,5067,401,506 - - - 7,401,506
188,148,859,151 185,431,515,492 2,569,522,609 - 147,821,050188,148,859,151 185,431,515,492 2,569,522,609 - 147,821,05028,393,422,179 11,553,197,072 16,520,802,392 7,294,000 312,128,71511,272,147,881 8,349,280,220 2,778,756,022 594,000 143,517,6394,734,822,044 944,519,670 3,777,006,445 - 13,295,9292,422,191,829 2,186,097,182 86,562,575 6,500,000 143,032,0729,964,260,425 73,300,000 9,878,477,350 200,000 12,283,075
16,814,632,422 9,698,384,714 6,149,207,859 317,267,383 649,772,4662,105,399,000 1,229,942,000 872,578,000 - 2,879,0006,802,060,997 4,926,287,398 1,700,416,656 - 175,356,9433,792,436,062 2,059,233,574 1,240,744,546 317,146,883 175,311,0592,074,671,182 843,145,167 1,158,012,913 120,500 73,392,602
138,128,220 16,601,950 116,270,000 - 5,256,270142,784,252 31,478,195 97,183,789 - 14,122,268
6,027,757 0 3,872,876 - 2,154,8811,753,124,952 591,696,430 960,129,079 - 201,299,443
Group Total 2021 Manu.of veneer sheets, plywood, lamin board, particle board 2022 Manufacture of builders carpentry and joinery 2023 Manufacture of wooden containers 2025 Manu.of Household utencils of other wooden article and ornaments2026 Manu. of tools, coffins, other equipments used infunerals 2029 Manu.of all kinds of other wood products
202 Manu.of produ. of wood, cork,straw & plaiting material
Group Total 2101 Manufacture of pulp, paper and paperboards 2102 Manu.of corrugated paper & paperboard & containers of paper 2103 Manufacture of cards, files, books and pads 2109 Manu.of pulp paper and paper boards articles n.e.c
210 Manu.of paper and paperproducts
Group Total 2211 Publishing of books, broachers, musical books 2212 Publishing of newspapers, journals and periodicals 2219 Other publishing
221 Publishing, printing andreproduction of recorded media
Group Total 2221 Printing of newspapers, journals & periodicals for others 2222 Service activities related to printing 2223 Photocopies, computer print out etc.
222 Printing & service activitiesrelated to printing for others
Group Total 2230 Reproduction of recorded media
223 Reproduction of recorded media
Group Total 2320 Manu.of refined petroleum products
232 Manu.of refined petroleumproducts
Group Total 2411 Manu.of basic chemicals,(except fertilizres & nitrogen compounds 2412 Manu.of fertilizer & nitrogen compounds 2413 Manu.of plastic in primary forms and synthetic rubber 2414 Manu.of Natural carbonic fertilizers
241 Manu.of basic chemicals
Group Total 2421 Manu.of pesticides and other agro-chemical products 2422 Manu.of paints, varnishes & similar coatings, printing ink 2423 Manu.of parmaceuticals, medicinal chemicals & botanical products 2424 Manu.of soap & detergent, cleaning, perfumies & toilet preparations 2425 Manu.of explosives, crackers and other firework2426 Manu. of mosquito-coils, camphor, naphthalene balls, incense sticks 2427 Manu.of processed salt (for food) 2428 Manu.of chemicals and activated carbon
242 Manu.of other chemical products
Type of industry Value of input(Rs.)
Raw materialsconsumed
(imported) (Rs.)
Raw materialsconsumed (local)
(Rs.)
Cost of industrialservices done by
others (Rs.)
Electricity &Fuel consumed
(Rs.)
(cont.)

Table 11 : Value of input & input components classified by industry - 2011(Establishments with 25 or more persons engaged)
49,006,886,955 9,992,499,376 33,748,866,637 17,066,232 5,248,454,71020,723,225,170 3,161,820,338 14,988,855,049 8,192,131 2,564,357,65311,784,625,979 2,939,110,532 7,313,355,121 - 1,532,160,32612,944,242,761 2,479,343,797 9,643,428,555 8,763,631 812,706,778
196,832,741 131,649,100 48,464,018 110,470 16,609,1533,357,960,304 1,280,575,609 1,754,763,894 - 322,620,800
21,706,839,008 15,517,587,713 4,340,475,794 123,067,290 1,725,708,21121,706,839,008 15,517,587,713 4,340,475,794 123,067,290 1,725,708,2111,785,679,428 372,637,518 487,561,891 - 925,480,0191,785,679,428 372,637,518 487,561,891 - 925,480,019
46,731,416,170 25,238,222,520 12,417,606,470 34,381,000 9,041,206,1813,047,226,503 856,044,838 711,065,593 - 1,480,116,0724,967,425,255 1,058,329,298 985,446,885 4,388,500 2,919,260,572
26,947,168,585 16,384,638,000 6,520,562,236 29,000,000 4,012,968,34911,527,025,425 6,898,260,881 4,041,377,774 27,500 587,359,271
91,983,144 32,268,149 32,147,492 965,000 26,602,50360,870,203 8,681,354 43,115,585 - 9,073,26489,717,055 - 83,890,905 - 5,826,150
12,254,038,338 11,275,546,412 467,352,506 7,898,427 503,240,99312,254,038,338 11,275,546,412 467,352,506 7,898,427 503,240,993
511,299,000 - 509,837,000 - 1,462,000511,299,000 - 509,837,000 - 1,462,000
10,579,007,079 8,826,502,220 1,141,260,902 1,915,380 609,328,5774,107,905,261 3,668,522,940 158,640,659 - 280,741,6626,471,101,818 5,157,979,280 982,620,243 1,915,380 328,586,9152,957,916,084 1,509,350,973 1,294,192,478 10,883,610 143,489,0232,553,502,045 1,318,915,123 1,144,424,365 594,573 89,567,984
404,414,039 190,435,850 149,768,113 10,289,037 53,921,039
2,866,733,492 1,528,229,269 1,173,505,494 7,472,741 157,525,989359,429,749 5,077,896 318,665,042 7,472,741 28,214,070263,868,323 107,004,932 143,610,708 - 13,252,683
2,231,609 1,082,299 - - 1,149,310650,399,473 267,730,000 366,228,000 - 16,441,47314,222,649 - 11,098,268 - 3,124,381
535,806,717 427,361,200 100,654,000 - 7,791,517322,446,118 148,365,994 134,619,711 - 39,460,413718,328,855 571,606,948 98,629,765 - 48,092,142
Group Total 2511 Manu.of rubber tyres and tubes, rebuilding of rubber tyres 2512 Manu.of rubber condoms, rubber gloves 2513 Manu.of product from natural rubber 2514 Manu.of article of rubber 2519 Manu.of rubber products (not classified elsewhere)
251 Manu.of rubber products
Group Total 2520 Manu.of plastic products
252 Manu.of plastic products
Group Total 2610 Manu.of glass and glass products
261 Manu.of glass and glassproducts
Group Total 2691 Manu.of non-structural non-refractory ceramic ware 2693 Manu.of structural non refractory clay & ceramic products 2694 Manu.of cement lime, and plaster 2695 Manu.of articles of concrete, cement & plaster 2696 Cutting, shaping & finishing of rough stones 2697 Refining of Ilmanite, surcon & refinding of plumbago 2699 Manu.of other non-metalic mineral products n.e.c
269 Manu. of non metallic mineralproducts(n.e.c.)
Group Total 2710 Manu.of basic iron & steel
271 Manu.of basic iron & steel
Group Total 2720 Manu.of basic precious & non-ferrous metal
272 Manu.of basic precious &non-ferrous metal
Group Total 2731 Casting of iron & steel 2732 Casting of Non ferrous metals
273 Casting of metals
Group Total 2811 Manu.of structural metal products 2812 Manu.of tanks, resorvoirs & containers of metal except packingcontainers
281 Manu.of structural metalproducts, tanks, reservoirs & steamgenerators
Group Total 2892 Treatment & coating of metal general mechanical engine 2893 Manu.of cutlery, hand tools & general hardware 2894 Manu.of other brass articles 2895 Manu.of non threaded metal products 2896 Manu.of Metal cooking utensils, household appliances & sanitary articles 2897 Manu.of Metal cables and similar articles 2898 Manu.of Containers used for the packing or conveyance 2899 Manu.of other fabricated metal products
289 Manu.of other fabricated metalproducts
Type of industry Value of input(Rs.)
Raw materialsconsumed
(imported) (Rs.)
Raw materialsconsumed (local)
(Rs.)
Cost of industrialservices done by
others (Rs.)
Electricity &Fuel consumed
(Rs.)
(cont.)

Table 11 : Value of input & input components classified by industry - 2011(Establishments with 25 or more persons engaged)
907,064,735 747,163,627 133,900,077 2,060,000 23,941,0312,148,000 - - 2,060,000 88,000
839,224,759 684,723,627 133,150,077 - 21,351,05565,691,976 62,440,000 750,000 - 2,501,976
919,574,668 556,897,024 292,579,199 4,430,508 65,667,937172,063,780 77,157,480 82,880,800 - 12,025,50017,587,957 2,586,342 9,054,608 4,412,508 1,534,4997,579,110 6,961,500 - - 617,610
208,234,107 64,512,368 113,973,682 18,000 29,730,057100,958,568 17,484,334 74,704,687 - 8,769,547387,355,200 377,740,000 - - 9,615,20025,795,946 10,455,000 11,965,422 - 3,375,524
1,792,789,869 1,401,627,561 328,890,925 - 62,271,3831,792,789,869 1,401,627,561 328,890,925 - 62,271,383
285,952,810 36,752,000 157,633,138 - 91,567,672285,952,810 36,752,000 157,633,138 - 91,567,672
5,705,804,679 4,416,131,197 1,179,009,571 6,470,990 104,192,9215,705,804,679 4,416,131,197 1,179,009,571 6,470,990 104,192,9215,039,662,299 4,458,378,932 442,503,447 8,500,000 130,279,9205,039,662,299 4,458,378,932 442,503,447 8,500,000 130,279,9201,354,464,466 1,273,109,820 22,408,877 - 58,945,7691,354,464,466 1,273,109,820 22,408,877 - 58,945,7691,849,441,540 1,179,911,236 571,085,900 - 98,444,4041,849,441,540 1,179,911,236 571,085,900 - 98,444,404
134,221,091 103,618,740 12,959,705 - 17,642,646134,221,091 103,618,740 12,959,705 - 17,642,646
4,296,088,538 3,896,486,017 332,351,621 - 67,250,9004,296,088,538 3,896,486,017 332,351,621 - 67,250,9002,383,802,545 2,101,287,000 165,000,000 - 117,515,5452,383,802,545 2,101,287,000 165,000,000 - 117,515,545
33,664,699 - 31,655,963 - 2,008,73633,664,699 - 31,655,963 - 2,008,73625,776,894 17,805,186 - - 7,971,70825,776,894 17,805,186 - - 7,971,708
925,257,256 743,120,000 164,320,000 - 17,817,256925,257,256 743,120,000 164,320,000 - 17,817,256
Group Total 2911 Manu.of engine and turbines, except aircraft, vehicle & cycle engines 2912 Manu.of pumps, compressors, taps and valves 2919 Manu.of other general purpose machinery
291 Manu.of general purposemachinery
Group Total 2921 Manu.of agricultural & forestry machinery 2922 Manu.of machine tools 2923 Manu.of machinery for metallurgy 2924 Manu.of machinery for mining, quarrying & construction 2925 Manu.of machinery for Food, beverage & tobacco proce. 2926 Manu.of machinery for textile, apparel & leather products 2929 Manu.of other special purpose machinery (n.e.c.)
292 Manu.of special purposemachinery
Group Total 2930 Manu.of domestic appliance n.e.c.
293 Manu.of domestic appliance n.e.c.
Group Total 3000 Manu.of office, accounting and computing machinery
300 Manu.of office, accounting andcomputing machinery
Group Total 3110 Manu.of electric motors, generators and transformers
311 Manu.of electronic motors,generators and transformers
Group Total 3120 Manu.of electricity distribution and control apparatus
312 Manu.of electricity distributionand control apparatus
Group Total 3130 Manu.of insulated wire and cables
313 Manu.of insulated wire andcables
Group Total 3140 Manu.of accumulators primary cells and primary batteries
314 Manu.of accumulators primarycells and primary batterie
Group Total 3150 Manu.of electric lamps and lighting equipments
315 Manu.of electric lamps andlighting equipments
Group Total 3210 Manu.of electronic valves, tubes & other
321 Manu.of electronic valves, tubes& other
Group Total 3220 Manu.of TV & radio transmitters & apparatus for line telephone
322 Manu.of TV & Radio transmitters
Group Total 3230 Manu.of TV & radio receivers sound or video recording
323 Manu.of TV & Radio receivers,sound or vedio recording apparatus
Group Total 3320 Manu.of optical instruments and photographic equipment
332 Manu.of optical instruments andphotographic equipments
Group Total 3410 Manu.of motor vehicles
341 Manu.of motor vehicles
Type of industry Value of input(Rs.)
Raw materialsconsumed
(imported) (Rs.)
Raw materialsconsumed (local)
(Rs.)
Cost of industrialservices done by
others (Rs.)
Electricity &Fuel consumed
(Rs.)
(cont.)

Table 11 : Value of input & input components classified by industry - 2011(Establishments with 25 or more persons engaged)
193,459,481 14,698,000 73,773,339 98,200,000 6,788,142193,459,481 14,698,000 73,773,339 98,200,000 6,788,142244,489,982 237,900,000 2,589,720 1,756,174 2,244,088244,489,982 237,900,000 2,589,720 1,756,174 2,244,088
6,400,275,257 5,726,137,329 397,942,141 391,752 275,804,0354,887,076,566 4,483,064,481 152,708,961 391,752 250,911,3721,513,198,691 1,243,072,848 245,233,180 - 24,892,6634,053,174,397 3,450,156,036 535,518,358 - 67,500,0034,053,174,397 3,450,156,036 535,518,358 - 67,500,0037,988,886,345 3,589,463,958 3,559,432,119 417,387,439 422,602,8287,988,886,345 3,589,463,958 3,559,432,119 417,387,439 422,602,828
11,889,959,900 7,898,430,013 3,433,037,711 70,592,862 487,899,3143,516,357,923 2,932,166,793 459,237,483 23,101,108 101,852,540
72,780,000 58,000,000 10,000,000 - 4,780,0001,002,538,023 544,319,148 414,067,839 - 44,151,0367,298,283,954 4,363,944,072 2,549,732,389 47,491,754 337,115,738
826,323,178 798,000,000 13,460,000 - 14,863,178826,323,178 798,000,000 13,460,000 - 14,863,178300,518,800 224,500,000 19,150,000 - 56,868,800300,518,800 224,500,000 19,150,000 - 56,868,800
116,544,131,993 - 42,000,000 84,144,100,000 32,358,031,993116,544,131,993 - 42,000,000 84,144,100,000 32,358,031,993
2,761,652,262 163,824,177 959,652 - 2,596,868,4332,761,652,262 163,824,177 959,652 - 2,596,868,433
1,161,181,309,415 608,863,079,228 362,339,559,817 99,300,525,985 90,678,144,385
Group Total 3420 Manu.of bodies for Motor vehicles, Manu. of trailers & semi-trailers
342 Manu.of bodies for Motorvehicles, Manu. of trailers &semi-trailers
Group Total 3430 Manu.of spare parts and accessories for motor vehicles
343 Manu.of spare parts andaccessories for motor vehicles
Group Total 3511 Building and repairing of ships 3512 Building and repairing of pleasure & sporting boats
351 Building and repairing of shipsand boats
Group Total 3592 Manu.of bicycles & invalid carraiges
359 Manu.of transport equipment n.e.c.
Group Total 3610 Manu.of furniture
361 Manu.of furniture
Group Total 3691 Manu.of jewellery and related articles 3693 Manu.of sports goods 3694 Manu.of toys & games 3699 Other manufacturing not elsewhere classified
369 Manu.of other product notelsewhere classified
Group Total 3710 Reycycling of metal waste and scrap
371 Recycling of metal waste andscrap
Group Total 3720 Reycycling of non-metal waste and scrap
372 Recycling of non-metal wasteand scrap
Group Total 4010 Production, collection & distribution of electricity
401 Production, collection &distribution of electricity
Group Total 4100 Collection, purification and distribution of water
410 Collection, purification anddistribution of water
Total
Type of industry Value of input(Rs.)
Raw materialsconsumed
(imported) (Rs.)
Raw materialsconsumed (local)
(Rs.)
Cost of industrialservices done by
others (Rs.)
Electricity &Fuel consumed
(Rs.)

Table 12 : Value of input & input components classified by industry division- 2011(Establishments with less than 25 persons engaged)
2,520,740,039 552,178,177 1,102,432,028 64,803,810 801,326,02537,570,615,737 1,616,305,318 33,159,153,385 112,545,024 2,682,612,011
172,820,894 68,268,879 57,549,045 41,557,990 5,444,9803,641,624,132 1,210,825,049 1,984,865,819 115,322,341 330,610,9242,047,355,245 221,801,915 1,585,085,121 4,538,900 235,929,310
582,488,334 185,652,744 365,247,453 9,535,827 22,052,3103,416,561,231 232,555,635 2,723,036,112 15,403,011 445,566,473
248,073,768 130,719,797 90,523,372 4,928,500 21,902,0981,943,426,865 412,268,813 1,390,980,179 9,519,001 130,658,871
12,800,000 - 11,000,000 - 1,800,0004,759,423,219 418,686,144 4,169,448,380 1,388,500 169,900,1946,246,973,222 2,576,624,999 3,271,689,728 11,251,023 387,407,4726,151,732,825 474,527,249 4,009,356,552 100,762,900 1,567,086,1241,298,990,586 912,895,829 313,675,522 21,058 72,398,1771,319,703,941 115,751,510 1,043,777,436 34,410,208 125,764,787
315,592,086 131,876,568 140,888,286 9,374,285 33,452,946860,415,485 788,313,930 56,620,035 - 15,481,52156,768,514 6,450,982 43,013,962 41,854 7,261,7167,715,267 7,619,605 -602,640 - 698,302
49,249,904 2,376,606 29,407,198 10,924,225 6,541,87585,536,680 40,529,373 36,711,737 5,050,000 3,245,570
8,285,342,970 1,402,519,954 5,508,039,622 44,135,664 1,330,647,730303,321,132 206,000,000 54,230,003 1,000,000 42,091,12943,380,336 21,024,000 12,274,933 877,200 9,204,20329,386,635 4,299,050 8,346,408 206,300 16,534,877
81,970,039,045 11,740,072,126 61,166,749,675 597,597,620 8,465,619,624
14 Other Mining and Quarrying 15 Manu.of food products and beverages 16 Manu.of tobacco products 17 Manu.of Textiles 18 Manu.of wearing Apparel, dressing & dyeing of fur 19 Tanning and dressing of leather; manu. of luggage, handbags & footwear 20 Manu.of wood & products of wood & cork except furniture 21 Manu.of paper and paper products 22 Publishing, printing and reproduction of recorded media 23 Manu.of coke refined petroleum products and nuclear fuel 24 Manu.of chemicals & chemical products 25 Manu.of rubber & plastic products 26 Manu. of other non metallic mineral products 27 Manu.of basic metals 28 Manu.of fabricated metal products except machinery equipments 29 Manu.of Machinery & equipments (n.e.c.) 31 Manu.of Electrical machinery and apparatus n.e.c. 32 Manu.of Radio, TV & communication equipment and apparatus 33 Manu.of medical, precision & optical instruments, watches & clocks 34 Manu.of motor vehicles, trailers and semi-trailers 35 Manu.of other transport equipments 36 Manu.of furniture, Manufacturing of n.e.c. 37 Recycling 40 Electricity, Gas, Steam and Hot water supply 41 Collection, purification and distribution of water Total
Industry division Value of input(Rs.)
Raw materialsconsumed
(imported) (Rs.)
Raw materialsconsumed(local) (Rs.)
Cost of industrialservices done by
others (Rs.)
Electricity &Fuel
consumed(Rs.)

Table 13 : Value of electricity & type of fuel classified by industry - 2011(Establishments with 25 or more persons engaged)
303,657,643 132,077,771 1,648,000 46,427,426 2,705,631 94,103,179 163,710 - 18,500 23,325,359 3,188,067254,473,263 115,131,106 1,648,000 22,164,788 2,651,979 94,103,179 - - 8,000 16,460,644 2,305,567
35,896,078 11,241,257 - 17,318,039 53,652 - 163,710 - 10,500 6,226,420 882,50013,288,302 5,705,408 - 6,944,599 - - - - - 638,295 -
138,940,907 85,376,543 2,335,474 34,584,289 47,588 6,921,494 665,148 127,915 1,332,000 5,698,467 1,851,98932,320,500 19,889,415 2,335,474 10,041,448 - - - - - 54,163 -39,978,764 18,140,483 - 7,895,051 21,812 6,246,437 12,490 2,698 1,080,000 5,544,304 1,035,489
7,552,900 10,000 - 6,474,400 - - - - 252,000 - 816,500
59,088,743 47,336,645 - 10,173,390 25,776 675,057 652,658 125,217 - 100,000 -
1,138,840,189 460,146,827 150,748,128 167,191,900 4,875,313 21,301,190 59,380,381 4,556,875 58,943,821 58,243,765 153,451,989350,414,279 172,006,920 25,340,008 89,591,179 - 12,788,672 26,013,801 - - 24,673,699 -
94,157,749 51,767,131 800,000 17,582,475 1,234,000 3,830,574 2,500,000 - 440,000 16,003,569 -229,003,248 87,059,712 75,667,659 37,992,218 3,625,831 1,662,875 2,338,282 17,500 10,157,325 10,481,846 -465,264,913 149,313,064 48,940,461 22,026,028 15,482 3,019,069 28,528,298 4,539,375 48,346,496 7,084,651 153,451,989765,557,424 400,329,230 93,309,250 57,676,416 28,543,258 92,898,207 7,100,904 42,435,145 2,745,388 37,094,217 3,425,409765,557,424 400,329,230 93,309,250 57,676,416 28,543,258 92,898,207 7,100,904 42,435,145 2,745,388 37,094,217 3,425,409
2,482,071,529 2,123,932,004 89,787,747 217,182,618 6,768,023 2,938,622 2,341,728 32,000 7,751,621 29,695,065 1,642,1012,234,818,013 1,975,714,273 16,754,698 205,383,605 490,022 1,635,200 1,021,268 32,000 7,212,321 26,340,816 233,810
246,984,236 148,083,091 73,033,049 11,664,373 6,278,001 1,303,422 1,320,460 - 539,300 3,354,249 1,408,291269,280 134,640 - 134,640 - - - - - - -
9,256,826,965 4,008,167,332 340,106,471 1,512,522,326 60,645,614 179,528,822 477,514,021 5,011,249 2,536,492,880 76,981,607 59,856,6421,293,544,453 589,217,299 22,715,495 204,399,251 552,327 10,849,987 427,118,895 - 4,205,232 34,473,968 12,000
248,069,255 83,087,585 4,847,764 123,130,590 270,570 5,000,220 - - 581,609 26,323 31,124,594183,553,316 94,471,555 48,555,924 6,332,898 307,902 878,432 29,960,033 - 81,792 2,401,030 563,750220,188,848 88,742,823 19,445,865 76,889,732 19,298,335 10,572,743 2,254,991 - 465,000 2,519,359 -
7,225,986,994 3,119,250,378 237,686,414 1,079,460,386 32,746,925 148,752,868 13,016,952 5,011,249 2,529,263,047 32,740,726 28,058,04872,300,068 27,283,560 6,855,009 16,918,570 7,454,556 3,199,572 4,899,150 - 831,200 4,820,201 38,250
2,393,032 927,133 - 1,465,899 - - - - - - -10,791,000 5,187,000 - 3,925,000 15,000 275,000 264,000 - 1,065,000 - 60,000
879,792,373 374,036,311 229,500,807 45,800,888 80,844 36,073,965 11,428,000 158,000,000 79,500 22,750,531 2,041,527299,540,346 63,596,887 47,842,449 19,265,466 51,544 4,446,815 - 158,000,000 - 6,336,273 912
200,800 40,000 - 52,000 29,300 - - - 79,500 - -253,064,321 116,034,736 113,543,874 17,777,281 - 927,150 - - - 4,781,280 -326,986,906 194,364,688 68,114,484 8,706,141 - 30,700,000 11,428,000 - - 11,632,978 2,040,615172,529,078 150,874,750 405,693 12,467,062 300,962 1,925,855 2,070,321 8,000 240,329 4,216,506 19,600
49,252,278 41,612,249 405,693 4,605,772 300,962 242,533 9,921 - 240,329 1,815,219 19,60056,460,624 51,432,604 - 2,927,620 - 32,000 2,060,400 8,000 - - -66,816,176 57,829,897 - 4,933,670 - 1,651,322 - - - 2,401,287 -
4,045,452,965 1,560,437,145 987,317,739 70,714,403 816,065,800 12,643,937 75,881,191 29,274,110 235,324,109 228,685,531 29,109,0001,341,518,435 653,397,945 461,658,485 52,816,174 381,000 10,072,137 31,445,755 - 2,007,929 129,635,010 104,0002,703,934,530 907,039,200 525,659,254 17,898,229 815,684,800 2,571,800 44,435,436 29,274,110 233,316,180 99,050,521 29,005,000
405,839,117 242,538,421 65,255,052 36,967,760 1,932,666 14,815,833 6,999,891 - 12,150,019 24,423,406 756,06937,820,619 18,983,501 8,161,800 2,569,420 816,000 2,000,000 4,668,823 - 207,117 225,958 188,000
3,580,140 904,290 - 87,000 - 275,400 - - - 2,313,450 -117,127,734 66,193,297 33,835,500 13,866,760 989,166 340,000 22,000 - - 1,805,221 75,790
30,000 30,000 - - - - - - - - -162,289,934 109,239,043 21,197,752 5,191,655 - 1,082,933 2,045,130 - 11,942,902 11,503,802 86,717
81,395,410 44,168,010 2,060,000 14,752,925 127,500 11,117,500 263,938 - - 8,499,975 405,5633,595,280 3,020,280 - 500,000 - - - - - 75,000 -
1,987,749,492 1,261,054,389 346,683,590 125,881,231 52,938,504 15,476,354 26,268,297 - 33,666,000 123,047,047 2,734,0801,012,493,429 722,746,877 166,731,590 37,091,353 1,397,219 12,930,562 8,184,617 - - 61,595,131 1,816,080
397,938,230 239,392,857 86,505,000 16,674,389 42,680,440 2,381,000 1,000,000 - - 9,304,544 -17,579,000 3,234,000 - 6,720,000 - - 5,775,000 - - 1,850,000 -
559,738,833 295,680,655 93,447,000 65,395,489 8,860,845 164,792 11,308,680 - 33,666,000 50,297,372 918,0009,297,529,452 6,440,899,783 586,824,131 802,044,306 174,902,155 654,993,442 133,608,702 16,775,663 2,889,795 414,151,789 70,439,6869,297,529,452 6,440,899,783 586,824,131 802,044,306 174,902,155 654,993,442 133,608,702 16,775,663 2,889,795 414,151,789 70,439,686
Group Total 1411 Quarrying of stone Clay and Sand 1412 Braking of Granite 1413 Quarrying of Sand & Gravel
141 Quarrying of stone Clay and Sand
Group Total 1421 Mining of chemical and Fertilizer minerals 1422 Extraction of salt 1423 Mining of precious and semi precious stones 1429 Other Mining & Quarrying N.e.c
142 Mining and Quarrying n.e.c
Group Total 1511 Processing and Preserving of Meat and Meat Product 1512 Processing and Preserving of fish and fish Products 1513 Processing & Preserving of fruits & Vegetables 1514 Manufacture of Vegetable oils animal oils & fats
151 Produ., proce. & preserving of meat,fish,fruit, vegetables, oils & fats
Group Total 1520 Manufacture of Dairy Products
152 Manufacture of Dairy Products
Group Total 1531 Manufacture of Grain Mill Products 1533 Preparation of Animal food from milling waist 1538 Packeting of Cereal, grains, yarm and their preparations
153 Manu.of grain mill products andprepared animal feeds
Group Total 1541 Manufacture of bakery products 1542 Manufacture of Cane sugar and molasses 1543 Manu.of cocoa, chocolate and sugar confectionary 1544 Manu.of macaroni, noodles couscous and similar farinaceous 1546 Manu.of tea and tea products 1547 Manu.of chilly-power, condiments powder, proce.of spices 1548 Manu.of viniger and similar products 1549 Manu.of other food products n.e.c
154 Manu.of other food products
Group Total 1551 Manufacture of beverages 1552 Manu.of wine, bottled toddy and similar products 1553 Manu.of all other beverages such as beer and stout 1554 Manu.of beverages such as soft drinks, soda etc
155 Manu.of beverags
Group Total 1601 Manu.of tabacco products 1602 Manu.of Cigarette, Cigar & Beedi 1609 Tobacco based products
160 Manu.of tobacco products
Group Total 1711 Prepa. & spinning of Textiles fibres, weaving of textiles 1712 Finishing of Textiles
171 Spinning, weaving and finishing ofTextiles
Group Total 1721 Manu.of made-up textile article, except apparel 1722 Manu.of carpets and rugs 1723 Manu.of Cordage, Rope, twine & netting 1724 Manufacture of Sanitary Towels & Pampers 1726 Manu. of Laces and embroidered cloths 1727 Manu. of Labels, badges (cloth based) 1729 Cloth and coir based other products
172 Manu.of other Textiles
Group Total 1731 Manufacture of knitted Garments 1732 Manufacture of knitted socks, purses and Hand glouses 1733 Manufacture of Knitted Lace 1739 Elastomeric Yarn & other rubber thread based products
173 Manu.of knitted and crocheted fabricsand articles
Group Total 1810 Manufacture of weaving Apparel, except fur apparels
181 Manu.of weaving Apparel except furapparels
Type of industryFuel &
ElectricityTotal (Rs.) Electricity (Rs.) Furnace (Rs.) Diesel (Rs.) Kerosene (Rs.) Petrol (Rs.) L.P.G. (Rs.) Charcoal (Rs.) Firewood (Rs.) Water (Rs.)
Other fuel(Rs.)
(cont.)

Table 13 : Value of electricity & type of fuel classified by industry - 2011(Establishments with 25 or more persons engaged)
32,942,961 6,256,108 20,018,790 1,841,954 26,849 5,815 - - - 4,793,445 -
32,942,961 6,256,108 20,018,790 1,841,954 26,849 5,815 - - - 4,793,445 -23,840,661 13,683,678 - 2,254,949 20,000 4,076,321 1,384,214 - 1,057,625 1,363,874 -
6,942,327 5,791,534 - - - - - - 1,057,625 93,168 -2,647,335 1,571,061 - 333,589 20,000 572,111 150,574 - - - -
14,250,999 6,321,083 - 1,921,360 - 3,504,210 1,233,640 - - 1,270,706 -177,007,732 112,201,191 23,403,723 21,763,967 7,371,622 4,130,274 280,000 - - 4,866,326 2,990,630177,007,732 112,201,191 23,403,723 21,763,967 7,371,622 4,130,274 280,000 - - 4,866,326 2,990,630
51,018,778 30,149,643 4,503,000 6,081,258 31,250 1,397,806 1,545,993 - 1,894,500 3,322,736 2,092,59251,018,778 30,149,643 4,503,000 6,081,258 31,250 1,397,806 1,545,993 - 1,894,500 3,322,736 2,092,592
1,579,985,570 540,633,386 98,859,517 36,802,582 33,200 3,573,827 7,640,926 160,000 878,324,787 13,926,295 31,0501,524,829,013 501,580,041 98,859,517 33,467,876 33,200 768,328 - - 877,152,787 12,952,264 15,000
4,872,691 4,238,377 - 272,959 - 260,900 - - - 100,455 -9,205,764 6,761,845 - 542,039 - 1,088,773 - - - 201,107 -
17,614,262 6,615,722 - 2,259,677 - 249,418 7,640,926 160,000 - 672,469 16,05022,804,640 20,778,201 - 260,031 - 1,206,408 - - 560,000 - -
659,200 659,200 - - - - - - - - -448,337,242 180,455,677 122,067,358 55,649,276 3,643,830 52,762,408 343,860 13,295,880 2,426,795 6,389,726 11,302,434121,192,866 61,511,956 16,014,717 7,713,096 1,696,557 27,277,595 - - 2,426,795 339,201 4,212,949279,311,613 88,584,773 106,052,641 43,993,019 355,593 16,549,747 81,193 11,593,213 - 5,267,148 6,834,286
39,454,628 24,081,524 - 3,245,782 1,591,680 7,597,066 262,667 1,702,667 - 783,377 189,8678,378,135 6,277,424 - 697,379 - 1,338,000 - - - - 65,332
36,759,546 32,310,477 221,550 1,500,000 60,000 - 900,000 - - 1,742,519 25,0005,728,937 4,765,843 221,550 - 60,000 - - - - 656,544 25,000
12,266,609 11,380,634 - - - - - - - 885,975 -18,764,000 16,164,000 - 1,500,000 - - 900,000 - - 200,000 -
825,456,681 566,954,074 3,399,643 150,849,593 6,076,297 42,092,278 9,529,216 - - 31,833,765 14,721,815807,853,118 553,234,685 3,399,643 150,849,593 5,756,297 38,949,619 9,429,216 - - 31,512,250 14,721,815
16,723,166 13,413,166 - - 320,000 2,670,000 100,000 - - 220,000 -880,397 306,223 - - - 472,659 - - - 101,515 -
7,401,506 7,401,506 - - - - - - - - -
7,401,506 7,401,506 - - - - - - - - -147,821,050 107,614,006 3,432,000 32,539,632 - 936,000 - - - 3,299,412 -
147,821,050 107,614,006 3,432,000 32,539,632 - 936,000 - - - 3,299,412 -312,128,715 231,752,895 23,351,760 27,978,373 338,980 4,183,423 2,609,717 663,000 20,400 19,499,991 1,730,176143,517,639 100,376,648 22,051,760 4,796,560 - 162,000 12,852 663,000 20,400 14,720,645 713,774
13,295,929 7,069,806 - 714,000 - 3,514,783 - - - 1,181,340 816,000143,032,072 116,396,052 1,300,000 21,394,620 223,380 353,940 2,595,000 - - 769,080 -
12,283,075 7,910,389 - 1,073,193 115,600 152,700 1,865 - - 2,828,926 200,402649,772,466 235,623,096 174,100,851 119,049,530 6,271,783 34,810,669 8,050,120 614,415 13,861,667 10,472,813 46,917,524
2,879,000 2,758,000 - 121,000 - - - - - - -175,356,943 72,660,593 13,111,800 67,514,087 4,059,708 6,326,143 243,386 196,635 10,800 2,050,166 9,183,625175,311,059 77,296,046 14,861,700 32,682,684 1,234,999 25,451,720 4,694,843 - 11,976,812 7,082,932 29,325
73,392,602 25,262,158 3,541,539 5,521,391 701,223 619,766 3,111,891 - - 821,440 33,813,1945,256,270 3,049,620 - 1,222,230 - 50,000 - 417,780 - 259,140 257,500
14,122,268 7,151,425 - 2,225,160 273,465 563,040 - - 40,000 235,298 3,633,8802,154,881 586,154 98,946 1,076,056 2,388 - - - 367,500 23,837 -
201,299,443 46,859,100 142,486,866 8,686,922 - 1,800,000 - - 1,466,555 - -5,248,454,710 2,807,948,790 1,122,710,691 299,870,136 51,366,066 45,560,158 24,078,584 70,720,000 543,914,503 263,545,610 18,740,1722,564,357,653 1,786,882,008 401,832,479 125,419,424 187,844 16,827,146 20,175,000 - 107,546,229 103,169,539 2,317,9851,532,160,326 488,755,836 380,605,591 54,300,686 26,000,000 2,532,899 1,142,183 70,720,000 402,593,688 90,783,576 14,725,867
812,706,778 381,975,691 178,199,865 113,619,347 21,686,518 22,861,343 1,799,058 - 27,441,083 64,855,553 268,32016,609,153 10,158,571 3,710,400 1,071,000 - - - - - 241,182 1,428,000
322,620,800 140,176,685 158,362,355 5,459,679 3,491,704 3,338,770 962,343 - 6,333,504 4,495,760 -1,725,708,211 1,316,491,534 10,679,868 202,247,671 4,523,798 26,775,082 98,352,985 - 8,190 40,511,858 26,117,2241,725,708,211 1,316,491,534 10,679,868 202,247,671 4,523,798 26,775,082 98,352,985 - 8,190 40,511,858 26,117,224
Group Total 1820 Dressing and dyeing of fur, manu. articles of fur
182 Dressing and dyeing of fur,manufacture articles of fur
Group Total 1911 Tanning and dressing of leather 1912 Manu.of luggage, hand bags 1913 Manu. of Bags & rain coats, artificial leather product
191 Tanning & dressing of leather; manu.of luggage, Hand bags
Group Total 1920 Manufacturing of footwear
192 Manu.of footwear
Group Total 2010 Saw-milling and planning of wood
201 Saw-milling and planning of wood
Group Total 2021 Manu.of veneer sheets, plywood, lamin board, particle board 2022 Manufacture of builders carpentry and joinery 2023 Manufacture of wooden containers 2025 Manu.of Household utencils of other wooden article and ornaments 2026 Manu.of tools, coffins, other equipments used in funerals 2029 Manu.of all kinds of other wood products
202 Manu.of produ. of wood, cork, straw &plaiting material
Group Total 2101 Manufacture of pulp, paper and paperboards 2102 Manu.of corrugated paper & paperboard & containers of paper 2103 Manufacture of cards, files, books and pads 2109 Manu.of pulp paper and paper boards articles n.e.c
210 Manu.of paper and paper products
Group Total 2211 Publishing of books, broachers, musical books 2212 Publishing of newspapers, journals and periodicals 2219 Other publishing
221 Publishing, printing and reproductionof recorded media
Group Total 2221 Printing of newspapers, journals & periodicals for others 2222 Service activities related to printing 2223 Photocopies, computer print out etc.
222 Printing & service activities related toprinting for others
Group Total 2230 Reproduction of recorded media
223 Reproduction of recorded media
Group Total 2320 Manu.of refined petroleum products
232 Manu.of refined petroleum products
Group Total 2411 Manu.of basic chemicals,(except fertilizres & nitrogen 2412 Manu.of fertilizer & nitrogen compounds 2413 Manu.of plastic in primary forms and synthetic rubber 2414 Manu.of Natural carbonic fertilizers
241 Manu.of basic chemicals
Group Total 2421 Manu.of pesticides and other agro-chemical products 2422 Manu.of paints, varnishes & similar coatings, printing ink 2423 Manu.of parmaceuticals, medicinal chemicals & botanical products 2424 Manu.of soap & detergent, cleaning, perfumies & toilet preparations 2425 Manu.of explosives, crackers and other firework 2426 Manu.of mosquito-coils, camphor, napthaline balls, incense sticks 2427 Manu.of processed salt (for food) 2428 Manu.of chemicals and activated carbon
242 Manu.of other chemical products
Group Total 2511 Manu.of rubber tyres and tubes, rebuilding of rubber tyre 2512 Manu.of rubber condoms, rubber gloves 2513 Manu.of product from natural rubber 2514 Manu.of article of rubber 2519 Manu.of rubber products (not classified elsewhere)
251 Manu.of rubber products
Group Total 2520 Manu.of plastic products
252 Manu.of plastic products
Type of industryFuel &
ElectricityTotal (Rs.) Electricity (Rs.) Furnace (Rs.) Diesel (Rs.) Kerosene (Rs.) Petrol (Rs.) L.P.G. (Rs.) Charcoal (Rs.) Firewood (Rs.) Water (Rs.)
Other fuel(Rs.)
(cont.)

Table 13 : Value of electricity & type of fuel classified by industry - 2011(Establishments with 25 or more persons engaged)
925,480,019 339,421,008 317,943,414 384,356 1,010,453 189,618 265,586,170 - - 945,000 -
925,480,019 339,421,008 317,943,414 384,356 1,010,453 189,618 265,586,170 - - 945,000 -9,041,206,181 3,526,882,410 395,809,944 581,209,979 1,603,418,386 6,099,356 1,308,270,522 1,328,545,063 112,294,997 13,083,914 165,591,6091,480,116,072 337,534,356 1,984,522 223,028,586 271,966,357 - 644,189,454 - - 171,356 1,241,4412,919,260,572 796,393,451 30,759,812 86,404,282 1,330,430,947 22,222 660,228,808 - 14,277,997 337,858 405,1954,012,968,349 1,911,040,673 360,785,310 152,272,816 - - - 1,328,470,063 98,017,000 1,745,620 160,636,867
587,359,271 456,374,298 2,280,300 110,081,951 645,992 5,797,244 1,376,100 75,000 - 9,391,293 1,337,09226,602,503 12,279,473 - 8,751,934 71,850 274,650 2,466,045 - - 787,537 1,971,014
9,073,264 8,079,259 - 555,410 303,240 5,240 10,115 - - 120,000 -5,826,150 5,180,900 - 115,000 - - - - - 530,250 -
503,240,993 275,470,824 218,430,567 6,427,890 - - - - - 1,990,432 921,280503,240,993 275,470,824 218,430,567 6,427,890 - - - - - 1,990,432 921,280
1,462,000 645,000 - 752,000 - - - - - 65,000 -
1,462,000 645,000 - 752,000 - - - - - 65,000 -609,328,577 346,475,533 69,078,850 115,922,193 432,795 5,407,174 44,783,520 9,970,550 30,000 13,115,361 4,112,602280,741,662 109,940,659 51,755,140 61,581,525 257,225 0 43,811,520 3,000,000 30,000 6,252,991 4,112,602328,586,915 236,534,874 17,323,710 54,340,668 175,570 5,407,174 972,000 6,970,550 - 6,862,370 -143,489,023 42,246,063 365,082 37,144,246 614,460 33,915,869 18,132,110 146,450 328,590 8,708,143 1,888,010
89,567,984 31,929,548 365,082 13,443,429 238,210 33,132,875 215,332 146,450 328,590 7,880,458 1,888,010
53,921,039 10,316,515 - 23,700,817 376,250 782,994 17,916,778 - - 827,685 -
157,525,989 63,409,836 30,729,006 15,719,876 2,320,804 8,408,307 23,255,384 1,939,340 635,460 6,514,687 4,593,29028,214,070 10,134,466 2,076,662 3,143,860 680,000 7,086,873 1,576,008 - - 1,016,201 2,500,00013,252,683 5,196,653 1,608,744 3,895,349 36,668 - 1,362,704 60,000 160,000 919,923 12,642
1,149,310 824,777 - - - - 115,115 - - 209,418 -16,441,473 12,311,531 1,207,160 1,583,220 - - - - - 815,936 523,626
3,124,381 1,980,630 295,800 420,600 - - 102,000 17,340 125,460 182,551 -7,791,517 6,040,991 - 892,612 8,569 - - - - 193,468 655,877
39,460,413 13,007,337 408,652 2,482,246 334,172 496,874 19,821,267 1,862,000 350,000 92,520 605,34548,092,142 13,913,451 25,131,988 3,301,989 1,261,395 824,560 278,290 - - 3,084,670 295,80023,941,031 18,584,740 116,625 582,840 - - 17,500 - - 4,091,108 548,218
88,000 64,000 - - - - - - - 24,000 -21,351,055 16,715,790 116,625 582,840 - - 17,500 - - 3,889,832 28,468
2,501,976 1,804,950 - - - - - - - 177,276 519,75065,667,937 25,960,333 808,500 26,259,832 637,903 1,395,711 2,715,505 2,639,277 2,277,659 1,444,237 1,528,98012,025,500 5,168,851 - 2,148,120 32,640 577,674 151,980 - 2,152,659 412,496 1,381,080
1,534,499 1,235,848 - 225,019 - - - - - 73,632 -617,610 351,900 - 107,100 - - - - - 10,710 147,900
29,730,057 4,033,000 - 22,150,000 510,000 334,057 2,290,000 - - 413,000 -8,769,547 3,648,818 808,500 1,121,803 25,000 15,000 163,500 2,639,277 125,000 222,649 -9,615,200 9,494,000 - - - - - - - 121,200 -3,375,524 2,027,916 - 507,790 70,263 468,980 110,025 - - 190,550 -
62,271,383 28,894,219 - 16,640,899 8,649,200 1,196,000 234,600 - - 822,465 5,834,00062,271,383 28,894,219 - 16,640,899 8,649,200 1,196,000 234,600 - - 822,465 5,834,00091,567,672 86,925,793 - 2,187,866 - 1,531,470 75,000 - - 847,543 -
91,567,672 86,925,793 - 2,187,866 - 1,531,470 75,000 - - 847,543 -104,192,921 78,453,299 - 5,019,096 - 15,172,168 - - 711,887 3,263,107 1,573,364104,192,921 78,453,299 - 5,019,096 - 15,172,168 - - 711,887 3,263,107 1,573,364130,279,920 105,832,270 - 10,834,162 - 6,708,230 554,560 - - 6,150,698 200,000130,279,920 105,832,270 - 10,834,162 - 6,708,230 554,560 - - 6,150,698 200,000
58,945,769 51,650,669 - 3,826,500 - - 408,000 - - 3,060,600 -
58,945,769 51,650,669 - 3,826,500 - - 408,000 - - 3,060,600 -98,444,404 64,071,426 2,090,036 1,028,540 13,574,440 22,000 22,000 - - 17,635,962 -
98,444,404 64,071,426 2,090,036 1,028,540 13,574,440 22,000 22,000 - - 17,635,962 -17,642,646 9,877,015 - 539,880 - 642,950 6,323,685 - - 259,116 -
17,642,646 9,877,015 - 539,880 - 642,950 6,323,685 - - 259,116 -67,250,900 60,644,545 - 838,330 - 2,942,298 386,000 - - 2,439,727 -
67,250,900 60,644,545 - 838,330 - 2,942,298 386,000 - - 2,439,727 -
Group Total 2610 Manu.of glass and glass products
261 Manu.of glass and glass products
Group Total 2691 Manu.of non-structural non-refractory ceramic ware 2693 Manu.of structural non refractory clay & ceramic products 2694 Manu.of cement lime, and plaster 2695 Manu.of articles of concrete, cement & plaster 2696 Cutting, shaping & finishing of rough stones 2697 Refining of Ilmanite, surcon & refinding of plumbago 2699 Manu.of other non-metalic mineral products n.e.c
269 Manu.of Non metallic mineralproducts(n.e.c.)
Group Total 2710 Manu.of basic iron & steel
271 Manu.of basic iron & steel
Group Total 2720 Manu.of basic precious & non-ferrous metal
272 Manu.of basic precious & non-ferrousmetal
Group Total 2731 Casting of iron & steel 2732 Casting of Non ferrous metals
273 Casting of metals
Group Total 2811 Manu.of structural metal products 2812 Manu.of tanks, resorvoirs & containers of metal except packingcontainers
281 Manu.of structural metal products,tanks, reservoirs & steam generators
Group Total 2892 Treatment & coating of metal general mechanical engine 2893 Manu.of cutlery, hand tools & general hardware 2894 Manu.of other brass articles 2895 Manu.of non threaded metal products 2896 Manu.of Metal cooking utensils, household appliances & sanitary articles 2897 Manu.of Metal cables and similar articles 2898 Manu.of Containers used for the packing or conveyance 2899 Manu.of other fabricated metal products
289 Manu.of other fabricated metalproducts
Group Total 2911 Manu.of engine and turbines, except aircraft, vehicle 2912 Manu.of pumps, compressors, taps and valves 2919 Manu.of other general purpose machinery
291 Manu.of general purpose machinery
Group Total 2921 Manu.of agricultural & forestry machinery 2922 Manu.of machine tools 2923 Manu.of machinery for metallurgy 2924 Manu.of machinery for mining, quarrying & construction 2925 Manu.of machinery for Food, beverage & tobacco proce. 2926 Manu.of machinery for textile, apparel & leather products 2929 Manu.of other special purpose machinery (n.e.c.)
292 Manu.of special purpose machinery
Group Total 2930 Manu.of domestic appliance n.e.c.
293 Manu.of domestic appliance n.e.c.
Group Total 3000 Manu.of office, accounting and computing machinery
300 Manu.of office, accounting andcomputing machinery
Group Total 3110 Manu.of electric motors, generators and transformers
311 Manu.of electronic motors, generatorsand transformers
Group Total 3120 Manu.of electricity distribution and control apparatus
312 Manu.of electricity distribution andcontrol apparatus
Group Total 3130 Manu.of insulated wire and cables
313 Manu.of insulated wire and cables
Group Total 3140 Manu.of accumulators primary cells and primary batteries
314 Manu.of accumulators primary cellsand primary batteries
Group Total 3150 Manu.of electric lamps and lighting equipments
315 Manu.of electric lamps and lightingequipments
Group Total 3210 Manu.of electronic valves, tubes & other
321 Manu.of electronic valves, tubes &other
Type of industryFuel &
ElectricityTotal (Rs.) Electricity (Rs.) Furnace (Rs.) Diesel (Rs.) Kerosene (Rs.) Petrol (Rs.) L.P.G. (Rs.) Charcoal (Rs.) Firewood (Rs.) Water (Rs.)
Other fuel(Rs.)
(cont.)

Table 13 : Value of electricity & type of fuel classified by industry - 2011(Establishments with 25 or more persons engaged)
117,515,545 108,676,000 - 2,383,000 545 1,444,000 - - - 5,012,000 -
117,515,545 108,676,000 - 2,383,000 545 1,444,000 - - - 5,012,000 -2,008,736 762,056 - - 15,000 1,229,680 - - - 2,000 -
2,008,736 762,056 - - 15,000 1,229,680 - - - 2,000 -7,971,708 6,338,577 612,000 290,883 178,555 145,133 30,600 - - 375,960 -
7,971,708 6,338,577 612,000 290,883 178,555 145,133 30,600 - - 375,960 -17,817,256 7,953,706 - - - 7,685,167 1,973,218 - - 205,165 -
17,817,256 7,953,706 - - - 7,685,167 1,973,218 - - 205,165 -6,788,142 3,192,784 - 2,410,238 334,254 295,000 208,500 65,213 1,200 113,193 167,7606,788,142 3,192,784 - 2,410,238 334,254 295,000 208,500 65,213 1,200 113,193 167,7602,244,088 1,115,588 - 500,500 - - 580,000 - - 48,000 -
2,244,088 1,115,588 - 500,500 - - 580,000 - - 48,000 -275,804,035 157,482,226 - 75,029,292 1,851,000 4,912,044 9,255,900 - - 27,273,573 -
250,911,372 137,480,156 - 72,404,598 1,851,000 4,013,744 9,000,000 - - 26,161,874 -24,892,663 20,002,070 - 2,624,694 - 898,300 255,900 - - 1,111,699 -67,500,003 25,782,147 240,000 22,826,689 - 49,464 15,485,980 - - 2,197,723 918,00067,500,003 25,782,147 240,000 22,826,689 - 49,464 15,485,980 - - 2,197,723 918,000
422,602,828 229,826,099 12,556,310 71,543,599 3,284,445 28,646,593 2,001,928 3,460 81,600 7,532,228 67,126,567422,602,828 229,826,099 12,556,310 71,543,599 3,284,445 28,646,593 2,001,928 3,460 81,600 7,532,228 67,126,567487,899,314 350,047,781 6,428,700 60,902,468 1,545,405 31,273,278 8,478,677 994,925 1,545,300 13,894,740 12,788,040101,852,540 73,686,665 440,500 5,708,175 136,180 12,738,749 3,502,137 494,925 1,514,500 3,269,032 361,677
4,780,000 3,145,000 - 1,235,000 - - - - - 400,000 -44,151,036 36,344,616 - 3,852,604 - 958,663 984,340 - - 2,010,813 -
337,115,738 236,871,500 5,988,200 50,106,689 1,409,225 17,575,866 3,992,200 500,000 30,800 8,214,895 12,426,36314,863,178 7,276,433 - 1,011,000 5,525,343 896,308 - - - 104,094 50,00014,863,178 7,276,433 - 1,011,000 5,525,343 896,308 - - - 104,094 50,00056,868,800 52,900,500 2,035,500 1,700,500 30,000 24,000 52,800 - - 125,500 -
56,868,800 52,900,500 2,035,500 1,700,500 30,000 24,000 52,800 - - 125,500 -32,358,031,993 201,825,800 8,048,393,900 13,015,489,813 - 20,134,800 - 6,786,000,000 - 93,187,680 4,193,000,00032,358,031,993 201,825,800 8,048,393,900 13,015,489,813 - 20,134,800 - 6,786,000,000 - 93,187,680 4,193,000,000
2,596,868,433 2,571,721,535 - 21,834,222 76,464 600,681 16,365 - - - 2,619,1662,596,868,433 2,571,721,535 - 21,834,222 76,464 600,681 16,365 - - - 2,619,166
90,678,144,385 32,279,692,782 13,606,309,268 18,189,130,233 2,873,069,484 1,534,892,260 2,666,986,432 8,471,978,529 4,451,049,123 1,688,390,613 4,916,645,660
Group Total 3220 Manu.of TV & radio transmitters & apparatus for line telephone
322 Manu.of TV & Radio transmitters
Group Total 3230 Manu.of TV & radio receivers sound or video recording
323 Manu.of TV & Radio receivers, soundor vedio recording
Group Total 3320 Manu.of optical instruments and photographic equipments
332 Manu.of optical instruments andphotographic equipments
Group Total 3410 Manu.of motor vehicles
341 Manu.of motor vehicles
Group Total 3420 Manu.of bodies for Motor vehicles, Manu. of trailers & semi-trailers
342 Manu.of bodies for Motor vehicles,Manu. of trailers & semi trailers
Group Total 3430 Manu.of spare parts and accessories for motor vehicles
343 Manu.of spare parts and accessoriesfor motor vehicles
Group Total 3511 Building and repairing of ships 3512 Building and repairing of pleasure & sporting boats
351 Building and repairing of ships andboats
Group Total 3592 Manu.of bicycles & invalid carraiges
359 Manu.of transport equipment n.e.c.
Group Total 3610 Manu.of furniture
361 Manu.of furniture
Group Total 3691 Manu.of jewellery and related articles 3693 Manu.of sports goods 3694 Manu.of toys & games 3699 Other manufacturing not elsewhere classified
369 Manu.of other product not elsewhereclassified
Group Total 3710 Reycycling of metal waste and scrap
371 Recycling of metal waste and scrap
Group Total 3720 Reycycling of non-metal waste and scrap
372 Recycling of non-metal waste andscrap
Group Total 4010 Production, collection & distribution of electricity
401 Production, collection & distributionof electricity
Group Total 4100 Collection, purification and distribution of water
410 Collection, purification anddistribution of water
Total
Type of industryFuel &
ElectricityTotal (Rs.) Electricity (Rs.) Furnace (Rs.) Diesel (Rs.) Kerosene (Rs.) Petrol (Rs.) L.P.G. (Rs.) Charcoal (Rs.) Firewood (Rs.) Water (Rs.)
Other fuel(Rs.)

Table 14 : Value of electricity & type of fuel classified by industry - 2011(Establishments with less than 25 persons engaged)
801,326,025 335,027,305 6,637,934 300,830,896 4,200,252 4,476,982 5,899,886 77,554 8,091,281 32,838,763 103,245,1732,682,612,011 1,586,708,365 3,104,441 424,148,845 43,585,279 23,508,159 136,439,543 4,953,000 365,643,297 82,675,342 11,845,741
5,444,980 1,432,626 - 2,051,750 96,000 911,124 - 49,000 533,200 34,680 336,600330,610,924 226,007,761 1,668,746 70,388,195 3,261,934 4,038,786 202,850 - 15,416,126 5,223,895 4,402,630235,929,310 221,438,118 15,000 4,394,766 1,251,818 5,567,271 252,239 - 334,564 2,344,242 331,29322,052,310 14,040,392 137,700 4,597,299 6,600 1,379,010 469,100 - - 1,184,443 237,766
445,566,473 341,555,775 2,502,850 15,813,036 67,807,479 1,845,988 356,000 867,799 2,525,364 7,645,970 4,646,21421,902,098 13,500,467 19,300 6,504,847 207,120 234,840 - - 1,168,770 266,755 -
130,658,871 90,191,613 2,618,131 9,778,719 4,385,053 9,273,841 4,442,423 - - 8,845,012 1,124,0791,800,000 246,000 - 703,000 786,000 - - - - 65,000 -
169,900,194 59,613,993 14,717,900 46,970,721 900,055 17,093,301 2,147,358 1,709,000 12,250,358 6,001,819 8,495,690387,407,472 311,003,351 8,180,500 37,302,740 2,396,667 3,641,543 5,625 - 4,817,363 19,175,858 883,825
1,567,086,124 404,285,967 14,996,058 433,671,308 100,156,477 1,803,567 53,867,988 1,500,000 498,617,151 7,697,412 50,490,19572,398,177 25,675,932 10,318,815 659,621 1,342,125 281,738 5,011,901 26,641,667 712,425 1,585,654 168,300
125,764,787 60,206,588 9,877,470 9,287,010 2,711,130 4,972,848 6,814,140 1,432,677 2,727,500 8,078,662 19,656,76233,452,946 13,130,524 708,180 11,820,333 1,037,100 1,293,140 1,804,132 801,750 20,000 1,489,682 1,348,10515,481,521 10,692,360 - 2,263,525 - - 621,186 - - 1,092,190 812,2607,261,716 4,315,793 - 2,692,320 30,000 48,848 52,183 - - 122,572 -
698,302 322,756 - - - 375,546 - - - - -6,541,875 4,515,288 - 237,601 680,036 274,255 403,684 5,185 - 231,550 194,2763,245,570 1,703,901 - 785,730 85,500 40,000 196,900 10,500 - 356,739 66,300
1,330,647,730 1,240,723,489 10,416,117 34,261,031 1,191,635 19,718,891 4,820,102 705,567 198,000 11,207,212 7,405,68842,091,129 7,866,374 19,500,000 986,755 - - 252,000 13,000,000 - 486,000 -9,204,203 1,913,719 - 182,400 - 117,920 51,000 - - 434,724 6,504,440
16,534,877 15,988,938 - 372,739 - 157,500 - - - - 15,7008,465,619,624 4,992,107,395 105,419,142 1,420,705,186 236,118,261 101,055,096 224,110,238 51,753,698 913,055,398 199,084,176 222,211,035
14 Other Mining and Quarrying 15 Manu.of food products and beverages 16 Manu.of tobacco products 17 Manu.of Textiles 18 Manu.of wearing Apparel, dressing & dyeing of fur 19 Tanning and dressing of leather; manu. of luggage, handbags & footwear 20 Manu.of wood & products of wood & cork except furniture 21 Manu.of paper and paper products 22 Publishing, printing and reproduction of recorded media 23 Manu.of coke refined petroleum products and nuclear fuel 24 Manu.of chemicals & chemical products 25 Manu.of rubber & plastic products 26 Manu. of other non metallic mineral products 27 Manu.of basic metals 28 Manu.of fabricated metal products except machinery equipments 29 Manu.of Machinery & equipments (n.e.c.) 31 Manu.of Electrical machinery and apparatus n.e.c. 32 Manu.of Radio, TV & communication equipment and apparatus 33 Manu.of medical, precision & optical instruments, watches & clocks 34 Manu.of motor vehicles, trailers and semi-trailers 35 Manu.of other transport equipments 36 Manu.of furniture, Manufacturing of n.e.c. 37 Recycling 40 Electricity, Gas, Steam and Hot water supply 41 Collection, purification and distribution of water Total
Type of industryFuel &
ElectricityTotal (Rs.) Electricity (Rs.) Furnace (Rs.) Diesel (Rs.) Kerosene (Rs.) Petrol (Rs.) L.P.G. (Rs.) Charcoal (Rs.) Firewood (Rs.) Water (Rs.)
Other fuel(Rs.)

Table 15 : Employment by nature of employment & sex classified by industry - 2011(Establishments with 25 or more persons engaged)
6 1 2 1 1,042 179 382 124 1,432 3055 1 2 1 765 155 320 100 1,092 2571 0 0 0 228 16 59 22 288 380 0 0 0 49 8 3 2 52 10
41 1 2 2 1,139 67 1,333 344 2,515 4140 0 0 0 229 3 50 12 279 15
11 0 0 0 339 42 1,155 309 1,505 35130 1 2 2 372 0 15 4 419 7
0 0 0 0 199 22 113 19 312 41
40 4 10 10 5,129 3,092 2,337 487 7,516 3,5923 2 2 2 1,258 520 761 107 2,024 6312 0 0 0 465 366 307 90 774 4566 1 0 3 1,093 412 509 142 1,608 558
29 1 8 5 2,313 1,794 760 148 3,110 1,94712 1 1 0 2,173 527 1,208 399 3,394 92712 1 1 0 2,173 527 1,208 399 3,394 92711 3 8 1 1,899 788 1,370 227 3,287 1,01811 3 8 1 1,607 750 1,175 185 2,800 938
0 0 0 0 244 30 185 33 429 630 0 0 0 48 8 10 9 58 17
249 56 74 81 23,834 28,794 16,636 5,389 40,794 34,31932 5 8 5 3,277 2,492 3,327 1,500 6,644 4,002
0 0 0 0 138 37 140 22 278 591 2 3 1 756 823 277 67 1,037 8932 1 0 0 774 391 606 146 1,382 538
195 40 58 75 18,396 24,209 12,108 3,547 30,757 27,8708 5 3 0 425 571 164 79 600 6551 1 0 0 7 29 4 8 12 38
10 2 3 0 61 242 11 20 85 2646 3 6 0 1,969 805 1,441 502 3,422 1,3102 2 0 0 1,126 396 598 340 1,726 7380 0 0 0 3 0 22 2 25 20 0 0 0 173 51 103 20 276 714 1 6 0 667 358 718 140 1,395 499
17 3 3 1 401 3,173 409 197 830 3,3741 0 0 0 96 1,097 106 68 203 1,165
16 3 3 1 269 783 193 28 481 8150 0 0 0 36 1,293 110 101 146 1,394
34 5 7 3 6,062 4,241 2,552 1,147 8,655 5,39630 5 5 2 2,570 3,048 1,539 788 4,144 3,843
4 0 2 1 3,492 1,193 1,013 359 4,511 1,55323 7 0 0 2,480 1,767 744 347 3,247 2,121
6 3 0 0 253 571 85 66 344 6400 0 0 0 109 96 17 8 126 1046 2 0 0 933 306 252 42 1,191 3501 1 0 0 0 26 1 6 2 335 1 0 0 656 459 214 84 875 5454 0 0 0 507 205 168 130 679 3341 0 0 0 22 104 7 11 30 115
Group Total 1411 Quarrying of stone Clay and Sand 1412 Braking of Granite 1413 Quarrying of Sand & Gravel
141 Quarrying of stone Clay and Sand
Group Total 1421 Mining of chemical and Fertilizer minerals 1422 Extraction of salt 1423 Mining of precious and semi precious stones 1429 Other Mining & Quarrying N.e.c
142 Mining and Quarrying n.e.c
Group Total 1511 Processing and Preserving of Meat and Meat Products 1512 Processing and Preserving of fish and fish Products 1513 Processing & Preserving of fruits & Vegetables 1514 Manufacture of Vegetable oils animal oils & fats
151 Produ., proce. & preserving ofmeat, fish,fruit, vegetables, oils & fats
Group Total 1520 Manufacture of Dairy Products
152 Manufacture of Dairy Products
Group Total 1531 Manufacture of Grain Mill Products 1533 Preparation of Animal food from milling waist 1538 Packeting of Cereal, grains, yarm and their preparations
153 Manu.of grain mill products andprepared animal feeds
Group Total 1541 Manufacture of bakery products 1542 Manufacture of Cane sugar and molasses 1543 Manu.of cocoa, chocolate and sugar confectionary 1544 Manu.of macaroni, noodles couscous and similar farinaceous 1546 Manu.of tea and tea products 1547 Manu.of chilly-power, condiments powder, proce.of spices 1548 Manu.of viniger and similar products 1549 Manu.of other food products n.e.c
154 Manu.of other food products
Group Total 1551 Manufacture of beverages 1552 Manu.of wine, bottled toddy and similar products 1553 Manu.of all other beverages such as beer and stout 1554 Manu.of beverages such as soft drinks, soda etc
155 Manu.of beverags
Group Total 1601 Manu.of tabacco products 1602 Manu.of Cigarette, Cigar & Beedi 1609 Tobacco based products
160 Manu.of tobacco products
Group Total 1711 Prepa. & spinning of Textiles fibres, weaving of textiles 1712 Finishing of Textiles
171 Spinning, weaving and finishing ofTextiles
Group Total 1721 Manu.of made-up textile article, except apparel 1722 Manu.of carpets and rugs 1723 Manu.of Cordage, Rope, twine & netting 1724 Manufacture of Sanitary Towels & Pampers 1726 Manu. of Laces and embroidered cloths 1727 Manu. of Labels, badges (cloth based) 1729 Cloth and coir based other products
172 Manu.of other Textiles
Type of industryworking
proprietors Male (No.)
Workingproprietors Female (No.)
Unpaid familyworkers Male
(No.)
Unpaid familyworkers
Female (No.)Operatives Male (No.)
Operatives Female (No.)
Otheremployees Male (No.)
Otheremployees
Female (No.) Male (No.) Female (No.)Total persons engaged
(cont.)

Table 15 : Employment by nature of employment & sex classified by industry - 2011(Establishments with 25 or more persons engaged)
12 3 0 0 5,020 9,904 2,835 1,449 7,867 11,3562 0 0 0 2,467 6,049 1,169 636 3,638 6,6850 0 0 0 1,033 3,077 647 558 1,680 3,6350 1 0 0 44 15 13 5 57 21
10 2 0 0 1,476 763 1,006 250 2,492 1,015111 49 39 125 45,342 183,717 23,117 20,571 68,609 204,461111 49 39 125 45,342 183,717 23,117 20,571 68,609 204,461
0 0 0 0 104 18 11 3 115 210 0 0 0 104 18 11 3 115 212 2 0 0 324 804 161 135 487 9410 0 0 0 40 0 28 4 68 42 2 0 0 96 340 48 83 146 4250 0 0 0 188 464 85 48 273 5127 1 16 0 3,399 3,046 664 300 4,085 3,3487 1 16 0 3,399 3,046 664 300 4,085 3,3484 3 0 0 476 67 250 82 730 1524 3 0 0 476 67 250 82 730 152
23 3 4 4 962 654 291 157 1,280 81817 2 0 0 517 261 151 90 685 353
1 0 0 0 100 3 15 4 116 70 0 0 0 51 102 31 14 82 1163 0 4 4 187 172 44 27 238 2032 1 0 0 100 100 47 22 149 1230 0 0 0 7 16 3 0 10 16
13 4 13 0 2,449 1,072 935 329 3,409 1,4050 0 0 0 677 161 342 139 1,019 300
11 4 3 0 1,200 496 362 136 1,575 6362 0 10 0 507 367 177 40 695 4070 0 0 0 66 48 54 14 120 622 0 0 0 238 24 263 90 503 1142 0 0 0 118 5 9 22 129 270 0 0 0 31 0 226 57 257 570 0 0 0 89 19 28 11 117 30
35 20 2 0 6,286 1,574 4,279 1,419 10,602 3,01229 17 2 0 6,113 1,418 4,201 1,392 10,345 2,826
4 2 0 0 150 156 73 25 227 1832 1 0 0 23 0 5 2 30 30 0 0 0 0 0 78 21 78 210 0 0 0 0 0 78 21 78 210 0 27 0 1,113 42 1,345 286 2,485 3280 0 27 0 1,113 42 1,345 286 2,485 328
11 0 0 0 1,396 184 850 236 2,257 4208 0 0 0 762 58 215 54 985 1123 0 0 0 161 49 174 52 338 1010 0 0 0 382 28 179 42 561 700 0 0 0 91 49 282 88 373 137
Group Total 1731 Manufacture of knitted Garments 1732 Manufacture of knitted socks, purses and Hand glouses 1733 Manufacture of Knitted Lace 1739 Elastomeric Yarn & other rubber thread based products
173 Manu.of knitted and crochetedfabrics and articles
Group Total 1810 Manufacture of weaving Apparel, except fur apparels
181 Manu.of weaving Apparel exceptfur apparels
Group Total 1820 Dressing and dyeing of fur, manu. articles of fur
182 Dressing and dyeing of fur,manufacture articles of fur
Group Total 1911 Tanning and dressing of leather 1912 Manu.of luggage, hand bags 1913 Manu. of Bags & rain coats, artificial leather product
191 Tanning & dressing of leather;manu. of luggage, Hand bags
Group Total 1920 Manufacturing of footwear
192 Manu.of footwear
Group Total 2010 Saw-milling and planning of wood
201 Saw-milling and planning of wood
Group Total 2021 Manu.of veneer sheets, plywood, lamin board, particle board 2022 Manufacture of builders carpentry and joinery 2023 Manufacture of wooden containers 2025 Manu.of Household utencils of other wooden article & ornaments 2026 Manu.of tools, coffins, other equipments used in funerals 2029 Manu.of all kinds of other wood products
202 Manu.of produ. of wood, cork,straw & plaiting material
Group Total 2101 Manufacture of pulp, paper and paperboards 2102 Manu.of corrugated paper & paperboard & containers of paper 2103 Manufacture of cards, files, books and pads 2109 Manu.of pulp paper and paper boards articles n.e.c
210 Manu.of paper and paper products
Group Total 2211 Publishing of books, broachers, musical books 2212 Publishing of newspapers, journals and periodicals 2219 Other publishing
221 Publishing, printing andreproduction of recorded media
Group Total 2221 Printing of newspapers, journals & periodicals for others 2222 Service activities related to printing 2223 Photocopies, computer print out etc.
222 Printing & service activities relatedto printing for others
Group Total 2230 Reproduction of recorded media
223 Reproduction of recorded media
Group Total 2320 Manu.of refined petroleum products
232 Manu.of refined petroleumproducts
Group Total 2411 Manu.of basic chemicals,(except fertilizres & nitrogen 2412 Manu.of fertilizer & nitrogen compounds 2413 Manu.of plastic in primary forms and synthetic rubber 2414 Manu.of Natural carbonic fertilizers
241 Manu.of basic chemicals
Type of industryworking
proprietors Male (No.)
Workingproprietors Female (No.)
Unpaid familyworkers Male
(No.)
Unpaid familyworkers
Female (No.)Operatives Male (No.)
Operatives Female (No.)
Otheremployees Male (No.)
Otheremployees
Female (No.) Male (No.) Female (No.)Total persons engaged
(cont.)

Table 15 : Employment by nature of employment & sex classified by industry - 2011(Establishments with 25 or more persons engaged)
46 11 8 3 3,615 2,451 2,157 910 5,825 3,3750 0 0 0 102 1 181 27 283 280 0 0 0 1,304 303 549 243 1,853 546
31 11 2 1 1,037 826 1,016 414 2,086 1,2529 0 0 0 478 672 213 146 700 8180 0 0 0 19 111 20 6 39 1172 0 6 2 332 394 100 42 440 4380 0 0 0 60 65 12 10 72 754 0 0 0 283 79 66 22 353 101
34 1 43 58 16,759 7,758 4,326 1,788 21,162 9,6052 0 1 1 9,288 764 1,504 303 10,794 1,0680 0 0 0 2,205 2,990 652 285 2,857 3,275
21 1 42 56 3,792 3,211 1,720 821 5,575 4,0890 0 0 0 277 123 61 27 338 150
12 0 0 1 1,197 670 390 352 1,598 1,023169 34 6 5 8,024 3,944 2,607 848 10,806 4,830169 34 6 5 8,024 3,944 2,607 848 10,806 4,830
0 0 0 0 325 28 138 33 463 610 0 0 0 325 28 138 33 463 61
38 11 5 6 7,983 1,885 2,551 699 10,576 2,6010 0 0 0 2,047 1,515 411 217 2,458 1,7324 0 0 1 2,782 188 730 202 3,516 3911 0 0 0 868 21 729 110 1,598 131
26 4 1 1 1,966 24 613 128 2,605 1575 7 4 4 223 10 48 28 280 492 0 0 0 37 114 20 12 59 1260 0 0 0 60 13 0 2 60 151 1 0 0 526 45 606 142 1,133 1881 1 0 0 526 45 606 142 1,133 1880 0 0 0 39 1 8 2 47 30 0 0 0 39 1 8 2 47 3
12 1 21 11 1,272 68 831 205 2,135 28512 1 21 11 335 66 146 60 514 138
0 0 0 0 937 2 685 145 1,621 1475 1 0 0 1,679 204 407 133 2,091 3385 1 0 0 1,341 154 312 103 1,658 258
0 0 0 0 338 50 95 30 433 80
19 2 5 65 1,475 777 446 164 1,944 1,0074 0 0 0 469 12 102 39 574 510 0 0 0 191 122 55 10 246 1325 0 0 0 25 0 2 0 32 05 0 0 0 201 12 81 31 287 431 0 0 0 60 11 25 4 86 150 0 0 0 45 2 21 6 66 82 1 0 0 122 131 46 9 170 1412 1 5 65 362 487 115 65 483 617
Group Total 2421 Manu.of pesticides and other agro-chemical products 2422 Manu.of paints, varnishes & similar coatings, printing ink 2423 Manu.of parmaceuticals, medicinal chemicals & botanical products 2424 Manu.of soap & detergent, cleaning, perfumies & toilet preparations 2425 Manu.of explosives, crackers and other firework 2426 Manu.of mosquito-coils, camphor, napthaline balls, incense sticks 2427 Manu.of processed salt (for food) 2428 Manu.of chemicals and activated carbon
242 Manu.of other chemical products
Group Total 2511 Manu.of rubber tyres and tubes, rebuilding of rubber tyres 2512 Manu.of rubber condoms, rubber gloves 2513 Manu.of product from natural rubber 2514 Manu.of article of rubber 2519 Manu.of rubber products (not classified elsewhere)
251 Manu.of rubber products
Group Total 2520 Manu.of plastic products
252 Manu.of plastic products
Group Total 2610 Manu.of glass and glass products
261 Manu.of glass and glass products
Group Total 2691 Manu.of non-structural non-refractory ceramic ware 2693 Manu.of structural non refractory clay & ceramic products 2694 Manu.of cement lime, and plaster 2695 Manu.of articles of concrete, cement & plaster 2696 Cutting, shaping & finishing of rough stones 2697 Refining of Ilmanite, surcon & refinding of plumbago 2699 Manu.of other non-metalic mineral products n.e.c
269 Manu.of Non metallic mineralproducts(n.e.c.)
Group Total 2710 Manu.of basic iron & steel
271 Manu.of basic iron & steel
Group Total 2720 Manu.of basic precious & non-ferrous metal
272 Manu.of basic precious &non-ferrous metal
Group Total 2731 Casting of iron & steel 2732 Casting of Non ferrous metals
273 Casting of metals
Group Total 2811 Manu.of structural metal products 2812 Manu.of tanks, resorvoirs & containers of metal except packing containers
281 Manu.of structural metal products,tanks, reservoirs & steam generators
Group Total 2892 Treatment & coating of metal general mechanical engine 2893 Manu.of cutlery, hand tools & general hardware 2894 Manu.of other brass articles 2895 Manu.of non threaded metal products 2896 Manu.of Metal cooking utensils, household appliances & sanitary articles 2897 Manu.of Metal cables and similar articles 2898 Manu.of Containers used for the packing or conveyance 2899 Manu.of other fabricated metal products
289 Manu.of other fabricated metalproducts
Type of industryworking
proprietors Male (No.)
Workingproprietors Female (No.)
Unpaid familyworkers Male
(No.)
Unpaid familyworkers
Female (No.)Operatives Male (No.)
Operatives Female (No.)
Otheremployees Male (No.)
Otheremployees
Female (No.) Male (No.) Female (No.)Total persons engaged
(cont.)

Table 15 : Employment by nature of employment & sex classified by industry - 2011(Establishments with 25 or more persons engaged)
6 1 1 0 471 3 73 14 551 180 0 1 0 30 2 3 1 34 32 1 0 0 411 0 54 10 467 114 0 0 0 30 1 16 3 50 49 2 0 0 756 13 152 33 917 482 0 0 0 197 0 25 8 224 84 0 0 0 35 0 17 7 56 70 0 0 0 21 10 10 0 31 100 0 0 0 130 0 24 1 154 13 2 0 0 166 0 27 9 196 110 0 0 0 129 0 38 2 167 20 0 0 0 78 3 11 6 89 94 0 0 0 424 35 223 28 651 634 0 0 0 424 35 223 28 651 630 0 0 0 660 814 200 198 860 1,0120 0 0 0 660 814 200 198 860 1,0122 2 0 0 707 683 328 120 1,037 8042 2 0 0 707 683 328 120 1,037 8042 0 0 0 1,117 581 264 135 1,383 7162 0 0 0 1,117 581 264 135 1,383 7160 0 0 0 568 59 311 89 879 1480 0 0 0 568 59 311 89 879 1484 1 0 0 71 0 170 10 245 114 1 0 0 71 0 170 10 245 113 0 0 0 42 94 34 13 79 1073 0 0 0 42 94 34 13 79 1070 0 0 0 256 668 254 128 510 7960 0 0 0 256 668 254 128 510 7960 0 0 0 281 725 204 115 485 8400 0 0 0 281 725 204 115 485 8403 0 0 0 55 37 12 10 70 473 0 0 0 55 37 12 10 70 470 0 1 0 14 81 19 8 34 890 0 1 0 14 81 19 8 34 891 0 0 0 275 0 115 13 391 131 0 0 0 275 0 115 13 391 130 0 0 0 240 0 126 45 366 450 0 0 0 240 0 126 45 366 450 0 0 0 79 7 60 27 139 340 0 0 0 79 7 60 27 139 343 0 0 0 1,512 1,241 683 466 2,198 1,7073 0 0 0 1,086 113 573 384 1,662 4970 0 0 0 426 1,128 110 82 536 1,2104 0 0 0 816 197 192 40 1,012 2374 0 0 0 816 197 192 40 1,012 237
24 2 1 0 3,406 207 904 266 4,335 47524 2 1 0 3,406 207 904 266 4,335 475
Group Total 2911 Manu.of engine and turbines, except aircraft, vehicle 2912 Manu.of pumps, compressors, taps and valves 2919 Manu.of other general purpose machinery
291 Manu.of general purposemachinery
Group Total 2921 Manu.of agricultural & forestry machinery 2922 Manu.of machine tools 2923 Manu.of machinery for metallurgy 2924 Manu.of machinery for mining, quarrying & construction 2925 Manu.of machinery for Food, beverage & tobacco proce. 2926 Manu.of machinery for textile, apparel & leather products 2929 Manu.of other special purpose machinery (n.e.c.)
292 Manu.of special purposemachinery
Group Total 2930 Manu.of domestic appliance n.e.c.
293 Manu.of domestic appliance n.e.c.
Group Total 3000 Manu.of office, accounting and computing machinery
300 Manu.of office, accounting andcomputing machinery
Group Total 3110 Manu.of electric motors, generators and transformers
311 Manu.of electronic motors,generators and transformers
Group Total 3120 Manu.of electricity distribution and control apparatus
312 Manu.of electricity distribution andcontrol apparatus
Group Total 3130 Manu.of insulated wire and cables
313 Manu.of insulated wire and cables
Group Total 3140 Manu.of accumulators primary cells and primary batteries
314 Manu.of accumulators primarycells and primary batteries
Group Total 3150 Manu.of electric lamps and lighting equipments
315 Manu.of electric lamps and lightingequipments
Group Total 3210 Manu.of electronic valves, tubes & other
321 Manu.of electronic valves, tubes &other
Group Total 3220 Manu.of TV & radio transmitters & apparatus for line telephone
322 Manu.of TV & Radio transmitters
Group Total 3230 Manu.of TV & radio receivers sound or video recording
323 Manu.of TV & Radio receivers,sound or vedio recording
Group Total 3320 Manu.of optical instruments and photographic equipment
332 Manu.of optical instruments andphotographic equipments
Group Total 3410 Manu.of motor vehicles
341 Manu.of motor vehicles
Group Total 3420 Manu.of bodies for Motor vehicles, Manu. of trailers & semi-trailers
342 Manu.of bodies for Motor vehicles,Manu. of trailers & semi-trailers
Group Total 3430 Manu.of spare parts and accessories for motor vehicles
343 Manu.of spare parts andaccessories for motor vehicles
Group Total 3511 Building and repairing of ships 3512 Building and repairing of pleasure & sporting boats
351 Building and repairing of ships andboats
Group Total 3592 Manu.of bicycles & invalid carraiges
359 Manu.of transport equipment n.e.c.
Group Total 3610 Manu.of furniture
361 Manu.of furniture
Type of industryworking
proprietors Male (No.)
Workingproprietors Female (No.)
Unpaid familyworkers Male
(No.)
Unpaid familyworkers
Female (No.)Operatives Male (No.)
Operatives Female (No.)
Otheremployees Male (No.)
Otheremployees
Female (No.) Male (No.) Female (No.)Total persons engaged
(cont.)

Table 15 : Employment by nature of employment & sex classified by industry - 2011(Establishments with 25 or more persons engaged)
20 10 7 0 4,639 6,997 1,503 806 6,170 7,8134 3 0 0 1,113 700 621 315 1,738 1,0181 0 0 0 164 0 37 8 202 80 0 0 0 549 1,774 110 49 659 1,823
15 7 7 0 2,813 4,523 735 435 3,571 4,9644 2 2 1 62 0 22 9 90 124 2 2 1 62 0 22 9 90 121 1 0 0 74 58 12 11 87 701 1 0 0 74 58 12 11 87 700 0 0 0 9,204 3 5,320 1,837 14,524 1,8400 0 0 0 9,204 3 5,320 1,837 14,524 1,8400 0 0 0 3,039 330 4,461 1,909 7,500 2,2390 0 0 0 3,039 330 4,461 1,909 7,500 2,239
1,074 252 313 376 183,700 274,529 93,205 45,491 278,292 320,648
Group Total 3691 Manu.of jewellery and related articles 3693 Manu.of sports goods 3694 Manu.of toys & games 3699 Other manufacturing not elsewhere classified
369 Manu.of other product notelsewhere classified
Group Total 3710 Reycycling of metal waste and scrap
371 Recycling of metal waste andscrap
Group Total 3720 Reycycling of non-metal waste and scrap
372 Recycling of non-metal waste andscrap
Group Total 4010 Production, collection & distribution of electricity
401 Production, collection &distribution of electricity
Group Total 4100 Collection, purification and distribution of water
410 Collection, purification anddistribution of water
Total
Type of industryworking
proprietors Male (No.)
Workingproprietors Female (No.)
Unpaid familyworkers Male
(No.)
Unpaid familyworkers
Female (No.)Operatives Male (No.)
Operatives Female (No.)
Otheremployees Male (No.)
Otheremployees
Female (No.) Male (No.) Female (No.)Total persons engaged

Table 16 : Employment by nature of employment & sex classified by industry division - 2011(Establishments with less than 25 persons engaged)
1,292 87 352 93 11,913 899 988 101 14,546 1,1811,787 414 840 582 13,838 6,492 2,489 1,109 18,955 8,598
70 23 21 14 342 421 50 44 483 502888 272 339 322 4,218 8,334 701 628 6,146 9,556592 269 104 93 2,529 4,751 488 221 3,714 5,334141 41 25 23 773 878 111 45 1,050 986947 66 174 23 7,165 764 887 183 9,172 1,036
49 23 29 2 455 233 77 34 609 29397 20 17 14 1,981 833 344 220 2,439 1,087
0 0 2 0 3 1 2 0 7 1201 39 43 44 1,700 892 510 183 2,453 1,158
98 21 44 15 1,982 879 572 136 2,697 1,0521,141 34 260 209 9,093 4,234 1,313 454 11,806 4,930
56 8 2 2 794 1 73 65 925 76524 79 90 2 3,251 201 387 94 4,251 376
49 4 7 1 622 8 134 48 811 6112 0 10 2 303 45 72 29 397 76
6 2 2 0 96 35 32 20 136 572 2 0 0 8 1 4 6 14 9
22 3 3 0 277 23 63 36 365 617 0 2 0 114 13 22 4 145 17
692 136 438 155 7,083 1,511 819 262 9,032 2,0632 1 0 0 37 8 19 6 58 157 3 0 0 76 1 34 7 117 116 1 21 12 104 6 19 7 150 26
8,688 1,548 2,823 1,606 68,756 31,465 10,209 3,942 90,477 38,561
14 Other Mining and Quarrying 15 Manu.of food products and beverages 16 Manu.of tobacco products 17 Manu.of Textiles 18 Manu.of wearing Apparel, dressing & dyeing of fur 19 Tanning and dressing of leather; manu. of luggage, handbags & footwear 20 Manu.of wood & products of wood & cork except furniture 21 Manu.of paper and paper products 22 Publishing, printing and reproduction of recorded media 23 Manu.of coke refined petroleum products and nuclear fuel 24 Manu.of chemicals & chemical products 25 Manu.of rubber & plastic products 26 Manu. of other non metallic mineral products 27 Manu.of basic metals 28 Manu.of fabricated metal products except machinery equipments 29 Manu.of Machinery & equipments (n.e.c.) 31 Manu.of Electrical machinery and apparatus n.e.c. 32 Manu.of Radio, TV & communication equipment and apparatus 33 Manu.of medical, precision & optical instruments, watches & clocks 34 Manu.of motor vehicles, trailers and semi-trailers 35 Manu.of other transport equipment 36 Manu.of furniture, Manufacturing of n.e.c. 37 Recycling 40 Electricity, Gas, Steam and Hot water supply 41 Collection, purification and distribution of water Total
industry divisionworking
proprietors Male (No.)
Workingproprietors Female (No.)
Unpaid familyworkers Male
(No.)
Unpaid familyworkers
Female (No.)Operatives Male (No.)
Operatives Female (No.)
Otheremployees Male (No.)
Otheremployees
Female (No.) Male (No.) Female (No.)Total persons engaged
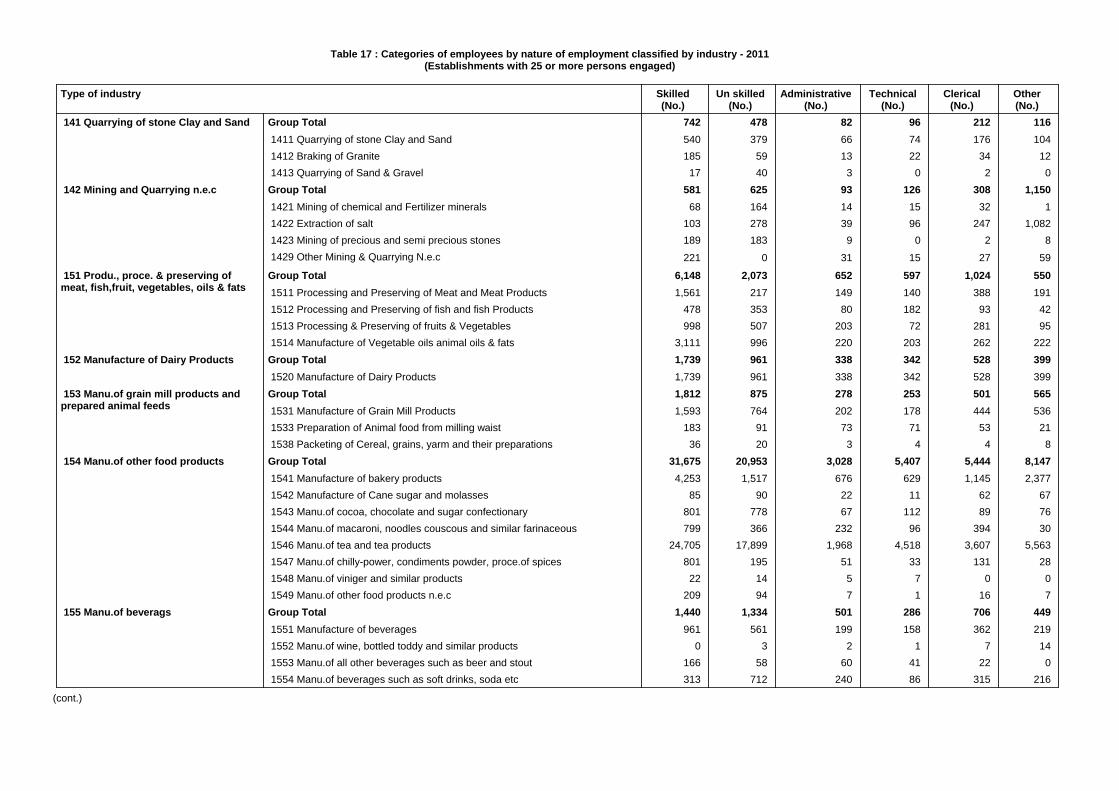
Table 17 : Categories of employees by nature of employment classified by industry - 2011(Establishments with 25 or more persons engaged)
742 478 82 96 212 116540 379 66 74 176 104185 59 13 22 34 12
17 40 3 0 2 0581 625 93 126 308 1,150
68 164 14 15 32 1103 278 39 96 247 1,082189 183 9 0 2 8
221 0 31 15 27 59
6,148 2,073 652 597 1,024 5501,561 217 149 140 388 191
478 353 80 182 93 42998 507 203 72 281 95
3,111 996 220 203 262 2221,739 961 338 342 528 3991,739 961 338 342 528 3991,812 875 278 253 501 5651,593 764 202 178 444 536
183 91 73 71 53 2136 20 3 4 4 8
31,675 20,953 3,028 5,407 5,444 8,1474,253 1,517 676 629 1,145 2,377
85 90 22 11 62 67801 778 67 112 89 76799 366 232 96 394 30
24,705 17,899 1,968 4,518 3,607 5,563801 195 51 33 131 28
22 14 5 7 0 0209 94 7 1 16 7
1,440 1,334 501 286 706 449961 561 199 158 362 219
0 3 2 1 7 14166 58 60 41 22 0313 712 240 86 315 216
Group Total 1411 Quarrying of stone Clay and Sand 1412 Braking of Granite 1413 Quarrying of Sand & Gravel
141 Quarrying of stone Clay and Sand
Group Total 1421 Mining of chemical and Fertilizer minerals 1422 Extraction of salt 1423 Mining of precious and semi precious stones 1429 Other Mining & Quarrying N.e.c
142 Mining and Quarrying n.e.c
Group Total 1511 Processing and Preserving of Meat and Meat Products 1512 Processing and Preserving of fish and fish Products 1513 Processing & Preserving of fruits & Vegetables 1514 Manufacture of Vegetable oils animal oils & fats
151 Produ., proce. & preserving ofmeat, fish,fruit, vegetables, oils & fats
Group Total 1520 Manufacture of Dairy Products
152 Manufacture of Dairy Products
Group Total 1531 Manufacture of Grain Mill Products 1533 Preparation of Animal food from milling waist 1538 Packeting of Cereal, grains, yarm and their preparations
153 Manu.of grain mill products andprepared animal feeds
Group Total 1541 Manufacture of bakery products 1542 Manufacture of Cane sugar and molasses 1543 Manu.of cocoa, chocolate and sugar confectionary 1544 Manu.of macaroni, noodles couscous and similar farinaceous 1546 Manu.of tea and tea products 1547 Manu.of chilly-power, condiments powder, proce.of spices 1548 Manu.of viniger and similar products 1549 Manu.of other food products n.e.c
154 Manu.of other food products
Group Total 1551 Manufacture of beverages 1552 Manu.of wine, bottled toddy and similar products 1553 Manu.of all other beverages such as beer and stout 1554 Manu.of beverages such as soft drinks, soda etc
155 Manu.of beverags
Type of industry Skilled(No.)
Un skilled(No.)
Administrative(No.)
Technical(No.)
Clerical(No.)
Other(No.)
(cont.)

Table 17 : Categories of employees by nature of employment classified by industry - 2011(Establishments with 25 or more persons engaged)
832 2,742 231 219 64 9284 1,109 33 116 11 14
727 325 182 3 27 921 1,308 16 100 26 69
7,621 2,682 693 925 720 1,3624,597 1,021 406 461 407 1,0543,024 1,661 287 464 313 3082,995 1,252 243 390 383 74
557 267 32 40 47 32150 55 2 7 6 10920 319 77 149 58 10
26 0 1 1 2 3779 336 65 129 95 10459 253 61 61 172 5104 22 6 4 4 4
11,557 3,367 1,013 2,013 959 2997,010 1,506 648 625 385 1472,734 1,376 144 608 384 69
48 11 2 0 14 21,765 474 219 780 176 81
175,075 53,984 7,458 16,033 7,188 13,008175,075 53,984 7,458 16,033 7,188 13,008
90 32 2 12 0 090 32 2 12 0 0
809 319 55 92 108 4136 4 6 5 14 7
365 71 26 28 61 16408 244 23 59 33 18
4,337 2,108 173 341 385 664,337 2,108 173 341 385 66
349 194 30 39 103 160349 194 30 39 103 160
Group Total 1601 Manu.of tabacco products 1602 Manu.of Cigarette, Cigar & Beedi 1609 Tobacco based products
160 Manu.of tobacco products
Group Total 1711 Prepa. & spinning of Textiles fibres, weaving of textiles 1712 Finishing of Textiles
171 Spinning, weaving and finishing ofTextiles
Group Total 1721 Manu.of made-up textile article, except apparel 1722 Manu.of carpets and rugs 1723 Manu.of Cordage, Rope, twine & netting 1724 Manufacture of Sanitary Towels & Pampers 1726 Manu. of Laces and embroidered cloths 1727 Manu. of Labels, badges (cloth based) 1729 Cloth and coir based other products
172 Manu.of other Textiles
Group Total 1731 Manufacture of knitted Garments 1732 Manufacture of knitted socks, purses and Hand glouses 1733 Manufacture of Knitted Lace 1739 Elastomeric Yarn & other rubber thread based products
173 Manu.of knitted and crochetedfabrics and articles
Group Total 1810 Manufacture of weaving Apparel, except fur apparels
181 Manu.of weaving Apparel exceptfur apparels
Group Total 1820 Dressing and dyeing of fur, manu. articles of fur
182 Dressing and dyeing of fur,manufacture articles of fur
Group Total 1911 Tanning and dressing of leather 1912 Manu.of luggage, hand bags 1913 Manu. of Bags & rain coats, artificial leather products
191 Tanning & dressing of leather;manu. of luggage, Hand bags, saddlery& harness
Group Total 1920 Manufacturing of footwear
192 Manu.of footwear
Group Total 2010 Saw-milling and planning of wood
201 Saw-milling and planning of wood
Type of industry Skilled(No.)
Un skilled(No.)
Administrative(No.)
Technical(No.)
Clerical(No.)
Other(No.)
(cont.)

Table 17 : Categories of employees by nature of employment classified by industry - 2011(Establishments with 25 or more persons engaged)
1,087 529 105 152 108 83470 308 49 85 56 51
45 58 8 3 2 6124 29 12 14 13 6285 74 27 22 17 5140 60 8 28 18 15
23 0 1 0 2 02,360 1,161 315 316 443 189
664 174 121 117 182 61890 806 131 159 186 22707 166 52 15 50 99
99 15 11 25 25 7150 112 43 25 261 24
69 54 7 2 22 015 16 30 3 226 2466 42 6 20 13 0
6,156 1,704 726 2,216 1,903 8536,024 1,507 701 2,174 1,883 835
117 189 21 42 17 1815 8 4 0 3 0
0 0 3 92 4 00 0 3 92 4 0
708 447 300 550 531 250708 447 300 550 531 250872 708 249 202 395 240347 473 59 73 79 58168 42 63 42 100 21294 116 59 78 48 36
63 77 68 9 168 125
Group Total 2021 Manu.of veneer sheets, plywood, lamin board, particle board 2022 Manufacture of builders carpentry and joinery 2023 Manufacture of wooden containers 2025 Manu.of Household utencils of other wooden article and ornaments 2026 Manu.of tools, coffins, other equipments used in funerals 2029 Manu.of all kinds of other wood products
202 Manu.of produ. of wood, cork,straw & plaiting material
Group Total 2101 Manufacture of pulp, paper and paperboards 2102 Manu.of corrugated paper & paperboard & containers of paper 2103 Manufacture of cards, files, books and pads 2109 Manu.of pulp paper and paper boards articles n.e.c
210 Manu.of paper and paper products
Group Total 2211 Publishing of books, broachers, musical books 2212 Publishing of newspapers, journals and periodicals 2219 Other publishing
221 Publishing, printing andreproduction of recorded media
Group Total 2221 Printing of newspapers, journals & periodicals for others 2222 Service activities related to printing 2223 Photocopies, computer print out etc.
222 Printing & service activities relatedto printing for others
Group Total 2230 Reproduction of recorded media
223 Reproduction of recorded media
Group Total 2320 Manu.of refined petroleum products
232 Manu.of refined petroleumproducts
Group Total 2411 Manu.of basic chemicals,(except fertilizres & nitrogen 2412 Manu.of fertilizer & nitrogen compounds 2413 Manu.of plastic in primary forms and synthetic rubber 2414 Manu.of Natural carbonic fertilizers
241 Manu.of basic chemicals
Type of industry Skilled(No.)
Un skilled(No.)
Administrative(No.)
Technical(No.)
Clerical(No.)
Other(No.)
(cont.)

Table 17 : Categories of employees by nature of employment classified by industry - 2011(Establishments with 25 or more persons engaged)
4,563 1,502 672 497 1,026 87253 50 49 32 22 105
1,352 255 214 126 336 1161,359 503 254 220 503 454
940 210 74 57 82 146112 18 4 4 8 10494 232 29 39 43 31
10 115 3 3 6 10243 119 45 16 27 0
17,364 7,154 1,171 1,811 1,227 1,9057,886 2,166 587 692 392 1363,871 1,324 256 468 163 513,602 3,401 213 485 446 1,396
368 32 22 25 31 101,636 231 93 141 196 3137,492 4,476 943 759 1,160 5937,492 4,476 943 759 1,160 593
325 28 21 124 22 4325 28 21 124 22 4
6,929 2,939 940 964 1,005 3412,784 778 198 157 211 622,050 920 310 174 308 140
692 197 276 291 191 811,068 922 120 314 249 58
164 69 27 21 28 0141 10 9 7 16 0
30 43 0 0 2 0414 157 197 115 123 313414 157 197 115 123 313
8 32 2 4 4 08 32 2 4 4 0
866 474 277 158 433 168246 155 60 61 56 29620 319 217 97 377 139
Group Total 2421 Manu.of pesticides and other agro-chemical products 2422 Manu.of paints, varnishes & similar coatings, printing ink 2423 Manu.of parmaceuticals, medicinal chemicals & botanical products 2424 Manu.of soap & detergent, cleaning, perfumies & toilet preparations 2425 Manu.of explosives, crackers and other firework 2426 Manu.of mosquito-coils, camphor, napthaline balls, incense sticks 2427 Manu.of processed salt (for food) 2428 Manu.of chemicals and activated carbon
242 Manu.of other chemical products
Group Total 2511 Manu.of rubber tyres and tubes, rebuilding of rubber tyres 2512 Manu.of rubber condoms, rubber gloves 2513 Manu.of product from natural rubber 2514 Manu.of article of rubber 2519 Manu.of rubber products (not classified elsewhere)
251 Manu.of rubber products
Group Total 2520 Manu.of plastic products
252 Manu.of plastic products
Group Total 2610 Manu.of glass and glass products
261 Manu.of glass and glass products
Group Total 2691 Manu.of non-structural non-refractory ceramic ware 2693 Manu.of structural non refractory clay & ceramic products 2694 Manu.of cement lime, and plaster 2695 Manu.of articles of concrete, cement & plaster 2696 Cutting, shaping & finishing of rough stones 2697 Refining of Ilmanite, surcon & refinding of plumbago 2699 Manu.of other non-metalic mineral products n.e.c
269 Manu.of Non metallic mineralproducts(n.e.c.)
Group Total 2710 Manu.of basic iron & steel
271 Manu.of basic iron & steel
Group Total 2720 Manu.of basic precious & non-ferrous metal
272 Manu.of basic precious &non-ferrous metal
Group Total 2731 Casting of iron & steel 2732 Casting of Non ferrous metals
273 Casting of metals
Type of industry Skilled(No.)
Un skilled(No.)
Administrative(No.)
Technical(No.)
Clerical(No.)
Other(No.)
(cont.)

Table 17 : Categories of employees by nature of employment classified by industry - 2011(Establishments with 25 or more persons engaged)
1,212 671 136 126 218 60983 512 109 105 141 60
229 159 27 21 77 0
1,811 440 147 126 257 81424 57 27 37 62 16213 100 19 15 29 2
22 3 1 0 1 0146 67 41 13 30 28
51 20 2 8 10 934 13 4 4 17 2
222 31 14 20 12 9699 150 39 29 97 15406 68 27 26 28 6
32 0 2 2 0 0352 59 15 21 26 2
22 9 10 3 2 4592 177 28 47 93 17123 74 6 11 8 8
30 5 4 10 8 231 0 3 4 3 078 52 3 12 10 0
142 24 8 5 20 3129 0 0 3 37 0
59 22 4 2 7 4340 119 41 159 44 7340 119 41 159 44 7
1,282 192 130 117 33 1181,282 192 130 117 33 1181,167 223 160 166 61 611,167 223 160 166 61 611,178 520 94 154 118 331,178 520 94 154 118 33
555 72 111 88 196 5555 72 111 88 196 5
Group Total 2811 Manu.of structural metal products 2812 Manu.of tanks, resorvoirs & containers of metal except packingcontainers
281 Manu.of structural metal products,tanks, reservoirs &steam generators
Group Total 2892 Treatment & coating of metal general mechanical engine 2893 Manu.of cutlery, hand tools & general hardware 2894 Manu.of other brass articles 2895 Manu.of non threaded metal products 2896 Manu.of Metal cooking utensils, household appliances & sanitary articles 2897 Manu.of Metal cables and similar articles 2898 Manu.of Containers used for the packing or conveyance 2899 Manu.of other fabricated metal products
289 Manu.of other fabricated metalproducts
Group Total 2911 Manu.of engine and turbines, except aircraft, vehicle 2912 Manu.of pumps, compressors, taps and valves 2919 Manu.of other general purpose machinery
291 Manu.of general purposemachinery
Group Total 2921 Manu.of agricultural & forestry machinery 2922 Manu.of machine tools 2923 Manu.of machinery for metallurgy 2924 Manu.of machinery for mining, quarrying & construction 2925 Manu.of machinery for Food, beverage & tobacco proce. 2926 Manu.of machinery for textile, apparel & leather products 2929 Manu.of other special purpose machinery (n.e.c.)
292 Manu.of special purposemachinery
Group Total 2930 Manu.of domestic appliance n.e.c.
293 Manu.of domestic appliance n.e.c.
Group Total 3000 Manu.of office, accounting and computing machinery
300 Manu.of office, accounting andcomputing machinery
Group Total 3110 Manu.of electric motors, generators and transformers
311 Manu.of electronic motors,generators and transformers
Group Total 3120 Manu.of electricity distribution and control apparatus
312 Manu.of electricity distribution andcontrol apparatus
Group Total 3130 Manu.of insulated wire and cables
313 Manu.of insulated wire and cables
Type of industry Skilled(No.)
Un skilled(No.)
Administrative(No.)
Technical(No.)
Clerical(No.)
Other(No.)
(cont.)

Table 17 : Categories of employees by nature of employment classified by industry - 2011(Establishments with 25 or more persons engaged)
39 32 21 27 8 12439 32 21 27 8 124
119 17 10 5 22 10119 17 10 5 22 10872 52 91 113 43 135872 52 91 113 43 135963 43 68 67 41 143963 43 68 67 41 143
55 37 2 3 9 855 37 2 3 9 890 5 4 6 9 890 5 4 6 9 8
174 101 40 28 29 31174 101 40 28 29 31153 87 15 37 78 41153 87 15 37 78 41
86 0 22 31 23 1186 0 22 31 23 11
1,445 1,308 222 352 332 243641 558 167 304 262 224804 750 55 48 70 19750 263 55 92 80 5750 263 55 92 80 5
2,571 1,043 223 247 493 2062,571 1,043 223 247 493 2068,128 3,508 656 630 597 4281,347 466 229 178 265 264
77 87 9 9 5 221,930 393 74 60 25 04,775 2,562 344 382 302 142
30 32 7 9 9 630 32 7 9 9 6
Group Total 3140 Manu.of accumulators primary cells and primary batteries
314 Manu.of accumulators primarycells and primary batteries
Group Total 3150 Manu.of electric lamps and lighting equipments
315 Manu.of electric lamps andlighting equipments
Group Total 3210 Manu.of electronic valves, tubes & other
321 Manu.of electronic valves, tubes &other
Group Total 3220 Manu.of TV & radio transmitters & apparatus for line telephone
322 Manu.of TV & Radio transmitters
Group Total 3230 Manu.of TV & radio receivers sound or video recording
323 Manu.of TV & Radio receivers,sound or vedio recording
Group Total 3320 Manu.of optical instruments and photographic equipments
332 Manu.of optical instruments andphotographic equipments
Group Total 3410 Manu.of motor vehicles
341 Manu.of motor vehicles
Group Total 3420 Manu.of bodies for Motor vehicles, Manu. of trailers & semi-trailers
342 Manu.of bodies for Motor vehicles,Manu. of trailers & semi-trailers
Group Total 3430 Manu.of spare parts and accessories for motor vehicles
343 Manu.of spare parts andaccessories for motor vehicles
Group Total 3511 Building and repairing of ships 3512 Building and repairing of pleasure & sporting boats
351 Building and repairing of shipsand boats
Group Total 3592 Manu.of bicycles & invalid carraiges
359 Manu.of transport equipment n.e.c.
Group Total 3610 Manu.of furniture
361 Manu.of furniture
Group Total 3691 Manu.of jewellery and related articles 3693 Manu.of sports goods 3694 Manu.of toys & games 3699 Other manufacturing not elsewhere classified
369 Manu.of other product notelsewhere classified
Group Total 3710 Reycycling of metal waste and scrap
371 Recycling of metal waste andscrap
Type of industry Skilled(No.)
Un skilled(No.)
Administrative(No.)
Technical(No.)
Clerical(No.)
Other(No.)
(cont.)

Table 17 : Categories of employees by nature of employment classified by industry - 2011(Establishments with 25 or more persons engaged)
121 11 9 4 7 3121 11 9 4 7 3
5,553 3,654 1,273 1,259 3,028 1,5975,553 3,654 1,273 1,259 3,028 1,5971,912 1,457 2,061 1,906 1,268 1,1351,912 1,457 2,061 1,906 1,268 1,135
328,699 129,530 26,486 40,978 34,400 36,833
Group Total 3720 Reycycling of non-metal waste and scrap
372 Recycling of non-metal waste andscrap
Group Total 4010 Production, collection & distribution of electricity
401 Production, collection &distribution of electricity
Group Total 4100 Collection, purification and distribution of water
410 Collection, purification anddistribution of water
Total
Type of industry Skilled(No.)
Un skilled(No.)
Administrative(No.)
Technical(No.)
Clerical(No.)
Other(No.)

Table 18 : Categories of employees by nature of employment classified by industry division - 2011(Establishments with less than 25 persons engaged)
9,294 3,519 506 140 341 10214,081 6,250 985 579 1,066 968
669 95 24 3 41 269,692 2,861 357 259 158 5565,662 1,619 206 93 341 701,326 324 33 46 57 204,247 3,682 425 88 301 256
559 129 26 17 48 202,094 719 179 62 247 76
3 1 1 1 0 01,785 807 204 145 209 1342,229 633 227 126 209 146
10,138 3,189 645 163 405 554704 92 26 29 54 29
2,642 810 149 105 202 24472 158 52 43 66 20259 89 18 24 47 13102 29 18 10 16 8
7 2 3 1 5 1230 70 28 9 53 10109 18 7 5 7 7
6,414 2,180 380 106 463 13339 6 2 4 5 1442 35 11 19 7 456 54 3 9 12 2
72,853 27,368 4,516 2,084 4,360 3,191
14 Other Mining and Quarrying 15 Manu.of food products and beverages 16 Manu.of tobacco products 17 Manu.of Textiles 18 Manu.of wearing Apparel, dressing & dyeing of fur 19 Tanning and dressing of leather; manu. of luggage, handbags & footwear 20 Manu.of wood & products of wood & cork except furniture 21 Manu.of paper and paper products 22 Publishing, printing and reproduction of recorded media 23 Manu.of coke refined petroleum products and nuclear fuel 24 Manu.of chemicals & chemical products 25 Manu.of rubber & plastic products 26 Manu. of other non metallic mineral products 27 Manu.of basic metals 28 Manu.of fabricated metal products except machinery equipments 29 Manu.of Machinery & equipments (n.e.c.) 31 Manu.of Electrical machinery and apparatus n.e.c. 32 Manu.of Radio, TV & communication equipment and apparatus 33 Manu.of medical, precision & optical instruments, watches & clocks 34 Manu.of motor vehicles, trailers and semi-trailers 35 Manu.of other transport equipment 36 Manu.of furniture, Manufacturing of n.e.c. 37 Recycling 40 Electricity, Gas, Steam and Hot water supply 41 Collection, purification and distribution of waterTotal
Industry divisionSkilled (No.) Un skilled (No.) Administrative (No.) Technical (No.) Clerical (No.) Other (No.)

Table 19 : Earning of employees by nature of employment classified by industry - 2011(Establishments with 25 or more persons engaged)
141,868,734 56,489,945 34,284,932 17,189,598 36,826,639 14,314,470102,339,780 46,157,789 29,526,272 12,208,059 30,230,736 12,849,996
38,508,954 8,412,156 4,596,660 4,981,539 6,511,903 1,464,4741,020,000 1,920,000 162,000 - 84,000 -
141,294,989 129,131,623 53,613,044 36,595,201 77,705,288 113,097,50333,453,064 67,820,379 9,704,489 8,492,680 14,165,579 38,48918,326,140 51,445,364 16,873,833 22,096,923 56,927,324 94,512,88918,161,560 9,865,880 1,954,840 - 186,000 398,000
71,354,225 - 25,079,882 6,005,598 6,426,385 18,148,125
901,751,804 208,732,876 432,805,390 159,120,891 165,129,967 94,424,712226,554,840 31,095,417 150,716,400 42,409,400 60,268,757 39,384,800
73,269,144 38,795,597 37,482,696 46,458,522 18,786,532 6,942,050177,593,155 50,318,419 87,605,744 31,803,496 35,739,808 12,169,821424,334,665 88,523,443 157,000,550 38,449,473 50,334,870 35,928,041512,773,067 190,083,630 264,141,953 183,076,862 120,218,527 68,097,837512,773,067 190,083,630 264,141,953 183,076,862 120,218,527 68,097,837323,361,441 141,795,191 174,869,823 101,149,030 118,272,576 152,076,380280,433,148 122,789,842 103,038,123 67,013,520 103,180,021 148,409,010
34,703,013 16,067,749 70,362,900 32,421,910 14,113,355 2,394,4108,225,280 2,937,600 1,468,800 1,713,600 979,200 1,272,960
4,524,155,238 2,721,808,540 1,750,928,445 1,695,289,854 1,435,283,736 1,471,501,053824,335,125 264,152,884 356,670,722 228,535,498 306,327,663 568,667,894
11,647,718 18,057,600 7,184,784 2,748,180 13,206,928 15,148,800123,413,986 108,760,136 25,648,169 30,190,546 16,395,545 9,779,455155,648,367 52,273,686 87,703,356 23,758,464 89,734,680 6,000,000
3,305,688,828 2,253,480,205 1,249,173,444 1,397,432,651 989,196,510 865,514,32073,787,715 12,704,180 20,699,470 11,130,514 17,309,160 3,790,584
2,937,000 1,428,000 1,968,000 1,134,000 - -26,696,500 10,951,850 1,880,500 360,000 3,113,250 2,600,000
357,916,460 248,201,712 526,268,690 158,502,620 233,912,454 106,062,673241,313,861 125,549,788 265,683,827 103,310,715 132,080,948 57,580,021
- 432,000 420,000 144,000 1,159,200 1,848,00062,244,000 11,832,000 82,080,000 32,676,000 9,120,000 -54,358,599 110,387,924 178,084,863 22,371,905 91,552,306 46,634,652
268,088,314 571,972,403 508,912,000 84,421,385 31,713,893 13,853,8008,996,200 319,038,000 31,320,000 41,749,230 1,957,000 1,117,000
254,682,114 2,949,135 460,888,000 764,000 22,546,000 648,0004,410,000 249,985,268 16,704,000 41,908,155 7,210,893 12,088,800
Group Total 1411 Quarrying of stone Clay and Sand 1412 Braking of Granite 1413 Quarrying of Sand & Gravel
141 Quarrying of stone Clay and Sand
Group Total 1421 Mining of chemical and Fertilizer minerals 1422 Extraction of salt 1423 Mining of precious and semi precious stones 1429 Other Mining & Quarrying N.e.c
142 Mining and Quarrying n.e.c
Group Total 1511 Processing and Preserving of Meat and Meat Products 1512 Processing and Preserving of fish and fish Products 1513 Processing & Preserving of fruits & Vegetables 1514 Manufacture of Vegetable oils animal oils & fats
151 Produ., proce. & preserving ofmeat, fish,fruit, vegetables, oils & fats
Group Total 1520 Manufacture of Dairy Products
152 Manufacture of Dairy Products
Group Total 1531 Manufacture of Grain Mill Products 1533 Preparation of Animal food from milling waist 1538 Packeting of Cereal, grains, yarm and their preparations
153 Manu.of grain mill products andprepared animal feeds
Group Total 1541 Manufacture of bakery products 1542 Manufacture of Cane sugar and molasses 1543 Manu.of cocoa, chocolate and sugar confectionary 1544 Manu.of macaroni, noodles couscous and similar farinaceous 1546 Manu.of tea and tea products 1547 Manu.of chilly-power, condiments powder, proce.of spices 1548 Manu.of viniger and similar products 1549 Manu.of other food products n.e.c
154 Manu.of other food products
Group Total 1551 Manufacture of beverages 1552 Manu.of wine, bottled toddy and similar products 1553 Manu.of all other beverages such as beer and stout 1554 Manu.of beverages such as soft drinks, soda etc
155 Manu.of beverags
Group Total 1601 Manu.of tabacco products 1602 Manu.of Cigarette, Cigar & Beedi 1609 Tobacco based products
160 Manu.of tobacco products
Type of industrySkilled Unskilled Administrative Technical Clerical Other
Salaries & Wages (Rs.)
(cont.)

Table 19 : Earning of employees by nature of employment classified by industry - 2011(Establishments with 25 or more persons engaged)
1,219,328,205 479,191,461 523,387,392 399,978,185 159,333,476 197,414,568615,622,415 199,973,401 235,011,261 156,808,332 76,458,711 153,811,301603,705,790 279,218,060 288,376,131 243,169,852 82,874,765 43,603,267577,971,344 159,398,414 144,256,555 165,034,100 69,763,950 6,316,046
68,652,947 30,804,133 10,367,160 8,443,604 6,413,029 2,014,43416,583,633 8,709,982 1,200,000 2,105,442 551,360 600,000
244,649,935 39,563,909 61,085,776 87,810,042 11,663,093 1,370,8122,340,000 - 120,000 60,000 240,000 180,000
134,182,029 41,806,235 24,064,679 48,407,386 19,793,465 1,377,000101,348,780 35,831,155 44,683,520 17,776,626 30,672,004 612,000
10,214,020 2,683,000 2,735,420 431,000 431,000 161,8001,705,954,702 381,209,165 996,002,938 634,524,530 208,556,682 49,410,058
933,383,493 133,588,320 655,892,916 147,681,233 44,007,701 16,560,000557,729,967 197,727,538 121,211,241 187,354,778 116,843,893 20,715,911
4,326,000 738,000 2,600,000 - 1,500,000 378,000210,515,242 49,155,307 216,298,781 299,488,519 46,205,088 11,756,147
23,090,306,537 6,486,679,938 3,771,455,733 4,598,754,769 1,363,919,459 1,596,356,48523,090,306,537 6,486,679,938 3,771,455,733 4,598,754,769 1,363,919,459 1,596,356,485
16,863,368 5,924,967 2,628,600 4,817,692 - -16,863,368 5,924,967 2,628,600 4,817,692 - -
142,965,108 61,781,012 21,163,254 26,784,299 21,917,529 8,042,2584,830,660 503,305 1,163,400 1,090,560 2,645,452 761,460
41,174,856 17,289,507 7,550,479 5,031,349 8,850,699 1,912,44096,959,592 43,988,200 12,449,375 20,662,390 10,421,378 5,368,358
524,257,050 218,692,630 124,605,220 85,448,518 49,661,999 23,602,183524,257,050 218,692,630 124,605,220 85,448,518 49,661,999 23,602,183
55,148,191 22,683,055 12,005,659 7,583,330 24,222,630 36,057,60055,148,191 22,683,055 12,005,659 7,583,330 24,222,630 36,057,600
157,500,834 45,876,085 61,174,330 37,256,356 15,541,332 8,010,97978,582,544 24,526,755 45,464,904 24,358,338 7,417,842 4,230,109
8,070,028 6,285,110 1,956,360 564,216 297,000 730,56016,312,359 3,828,000 4,912,683 3,898,155 3,015,884 1,258,31036,797,075 7,156,220 6,896,329 3,233,647 2,182,520 802,00014,978,000 4,080,000 1,764,000 5,202,000 2,340,000 990,000
2,760,828 - 180,054 - 288,086 -374,015,691 158,652,225 122,890,746 82,036,549 85,770,621 18,181,297108,184,694 16,196,948 46,740,930 31,070,290 36,214,747 7,537,251169,141,630 129,199,317 59,719,816 40,644,435 38,450,414 2,971,296
81,691,767 12,355,960 12,626,000 3,283,344 5,250,900 7,329,55014,997,600 900,000 3,804,000 7,038,480 5,854,560 343,200
Group Total 1711 Prepa. & spinning of Textiles fibres, weaving of textiles 1712 Finishing of Textiles
171 Spinning, weaving and finishing ofTextiles
Group Total 1721 Manu.of made-up textile article, except apparel 1722 Manu.of carpets and rugs 1723 Manu.of Cordage, Rope, twine & netting 1724 Manufacture of Sanitary Towels & Pampers 1726 Manu. of Laces and embroidered cloths 1727 Manu. of Labels, badges (cloth based) 1729 Cloth and coir based other products
172 Manu.of other Textiles
Group Total 1731 Manufacture of knitted Garments 1732 Manufacture of knitted socks, purses and Hand glouses 1733 Manufacture of Knitted Lace 1739 Elastomeric Yarn & other rubber thread based products
173 Manu.of knitted and crochetedfabrics and articles
Group Total 1810 Manufacture of weaving Apparel, except fur apparels
181 Manu.of weaving Apparel exceptfur apparels
Group Total 1820 Dressing and dyeing of fur, manu. articles of fur
182 Dressing and dyeing of fur,manufacture articles of fur
Group Total 1911 Tanning and dressing of leather 1912 Manu.of luggage, hand bags 1913 Manu. of Bags & rain coats, artificial leather products
191 Tanning & dressing of leather;manu. of luggage, Hand bags, saddlery& harness
Group Total 1920 Manufacturing of footwear
192 Manu.of footwear
Group Total 2010 Saw-milling and planning of wood
201 Saw-milling and planning of wood
Group Total 2021 Manu.of veneer sheets, plywood, lamin board, particle board 2022 Manufacture of builders carpentry and joinery 2023 Manufacture of wooden containers 2025 Manu.of Household utencils of other wooden article and ornaments 2026 Manu.of tools, coffins, other equipments used in funerals 2029 Manu.of all kinds of other wood products
202 Manu.of produ. of wood, cork,straw & plaiting material
Group Total 2101 Manufacture of pulp, paper and paperboards 2102 Manu.of corrugated paper & paperboard & containers of paper 2103 Manufacture of cards, files, books and pads 2109 Manu.of pulp paper and paper boards articles n.e.c
210 Manu.of paper and paper products
Type of industrySkilled Unskilled Administrative Technical Clerical Other
Salaries & Wages (Rs.)
(cont.)
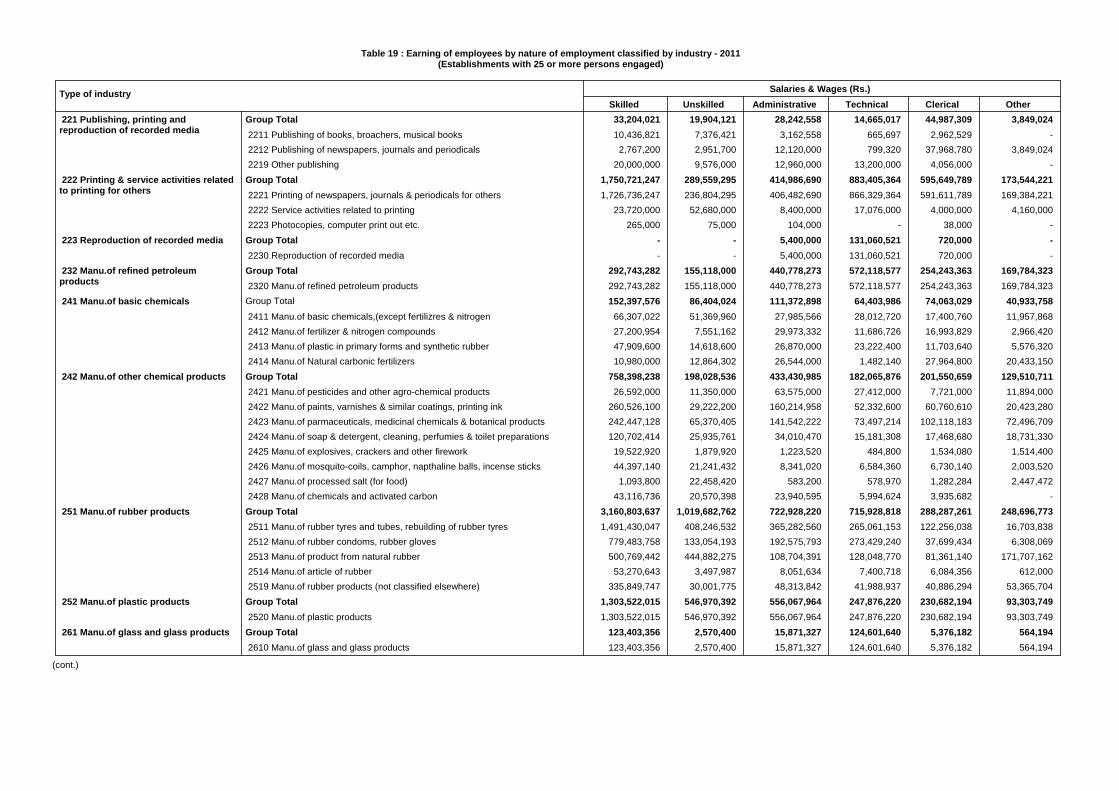
Table 19 : Earning of employees by nature of employment classified by industry - 2011(Establishments with 25 or more persons engaged)
33,204,021 19,904,121 28,242,558 14,665,017 44,987,309 3,849,02410,436,821 7,376,421 3,162,558 665,697 2,962,529 -
2,767,200 2,951,700 12,120,000 799,320 37,968,780 3,849,02420,000,000 9,576,000 12,960,000 13,200,000 4,056,000 -
1,750,721,247 289,559,295 414,986,690 883,405,364 595,649,789 173,544,2211,726,736,247 236,804,295 406,482,690 866,329,364 591,611,789 169,384,221
23,720,000 52,680,000 8,400,000 17,076,000 4,000,000 4,160,000265,000 75,000 104,000 - 38,000 -
- - 5,400,000 131,060,521 720,000 -- - 5,400,000 131,060,521 720,000 -
292,743,282 155,118,000 440,778,273 572,118,577 254,243,363 169,784,323292,743,282 155,118,000 440,778,273 572,118,577 254,243,363 169,784,323152,397,576 86,404,024 111,372,898 64,403,986 74,063,029 40,933,758
66,307,022 51,369,960 27,985,566 28,012,720 17,400,760 11,957,86827,200,954 7,551,162 29,973,332 11,686,726 16,993,829 2,966,42047,909,600 14,618,600 26,870,000 23,222,400 11,703,640 5,576,32010,980,000 12,864,302 26,544,000 1,482,140 27,964,800 20,433,150
758,398,238 198,028,536 433,430,985 182,065,876 201,550,659 129,510,71126,592,000 11,350,000 63,575,000 27,412,000 7,721,000 11,894,000
260,526,100 29,222,200 160,214,958 52,332,600 60,760,610 20,423,280242,447,128 65,370,405 141,542,222 73,497,214 102,118,183 72,496,709120,702,414 25,935,761 34,010,470 15,181,308 17,468,680 18,731,330
19,522,920 1,879,920 1,223,520 484,800 1,534,080 1,514,40044,397,140 21,241,432 8,341,020 6,584,360 6,730,140 2,003,520
1,093,800 22,458,420 583,200 578,970 1,282,284 2,447,47243,116,736 20,570,398 23,940,595 5,994,624 3,935,682 -
3,160,803,637 1,019,682,762 722,928,220 715,928,818 288,287,261 248,696,7731,491,430,047 408,246,532 365,282,560 265,061,153 122,256,038 16,703,838
779,483,758 133,054,193 192,575,793 273,429,240 37,699,434 6,308,069500,769,442 444,882,275 108,704,391 128,048,770 81,361,140 171,707,162
53,270,643 3,497,987 8,051,634 7,400,718 6,084,356 612,000335,849,747 30,001,775 48,313,842 41,988,937 40,886,294 53,365,704
1,303,522,015 546,970,392 556,067,964 247,876,220 230,682,194 93,303,7491,303,522,015 546,970,392 556,067,964 247,876,220 230,682,194 93,303,749
123,403,356 2,570,400 15,871,327 124,601,640 5,376,182 564,194123,403,356 2,570,400 15,871,327 124,601,640 5,376,182 564,194
Group Total 2211 Publishing of books, broachers, musical books 2212 Publishing of newspapers, journals and periodicals 2219 Other publishing
221 Publishing, printing andreproduction of recorded media
Group Total 2221 Printing of newspapers, journals & periodicals for others 2222 Service activities related to printing 2223 Photocopies, computer print out etc.
222 Printing & service activities relatedto printing for others
Group Total 2230 Reproduction of recorded media
223 Reproduction of recorded media
Group Total 2320 Manu.of refined petroleum products
232 Manu.of refined petroleumproducts
Group Total
2411 Manu.of basic chemicals,(except fertilizres & nitrogen 2412 Manu.of fertilizer & nitrogen compounds 2413 Manu.of plastic in primary forms and synthetic rubber 2414 Manu.of Natural carbonic fertilizers
241 Manu.of basic chemicals
Group Total 2421 Manu.of pesticides and other agro-chemical products 2422 Manu.of paints, varnishes & similar coatings, printing ink 2423 Manu.of parmaceuticals, medicinal chemicals & botanical products 2424 Manu.of soap & detergent, cleaning, perfumies & toilet preparations 2425 Manu.of explosives, crackers and other firework 2426 Manu.of mosquito-coils, camphor, napthaline balls, incense sticks 2427 Manu.of processed salt (for food) 2428 Manu.of chemicals and activated carbon
242 Manu.of other chemical products
Group Total 2511 Manu.of rubber tyres and tubes, rebuilding of rubber tyres 2512 Manu.of rubber condoms, rubber gloves 2513 Manu.of product from natural rubber 2514 Manu.of article of rubber 2519 Manu.of rubber products (not classified elsewhere)
251 Manu.of rubber products
Group Total 2520 Manu.of plastic products
252 Manu.of plastic products
Group Total 2610 Manu.of glass and glass products
261 Manu.of glass and glass products
Type of industrySkilled Unskilled Administrative Technical Clerical Other
Salaries & Wages (Rs.)
(cont.)

Table 19 : Earning of employees by nature of employment classified by industry - 2011(Establishments with 25 or more persons engaged)
1,602,514,387 551,215,015 621,053,823 510,189,619 224,055,106 63,666,121648,774,388 88,200,167 147,997,371 63,329,571 42,877,475 14,641,680386,934,016 100,421,397 107,707,806 47,629,861 54,895,458 14,128,701216,907,431 28,300,328 284,983,920 177,055,913 69,431,743 24,046,800295,845,810 321,389,332 70,825,251 211,786,274 50,851,853 10,848,940
21,422,792 5,537,400 5,120,000 7,868,000 2,448,000 -25,859,950 1,366,391 4,419,475 2,520,000 3,153,677 -
6,770,000 6,000,000 - - 396,900 -121,351,676 23,206,880 115,202,126 53,968,396 28,798,739 96,817,000121,351,676 23,206,880 115,202,126 53,968,396 28,798,739 96,817,000
864,000 3,072,000 792,000 960,000 576,000 -864,000 3,072,000 792,000 960,000 576,000 -
249,212,714 86,999,990 173,784,484 67,316,344 92,565,399 38,968,63164,850,496 38,902,967 38,409,949 25,451,846 16,806,825 5,141,468
184,362,218 48,097,023 135,374,535 41,864,498 75,758,574 33,827,163200,811,977 84,018,509 71,467,015 28,461,657 44,693,282 8,036,913147,881,084 53,985,612 51,559,277 21,725,516 27,657,932 8,036,913
52,930,893 30,032,897 19,907,738 6,736,141 17,035,350 -290,106,423 43,536,685 57,559,630 36,942,383 41,157,925 11,342,729
94,307,263 6,622,140 15,880,324 12,050,865 10,639,860 2,355,06028,618,134 9,267,518 6,167,090 2,438,756 2,447,572 240,000
6,048,186 260,879 606,000 - 4,410,181 -23,774,841 7,074,000 11,426,754 4,194,000 4,228,800 2,406,000
8,126,793 2,012,476 412,080 1,880,545 1,648,876 2,062,6243,987,671 1,782,633 2,008,194 605,867 2,811,638 382,301
26,381,825 2,100,500 3,673,948 7,239,250 1,729,000 2,293,20098,861,710 14,416,539 17,385,240 8,533,100 13,241,998 1,603,54463,358,721 7,638,932 19,782,744 7,644,156 8,639,925 940,820
2,304,000 - 384,000 192,000 - -57,954,881 6,895,172 12,923,544 6,912,156 8,423,925 600,500
3,099,840 743,760 6,475,200 540,000 216,000 340,320127,615,067 25,233,530 19,118,718 29,899,500 27,370,730 3,523,286
31,132,320 13,957,680 7,932,480 6,027,840 2,339,280 1,958,4004,896,000 624,000 1,224,000 2,388,000 1,398,000 306,000
757,200 - 1,272,600 1,212,000 545,400 -13,104,000 7,394,400 1,980,000 2,340,000 1,200,000 -17,619,316 2,040,000 5,306,823 1,763,580 2,675,381 597,93254,721,800 - - 15,756,000 17,937,000 -
5,384,431 1,217,450 1,402,815 412,080 1,275,669 660,95481,065,643 20,731,600 24,342,102 49,625,200 9,090,920 714,00081,065,643 20,731,600 24,342,102 49,625,200 9,090,920 714,000
Group Total 2691 Manu.of non-structural non-refractory ceramic ware 2693 Manu.of structural non refractory clay & ceramic products 2694 Manu.of cement lime, and plaster 2695 Manu.of articles of concrete, cement & plaster 2696 Cutting, shaping & finishing of rough stones 2697 Refining of Ilmanite, surcon & refinding of plumbago 2699 Manu.of other non-metalic mineral products n.e.c
269 Manu.of Non metallic mineralproducts(n.e.c.)
Group Total 2710 Manu.of basic iron & steel
271 Manu.of basic iron & steel
Group Total 2720 Manu.of basic precious & non-ferrous metal
272 Manu.of basic precious &non-ferrous metal
Group Total 2731 Casting of iron & steel 2732 Casting of Non ferrous metals
273 Casting of metals
Group Total 2811 Manu.of structural metal products 2812 Manu.of tanks, resorvoirs & containers of metal except packing containers
281 Manu.of structural metal products,tanks, reservoirs & steam generators
Group Total 2892 Treatment & coating of metal general mechanical engine 2893 Manu.of cutlery, hand tools & general hardware 2894 Manu.of other brass articles 2895 Manu.of non threaded metal products 2896 Manu.of Metal cooking utensils, household appliances & sanitary articals 2897 Manu.of Metal cables and similar articles 2898 Manu.of Containers used for the packing or conveyance 2899 Manu.of other fabricated metal products
289 Manu.of other fabricated metalproducts
Group Total 2911 Manu.of engine and turbines, except aircraft, vehicle 2912 Manu.of pumps, compressors, taps and valves 2919 Manu.of other general purpose machinery
291 Manu.of general purposemachinery
Group Total 2921 Manu.of agricultural & forestry machinery 2922 Manu.of machine tools 2923 Manu.of machinery for metallurgy 2924 Manu.of machinery for mining, quarrying & construction 2925 Manu.of machinery for Food, beverage & tobacco proce. 2926 Manu.of machinery for textile, apparel & leather products 2929 Manu.of other special purpose machinery (n.e.c.)
292 Manu.of special purposemachinery
Group Total 2930 Manu.of domestic appliance n.e.c.
293 Manu.of domestic appliance n.e.c.
Type of industrySkilled Unskilled Administrative Technical Clerical Other
Salaries & Wages (Rs.)
(cont.)
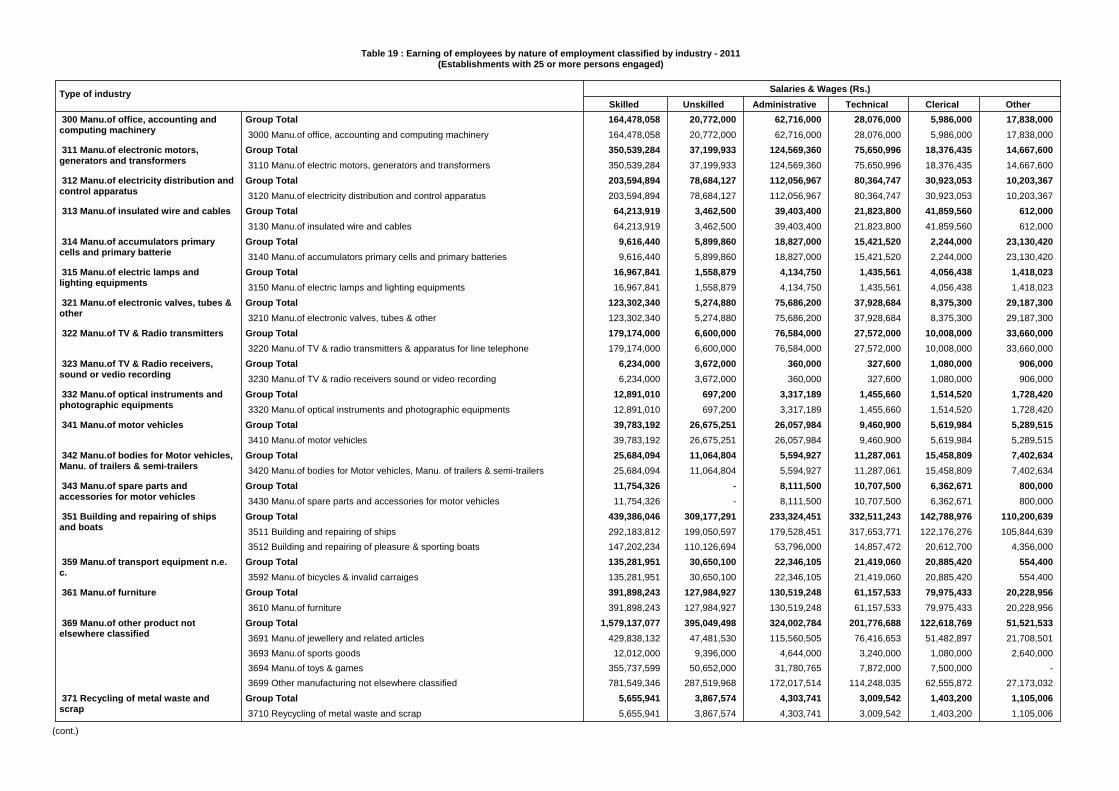
Table 19 : Earning of employees by nature of employment classified by industry - 2011(Establishments with 25 or more persons engaged)
164,478,058 20,772,000 62,716,000 28,076,000 5,986,000 17,838,000164,478,058 20,772,000 62,716,000 28,076,000 5,986,000 17,838,000350,539,284 37,199,933 124,569,360 75,650,996 18,376,435 14,667,600350,539,284 37,199,933 124,569,360 75,650,996 18,376,435 14,667,600203,594,894 78,684,127 112,056,967 80,364,747 30,923,053 10,203,367203,594,894 78,684,127 112,056,967 80,364,747 30,923,053 10,203,367
64,213,919 3,462,500 39,403,400 21,823,800 41,859,560 612,00064,213,919 3,462,500 39,403,400 21,823,800 41,859,560 612,000
9,616,440 5,899,860 18,827,000 15,421,520 2,244,000 23,130,4209,616,440 5,899,860 18,827,000 15,421,520 2,244,000 23,130,420
16,967,841 1,558,879 4,134,750 1,435,561 4,056,438 1,418,02316,967,841 1,558,879 4,134,750 1,435,561 4,056,438 1,418,023
123,302,340 5,274,880 75,686,200 37,928,684 8,375,300 29,187,300123,302,340 5,274,880 75,686,200 37,928,684 8,375,300 29,187,300179,174,000 6,600,000 76,584,000 27,572,000 10,008,000 33,660,000179,174,000 6,600,000 76,584,000 27,572,000 10,008,000 33,660,000
6,234,000 3,672,000 360,000 327,600 1,080,000 906,0006,234,000 3,672,000 360,000 327,600 1,080,000 906,000
12,891,010 697,200 3,317,189 1,455,660 1,514,520 1,728,42012,891,010 697,200 3,317,189 1,455,660 1,514,520 1,728,42039,783,192 26,675,251 26,057,984 9,460,900 5,619,984 5,289,51539,783,192 26,675,251 26,057,984 9,460,900 5,619,984 5,289,51525,684,094 11,064,804 5,594,927 11,287,061 15,458,809 7,402,63425,684,094 11,064,804 5,594,927 11,287,061 15,458,809 7,402,63411,754,326 - 8,111,500 10,707,500 6,362,671 800,00011,754,326 - 8,111,500 10,707,500 6,362,671 800,000
439,386,046 309,177,291 233,324,451 332,511,243 142,788,976 110,200,639292,183,812 199,050,597 179,528,451 317,653,771 122,176,276 105,844,639147,202,234 110,126,694 53,796,000 14,857,472 20,612,700 4,356,000135,281,951 30,650,100 22,346,105 21,419,060 20,885,420 554,400135,281,951 30,650,100 22,346,105 21,419,060 20,885,420 554,400391,898,243 127,984,927 130,519,248 61,157,533 79,975,433 20,228,956391,898,243 127,984,927 130,519,248 61,157,533 79,975,433 20,228,956
1,579,137,077 395,049,498 324,002,784 201,776,688 122,618,769 51,521,533429,838,132 47,481,530 115,560,505 76,416,653 51,482,897 21,708,501
12,012,000 9,396,000 4,644,000 3,240,000 1,080,000 2,640,000355,737,599 50,652,000 31,780,765 7,872,000 7,500,000 -781,549,346 287,519,968 172,017,514 114,248,035 62,555,872 27,173,032
5,655,941 3,867,574 4,303,741 3,009,542 1,403,200 1,105,0065,655,941 3,867,574 4,303,741 3,009,542 1,403,200 1,105,006
Group Total 3000 Manu.of office, accounting and computing machinery
300 Manu.of office, accounting andcomputing machinery
Group Total 3110 Manu.of electric motors, generators and transformers
311 Manu.of electronic motors,generators and transformers
Group Total 3120 Manu.of electricity distribution and control apparatus
312 Manu.of electricity distribution andcontrol apparatus
Group Total 3130 Manu.of insulated wire and cables
313 Manu.of insulated wire and cables
Group Total 3140 Manu.of accumulators primary cells and primary batteries
314 Manu.of accumulators primarycells and primary batterie
Group Total 3150 Manu.of electric lamps and lighting equipments
315 Manu.of electric lamps andlighting equipments
Group Total 3210 Manu.of electronic valves, tubes & other
321 Manu.of electronic valves, tubes &other
Group Total 3220 Manu.of TV & radio transmitters & apparatus for line telephone
322 Manu.of TV & Radio transmitters
Group Total 3230 Manu.of TV & radio receivers sound or video recording
323 Manu.of TV & Radio receivers,sound or vedio recording
Group Total 3320 Manu.of optical instruments and photographic equipments
332 Manu.of optical instruments andphotographic equipments
Group Total 3410 Manu.of motor vehicles
341 Manu.of motor vehicles
Group Total 3420 Manu.of bodies for Motor vehicles, Manu. of trailers & semi-trailers
342 Manu.of bodies for Motor vehicles,Manu. of trailers & semi-trailers
Group Total 3430 Manu.of spare parts and accessories for motor vehicles
343 Manu.of spare parts andaccessories for motor vehicles
Group Total 3511 Building and repairing of ships 3512 Building and repairing of pleasure & sporting boats
351 Building and repairing of shipsand boats
Group Total 3592 Manu.of bicycles & invalid carraiges
359 Manu.of transport equipment n.e.c.
Group Total 3610 Manu.of furniture
361 Manu.of furniture
Group Total 3691 Manu.of jewellery and related articles 3693 Manu.of sports goods 3694 Manu.of toys & games 3699 Other manufacturing not elsewhere classified
369 Manu.of other product notelsewhere classified
Group Total 3710 Reycycling of metal waste and scrap
371 Recycling of metal waste andscrap
Type of industrySkilled Unskilled Administrative Technical Clerical Other
Salaries & Wages (Rs.)
(cont.)

Table 19 : Earning of employees by nature of employment classified by industry - 2011(Establishments with 25 or more persons engaged)
9,300,500 975,500 2,750,500 940,500 1,070,500 210,0009,300,500 975,500 2,750,500 940,500 1,070,500 210,000
3,366,600,000 1,652,724,000 4,105,946,000 1,478,171,216 2,175,717,216 957,642,0003,366,600,000 1,652,724,000 4,105,946,000 1,478,171,216 2,175,717,216 957,642,0001,039,752,566 58,597,958 1,739,683,937 1,256,514,360 683,554,874 431,978,9261,039,752,566 58,597,958 1,739,683,937 1,256,514,360 683,554,874 431,978,926
53,522,860,776 18,232,783,824 20,477,872,304 15,875,709,211 9,770,137,727 6,781,300,893
Group Total 3720 Reycycling of non-metal waste and scrap
372 Recycling of non-metal waste andscrap
Group Total 4010 Production, collection & distribution of electricity
401 Production, collection &distribution of electricity
Group Total 4100 Collection, purification and distribution of water
410 Collection, purification anddistribution of water
Total
Type of industrySkilled Unskilled Administrative Technical Clerical Other
Salaries & Wages (Rs.)
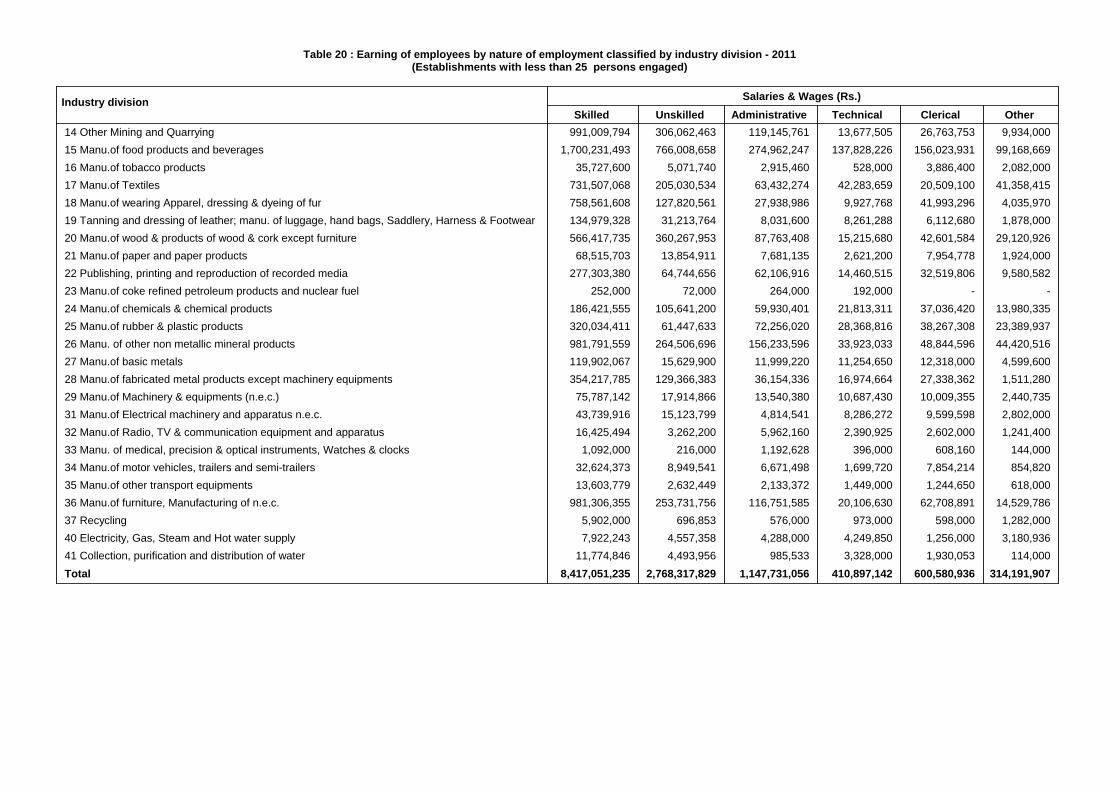
Table 20 : Earning of employees by nature of employment classified by industry division - 2011(Establishments with less than 25 persons engaged)
991,009,794 306,062,463 119,145,761 13,677,505 26,763,753 9,934,0001,700,231,493 766,008,658 274,962,247 137,828,226 156,023,931 99,168,669
35,727,600 5,071,740 2,915,460 528,000 3,886,400 2,082,000731,507,068 205,030,534 63,432,274 42,283,659 20,509,100 41,358,415758,561,608 127,820,561 27,938,986 9,927,768 41,993,296 4,035,970134,979,328 31,213,764 8,031,600 8,261,288 6,112,680 1,878,000566,417,735 360,267,953 87,763,408 15,215,680 42,601,584 29,120,92668,515,703 13,854,911 7,681,135 2,621,200 7,954,778 1,924,000
277,303,380 64,744,656 62,106,916 14,460,515 32,519,806 9,580,582252,000 72,000 264,000 192,000 - -
186,421,555 105,641,200 59,930,401 21,813,311 37,036,420 13,980,335320,034,411 61,447,633 72,256,020 28,368,816 38,267,308 23,389,937981,791,559 264,506,696 156,233,596 33,923,033 48,844,596 44,420,516119,902,067 15,629,900 11,999,220 11,254,650 12,318,000 4,599,600354,217,785 129,366,383 36,154,336 16,974,664 27,338,362 1,511,28075,787,142 17,914,866 13,540,380 10,687,430 10,009,355 2,440,73543,739,916 15,123,799 4,814,541 8,286,272 9,599,598 2,802,00016,425,494 3,262,200 5,962,160 2,390,925 2,602,000 1,241,4001,092,000 216,000 1,192,628 396,000 608,160 144,000
32,624,373 8,949,541 6,671,498 1,699,720 7,854,214 854,82013,603,779 2,632,449 2,133,372 1,449,000 1,244,650 618,000
981,306,355 253,731,756 116,751,585 20,106,630 62,708,891 14,529,7865,902,000 696,853 576,000 973,000 598,000 1,282,0007,922,243 4,557,358 4,288,000 4,249,850 1,256,000 3,180,936
11,774,846 4,493,956 985,533 3,328,000 1,930,053 114,0008,417,051,235 2,768,317,829 1,147,731,056 410,897,142 600,580,936 314,191,907
14 Other Mining and Quarrying 15 Manu.of food products and beverages 16 Manu.of tobacco products 17 Manu.of Textiles 18 Manu.of wearing Apparel, dressing & dyeing of fur 19 Tanning and dressing of leather; manu. of luggage, hand bags, Saddlery, Harness & Footwear 20 Manu.of wood & products of wood & cork except furniture 21 Manu.of paper and paper products 22 Publishing, printing and reproduction of recorded media 23 Manu.of coke refined petroleum products and nuclear fuel 24 Manu.of chemicals & chemical products 25 Manu.of rubber & plastic products 26 Manu. of other non metallic mineral products 27 Manu.of basic metals 28 Manu.of fabricated metal products except machinery equipments 29 Manu.of Machinery & equipments (n.e.c.) 31 Manu.of Electrical machinery and apparatus n.e.c. 32 Manu.of Radio, TV & communication equipment and apparatus 33 Manu. of medical, precision & optical instruments, Watches & clocks 34 Manu.of motor vehicles, trailers and semi-trailers 35 Manu.of other transport equipments 36 Manu.of furniture, Manufacturing of n.e.c. 37 Recycling 40 Electricity, Gas, Steam and Hot water supply 41 Collection, purification and distribution of water Total
Industry divisionSkilled Unskilled Administrative Technical Clerical Other
Salaries & Wages (Rs.)

Table 21: Salaries per employee by nature of employment & industry - 2011(Establishments with 25 or more persons engaged)
189,518 121,788 447,368 164,974 171,766 123,558208,157 142,579 353,589 226,434 191,527 122,040
60,000 48,000 54,000 . 42,000 .491,957 413,539 693,178 566,179 442,674 38,489177,924 185,055 432,662 230,176 230,475 87,350
96,093 53,912 217,204 . 93,000 49,750322,870 . 809,028 400,373 238,014 307,595145,134 143,297 1,011,519 302,924 155,332 206,203153,283 109,903 468,534 255,267 202,006 165,287177,949 99,247 431,555 441,715 127,188 128,103136,398 88,879 713,639 189,406 192,118 161,838294,867 197,798 781,485 535,312 227,687 170,671176,041 160,720 510,090 376,480 232,387 276,882189,634 176,569 963,875 456,647 266,290 114,020228,480 146,880 489,600 428,400 244,800 159,120193,824 174,128 527,619 363,331 267,535 239,238137,032 200,640 326,581 249,835 213,015 226,101154,075 139,795 382,808 269,558 184,220 128,677194,804 142,824 378,032 247,484 227,753 200,000133,806 125,900 634,743 309,303 274,244 155,584
92,119 65,150 405,872 337,288 132,131 135,378133,500 102,000 393,600 162,000 . .127,734 116,509 268,643 360,000 194,578 371,429251,107 223,796 1,335,095 653,865 364,864 262,922
. 144,000 210,000 144,000 165,600 132,000374,964 204,000 1,368,000 796,976 414,545 .173,670 155,039 742,020 260,138 290,642 215,901107,098 287,681 949,091 359,907 177,909 79,786350,319 9,074 2,532,352 254,667 835,037 72,000
1411 Quarrying of stone Clay and Sand 1412 Braking of Granite 1413 Quarrying of Sand & Gravel 1421 Mining of chemical and Fertilizer minerals 1422 Extraction of salt 1423 Mining of precious and semi precious stones 1429 Other Mining & Quarrying N.e.c 1511 Processing and Preserving of Meat and Meat Products 1512 Processing and Preserving of fish and fish Products 1513 Processing & Preserving of fruits & Vegetables 1514 Manufacture of Vegetable oils animal oils & fats 1520 Manufacture of Dairy Products 1531 Manufacture of Grain Mill Products 1533 Preparation of Animal food from milling waist 1538 Packeting of Cereal, grains, yarm and their preparations 1541 Manufacture of bakery products 1542 Manufacture of Cane sugar and molasses 1543 Manu.of cocoa, chocolate and sugar confectionary 1544 Manu.of macaroni, noodles couscous and similar farinaceous 1546 Manu.of tea and tea products 1547 Manu.of chilly-power, condiments powder, proce.of spices 1548 Manu.of viniger and similar products 1549 Manu.of other food products n.e.c 1551 Manufacture of beverages 1552 Manu.of wine, bottled toddy and similar products 1553 Manu.of all other beverages such as beer and stout 1554 Manu.of beverages such as soft drinks, soda etc 1601 Manu.of tabacco products 1602 Manu.of Cigarette, Cigar & Beedi
Industry classSalaries per
skilledoperatives
Salaries perunskilled
operatives
Salaries peradministrative
employee
Salaries pertechnicalemployee
Salaries perclerical
employee
Salariesper otheremployee
(cont.)
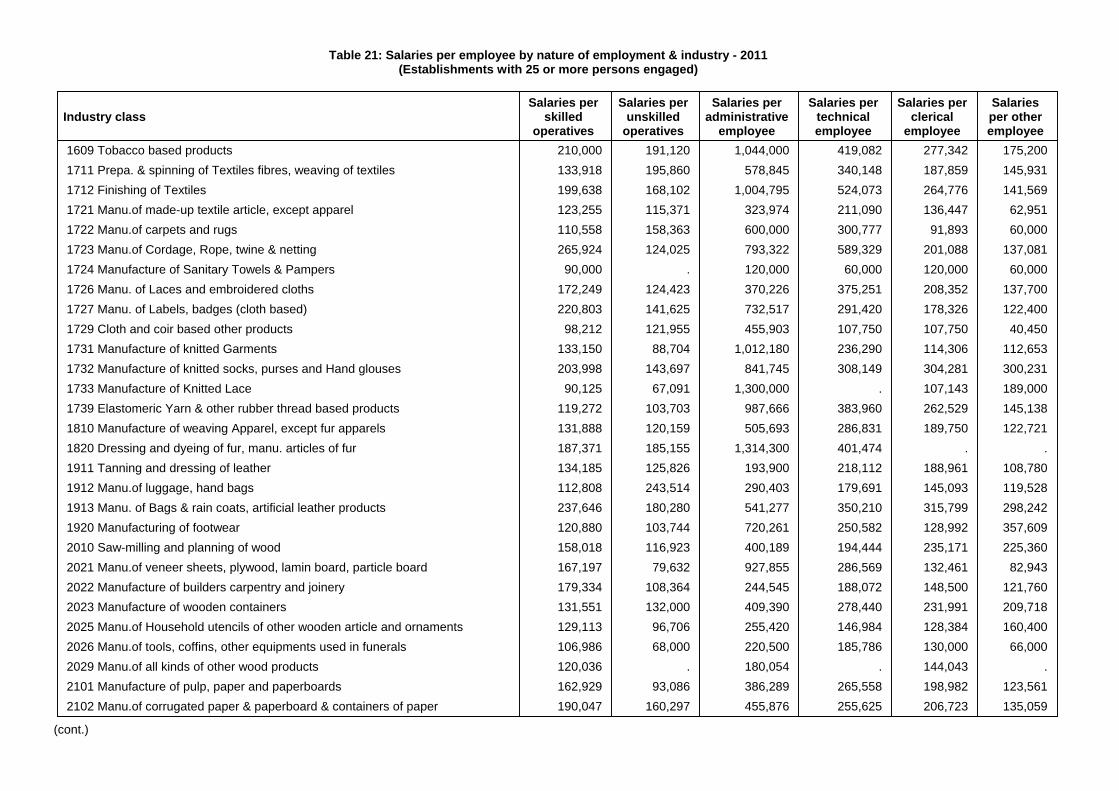
Table 21: Salaries per employee by nature of employment & industry - 2011(Establishments with 25 or more persons engaged)
210,000 191,120 1,044,000 419,082 277,342 175,200133,918 195,860 578,845 340,148 187,859 145,931199,638 168,102 1,004,795 524,073 264,776 141,569123,255 115,371 323,974 211,090 136,447 62,951110,558 158,363 600,000 300,777 91,893 60,000265,924 124,025 793,322 589,329 201,088 137,081
90,000 . 120,000 60,000 120,000 60,000172,249 124,423 370,226 375,251 208,352 137,700220,803 141,625 732,517 291,420 178,326 122,400
98,212 121,955 455,903 107,750 107,750 40,450133,150 88,704 1,012,180 236,290 114,306 112,653203,998 143,697 841,745 308,149 304,281 300,231
90,125 67,091 1,300,000 . 107,143 189,000119,272 103,703 987,666 383,960 262,529 145,138131,888 120,159 505,693 286,831 189,750 122,721187,371 185,155 1,314,300 401,474 . .134,185 125,826 193,900 218,112 188,961 108,780112,808 243,514 290,403 179,691 145,093 119,528237,646 180,280 541,277 350,210 315,799 298,242120,880 103,744 720,261 250,582 128,992 357,609158,018 116,923 400,189 194,444 235,171 225,360167,197 79,632 927,855 286,569 132,461 82,943179,334 108,364 244,545 188,072 148,500 121,760131,551 132,000 409,390 278,440 231,991 209,718129,113 96,706 255,420 146,984 128,384 160,400106,986 68,000 220,500 185,786 130,000 66,000120,036 . 180,054 . 144,043 .162,929 93,086 386,289 265,558 198,982 123,561190,047 160,297 455,876 255,625 206,723 135,059
1609 Tobacco based products 1711 Prepa. & spinning of Textiles fibres, weaving of textiles 1712 Finishing of Textiles 1721 Manu.of made-up textile article, except apparel 1722 Manu.of carpets and rugs 1723 Manu.of Cordage, Rope, twine & netting 1724 Manufacture of Sanitary Towels & Pampers 1726 Manu. of Laces and embroidered cloths 1727 Manu. of Labels, badges (cloth based) 1729 Cloth and coir based other products 1731 Manufacture of knitted Garments 1732 Manufacture of knitted socks, purses and Hand glouses 1733 Manufacture of Knitted Lace 1739 Elastomeric Yarn & other rubber thread based products 1810 Manufacture of weaving Apparel, except fur apparels 1820 Dressing and dyeing of fur, manu. articles of fur 1911 Tanning and dressing of leather 1912 Manu.of luggage, hand bags 1913 Manu. of Bags & rain coats, artificial leather products 1920 Manufacturing of footwear 2010 Saw-milling and planning of wood 2021 Manu.of veneer sheets, plywood, lamin board, particle board 2022 Manufacture of builders carpentry and joinery 2023 Manufacture of wooden containers 2025 Manu.of Household utencils of other wooden article and ornaments 2026 Manu.of tools, coffins, other equipments used in funerals 2029 Manu.of all kinds of other wood products 2101 Manufacture of pulp, paper and paperboards 2102 Manu.of corrugated paper & paperboard & containers of paper
Industry classSalaries per
skilledoperatives
Salaries perunskilled
operatives
Salaries peradministrative
employee
Salaries pertechnicalemployee
Salaries perclerical
employee
Salariesper otheremployee
(cont.)

Table 21: Salaries per employee by nature of employment & industry - 2011(Establishments with 25 or more persons engaged)
115,547 74,433 242,808 218,890 105,018 74,036151,491 60,000 345,818 281,539 234,182 49,029151,258 136,600 451,794 332,849 134,660 .184,480 184,481 404,000 266,440 168,003 160,376303,030 228,000 2,160,000 660,000 312,000 .286,643 157,136 579,861 398,496 314,186 202,855202,735 278,730 400,000 406,571 235,294 231,111
17,667 9,375 26,000 . 12,667 .. . 1,800,000 1,424,571 180,000 .
413,479 347,020 1,469,261 1,040,216 478,801 679,137191,087 108,605 474,332 383,736 220,263 206,170161,910 179,790 475,767 278,255 169,938 141,258162,958 126,022 455,424 297,723 243,826 154,898174,286 167,069 390,353 164,682 166,457 163,465501,736 227,000 1,297,449 856,625 350,955 113,276192,697 114,597 748,668 415,338 180,835 176,063178,401 129,961 557,253 334,078 203,018 159,684128,407 123,504 459,601 266,339 213,033 128,297174,312 104,440 305,880 121,200 191,760 151,440
89,873 91,558 287,621 168,830 156,515 64,630109,380 195,291 194,400 192,990 213,714 244,747177,435 172,860 532,013 374,664 145,766 .189,124 188,479 622,287 383,036 311,878 122,822201,365 100,494 752,249 584,251 231,285 123,688139,025 130,809 510,349 264,018 182,424 122,999144,757 109,312 365,983 296,029 196,270 61,200205,287 129,878 519,504 297,794 208,604 170,497173,989 122,201 589,680 326,583 198,864 157,342379,703 91,800 755,777 1,004,852 244,372 141,049
2103 Manufacture of cards, files, books and pads 2109 Manu.of pulp paper and paper boards articles n.e.c 2211 Publishing of books, broachers, musical books 2212 Publishing of newspapers, journals and periodicals 2219 Other publishing 2221 Printing of newspapers, journals & periodicals for others 2222 Service activities related to printing 2223 Photocopies, computer print out etc. 2230 Reproduction of recorded media 2320 Manu.of refined petroleum products 2411 Manu.of basic chemicals,(except fertilizres & nitrogen 2412 Manu.of fertilizer & nitrogen compounds 2413 Manu.of plastic in primary forms and synthetic rubber 2414 Manu.of Natural carbonic fertilizers 2421 Manu.of pesticides and other agro-chemical products 2422 Manu.of paints, varnishes & similar coatings, printing ink 2423 Manu.of parmaceuticals, medicinal chemicals & botanical products 2424 Manu.of soap & detergent, cleaning, perfumies & toilet preparations 2425 Manu.of explosives, crackers and other firework 2426 Manu.of mosquito-coils, camphor, napthaline balls, incense sticks 2427 Manu.of processed salt (for food) 2428 Manu.of chemicals and activated carbon 2511 Manu.of rubber tyres and tubes, rebuilding of rubber tyres 2512 Manu.of rubber condoms, rubber gloves 2513 Manu.of product from natural rubber 2514 Manu.of article of rubber 2519 Manu.of rubber products (not classified elsewhere) 2520 Manu.of plastic products 2610 Manu.of glass and glass products
Industry classSalaries per
skilledoperatives
Salaries perunskilled
operatives
Salaries peradministrative
employee
Salaries pertechnicalemployee
Salaries perclerical
employee
Salariesper otheremployee
(cont.)
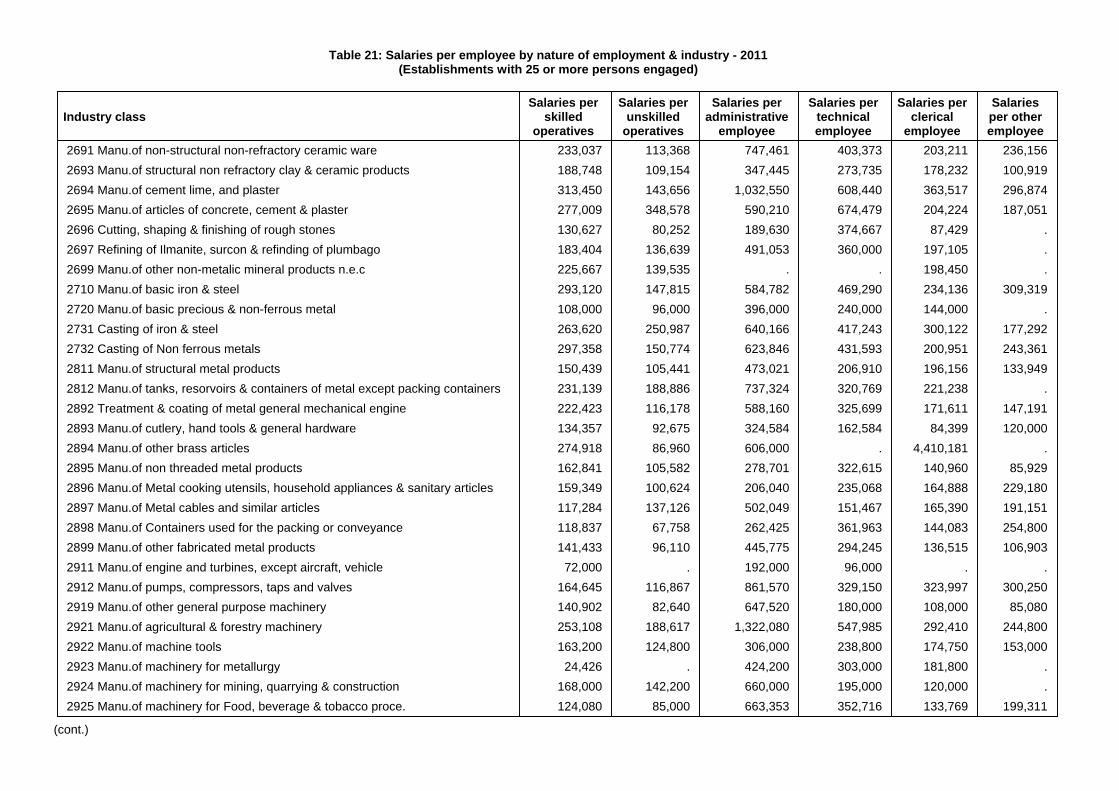
Table 21: Salaries per employee by nature of employment & industry - 2011(Establishments with 25 or more persons engaged)
233,037 113,368 747,461 403,373 203,211 236,156188,748 109,154 347,445 273,735 178,232 100,919313,450 143,656 1,032,550 608,440 363,517 296,874277,009 348,578 590,210 674,479 204,224 187,051130,627 80,252 189,630 374,667 87,429 .183,404 136,639 491,053 360,000 197,105 .225,667 139,535 . . 198,450 .293,120 147,815 584,782 469,290 234,136 309,319108,000 96,000 396,000 240,000 144,000 .263,620 250,987 640,166 417,243 300,122 177,292297,358 150,774 623,846 431,593 200,951 243,361150,439 105,441 473,021 206,910 196,156 133,949231,139 188,886 737,324 320,769 221,238 .222,423 116,178 588,160 325,699 171,611 147,191134,357 92,675 324,584 162,584 84,399 120,000274,918 86,960 606,000 . 4,410,181 .162,841 105,582 278,701 322,615 140,960 85,929159,349 100,624 206,040 235,068 164,888 229,180117,284 137,126 502,049 151,467 165,390 191,151118,837 67,758 262,425 361,963 144,083 254,800141,433 96,110 445,775 294,245 136,515 106,903
72,000 . 192,000 96,000 . .164,645 116,867 861,570 329,150 323,997 300,250140,902 82,640 647,520 180,000 108,000 85,080253,108 188,617 1,322,080 547,985 292,410 244,800163,200 124,800 306,000 238,800 174,750 153,000
24,426 . 424,200 303,000 181,800 .168,000 142,200 660,000 195,000 120,000 .124,080 85,000 663,353 352,716 133,769 199,311
2691 Manu.of non-structural non-refractory ceramic ware 2693 Manu.of structural non refractory clay & ceramic products 2694 Manu.of cement lime, and plaster 2695 Manu.of articles of concrete, cement & plaster 2696 Cutting, shaping & finishing of rough stones 2697 Refining of Ilmanite, surcon & refinding of plumbago 2699 Manu.of other non-metalic mineral products n.e.c 2710 Manu.of basic iron & steel 2720 Manu.of basic precious & non-ferrous metal 2731 Casting of iron & steel 2732 Casting of Non ferrous metals 2811 Manu.of structural metal products 2812 Manu.of tanks, resorvoirs & containers of metal except packing containers 2892 Treatment & coating of metal general mechanical engine 2893 Manu.of cutlery, hand tools & general hardware 2894 Manu.of other brass articles 2895 Manu.of non threaded metal products 2896 Manu.of Metal cooking utensils, household appliances & sanitary articles 2897 Manu.of Metal cables and similar articles 2898 Manu.of Containers used for the packing or conveyance 2899 Manu.of other fabricated metal products 2911 Manu.of engine and turbines, except aircraft, vehicle 2912 Manu.of pumps, compressors, taps and valves 2919 Manu.of other general purpose machinery 2921 Manu.of agricultural & forestry machinery 2922 Manu.of machine tools 2923 Manu.of machinery for metallurgy 2924 Manu.of machinery for mining, quarrying & construction 2925 Manu.of machinery for Food, beverage & tobacco proce.
Industry classSalaries per
skilledoperatives
Salaries perunskilled
operatives
Salaries peradministrative
employee
Salaries pertechnicalemployee
Salaries perclerical
employee
Salariesper otheremployee
(cont.)

Table 21: Salaries per employee by nature of employment & industry - 2011(Establishments with 25 or more persons engaged)
424,200 . . 5,252,000 484,784 .91,262 55,339 350,704 206,040 182,238 165,239
238,428 174,215 593,710 312,108 206,612 102,000128,298 108,188 482,431 239,966 181,394 151,169300,376 166,816 778,559 455,729 301,253 240,452172,831 151,316 1,192,095 521,849 262,060 309,193115,701 48,090 354,986 247,998 213,569 122,400246,575 184,371 896,524 571,167 280,500 186,536142,587 91,699 413,475 287,112 184,384 141,802141,402 101,440 831,716 335,652 194,774 216,202186,058 153,488 1,126,235 411,522 244,098 235,385113,345 99,243 180,000 109,200 120,000 113,250143,233 139,440 829,297 242,610 168,280 216,053228,639 264,111 651,450 337,889 193,793 170,630167,870 127,182 372,995 305,056 198,190 180,552136,678 . 368,705 345,403 276,638 72,727455,825 356,722 1,075,021 1,044,914 466,322 472,521183,087 146,836 978,109 309,531 294,467 229,263180,376 116,540 406,293 232,816 261,068 110,880152,430 122,708 585,288 247,601 162,222 98,199319,108 101,892 504,631 429,307 194,275 82,229156,000 108,000 516,000 360,000 216,000 120,000184,320 128,885 429,470 131,200 300,000 .163,675 112,225 500,051 299,079 207,139 191,359188,531 120,862 614,820 334,394 155,911 184,168
76,864 88,682 305,611 235,125 152,929 70,000606,267 452,305 3,225,409 1,174,084 718,533 599,651543,804 40,218 844,097 659,242 539,081 380,598
2926 Manu.of machinery for textile, apparel & leather products 2929 Manu.of other special purpose machinery (n.e.c.) 2930 Manu.of domestic appliance n.e.c. 3000 Manu.of office, accounting and computing machinery 3110 Manu.of electric motors, generators and transformers 3120 Manu.of electricity distribution and control apparatus 3130 Manu.of insulated wire and cables 3140 Manu.of accumulators primary cells and primary batteries 3150 Manu.of electric lamps and lighting equipments 3210 Manu.of electronic valves, tubes & other 3220 Manu.of TV & radio transmitters & apparatus for line telephone 3230 Manu.of TV & radio receivers sound or video recording 3320 Manu.of optical instruments and photographic equipment 3410 Manu.of motor vehicles 3420 Manu.of bodies for Motor vehicles, Manu. of trailers & semi-trailers 3430 Manu.of spare parts and accessories for motor vehicles 3511 Building and repairing of ships 3512 Building and repairing of pleasure & sporting boats 3592 Manu.of bicycles & invalid carraiges 3610 Manu.of furniture 3691 Manu.of jewellery and related articles 3693 Manu.of sports goods 3694 Manu.of toys & games 3699 Other manufacturing not elsewhere classified 3710 Reycycling of metal waste and scrap 3720 Reycycling of non-metal waste and scrap 4010 Production, collection & distribution of electricity 4100 Collection, purification and distribution of water
Industry classSalaries per
skilledoperatives
Salaries perunskilled
operatives
Salaries peradministrative
employee
Salaries pertechnicalemployee
Salaries perclerical
employee
Salariesper otheremployee
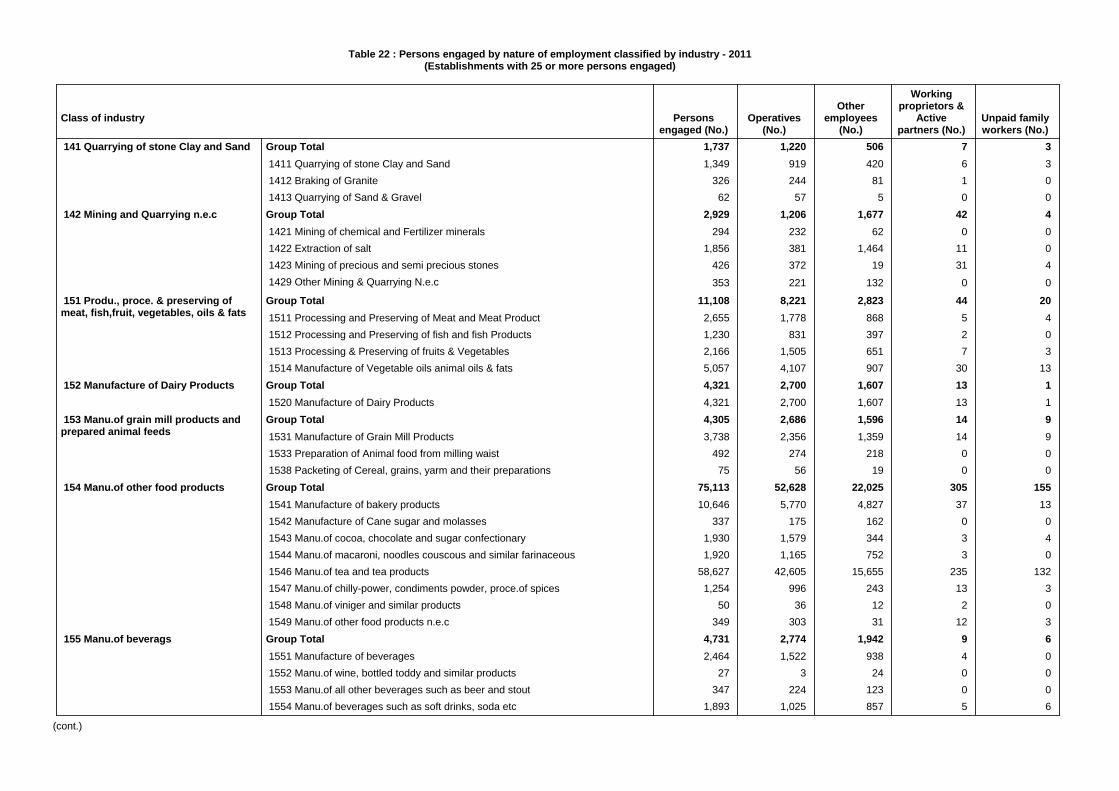
Table 22 : Persons engaged by nature of employment classified by industry - 2011(Establishments with 25 or more persons engaged)
1,737 1,220 506 7 31,349 919 420 6 3
326 244 81 1 062 57 5 0 0
2,929 1,206 1,677 42 4294 232 62 0 0
1,856 381 1,464 11 0426 372 19 31 4
353 221 132 0 0
11,108 8,221 2,823 44 202,655 1,778 868 5 41,230 831 397 2 02,166 1,505 651 7 35,057 4,107 907 30 134,321 2,700 1,607 13 14,321 2,700 1,607 13 14,305 2,686 1,596 14 93,738 2,356 1,359 14 9
492 274 218 0 075 56 19 0 0
75,113 52,628 22,025 305 15510,646 5,770 4,827 37 13
337 175 162 0 01,930 1,579 344 3 41,920 1,165 752 3 0
58,627 42,605 15,655 235 1321,254 996 243 13 3
50 36 12 2 0349 303 31 12 3
4,731 2,774 1,942 9 62,464 1,522 938 4 0
27 3 24 0 0347 224 123 0 0
1,893 1,025 857 5 6
Group Total 1411 Quarrying of stone Clay and Sand 1412 Braking of Granite 1413 Quarrying of Sand & Gravel
141 Quarrying of stone Clay and Sand
Group Total 1421 Mining of chemical and Fertilizer minerals 1422 Extraction of salt 1423 Mining of precious and semi precious stones 1429 Other Mining & Quarrying N.e.c
142 Mining and Quarrying n.e.c
Group Total 1511 Processing and Preserving of Meat and Meat Product 1512 Processing and Preserving of fish and fish Products 1513 Processing & Preserving of fruits & Vegetables 1514 Manufacture of Vegetable oils animal oils & fats
151 Produ., proce. & preserving ofmeat, fish,fruit, vegetables, oils & fats
Group Total 1520 Manufacture of Dairy Products
152 Manufacture of Dairy Products
Group Total 1531 Manufacture of Grain Mill Products 1533 Preparation of Animal food from milling waist 1538 Packeting of Cereal, grains, yarm and their preparations
153 Manu.of grain mill products andprepared animal feeds
Group Total 1541 Manufacture of bakery products 1542 Manufacture of Cane sugar and molasses 1543 Manu.of cocoa, chocolate and sugar confectionary 1544 Manu.of macaroni, noodles couscous and similar farinaceous 1546 Manu.of tea and tea products 1547 Manu.of chilly-power, condiments powder, proce.of spices 1548 Manu.of viniger and similar products 1549 Manu.of other food products n.e.c
154 Manu.of other food products
Group Total 1551 Manufacture of beverages 1552 Manu.of wine, bottled toddy and similar products 1553 Manu.of all other beverages such as beer and stout 1554 Manu.of beverages such as soft drinks, soda etc
155 Manu.of beverags
Class of industry Personsengaged (No.)
Operatives(No.)
Otheremployees
(No.)
Workingproprietors &
Activepartners (No.)
Unpaid familyworkers (No.)
(cont.)

Table 22 : Persons engaged by nature of employment classified by industry - 2011(Establishments with 25 or more persons engaged)
4,204 3,574 606 20 41,368 1,193 174 1 01,296 1,052 221 19 41,540 1,329 211 0 0
14,051 10,303 3,699 39 107,987 5,618 2,327 35 76,064 4,685 1,372 4 35,367 4,247 1,091 30 0
984 824 151 9 0230 205 25 0 0
1,541 1,239 294 8 035 26 7 2 0
1,420 1,116 298 6 01,013 712 298 4 0
145 126 18 1 019,222 14,924 4,284 15 010,323 8,516 1,805 2 05,315 4,110 1,205 0 0
78 59 18 1 03,506 2,239 1,256 12 0
273,071 229,059 43,687 160 164273,071 229,059 43,687 160 164
136 122 14 0 0136 122 14 0 0
1,428 1,128 296 4 072 40 32 0 0
571 436 131 4 0785 652 133 0 0
7,433 6,445 964 8 167,433 6,445 964 8 16
881 543 331 7 0881 543 331 7 0
Group Total 1601 Manu.of tabacco products 1602 Manu.of Cigarette, Cigar & Beedi 1609 Tobacco based products
160 Manu.of tobacco products
Group Total 1711 Prepa. & spinning of Textiles fibres, weaving of textiles 1712 Finishing of Textiles
171 Spinning, weaving and finishingof Textiles
Group Total 1721 Manu.of made-up textile article, except apparel 1722 Manu.of carpets and rugs 1723 Manu.of Cordage, Rope, twine & netting 1724 Manufacture of Sanitary Towels & Pampers 1726 Manu. of Laces and embroidered cloths 1727 Manu. of Labels, badges (cloth based) 1729 Cloth and coir based other products
172 Manu.of other Textiles
Group Total 1731 Manufacture of knitted Garments 1732 Manufacture of knitted socks, purses and Hand glouses 1733 Manufacture of Knitted Lace 1739 Elastomeric Yarn & other rubber thread based products
173 Manu.of knitted and crochetedfabrics and articles
Group Total 1810 Manufacture of weaving Apparel, except fur apparels
181 Manu.of weaving Apparel exceptfur apparels
Group Total 1820 Dressing and dyeing of fur, manu. articles of fur
182 Dressing and dyeing of fur,manufacture articles of fur
Group Total 1911 Tanning and dressing of leather 1912 Manu.of luggage, hand bags 1913 Manu. of Bags & rain coats, artificial leather product
191 Tanning & dressing of leather;manu. of luggage, Hand bags, saddlery& harness
Group Total 1920 Manufacturing of footwear
192 Manu.of footwear
Group Total 2010 Saw-milling and planning of wood
201 Saw-milling and planning of wood
Class of industry Personsengaged (No.)
Operatives(No.)
Otheremployees
(No.)
Workingproprietors &
Activepartners (No.)
Unpaid familyworkers (No.)
(cont.)

Table 22 : Persons engaged by nature of employment classified by industry - 2011(Establishments with 25 or more persons engaged)
2,098 1,616 448 26 81,038 778 241 19 0
123 103 19 1 0198 153 45 0 0441 359 71 3 8272 200 69 3 026 23 3 0 0
4,814 3,521 1,264 17 131,319 838 481 0 02,211 1,696 498 15 31,102 873 217 2 10
182 114 68 0 0617 262 353 2 0156 123 31 2 0314 31 283 0 0147 108 39 0 0
13,614 7,860 5,697 55 213,171 7,531 5,592 46 2
410 306 98 6 033 23 7 3 099 0 99 0 099 0 99 0 0
2,813 1,155 1,631 0 272,813 1,155 1,631 0 272,677 1,580 1,086 11 01,097 820 269 8 0
439 210 226 3 0631 410 221 0 0510 140 370 0 0
Group Total 2021 Manu.of veneer sheets, plywood, lamin board, particle boards 2022 Manufacture of builders carpentry and joinery 2023 Manufacture of wooden containers 2025 Manu.of Household utencils of other wooden article and ornaments 2026 Manu.of tools, coffins, other equipments used in funerals 2029 Manu.of all kinds of other wood products
202 Manu.of produ. of wood, cork,straw & plaiting material
Group Total 2101 Manufacture of pulp, paper and paperboards 2102 Manu.of corrugated paper & paperboard & containers of paper 2103 Manufacture of cards, files, books and pads 2109 Manu.of pulp paper and paper boards articles n.e.c
210 Manu.of paper and paperproducts
Group Total 2211 Publishing of books, broachers, musical books 2212 Publishing of newspapers, journals and periodicals 2219 Other publishing
221 Publishing, printing andreproduction of recorded media
Group Total 2221 Printing of newspapers, journals & periodicals for others 2222 Service activities related to printing 2223 Photocopies, computer print out etc.
222 Printing & service activitiesrelated to printing for others
Group Total 2230 Reproduction of recorded media
223 Reproduction of recorded media
Group Total 2320 Manu.of refined petroleum products
232 Manu.of refined petroleumproducts
Group Total 2411 Manu.of basic chemicals,(except fertilizres & nitrogen 2412 Manu.of fertilizer & nitrogen compounds 2413 Manu.of plastic in primary forms and synthetic rubber 2414 Manu.of Natural carbonic fertilizers
241 Manu.of basic chemicals
Class of industry Personsengaged (No.)
Operatives(No.)
Otheremployees
(No.)
Workingproprietors &
Activepartners (No.)
Unpaid familyworkers (No.)
(cont.)

Table 22 : Persons engaged by nature of employment classified by industry - 2011(Establishments with 25 or more persons engaged)
9,200 6,065 3,067 57 11311 103 208 0 0
2,399 1,607 792 0 03,337 1,862 1,430 42 31,518 1,150 359 9 0
156 130 26 0 0878 726 142 2 8147 125 22 0 0454 362 88 4 0
30,768 24,517 6,114 35 10111,862 10,052 1,806 2 26,133 5,195 937 0 09,664 7,003 2,541 22 98
488 400 88 0 02,622 1,867 742 12 1
15,636 11,968 3,455 203 1115,636 11,968 3,455 203 11
524 353 171 0 0524 353 171 0 0
13,177 9,868 3,250 49 114,190 3,562 628 0 03,907 2,970 932 4 11,729 889 839 1 02,762 1,990 741 30 2
329 233 76 12 8185 151 32 2 075 73 2 0 0
1,321 571 748 2 01,321 571 748 2 0
50 40 10 0 050 40 10 0 0
2,420 1,340 1,035 13 32652 401 206 13 32
1,768 939 829 0 0
Group Total 2421 Manu.of pesticides and other agro-chemical products 2422 Manu.of paints, varnishes & similar coatings, printing ink 2423 Manu.of parmaceuticals, medicinal chemicals & botanical products 2424 Manu.of soap & detergent, cleaning, perfumies & toilet preparations 2425 Manu.of explosives, crackers and other firework 2426 Manu.of mosquito-coils, camphor, napthaline balls, incense sticks 2427 Manu.of processed salt (for food) 2428 Manu.of chemicals and activated carbon
242 Manu.of other chemical products
Group Total 2511 Manu.of rubber tyres and tubes, rebuilding of rubber tyres 2512 Manu.of rubber condoms, rubber gloves 2513 Manu.of product from natural rubber 2514 Manu.of article of rubber 2519 Manu.of rubber products (not classified elsewhere)
251 Manu.of rubber products
Group Total 2520 Manu.of plastic products
252 Manu.of plastic products
Group Total 2610 Manu.of glass and glass products
261 Manu.of glass and glass products
Group Total 2691 Manu.of non-structural non-refractory ceramic ware 2693 Manu.of structural non refractory clay & ceramic products 2694 Manu.of cement lime, and plaster 2695 Manu.of articles of concrete, cement & plaster 2696 Cutting, shaping & finishing of rough stones 2697 Refining of Ilmanite, surcon & refinding of plumbago 2699 Manu.of other non-metalic mineral products n.e.c
269 Manu.of Non metallic mineralproducts(n.e.c.)
Group Total 2710 Manu.of basic iron & steel
271 Manu.of basic iron & steel
Group Total 2720 Manu.of basic precious & non-ferrous metal
272 Manu.of basic precious &non-ferrous metal
Group Total 2731 Casting of iron & steel 2732 Casting of Non ferrous metals
273 Casting of metals
Class of industry Personsengaged (No.)
Operatives(No.)
Otheremployees
(No.)
Workingproprietors &
Activepartners (No.)
Unpaid familyworkers (No.)
(cont.)

Table 22 : Persons engaged by nature of employment classified by industry - 2011(Establishments with 25 or more persons engaged)
2,429 1,883 540 6 01,916 1,495 415 6 0
513 388 125 0 02,951 2,251 610 21 70
625 481 141 4 0378 313 65 0 032 25 2 5 0
330 213 112 5 0101 71 29 1 074 47 27 0 0
311 253 55 3 01,100 849 179 3 70
569 474 87 7 137 32 4 0 1
478 411 64 3 054 31 19 4 0
965 769 185 11 0232 197 33 2 063 35 24 4 041 31 10 0 0
155 130 25 0 0207 166 36 5 0169 129 40 0 098 81 17 0 0
714 459 251 4 0714 459 251 4 0
1,872 1,474 398 0 01,872 1,474 398 0 01,841 1,390 447 4 01,841 1,390 447 4 02,099 1,698 399 2 02,099 1,698 399 2 01,027 627 400 0 01,027 627 400 0 0
Group Total 2811 Manu.of structural metal products 2812 Manu.of tanks, resorvoirs & containers of metal except packing containers
281 Manu.of structural metalproducts, tanks, reservoirs & steamgenerators
Group Total 2892 Treatment & coating of metal general mechanical engine 2893 Manu.of cutlery, hand tools & general hardware 2894 Manu.of other brass articles 2895 Manu.of non threaded metal products 2896 Manu.of Metal cooking utensils, household appliances & sanitary articles 2897 Manu.of Metal cables and similar articles 2898 Manu.of Containers used for the packing or conveyance 2899 Manu.of other fabricated metal products
289 Manu.of other fabricated metalproducts
Group Total 2911 Manu.of engine and turbines, except aircraft, vehicle 2912 Manu.of pumps, compressors, taps and valves 2919 Manu.of other general purpose machinery
291 Manu.of general purposemachinery
Group Total 2921 Manu.of agricultural & forestry machinery 2922 Manu.of machine tools 2923 Manu.of machinery for metallurgy 2924 Manu.of machinery for mining, quarrying & construction 2925 Manu.of machinery for Food, beverage & tobacco proce. 2926 Manu.of machinery for textile, apparel & leather products 2929 Manu.of other special purpose machinery (n.e.c.)
292 Manu.of special purposemachinery
Group Total 2930 Manu.of domestic appliance n.e.c.
293 Manu.of domestic appliance n.e.c.
Group Total 3000 Manu.of office, accounting and computing machinery
300 Manu.of office, accounting andcomputing machinery
Group Total 3110 Manu.of electric motors, generators and transformers
311 Manu.of electronic motors,generators and transformers
Group Total 3120 Manu.of electricity distribution and control apparatus
312 Manu.of electricity distributionand control apparatus
Group Total 3130 Manu.of insulated wire and cables
313 Manu.of insulated wire and cables
Class of industry Personsengaged (No.)
Operatives(No.)
Otheremployees
(No.)
Workingproprietors &
Activepartners (No.)
Unpaid familyworkers (No.)
(cont.)

Table 22 : Persons engaged by nature of employment classified by industry - 2011(Establishments with 25 or more persons engaged)
256 71 180 5 0256 71 180 5 0186 136 47 3 0186 136 47 3 0
1,306 924 382 0 01,306 924 382 0 01,325 1,006 319 0 01,325 1,006 319 0 0
117 92 22 3 0117 92 22 3 0123 95 27 0 1123 95 27 0 1404 275 128 1 0404 275 128 1 0411 240 171 0 0411 240 171 0 0173 86 87 0 0173 86 87 0 0
3,905 2,753 1,149 3 02,159 1,199 957 3 01,746 1,554 192 0 01,249 1,013 232 4 01,249 1,013 232 4 04,811 3,613 1,169 26 14,811 3,613 1,169 26 1
13,982 11,636 2,310 30 72,756 1,813 936 7 0
210 164 45 1 02,482 2,323 159 0 08,535 7,337 1,170 22 7
102 62 31 6 3102 62 31 6 3157 132 23 2 0157 132 23 2 0
Group Total 3140 Manu.of accumulators primary cells and primary batteries
314 Manu.of accumulators primarycells and primary batteries
Group Total 3150 Manu.of electric lamps and lighting equipments
315 Manu.of electric lamps andlighting equipments
Group Total 3210 Manu.of electronic valves, tubes & others
321 Manu.of electronic valves, tubes &others
Group Total 3220 Manu.of TV & radio transmitters & apparatus for line telephone
322 Manu.of TV & Radio transmitters
Group Total 3230 Manu.of TV & radio receivers sound or video recording
323 Manu.of TV & Radio receivers,sound or vedio recording
Group Total 3320 Manu.of optical instruments and photographic equipment
332 Manu.of optical instruments andphotographic equipments
Group Total 3410 Manu.of motor vehicles
341 Manu.of motor vehicles
Group Total 3420 Manu.of bodies for Motor vehicles, Manu. of trailers & semi-trailers
342 Manu.of bodies for Motorvehicles, Manu. of trailers &semi-trailers
Group Total 3430 Manu.of spare parts and accessories for motor vehicles
343 Manu.of spare parts andaccessories for motor vehicles
Group Total 3511 Building and repairing of ships 3512 Building and repairing of pleasure & sporting boats
351 Building and repairing of shipsand boats
Group Total 3592 Manu.of bicycles & invalid carraiges
359 Manu.of transport equipment n.e.c.
Group Total 3610 Manu.of furniture
361 Manu.of furniture
Group Total 3691 Manu.of jewellery and related articles 3693 Manu.of sports goods 3694 Manu.of toys & games 3699 Other manufacturing not elsewhere classified
369 Manu.of other product notelsewhere classified
Group Total 3710 Reycycling of metal waste and scrap
371 Recycling of metal waste andscrap
Group Total 3720 Reycycling of non-metal waste and scrap
372 Recycling of non-metal waste andscrap
Class of industry Personsengaged (No.)
Operatives(No.)
Otheremployees
(No.)
Workingproprietors &
Activepartners (No.)
Unpaid familyworkers (No.)
(cont.)
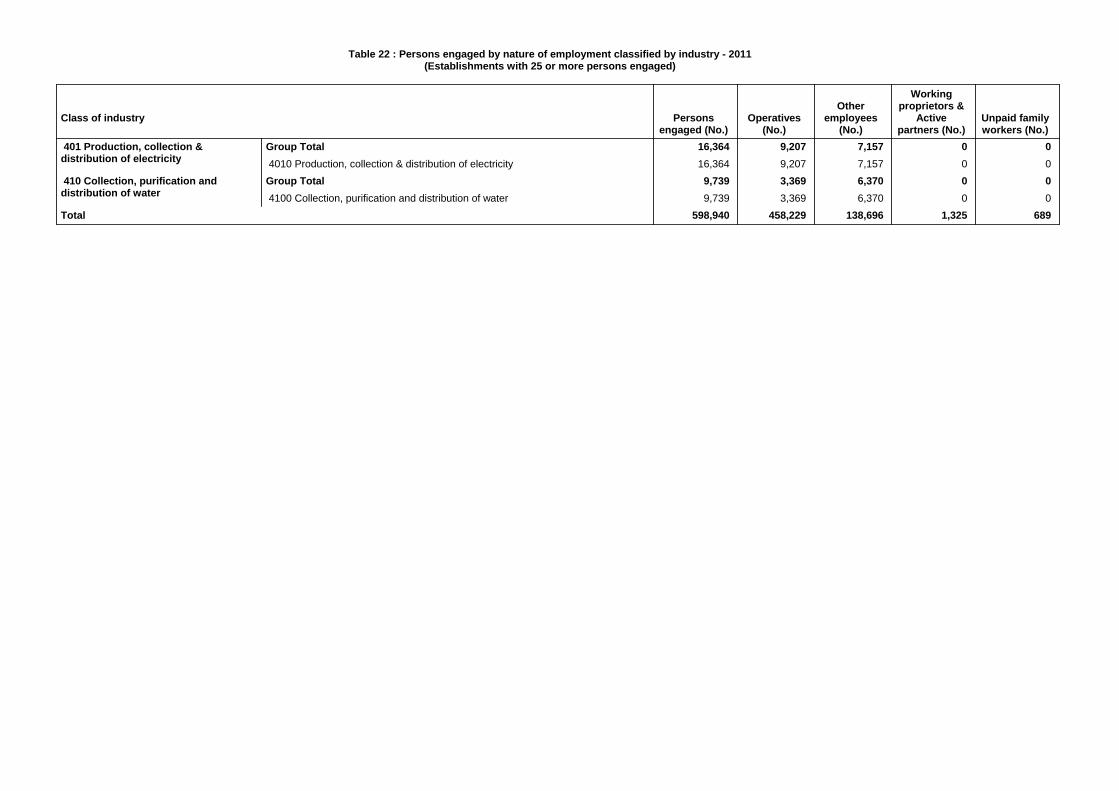
Table 22 : Persons engaged by nature of employment classified by industry - 2011(Establishments with 25 or more persons engaged)
16,364 9,207 7,157 0 016,364 9,207 7,157 0 09,739 3,369 6,370 0 09,739 3,369 6,370 0 0
598,940 458,229 138,696 1,325 689
Group Total 4010 Production, collection & distribution of electricity
401 Production, collection &distribution of electricity
Group Total 4100 Collection, purification and distribution of water
410 Collection, purification anddistribution of water
Total
Class of industry Personsengaged (No.)
Operatives(No.)
Otheremployees
(No.)
Workingproprietors &
Activepartners (No.)
Unpaid familyworkers (No.)
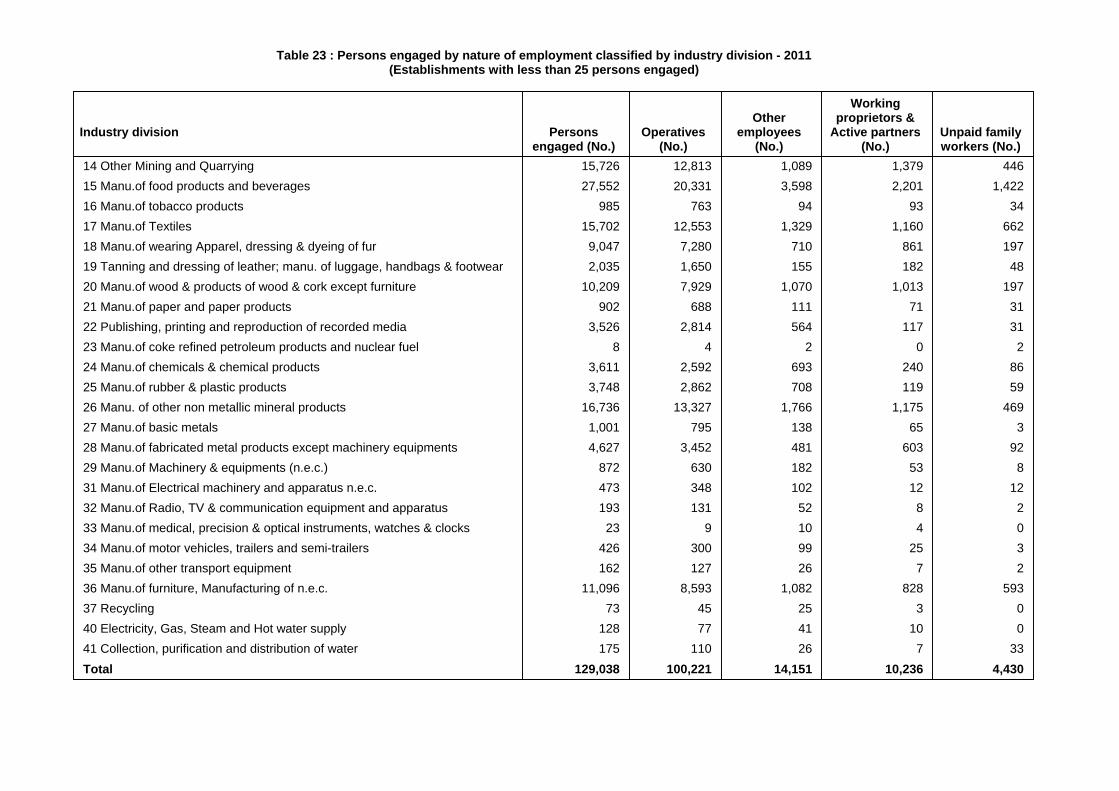
Table 23 : Persons engaged by nature of employment classified by industry division - 2011(Establishments with less than 25 persons engaged)
15,726 12,813 1,089 1,379 44627,552 20,331 3,598 2,201 1,422
985 763 94 93 3415,702 12,553 1,329 1,160 662
9,047 7,280 710 861 1972,035 1,650 155 182 48
10,209 7,929 1,070 1,013 197902 688 111 71 31
3,526 2,814 564 117 318 4 2 0 2
3,611 2,592 693 240 863,748 2,862 708 119 59
16,736 13,327 1,766 1,175 4691,001 795 138 65 34,627 3,452 481 603 92
872 630 182 53 8473 348 102 12 12193 131 52 8 2
23 9 10 4 0426 300 99 25 3162 127 26 7 2
11,096 8,593 1,082 828 59373 45 25 3 0
128 77 41 10 0175 110 26 7 33
129,038 100,221 14,151 10,236 4,430
14 Other Mining and Quarrying 15 Manu.of food products and beverages 16 Manu.of tobacco products 17 Manu.of Textiles 18 Manu.of wearing Apparel, dressing & dyeing of fur 19 Tanning and dressing of leather; manu. of luggage, handbags & footwear 20 Manu.of wood & products of wood & cork except furniture 21 Manu.of paper and paper products 22 Publishing, printing and reproduction of recorded media 23 Manu.of coke refined petroleum products and nuclear fuel 24 Manu.of chemicals & chemical products 25 Manu.of rubber & plastic products 26 Manu. of other non metallic mineral products 27 Manu.of basic metals 28 Manu.of fabricated metal products except machinery equipments 29 Manu.of Machinery & equipments (n.e.c.) 31 Manu.of Electrical machinery and apparatus n.e.c. 32 Manu.of Radio, TV & communication equipment and apparatus 33 Manu.of medical, precision & optical instruments, watches & clocks 34 Manu.of motor vehicles, trailers and semi-trailers 35 Manu.of other transport equipment 36 Manu.of furniture, Manufacturing of n.e.c. 37 Recycling 40 Electricity, Gas, Steam and Hot water supply 41 Collection, purification and distribution of water Total
Industry division Personsengaged (No.)
Operatives(No.)
Otheremployees
(No.)
Workingproprietors &
Active partners(No.)
Unpaid familyworkers (No.)

Table 24 : Value of assets (at the beginning of the year) classified by industry - 2011(Establishments with 25 or more persons engaged)
1,484,478,674 80,297,097 372,498,405 814,793,916 216,889,2561,287,901,443 52,758,747 313,689,300 738,224,912 183,228,484
29,346,428 - 1,040,000 12,103,347 16,203,081167,230,803 27,538,350 57,769,105 64,465,657 17,457,691
1,022,257,049 66,004,259 627,994,889 245,184,627 83,073,27439,423,764 - 16,731,777 14,459,904 8,232,083
654,938,085 49,788,459 470,951,574 79,539,168 54,658,8842,425,000 - 50,000 2,375,000 -
325,470,200 16,215,800 140,261,538 148,810,555 20,182,307
57,574,166,307 715,857,092 24,071,047,730 27,841,098,037 4,946,163,447209,048,861 49,000,000 115,350,000 26,927,838 17,771,023286,373,465 22,453,670 72,671,910 64,803,871 126,444,014
56,304,445,864 512,568,898 23,644,281,779 27,412,015,838 4,735,579,349774,298,117 131,834,524 238,744,041 337,350,490 66,369,061
1,502,649,817 49,571,579 370,056,983 808,256,838 274,764,4171,502,649,817 49,571,579 370,056,983 808,256,838 274,764,417
13,154,490,024 554,868,289 5,447,622,982 6,766,691,726 385,307,02712,186,546,958 404,304,539 5,191,814,702 6,246,758,826 343,668,891
967,943,066 150,563,750 255,808,280 519,932,900 41,638,13636,683,231,354 4,148,340,381 8,882,248,845 19,991,573,321 3,661,068,806
3,914,005,276 187,061,618 794,667,678 2,739,848,772 192,427,2092,794,933,065 89,554,275 207,233,320 2,480,330,000 17,815,470
465,453,624 33,597,200 54,415,048 289,335,044 88,106,332303,486,771 26,421,876 81,774,935 108,386,321 86,903,639
28,535,567,754 3,686,906,228 7,489,944,489 14,217,466,128 3,141,250,909547,899,121 77,869,184 219,970,704 141,688,765 108,370,468
22,430,743 13,730,000 1,742,672 563,292 6,394,77999,455,000 33,200,000 32,500,000 13,955,000 19,800,000
4,045,105,156 889,945,602 828,703,131 2,159,349,191 167,107,2331,712,078,254 401,283,978 179,802,954 1,010,429,153 120,562,169
20,388,343 5,286,900 14,203,080 635,930 262,4332,091,370,974 450,147,068 520,386,577 1,102,050,373 18,786,956
221,267,585 33,227,656 114,310,520 46,233,735 27,495,675123,087,848 9,330,000 41,465,035 36,118,504 36,174,309
67,528,274 - 29,770,946 26,088,332 11,668,99628,227,284 9,330,000 1,918,804 428,480 16,550,00027,332,290 - 9,775,285 9,601,692 7,955,313
Group Total 1411 Quarrying of stone Clay and Sand 1412 Braking of Granite 1413 Quarrying of Sand & Gravel
141 Quarrying of stone Clay and Sand
Group Total 1421 Mining of chemical and Fertilizer minerals 1422 Extraction of salt 1423 Mining of precious and semi precious stones 1429 Other Mining & Quarrying N.e.c
142 Mining and Quarrying n.e.c
Group Total 1511 Processing and Preserving of Meat and Meat Product 1512 Processing and Preserving of fish and fish Products 1513 Processing & Preserving of fruits & Vegetables 1514 Manufacture of Vegetable oils animal oils & fats
151 Produ., proce. & preserving of meat,fish,fruit, vegetables, oils & fats
Group Total 1520 Manufacture of Dairy Products
152 Manufacture of Dairy Products
Group Total 1531 Manufacture of Grain Mill Products 1533 Preparation of Animal food from milling waist
153 Manu.of grain mill products andprepared animal feeds
Group Total 1541 Manufacture of bakery products 1542 Manufacture of Cane sugar and molasses 1543 Manu.of cocoa, chocolate and sugar confectionary 1544 Manu.of macaroni, noodles couscous and similar farinaceous 1546 Manu.of tea and tea products 1547 Manu.of chilly-power, condiments powder, proce.of spices 1548 Manu.of viniger and similar products 1549 Manu.of other food products n.e.c
154 Manu.of other food products
Group Total 1551 Manufacture of beverages 1552 Manu.of wine, bottled toddy and similar products 1553 Manu.of all other beverages such as beer and stout 1554 Manu.of beverages such as soft drinks, soda etc
155 Manu.of beverags
Group Total 1601 Manu.of tabacco products 1602 Manu.of Cigarette, Cigar & Beedi 1609 Tobacco based products
160 Manu.of tobacco products
Type of industryTotal value (Rs.)
Land value(Rs.)
Building value(Rs.)
Machinery value(Rs.)
Transport value(Rs.)
(cont.)

Table 24 : Value of assets (at the beginning of the year) classified by industry - 2011(Establishments with 25 or more persons engaged)
9,991,678,499 671,484,620 3,302,977,125 5,790,654,109 226,562,6455,339,514,602 554,537,556 2,082,725,795 2,504,275,460 197,975,7914,652,163,897 116,947,064 1,220,251,330 3,286,378,649 28,586,8543,737,341,672 322,656,089 504,622,401 2,834,980,093 75,083,089
132,272,204 27,215,024 46,278,660 46,056,602 12,721,9183,658,000 - - 3,658,000 -
510,092,546 245,113,215 89,472,478 161,572,920 13,933,9336,300,000 3,500,000 2,100,000 700,000 -
2,467,403,922 17,077,850 331,021,263 2,092,097,571 27,207,238617,615,000 29,750,000 35,750,000 530,895,000 21,220,000
10,661,227,359 259,109,364 2,310,287,998 7,849,568,039 242,261,9583,590,970,865 56,536,880 1,094,020,822 2,344,987,071 95,426,0922,251,417,563 120,529,363 654,043,072 1,415,951,542 60,893,586
27,400,000 3,600,000 - 19,000,000 4,800,0004,791,438,931 78,443,121 562,224,104 4,069,629,426 81,142,280
38,110,075,040 4,969,087,771 11,830,497,880 20,378,465,754 932,023,63538,110,075,040 4,969,087,771 11,830,497,880 20,378,465,754 932,023,635
117,307,026 3,700,000 46,487,404 67,119,622 -
117,307,026 3,700,000 46,487,404 67,119,622 -5,289,417,868 5,048,686,745 50,496,200 147,233,402 43,001,521
149,565,050 47,071,558 26,038,651 57,872,376 18,582,4655,022,950,000 5,000,000,000 3,000,000 10,000,000 9,950,000
116,902,818 1,615,187 21,457,549 79,361,026 14,469,0561,506,604,935 330,408,305 344,158,790 781,297,435 50,740,4051,506,604,935 330,408,305 344,158,790 781,297,435 50,740,405
98,789,476 5,996,698 56,898,113 33,526,167 2,368,49898,789,476 5,996,698 56,898,113 33,526,167 2,368,498
4,229,418,270 142,930,250 680,399,791 3,342,999,354 63,088,8753,622,943,719 31,202,000 469,044,006 3,101,247,263 21,450,450
57,566,032 25,774,900 10,441,132 16,200,000 5,150,00057,206,154 - 12,319,988 31,448,104 13,438,062
386,451,401 60,048,020 145,156,113 158,562,664 22,684,604105,250,964 25,905,330 43,438,552 35,541,323 365,759
1,891,436,907 263,563,296 644,602,906 814,111,172 169,159,532124,419,921 7,683,514 40,085,219 75,375,362 1,275,826
1,379,295,084 226,416,318 405,745,407 597,775,865 149,357,494387,721,902 29,463,464 198,772,280 140,959,945 18,526,212
Group Total 1711 Prepa. & spinning of Textiles fibres, weaving of textiles 1712 Finishing of Textiles
171 Spinning, weaving and finishing ofTextiles
Group Total 1721 Manu.of made-up textile article, except apparel 1722 Manu.of carpets and rugs 1723 Manu.of Cordage, Rope, twine & netting 1724 Manufacture of Sanitary Towels & Pampers 1726 Manu. of Laces and embroidered cloths 1727 Manu. of Labels, badges (cloth based)
172 Manu.of other Textiles
Group Total 1731 Manufacture of knitted Garments 1732 Manufacture of knitted socks, purses and Hand glouses 1733 Manufacture of Knitted Lace 1739 Elastomeric Yarn & other rubber thread based products
173 Manu.of knitted and crocheted fabricsand articles
Group Total 1810 Manufacture of weaving Apparel, except fur apparels
181 Manu.of weaving Apparel except furapparels
Group Total 1820 Dressing and dyeing of fur, manu. articles of fur
182 Dressing and dyeing of fur,manufacture articles of fur
Group Total 1911 Tanning and dressing of leather 1912 Manu.of luggage, hand bags 1913 Manu. of Bags & rain coats, artificial leather products
191 Tanning & dressing of leather; manu.of luggage, Hand bags, saddlery &harness
Group Total 1920 Manufacturing of footwear
192 Manu.of footwear
Group Total 2010 Saw-milling and planning of wood
201 Saw-milling and planning of wood
Group Total 2021 Manu.of veneer sheets, plywood, lamin board, particle board 2022 Manufacture of builders carpentry and joinery 2023 Manufacture of wooden containers 2025 Manu.of Household utencils of other wooden article and ornaments 2026 Manu.of tools, coffins, other equipments used in funerals
202 Manu.of produ. of wood, cork, straw &plaiting material
Group Total 2101 Manufacture of pulp, paper and paperboards 2102 Manu.of corrugated paper & paperboard & containers of paper 2103 Manufacture of cards, files, books and pads
210 Manu.of paper and paper products
Type of industryTotal value (Rs.)
Land value(Rs.)
Building value(Rs.)
Machinery value(Rs.)
Transport value(Rs.)
(cont.)
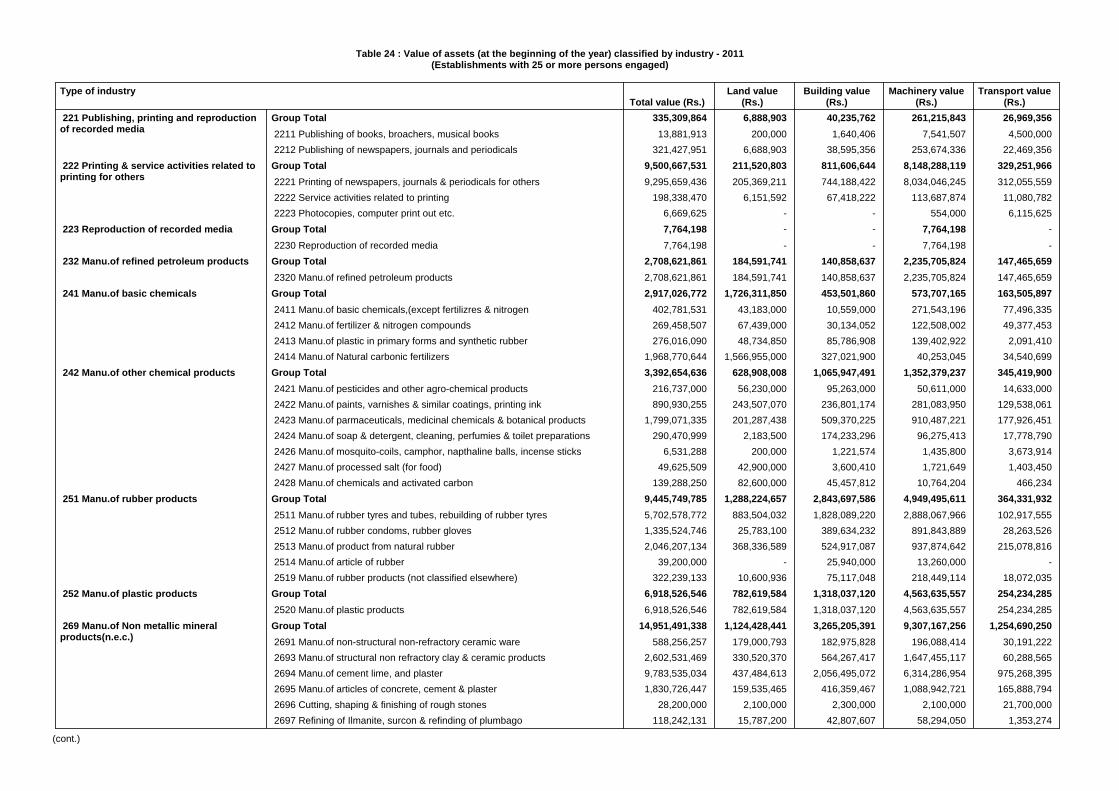
Table 24 : Value of assets (at the beginning of the year) classified by industry - 2011(Establishments with 25 or more persons engaged)
335,309,864 6,888,903 40,235,762 261,215,843 26,969,35613,881,913 200,000 1,640,406 7,541,507 4,500,000
321,427,951 6,688,903 38,595,356 253,674,336 22,469,3569,500,667,531 211,520,803 811,606,644 8,148,288,119 329,251,9669,295,659,436 205,369,211 744,188,422 8,034,046,245 312,055,559
198,338,470 6,151,592 67,418,222 113,687,874 11,080,7826,669,625 - - 554,000 6,115,6257,764,198 - - 7,764,198 -
7,764,198 - - 7,764,198 -2,708,621,861 184,591,741 140,858,637 2,235,705,824 147,465,6592,708,621,861 184,591,741 140,858,637 2,235,705,824 147,465,6592,917,026,772 1,726,311,850 453,501,860 573,707,165 163,505,897
402,781,531 43,183,000 10,559,000 271,543,196 77,496,335269,458,507 67,439,000 30,134,052 122,508,002 49,377,453276,016,090 48,734,850 85,786,908 139,402,922 2,091,410
1,968,770,644 1,566,955,000 327,021,900 40,253,045 34,540,6993,392,654,636 628,908,008 1,065,947,491 1,352,379,237 345,419,900
216,737,000 56,230,000 95,263,000 50,611,000 14,633,000890,930,255 243,507,070 236,801,174 281,083,950 129,538,061
1,799,071,335 201,287,438 509,370,225 910,487,221 177,926,451290,470,999 2,183,500 174,233,296 96,275,413 17,778,790
6,531,288 200,000 1,221,574 1,435,800 3,673,91449,625,509 42,900,000 3,600,410 1,721,649 1,403,450
139,288,250 82,600,000 45,457,812 10,764,204 466,2349,445,749,785 1,288,224,657 2,843,697,586 4,949,495,611 364,331,9325,702,578,772 883,504,032 1,828,089,220 2,888,067,966 102,917,5551,335,524,746 25,783,100 389,634,232 891,843,889 28,263,5262,046,207,134 368,336,589 524,917,087 937,874,642 215,078,816
39,200,000 - 25,940,000 13,260,000 -322,239,133 10,600,936 75,117,048 218,449,114 18,072,035
6,918,526,546 782,619,584 1,318,037,120 4,563,635,557 254,234,2856,918,526,546 782,619,584 1,318,037,120 4,563,635,557 254,234,285
14,951,491,338 1,124,428,441 3,265,205,391 9,307,167,256 1,254,690,250588,256,257 179,000,793 182,975,828 196,088,414 30,191,222
2,602,531,469 330,520,370 564,267,417 1,647,455,117 60,288,5659,783,535,034 437,484,613 2,056,495,072 6,314,286,954 975,268,3951,830,726,447 159,535,465 416,359,467 1,088,942,721 165,888,794
28,200,000 2,100,000 2,300,000 2,100,000 21,700,000118,242,131 15,787,200 42,807,607 58,294,050 1,353,274
Group Total 2211 Publishing of books, broachers, musical books 2212 Publishing of newspapers, journals and periodicals
221 Publishing, printing and reproductionof recorded media
Group Total 2221 Printing of newspapers, journals & periodicals for others 2222 Service activities related to printing 2223 Photocopies, computer print out etc.
222 Printing & service activities related toprinting for others
Group Total 2230 Reproduction of recorded media
223 Reproduction of recorded media
Group Total 2320 Manu.of refined petroleum products
232 Manu.of refined petroleum products
Group Total 2411 Manu.of basic chemicals,(except fertilizres & nitrogen 2412 Manu.of fertilizer & nitrogen compounds 2413 Manu.of plastic in primary forms and synthetic rubber 2414 Manu.of Natural carbonic fertilizers
241 Manu.of basic chemicals
Group Total 2421 Manu.of pesticides and other agro-chemical products 2422 Manu.of paints, varnishes & similar coatings, printing ink 2423 Manu.of parmaceuticals, medicinal chemicals & botanical products 2424 Manu.of soap & detergent, cleaning, perfumies & toilet preparations 2426 Manu.of mosquito-coils, camphor, napthaline balls, incense sticks 2427 Manu.of processed salt (for food) 2428 Manu.of chemicals and activated carbon
242 Manu.of other chemical products
Group Total 2511 Manu.of rubber tyres and tubes, rebuilding of rubber tyres 2512 Manu.of rubber condoms, rubber gloves 2513 Manu.of product from natural rubber 2514 Manu.of article of rubber 2519 Manu.of rubber products (not classified elsewhere)
251 Manu.of rubber products
Group Total 2520 Manu.of plastic products
252 Manu.of plastic products
Group Total 2691 Manu.of non-structural non-refractory ceramic ware 2693 Manu.of structural non refractory clay & ceramic products 2694 Manu.of cement lime, and plaster 2695 Manu.of articles of concrete, cement & plaster 2696 Cutting, shaping & finishing of rough stones 2697 Refining of Ilmanite, surcon & refinding of plumbago
269 Manu.of Non metallic mineralproducts(n.e.c.)
Type of industryTotal value (Rs.)
Land value(Rs.)
Building value(Rs.)
Machinery value(Rs.)
Transport value(Rs.)
(cont.)

Table 24 : Value of assets (at the beginning of the year) classified by industry - 2011(Establishments with 25 or more persons engaged)
4,530,016,062 2,640,859,050 597,424,104 1,205,994,132 85,738,7764,530,016,062 2,640,859,050 597,424,104 1,205,994,132 85,738,7761,644,580,961 292,389,723 352,823,611 939,501,824 59,865,803
198,243,312 8,882,223 45,942,463 138,045,646 5,372,9801,446,337,649 283,507,500 306,881,148 801,456,178 54,492,8231,045,603,627 317,007,201 277,880,744 281,797,089 168,918,593
599,482,361 194,073,109 163,834,520 136,286,038 105,288,694
446,121,266 122,934,092 114,046,224 145,511,051 63,629,899
922,571,006 127,407,837 239,353,424 413,395,427 142,414,318256,976,027 54,968,625 26,742,050 100,522,796 74,742,556
65,682,573 3,399,575 11,039,772 39,078,956 12,164,27084,120 25 7,319 76,506 270
534,954,148 62,258,650 145,488,780 272,393,363 54,813,35564,874,138 6,780,962 56,075,503 1,323,806 693,867
220,173,143 29,351,076 38,623,708 78,004,980 74,193,379220,173,143 29,351,076 38,623,708 78,004,980 74,193,379121,777,487 13,883,500 72,049,918 11,656,217 24,187,852
51,816,174 - 48,511,126 3,305,048 -69,961,313 13,883,500 23,538,792 8,351,169 24,187,852
572,425,020 176,250,000 182,171,230 204,878,806 9,124,984572,425,020 176,250,000 182,171,230 204,878,806 9,124,984148,165,822 2,000,000 97,414,369 40,146,698 8,604,755148,165,822 2,000,000 97,414,369 40,146,698 8,604,755656,161,983 13,651,827 224,902,936 413,703,949 3,903,271656,161,983 13,651,827 224,902,936 413,703,949 3,903,271723,883,280 270,746,551 153,896,811 224,960,973 74,278,945723,883,280 270,746,551 153,896,811 224,960,973 74,278,945
36,283,162 8,375,000 1,659,877 2,570,961 23,677,32436,283,162 8,375,000 1,659,877 2,570,961 23,677,324
364,291,285 47,480,875 170,040,580 136,926,080 9,843,750364,291,285 47,480,875 170,040,580 136,926,080 9,843,750106,297,230 6,694,526 36,113,438 51,899,438 11,589,828106,297,230 6,694,526 36,113,438 51,899,438 11,589,828734,585,723 - 120,797,688 600,690,436 13,097,599734,585,723 - 120,797,688 600,690,436 13,097,599347,709,000 - 233,000,000 94,000,000 20,709,000347,709,000 - 233,000,000 94,000,000 20,709,000
14,502,648 1,327,000 - 3,761,844 9,413,80414,502,648 1,327,000 - 3,761,844 9,413,804
Group Total 2710 Manu.of basic iron & steel
271 Manu.of basic iron & steel
Group Total 2731 Casting of iron & steel 2732 Casting of Non ferrous metals
273 Casting of metals
Group Total 2811 Manu.of structural metal products 2812 Manu.of tanks, resorvoirs & containers of metal except packingcontainers
281 Manu.of structural metal products,tanks, reservoirs & steam generators
Group Total 2892 Treatment & coating of metal general mechanical engine 2893 Manu.of cutlery, hand tools & general hardware 2897 Manu.of Metal cables and similar articles 2898 Manu.of Containers used for the packing or conveyance 2899 Manu.of other fabricated metal products
289 Manu.of other fabricated metalproducts
Group Total 2912 Manu.of pumps, compressors, taps and valves
291 Manu.of general purpose machinery
Group Total 2922 Manu.of machine tools 2925 Manu.of machinery for Food, beverage & tobacco proce.
292 Manu.of special purpose machinery
Group Total 2930 Manu.of domestic appliance n.e.c.
293 Manu.of domestic appliance n.e.c.
Group Total 3000 Manu.of office, accounting and computing machinery
300 Manu.of office, accounting andcomputing machinery
Group Total 3110 Manu.of electric motors, generators and transformers
311 Manu.of electronic motors, generatorsand transformers
Group Total 3120 Manu.of electricity distribution and control apparatus
312 Manu.of electricity distribution andcontrol apparatus
Group Total 3130 Manu.of insulated wire and cables
313 Manu.of insulated wire and cables
Group Total 3140 Manu.of accumulators primary cells and primary batteries
314 Manu.of accumulators primary cellsand primary batteries
Group Total 3150 Manu.of electric lamps and lighting equipments
315 Manu.of electric lamps and lightingequipments
Group Total 3210 Manu.of electronic valves, tubes & other
321 Manu.of electronic valves, tubes &other
Group Total 3220 Manu.of TV & radio transmitters & apparatus for line telephone
322 Manu.of TV & Radio transmitters
Group Total 3230 Manu.of TV & radio receivers sound or video recording
323 Manu.of TV & Radio receivers, soundor vedio recording
Type of industryTotal value (Rs.)
Land value(Rs.)
Building value(Rs.)
Machinery value(Rs.)
Transport value(Rs.)
(cont.)

Table 24 : Value of assets (at the beginning of the year) classified by industry - 2011(Establishments with 25 or more persons engaged)
36,304,170 - 24,249,901 9,985,056 2,069,21336,304,170 - 24,249,901 9,985,056 2,069,213
287,154,566 77,146,650 165,583,819 41,809,750 2,614,347287,154,566 77,146,650 165,583,819 41,809,750 2,614,347
11,245,179 8,087,900 2,500,000 657,279 -
11,245,179 8,087,900 2,500,000 657,279 -2,863,292 - 899,904 1,868,250 95,1382,863,292 - 899,904 1,868,250 95,138
277,516,992 81,398,906 87,842,222 93,526,022 14,749,842212,317,445 79,172,989 66,921,355 59,291,559 6,931,542
65,199,547 2,225,917 20,920,867 34,234,463 7,818,300729,936,882 116,246,853 295,690,685 299,910,472 18,088,872729,936,882 116,246,853 295,690,685 299,910,472 18,088,872
2,192,417,911 451,508,878 819,061,423 793,444,009 128,403,6022,192,417,911 451,508,878 819,061,423 793,444,009 128,403,6023,510,082,129 359,440,498 1,181,563,151 1,785,101,531 183,976,949
510,407,946 33,025,128 189,257,529 261,573,784 26,551,505629,635,716 92,034,445 250,885,089 261,531,465 25,184,717
2,370,038,467 234,380,925 741,420,533 1,261,996,282 132,240,72798,644,456 11,397,255 22,494,775 64,139,382 613,04498,644,456 11,397,255 22,494,775 64,139,382 613,04427,000,000 - 15,000,000 10,000,000 2,000,00027,000,000 - 15,000,000 10,000,000 2,000,000
378,208,000,000 10,045,000,000 319,875,000,000 46,113,000,000 2,175,000,000378,208,000,000 10,045,000,000 319,875,000,000 46,113,000,000 2,175,000,000
78,576,200,000 8,568,414,000 28,806,382,000 39,292,333,000 1,909,071,00078,576,200,000 8,568,414,000 28,806,382,000 39,292,333,000 1,909,071,000
717,546,968,826 48,151,396,529 424,446,577,417 225,312,043,722 19,636,951,158
Group Total 3320 Manu.of optical instruments and photographic equipment
332 Manu.of optical instruments andphotographic equipments
Group Total 3410 Manu.of motor vehicles
341 Manu.of motor vehicles
Group Total 3420 Manu.of bodies for Motor vehicles, Manu. of trailers & semi-trailers
342 Manu.of bodies for Motor vehicles,Manu. of trailers & semi-trailers
Group Total 3430 Manu.of spare parts and accessories for motor vehicles
343 Manu.of spare parts and accessoriesfor motor vehicles
Group Total 3511 Building and repairing of ships 3512 Building and repairing of pleasure & sporting boats
351 Building and repairing of ships andboats
Group Total 3592 Manu.of bicycles & invalid carraiges
359 Manu.of transport equipment n.e.c.
Group Total 3610 Manu.of furniture
361 Manu.of furniture
Group Total 3691 Manu.of jewellery and related articles 3694 Manu.of toys & games 3699 Other manufacturing not elsewhere classified
369 Manu.of other product not elsewhereclassified
Group Total 3710 Reycycling of metal waste and scrap
371 Recycling of metal waste and scrap
Group Total 3720 Reycycling of non-metal waste and scrap
372 Recycling of non-metal waste andscrap
Group Total 4010 Production, collection & distribution of electricity
401 Production, collection & distributionof electricity
Group Total 4100 Collection, purification and distribution of water
410 Collection, purification anddistribution of water
Total
Type of industryTotal value (Rs.)
Land value(Rs.)
Building value(Rs.)
Machinery value(Rs.)
Transport value(Rs.)

Table 25 : Value of assets (at the beginning of the year) classified by industry division - 2011(Establishments with less than 25 persons engaged)
2,695,325,945 806,718,407 84,920,440 1,464,491,888 339,195,21113,402,310,548 4,085,006,291 3,122,664,295 4,081,705,745 2,112,934,217
133,714,141 36,126,927 36,024,730 5,161,827 56,400,6572,986,576,915 1,297,797,040 536,445,605 693,227,164 459,107,106
609,450,566 194,580,667 170,113,669 129,717,872 115,038,358390,696,687 31,300,000 43,470,000 14,656,687 301,270,000
3,285,327,707 1,767,667,727 656,498,403 675,914,136 185,247,442101,081,572 32,180,000 20,788,859 34,316,409 13,796,304530,688,538 115,469,482 158,702,601 236,224,246 20,292,210517,828,328 155,814,900 183,818,078 121,239,107 56,956,243
1,300,737,860 649,221,920 137,370,989 368,892,790 145,252,1605,009,947,064 2,454,894,244 828,919,714 968,069,656 758,063,450
254,230,154 131,405,252 45,801,212 58,131,084 18,892,606634,765,808 240,915,000 119,833,964 80,753,961 193,262,883239,501,468 119,725,000 42,349,296 40,861,800 36,565,372
11,500,000 6,100,000 3,500,000 1,100,000 800,00054,949,929 13,487,500 24,986,672 7,636,736 8,839,02116,542,170 - 8,524,319 2,756,883 5,260,96832,444,156 3,060,912 13,998,527 12,173,629 3,211,08811,276,250 3,300,000 2,457,465 4,118,785 1,400,000
1,193,659,607 502,539,277 410,468,370 138,924,957 141,727,00414,958,352 6,000,000 5,500,000 2,945,352 513,000
381,205,613 11,206,688 190,415,363 158,769,714 20,813,848229,843,412 3,500,000 61,718,887 162,418,310 2,206,215
34,038,562,789 12,668,017,233 6,909,291,457 9,464,208,738 4,997,045,361
14 Other Mining and Quarrying 15 Manu.of food products and beverages 16 Manu.of tobacco products 17 Manu.of Textiles 18 Manu.of wearing Apparel, dressing & dyeing of fur 19 Tanning and dressing of leather; manu. of luggage, handbags & footwear 20 Manu.of wood & products of wood & cork except furniture 21 Manu.of paper and paper products 22 Publishing, printing and reproduction of recorded media 24 Manu.of chemicals & chemical products 25 Manu.of rubber & plastic products 26 Manu. of other non metallic mineral products 27 Manu.of basic metals 28 Manu.of fabricated metal products except machinery equipments 29 Manu.of Machinery & equipments (n.e.c.) 31 Manu.of Electrical machinery and apparatus n.e.c. 32 Manu.of Radio, TV & communication equipment and apparatus 33 Manu.of medical, precision & optical instruments, watches & clocks 34 Manu.of motor vehicles, trailers and semi-trailers 35 Manu.of other transport equipment 36 Manu.of furniture, Manufacturing of n.e.c. 37 Recycling 40 Electricity, Gas, Steam and Hot water supply 41 Collection, purification and distribution of water Total
Industry division Total value(Rs.)
Land value(Rs.)
Building value(Rs.)
Machineryvalue (Rs.)
Transportvalue (Rs.)

Table 26 : Value of gross additions to the fixed assets during the year classified by industry - 2011(Establishment with 25 or more persons engaged)
2,429,498,046 - 16,970,351 2,344,481,737 68,045,9582,399,852,654 - 16,906,199 2,315,106,437 67,840,018
28,920,648 - - 28,714,708 205,940
724,744 - 64,152 660,592 -281,172,198 70,000 144,936,189 82,706,781 53,459,228
25,903,906 - 1,869,745 5,234,161 18,800,000
188,370,922 - 124,266,529 29,445,165 34,659,228
184,000 70,000 50,000 64,000 -
66,713,370 - 18,749,915 47,963,455 -86,677,539,141 4,161,314 65,900,264,163 19,457,519,648 1,315,594,015
3,500,000 1,400,000 - 600,000 1,500,000
10,433,224 - 2,974,456 218,675 7,240,093
86,572,298,562 - 65,886,455,380 19,419,112,233 1,266,730,94991,307,355 2,761,314 10,834,327 37,588,740 40,122,973
1,154,205,065 6,799,242 18,314,971 1,082,511,761 46,579,0911,154,205,065 6,799,242 18,314,971 1,082,511,761 46,579,091
555,864,616 1,559,000 130,491,427 232,350,106 191,464,083316,042,546 1,559,000 41,394,215 123,511,307 149,578,024
239,822,070 - 89,097,212 108,838,799 41,886,0593,422,482,267 125,595,740 806,967,372 1,871,260,117 618,659,0391,365,734,741 29,087,770 307,606,335 901,087,524 127,953,112
7,928,000 - - 6,344,000 1,584,000
58,373,272 - - 58,373,272 -
59,850,231 - 695,470 16,012,866 43,141,8951,882,596,989 95,307,970 490,264,968 871,558,189 425,465,862
43,436,285 1,200,000 8,176,153 16,689,551 17,370,581
4,557,750 - 224,446 1,189,715 3,143,589
5,000 - - 5,000 -177,665,866 - 50,876,139 88,594,091 38,195,636
106,649,830 - 47,290,134 45,076,482 14,283,214
1,214,787 - 1,030,859 119,588 64,340
8,987,456 - - 595,616 8,391,840
60,813,793 - 2,555,146 42,802,405 15,456,242105,375,517 8,670,000 22,047,677 67,135,762 7,522,07851,207,045 - 17,491,535 30,043,432 3,672,078
11,993,302 8,670,000 3,148,302 - 175,000
42,175,170 - 1,407,840 37,092,330 3,675,000
Group Total 1411 Quarrying of stone Clay and Sand
1412 Braking of Granite
1413 Quarrying of Sand & Gravel
141 Quarrying of stone Clay and Sand
Group Total 1421 Mining of chemical and Fertilizer minerals
1422 Extraction of salt
1423 Mining of precious and semi precious stones
1429 Other Mining & Quarrying N.e.c
142 Mining and Quarrying n.e.c
Group Total 1511 Processing and Preserving of Meat and Meat Product
1512 Processing and Preserving of fish and fish Products
1513 Processing & Preserving of fruits & Vegetables
1514 Manufacture of Vegetable oils animal oils & fats
151 Produ., proce. & preserving of meat,fish,fruit, vegetables, oils & fats
Group Total 1520 Manufacture of Dairy Products
152 Manufacture of Dairy Products
Group Total 1531 Manufacture of Grain Mill Products 1533 Preparation of Animal food from milling waist
153 Manu.of grain mill products andprepared animal feeds
Group Total 1541 Manufacture of bakery products 1542 Manufacture of Cane sugar and molasses
1543 Manu.of cocoa, chocolate and sugar confectionary
1544 Manu.of macaroni, noodles couscous and similar farinaceous
1546 Manu.of tea and tea products 1547 Manu.of chilly-power, condiments powder, proce.of spices 1548 Manu.of viniger and similar products
1549 Manu.of other food products n.e.c
154 Manu.of other food products
Group Total 1551 Manufacture of beverages
1552 Manu.of wine, bottled toddy and similar products
1553 Manu.of all other beverages such as beer and stout
1554 Manu.of beverages such as soft drinks, soda etc
155 Manu.of beverags
Group Total 1601 Manu.of tabacco products
1602 Manu.of Cigarette, Cigar & Beedi
1609 Tobacco based products
160 Manu.of tobacco products
Type of industry Total (Rs.) Land (Rs.) Building (Rs.) Mechinery (Rs.)Transport
(Rs.)
(cont.)

Table 26 : Value of gross additions to the fixed assets during the year classified by industry - 2011(Establishment with 25 or more persons engaged)
828,023,646 83,310,000 103,164,414 617,792,166 23,757,067620,501,998 83,310,000 77,531,419 438,731,108 20,929,472
207,521,648 - 25,632,995 179,061,058 2,827,595484,360,254 - 7,672,000 476,133,514 554,740
832,754 - - 690,514 142,240
458,435,000 - 7,672,000 450,763,000 -25,092,500 - - 24,680,000 412,500
1,317,837,635 33,480,880 137,561,194 1,112,162,561 34,633,000
279,004,592 - 27,375,622 250,745,425 883,545
578,910,372 - 38,837,220 536,678,697 3,394,455459,922,671 33,480,880 71,348,352 324,738,439 30,355,000
4,059,915,070 567,758,642 764,031,776 2,450,897,272 277,227,3804,059,915,070 567,758,642 764,031,776 2,450,897,272 277,227,380
62,757 - - 62,757 -62,757 - - 62,757 -
82,628,235 800,000 40,292,593 33,638,511 7,897,131
15,059,588 - - 9,509,588 5,550,000
1,750,000 800,000 800,000 150,000 -
65,818,647 - 39,492,593 23,978,923 2,347,131372,627,284 93,251,000 159,664,301 86,291,673 33,420,310372,627,284 93,251,000 159,664,301 86,291,673 33,420,310
8,603,523 - 275,000 7,944,523 384,000
8,603,523 - 275,000 7,944,523 384,000229,661,466 6,279,630 42,381,228 170,402,759 10,597,849178,799,180 - 11,956,612 160,206,487 6,636,081
3,957,314 - 3,317,267 629,172 10,87542,841,591 6,279,630 26,894,384 6,667,577 3,000,000
4,063,381 - 212,965 2,899,523 950,893268,313,553 23,250,000 66,584,179 136,344,098 42,135,27633,555,043 - - 33,398,813 156,230
209,965,177 23,000,000 65,650,846 88,085,285 33,229,04624,793,333 250,000 933,333 14,860,000 8,750,000
162,970,742 140,336,097 2,210,879 5,099,736 15,324,030162,970,742 140,336,097 2,210,879 5,099,736 15,324,030
2,904,964,152 103,763,776 1,348,604,992 1,373,448,105 79,147,2802,896,461,174 103,763,776 1,346,954,992 1,371,516,187 74,226,220
8,502,978 - 1,650,000 1,931,918 4,921,060
Group Total 1711 Prepa. & spinning of Textiles fibres, weaving of textiles 1712 Finishing of Textiles
171 Spinning, weaving and finishing ofTextiles
Group Total 1723 Manu.of Cordage, Rope, twine & netting
1726 Manu. of Laces and embroidered cloths
1727 Manu. of Labels, badges (cloth based)
172 Manu.of other Textiles
Group Total 1731 Manufacture of knitted Garments
1732 Manufacture of knitted socks, purses and Hand glouses
1739 Elastomeric Yarn & other rubber thread based products
173 Manu.of knitted and crocheted fabricsand articles
Group Total 1810 Manufacture of weaving Apparel, except fur apparels
181 Manu.of weaving Apparel except furapparels
Group Total 1820 Dressing and dyeing of fur, manu. articles of fur
182 Dressing and dyeing of fur,manufacture articles of fur
Group Total 1911 Tanning and dressing of leather
1912 Manu.of luggage, hand bags
1913 Manu. of Bags & rain coats, artificial leather product
191 Tanning & dressing of leather; manu.of luggage, Hand bags, saddlery & harness
Group Total 1920 Manufacturing of footwear
192 Manu.of footwear
Group Total 2010 Saw-milling and planning of wood
201 Saw-milling and planning of wood
Group Total 2021 Manu.of veneer sheets, plywood, lamin board, particle board
2023 Manufacture of wooden containers
2025 Manu.of Household utencils of other wooden article and ornaments 2026 Manu.of tools, coffins, other equipments used in funeral
202 Manu.of produ. of wood, cork, straw &plaiting material
Group Total 2101 Manufacture of pulp, paper and paperboards
2102 Manu.of corrugated paper & paperboard & containers of paper 2103 Manufacture of cards, files, books and pads
210 Manu.of paper and paper products
Group Total 2212 Publishing of newspapers, journals and periodicals
221 Publishing, printing and reproductionof recorded media
Group Total 2221 Printing of newspapers, journals & periodicals for others 2222 Service activities related to printing
222 Printing & service activities related toprinting for others
Type of industry Total (Rs.) Land (Rs.) Building (Rs.) Mechinery (Rs.)Transport
(Rs.)
(cont.)

Table 26 : Value of gross additions to the fixed assets during the year classified by industry - 2011(Establishment with 25 or more persons engaged)
11,632,352 - - 11,632,352 -11,632,352 - - 11,632,352 -
699,548,689 538,991,332 80,997,500 34,709,357 44,850,500699,548,689 538,991,332 80,997,500 34,709,357 44,850,500199,772,004 - 32,735,729 77,099,239 89,937,03650,955,000 - 10,409,000 14,418,000 26,128,000
81,423,480 - 22,326,729 32,019,091 27,077,660
19,490,183 - - 19,490,183 -
47,903,341 - - 11,171,965 36,731,376444,283,990 42,900,000 98,745,207 186,144,311 116,494,472
112,820,000 - 10,443,000 100,110,000 2,267,000
156,657,484 - 28,938,924 48,138,302 79,580,258
116,153,181 - 52,955,623 31,523,794 31,673,764
7,687,000 - 2,100,000 4,017,000 1,570,000
260,000 - 260,000 - -49,812,075 42,900,000 3,600,410 1,908,215 1,403,450
894,250 - 447,250 447,000 -906,469,418 45,369,708 221,190,216 484,726,858 155,182,636365,665,118 4,506,400 8,179,409 304,999,277 47,980,032130,010,266 1,995,000 16,639,292 110,960,974 415,000389,705,556 38,868,308 195,682,828 59,139,451 96,014,968
21,088,479 - 688,687 9,627,156 10,772,636664,622,992 75,072,522 63,222,140 492,591,245 33,737,086664,622,992 75,072,522 63,222,140 492,591,245 33,737,086
2,237,571,547 184,931,363 397,783,500 1,541,825,055 113,031,62938,169,204 - 1,246,068 21,586,108 15,337,028
1,658,748,278 178,825,500 201,036,686 1,244,052,692 34,833,400471,962,145 5,863 193,909,233 234,913,973 43,133,076
41,643,941 - 1,391,513 30,274,303 9,978,12513,220,254 100,000 200,000 9,770,254 3,150,000
13,827,725 6,000,000 - 1,227,725 6,600,0003,151,586,120 1,984,000 12,911,500 3,120,806,914 15,883,7063,151,586,120 1,984,000 12,911,500 3,120,806,914 15,883,706
324,829,362 63,796,250 95,843,609 126,685,578 38,503,925
55,685,520 - 12,413,256 40,975,969 2,296,295269,143,842 63,796,250 83,430,353 85,709,609 36,207,630
Group Total 2230 Reproduction of recorded media
223 Reproduction of recorded media
Group Total 2320 Manu.of refined petroleum products
232 Manu.of refined petroleum products
Group Total 2411 Manu.of basic chemicals,(except fertilizres & nitrogen
2412 Manu.of fertilizer & nitrogen compounds
2413 Manu.of plastic in primary forms and synthetic rubber
2414 Manu.of Natural carbonic fertilizers
241 Manu.of basic chemicals
Group Total 2421 Manu.of pesticides and other agro-chemical products
2422 Manu.of paints, varnishes & similar coatings, printing ink
2423 Manu.of parmaceuticals, medicinal chemicals & botanical products
2424 Manu.of soap & detergent, cleaning, perfumies & toilet preparations
2425 Manu.of explosives, crackers and other firework
2427 Manu.of processed salt (for food) 2428 Manu.of chemicals and activated carbon
242 Manu.of other chemical products
Group Total 2511 Manu.of rubber tyres and tubes, rebuilding of rubber tyres 2512 Manu.of rubber condoms, rubber gloves 2513 Manu.of product from natural rubber 2519 Manu.of rubber products (not classified elsewhere)
251 Manu.of rubber products
Group Total 2520 Manu.of plastic products
252 Manu.of plastic products
Group Total 2691 Manu.of non-structural non-refractory ceramic ware
2693 Manu.of structural non refractory clay & ceramic products 2694 Manu.of cement lime, and plaster 2695 Manu.of articles of concrete, cement & plaster
2696 Cutting, shaping & finishing of rough stones 2697 Refining of Ilmanite, surcon & refinding of plumbago
269 Manu.of Non metallic mineralproducts(n.e.c.)
Group Total 2710 Manu.of basic iron & steel
271 Manu.of basic iron & steel
Group Total 2731 Casting of iron & steel
2732 Casting of Non ferrous metals
273 Casting of metals
Type of industry Total (Rs.) Land (Rs.) Building (Rs.) Mechinery (Rs.)Transport
(Rs.)
(cont.)
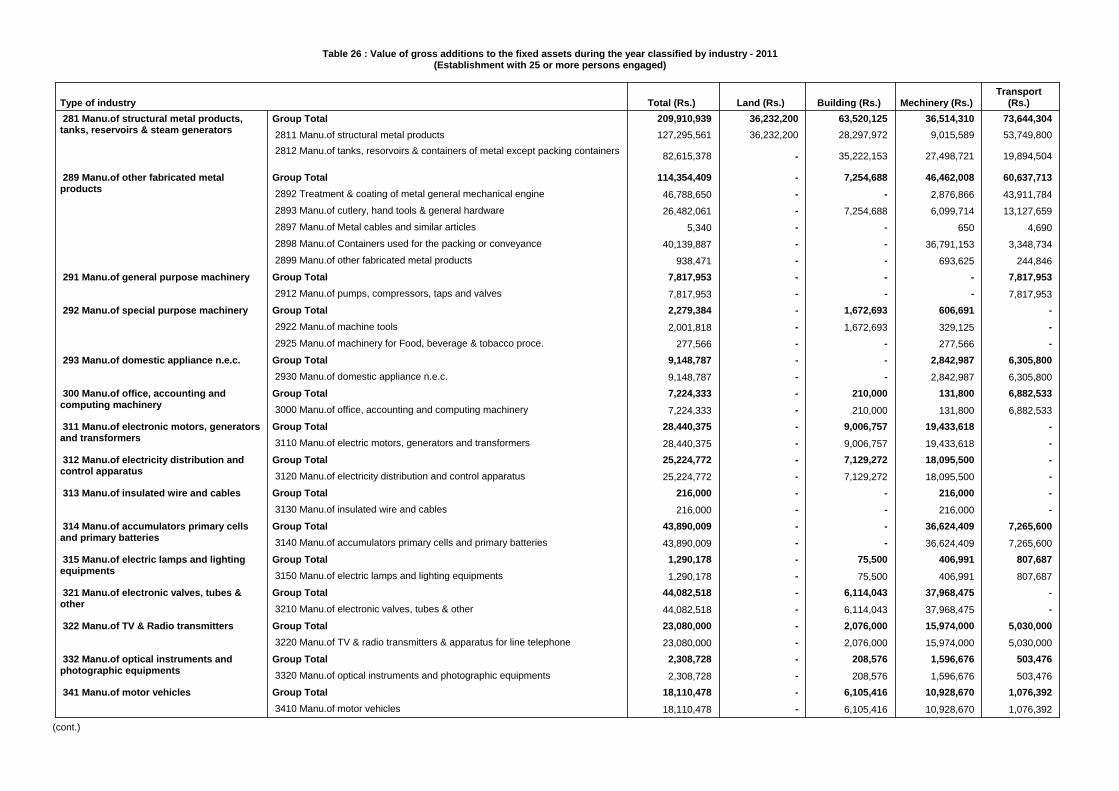
Table 26 : Value of gross additions to the fixed assets during the year classified by industry - 2011(Establishment with 25 or more persons engaged)
209,910,939 36,232,200 63,520,125 36,514,310 73,644,304127,295,561 36,232,200 28,297,972 9,015,589 53,749,800
82,615,378 - 35,222,153 27,498,721 19,894,504
114,354,409 - 7,254,688 46,462,008 60,637,713
46,788,650 - - 2,876,866 43,911,784
26,482,061 - 7,254,688 6,099,714 13,127,659
5,340 - - 650 4,690
40,139,887 - - 36,791,153 3,348,734
938,471 - - 693,625 244,8467,817,953 - - - 7,817,953
7,817,953 - - - 7,817,9532,279,384 - 1,672,693 606,691 -
2,001,818 - 1,672,693 329,125 -277,566 - - 277,566 -
9,148,787 - - 2,842,987 6,305,8009,148,787 - - 2,842,987 6,305,8007,224,333 - 210,000 131,800 6,882,533
7,224,333 - 210,000 131,800 6,882,53328,440,375 - 9,006,757 19,433,618 -
28,440,375 - 9,006,757 19,433,618 -25,224,772 - 7,129,272 18,095,500 -25,224,772 - 7,129,272 18,095,500 -
216,000 - - 216,000 -216,000 - - 216,000 -
43,890,009 - - 36,624,409 7,265,600
43,890,009 - - 36,624,409 7,265,6001,290,178 - 75,500 406,991 807,687
1,290,178 - 75,500 406,991 807,68744,082,518 - 6,114,043 37,968,475 -
44,082,518 - 6,114,043 37,968,475 -23,080,000 - 2,076,000 15,974,000 5,030,00023,080,000 - 2,076,000 15,974,000 5,030,0002,308,728 - 208,576 1,596,676 503,476
2,308,728 - 208,576 1,596,676 503,47618,110,478 - 6,105,416 10,928,670 1,076,392
18,110,478 - 6,105,416 10,928,670 1,076,392
Group Total 2811 Manu.of structural metal products 2812 Manu.of tanks, resorvoirs & containers of metal except packing containers
281 Manu.of structural metal products,tanks, reservoirs & steam generators
Group Total 2892 Treatment & coating of metal general mechanical engine
2893 Manu.of cutlery, hand tools & general hardware
2897 Manu.of Metal cables and similar articles
2898 Manu.of Containers used for the packing or conveyance
2899 Manu.of other fabricated metal products
289 Manu.of other fabricated metalproducts
Group Total 2912 Manu.of pumps, compressors, taps and valves
291 Manu.of general purpose machinery
Group Total 2922 Manu.of machine tools
2925 Manu.of machinery for Food, beverage & tobacco proce.
292 Manu.of special purpose machinery
Group Total 2930 Manu.of domestic appliance n.e.c.
293 Manu.of domestic appliance n.e.c.
Group Total 3000 Manu.of office, accounting and computing machinery
300 Manu.of office, accounting andcomputing machinery
Group Total 3110 Manu.of electric motors, generators and transformers
311 Manu.of electronic motors, generatorsand transformers
Group Total 3120 Manu.of electricity distribution and control apparatus
312 Manu.of electricity distribution andcontrol apparatus
Group Total 3130 Manu.of insulated wire and cables
313 Manu.of insulated wire and cables
Group Total 3140 Manu.of accumulators primary cells and primary batteries
314 Manu.of accumulators primary cellsand primary batteries
Group Total 3150 Manu.of electric lamps and lighting equipments
315 Manu.of electric lamps and lightingequipments
Group Total 3210 Manu.of electronic valves, tubes & other
321 Manu.of electronic valves, tubes &other
Group Total 3220 Manu.of TV & radio transmitters & apparatus for line telephone
322 Manu.of TV & Radio transmitters
Group Total 3320 Manu.of optical instruments and photographic equipments
332 Manu.of optical instruments andphotographic equipments
Group Total 3410 Manu.of motor vehicles
341 Manu.of motor vehicles
Type of industry Total (Rs.) Land (Rs.) Building (Rs.) Mechinery (Rs.)Transport
(Rs.)
(cont.)

Table 26 : Value of gross additions to the fixed assets during the year classified by industry - 2011(Establishment with 25 or more persons engaged)
204,085 - - 204,085 -204,085 - - 204,085 -
39,882,331 - 1,205,995 38,383,616 292,720
39,869,295 - 1,205,995 38,370,580 292,720
13,036 - - 13,036 -21,097,154 - 8,823,806 8,659,348 3,614,000
21,097,154 - 8,823,806 8,659,348 3,614,000220,251,669 26,000,000 27,915,254 143,017,891 23,318,524220,251,669 26,000,000 27,915,254 143,017,891 23,318,524603,294,506 48,105,568 136,168,662 334,340,420 84,679,857
106,866,081 - 12,952,436 47,580,564 46,333,081
34,381,601 - - 32,102,864 2,278,737462,046,824 48,105,568 123,216,226 254,656,992 36,068,039
367,750 - - 367,750 -
367,750 - - 367,750 -17,733,000,000 55,000,000 15,692,000,000 557,000,000 1,429,000,00017,733,000,000 55,000,000 15,692,000,000 557,000,000 1,429,000,00012,780,910,000 221,396,000 4,562,524,000 7,965,775,000 31,215,00012,780,910,000 221,396,000 4,562,524,000 7,965,775,000 31,215,000
146,100,473,867 2,538,864,264 91,298,751,032 47,048,548,832 5,214,309,739
Group Total 3430 Manu.of spare parts and accessories for motor vehicles
343 Manu.of spare parts and accessoriesfor motor vehicles
Group Total 3511 Building and repairing of ships
3512 Building and repairing of pleasure & sporting boats
351 Building and repairing of ships andboats
Group Total 3592 Manu.of bicycles & invalid carraiges
359 Manu.of transport equipment n.e.c.
Group Total 3610 Manu.of furniture
361 Manu.of furniture
Group Total 3691 Manu.of jewellery and related articles
3694 Manu.of toys & games
3699 Other manufacturing not elsewhere classified
369 Manu.of other product not elsewhereclassified
Group Total 3710 Reycycling of metal waste and scrap
371 Recycling of metal waste and scrap
Group Total 4010 Production, collection & distribution of electricity
401 Production, collection & distributionof electricity
Group Total 4100 Collection, purification and distribution of water
410 Collection, purification anddistribution of water
Total
Type of industry Total (Rs.) Land (Rs.) Building (Rs.) Mechinery (Rs.)Transport
(Rs.)
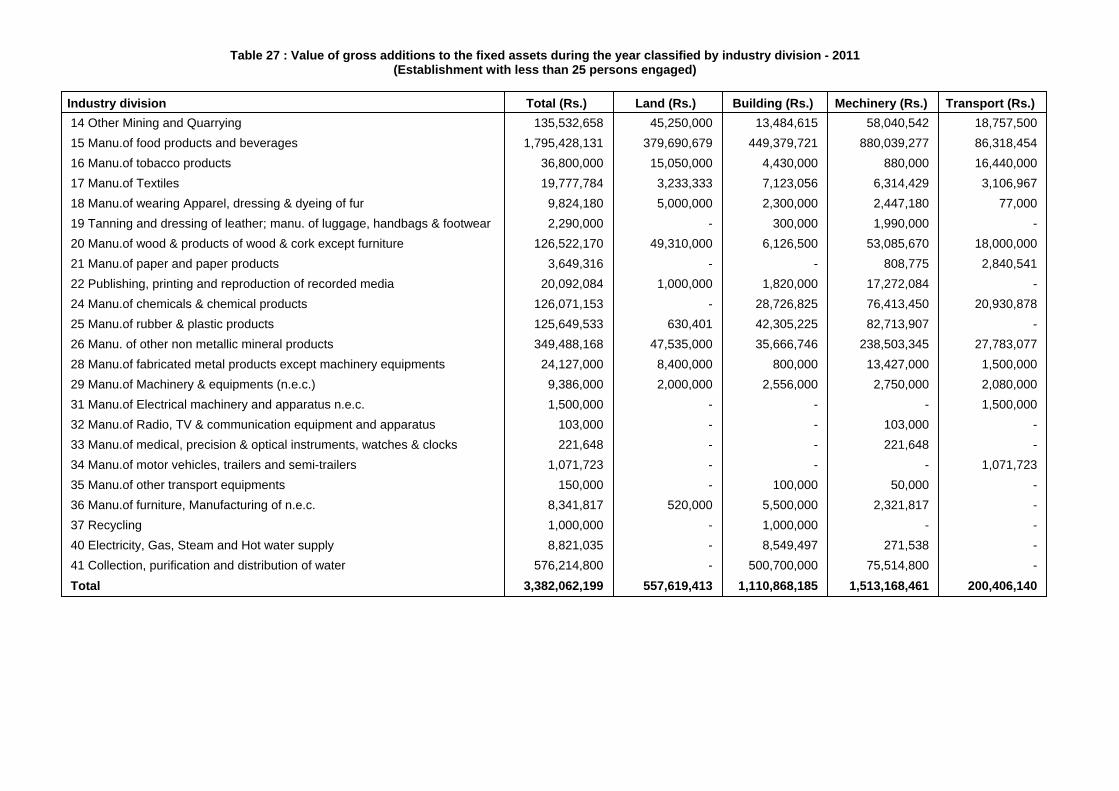
Table 27 : Value of gross additions to the fixed assets during the year classified by industry division - 2011(Establishment with less than 25 persons engaged)
135,532,658 45,250,000 13,484,615 58,040,542 18,757,5001,795,428,131 379,690,679 449,379,721 880,039,277 86,318,454
36,800,000 15,050,000 4,430,000 880,000 16,440,00019,777,784 3,233,333 7,123,056 6,314,429 3,106,967
9,824,180 5,000,000 2,300,000 2,447,180 77,0002,290,000 - 300,000 1,990,000 -
126,522,170 49,310,000 6,126,500 53,085,670 18,000,0003,649,316 - - 808,775 2,840,541
20,092,084 1,000,000 1,820,000 17,272,084 -126,071,153 - 28,726,825 76,413,450 20,930,878125,649,533 630,401 42,305,225 82,713,907 -349,488,168 47,535,000 35,666,746 238,503,345 27,783,077
24,127,000 8,400,000 800,000 13,427,000 1,500,0009,386,000 2,000,000 2,556,000 2,750,000 2,080,0001,500,000 - - - 1,500,000
103,000 - - 103,000 -221,648 - - 221,648 -
1,071,723 - - - 1,071,723150,000 - 100,000 50,000 -
8,341,817 520,000 5,500,000 2,321,817 -1,000,000 - 1,000,000 - -8,821,035 - 8,549,497 271,538 -
576,214,800 - 500,700,000 75,514,800 -3,382,062,199 557,619,413 1,110,868,185 1,513,168,461 200,406,140
14 Other Mining and Quarrying 15 Manu.of food products and beverages 16 Manu.of tobacco products 17 Manu.of Textiles 18 Manu.of wearing Apparel, dressing & dyeing of fur 19 Tanning and dressing of leather; manu. of luggage, handbags & footwear 20 Manu.of wood & products of wood & cork except furniture 21 Manu.of paper and paper products 22 Publishing, printing and reproduction of recorded media 24 Manu.of chemicals & chemical products 25 Manu.of rubber & plastic products 26 Manu. of other non metallic mineral products 28 Manu.of fabricated metal products except machinery equipments 29 Manu.of Machinery & equipments (n.e.c.) 31 Manu.of Electrical machinery and apparatus n.e.c. 32 Manu.of Radio, TV & communication equipment and apparatus 33 Manu.of medical, precision & optical instruments, watches & clocks 34 Manu.of motor vehicles, trailers and semi-trailers 35 Manu.of other transport equipments 36 Manu.of furniture, Manufacturing of n.e.c. 37 Recycling 40 Electricity, Gas, Steam and Hot water supply 41 Collection, purification and distribution of water Total
Industry division Total (Rs.) Land (Rs.) Building (Rs.) Mechinery (Rs.) Transport (Rs.)

Table 28 : Economic indicators of industrial activity classified by industry class - 2011(Establishmets with 25 or more persons engaged)
1,407,789 2 1 790,427 1 0568,939 3 3 358,918 2 2
3,305,310 1 1 275,323 0 01,713,994 7 9 1,474,812 6 8
482,482 4 1 350,997 3 1180,835 7 33 154,397 6 28
1,614,256 4 2 1,162,628 3 12,808,685 2 36 1,486,081 1 197,425,393 3 33 4,485,700 2 202,753,182 2 0 1,252,928 1 02,688,018 1 17 823,822 0 5
11,701,279 1 20 3,152,989 0 533,983,689 1 11 8,036,753 0 326,864,392 2 11 12,330,111 1 5
350,000 3 . 240,810 2 .3,075,499 2 7 1,829,951 1 4
22,464,745 3 3 14,705,777 2 21,976,330 2 8 801,100 1 33,346,421 2 19 1,671,750 1 103,637,052 2 8 1,731,829 1 43,871,476 2 9 1,790,888 1 4
737,358 2 2 343,847 1 11,069,386 2 4 513,892 1 28,559,114 2 12 4,447,610 1 6
859,993 1 1 118,915 0 026,400,275 2 5 15,108,589 1 3
3,266,696 2 24 1,566,220 1 11564,112 3 8 401,963 2 6
1411 Quarrying of stone Clay and Sand 1412 Braking of Granite 1413 Quarrying of Sand & Gravel 1421 Mining of chemical and Fertilizer minerals 1422 Extraction of salt 1423 Mining of precious and semi precious stones 1429 Other Mining & Quarrying N.e.c 1511 Processing and Preserving of Meat and Meat Product 1512 Processing and Preserving of fish and fish Products 1513 Processing & Preserving of fruits & Vegetables 1514 Manufacture of Vegetable oils animal oils & fats 1520 Manufacture of Dairy Products 1531 Manufacture of Grain Mill Products 1533 Preparation of Animal food from milling waist 1538 Packeting of Cereal, grains, yarm and their preparations 1541 Manufacture of bakery products 1542 Manufacture of Cane sugar and molasses 1543 Manu.of cocoa, chocolate and sugar confectionary 1544 Manu.of macaroni, noodles couscous and similar farinaceous 1546 Manu.of tea and tea products 1547 Manu.of chilly-power, condiments powder, proce.of spices 1548 Manu.of viniger and similar products 1549 Manu.of other food products n.e.c 1551 Manufacture of beverages 1552 Manu.of wine, bottled toddy and similar products 1553 Manu.of all other beverages such as beer and stout 1554 Manu.of beverages such as soft drinks, soda etc 1601 Manu.of tabacco products
Industry classOutput per
Personengaged
Outputper Input
Output perAssets (endof the year)
Value addedper Person
engagedValue added
per Input
Value addedper Assets(end of the
year)

Table 28 : Economic indicators of industrial activity classified by industry class - 2011(Establishmets with 25 or more persons engaged)
51,662,797 26 2,837 49,685,983 25 2,728543,007 3 15 337,282 2 10
2,400,906 1 3 662,683 0 14,157,769 2 7 2,144,908 1 4
888,393 2 7 432,243 1 3735,699 2 54 300,202 1 22
2,041,509 1 7 519,528 0 2257,991 2 1 143,771 1 1
1,567,977 3 1 1,078,698 2 11,340,366 2 2 713,791 1 1
406,931 3 . 259,663 2 .1,515,944 2 5 690,898 1 21,021,963 2 2 476,085 1 12,187,090 2 7 906,179 1 32,594,670 2 2 1,324,306 1 11,324,921 2 10 597,981 1 4
942,980 3 1 606,153 2 11,929,909 1 1 431,865 0 0
363,889 2 0 206,970 1 01,749,665 1 8 350,951 0 21,163,549 2 5 389,616 1 21,212,892 2 11 548,641 1 53,634,979 1 1 566,551 0 0
508,151 2 1 304,828 1 11,205,307 3 4 743,015 2 31,722,294 3 2 1,047,787 2 11,326,985 2 4 553,071 1 2
498,462 2 . 259,185 1 .
1602 Manu.of Cigarette, Cigar & Beedi 1609 Tobacco based products 1711 Prepa. & spinning of Textiles fibres, weaving of textiles 1712 Finishing of Textiles 1721 Manu.of made-up textile article, except apparel 1722 Manu.of carpets and rugs 1723 Manu.of Cordage, Rope, twine & netting 1724 Manufacture of Sanitary Towels & Pampers 1726 Manu. of Laces and embroidered cloths 1727 Manu. of Labels, badges (cloth based) 1729 Cloth and coir based other products 1731 Manufacture of knitted Garments 1732 Manufacture of knitted socks, purses and Hand glouses 1733 Manufacture of Knitted Lace 1739 Elastomeric Yarn & other rubber thread based products 1810 Manufacture of weaving Apparel, except fur apparels 1820 Dressing and dyeing of fur, manu. articles of fur 1911 Tanning and dressing of leather 1912 Manu.of luggage, hand bags 1913 Manu. of Bags & rain coats, artificial leather product 1920 Manufacturing of footwear 2010 Saw-milling and planning of wood 2021 Manu.of veneer sheets, plywood, lamin board, particle 2022 Manufacture of builders carpentry and joinery 2023 Manufacture of wooden containers 2025 Manu.of Household utencils of other wooden article and ornaments 2026 Manu.of tools, coffins, other equipments used in funeral 2029 Manu.of all kinds of other wood products
Industry classOutput per
Personengaged
Outputper Input
Output perAssets (endof the year)
Value addedper Person
engagedValue added
per Input
Value addedper Assets(end of the
year)

Table 28 : Economic indicators of industrial activity classified by industry class - 2011(Establishmets with 25 or more persons engaged)
2,603,654 2 24 1,455,215 1 133,254,384 2 5 1,476,610 1 2
696,960 2 2 339,994 1 1765,603 2 . 258,919 1 .839,919 2 10 411,088 1 5944,052 1 1 270,740 0 0
5,430,272 2 . 2,329,837 1 .2,380,916 2 3 807,212 1 1
763,494 3 2 529,151 2 11,192,238 1 6 293,963 0 22,734,873 37 20 2,660,111 36 19
68,781,599 1 60 1,896,118 0 216,708,553 2 45 6,433,121 1 1716,651,150 2 23 5,865,678 1 8
5,842,588 2 13 2,003,932 1 524,904,903 1 6 5,367,137 0 1
8,719,383 1 9 1,949,611 0 23,784,607 1 10 949,234 0 21,860,789 2 4 724,308 1 12,083,242 2 11 716,528 1 42,103,913 2 1,262 1,218,476 1 731
440,376 3 64 277,752 2 40326,027 8 0 285,021 7 0
4,618,893 1 15 757,384 0 33,725,413 2 8 1,978,387 1 42,887,040 2 13 965,529 1 42,472,993 2 11 1,133,564 1 5
837,004 2 11 433,658 1 6
2101 Manufacture of pulp, paper and paperboards 2102 Manu.of corrugated paper & paperboard & containers of paper 2103 Manufacture of cards, files, books and pads 2109 Manu.of pulp paper and paper boards articles n.e.c 2211 Publishing of books, broachers, musical books 2212 Publishing of newspapers, journals and periodicals 2219 Other publishing 2221 Printing of newspapers, journals & periodicals for others 2222 Service activities related to printing 2223 Photocopies, computer print out etc. 2230 Reproduction of recorded media 2320 Manu.of refined petroleum products 2411 Manu.of basic chemicals,(except fertilizres & nitrogen 2412 Manu.of fertilizer & nitrogen compounds 2413 Manu.of plastic in primary forms and synthetic rubber 2414 Manu.of Natural carbonic fertilizers 2421 Manu.of pesticides and other agro-chemical products 2422 Manu.of paints, varnishes & similar coatings, printing ink 2423 Manu.of parmaceuticals, medicinal chemicals & botanical products 2424 Manu.of soap & detergent, cleaning, perfumies & toilet preparations 2425 Manu.of explosives, crackers and other firework 2426 Manu.of mosquito-coils, camphor, napthaline balls, incense sticks 2427 Manu.of processed salt (for food) 2428 Manu.of chemicals and activated carbon 2511 Manu.of rubber tyres and tubes, rebuilding of rubber tyres 2512 Manu.of rubber condoms, rubber gloves 2513 Manu.of product from natural rubber 2514 Manu.of article of rubber
Industry classOutput per
Personengaged
Outputper Input
Output perAssets (endof the year)
Value addedper Person
engagedValue added
per Input
Value addedper Assets(end of the
year)

Table 28 : Economic indicators of industrial activity classified by industry class - 2011(Establishmets with 25 or more persons engaged)
2,025,664 2 17 744,978 1 62,170,228 2 5 781,968 1 27,317,661 2 . 3,909,876 1 .1,395,261 2 10 668,000 1 52,189,787 2 2 918,370 1 1
28,280,839 2 5 12,695,432 1 26,657,415 2 11 2,483,981 1 4
810,965 3 7 531,381 2 51,035,576 3 2 706,548 2 14,526,963 4 . 3,330,736 3 .
11,244,495 1 2 1,968,161 0 014,585,500 1 . 4,359,520 0 .
8,167,047 1 22 1,866,579 0 54,786,691 1 5 1,126,566 0 12,246,112 2 6 913,386 1 3
1,871,217 2 2 1,082,886 1 1
1,105,485 2 2 530,398 1 11,339,016 2 6 640,952 1 31,323,557 19 . 1,253,819 18 .2,554,242 1 . 583,334 0 .
626,130 4 . 485,312 3 .9,223,905 1 8,208 1,983,274 0 1,7651,440,996 1 1 404,191 0 01,216,674 2 21 563,648 1 10
310,811 5 . 252,757 4 .3,475,718 2 8 1,720,018 1 42,362,435 2 . 1,145,917 1 .
2519 Manu.of rubber products (not classified elsewhere) 2520 Manu.of plastic products 2610 Manu.of glass and glass products 2691 Manu.of non-structural non-refractory ceramic ware 2693 Manu.of structural non refractory clay & ceramic products 2694 Manu.of cement lime, and plaster 2695 Manu.of articles of concrete, cement & plaster 2696 Cutting, shaping & finishing of rough stones 2697 Refining of Ilmanite, surcon & refinding of plumbago 2699 Manu.of other non-metalic mineral products n.e.c 2710 Manu.of basic iron & steel 2720 Manu.of basic precious & non-ferrous metal 2731 Casting of iron & steel 2732 Casting of Non ferrous metals 2811 Manu.of structural metal products 2812 Manu.of tanks, resorvoirs & containers of metal except packing containers
2892 Treatment & coating of metal general mechanical engine 2893 Manu.of cutlery, hand tools & general hardware 2894 Manu.of other brass articles 2895 Manu.of non threaded metal products 2896 Manu.of Metal cooking utensils, household appliances & sanitary articles 2897 Manu.of Metal cables and similar articles 2898 Manu.of Containers used for the packing or conveyance 2899 Manu.of other fabricated metal products 2911 Manu.of engine and turbines, except aircraft, vehicle 2912 Manu.of pumps, compressors, taps and valves 2919 Manu.of other general purpose machinery
Industry classOutput per
Personengaged
Outputper Input
Output perAssets (endof the year)
Value addedper Person
engagedValue added
per Input
Value addedper Assets(end of the
year)

Table 28 : Economic indicators of industrial activity classified by industry class - 2011(Establishmets with 25 or more persons engaged)
1,327,875 2 . 586,221 1 .471,466 2 1 192,292 1 0413,561 2 . 228,705 1 .
1,787,071 1 . 443,625 0 .685,565 1 2 197,843 0 1
4,427,781 2 . 2,135,738 1 .457,821 2 . 194,597 1 .
4,605,237 2 6 2,094,327 1 3757,918 5 118 605,165 4 94
5,096,661 2 15 1,997,365 1 63,545,972 1 11 1,144,990 0 33,115,378 2 102 1,796,522 1 59
10,016,294 1 7 2,791,913 0 21,039,511 1 2 317,893 0 14,775,448 1 9 1,485,947 0 32,771,926 2 11 972,829 1 4
480,116 2 4 192,384 1 21,081,025 5 4 871,456 4 33,779,603 2 6 1,489,363 1 2
737,653 2 27 266,949 1 105,573,224 4 369 4,159,987 3 2755,090,320 2 46 2,826,736 1 261,271,789 1 35 405,123 0 113,989,503 1 7 744,367 0 13,504,188 2 8 1,843,642 1 42,469,203 2 12 1,193,311 1 6
775,000 2 . 428,429 1 .814,817 2 3 410,893 1 2
2921 Manu.of agricultural & forestry machinery 2922 Manu.of machine tools 2923 Manu.of machinery for metallurgy 2924 Manu.of machinery for mining, quarrying & construction 2925 Manu.of machinery for Food, beverage & tobacco proce. 2926 Manu.of machinery for textile, apparel & leather products 2929 Manu.of other special purpose machinery (n.e.c.) 2930 Manu.of domestic appliance n.e.c. 3000 Manu.of office, accounting and computing machinery 3110 Manu.of electric motors, generators and transformers 3120 Manu.of electricity distribution and control apparatus 3130 Manu.of insulated wire and cables 3140 Manu.of accumulators primary cells and primary batteries 3150 Manu.of electric lamps and lighting equipments 3210 Manu.of electronic valves, tubes & other 3220 Manu.of TV & radio transmitters & apparatus for line telephone 3230 Manu.of TV & radio receivers sound or video recording 3320 Manu.of optical instruments and photographic equipment 3410 Manu.of motor vehicles 3420 Manu.of bodies for Motor vehicles, Manu. of trailers & semi-trailers 3430 Manu.of spare parts and accessories for motor vehicles 3511 Building and repairing of ships 3512 Building and repairing of pleasure & sporting boats 3592 Manu.of bicycles & invalid carraiges 3610 Manu.of furniture 3691 Manu.of jewellery and related articles 3693 Manu.of sports goods 3694 Manu.of toys & games
Industry classOutput per
Personengaged
Outputper Input
Output perAssets (endof the year)
Value addedper Person
engagedValue added
per Input
Value addedper Assets(end of the
year)

Table 28 : Economic indicators of industrial activity classified by industry class - 2011(Establishmets with 25 or more persons engaged)
1,529,016 2 5 673,916 1 211,379,867 1 13 3,278,659 0 4
2,132,420 1 12 218,288 0 115,388,103 2 1 8,266,120 1 0
1,386,665 5 0 1,103,099 4 0
3699 Other manufacturing not elsewhere classified 3710 Reycycling of metal waste and scrap 3720 Reycycling of non-metal waste and scrap 4010 Production, collection & distribution of electricity 4100 Collection, purification and distribution of water
Industry classOutput per
Personengaged
Outputper Input
Output perAssets (endof the year)
Value addedper Person
engagedValue added
per Input
Value addedper Assets(end of the
year)
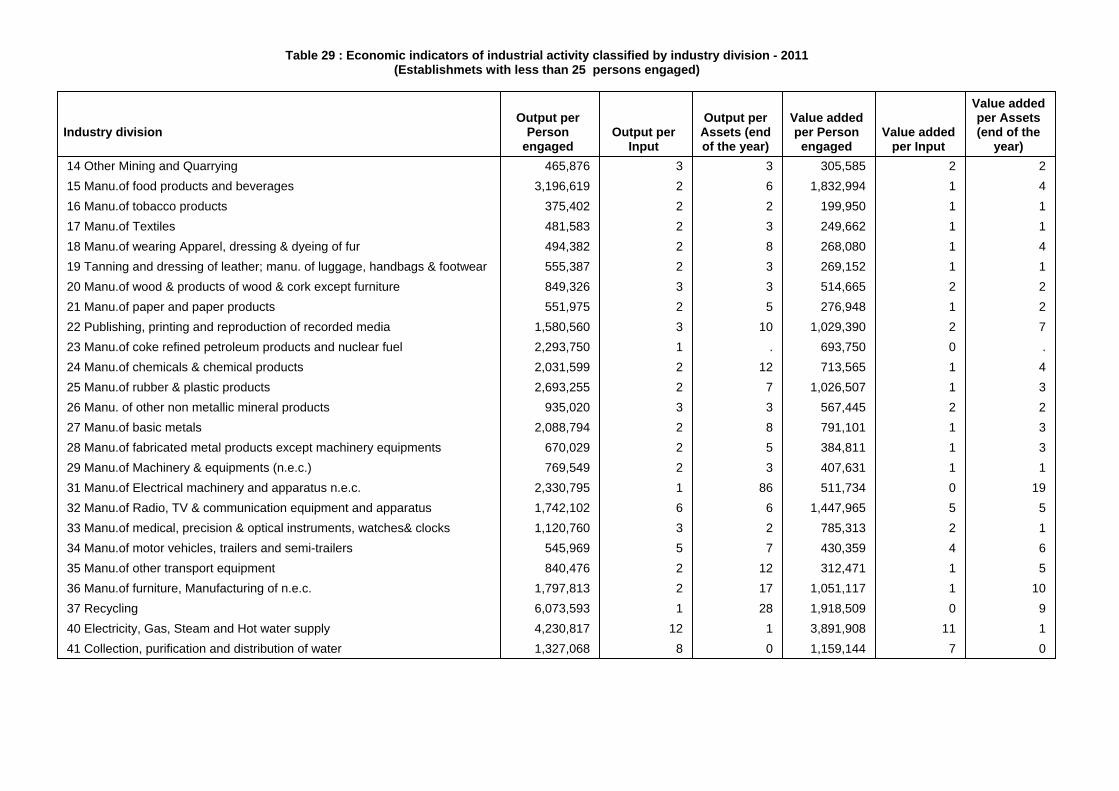
Table 29 : Economic indicators of industrial activity classified by industry division - 2011(Establishmets with less than 25 persons engaged)
465,876 3 3 305,585 2 23,196,619 2 6 1,832,994 1 4
375,402 2 2 199,950 1 1481,583 2 3 249,662 1 1494,382 2 8 268,080 1 4555,387 2 3 269,152 1 1849,326 3 3 514,665 2 2551,975 2 5 276,948 1 2
1,580,560 3 10 1,029,390 2 72,293,750 1 . 693,750 0 .2,031,599 2 12 713,565 1 42,693,255 2 7 1,026,507 1 3
935,020 3 3 567,445 2 22,088,794 2 8 791,101 1 3
670,029 2 5 384,811 1 3769,549 2 3 407,631 1 1
2,330,795 1 86 511,734 0 191,742,102 6 6 1,447,965 5 51,120,760 3 2 785,313 2 1
545,969 5 7 430,359 4 6840,476 2 12 312,471 1 5
1,797,813 2 17 1,051,117 1 106,073,593 1 28 1,918,509 0 94,230,817 12 1 3,891,908 11 11,327,068 8 0 1,159,144 7 0
14 Other Mining and Quarrying 15 Manu.of food products and beverages 16 Manu.of tobacco products 17 Manu.of Textiles 18 Manu.of wearing Apparel, dressing & dyeing of fur 19 Tanning and dressing of leather; manu. of luggage, handbags & footwear 20 Manu.of wood & products of wood & cork except furniture 21 Manu.of paper and paper products 22 Publishing, printing and reproduction of recorded media 23 Manu.of coke refined petroleum products and nuclear fuel 24 Manu.of chemicals & chemical products 25 Manu.of rubber & plastic products 26 Manu. of other non metallic mineral products 27 Manu.of basic metals 28 Manu.of fabricated metal products except machinery equipments 29 Manu.of Machinery & equipments (n.e.c.) 31 Manu.of Electrical machinery and apparatus n.e.c. 32 Manu.of Radio, TV & communication equipment and apparatus 33 Manu.of medical, precision & optical instruments, watches& clocks 34 Manu.of motor vehicles, trailers and semi-trailers 35 Manu.of other transport equipment 36 Manu.of furniture, Manufacturing of n.e.c. 37 Recycling 40 Electricity, Gas, Steam and Hot water supply 41 Collection, purification and distribution of water
Industry divisionOutput per
Personengaged
Output perInput
Output perAssets (endof the year)
Value addedper Person
engagedValue added
per Input
Value addedper Assets(end of the
year)

Table 30 : Principal indicators of industrial activity classified by investment size class - 2011(Establishments with 25 or more persons engaged)
4,666 4,610 852,411,966 4,335,779,035 1,574,189,241 2,761,589,794 2,710,670,244827 813 110,058,488 336,866,318 104,148,938 232,717,380 170,00027 0 0 2,000,000 450,000 1,550,000 6,000
253 244 20,768,000 93,627,431 12,727,214 80,900,218 8,00035 35 5,129,764 30,341,803 5,565,121 24,776,681 2,140,193
941 941 238,375,154 838,498,375 286,371,097 552,127,278 105,024,554497 491 36,190,941 581,039,260 272,889,899 308,149,361 50,412,640446 446 139,303,365 1,093,880,196 315,517,307 778,362,889 101,031,443
1,640 1,640 302,586,254 1,359,525,652 576,519,665 783,005,987 2,451,877,41499,578 99,002 19,541,713,428 532,486,602,750 314,056,484,997 218,430,117,753 91,987,756,95549,745 49,595 9,583,581,920 264,159,882,775 154,910,314,418 109,249,568,357 8,809,490
119 115 18,257,905 70,847,345 14,017,003 56,830,341 -416 416 61,441,657 922,028,894 357,177,430 564,851,464 1,913,364
8,033 7,978 1,742,057,945 21,132,416,624 4,639,521,295 16,492,895,328 83,681,72611,597 11,469 1,617,696,060 25,626,577,788 12,402,900,342 13,223,677,446 413,148,28110,125 10,039 1,782,023,734 24,863,320,544 13,491,893,685 11,371,426,859 579,976,4077,327 7,197 1,279,502,304 22,385,191,916 11,548,251,385 10,836,940,531 773,929,2925,650 5,628 1,112,475,218 26,059,299,687 14,459,314,488 11,599,985,199 433,196,039
6,564 6,564 2,344,676,686 147,267,037,177 102,233,094,950 45,033,942,227 89,693,102,356
4,204 4,180 1,478,961,795 68,562,920,736 3,100,585,830 65,462,334,906 105,375,5171,024 1,013 745,764,535 66,977,229,465 2,578,829,723 64,398,399,742 -
407 394 10,802,914 76,040,622 33,117,147 42,923,475 11,993,3022,773 2,773 722,394,346 1,509,650,649 488,638,960 1,021,011,689 93,382,215
38,640 38,547 8,077,031,770 82,578,781,387 46,310,510,816 36,268,270,571 2,630,221,53514,818 14,777 2,941,013,889 30,955,924,541 18,187,230,977 12,768,693,565 49,634
25 25 2,474,061 4,546,890 3,300,897 1,245,993 70,4011,153 1,133 119,076,831 477,437,070 251,533,565 225,903,505 555,6701,967 1,957 332,327,642 2,036,821,270 970,147,880 1,066,673,389 31,703,0151,804 1,792 239,116,627 2,497,664,845 1,261,974,666 1,235,690,179 67,656,7482,381 2,377 457,676,126 3,413,808,619 2,090,451,777 1,323,356,842 68,953,8732,297 2,297 360,417,085 2,924,910,884 1,531,719,134 1,393,191,750 129,400,449
14,196 14,190 3,624,929,510 40,267,667,269 22,014,151,920 18,253,515,350 2,331,831,745
Group Totalless than 250,000250,000 - 499,9991,000,000 - 14,999,99915,000,000 - 49,999,99950,000,000 - 99,999,999100,000,000 - 199,999,999200,000,000 - 399,999,999400,000,000 & above
14 Other Mining and Quarrying
Group Totalless than 250,000250,000 - 499,999500,000 - 999,9991,000,000 - 14,999,99915,000,000 - 49,999,99950,000,000 - 99,999,999100,000,000 - 199,999,999200,000,000 - 399,999,999400,000,000 & above
15 Manu.of food products andbeverages
Group Totalless than 250,0001,000,000 - 14,999,99950,000,000 - 99,999,999
16 Manu.of tobacco products
Group Totalless than 250,000500,000 - 999,9991,000,000 - 14,999,99915,000,000 - 49,999,99950,000,000 - 99,999,999100,000,000 - 199,999,999200,000,000 - 399,999,999400,000,000 & above
17 Manu.of Textiles
Investment (assets at the end of the year) size class Personsengaged (No.)
Employees(No.)
Salaries &Wages (Rs.)
Value of output(Rs.)
Value of input(Rs.)
Value added(Rs.)
Gross additionsto fixed assets
(Rs.)
(cont.)

Table 30 : Principal indicators of industrial activity classified by investment size class - 2011(Establishments with 25 or more persons engaged)
273,207 272,883 40,937,707,548 361,925,639,800 198,551,801,233 163,373,838,568 4,059,977,827137,183 136,954 17,481,180,908 158,502,858,897 81,310,536,363 77,192,322,534 87,833
54 52 2,592,000 9,661,500 7,236,000 2,425,500 100,0008,269 8,239 949,754,845 5,990,284,775 1,435,309,800 4,554,974,974 24,989,2479,118 9,094 1,482,774,189 6,988,864,956 3,621,315,047 3,367,549,909 94,949,466
10,612 10,602 1,376,942,536 6,609,004,336 1,979,363,540 4,629,640,796 275,902,51420,010 20,004 3,044,268,327 21,823,073,942 10,039,550,399 11,783,523,543 276,415,91619,843 19,841 3,721,348,800 42,429,096,553 27,496,185,329 14,932,911,224 638,951,68668,116 68,097 12,878,845,944 119,572,794,841 72,662,304,754 46,910,490,087 2,748,581,1658,861 8,833 1,308,921,060 10,368,881,235 7,048,096,588 3,320,784,647 455,255,5195,219 5,198 745,448,125 3,493,676,290 1,859,338,620 1,634,337,670 68,000
109 105 8,953,295 23,837,495 11,658,842 12,178,653 4,220,000256 253 51,650,538 290,321,637 137,508,371 152,813,266 7,652,693
1,142 1,142 184,116,153 2,613,804,584 1,735,560,571 878,244,013 105,176,684586 586 165,539,949 695,420,904 444,714,582 250,706,322 154,193,142
1,549 1,549 153,213,000 3,251,820,325 2,859,315,602 392,504,723 183,945,0002,979 2,938 483,060,381 6,276,250,996 4,400,958,743 1,875,292,253 238,264,9891,287 1,277 183,762,695 1,216,667,440 680,158,881 536,508,559 82,395
268 259 33,419,904 109,132,872 38,397,753 70,735,119 6,253,000683 661 109,968,826 750,353,987 403,140,051 347,213,936 11,170,442205 205 16,734,000 319,832,850 188,441,251 131,391,599 3,978,381211 211 16,765,800 55,193,525 33,368,228 21,825,297 -110 110 19,314,000 497,441,626 138,425,176 359,016,450 37,981,591215 215 103,095,156 3,327,628,696 2,919,027,403 408,601,293 178,799,180
4,814 4,785 841,547,129 11,537,052,838 5,931,043,303 5,606,009,535 268,313,5532,342 2,328 373,219,470 5,144,872,410 2,620,798,748 2,524,073,661 -
282 275 36,903,429 603,481,949 395,779,372 207,702,577 4,224,685326 326 63,446,062 355,433,252 184,996,226 170,437,026 54,610,140364 362 31,522,117 243,401,593 188,134,947 55,266,646 1,793,333335 335 53,554,999 503,397,958 318,540,495 184,857,463 4,150,436
1,165 1,159 282,901,052 4,686,465,676 2,222,793,514 2,463,672,162 203,534,959
Group Totalless than 250,000500,000 - 999,9991,000,000 - 14,999,99915,000,000 - 49,999,99950,000,000 - 99,999,999100,000,000 - 199,999,999200,000,000 - 399,999,999400,000,000 & above
18 Manu.of wearing Apparel,dressing & dyeing of fur
Group Totalless than 250,0001,000,000 - 14,999,99915,000,000 - 49,999,999100,000,000 - 199,999,999200,000,000 - 399,999,999400,000,000 & above
19 Tanning and dressing ofleather; manu. of luggage,handbags & footwear
Group Totalless than 250,0001,000,000 - 14,999,99915,000,000 - 49,999,99950,000,000 - 99,999,999100,000,000 - 199,999,999200,000,000 - 399,999,999400,000,000 & above
20 Manu.of wood & products ofwood & cork except furniture
Group Totalless than 250,0001,000,000 - 14,999,99915,000,000 - 49,999,99950,000,000 - 99,999,999100,000,000 - 199,999,999200,000,000 - 399,999,999
21 Manu.of paper and paperproducts
Investment (assets at the end of the year) size class Personsengaged (No.)
Employees(No.)
Salaries &Wages (Rs.)
Value of output(Rs.)
Value of input(Rs.)
Value added(Rs.)
Gross additionsto fixed assets
(Rs.)
(cont.)
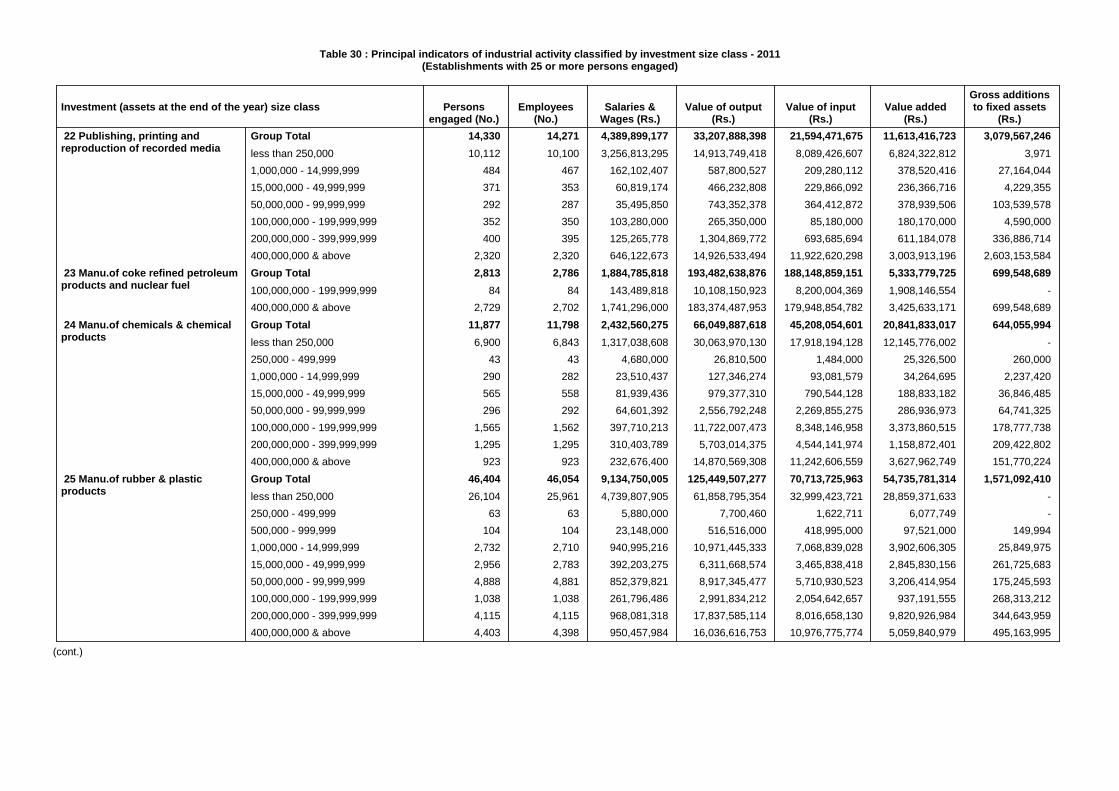
Table 30 : Principal indicators of industrial activity classified by investment size class - 2011(Establishments with 25 or more persons engaged)
14,330 14,271 4,389,899,177 33,207,888,398 21,594,471,675 11,613,416,723 3,079,567,24610,112 10,100 3,256,813,295 14,913,749,418 8,089,426,607 6,824,322,812 3,971
484 467 162,102,407 587,800,527 209,280,112 378,520,416 27,164,044371 353 60,819,174 466,232,808 229,866,092 236,366,716 4,229,355292 287 35,495,850 743,352,378 364,412,872 378,939,506 103,539,578352 350 103,280,000 265,350,000 85,180,000 180,170,000 4,590,000400 395 125,265,778 1,304,869,772 693,685,694 611,184,078 336,886,714
2,320 2,320 646,122,673 14,926,533,494 11,922,620,298 3,003,913,196 2,603,153,5842,813 2,786 1,884,785,818 193,482,638,876 188,148,859,151 5,333,779,725 699,548,689
84 84 143,489,818 10,108,150,923 8,200,004,369 1,908,146,554 -2,729 2,702 1,741,296,000 183,374,487,953 179,948,854,782 3,425,633,171 699,548,689
11,877 11,798 2,432,560,275 66,049,887,618 45,208,054,601 20,841,833,017 644,055,9946,900 6,843 1,317,038,608 30,063,970,130 17,918,194,128 12,145,776,002 -
43 43 4,680,000 26,810,500 1,484,000 25,326,500 260,000290 282 23,510,437 127,346,274 93,081,579 34,264,695 2,237,420565 558 81,939,436 979,377,310 790,544,128 188,833,182 36,846,485296 292 64,601,392 2,556,792,248 2,269,855,275 286,936,973 64,741,325
1,565 1,562 397,710,213 11,722,007,473 8,348,146,958 3,373,860,515 178,777,7381,295 1,295 310,403,789 5,703,014,375 4,544,141,974 1,158,872,401 209,422,802
923 923 232,676,400 14,870,569,308 11,242,606,559 3,627,962,749 151,770,22446,404 46,054 9,134,750,005 125,449,507,277 70,713,725,963 54,735,781,314 1,571,092,41026,104 25,961 4,739,807,905 61,858,795,354 32,999,423,721 28,859,371,633 -
63 63 5,880,000 7,700,460 1,622,711 6,077,749 -104 104 23,148,000 516,516,000 418,995,000 97,521,000 149,994
2,732 2,710 940,995,216 10,971,445,333 7,068,839,028 3,902,606,305 25,849,9752,956 2,783 392,203,275 6,311,668,574 3,465,838,418 2,845,830,156 261,725,6834,888 4,881 852,379,821 8,917,345,477 5,710,930,523 3,206,414,954 175,245,5931,038 1,038 261,796,486 2,991,834,212 2,054,642,657 937,191,555 268,313,2124,115 4,115 968,081,318 17,837,585,114 8,016,658,130 9,820,926,984 344,643,9594,403 4,398 950,457,984 16,036,616,753 10,976,775,774 5,059,840,979 495,163,995
Group Totalless than 250,0001,000,000 - 14,999,99915,000,000 - 49,999,99950,000,000 - 99,999,999100,000,000 - 199,999,999200,000,000 - 399,999,999400,000,000 & above
22 Publishing, printing andreproduction of recorded media
Group Total100,000,000 - 199,999,999400,000,000 & above
23 Manu.of coke refined petroleumproducts and nuclear fuel
Group Totalless than 250,000250,000 - 499,9991,000,000 - 14,999,99915,000,000 - 49,999,99950,000,000 - 99,999,999100,000,000 - 199,999,999200,000,000 - 399,999,999400,000,000 & above
24 Manu.of chemicals & chemicalproducts
Group Totalless than 250,000250,000 - 499,999500,000 - 999,9991,000,000 - 14,999,99915,000,000 - 49,999,99950,000,000 - 99,999,999100,000,000 - 199,999,999200,000,000 - 399,999,999400,000,000 & above
25 Manu.of rubber & plasticproducts
Investment (assets at the end of the year) size class Personsengaged (No.)
Employees(No.)
Salaries &Wages (Rs.)
Value of output(Rs.)
Value of input(Rs.)
Value added(Rs.)
Gross additionsto fixed assets
(Rs.)
(cont.)

Table 30 : Principal indicators of industrial activity classified by investment size class - 2011(Establishments with 25 or more persons engaged)
13,701 13,642 3,845,081,170 86,319,357,949 48,517,095,598 37,802,262,351 2,237,571,5477,575 7,533 1,869,092,094 43,051,626,591 27,681,123,821 15,370,502,770 -
64 64 11,628,400 53,312,252 9,980,600 43,331,652 21,000954 945 194,045,700 5,150,713,020 4,593,786,402 556,926,618 10,861,570235 232 44,742,622 494,949,442 272,359,969 222,589,473 17,984,544998 995 171,066,442 431,683,366 172,653,491 259,029,875 4,503,514391 389 71,224,322 448,462,353 219,730,579 228,731,774 40,713,645
1,127 1,127 261,638,441 1,153,487,983 559,427,195 594,060,788 21,461,2812,357 2,357 1,221,643,149 35,535,122,942 15,008,033,541 20,527,089,401 2,142,025,9933,791 3,744 1,154,456,377 29,371,038,077 23,344,344,417 6,026,693,660 3,476,415,4821,876 1,832 432,201,654 8,430,176,956 5,821,424,639 2,608,752,317 -
200 200 89,895,862 1,918,934,818 814,471,914 1,104,462,904 11,093,004183 182 53,224,450 729,691,680 488,021,965 241,669,715 33,279,811250 248 82,058,622 2,299,214,849 2,127,992,202 171,222,647 54,716,702519 519 212,407,632 7,516,389,393 6,294,864,130 1,221,525,263 53,740,133763 763 284,668,157 8,476,630,381 7,797,569,567 679,060,814 3,323,585,832
5,380 5,284 918,135,127 9,878,114,231 5,824,649,576 4,053,464,655 324,265,3483,413 3,324 477,267,209 6,026,269,817 3,665,886,242 2,360,383,575 5,340
181 181 32,388,000 452,119,791 108,193,347 343,926,444 16,07825 25 2,527,000 48,460,000 1,500,000 46,960,000 4,295,000
209 205 44,671,300 56,648,576 190,613,394 -133,964,818 20,690,142552 552 114,712,016 710,380,403 276,044,831 434,335,572 120,259,889484 481 112,188,897 1,635,575,109 893,590,051 741,985,058 62,375,371516 516 134,380,705 948,660,535 688,821,711 259,838,824 116,623,528
2,248 2,225 526,335,594 6,655,399,083 3,619,429,272 3,035,969,811 19,246,1241,448 1,437 378,349,084 4,149,976,156 2,366,572,307 1,783,403,849 -
207 202 30,003,032 141,912,032 100,958,568 40,953,464 277,56663 59 10,836,000 29,702,377 17,587,957 12,114,420 2,001,818
282 279 38,489,478 406,429,760 122,382,731 284,047,029 7,817,953248 248 68,658,000 1,927,378,758 1,011,927,709 915,451,049 9,148,787
1,872 1,872 299,866,058 1,418,821,827 285,952,810 1,132,869,017 7,224,3331,619 1,619 247,356,058 1,264,498,058 243,636,944 1,020,861,114 -
253 253 52,510,000 154,323,769 42,315,866 112,007,903 7,224,333
Group Totalless than 250,000500,000 - 999,9991,000,000 - 14,999,99915,000,000 - 49,999,99950,000,000 - 99,999,999100,000,000 - 199,999,999200,000,000 - 399,999,999400,000,000 & above
26 Manu. of other non metallicmineral products
Group Totalless than 250,0001,000,000 - 14,999,99915,000,000 - 49,999,999100,000,000 - 199,999,999200,000,000 - 399,999,999400,000,000 & above
27 Manu.of basic metals
Group Totalless than 250,000250,000 - 499,9991,000,000 - 14,999,99915,000,000 - 49,999,99950,000,000 - 99,999,999100,000,000 - 199,999,999200,000,000 - 399,999,999
28 Manu.of fabricated metalproducts except machineryequipments
Group Totalless than 250,00015,000,000 - 49,999,99950,000,000 - 99,999,999200,000,000 - 399,999,999400,000,000 & above
29 Manu.of Machinery &equipments (n.e.c.)
Group Totalless than 250,0001,000,000 - 14,999,999
30 Manu.of office, accounting andcomputing machinery
Investment (assets at the end of the year) size class Personsengaged (No.)
Employees(No.)
Salaries &Wages (Rs.)
Value of output(Rs.)
Value of input(Rs.)
Value added(Rs.)
Gross additionsto fixed assets
(Rs.)
(cont.)
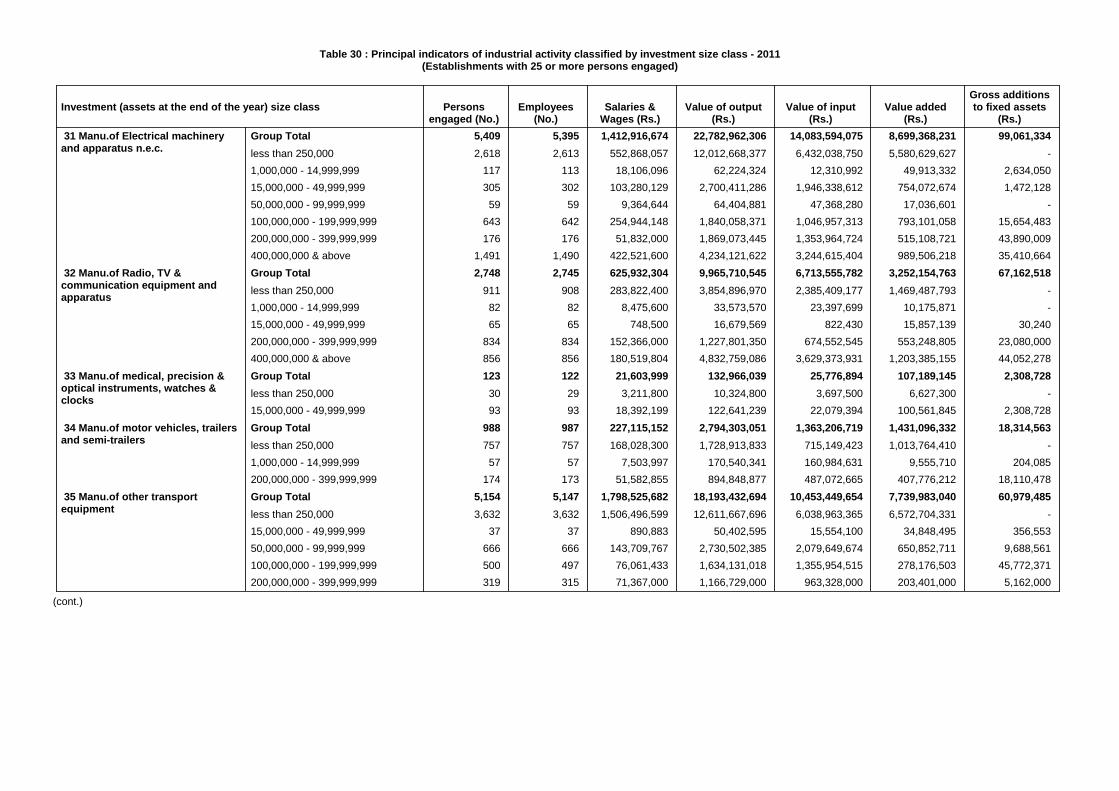
Table 30 : Principal indicators of industrial activity classified by investment size class - 2011(Establishments with 25 or more persons engaged)
5,409 5,395 1,412,916,674 22,782,962,306 14,083,594,075 8,699,368,231 99,061,3342,618 2,613 552,868,057 12,012,668,377 6,432,038,750 5,580,629,627 -
117 113 18,106,096 62,224,324 12,310,992 49,913,332 2,634,050305 302 103,280,129 2,700,411,286 1,946,338,612 754,072,674 1,472,12859 59 9,364,644 64,404,881 47,368,280 17,036,601 -
643 642 254,944,148 1,840,058,371 1,046,957,313 793,101,058 15,654,483176 176 51,832,000 1,869,073,445 1,353,964,724 515,108,721 43,890,009
1,491 1,490 422,521,600 4,234,121,622 3,244,615,404 989,506,218 35,410,6642,748 2,745 625,932,304 9,965,710,545 6,713,555,782 3,252,154,763 67,162,518
911 908 283,822,400 3,854,896,970 2,385,409,177 1,469,487,793 -82 82 8,475,600 33,573,570 23,397,699 10,175,871 -65 65 748,500 16,679,569 822,430 15,857,139 30,240
834 834 152,366,000 1,227,801,350 674,552,545 553,248,805 23,080,000856 856 180,519,804 4,832,759,086 3,629,373,931 1,203,385,155 44,052,278123 122 21,603,999 132,966,039 25,776,894 107,189,145 2,308,72830 29 3,211,800 10,324,800 3,697,500 6,627,300 -93 93 18,392,199 122,641,239 22,079,394 100,561,845 2,308,728
988 987 227,115,152 2,794,303,051 1,363,206,719 1,431,096,332 18,314,563757 757 168,028,300 1,728,913,833 715,149,423 1,013,764,410 -57 57 7,503,997 170,540,341 160,984,631 9,555,710 204,085
174 173 51,582,855 894,848,877 487,072,665 407,776,212 18,110,4785,154 5,147 1,798,525,682 18,193,432,694 10,453,449,654 7,739,983,040 60,979,4853,632 3,632 1,506,496,599 12,611,667,696 6,038,963,365 6,572,704,331 -
37 37 890,883 50,402,595 15,554,100 34,848,495 356,553666 666 143,709,767 2,730,502,385 2,079,649,674 650,852,711 9,688,561500 497 76,061,433 1,634,131,018 1,355,954,515 278,176,503 45,772,371319 315 71,367,000 1,166,729,000 963,328,000 203,401,000 5,162,000
Group Totalless than 250,0001,000,000 - 14,999,99915,000,000 - 49,999,99950,000,000 - 99,999,999100,000,000 - 199,999,999200,000,000 - 399,999,999400,000,000 & above
31 Manu.of Electrical machineryand apparatus n.e.c.
Group Totalless than 250,0001,000,000 - 14,999,99915,000,000 - 49,999,999200,000,000 - 399,999,999400,000,000 & above
32 Manu.of Radio, TV &communication equipment andapparatus
Group Totalless than 250,00015,000,000 - 49,999,999
33 Manu.of medical, precision &optical instruments, watches &clocks
Group Totalless than 250,0001,000,000 - 14,999,999200,000,000 - 399,999,999
34 Manu.of motor vehicles, trailersand semi-trailers
Group Totalless than 250,00015,000,000 - 49,999,99950,000,000 - 99,999,999100,000,000 - 199,999,999200,000,000 - 399,999,999
35 Manu.of other transportequipment
Investment (assets at the end of the year) size class Personsengaged (No.)
Employees(No.)
Salaries &Wages (Rs.)
Value of output(Rs.)
Value of input(Rs.)
Value added(Rs.)
Gross additionsto fixed assets
(Rs.)
(cont.)

Table 30 : Principal indicators of industrial activity classified by investment size class - 2011(Establishments with 25 or more persons engaged)
18,793 18,729 3,485,870,690 38,899,050,383 19,878,846,244 19,020,204,139 823,546,1769,544 9,515 1,734,821,047 21,767,591,804 8,969,993,444 12,797,598,360 -
91 89 12,010,798 147,146,529 82,140,687 65,005,842 3,998,69658 58 9,156,440 24,657,022 10,173,844 14,483,178 25,600
886 875 147,274,858 1,510,597,203 572,270,278 938,326,925 27,405,0961,671 1,652 275,720,835 1,941,016,781 1,149,232,627 791,784,154 68,248,6611,533 1,531 307,851,695 3,431,570,600 2,089,648,244 1,341,922,356 146,689,272
612 611 112,257,975 2,002,125,723 1,489,395,961 512,729,762 29,318,5261,324 1,323 257,926,357 3,383,922,520 2,073,729,137 1,310,193,383 278,634,7233,074 3,074 628,850,684 4,690,422,202 3,442,262,023 1,248,160,179 269,225,601
259 248 34,592,504 1,495,536,442 1,126,841,978 368,694,464 367,750104 104 11,962,500 307,000,000 276,502,000 30,498,000 -43 39 8,034,608 16,746,442 7,902,901 8,843,541 367,75053 51 3,285,000 27,790,000 24,016,800 3,773,200 -59 54 11,310,396 1,144,000,000 818,420,277 325,579,723 -
16,364 16,364 13,736,800,432 251,810,915,740 116,544,131,993 135,266,783,747 17,733,000,000172 172 47,500,432 1,025,055,740 115,031,993 910,023,747 -
16,192 16,192 13,689,300,000 250,785,860,000 116,429,100,000 134,356,760,000 17,733,000,0009,739 9,739 5,210,082,621 13,504,729,535 2,761,652,262 10,743,077,273 12,780,910,000
67 67 7,827,556 32,071,371 3,043,200 29,028,171 -9,672 9,672 5,202,255,065 13,472,658,164 2,758,609,062 10,714,049,102 12,780,910,000
598,940 596,925 124,660,664,735 1,989,484,168,848 1161181309415 828,302,859,433 146,100,473,867
Group Totalless than 250,000250,000 - 499,999500,000 - 999,9991,000,000 - 14,999,99915,000,000 - 49,999,99950,000,000 - 99,999,999100,000,000 - 199,999,999200,000,000 - 399,999,999400,000,000 & above
36 Manu.of furniture,Manufacturing of n.e.c.
Group Totalless than 250,0001,000,000 - 14,999,99915,000,000 - 49,999,99950,000,000 - 99,999,999
37 Recycling
Group Totalless than 250,000400,000,000 & above
40 Electricity, Gas, Steam and Hotwater supply
Group Totalless than 250,000400,000,000 & above
41 Collection, purification anddistribution of water
Total
Investment (assets at the end of the year) size class Personsengaged (No.)
Employees(No.)
Salaries &Wages (Rs.)
Value of output(Rs.)
Value of input(Rs.)
Value added(Rs.)
Gross additionsto fixed assets
(Rs.)
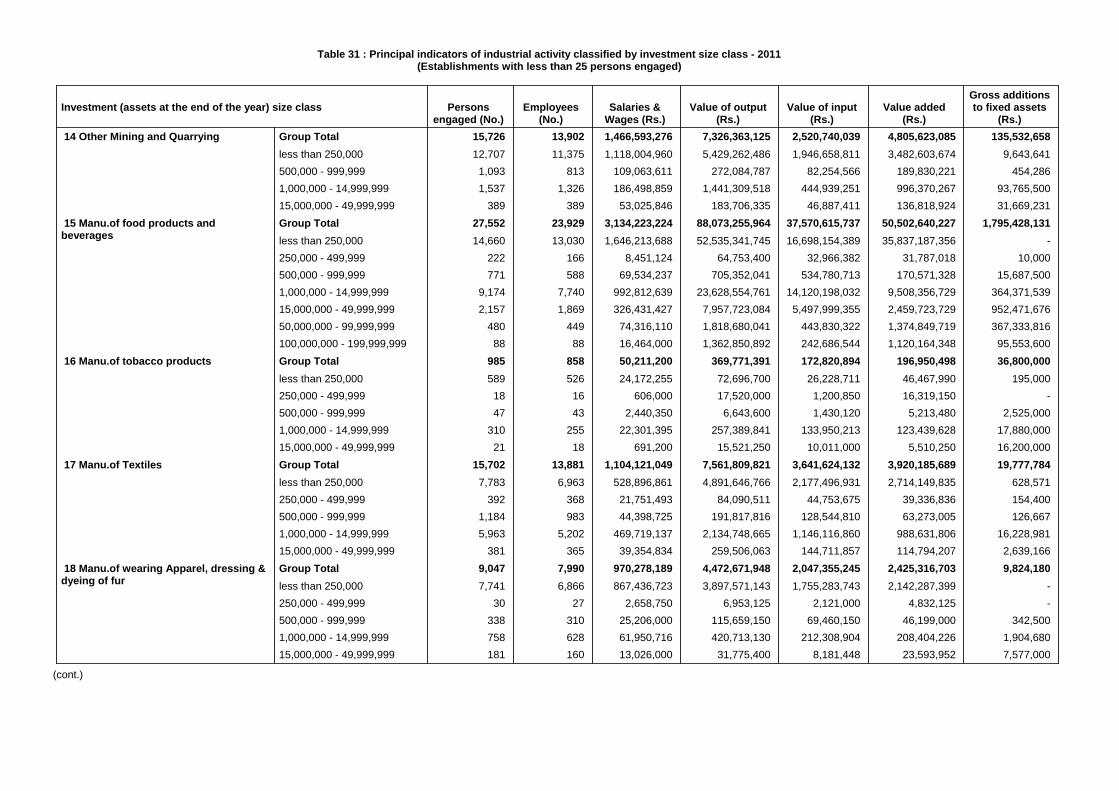
Table 31 : Principal indicators of industrial activity classified by investment size class - 2011(Establishments with less than 25 persons engaged)
15,726 13,902 1,466,593,276 7,326,363,125 2,520,740,039 4,805,623,085 135,532,65812,707 11,375 1,118,004,960 5,429,262,486 1,946,658,811 3,482,603,674 9,643,641
1,093 813 109,063,611 272,084,787 82,254,566 189,830,221 454,2861,537 1,326 186,498,859 1,441,309,518 444,939,251 996,370,267 93,765,500
389 389 53,025,846 183,706,335 46,887,411 136,818,924 31,669,23127,552 23,929 3,134,223,224 88,073,255,964 37,570,615,737 50,502,640,227 1,795,428,13114,660 13,030 1,646,213,688 52,535,341,745 16,698,154,389 35,837,187,356 -
222 166 8,451,124 64,753,400 32,966,382 31,787,018 10,000771 588 69,534,237 705,352,041 534,780,713 170,571,328 15,687,500
9,174 7,740 992,812,639 23,628,554,761 14,120,198,032 9,508,356,729 364,371,5392,157 1,869 326,431,427 7,957,723,084 5,497,999,355 2,459,723,729 952,471,676
480 449 74,316,110 1,818,680,041 443,830,322 1,374,849,719 367,333,81688 88 16,464,000 1,362,850,892 242,686,544 1,120,164,348 95,553,600
985 858 50,211,200 369,771,391 172,820,894 196,950,498 36,800,000589 526 24,172,255 72,696,700 26,228,711 46,467,990 195,000
18 16 606,000 17,520,000 1,200,850 16,319,150 -47 43 2,440,350 6,643,600 1,430,120 5,213,480 2,525,000
310 255 22,301,395 257,389,841 133,950,213 123,439,628 17,880,00021 18 691,200 15,521,250 10,011,000 5,510,250 16,200,000
15,702 13,881 1,104,121,049 7,561,809,821 3,641,624,132 3,920,185,689 19,777,7847,783 6,963 528,896,861 4,891,646,766 2,177,496,931 2,714,149,835 628,571
392 368 21,751,493 84,090,511 44,753,675 39,336,836 154,4001,184 983 44,398,725 191,817,816 128,544,810 63,273,005 126,6675,963 5,202 469,719,137 2,134,748,665 1,146,116,860 988,631,806 16,228,981
381 365 39,354,834 259,506,063 144,711,857 114,794,207 2,639,1669,047 7,990 970,278,189 4,472,671,948 2,047,355,245 2,425,316,703 9,824,1807,741 6,866 867,436,723 3,897,571,143 1,755,283,743 2,142,287,399 -
30 27 2,658,750 6,953,125 2,121,000 4,832,125 -338 310 25,206,000 115,659,150 69,460,150 46,199,000 342,500758 628 61,950,716 420,713,130 212,308,904 208,404,226 1,904,680181 160 13,026,000 31,775,400 8,181,448 23,593,952 7,577,000
Group Totalless than 250,000500,000 - 999,9991,000,000 - 14,999,99915,000,000 - 49,999,999
14 Other Mining and Quarrying
Group Totalless than 250,000250,000 - 499,999500,000 - 999,9991,000,000 - 14,999,99915,000,000 - 49,999,99950,000,000 - 99,999,999100,000,000 - 199,999,999
15 Manu.of food products andbeverages
Group Totalless than 250,000250,000 - 499,999500,000 - 999,9991,000,000 - 14,999,99915,000,000 - 49,999,999
16 Manu.of tobacco products
Group Totalless than 250,000250,000 - 499,999500,000 - 999,9991,000,000 - 14,999,99915,000,000 - 49,999,999
17 Manu.of Textiles
Group Totalless than 250,000250,000 - 499,999500,000 - 999,9991,000,000 - 14,999,99915,000,000 - 49,999,999
18 Manu.of wearing Apparel, dressing &dyeing of fur
Investment (assets at the end of the year) size class Personsengaged (No.)
Employees(No.)
Salaries &Wages (Rs.)
Value of output(Rs.)
Value of input(Rs.)
Value added(Rs.)
Gross additionsto fixed assets
(Rs.)
(cont.)

Table 31 : Principal indicators of industrial activity classified by investment size class - 2011(Establishments with less than 25 persons engaged)
2,035 1,806 190,476,659 1,130,211,838 582,488,334 547,723,504 2,290,0001,705 1,529 171,462,321 888,708,585 430,368,812 458,339,773 420,000
68 54 4,416,000 9,424,953 3,822,623 5,602,330 -62 49 903,500 2,750,000 1,445,000 1,305,000 -
172 146 11,099,838 205,866,750 133,759,315 72,107,435 50,00011 10 1,578,000 4,010,000 2,005,200 2,004,800 170,00018 18 1,017,000 19,451,550 11,087,384 8,364,167 1,650,000
10,209 8,999 1,101,387,286 8,670,772,373 3,416,561,231 5,254,211,142 126,522,1706,498 5,737 647,338,391 3,945,421,009 1,319,128,521 2,626,292,488 247,500
35 28 877,800 2,961,000 1,680,000 1,281,000 14,000102 88 12,763,250 132,250,450 25,831,274 106,419,177 400,000
2,794 2,440 292,438,445 2,390,479,196 709,843,341 1,680,635,856 119,360,670768 695 147,181,400 2,198,059,468 1,359,268,096 838,791,372 2,500,000
12 11 788,000 1,601,250 810,000 791,250 4,000,000902 799 102,551,727 497,881,203 248,073,768 249,807,436 3,649,316758 666 82,119,060 339,240,006 144,603,142 194,636,864 -
12 12 1,680,000 24,900,000 12,988,000 11,912,000 800,000120 110 16,052,667 126,091,197 87,130,125 38,961,071 2,849,316
11 11 2,700,000 7,650,000 3,352,500 4,297,500 -3,526 3,377 460,715,854 5,573,054,397 1,943,426,865 3,629,627,532 20,092,0842,914 2,802 384,398,564 4,934,028,560 1,776,247,498 3,157,781,062 -
68 60 2,775,000 6,460,469 3,025,599 3,434,870 50,000380 356 39,048,515 455,975,149 74,592,521 381,382,628 18,207,447123 123 27,845,775 152,890,220 73,074,247 79,815,973 1,834,637
40 36 6,648,000 23,700,000 16,487,000 7,213,000 -8 6 780,000 18,350,000 12,800,000 5,550,000 -
8 6 780,000 18,350,000 12,800,000 5,550,000 -3,611 3,285 424,823,222 7,336,105,538 4,759,423,219 2,576,682,319 126,071,1532,879 2,609 337,442,993 6,127,709,348 4,267,196,054 1,860,513,293 -
29 29 2,094,000 2,851,600 1,771,365 1,080,235 160,000176 171 8,965,552 193,115,084 16,335,783 176,779,301 389,325369 319 30,774,950 186,036,679 113,400,342 72,636,337 19,489,000158 157 45,545,728 826,392,828 360,719,675 465,673,153 106,032,828
Group Totalless than 250,000250,000 - 499,999500,000 - 999,9991,000,000 - 14,999,99915,000,000 - 49,999,999200,000,000 - 399,999,999
19 Tanning and dressing of leather;manu. of luggage, handbags & footwear
Group Totalless than 250,000250,000 - 499,999500,000 - 999,9991,000,000 - 14,999,99915,000,000 - 49,999,99950,000,000 - 99,999,999
20 Manu.of wood & products of wood &cork except furniture
Group Totalless than 250,000500,000 - 999,9991,000,000 - 14,999,99915,000,000 - 49,999,999
21 Manu.of paper and paper products
Group Totalless than 250,000500,000 - 999,9991,000,000 - 14,999,99915,000,000 - 49,999,99950,000,000 - 99,999,999
22 Publishing, printing andreproduction of recorded media
Group Totalless than 250,000
23 Manu.of coke refined petroleumproducts and nuclear fuel
Group Totalless than 250,000250,000 - 499,999500,000 - 999,9991,000,000 - 14,999,99915,000,000 - 49,999,999
24 Manu.of chemicals & chemicalproducts
Investment (assets at the end of the year) size class Personsengaged (No.)
Employees(No.)
Salaries &Wages (Rs.)
Value of output(Rs.)
Value of input(Rs.)
Value added(Rs.)
Gross additionsto fixed assets
(Rs.)
(cont.)
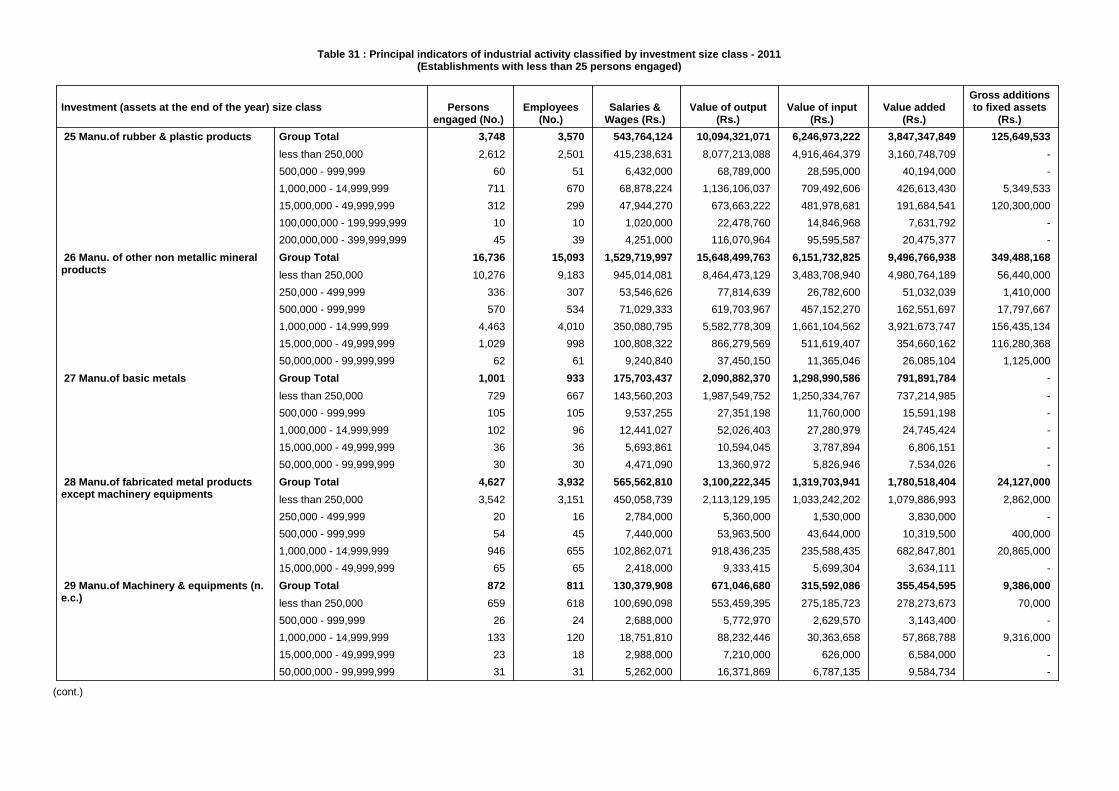
Table 31 : Principal indicators of industrial activity classified by investment size class - 2011(Establishments with less than 25 persons engaged)
3,748 3,570 543,764,124 10,094,321,071 6,246,973,222 3,847,347,849 125,649,5332,612 2,501 415,238,631 8,077,213,088 4,916,464,379 3,160,748,709 -
60 51 6,432,000 68,789,000 28,595,000 40,194,000 -711 670 68,878,224 1,136,106,037 709,492,606 426,613,430 5,349,533312 299 47,944,270 673,663,222 481,978,681 191,684,541 120,300,000
10 10 1,020,000 22,478,760 14,846,968 7,631,792 -45 39 4,251,000 116,070,964 95,595,587 20,475,377 -
16,736 15,093 1,529,719,997 15,648,499,763 6,151,732,825 9,496,766,938 349,488,16810,276 9,183 945,014,081 8,464,473,129 3,483,708,940 4,980,764,189 56,440,000
336 307 53,546,626 77,814,639 26,782,600 51,032,039 1,410,000570 534 71,029,333 619,703,967 457,152,270 162,551,697 17,797,667
4,463 4,010 350,080,795 5,582,778,309 1,661,104,562 3,921,673,747 156,435,1341,029 998 100,808,322 866,279,569 511,619,407 354,660,162 116,280,368
62 61 9,240,840 37,450,150 11,365,046 26,085,104 1,125,0001,001 933 175,703,437 2,090,882,370 1,298,990,586 791,891,784 -
729 667 143,560,203 1,987,549,752 1,250,334,767 737,214,985 -105 105 9,537,255 27,351,198 11,760,000 15,591,198 -102 96 12,441,027 52,026,403 27,280,979 24,745,424 -
36 36 5,693,861 10,594,045 3,787,894 6,806,151 -30 30 4,471,090 13,360,972 5,826,946 7,534,026 -
4,627 3,932 565,562,810 3,100,222,345 1,319,703,941 1,780,518,404 24,127,0003,542 3,151 450,058,739 2,113,129,195 1,033,242,202 1,079,886,993 2,862,000
20 16 2,784,000 5,360,000 1,530,000 3,830,000 -54 45 7,440,000 53,963,500 43,644,000 10,319,500 400,000
946 655 102,862,071 918,436,235 235,588,435 682,847,801 20,865,00065 65 2,418,000 9,333,415 5,699,304 3,634,111 -
872 811 130,379,908 671,046,680 315,592,086 355,454,595 9,386,000659 618 100,690,098 553,459,395 275,185,723 278,273,673 70,000
26 24 2,688,000 5,772,970 2,629,570 3,143,400 -133 120 18,751,810 88,232,446 30,363,658 57,868,788 9,316,000
23 18 2,988,000 7,210,000 626,000 6,584,000 -31 31 5,262,000 16,371,869 6,787,135 9,584,734 -
Group Totalless than 250,000500,000 - 999,9991,000,000 - 14,999,99915,000,000 - 49,999,999100,000,000 - 199,999,999200,000,000 - 399,999,999
25 Manu.of rubber & plastic products
Group Totalless than 250,000250,000 - 499,999500,000 - 999,9991,000,000 - 14,999,99915,000,000 - 49,999,99950,000,000 - 99,999,999
26 Manu. of other non metallic mineralproducts
Group Totalless than 250,000500,000 - 999,9991,000,000 - 14,999,99915,000,000 - 49,999,99950,000,000 - 99,999,999
27 Manu.of basic metals
Group Totalless than 250,000250,000 - 499,999500,000 - 999,9991,000,000 - 14,999,99915,000,000 - 49,999,999
28 Manu.of fabricated metal productsexcept machinery equipments
Group Totalless than 250,000500,000 - 999,9991,000,000 - 14,999,99915,000,000 - 49,999,99950,000,000 - 99,999,999
29 Manu.of Machinery & equipments (n.e.c.)
Investment (assets at the end of the year) size class Personsengaged (No.)
Employees(No.)
Salaries &Wages (Rs.)
Value of output(Rs.)
Value of input(Rs.)
Value added(Rs.)
Gross additionsto fixed assets
(Rs.)
(cont.)

Table 31 : Principal indicators of industrial activity classified by investment size class - 2011(Establishments with less than 25 persons engaged)
473 450 84,366,126 1,102,465,836 860,415,485 242,050,351 1,500,000451 433 82,309,326 1,092,100,836 854,185,485 237,915,351 -
22 17 2,056,800 10,365,000 6,230,000 4,135,000 1,500,000193 183 31,884,179 336,225,713 56,768,514 279,457,199 103,000156 151 28,692,179 316,898,313 53,935,060 262,963,253 -
11 9 1,080,000 11,525,800 387,500 11,138,300 100,0005 4 264,000 5,302,500 2,047,500 3,255,000 3,000
21 19 1,848,000 2,499,100 398,454 2,100,646 -23 19 3,648,788 25,777,470 7,715,267 18,062,203 221,648
7 7 1,152,000 7,845,000 2,286,000 5,559,000 -16 12 2,496,788 17,932,470 5,429,267 12,503,203 221,648
426 398 58,654,166 232,582,677 49,249,904 183,332,774 1,071,723329 306 47,123,086 196,946,375 37,096,371 159,850,005 -
97 92 11,531,080 35,636,302 12,153,533 23,482,769 1,071,723162 153 21,681,250 136,157,049 85,536,680 50,620,369 150,000116 109 17,016,250 95,492,249 65,570,665 29,921,584 -
10 10 936,000 2,588,300 828,500 1,759,800 -8 6 675,000 15,000,000 8,575,000 6,425,000 -
28 28 3,054,000 23,076,500 10,562,515 12,513,985 150,00011,096 9,675 1,449,135,005 19,948,533,197 8,285,342,970 11,663,190,227 8,341,817
9,042 7,895 1,183,864,340 17,067,971,145 7,111,764,715 9,956,206,430 3,149,333284 221 21,168,000 811,440,000 1,086,750 810,353,250 -275 250 25,029,333 57,480,583 17,104,017 40,376,567 1,247,667
1,374 1,213 206,648,331 1,963,616,090 1,145,300,883 818,315,206 3,944,817121 97 12,425,000 48,025,379 10,086,605 37,938,774 -
73 70 10,027,853 443,372,275 303,321,132 140,051,143 1,000,00052 51 7,980,000 434,884,200 297,918,486 136,965,714 -21 19 2,047,853 8,488,075 5,402,646 3,085,429 1,000,000
128 118 25,454,387 541,544,613 43,380,336 498,164,277 8,821,03583 77 16,791,850 359,314,227 42,429,269 316,884,958 -19 18 2,863,072 34,293,629 242,817 34,050,812 -13 10 3,828,445 19,782,159 529,331 19,252,828 8,821,03513 13 1,971,020 128,154,598 178,919 127,975,679 -
Group Totalless than 250,0001,000,000 - 14,999,999
31 Manu.of Electrical machinery andapparatus n.e.c.
Group Totalless than 250,000250,000 - 499,9991,000,000 - 14,999,99950,000,000 - 99,999,999
32 Manu.of Radio, TV & communicationequipment and apparatus
Group Totalless than 250,00015,000,000 - 49,999,999
33 Manu.of medical, precision & opticalinstruments, watches & clocks
Group Totalless than 250,0001,000,000 - 14,999,999
34 Manu.of motor vehicles, trailers andsemi-trailers
Group Totalless than 250,000250,000 - 499,999500,000 - 999,9991,000,000 - 14,999,999
35 Manu.of other transport equipment
Group Totalless than 250,000250,000 - 499,999500,000 - 999,9991,000,000 - 14,999,99915,000,000 - 49,999,999
36 Manu.of furniture, Manufacturing ofn.e.c.
Group Totalless than 250,0001,000,000 - 14,999,999
37 Recycling
Group Totalless than 250,00015,000,000 - 49,999,99950,000,000 - 99,999,999200,000,000 - 399,999,999
40 Electricity, Gas, Steam and Hot watersupply
Investment (assets at the end of the year) size class Personsengaged (No.)
Employees(No.)
Salaries &Wages (Rs.)
Value of output(Rs.)
Value of input(Rs.)
Value added(Rs.)
Gross additionsto fixed assets
(Rs.)
(cont.)

Table 31 : Principal indicators of industrial activity classified by investment size class - 2011(Establishments with less than 25 persons engaged)
175 135 22,626,388 232,236,873 29,386,635 202,850,238 576,214,80041 31 2,830,595 7,365,765 2,761,901 4,603,864 -48 30 6,491,873 48,709,928 11,697,534 37,012,394 514,80043 38 708,000 7,614,580 51,000 7,563,580 700,00019 12 2,179,920 8,908,800 4,204,200 4,704,600 -24 24 10,416,000 159,637,800 10,672,000 148,965,800 575,000,000
129,038 114,372 13,658,770,105 185,634,115,530 81,970,039,045 103,664,076,486 3,382,062,199
Group Totalless than 250,0001,000,000 - 14,999,99915,000,000 - 49,999,99950,000,000 - 99,999,999400,000,000 & above
41 Collection, purification anddistribution of water
Total
Investment (assets at the end of the year) size class Personsengaged (No.)
Employees(No.)
Salaries &Wages (Rs.)
Value of output(Rs.)
Value of input(Rs.)
Value added(Rs.)
Gross additionsto fixed assets
(Rs.)
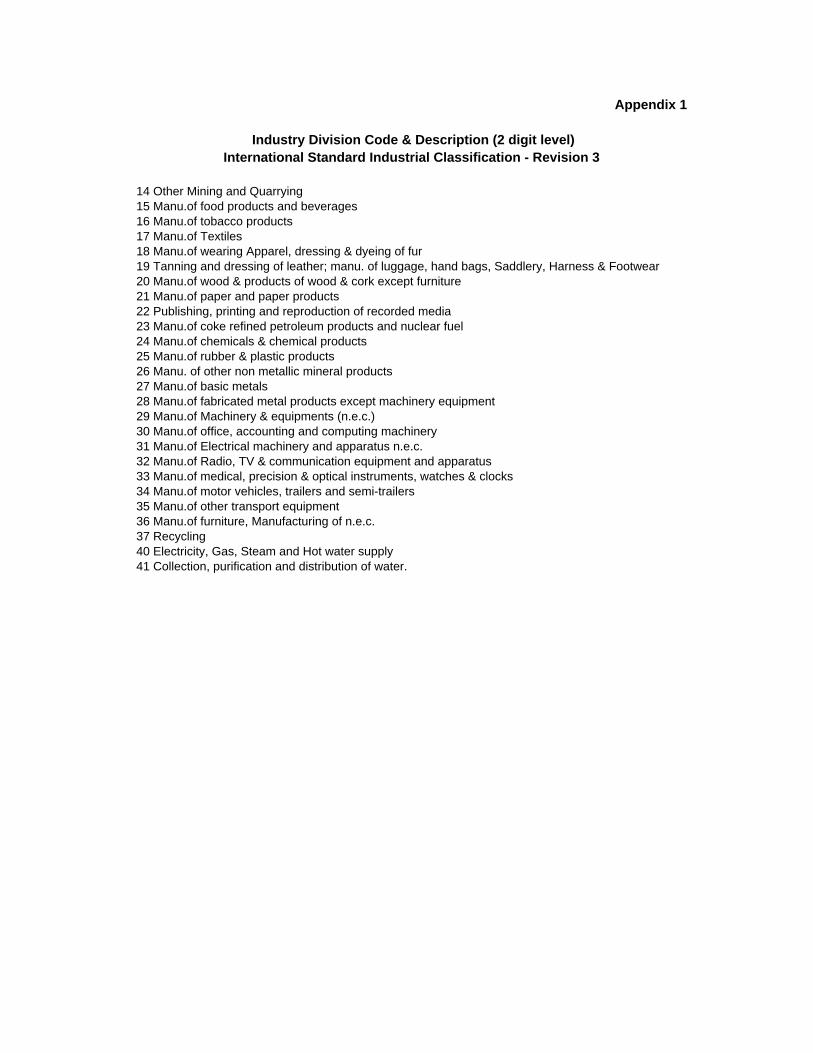
Appendix 1
Industry Division Code & Description (2 digit level)International Standard Industrial Classification - Revision 3
14 Other Mining and Quarrying15 Manu.of food products and beverages16 Manu.of tobacco products17 Manu.of Textiles18 Manu.of wearing Apparel, dressing & dyeing of fur19 Tanning and dressing of leather; manu. of luggage, hand bags, Saddlery, Harness & Footwear20 Manu.of wood & products of wood & cork except furniture21 Manu.of paper and paper products22 Publishing, printing and reproduction of recorded media23 Manu.of coke refined petroleum products and nuclear fuel24 Manu.of chemicals & chemical products25 Manu.of rubber & plastic products26 Manu. of other non metallic mineral products27 Manu.of basic metals28 Manu.of fabricated metal products except machinery equipment29 Manu.of Machinery & equipments (n.e.c.)30 Manu.of office, accounting and computing machinery31 Manu.of Electrical machinery and apparatus n.e.c.32 Manu.of Radio, TV & communication equipment and apparatus33 Manu.of medical, precision & optical instruments, watches & clocks34 Manu.of motor vehicles, trailers and semi-trailers35 Manu.of other transport equipment36 Manu.of furniture, Manufacturing of n.e.c.37 Recycling40 Electricity, Gas, Steam and Hot water supply41 Collection, purification and distribution of water.

Appendix 2
Type of Industry Code & Description (3 digit level)International Standard Industrial Classification - Revision 3
141 Quarrying of stone and sand142 Mining and Quarrying n.e.c151 Produ., proce. & preserving of meat, fish, fruit, vegetables, oils & fats152 Manufacture of Dairy Products153 Manu.of grain mill products and prepared animal feeds154 Manu.of other food products155 Manu.of beverages160 Manu.of tobacco products171 Spinning, weaving and finishing of Textiles172 Manu.of other Textiles173 Manu.of knitted and crocheted fabrics and articles181 Manu.of weaving Apparel except fur apparels182 Dressing and dyeing of fur, manufacture articles of fur191 Tanning & dressing of leather; manu. of luggage, Hand bags, saddlery & harness192 Manu.of footwear201 Saw-milling and planning of wood202 Manu.of produ. of wood, cork, straw & plaiting materials210 Manu.of paper and paper products221 Publishing, printing and reproduction of recorded media222 Printing & service activities related to printing for others223 Reproduction of recorded media231 Manu.of coke oven products232 Manu.of refined petroleum products241 Manu.of basic chemicals242 Manu.of other chemical products243 Manu.of Man made fibers251 Manu.of rubber products252 Manu.of plastic products261 Manu.of glass and glass products269 Manu.of Non metallic mineral products(n.e.c.)271 Manu.of basic iron & steel272 Manu.of basic precious & non-ferrous metal273 Casting of metals281 Manu.of structural metal products, tanks, reservoirs & steam generators289 Manu.of other fabricated metal products291 Manu.of general purpose machinery292 Manu.of special purpose machinery293 Manu.of domestic appliance n.e.c300 Manu.of office, accounting and computing machinery311 Manu.of electronic motors, generators and transformers312 Manu.of electricity distribution and control apparatus313 Manu.of insulated wire and cables314 Manu.of accumulators primary cells and primary batteries315 Manu.of electric lamps and lighting equipments319 Manu.of other electrical equipments n.e.c.321 Manu.of electronic valves, tubes & other322 Manu.of TV & Radio transmitters 323 Manu.of TV & Radio receivers, sound or video recording apparatus331 Manu.of medical appliances & instruments & appliances for measuring, checking,
333 Manu.of watches and clocks341 Manu.of motor vehicles342 Manu.of bodies for Motor vehicles, Manu. of trailers & semi-trailers343 Manu.of spare parts and accessories for motor vehicles & their engine351 Building and repairing of ships and boats352 Manu.of railway and tramway locomotives and rolling stock353 Manu.of aircraft and spacecraft359 Manu.of transport equipment n.e.c.361 Manu.of furniture369 Manu.of other product not elsewhere classified371 Recycling of metal waste and scrap372 Recycling of non-metal waste and scrap401 Production, collection & distribution of electricity402 Manu.of gas403 Steam and hot water supply410 Collection, purification and distribution of water.
testing, navigating & other purposes, except optical instrument

Appendix 3
Type of Industry Code & Description (4 digit level)International Standard Industrial Classification - Revision 3
1411 Quarrying of stone,Clay, Ceramic & Refactory minerals 1412 Braking of Granite1413 Quarrying of sand and Gravel1414 Quarrying of Limestone1415 Mininng of Brick earth1421 Mining of chemical and Fertilizer minerals1422 Extraction of salt1423 Mining of precious and semi precious stones1429 Other Mining & Quarrying N.e.c1511 Processing and Preserving of Meat and Meat Product1512 Processing and Preserving of fish and fish Products1513 Processing & Preserving of fruits & Vegetables1514 Manufacture of Vegetable oils animal oils & fats1518 Packeting of all kind of foods whether or not dried1520 Manufacture of Dairy Products1531 Manufacture of Grain Mill Products1532 Manufacture of starches and starch products1533 Preparation of Animal food from milling waist1538 Packeting of Cereal, grains, yarm and their preparation & flour1541 Manufacture of bakery products1542 Manufacture of Cane sugar and molasses1543 Manu.of cocoa, chocolate and sugar confectionary1544 Manu.of macaroni, noodles couscous and similar farinaceous1545 Manu.of Coffee & Soya Products for drinking1546 Manu.of tea and tea products1547 Manu.of chilly-power, condiments powder, proce.of spices1548 Manu.of vinegar and similar products1549 Manu.of other food products n.e.c1551 Manufacture of beverages1552 Manu.of wine, bottled toddy and similar products1553 Manu.of all other beverages such as beer and stout1554 Manu.of beverages such as soft drinks, soda etc1601 Manu.of tobacco products1602 Manu.of Cigarette, Cigar & Beedi1609 Tobacco based products1711 Prepa. & spinning of Textiles fibers, weaving of textiles1712 Finishing of Textiles1719 Other Textiles products not classified elsewhere1721 Manu.of made-up textile article, except apparel1722 Manu.of carpets and rugs1723 Manu.of Cordage, Rope, twine & netting1724 Manufacture of Sanitary Towels & Pampers1725 Manu.of buckram canvas and plastic felted canvas1726 Manu. of Laces and embroidered cloths1727 Manu. of Labels, badges (cloth based)1729 Cloth and coir based other products1731 Manufacture of knitted Garments1732 Manufacture of knitted socks, purses and Hand glouses

1733 Manufacture of Knitted Lace1739 Electrometric Yarn & other rubber thread based products1810 Manufacture of weaving Apparel, except fur apparels1820 Dressing and dyeing of fur, manu. articles of fur1911 Tanning and dressing of leather1912 Manu.of luggage, hand bags 1913 Manu. of Bags & rain coats, artificial leather products1920 Manufacturing of footwear2010 Saw-milling and planning of wood2021 Manu.of veneer sheets, plywood, lamin board, particle board2022 Manufacture of builders carpentry and joinery2023 Manufacture of wooden containers2024 Manu.of produ. by cork barks, wood utencils from reed, cane, bamboo and leaves & pan2025 Manu.of Household utencils of other wooden article and ornaments2026 Manu.of tools, coffins, other equipments used in funerals & parts of carts2027 Manu.of other cabinets & wood based seats & supports2028 Manu.of other office equipment & wood articles2029 Manu.of all kinds of other wood products2101 Manufacture of pulp, paper and paperboards2102 Manu.of corrugated paper & paperboard & containers of paper & paperboard2103 Manufacture of cards, files, books and pads2104 Manu.of toys, plates, cups, spoons, knives & ornaments from paper & paper pulp2109 Manu.of pulp paper and paper boards articles n.e.c2211 Publishing of books, broachers, musical books2212 Publishing of newspapers, journals and periodicals2213 Publishing of records and other recorded audio media2219 Other publishing2221 Printing of newspapers, journals & periodicals for others2222 Service activities related to printing2223 Photocopies, computer print out etc2230 Reproduction of recorded media2310 Manu.of coke oven products2320 Manu.of refined petroleum products2411 Manu.of basic chemicals,(except fertilizers & nitrogen compounds)2412 Manu.of fertilizer & nitrogen compounds2413 Manu.of plastic in primary forms and synthetic rubber2414 Manu.of Natural carbonic fertilizers2421 Manu.of pesticides and other agro-chemical products2422 Manu.of paints, varnishes & similar coatings, printing ink2423 Manu.of pharmaceuticals, medicinal chemicals & botanical products2424 Manu.of soap & detergent, cleaning, perfumes & toilet preparations2425 Manu.of explosives, crackers and other firework2426 Manu.of mosquito-coils, camphor, naphthalene balls, incense sticks, chalks & candles2427 Manu.of processed salt (for food)2428 Manu.of chemicals and activated carbon2429 Manu.of other chemical products n.e.c2430 Manu.of Man made fibers2511 Manu.of rubber tyres and tubes, rebuilding of rubber tyres2512 Manu.of rubber condoms, rubber gloves2513 Manu.of product from natural rubber2514 Manu.of article of rubber2519 Manu.of rubber products (not classified elsewhere)2520 Manu.of plastic products2610 Manu.of glass and glass products2691 Manu.of non-structural non-refractory ceramic ware
2692 Manu.of refactory ceramic products2693 Manu.of structural non refractory clay & ceramic products2694 Manu.of cement lime, and plaster2695 Manu.of articles of concrete, cement & plaster2696 Cutting, shaping & finishing of rough stones2697 Refining of Ilmanite, surcon & refinding of plumbago2698 Manu.of Terrazzo2699 Manu.of other non-metalic mineral products n.e.c2710 Manu.of basic iron & steel2720 Manu.of basic precious & non-ferrous metal2731 Casting of iron & steel2732 Casting of Non ferrous metals2811 Manu.of structural metal products2812 Manu.of tanks, resorvoirs & containers of metal except packing containers2813 Manu.of steam generators except central heating hotwater boilers2891 Forging, Pressing, Stamping and roll forming of metal, powder metallurgy2892 Treatment & coating of metal general mechanical engineering work2893 Manu.of cutlery, hand tools & general hardware2894 Manu.of other brass articales2895 Manu.of non threaded metal products2896 Manu.of Metal cooking utensils, household appliances & sanitary articles2897 Manu.of Metal cables and similar articles2898 Manu.of Containers used for the packing or conveyance2899 Manu.of other fabricated metal products2911 Manu.of engine and turbines, except aircraft, vehicle & cycle engines2912 Manu.of pumps, compressors, taps and valves2913 Manu.of bearings, gears, gearing & driving clemeufs2914 Manu.of Ovens, furnaces & furnace burners2915 Manufactory of lifting & handling equipments2919 Manu.of other general purpose machinery2921 Manu.of agricultural & forestry machinery2922 Manu.of machine tools2923 Manu.of machinery for metallurgy2924 Manu.of machinery for mining, quarrying & construction2925 Manu.of machinery for Food, beverage & tobacco proce.2926 Manu.of machinery for textile, apparel & leather products2927 Manu.of weapons and ammunition2929 Manu.of other special purpose machinery (n.e.c.)2930 Manu.of domestic appliance n.e.c3000 Manu.of office, accounting and computing machinery3110 Manu.of electric motors, generators and transformers3120 Manu.of electricity distribution and control apparatus3130 Manu.of insulated wire and cables3140 Manu.of accumulators primary cells and primary batteries3150 Manu.of electric lamps and lighting equipments3190 Manu.of other electrical equipments n.e.c3210 Manu.of electronic valves, tubes & other3220 Manu.of TV & radio transmitters & apparatus for line telephone & line telegraphy3230 Manu.of TV & radio receivers sound or video recording or reproducing apparatus & associated go3311 Manu.of medical & surgical equipment and orthopaedic appliances3312 Manu.of instruments & appliances for measuring, checking, testing navigation & other purposes except industrial purposes control equipment3313 Manu.of industrial process control equipments3320 Manu.of optical instruments and photographic equipments3330 Manu.of watches and clocks

3410 Manu.of motor vehicles3411 Assembling of all kind of Motor vehicle3420 Manu.of bodies for Motor vehicles, Manu. of trailers & semi-trailers3430 Manu.of spare parts and accessories for motor vehicles & their engine3511 Building and repairing of ships3512 Building and repairing of pleasure & sporting boats3520 Manu.of railway & tramway locomatives & rolling stock3530 Manu.of aircraft and spacecraft3591 Manu.of motorcycles & motor tricycle (three wheelers)3592 Manu.of bicycles & invalid carraiges3593 Manu.of other transport equipment3599 Manu.of other transport equipment n.e.c3610 Manu.of furniture3691 Manu.of jewellery and related articles3692 Manu.of musical instruments3693 Manu.of sports goods3694 Manu.of toys & games3699 Other manufacturing not elsewhere classified3710 Reycycling of metal waste and scrap3720 Reycycling of non-metal waste and scrap4010 Production, collection & distribution of electricity4020 Manu.of gas4030 Steam and hot water supply4100 Collection, purification and distribution of water