annual survey report 2011 - simplyhealth · absence management 2011 1 2011 contents foreword 2 ......
TRANSCRIPT

Annual survey report 20112011ABSENCE
MANAGEMENT
in partnership with

AB
SEN
CE M
AN
AG
EM
EN
T 2011
1
2011
CONTENTS
Foreword 2
About us 4
suMMArY oF KeY FINdINGs 5
rAtes oF eMPLoYee AbseNCe 9
tHe Cost oF AbseNCe 16
CAuses oF AbseNCe 18
worK-reLAted stress 23
MANAGING AbseNCe 26
returN to worK Versus turNoVer FroM ILL HeALtH 35
eMPLoYee weLL-beING 38
eMPLoYee AbseNCe ANd tHe eCoNoMIC CLIMAte 42
CoNCLusIoNs 44
bACKGrouNd to tHe surVeY 46
FurtHer sourCes oF INForMAtIoN 50
ACKNowLedGeMeNts 51
cipd.co.uk/2011absencemanagem
entsurvey
2
ABSENCE MANAGEMENT
fOrEwOrd
Welcome to the twelfth edition of our Absence
Management survey report in partnership with
Simplyhealth. As in previous years, we provide
useful benchmarking data for organisations on
absence levels and the cost and causes of absence,
as well as a focus on employee well-being. In
addition, we report on the topical questions
we asked about the abolition of the Default
Retirement Age and levels of turnover due to ill
health, and we continue to track the effect of the
economic climate on employee absence.
Comparing this year’s survey results with those of
previous years suggests that the economic climate has
a considerable effect on employee absence, affecting
absence levels, the prevalence of reported stress
and mental health problems, and the number of
employees coming to work ill. Our results show that it
is therefore imperative to manage absence effectively,
regularly reviewing the suitability of approaches.
Reassuringly, this year’s results show that
organisations are taking a proactive approach
to absence management overall, responding to
the need to constantly reassess their absence
management policies, particularly in view of
the economic climate. For example, many public
sector organisations have further increased their
focus on employee well-being, in response to the
considerable organisation change and uncertainty
faced, despite reduced budgets.
However, there is still more that can be done
and this report refers to some of the challenges
organisations are facing now and anticipating over
the next year. A focus on well-being and active
health promotion is essential given the prevailing
uncertain environment, particularly in the public
sector where many organisations we surveyed are
anticipating redundancies. Furthermore, this year,
for the first time, we found stress to be the most
common cause of long-term absence, making an
even stronger case for action.
We feature Kent County Council as a case
study in this report, identifying the key factors
that underpin the success of their approach to
attendance management and how they are actively
promoting health and well-being. They take a
holistic approach to ensure a positive attendance
culture is firmly embedded in the council.
Sickness absence has also been a significant focus
for policy-makers over the last few months with
the launch in February 2011 of the Government-
commissioned independent review on this subject.
The review, jointly chaired by David Frost, formerly
director general of the British Chambers of
Commerce, and Dame Carol Black, National Director
for Health and Work, is exploring radical new ways
in which the current system can be changed to help
more people stay in work and reduce costs.
The CIPD has been closely involved in the review
and the data from the Absence Management survey
series has helped inform it.
We will be feeding our views into the Government
once the recommendations from the review have
been published.
dr Jill Miller
research Adviser, CIPd

AB
SEN
CE M
AN
AG
EM
EN
T 2011
3
2011
Simplyhealth is delighted to partner with the
CIPD for a second year to bring you the Absence
Management survey report. We believe that health
is the most important thing of all and that employer
health and well-being strategies play a fundamental
role in the management of absence. The survey
offers us, as HR professionals, insights that help us to
develop a strategy to keep absence at a sustainable
level and enable our employees to manage their
health and well-being.
The current economic climate is presenting additional
challenges as employers try to adapt to the difficult
economic conditions. They often have to make quick
decisions, which means that organisational change
can take place rapidly and more frequently, leaving
employees feeling the pressure.
In addition, their own household budgets are being
squeezed, pay rises are now less likely, and the price
of food and household bills continues to rise. This
means that the potential for employees to suffer
from stress is ever greater.
The fact that stress is a key cause of absence perhaps
suggests that its symptoms are not being identified
quickly enough. Alternatively, it could be that
employees are masking their symptoms so as not
to draw the attention of their employer. Many are
concerned about keeping their jobs and do not want
to ask for help.
By taking a proactive approach, employers can
reduce absence levels by educating employees and
introducing offerings which enable early detection
of health issues along with quick access to treatment
and support.
The survey provides us with insights that invite us to
ask what more employers can do to get employees
back to work quickly and to keep those at work
motivated and engaged.
Gill Phipps
Hr Policy Manager, simplyhealth
cipd.co.uk/2011absencemanagem
entsurvey
4
ABSENCE MANAGEMENT
ABOuT uS
CIPdThe Chartered Institute of Personnel and
Development (CIPD) is the world’s largest chartered
HR and development professional body. As a
globally recognised brand with over 135,000
members, we pride ourselves on supporting and
developing those responsible for the management
and development of people within organisations.
Our aim is to drive sustained organisation
performance through HR, shaping thinking, leading
practice and building HR capability within the
profession. Our topical research and public policy
activities set the vision, provide a voice for the
profession and promote new and improved HR and
management practices.
We know what good HR looks like and what HR
professionals need to know, do and deliver at
different stages of their career, be they specialists or
generalists, working in the UK or internationally.
We offer:
• membership
• professional development including
qualifications and training
• networking opportunities and world-class events
• expertise in HR capability-building and
consultancy services
• topical insights and analysis
• a wealth of resources and a voice for HR.
cipd.co.uk
simplyhealth
At Simplyhealth we focus on healthcare, so
individuals and businesses can rely on us for our
specialist knowledge. We’ve been helping people
access affordable healthcare for nearly 140 years.
We now help 2 million people with their health
and 11,000 companies choose us as their healthcare
provider. Our corporate clients include the John Lewis
Partnership, British Airways, Royal Mail and Tesco.
We offer private medical insurance, health cash
plans, dental plans and self-funded health plans
to help people with their everyday health and get
cover for the unexpected.
We’re committed to delivering exceptional personal
customer service and go out of our way to do the
right thing, not the easy thing. We were recently
named Best Private Health Provider at the Consumer
Moneyfacts Awards.
We also care about our communities and last year
donated £1.6 million to local causes and national
charities.
simplyhealth.co.uk

AB
SEN
CE M
AN
AG
EM
EN
T 2011
5
2011
SuMMAry Of kEy fiNdiNGS
Absence levelsMost organisations record their annual employee
absence rate, with larger organisations and the
public sector most likely to do so.
The average level of employee absence remains
at the 2010 level of 7.7 days per employee per
year; however, there is high variation across
organisations, with some reporting extremely high
levels of absence.
The average level of absence remains highest in
the public sector at 9.1 days per employee per
year, a decrease of 0.5 day from 2010. This year
the public sector figure is nearly matched by the
level of absence in the non-profit sector at 8.8
days per employee.
Absence is lowest in the private sector, particularly in
manufacturing and production organisations, where
levels have reduced in comparison with previous
years (5.7 days compared with 6.9 days in 2010). In
contrast, average absence levels have increased in
the private services sector (2011: 7.1 days; 2010: 6.6
days), although there is particularly high variation
within this sector.
As in previous years, we found that overall, larger
organisations have higher average levels of absence
than smaller organisations, although this trend is
not reflected in the public sector.
Overall, more organisations report their absence
levels have decreased (41%) compared with the
previous year than said it has increased (27%). One-
third report it has remained the same. The public
sector was most likely to report their absence levels
have improved compared with the previous year.
The majority of respondents, particularly in the
public sector, believe it is possible to reduce absence.
Length of absenceTwo-thirds of working time lost to absence is
accounted for by short-term absences of up to
seven days.
A larger proportion of manual workers’ absence
is long term compared with their non-manual
counterparts.
As found in previous years, a higher proportion
of absence in the public and non-profit sectors is
due to long-term absences of four weeks or longer
compared with the private sector, where nearly
three-quarters of absence is short term.
Smaller organisations are more likely to attribute
a higher proportion of their absence to short-term
leave compared with larger organisations.
this report sets out the findings of the CIPd’s twelfth national survey of absence management trends, policy and practice. the analysis is based on replies from 592 organisations across the uK, employing a total of nearly 2 million employees.

cipd.co.uk/2011absencemanagem
entsurvey
6
ABSENCE MANAGEMENT
Cost of absenceFewer than half of employers monitor the cost of
absence. The public sector and larger organisations
are most likely to do so.
The average annual cost of employee absence per
employee varies considerably across organisations,
partly because they include different costs in
their calculations. The median cost of absence
has increased compared with last year (£673 per
employee per year compared with £600 in 2010).
The public and non-profit sectors report higher costs
of absence per employee than the private sector.
The median annual cost per employee in the public
sector is £800 and in the non-profit sector it is £743
compared with £446 in private services and £444 in
the production and manufacturing sector.
Causes of absenceMinor illnesses (such as colds, flu, stomach upsets,
headaches and migraines) are by far the most
common cause of short-term absence.
Musculoskeletal injuries, back pain and stress are the
next most common causes of short-term absence.
Stress is more common for non-manual workers,
while musculoskeletal injuries and back pain are
more common for manual workers.
Home/family responsibilities are in the top five
most common causes of absence for two-fifths of
organisations.
As last year, approximately one in five employers
report that absences not due to genuine ill health
rank among the top five most common causes
of short-term absence for both manual and non-
manual workers. Non-genuine absence is reportedly
most common in private services organisations.
The most common causes of long-term absence are
stress, acute medical conditions (for example stroke,
heart attacks and cancer), musculoskeletal injuries,
mental ill health and back pain. Musculoskeletal
injuries and back pain are particularly common for
manual workers while stress is more common for
non-manual workers.
Stress is particularly common in the public and non-
profit sectors.
work-related stressNearly two-fifths of employers overall (50% in the
public sector) report that stress-related absence has
increased over the past year.
The top causes of stress at work are workloads,
management style, non-work factors such as
relationships and family, relationships at work and
considerable organisational change/restructuring.
Job insecurity is a more common cause of stress in
the public sector this year compared with last year
and is higher there than in the private or non-profit
sectors.
Three-fifths of organisations are taking steps to
identify and reduce stress in the workplace. As in
previous years, public services employers are most
likely to be proactively managing stress; however,
the proportion doing so has fallen in comparison
with previous years.
Popular methods to identify and reduce workplace
stress include using staff surveys, training for
managers/staff and flexible working options/
improved work–life balance.
Managing absence Almost all organisations surveyed have a written
absence/attendance management policy.
Just over half have introduced changes to some
aspect of their approach in the last year, with
public sector organisations most likely to have
made changes.
Overall, just under half of employers have a target in
place for reducing employee absence, although this
rises to 71% in the public sector.
ABSENCE MANAGEMENT
AB
SEN
CE M
AN
AG
EM
EN
T 2011
7
2011The most common methods used to manage
short-term absence are return-to-work interviews,
trigger mechanisms to review attendance, giving
sickness absence information to line managers and
disciplinary procedures for unacceptable absence.
The most common methods used to manage
long-term absence are return-to-work interviews,
occupational health involvement and giving sickness
absence information to line managers, followed by
trigger mechanisms to review attendance and risk
assessments to aid return to work.
Line managers take primary responsibility for
managing short-term absence in two-thirds of
organisations overall and more than three-quarters
in the public sector. They take responsibility
for managing long-term absence in 55% of
organisations overall (73% of the public sector).
Private sector employers are much more likely to
restrict sick pay than the public sector. They are also
more likely to offer private medical insurance and
attendance bonuses or incentives.
The public sector (and to a lesser extent the non-profit
sector) are more likely to use a range of methods
aimed at promoting good health and flexibility and
are more likely to report that attendance is driven
by the board. Nevertheless, fewer public sector
organisations are using stress counselling to manage
absence compared with last year.
Impact of the abolition of the default retirement Age (drA) on absenceThe majority of organisations believe the abolition
of the DRA will have no impact on their absence
levels, while a quarter believe it will increase
absence.
One in six organisations report they will increase
their focus on well-being provisions as a result of the
abolition of the DRA and three out of ten that they
will increase their use of flexible working practices as
a consequence.
Most organisations report that the abolition of
the DRA will have no impact on their provisions of
private medical insurance to employees.
return to work versus turnover from ill healthNearly three-fifths of employers report that no
employees had left their organisation due to ill
health in the last 12 months. A small proportion
(7%) had lost more than 10% of employees due to
ill health.
Two-thirds of organisations report that all their
employees who left in the last 12 months due to
ill health left after the first 28 weeks of absence.
Fewer than one in ten report that all employees who
had left due to ill health had left during the first 28
weeks of absence.
Two-fifths of employers report that everyone who
left during the first 28 weeks of absence did so
voluntarily, while one-fifth report all who left were
dismissed and a small minority (5%) that all took
early retirement. After the first 28 weeks of absence
leavers were less likely to leave voluntarily.
employee well-beingTwo-thirds of the public sector and one-third of the
private sector have an employee well-being strategy
in place.
The most commonly provided well-being benefits
are access to counselling services, followed by
employee assistance programmes and stop smoking
support.
The public sector are most likely to promote well-
being through benefits to facilitate healthy lifestyles.
The private sector are more likely to provide
insurance for employees.
One-quarter of organisations report their well-
being spend has increased this year, while one in six
report it has decreased. Similar changes in the same
direction are anticipated in 2012.
cipd.co.uk/2011absencemanagem
entsurvey
8
ABSENCE MANAGEMENT
Public sector organisations are most likely to report
their well-being spend has decreased over the past
year and anticipate further cuts in 2012.
Organisations that evaluate their well-being spend
are more likely to have increased their spend this
year and are more likely to increase it in 2012
compared with those who don’t evaluate.
employee absence and the recessionMore than two-fifths of public sector organisations
report they will be making redundancies over
the next six months (and a further third that
redundancies are a possibility), compared with one in
six in the private sector and a quarter of non-profits.
Half of employers use employee absence records as
part of their criteria for selecting for redundancy.
This figure rises to nearly three-quarters in the
manufacturing and production sector.
Over a quarter of organisations report an increase
in people coming to work ill in the last 12 months
and almost two-fifths have noted an increase in
reported mental health problems. These issues are
more common in organisations that are anticipating
redundancies in the next six months.
Over a quarter of organisations (two-fifths in the
public sector) report they have increased their focus
on employee well-being and health promotion as a
result of the economic context.

AB
SEN
CE M
AN
AG
EM
EN
T 2011
9
2011
rATES Of EMplOyEE ABSENCE
Most organisations now record their annual
employee absence rate, reflecting the relevance
of absence to productivity (2011: 81%; 2010: 82%;
2009: 70%; 2008: 72%). Larger organisations
are most likely to record this information, as are
the public sector (92% compared with 85% of
manufacturing and production, 80% of non-profits
and 72% of private services organisations).1
Table 1 shows that absence levels overall remain
the same as in 2010 at 7.7 days per employee per
year (or 3.4% of working time).
There was considerable variation in the levels of
absence reported by organisations in this year’s
survey, with a few organisations reporting very
high absence levels (standard deviation 3.5%,
or 8.0 days, compared with 1.9%, or 4.3 days in
2010).2 In order to avoid a few extreme cases
skewing the results, this year we report here on
the 5% trimmed mean.3 Last year we reported the
arithmetic mean because the standard deviation
was within acceptable limits.
Average absence rates overall remain at the 2010 level of 7.7 days per employee, per year. while, as in previous years, the absence rate tends to be highest in the public sector, many in this sector have noted improvements compared with previous years.
Table 1: Average level of employee absence, all employees
Average working time lost per year (%)
Average number of days lost per employee per year
MeanStandard deviation
5% trimmed mean Mean
Standard deviation
5% trimmed mean
2011: all employees 3.8 3.5 3.4 8.7 8.0 7.7*
2010: all employees 3.4 1.9 3.2 7.7* 4.3 7.4
Base: 403 (2011); 429 (2010)
*This year we are using the 5% trimmed mean because the large standard deviation shows there is high variation across organisations, with some reporting extremely high levels of absence. In 2010 we reported the arithmetic mean because the standard deviation was within acceptable limits, showing less variation in the level of absence reported by organisations. We have included both the mean and 5% trimmed mean in Table 1 for reference.

cipd.co.uk/2011absencemanagem
entsurvey
10
ABSENCE MANAGEMENT
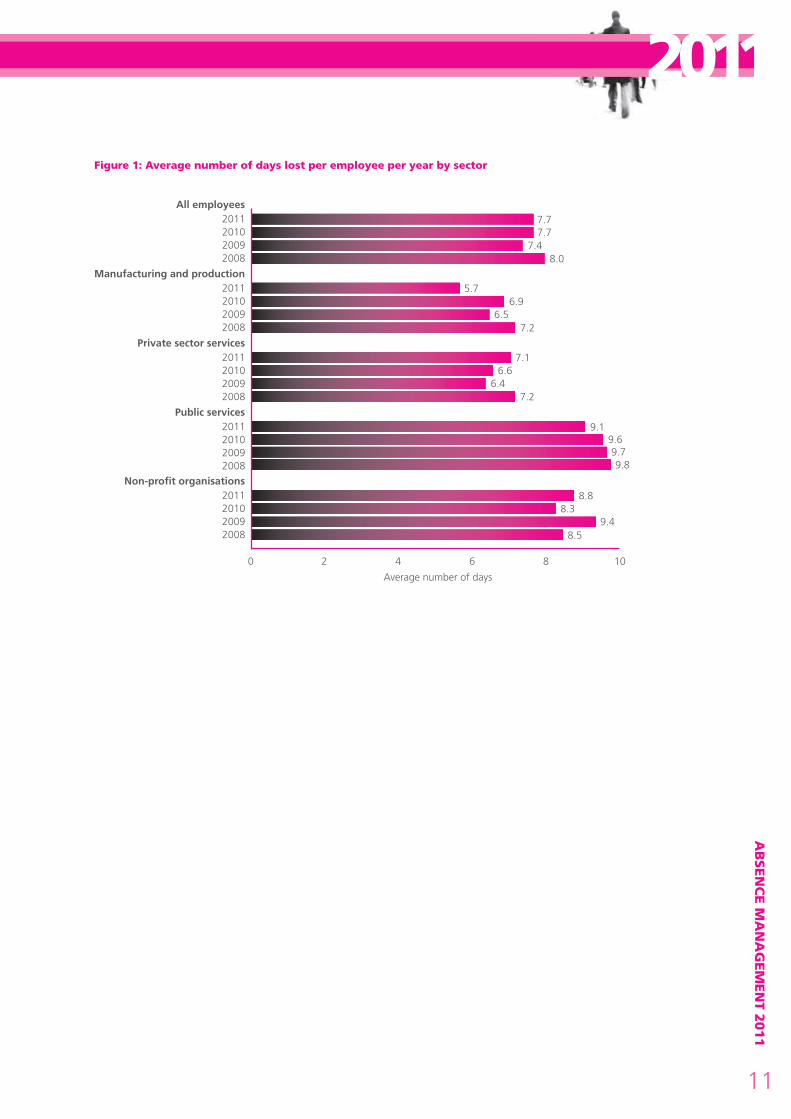
sector variationsThere is considerable variation in levels of employee
absence across sectors (Table 2). As in previous
years, the average level of absence remains highest
in the public sector at 9.1 days per employee per
year (2010: 9.6 days; 2009: 9.7 days; 2008: 9.8 days),
although this year it is nearly matched by the level
of absence in the non-profit sector at 8.8 days (2010:
8.3 days; 2009: 9.4 days; 2008: 8.5 days).
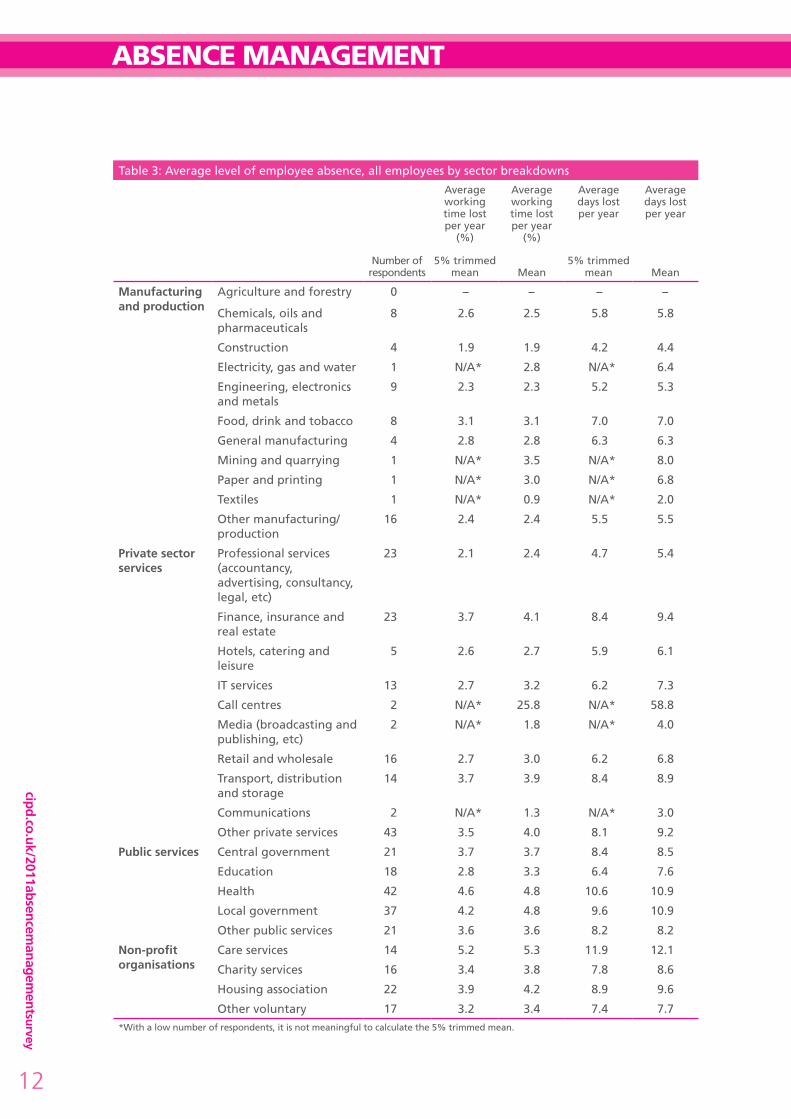
Absence levels are lowest in the manufacturing
and production sector where they have reduced
in comparison with previous years (2011: 5.7
days; 2010: 6.9 days). In contrast, average absence
levels have increased in the private services sector
(2011: 7.1 days; 2010: 6.6 days), although there
is particularly high variation within this sector
(Table 3). Call centres, finance, insurance and real
estate, and transport, distribution and storage
organisations were most likely to report higher
absence rates, although comparisons should be
treated with caution due to the small number
of responses in each industry. There is also
considerable variation within sectors. For example,
of the two call centres in our sample who recorded
an absence level, one reported their average
working time lost per year was 4%, the other 48%.
It is interesting to compare absence levels across
sectors since 2008 (Figure 1), which suggests
that changes in absence levels are reflecting the
economic climate.
Table 2: Average level of employee absence, by sector for all, manual and non-manual employees
Average working time lost per year (%)
Average number of days lost per employee per year
Number of respondents
5% trimmed mean
Standard deviation
5% trimmed mean
Standard deviation
All employees
Manufacturing and production 53 2.5 1.1 5.7 2.5
Private sector services 143 3.1 5.0 7.1 11.4
Public services 138 4.0 2.4 9.1 5.5
Non-profit organisations 68 3.9 2.5 8.8 5.6
total 403 3.4 3.5 7.7 8.0
Manual employees
Manufacturing and production 24 2.7 1.2 6.2 2.8
Private sector services 24 2.3 5.6 5.3 12.9
Public services 7 2.8 2.6 6.4 6.0
Non-profit organisations 5 3.6 3.8 8.1 8.8
total 61 2.5 3.8 5.7 8.7
Non-manual employees
Manufacturing and production 24 2.0 3.5 4.6 8.1
Private sector services 46 2.2 2.9 5.0 6.6
Public services 19 3.4 2.2 7.8 4.9
Non-profit organisations 13 2.7 1.7 6.0 3.9
total 103 2.4 2.8 5.5 6.4
AB
SEN
CE M
AN
AG
EM
EN
T 2011
11
2011
2011201020092008
5.76.9
6.57.2
Manufacturing and production
2011201020092008
7.16.6
6.47.2
Private sector services
8.88.3
9.48.5
2011201020092008
Non-profit organisations
9.19.69.79.8
2011201020092008
Public services
2011201020092008
All employees
7.4
7.77.7
8.0
0 2 4 6 8 10
Average number of days
figure 1: Average number of days lost per employee per year by sector
cipd.co.uk/2011absencemanagem
entsurvey
12
ABSENCE MANAGEMENT
Table 3: Average level of employee absence, all employees by sector breakdowns
Average working time lost per year
(%)
Average working time lost per year
(%)
Average days lost per year
Average days lost per year
Number of respondents
5% trimmed mean Mean
5% trimmed mean Mean
Manufacturing and production
Agriculture and forestry 0 – – – –
Chemicals, oils and pharmaceuticals
8 2.6 2.5 5.8 5.8
Construction 4 1.9 1.9 4.2 4.4
Electricity, gas and water 1 N/A* 2.8 N/A* 6.4
Engineering, electronics and metals
9 2.3 2.3 5.2 5.3
Food, drink and tobacco 8 3.1 3.1 7.0 7.0
General manufacturing 4 2.8 2.8 6.3 6.3
Mining and quarrying 1 N/A* 3.5 N/A* 8.0
Paper and printing 1 N/A* 3.0 N/A* 6.8
Textiles 1 N/A* 0.9 N/A* 2.0
Other manufacturing/production
16 2.4 2.4 5.5 5.5
Private sector services
Professional services (accountancy, advertising, consultancy, legal, etc)
23 2.1 2.4 4.7 5.4
Finance, insurance and real estate
23 3.7 4.1 8.4 9.4
Hotels, catering and leisure
5 2.6 2.7 5.9 6.1
IT services 13 2.7 3.2 6.2 7.3
Call centres 2 N/A* 25.8 N/A* 58.8
Media (broadcasting and publishing, etc)
2 N/A* 1.8 N/A* 4.0
Retail and wholesale 16 2.7 3.0 6.2 6.8
Transport, distribution and storage
14 3.7 3.9 8.4 8.9
Communications 2 N/A* 1.3 N/A* 3.0
Other private services 43 3.5 4.0 8.1 9.2
Public services Central government 21 3.7 3.7 8.4 8.5
Education 18 2.8 3.3 6.4 7.6
Health 42 4.6 4.8 10.6 10.9
Local government 37 4.2 4.8 9.6 10.9
Other public services 21 3.6 3.6 8.2 8.2
Non-profit organisations
Care services 14 5.2 5.3 11.9 12.1
Charity services 16 3.4 3.8 7.8 8.6
Housing association 22 3.9 4.2 8.9 9.6
Other voluntary 17 3.2 3.4 7.4 7.7*With a low number of respondents, it is not meaningful to calculate the 5% trimmed mean.
AB
SEN
CE M
AN
AG
EM
EN
T 2011
13
2011Manual and non-manual absence levelsPrevious years’ surveys have found that manual
workers have a higher level of absence than non-
manual workers. This year differences between
manual and non-manual absence levels are not
significant, although findings here are limited by
the small number of organisations reporting both
manual and non-manual levels of absence.
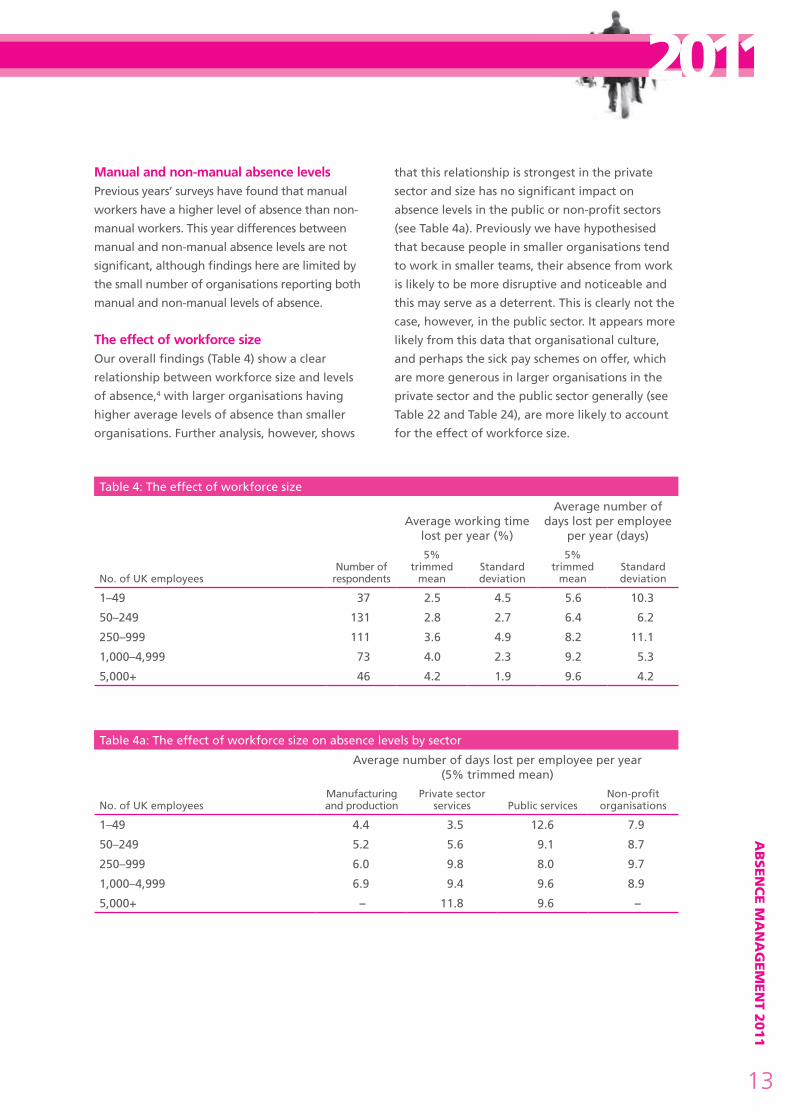
the effect of workforce sizeOur overall findings (Table 4) show a clear
relationship between workforce size and levels
of absence,4 with larger organisations having
higher average levels of absence than smaller
organisations. Further analysis, however, shows
that this relationship is strongest in the private
sector and size has no significant impact on
absence levels in the public or non-profit sectors
(see Table 4a). Previously we have hypothesised
that because people in smaller organisations tend
to work in smaller teams, their absence from work
is likely to be more disruptive and noticeable and
this may serve as a deterrent. This is clearly not the
case, however, in the public sector. It appears more
likely from this data that organisational culture,
and perhaps the sick pay schemes on offer, which
are more generous in larger organisations in the
private sector and the public sector generally (see
Table 22 and Table 24), are more likely to account
for the effect of workforce size.
Table 4: The effect of workforce size
Average working time lost per year (%)
Average number of days lost per employee
per year (days)
No. of UK employeesNumber of
respondents
5% trimmed
meanStandard deviation
5% trimmed
meanStandard deviation
1–49 37 2.5 4.5 5.6 10.3
50–249 131 2.8 2.7 6.4 6.2
250–999 111 3.6 4.9 8.2 11.1
1,000–4,999 73 4.0 2.3 9.2 5.3
5,000+ 46 4.2 1.9 9.6 4.2
Table 4a: The effect of workforce size on absence levels by sector
Average number of days lost per employee per year (5% trimmed mean)
No. of UK employeesManufacturing and production
Private sector services Public services
Non-profit organisations
1–49 4.4 3.5 12.6 7.9
50–249 5.2 5.6 9.1 8.7
250–999 6.0 9.8 8.0 9.7
1,000–4,999 6.9 9.4 9.6 8.9
5,000+ – 11.8 9.6 –
cipd.co.uk/2011absencemanagem
entsurvey
14
ABSENCE MANAGEMENT
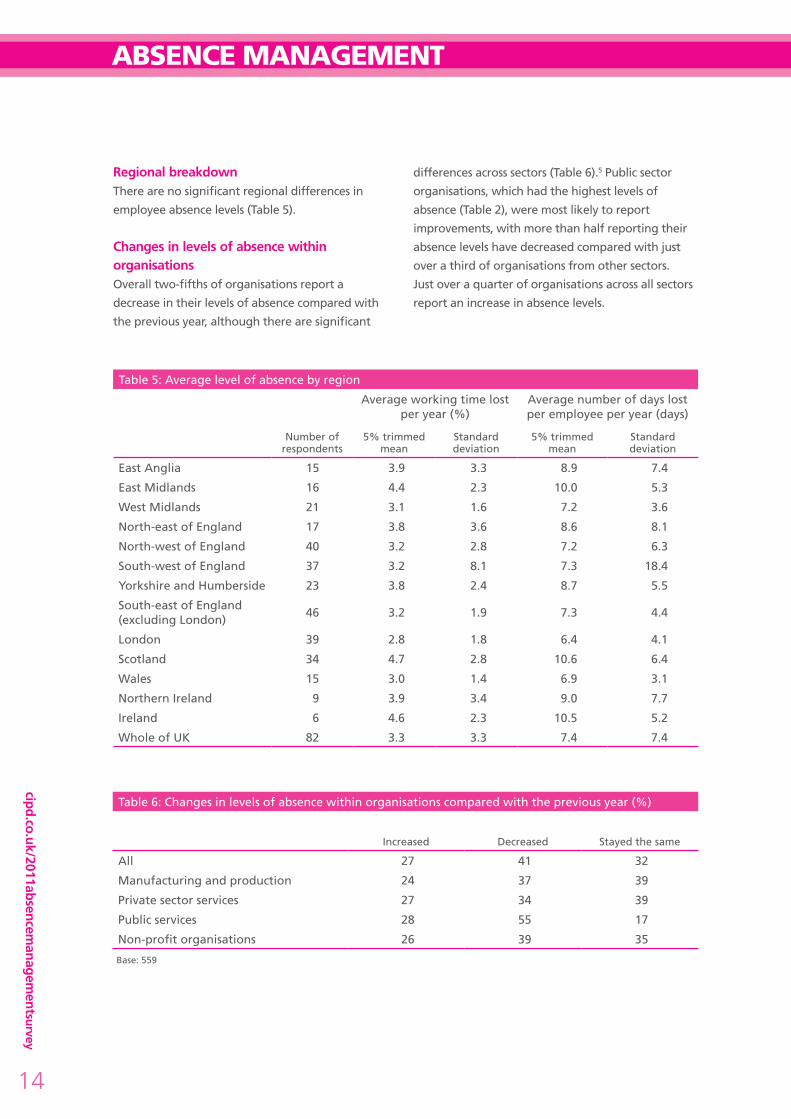
regional breakdownThere are no significant regional differences in
employee absence levels (Table 5).
Changes in levels of absence within organisationsOverall two-fifths of organisations report a
decrease in their levels of absence compared with
the previous year, although there are significant
differences across sectors (Table 6).5 Public sector
organisations, which had the highest levels of
absence (Table 2), were most likely to report
improvements, with more than half reporting their
absence levels have decreased compared with just
over a third of organisations from other sectors.
Just over a quarter of organisations across all sectors
report an increase in absence levels.
Table 5: Average level of absence by region
Average working time lost per year (%)
Average number of days lost per employee per year (days)
Number of respondents
5% trimmed mean
Standard deviation
5% trimmed mean
Standard deviation
East Anglia 15 3.9 3.3 8.9 7.4
East Midlands 16 4.4 2.3 10.0 5.3
West Midlands 21 3.1 1.6 7.2 3.6
North-east of England 17 3.8 3.6 8.6 8.1
North-west of England 40 3.2 2.8 7.2 6.3
South-west of England 37 3.2 8.1 7.3 18.4
Yorkshire and Humberside 23 3.8 2.4 8.7 5.5
South-east of England (excluding London)
46 3.2 1.9 7.3 4.4
London 39 2.8 1.8 6.4 4.1
Scotland 34 4.7 2.8 10.6 6.4
Wales 15 3.0 1.4 6.9 3.1
Northern Ireland 9 3.9 3.4 9.0 7.7
Ireland 6 4.6 2.3 10.5 5.2
Whole of UK 82 3.3 3.3 7.4 7.4
Table 6: Changes in levels of absence within organisations compared with the previous year (%)
Increased Decreased Stayed the same
All 27 41 32
Manufacturing and production 24 37 39
Private sector services 27 34 39
Public services 28 55 17
Non-profit organisations 26 39 35
Base: 559
AB
SEN
CE M
AN
AG
EM
EN
T 2011
15
2011Most employers believe it is possible to further
reduce employee absence (81%). Only one in ten
do not think it is possible (9% reported they don’t
know). As in previous years, the public sector is most
likely to believe they can reduce employee absence
(90% compared with 76% in the private sector).6
Larger organisations are also more likely to believe
they can reduce absence.7
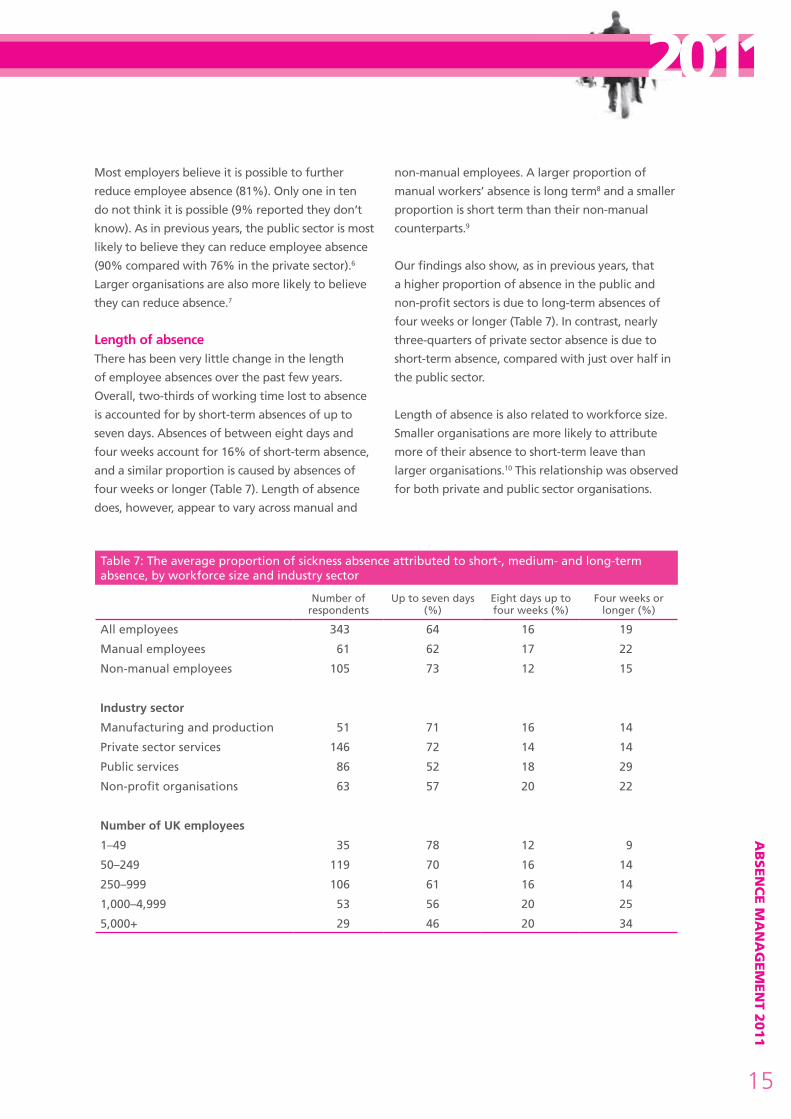
Length of absenceThere has been very little change in the length
of employee absences over the past few years.
Overall, two-thirds of working time lost to absence
is accounted for by short-term absences of up to
seven days. Absences of between eight days and
four weeks account for 16% of short-term absence,
and a similar proportion is caused by absences of
four weeks or longer (Table 7). Length of absence
does, however, appear to vary across manual and
non-manual employees. A larger proportion of
manual workers’ absence is long term8 and a smaller
proportion is short term than their non-manual
counterparts.9
Our findings also show, as in previous years, that
a higher proportion of absence in the public and
non-profit sectors is due to long-term absences of
four weeks or longer (Table 7). In contrast, nearly
three-quarters of private sector absence is due to
short-term absence, compared with just over half in
the public sector.
Length of absence is also related to workforce size.
Smaller organisations are more likely to attribute
more of their absence to short-term leave than
larger organisations.10 This relationship was observed
for both private and public sector organisations.
Table 7: The average proportion of sickness absence attributed to short-, medium- and long-term absence, by workforce size and industry sector
Number of respondents
Up to seven days (%)
Eight days up to four weeks (%)
Four weeks or longer (%)
All employees 343 64 16 19
Manual employees 61 62 17 22
Non-manual employees 105 73 12 15
Industry sector
Manufacturing and production 51 71 16 14
Private sector services 146 72 14 14
Public services 86 52 18 29
Non-profit organisations 63 57 20 22
Number of uK employees
1–49 35 78 12 9
50–249 119 70 16 14
250–999 106 61 16 14
1,000–4,999 53 56 20 25
5,000+ 29 46 20 34

cipd.co.uk/2011absencemanagem
entsurvey
16
ABSENCE MANAGEMENT
THE COST Of ABSENCE
the average annual absence costs per employee have increased compared with last year, although they vary considerably across organisations. Fewer than half of employers monitor the cost of absence.
As in previous years, fewer than half (2011: 42%;
2010: 45%; 2009: 41%) of organisations surveyed
report they monitor the cost of employee absence,
despite the importance of this information for
identifying the cost-benefits of investing in
better absence management practices (Table 8).
Unsurprisingly, larger organisations are significantly
more likely to monitor the cost11 as are public
services organisations.12
There is considerable variation in the reported
average annual cost of employee absence per
employee (Table 9). This is at least partly due to our
findings that organisations include different costs
in their calculations (Table 10). On average, the
reported cost of absence per employee was higher
than last year (median £673 compared with £600
in 2010). This figure masks considerable variation
across sectors. The public and non-profit sectors
report higher costs of absence per employee than
the private sector, no doubt due to their more
generous sick pay schemes (Table 22 and Table 24)
but perhaps also because in these sectors a higher
proportion of absence is long term (Table 7) and
consequently more costly to the business.
Table 8: Proportion of organisations that monitor the cost of employee absence (%)
Does your organisation monitor the cost of employee absence?
Yes No Don’t know
All organisations 43 46 11
Industry sector
Manufacturing and production 32 58 10
Private sector services 40 51 9
Public services 54 34 11
Non-profit organisations 38 47 15
Number of uK employees
1–49 23 68 9
50–249 39 54 7
250–999 43 50 7
1,000–4,999 49 33 19
5,000+ 66 18 16Base: 591

AB
SEN
CE M
AN
AG
EM
EN
T 2011
17
2011Table 9: Average annual cost of absence per employee per year
Cost (£) per employee per year
Number of respondents
Median (2010)
5% trimmed meanA (2010) Minimum Maximum
All 135 673 (600) 798 (693) 13 1,080,925
Manufacturing and production 13 444 (400) 598 (530) 40 2,236
Private sector services 57 446 (600) 686 (790) 28 1,080,925
Public services 39 800 (889) 1538 (862) 13 500,000
Non-profit organisations 22 743 (600) 803 (581) 60 3,000AThe 5% trimmed mean is used where there are some extreme outliers. The 5% trimmed mean is the arithmetic mean calculated when the largest 5% and the smallest 5% of the cases have been eliminated. Eliminating extreme cases from the computation of the mean results in a better estimate of central tendency when extreme outliers exist.
Table 10: Criteria included in calculation of average cost of employee absence per employee
%
Occupational sick pay 81
Statutory sick pay 65
Temporary cover 27
Additional overtime costs 23
Lost production or service provision 21
Other 6
Base: 233

cipd.co.uk/2011absencemanagem
entsurvey
18
ABSENCE MANAGEMENT
CAuSES Of ABSENCE
Most organisations (84%) collect information on
the causes of employee absence (2010: 86%). The
public and non-profit sectors are particularly likely
to do this (93% and 95% respectively compared
with 81% in the private sector).13 Respondents
were asked to rank the five most common causes
of short- and long-term absence, for both manual
and non-manual workers.
short-term absenceAs in previous years, almost all organisations
report that the main cause of short-term absence
(four weeks or less) for both manual and non-
manual workers is minor illness, including colds,
flu, stomach upsets, headaches and migraines
(Table 11). The next most common causes of short-
term absence are musculoskeletal injuries, back
pain and stress, although musculoskeletal injuries
and back pain are more common causes of absence
for manual workers, while stress appears to be
more common for non-manual workers.
Similar to previous years, home/family
responsibilities are in the top five most common
causes of absence for two-fifths of organisations,
reflecting the continued need for flexible working
arrangements. There has also been little change
in the proportion of organisations reporting that
absences not due to genuine ill health rank among
the top five most common causes of absence for
both manual and non-manual workers. Addressing
such ‘illegitimate’ absences through appropriate
attendance policies and absence information
systems could have a significant impact on
productivity for these employers.
sector differencesIn line with findings from previous years, stress
and mental ill health are more common causes of
absence in the public sector than in the private
for both manual and non-manual workers (Table
12 and Table 13). Musculoskeletal injuries in both
manual and non-manual workers and back pain in
non-manual workers are also more common in the
public sector.
In contrast, private sector organisations are more
likely than the public or non-profit sectors to report
home/family responsibilities among their top
five causes of absence for both manual and non-
manual workers. This may partly reflect the typically
better flexible working practices offered by public
sector employers (see Table 22 and Table 24) and
underlines the importance of providing good work–
life balance opportunities to employees.
Private services organisations are also more likely
to cite non-genuine absence as a common cause
of short-term absence for manual and non-manual
workers than public services or non-profit employers.
Manufacturing and production organisations are
more likely to report injuries not related to work as
a key cause of absence for both manual and non-
manual workers.
by far the most common cause of short-term absence is minor illness, including colds, flu, stomach upsets, headaches and migraines. the most common causes of long-term absence are stress, acute medical conditions, musculoskeletal injuries, mental ill health and back pain.

AB
SEN
CE M
AN
AG
EM
EN
T 2011
19
2011Table 11: Common causes of short-term absence (%)
Most common causeIn top 5 most
common causes
Manual Non-manual Manual Non-manual
Minor illness (for example colds/flu, stomach upsets, headaches and migraines)
81 91 97 98
Musculoskeletal injuries (for example neck strains and repetitive strain injury, but excluding back pain)
8 2 62 50
Back pain 4 1 61 43
Stress 3 4 49 57
Home/family responsibilities 1 0 39 40
Recurring medical conditions (for example asthma, angina and allergies)
1 0 37 40
Mental ill health (for example clinical depression and anxiety)
1 1 25 31
Injuries/accidents not related to work 1 0 24 22
Other absences not due to genuine ill health 1 1 21 21
Acute medical conditions (for example stroke, heart attack and cancer)
0 1 17 18
Work-related injuries/accidents 0 0 15 3
Pregnancy-related absence (not maternity leave) 0 0 9 14
Drink- or drug-related conditions 0 0 2 1Base: Manual: 306; Non-manual: 350
Table 12: Top five most common causes of short-term absence for manual workers, by sector (%)
All organisations
Manufacturing and production
Private sector services Public services
Non-profit organisations
Minor illness (for example colds/flu, stomach upsets, headaches and migraines)
97 97 95 99 98
Musculoskeletal injuries (for example neck strains and repetitive strain injury, but excluding back pain)
62 61 57 72 61
Back pain 61 69 56 64 61
Stress 49 28 46 69 53
Home/family responsibilities 39 47 48 27 27
Recurring medical conditions (for example asthma, angina and allergies)
37 41 40 32 33
Mental ill health (for example clinical depression and anxiety)
25 19 21 31 35
Injuries/accidents not related to work 24 38 20 16 27
Other absences not due to genuine ill health
21 17 30 11 20
Acute medical conditions (for example stroke, heart attack and cancer)
17 19 19 16 14
Work-related injuries/accidents 15 20 10 20 14
Pregnancy-related absence (not maternity leave)
9 3 13 9 6
Drink- or drug-related conditions 2 2 2 4 0Base: 305

cipd.co.uk/2011absencemanagem
entsurvey
20
ABSENCE MANAGEMENT
Long-term absenceThe most common causes of long-term absence
(four weeks or more) among manual and non-
manual workers are stress, acute medical conditions
(for example stroke, heart attack and cancer),
musculoskeletal injuries (for example neck strains
and repetitive strain injury), mental ill health and
back pain (Table 14). Musculoskeletal injuries and
back pain are particularly common for manual
workers while stress is more common for non-
manual workers. These findings are very similar to
last year; however, stress is now the top cause of
long-term absence. The proportion of organisations
reporting that stress is the most common cause
of absence for non-manual workers has risen to a
third this year (33%) from a quarter last year (24%).
While illegitimate absence is more commonly
reported to be a cause of short-term than long-
term absence, 6% still report this among their top
five most common causes of long-term absence for
manual and 8% for non-manual workers.
sector differences The public and non-profit sectors are most likely
to report stress is a common cause of long-term
absence (as well as short-term absence) compared
with organisations in the private sector (Table
15 and Table 16). Manufacturing and production
employers least frequently cited mental ill health as
a major cause of long-term absence, compared with
the other sectors. Musculoskeletal injuries and back
pain are least common in the private services sector.
Table 13: Top five most common causes of short-term absence for non-manual workers, by sector (%)
All organisations
Manufacturing and production
Private sector services Public services
Non-profit organisations
Minor illness (for example colds/flu, stomach upsets, headaches and migraines)
98 94 99 98 100
Stress 57 53 48 72 58
Musculoskeletal injuries (for example neck strains and repetitive strain injury, but excluding back pain)
50 28 46 65 55
Back pain 43 38 37 54 47
Home/family responsibilities 40 43 52 24 33
Recurring medical conditions (for example asthma, angina and allergies)
40 32 42 37 45
Mental ill health (for example clinical depression and anxiety)
31 25 26 38 35
Injuries/accidents not related to work 22 32 21 16 27
Other absences not due to genuine ill health
22 23 29 13 17
Acute medical conditions (for example stroke, heart attack and cancer)
18 25 16 16 22
Pregnancy-related absence (not maternity leave)
14 9 18 13 13
Work-related injuries/accidents 3 0 2 7 3
Drink- or drug-related conditions 1 0 1 2 2Base: 348

AB
SEN
CE M
AN
AG
EM
EN
T 2011
21
2011
Table 15: Top five most common causes of long-term absence for manual workers, by sector (%)
All organisations
Manufacturing and production
Private sector services Public services
Non-profit organisations
Stress 58 38 55 70 69
Acute medical conditions (for example stroke, heart attack and cancer)
57 61 56 59 51
Musculoskeletal injuries (for example neck strains and repetitive strain injury, but excluding back pain)
57 61 44 73 55
Back pain 50 55 41 56 57
Mental ill health (for example clinical depression and anxiety)
46 32 50 53 43
Injuries/accidents not related to work 30 30 32 25 31
Recurring medical conditions (for example asthma, angina and allergies)
28 34 29 29 20
Work-related injuries/accidents 20 27 12 29 16
Home/family responsibilities 13 11 15 14 8
Minor illness (for example colds/flu, stomach upsets, headaches and migraines)
11 4 13 14 10
Pregnancy-related absence (not maternity leave)
10 5 15 10 6
Other absences not due to genuine ill health
6 4 8 5 4
Drink- or drug-related conditions 1 0 2 3 0Base: 286
Table 14: Common causes of long-term absence (%)
Most common causeIn top 5 most
common causes
Manual Non-manual Manual Non-manual
Stress 21 33 58 68
Acute medical conditions (for example stroke, heart attack and cancer)
21 24 57 62
Musculoskeletal injuries (for example neck strains and repetitive strain injury, but excluding back pain)
17 7 57 46
Mental ill health (for example clinical depression and anxiety)
11 18 46 54
Back pain 11 4 50 41
Injuries/accidents not related to work 8 6 30 32
Recurring medical conditions (for example asthma, angina and allergies)
4 3 28 29
Minor illness (for example colds/flu, stomach upsets, headaches and migraines)
3 3 11 8
Pregnancy-related absence (not maternity leave) 2 1 10 12
Work-related injuries/accidents 1 1 20 7
Home/family responsibilities 1 0 13 11
Other absences not due to genuine ill health 0 1 6 8
Drink- or drug-related conditions 0 0 1 2Base: Manual: 286; Non-manual: 304

cipd.co.uk/2011absencemanagem
entsurvey
22
ABSENCE MANAGEMENT
Table 16: Top five most common causes of long-term absence for non-manual workers, by sector (%)
All organisations
Manufacturing and production
Private sector services Public services
Non-profit organisations
Stress 68 54 63 80 70
Acute medical conditions (for example stroke, heart attack and cancer)
62 64 57 67 64
Mental ill health (for example clinical depression and anxiety)
53 33 54 57 62
Musculoskeletal injuries (for example neck strains and repetitive strain injury, but excluding back pain)
46 38 36 65 43
Back pain 42 38 29 59 43
Injuries/accidents not related to work 32 33 30 23 49
Recurring medical conditions (for example asthma, angina and allergies)
29 33 32 24 28
Pregnancy-related absence (not maternity leave)
12 8 20 8 6
Home/family responsibilities 11 10 12 13 8
Minor illness (for example colds/flu, stomach upsets, headaches and migraines)
8 8 8 13 2
Other absences not due to genuine ill health
8 5 13 6 2
Work-related injuries/accidents 7 5 5 10 6
Drink- or drug-related conditions 2 0 0 6 2Base: 303
AB
SEN
CE M
AN
AG
EM
EN
T 2011
23
2011
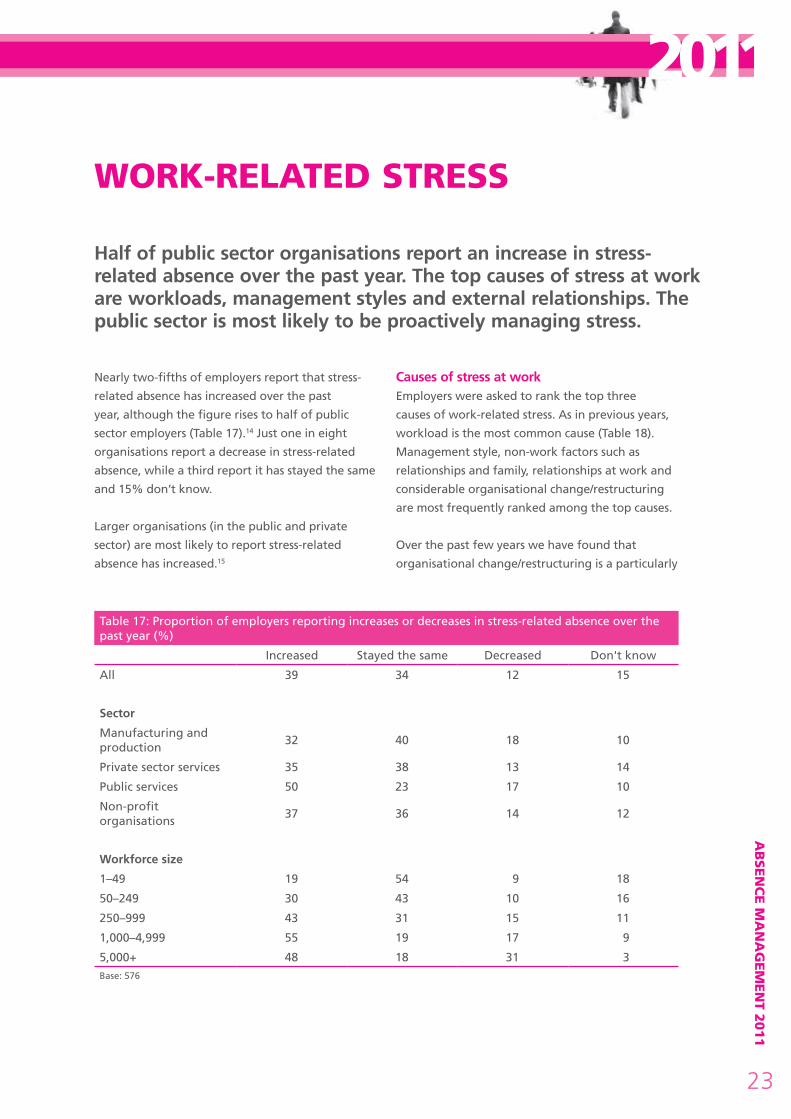
wOrk-rElATEd STrESS
Nearly two-fifths of employers report that stress-
related absence has increased over the past
year, although the figure rises to half of public
sector employers (Table 17).14 Just one in eight
organisations report a decrease in stress-related
absence, while a third report it has stayed the same
and 15% don’t know.
Larger organisations (in the public and private
sector) are most likely to report stress-related
absence has increased.15
Causes of stress at workEmployers were asked to rank the top three
causes of work-related stress. As in previous years,
workload is the most common cause (Table 18).
Management style, non-work factors such as
relationships and family, relationships at work and
considerable organisational change/restructuring
are most frequently ranked among the top causes.
Over the past few years we have found that
organisational change/restructuring is a particularly
Half of public sector organisations report an increase in stress-related absence over the past year. the top causes of stress at work are workloads, management styles and external relationships. the public sector is most likely to be proactively managing stress.
Table 17: Proportion of employers reporting increases or decreases in stress-related absence over the past year (%)
Increased Stayed the same Decreased Don't know
All 39 34 12 15
sector
Manufacturing and production
32 40 18 10
Private sector services 35 38 13 14
Public services 50 23 17 10
Non-profit organisations
37 36 14 12
workforce size
1–49 19 54 9 18
50–249 30 43 10 16
250–999 43 31 15 11
1,000–4,999 55 19 17 9
5,000+ 48 18 31 3Base: 576

cipd.co.uk/2011absencemanagem
entsurvey
24
ABSENCE MANAGEMENT
Table 18: The causes of work-related stress (top three causes, %)All
respondents
Manufacturing
and production
Private sector
services Public services
Non-profit
organisations
Workloads/volume of work 48 34 49 48 54
Management style 40 44 41 41 35
Non-work factors – relationships/family 37 40 41 24 48
Relationships at work 31 34 29 31 37
Considerable organisational change/restructuring
31 21 19 52 29
Poorly managed organisational change/restructuring
18 21 15 24 13
Pressure to meet targets 17 16 24 13 8
Job insecurity 17 12 14 24 14
Lack of employee support from line managers
16 14 20 13 11
Long hours 12 14 13 8 14
Non-work factors – financial concerns 11 16 13 8 8
Lack of control over how work is carried out
7 11 8 4 5
Poorly designed jobs/poorly designed roles
5 10 5 4 2
Lack of training 4 4 4 3 2
Lack of consultation 4 3 5 4 1Base: 526
common cause of stress in the public services sector.
This year we rephrased this response category and
included an additional item to ascertain whether
it is the ineffective management of organisational
change in the public sector or the quantity of
change in this sector that is the key issue. The
findings suggest the latter, as twice as many public
as private sector employers report that considerable
organisational change/restructuring is a main cause
of stress. While a quarter of the public sector also
report that poorly managed organisational change/
restructuring is a main cause of stress, the proportion
is more similar to that in the other sectors.
Unsurprisingly, given the significant budget cuts and
the anticipated redundancies in much of the public
sector (see section on employee absence and the
economic climate), job insecurity is a more common
cause of stress in the public sector this year (24%)
compared with last year (10%) and is higher than in
the private or non-profit sectors (Table 18).
Managing stressThree out of five respondents (58%) report that
their organisations are taking steps to identify and
reduce stress in the workplace. Just under a third
(29%) report their organisations are not doing
anything to reduce stress, while 13% report they
don’t know. There is no relationship between
whether organisations have noted an increase in
stress-related absence and whether they are taking
steps to identify and reduce stress, suggesting
that many organisations may fail to respond to
information about the causes of absence.
While, as in previous years, public sector employers
are most likely to be proactively managing stress
(69% compared with 59% of non-profit employers,
58% of manufacturing and production and 49% of
private sector services employers),16 the proportion
doing so has fallen in comparison with previous
years (2011: 69%; 2010: 81%; 2009: 85%; 2008:
84%). This may be a consequence of the current

AB
SEN
CE M
AN
AG
EM
EN
T 2011
25
2011budget cuts; however, ensuring well-being is
particularly important at times of significant
change to protect employees and both short- and
long-term productivity. Size of organisation is not a
relevant factor.
Organisations use a range of methods to identify
and reduce stress in the workplace (Table 19). The
most popular approaches include staff surveys,
training for managers/staff and flexible working
options/improved work–life balance. Public sector
organisations are most likely to use almost all
of the methods we listed. Overall, there is little
change compared with previous years, although
more private services employers report they are
conducting risk assessments/stress audits this year
(56% compared with 43% in 2010, 49% in 2009
and 45% in 2008).
Table 19: Methods used to identify and reduce stress in the workplace (% of employers)
All respondents
Manufacturing and production
Private sector services
Public services
Non-profit organisations
Staff surveys 67 49 56 84 71
Training for managers/staff 65 60 56 73 69
Flexible working options/improved work–life balance
63 38 61 70 75
Risk assessments/stress audits 62 64 56 70 58
Written stress policy/guidance 52 40 47 66 42
Employee assistance programme 46 40 44 53 38
Greater involvement of occupational health specialists
44 51 27 59 38
Health and Safety Executive's stress management standards
30 20 21 41 33
Changes in work organisation 21 20 23 22 13
Focus groups 20 13 15 26 21Base: 333
cipd.co.uk/2011absencemanagem
entsurvey
26
ABSENCE MANAGEMENT
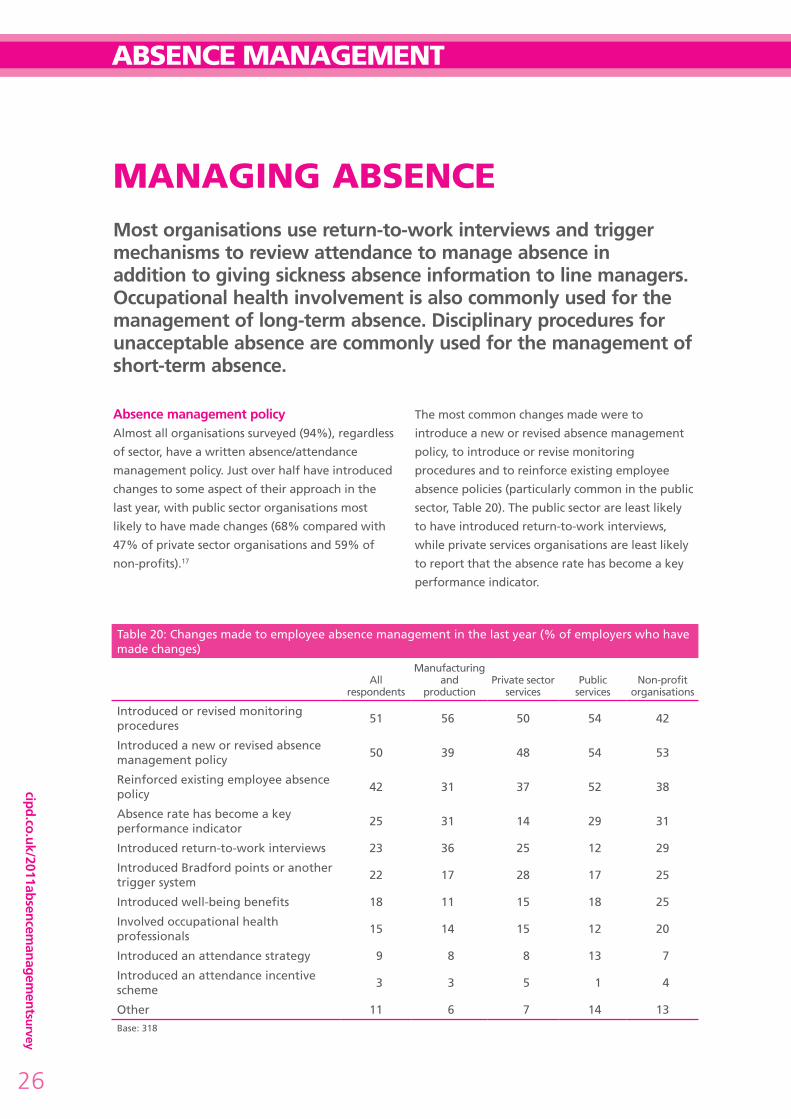
MANAGiNG ABSENCE
Absence management policyAlmost all organisations surveyed (94%), regardless
of sector, have a written absence/attendance
management policy. Just over half have introduced
changes to some aspect of their approach in the
last year, with public sector organisations most
likely to have made changes (68% compared with
47% of private sector organisations and 59% of
non-profits).17
The most common changes made were to
introduce a new or revised absence management
policy, to introduce or revise monitoring
procedures and to reinforce existing employee
absence policies (particularly common in the public
sector, Table 20). The public sector are least likely
to have introduced return-to-work interviews,
while private services organisations are least likely
to report that the absence rate has become a key
performance indicator.
Most organisations use return-to-work interviews and trigger mechanisms to review attendance to manage absence in addition to giving sickness absence information to line managers. occupational health involvement is also commonly used for the management of long-term absence. disciplinary procedures for unacceptable absence are commonly used for the management of short-term absence.
Table 20: Changes made to employee absence management in the last year (% of employers who have made changes)
All respondents
Manufacturing and
productionPrivate sector
servicesPublic
servicesNon-profit
organisations
Introduced or revised monitoring procedures
51 56 50 54 42
Introduced a new or revised absence management policy
50 39 48 54 53
Reinforced existing employee absence policy
42 31 37 52 38
Absence rate has become a key performance indicator
25 31 14 29 31
Introduced return-to-work interviews 23 36 25 12 29
Introduced Bradford points or another trigger system
22 17 28 17 25
Introduced well-being benefits 18 11 15 18 25
Involved occupational health professionals
15 14 15 12 20
Introduced an attendance strategy 9 8 8 13 7
Introduced an attendance incentive scheme
3 3 5 1 4
Other 11 6 7 14 13Base: 318
AB
SEN
CE M
AN
AG
EM
EN
T 2011
27
2011
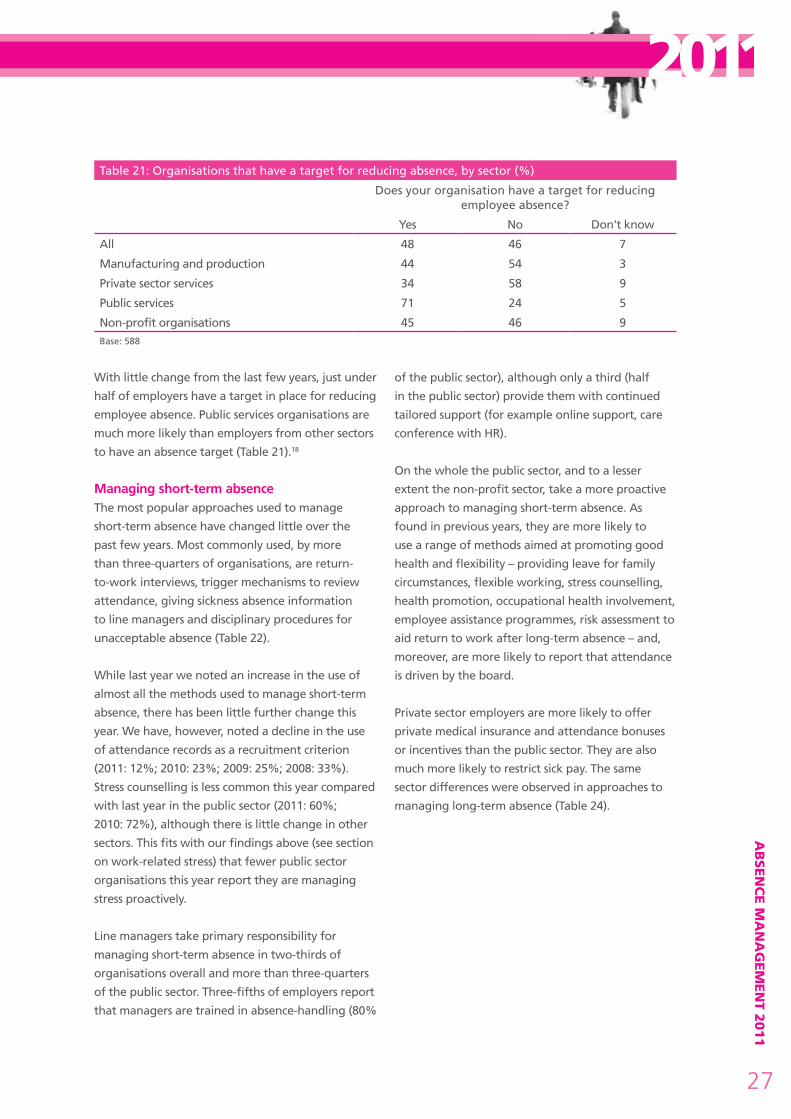
With little change from the last few years, just under
half of employers have a target in place for reducing
employee absence. Public services organisations are
much more likely than employers from other sectors
to have an absence target (Table 21).18
Managing short-term absenceThe most popular approaches used to manage
short-term absence have changed little over the
past few years. Most commonly used, by more
than three-quarters of organisations, are return-
to-work interviews, trigger mechanisms to review
attendance, giving sickness absence information
to line managers and disciplinary procedures for
unacceptable absence (Table 22).
While last year we noted an increase in the use of
almost all the methods used to manage short-term
absence, there has been little further change this
year. We have, however, noted a decline in the use
of attendance records as a recruitment criterion
(2011: 12%; 2010: 23%; 2009: 25%; 2008: 33%).
Stress counselling is less common this year compared
with last year in the public sector (2011: 60%;
2010: 72%), although there is little change in other
sectors. This fits with our findings above (see section
on work-related stress) that fewer public sector
organisations this year report they are managing
stress proactively.
Line managers take primary responsibility for
managing short-term absence in two-thirds of
organisations overall and more than three-quarters
of the public sector. Three-fifths of employers report
that managers are trained in absence-handling (80%
of the public sector), although only a third (half
in the public sector) provide them with continued
tailored support (for example online support, care
conference with HR).
On the whole the public sector, and to a lesser
extent the non-profit sector, take a more proactive
approach to managing short-term absence. As
found in previous years, they are more likely to
use a range of methods aimed at promoting good
health and flexibility – providing leave for family
circumstances, flexible working, stress counselling,
health promotion, occupational health involvement,
employee assistance programmes, risk assessment to
aid return to work after long-term absence – and,
moreover, are more likely to report that attendance
is driven by the board.
Private sector employers are more likely to offer
private medical insurance and attendance bonuses
or incentives than the public sector. They are also
much more likely to restrict sick pay. The same
sector differences were observed in approaches to
managing long-term absence (Table 24).
Table 21: Organisations that have a target for reducing absence, by sector (%)
Does your organisation have a target for reducing employee absence?
Yes No Don't know
All 48 46 7
Manufacturing and production 44 54 3
Private sector services 34 58 9
Public services 71 24 5
Non-profit organisations 45 46 9Base: 588

cipd.co.uk/2011absencemanagem
entsurvey
28
ABSENCE MANAGEMENT
Most effective approaches for managing short-term absenceEmployers were asked to rank the top three
most effective approaches for managing short-
term absence from the list in Table 22. As with
previous years, return-to-work interviews and
trigger mechanisms to review attendance are most
commonly cited as among the top three most
effective methods by employers from all sectors,
highlighting the importance of follow-up procedures
for monitoring absence proactively (Table 23).
Disciplinary procedures for unacceptable absence
are also among the most effective approaches for
Table 22: Approaches used to manage short-term absence (% of respondents)
All respondents
Manufacturing and production
Private sector services
Public services
Non-profit organisations
Return-to-work interviews 87 89 81 94 86
Trigger mechanisms to review attendance 82 83 77 91 76
Sickness absence information given to line managers
79 82 75 88 73
Disciplinary procedures for unacceptable absence
75 84 75 76 70
Line managers take primary responsibility for managing absence
69 67 64 79 63
Leave for family circumstances 66 58 59 72 79
Managers are trained in absence-handling 62 61 51 80 60
Flexible working 54 28 48 70 64
Occupational health involvement 53 58 33 75 59
Capability procedure 48 42 36 64 55
Changes to working patterns or environment
48 29 46 58 50
Restricting sick pay 44 61 54 26 36
Employee assistance programmes 44 33 39 59 42
Absence rate is a key performance indicator
43 43 31 57 46
Health promotion 38 26 27 59 35
Stress counselling 38 24 25 60 41
Tailored support for line managers (for example online support, care conference with HR)
33 18 29 48 28
Well-being benefits 32 29 30 35 33
Risk assessment to aid return to work after long-term absence
25 18 21 34 23
Offering private medical insurance 24 28 41 5 14
Employees' absence records taken into account when considering promotion
22 24 27 22 10
Rehabilitation programme 16 17 12 23 11
Nominated absence case manager/management team
15 9 14 23 9
Attendance driven by board 15 9 10 29 9
Attendance bonuses or incentives 12 18 18 5 8
Attendance record is a recruitment criterion
12 14 13 13 8
Outsourced absence management process 1 0 1 0 1Base: 561

AB
SEN
CE M
AN
AG
EM
EN
T 2011
29
2011
Table 23: Most effective approaches for managing short-term absence (% of respondents citing as one of top three most effective methods)
All respondents
Manufacturing and production
Private sector services
Public services
Non-profit organisations
Return-to-work interviews 63 68 65 60 59
Trigger mechanisms to review attendance 57 54 47 70 64
Disciplinary procedures for unacceptable absence
28 39 31 28 11
Restricting sick pay 18 25 27 8 10
Line managers take primary responsibility for managing absence
17 17 18 16 16
Managers are trained in absence-handling 17 13 12 20 28
Sickness absence information given to line managers
16 25 14 16 15
Occupational health involvement 13 12 7 19 16
Flexible working 10 4 9 9 19
Leave for family circumstances 5 1 7 4 8
Capability procedure 5 3 4 6 5
Attendance bonuses or incentives 4 9 6 2 1
Tailored support for line managers (for example online support, care conference with HR)
3 1 4 5 1
Employee assistance programmes 3 0 4 1 8
Nominated absence case manager/management team
3 3 3 2 3
Changes to working patterns or environment
3 0 3 3 4
Offering private medical insurance 2 0 4 0 1
Attendance driven by board 1 1 1 3 0
Stress counselling 1 0 1 1 1
Rehabilitation programme 1 1 1 1 0
Risk assessment to aid return to work after long-term absence
1 0 2 0 0
Employees' absence records taken into account when considering promotion
1 0 1 1 0
Health promotion 0 0 0 1 0
Attendance record is a recruitment criterion
0 0 0 0 1
Base: 486
about a third of private sector employers, a quarter
of the public sector and one in ten non-profit
organisations. Restricting sick pay is also seen to be
particularly effective in the private sector, where it is
most commonly used.
About one in six employers from all sectors report
that giving line managers primary responsibility for
managing absence is effective, although the public
and non-profit sectors are most likely to stress the
effectiveness of training them in absence-handling.
cipd.co.uk/2011absencemanagem
entsurvey
30
ABSENCE MANAGEMENT
Case study: building line manager confidence in managing attendance and promoting well-being at Kent County Council
For Kent County Council (KCC), managing attendance and promoting employee well-being is an integral part of improving people and organisational performance. It takes a holistic approach, using the internal expertise of HR, health and safety, learning and development, occupational health colleagues and line managers, who work together to ensure that a positive attendance culture is firmly embedded in KCC.
KCC has achieved a significant and sustained improvement in attendance levels since 2006, reducing days lost through sickness by 40,000. The team driving the initiative to improve attendance was made up of HR professionals working in organisational performance and well-being, HR policy and health and safety. The team’s core belief was that improvement could be achieved by ‘developing internal capability and confidence, both of HR and line managers’ and that ‘the management role in managing attendance was central and reduced the costs of using external providers’. However, they have also developed effective partnerships (such as with Jobcentre Plus and mental health charities, particularly those that help people with depression and anxiety-related illnesses), which have proved valuable in developing internal capability and providing additional support services for staff.
Amplifying attendance management and well-being Over the last several years, the council has made significant changes to the way they manage absence, developing a positive attendance culture with proactive health promotion and where people feel supported to return to work after being absent. Starting back in 2004, it moved away from having a ‘sickness policy’ to having an ‘attendance policy’. This new policy was accompanied by guidance for line managers on ‘managing positive attendance at work’ and a communication to all staff about work and attendance.
In 2006 the council further increased its focus on attendance and well-being, and is now reaping the benefits of supporting staff in managing their health and well-being at work. An initial kick-off meeting with colleagues from different, relevant disciplines, including an occupational health physician, isolated the key factors affecting attendance. They focused on achieving sustained improvement and identified four broad areas for attention, around which the project group created an action plan:
• communication• entitlements, including the need to review their reward offer, identifying those elements
likely to impact most on attendance• reporting systems, including looking at how absence was being categorised • interventions.
Examples of the actions taken include: focusing on long-term absence initially, where the impact was greatest, then moving to short-term/frequent absence at a later stage; establishing automatic email alerts for managers at trigger points; categorising ‘stress’ more accurately; providing more regular management information and training on handling sick staff; and reviewing sick pay. A review of current entitlements resulted in the decision not to change sick pay at that time, as more pragmatic, thoughtful management action proved successful in achieving better outcomes.
the critical role of line managersLine managers were central to the success of the council’s new approach to attendance and well-being. Over the course of the four-year initiative, the core aim has been to build line managers’ confidence and competence in managing people with health or disability issues. A number of training courses are offered to line managers, and these are regularly reviewed for their relevance and for any gaps in provision. Training courses offered include coaching skills, managing difficult conversations well, stress management and living skills, positive management of mental health and – particularly valuable in the current climate – a course on managing change successfully.
AB
SEN
CE M
AN
AG
EM
EN
T 2011
31
2011The council believed many of the attendance issues it observed could be resolved through more robust discussions between employees and their line manager. For example, managers were anxious about contacting people off sick who had GP certificates or fit notes, or those who were off work with stress-related illness. The council worked to change perceptions, advocating the value to both the employee and the organisation of keeping in contact. HR have found this focus helps people stay connected to work; the longer people stay away from the workplace, the harder it can be for them to return successfully.
In addition, HR arranged ‘speed surgeries’ for managers to ‘myth-bust’ around what they can and can’t do in managing attendance. To be best equipped to advise managers on taking more positive, direct action, the HR advisory team further developed its understanding of case law around disability and health. As a result of HR’s support and guidance, line managers now feel much more confident and empowered to have conversations about absence and health issues without necessarily referring automatically to occupational health advisers.
The council’s approach to attendance management, being manager-led, is very effective, is embedded and has helped to bring about a shift in culture. In more complex cases, such as those concerning mental health issues, HR has developed a case management model which brings together at one meeting all those able to provide specialist advice to managers to investigate interventions or solutions to improve the situation or resolve problems. Importantly, the line manager stays central to the decision-making. Particularly popular among managers is the ‘Positive Management of Mental Health’ course, which is provided by a consultant occupational psychologist. Part of that training focuses on busting the myths around helping people with mental health issues at work. A member of the OH team also takes part in this training to make sure managers know about the resources available to them in their ‘toolkit’ to support staff within the work environment: for example, the in-house staff counselling, workplace mediation services and return-to-work coaching.
Positive health promotion across a diverse workforceKent County Council provides support directly to staff to encourage people to take responsibility for their own health and well-being in the broadest sense. Care is taken to ensure that what is offered appeals to as many people as possible, across demographics and geographical areas. For example, opportunities for flexible working patterns are now available to anyone and ‘carer’ leave has been introduced to allow people to better plan absence related to caring responsibilities.
Carer leave was seen as an important innovation given KCC’s workforce demographic (85% female) because it recognises the potential impact that balancing domestic and work responsibilities can have on health and attendance.
In terms of health promotion, online resources are proving very popular with KCC staff as they are able to access them from their workplace as well as remotely. For example, there is online access to physical exercise demonstrations, identifying strengths and areas of development for increasing personal resilience, nutritional advice, healthy eating recipes and details of walks in Kent. The council also provides mini health checks, including through a ‘well point’ kiosk that’s sited at different locations around the county where staff can have their blood pressure and BMI (body mass index) checked. Free or minimal cost facilities are identified to maximise availability for staff.
Looking aheadAmanda Beer, Corporate Director of HR, believes that ‘one of the key challenges Kent County Council faces is to continue to improve attendance levels whilst being mindful of the context within which public sector staff are now working. It is important for us to maintain the motivation and engagement of our staff throughout this period of significant change and to continue to build line manager confidence to handle the wide range of people management issues they face daily.’
cipd.co.uk/2011absencemanagem
entsurvey
32
ABSENCE MANAGEMENT
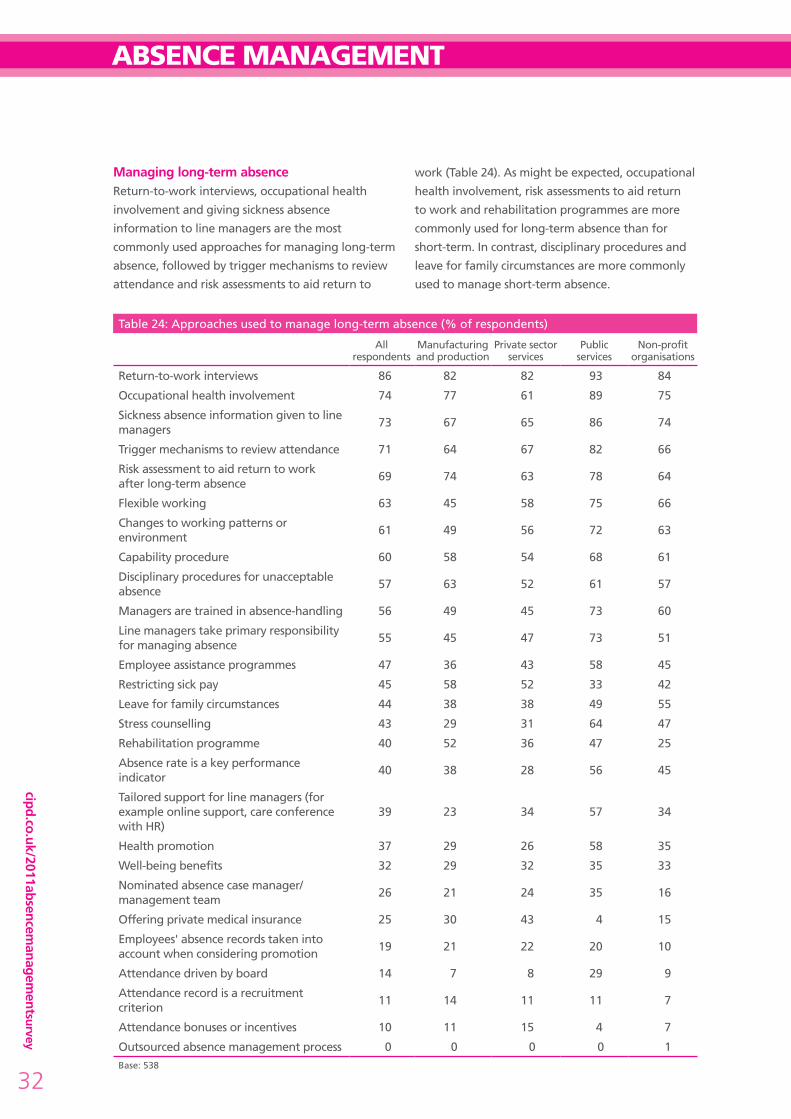
Managing long-term absenceReturn-to-work interviews, occupational health
involvement and giving sickness absence
information to line managers are the most
commonly used approaches for managing long-term
absence, followed by trigger mechanisms to review
attendance and risk assessments to aid return to
work (Table 24). As might be expected, occupational
health involvement, risk assessments to aid return
to work and rehabilitation programmes are more
commonly used for long-term absence than for
short-term. In contrast, disciplinary procedures and
leave for family circumstances are more commonly
used to manage short-term absence.
Table 24: Approaches used to manage long-term absence (% of respondents)
All respondents
Manufacturing and production
Private sector services
Public services
Non-profit organisations
Return-to-work interviews 86 82 82 93 84
Occupational health involvement 74 77 61 89 75
Sickness absence information given to line managers
73 67 65 86 74
Trigger mechanisms to review attendance 71 64 67 82 66
Risk assessment to aid return to work after long-term absence
69 74 63 78 64
Flexible working 63 45 58 75 66
Changes to working patterns or environment
61 49 56 72 63
Capability procedure 60 58 54 68 61
Disciplinary procedures for unacceptable absence
57 63 52 61 57
Managers are trained in absence-handling 56 49 45 73 60
Line managers take primary responsibility for managing absence
55 45 47 73 51
Employee assistance programmes 47 36 43 58 45
Restricting sick pay 45 58 52 33 42
Leave for family circumstances 44 38 38 49 55
Stress counselling 43 29 31 64 47
Rehabilitation programme 40 52 36 47 25
Absence rate is a key performance indicator
40 38 28 56 45
Tailored support for line managers (for example online support, care conference with HR)
39 23 34 57 34
Health promotion 37 29 26 58 35
Well-being benefits 32 29 32 35 33
Nominated absence case manager/management team
26 21 24 35 16
Offering private medical insurance 25 30 43 4 15
Employees' absence records taken into account when considering promotion
19 21 22 20 10
Attendance driven by board 14 7 8 29 9
Attendance record is a recruitment criterion
11 14 11 11 7
Attendance bonuses or incentives 10 11 15 4 7
Outsourced absence management process 0 0 0 0 1Base: 538
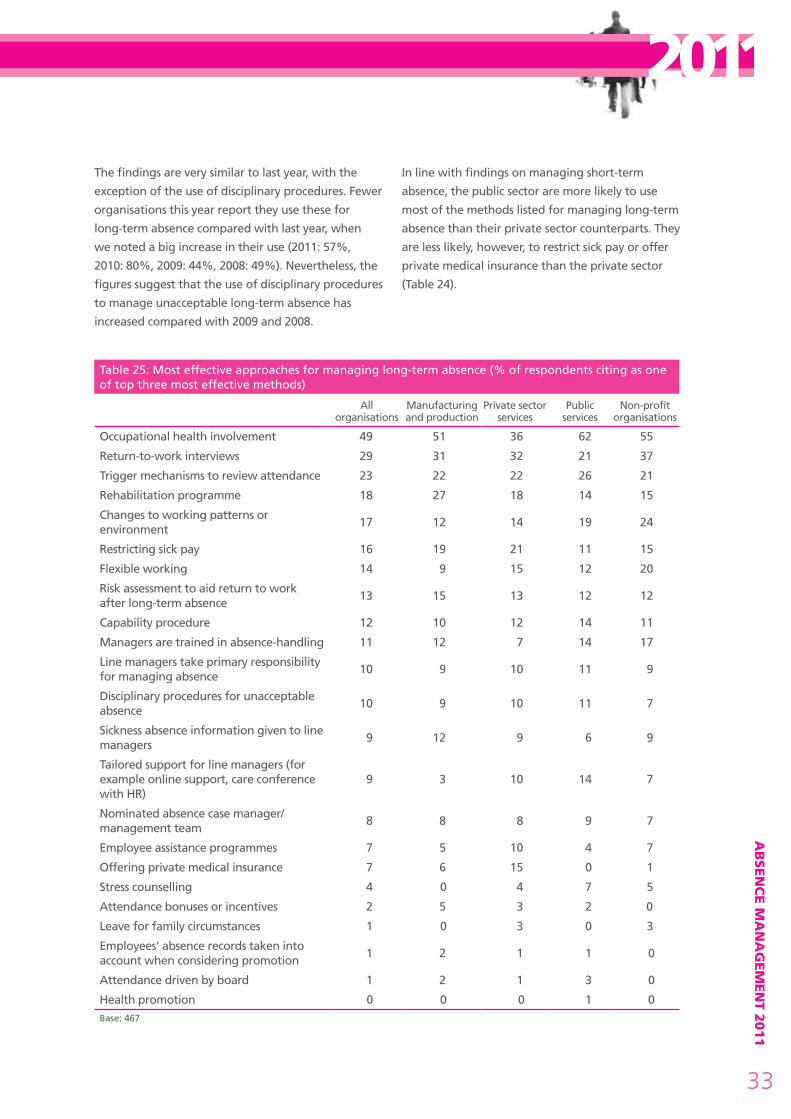
AB
SEN
CE M
AN
AG
EM
EN
T 2011
33
2011The findings are very similar to last year, with the
exception of the use of disciplinary procedures. Fewer
organisations this year report they use these for
long-term absence compared with last year, when
we noted a big increase in their use (2011: 57%,
2010: 80%, 2009: 44%, 2008: 49%). Nevertheless, the
figures suggest that the use of disciplinary procedures
to manage unacceptable long-term absence has
increased compared with 2009 and 2008.
In line with findings on managing short-term
absence, the public sector are more likely to use
most of the methods listed for managing long-term
absence than their private sector counterparts. They
are less likely, however, to restrict sick pay or offer
private medical insurance than the private sector
(Table 24).
Table 25: Most effective approaches for managing long-term absence (% of respondents citing as one of top three most effective methods)
All organisations
Manufacturing and production
Private sector services
Public services
Non-profit organisations
Occupational health involvement 49 51 36 62 55
Return-to-work interviews 29 31 32 21 37
Trigger mechanisms to review attendance 23 22 22 26 21
Rehabilitation programme 18 27 18 14 15
Changes to working patterns or environment
17 12 14 19 24
Restricting sick pay 16 19 21 11 15
Flexible working 14 9 15 12 20
Risk assessment to aid return to work after long-term absence
13 15 13 12 12
Capability procedure 12 10 12 14 11
Managers are trained in absence-handling 11 12 7 14 17
Line managers take primary responsibility for managing absence
10 9 10 11 9
Disciplinary procedures for unacceptable absence
10 9 10 11 7
Sickness absence information given to line managers
9 12 9 6 9
Tailored support for line managers (for example online support, care conference with HR)
9 3 10 14 7
Nominated absence case manager/management team
8 8 8 9 7
Employee assistance programmes 7 5 10 4 7
Offering private medical insurance 7 6 15 0 1
Stress counselling 4 0 4 7 5
Attendance bonuses or incentives 2 5 3 2 0
Leave for family circumstances 1 0 3 0 3
Employees' absence records taken into account when considering promotion
1 2 1 1 0
Attendance driven by board 1 2 1 3 0
Health promotion 0 0 0 1 0Base: 467
cipd.co.uk/2011absencemanagem
entsurvey
34
ABSENCE MANAGEMENT
Most effective approaches for managing long-term absenceThe two most commonly used methods for
managing long-term absence, the involvement of
occupational health professionals and return-to-
work interviews, are also considered to be the most
effective approaches (Table 25). A fifth report that
rehabilitation programmes are among their most
effective methods, although these are only used by
two-fifths of organisations. Trigger mechanisms to
review attendance are also commonly considered
to be effective for managing long-term as well as
short-term absence.
Impact of the abolition of the default retirement Age (drA) on absenceFrom April 2011 employers are no longer able to
serve employees with a notice of retirement. (They
are still able to retire staff who are or will turn 65
by 30 September 2011 and if they were served a
retirement notice before 6 April 2011.) This year’s
survey included new questions to examine the
anticipated impact of the abolition of the DRA on
absence levels and practices.
Overall, a quarter (23%) of employers believe that
the abolition of the DRA will increase their absence
levels. The majority (76%) believe it will have no
impact and just 1% that it will result in lower
absence levels. While there are no significant sector
differences, larger organisations are most likely
to anticipate a negative impact on absence. Over
a third (36%) of very large organisations (5,000+
employees) expect higher absence levels, compared
with a quarter (25%) of organisations with 250–999
employees and just one in ten (11%) of those with
fewer than 50 employees.19
One in six organisations report they will increase
their focus on well-being provisions as a result of
the abolition of the DRA and three out of ten that
they will increase their use of flexible working
practices. Just under a third are unsure whether
there will be any change in well-being (32%)
and flexible working practices (28%). There are
no significant differences across sectors or size of
organisations.
According to our sample, the abolition of the DRA
will have little impact on their provision of private
medical insurance to employees. The vast majority
report either that they do not offer insurance
benefits (50%) or that provision will stay the same
(41%). Only 4% report they will increase provision,
1% that they will decrease provision for all
employees and a further 4% that they will decrease
provision to certain groups.

AB
SEN
CE M
AN
AG
EM
EN
T 2011
35
2011
rETurN TO wOrk vErSuS TurNOvEr frOM ill HEAlTH
Nearly three-fifths of employers report that no
employees had left their organisation due to ill
health in the last 12 months and a further fifth
(18%) report that just 1% of leavers left for health
reasons. A small proportion (7%) had lost more
than 10% of their leavers due to ill health (Table
26). The proportion of leavers who left due to ill
health increased with organisation size.20
The Government commissioned an independent review into sickness absence, due to report later in
2011, looking at how the current sickness absence system could be changed to help people stay in
work and reduce overall costs to the state, individuals and employers. One question the review aims to
address is why some people with a certain health condition return to work while others with the same
condition do not. In this year’s survey we asked some questions related to this intriguing issue; namely,
the number of people who return to work versus leave the organisation each year from ill health and
when they do so.
Table 26: Proportion of leavers who left due to ill health in the past 12 months (% of respondents)
0 1% 2–5% 6–10% 11–25% 26–50% 51–100%
All organisations 58 18 11 6 3 2 2
Number of uK employees
1–49 88 7 0 2 2 2 0
50–249 72 16 5 3 1 1 3
250–999 46 25 20 5 2 1 1
1,000–4,999 30 26 19 11 7 4 4
5,000+ 22 19 15 19 19 7 0
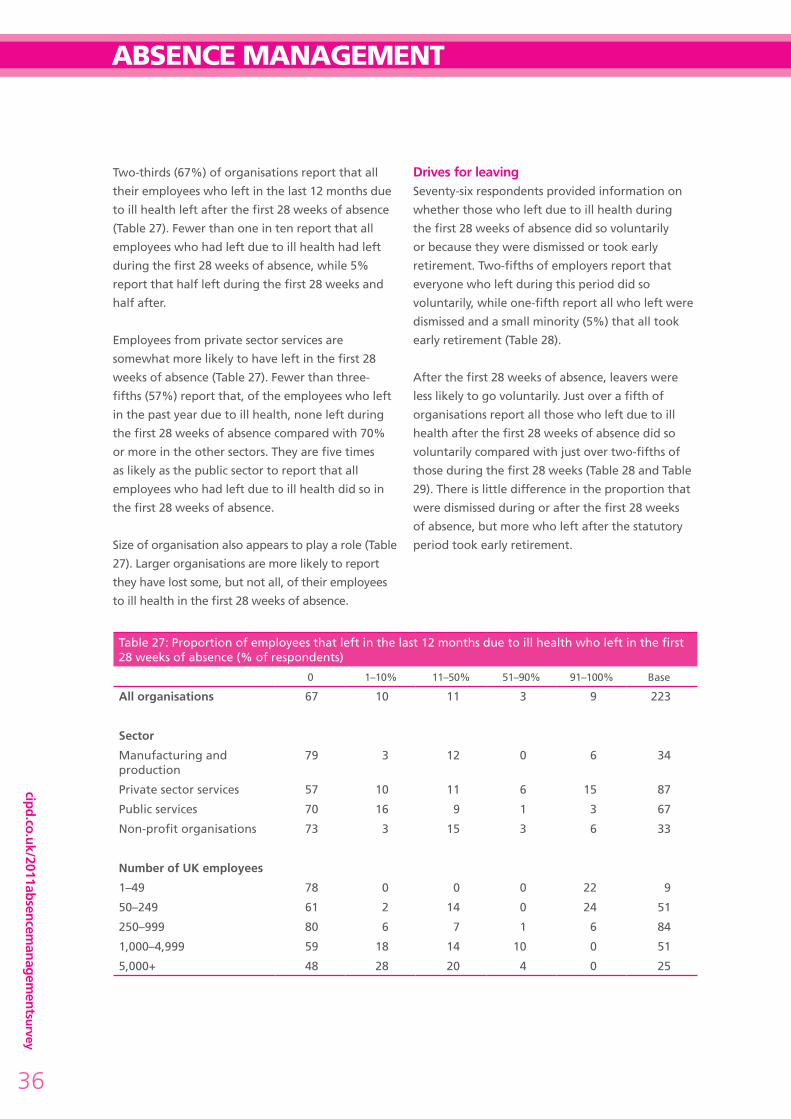
cipd.co.uk/2011absencemanagem
entsurvey
36
ABSENCE MANAGEMENT
Two-thirds (67%) of organisations report that all
their employees who left in the last 12 months due
to ill health left after the first 28 weeks of absence
(Table 27). Fewer than one in ten report that all
employees who had left due to ill health had left
during the first 28 weeks of absence, while 5%
report that half left during the first 28 weeks and
half after.
Employees from private sector services are
somewhat more likely to have left in the first 28
weeks of absence (Table 27). Fewer than three-
fifths (57%) report that, of the employees who left
in the past year due to ill health, none left during
the first 28 weeks of absence compared with 70%
or more in the other sectors. They are five times
as likely as the public sector to report that all
employees who had left due to ill health did so in
the first 28 weeks of absence.
Size of organisation also appears to play a role (Table
27). Larger organisations are more likely to report
they have lost some, but not all, of their employees
to ill health in the first 28 weeks of absence.
drives for leavingSeventy-six respondents provided information on
whether those who left due to ill health during
the first 28 weeks of absence did so voluntarily
or because they were dismissed or took early
retirement. Two-fifths of employers report that
everyone who left during this period did so
voluntarily, while one-fifth report all who left were
dismissed and a small minority (5%) that all took
early retirement (Table 28).
After the first 28 weeks of absence, leavers were
less likely to go voluntarily. Just over a fifth of
organisations report all those who left due to ill
health after the first 28 weeks of absence did so
voluntarily compared with just over two-fifths of
those during the first 28 weeks (Table 28 and Table
29). There is little difference in the proportion that
were dismissed during or after the first 28 weeks
of absence, but more who left after the statutory
period took early retirement.
Table 27: Proportion of employees that left in the last 12 months due to ill health who left in the first 28 weeks of absence (% of respondents)
0 1–10% 11–50% 51–90% 91–100% Base
All organisations 67 10 11 3 9 223
sector
Manufacturing and production
79 3 12 0 6 34
Private sector services 57 10 11 6 15 87
Public services 70 16 9 1 3 67
Non-profit organisations 73 3 15 3 6 33
Number of uK employees
1–49 78 0 0 0 22 9
50–249 61 2 14 0 24 51
250–999 80 6 7 1 6 84
1,000–4,999 59 18 14 10 0 51
5,000+ 48 28 20 4 0 25

AB
SEN
CE M
AN
AG
EM
EN
T 2011
37
2011
Table 30: The proportion of employees with the following conditions who return to work after absences of four weeks or longer (% of respondents)
Musculoskeletal injuries Back pain Stress
Mental ill health
Acute medical
conditionsOther
conditions
0 2 3 2 5 8 6
1–25% 8 9 10 10 13 10
26–50% 5 7 11 10 17 7
51–75% 6 3 5 9 10 2
76–99% 19 20 26 27 22 22
100% 60 58 46 39 30 52
Mean 85 82 80 75 66 78
Standard deviation 28 31 30 33 36 35
Base 186 179 178 174 187 109
Table 31: The percentage of organisations who report that all employees absent for four weeks or more with the following conditions return to work, by organisation size (%)
Number of employees
Musculoskeletal injuries Back pain Stress
Mental ill health
Acute medical conditions
Other conditions
1–49 100 83 55 63 79 78
50–249 78 77 68 53 44 77
250–999 55 55 40 39 21 40
1,000–4,999 22 15 15 4 4 21
5,000+ 29 29 14 0 0 0
Table 28: Proportion of those who left DURING the first 28 weeks of absence voluntarily, were dismissed or took early retirement (% of respondents)
VoluntarilyWere
dismissedTook early retirement
0 26 54 78
1–50% 12 18 17
51–99% 18 8 0
100% 43 20 5Base: 76
Table 29: Proportion of those who left AFTER the first 28 weeks of absence voluntarily, were dismissed or took early retirement (% of respondents)
VoluntarilyWere
dismissedTook early retirement
0 47 44 62
1–50% 21 20 20
51–99% 9 11 4
100% 23 25 15Base: 179
the relevance of different conditions on return to workTable 30 shows the proportion of employees with
different conditions who return to work after
absences of four weeks or more. The data suggests
that people with acute medical conditions are
least likely to return to work. Fewer than a third
of organisations report that all their employees
who were absent for more than four weeks with
such conditions returned to work. The second most
common condition to prevent people returning
to work after absences of more than four weeks is
mental ill health. Fifteen per cent of organisations
report that fewer than a quarter of employees with
this condition return to work after an absence of
four weeks or more.
With all the listed conditions, the proportion of
respondents who returned to work is inversely
related to organisational size (Table 31).21

cipd.co.uk/2011absencemanagem
entsurvey
38
ABSENCE MANAGEMENT
EMplOyEE wEll-BEiNG
Last year we noted an increase in the proportion
of organisations that had an employee well-being
strategy (or similar) in place (2010: 46%, 2009: 33%;
2008: 30%). There has been no further increase
this year, although the level has been maintained
(2011: 46%). Public sector organisations are almost
twice as likely as the private sector to have a well-
being strategy in place (67% compared with 36%
of the private sector and 40% of non-profits).22
Larger organisations are also more likely to have
a strategy (5,000+ employees: 81%; 250–999
employees: 44%; 1–49 employees: 39%).23
well-being benefitsNearly three-quarters of organisations with a
well-being strategy provide access to counselling
services and more than two-thirds offer employee
assistance programmes to all employees (Table
32). About half offer stop smoking support and
advice on healthy eating. There is, however, a
considerable difference in the benefits offered
by different sectors. The public sector are most
likely to promote well-being through benefits
such as access to counselling services, stop
smoking support, advice on healthy eating, access
to physiotherapy, in-house gyms and walking/
pedometer initiatives. The private sector are more
likely to provide insurance for employees, including
private medical insurance, long-term disability/
permanent health insurance/income protection
and critical illness insurance. Manufacturing and
production organisations are particularly likely to
offer health screening, healthy canteen options
and self-funded health plans.
Most benefits on offer are available to all
employees, particularly in the public sector. There
are, however, a few notable exceptions in the
private sector. For example, 79% of private sector
organisations offer private medical insurance to
employees but about half of these only offer it to
certain employees depending on grade or seniority.
Health screening, critical illness insurance and long-
term disability/permanent health insurance/income
protection benefits are also dependent on grade
or seniority in about one-fifth of private sector
organisations (Table 32).
Nearly half of employers have an employee well-being strategy in place. the most common benefits provided are access to counselling services and employee assistance programmes.
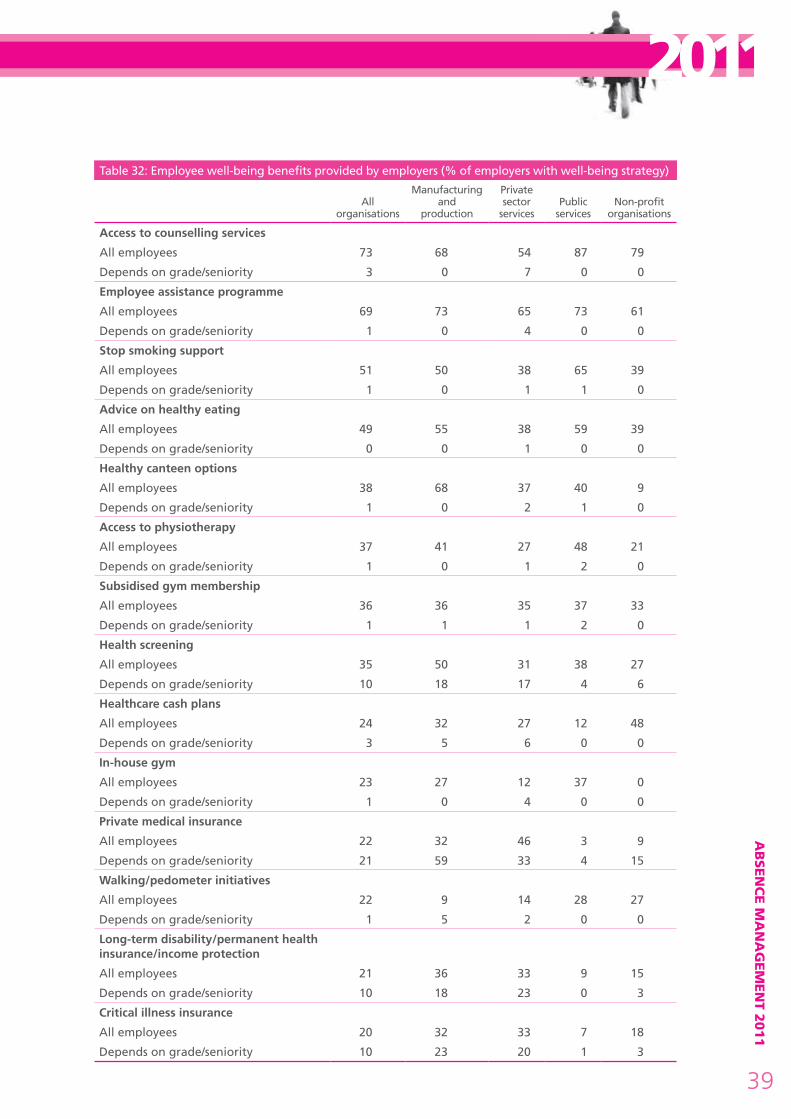
AB
SEN
CE M
AN
AG
EM
EN
T 2011
39
2011Table 32: Employee well-being benefits provided by employers (% of employers with well-being strategy)
All organisations
Manufacturing and
production
Private sector
servicesPublic
servicesNon-profit
organisations
Access to counselling services
All employees 73 68 54 87 79
Depends on grade/seniority 3 0 7 0 0
employee assistance programme
All employees 69 73 65 73 61
Depends on grade/seniority 1 0 4 0 0
stop smoking support
All employees 51 50 38 65 39
Depends on grade/seniority 1 0 1 1 0
Advice on healthy eating
All employees 49 55 38 59 39
Depends on grade/seniority 0 0 1 0 0
Healthy canteen options
All employees 38 68 37 40 9
Depends on grade/seniority 1 0 2 1 0
Access to physiotherapy
All employees 37 41 27 48 21
Depends on grade/seniority 1 0 1 2 0
subsidised gym membership
All employees 36 36 35 37 33
Depends on grade/seniority 1 1 1 2 0
Health screening
All employees 35 50 31 38 27
Depends on grade/seniority 10 18 17 4 6
Healthcare cash plans
All employees 24 32 27 12 48
Depends on grade/seniority 3 5 6 0 0
In-house gym
All employees 23 27 12 37 0
Depends on grade/seniority 1 0 4 0 0
Private medical insurance
All employees 22 32 46 3 9
Depends on grade/seniority 21 59 33 4 15
walking/pedometer initiatives
All employees 22 9 14 28 27
Depends on grade/seniority 1 5 2 0 0
Long-term disability/permanent health insurance/income protection
All employees 21 36 33 9 15
Depends on grade/seniority 10 18 23 0 3
Critical illness insurance
All employees 20 32 33 7 18
Depends on grade/seniority 10 23 20 1 3
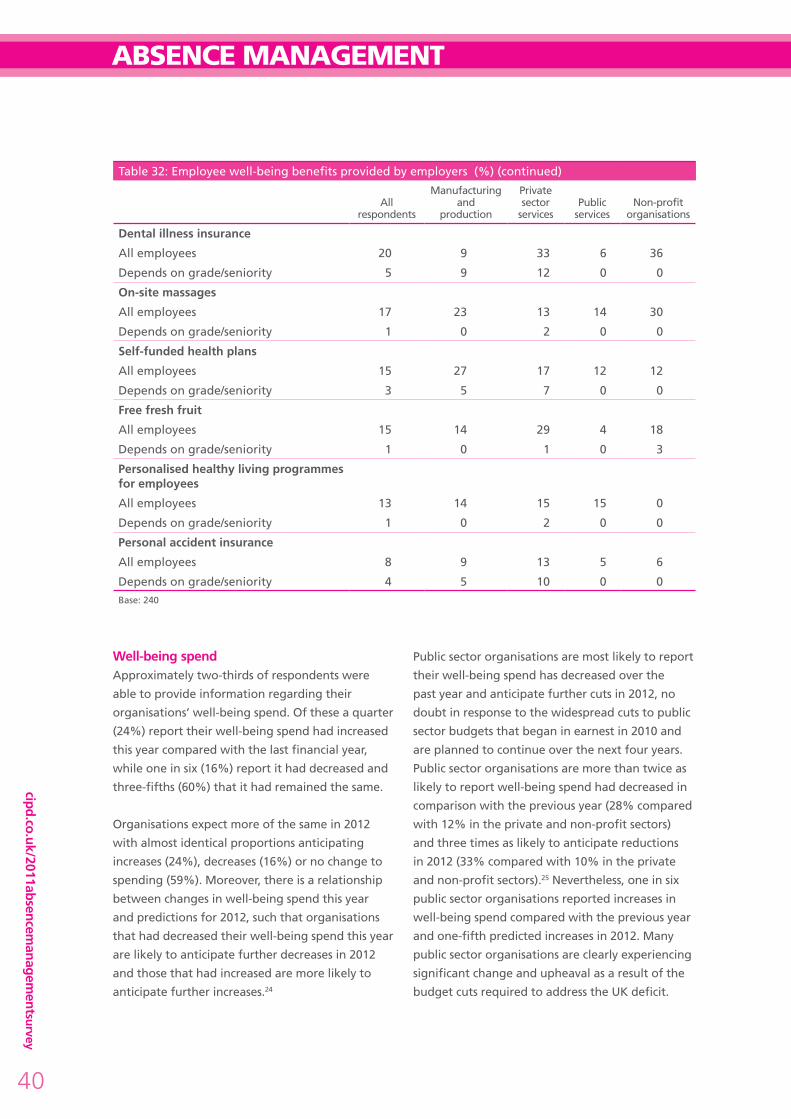
cipd.co.uk/2011absencemanagem
entsurvey
40
ABSENCE MANAGEMENT
Table 32: Employee well-being benefits provided by employers (%) (continued)
All respondents
Manufacturing and
production
Private sector
servicesPublic
servicesNon-profit
organisations
dental illness insurance
All employees 20 9 33 6 36
Depends on grade/seniority 5 9 12 0 0
on-site massages
All employees 17 23 13 14 30
Depends on grade/seniority 1 0 2 0 0
self-funded health plans
All employees 15 27 17 12 12
Depends on grade/seniority 3 5 7 0 0
Free fresh fruit
All employees 15 14 29 4 18
Depends on grade/seniority 1 0 1 0 3
Personalised healthy living programmes for employees
All employees 13 14 15 15 0
Depends on grade/seniority 1 0 2 0 0
Personal accident insurance
All employees 8 9 13 5 6
Depends on grade/seniority 4 5 10 0 0Base: 240
well-being spendApproximately two-thirds of respondents were
able to provide information regarding their
organisations’ well-being spend. Of these a quarter
(24%) report their well-being spend had increased
this year compared with the last financial year,
while one in six (16%) report it had decreased and
three-fifths (60%) that it had remained the same.
Organisations expect more of the same in 2012
with almost identical proportions anticipating
increases (24%), decreases (16%) or no change to
spending (59%). Moreover, there is a relationship
between changes in well-being spend this year
and predictions for 2012, such that organisations
that had decreased their well-being spend this year
are likely to anticipate further decreases in 2012
and those that had increased are more likely to
anticipate further increases.24
Public sector organisations are most likely to report
their well-being spend has decreased over the
past year and anticipate further cuts in 2012, no
doubt in response to the widespread cuts to public
sector budgets that began in earnest in 2010 and
are planned to continue over the next four years.
Public sector organisations are more than twice as
likely to report well-being spend had decreased in
comparison with the previous year (28% compared
with 12% in the private and non-profit sectors)
and three times as likely to anticipate reductions
in 2012 (33% compared with 10% in the private
and non-profit sectors).25 Nevertheless, one in six
public sector organisations reported increases in
well-being spend compared with the previous year
and one-fifth predicted increases in 2012. Many
public sector organisations are clearly experiencing
significant change and upheaval as a result of the
budget cuts required to address the UK deficit.
AB
SEN
CE M
AN
AG
EM
EN
T 2011
41
2011Guarding employees’ well-being through these
difficult times is essential to maintain levels of
service and retain talent.
Fewer than a third of employers (30%) evaluate
the impact of their well-being spend,26 which is an
increase on 17% in the 2010 survey. Public sector
employers are most likely to evaluate well-being
spend (37% compared with 24% in the private
sector and 33% of non-profits).27
Organisations that evaluate their well-being spend
are twice as likely to have increased their spend
this year (38% compared with 19%).28 They are
also more likely to predict it would increase in 2012
(36% compared with 21%).29 This confirms last
year’s findings and implies that evaluations of well-
being spend generally conclude that investing in
well-being is worthwhile.
Further evidence to support this comes from our
findings that organisations that had reduced
absence over the past year are more likely to have
a well-being strategy (52%) compared with those
that had seen an increase in their absence levels
(40%) or no change in their absence levels (41%).30
cipd.co.uk/2011absencemanagem
entsurvey
42
ABSENCE MANAGEMENT
EMplOyEE ABSENCE ANd THE ECONOMiC CliMATE
redundancies and absenceThe last couple of years have seen widespread
redundancies in the private sector. Economic
indicators for this year show signs of slow growth;
however, the public sector faces considerable
cuts and change as the Government attempts to
address the fiscal deficit. More than two-fifths
(43%) of public sector organisations report they
will be making redundancies over the next six
months compared with one in six in the private
sector (17%) and a quarter (24%) of non-profits.
An additional 37% of the public sector report
that redundancies are a possibility in the next six
months (29% of the private sector and 34% of
non-profits).31 Clearly, many organisations are still
dealing with the fall-out from the recession.
Half of organisations (52%) report they use
employee absence records as part of their criteria
for selecting for redundancy.32 As in previous
years, this is most common in manufacturing and
production organisations (73%) and lowest in
non-profit organisations (non-profits: 41%; public
sector: 47%; private services 55%).33
PresenteeismMore than a quarter (28%) of employers report
an increase in the number of people coming to
work ill in the last 12 months. Organisations that
are expecting redundancies in the coming six
months were more likely to report an increase
(32% compared with 27% of those who are not
expecting to make further redundancies). They
were also less likely to report they had not noticed
an increase (48% compared with 66%) and less
certain (20% report they don’t know if there had
been an increase compared with 7% of those not
making redundancies).34
It is likely that the threat of redundancies and the
consequent increase in employees’ concerns over
job security leads to an increase in the proportion
of employees who struggle into work when
unwell. Such presenteeism can negatively affect
an organisation’s productivity, not only if illness is
transmitted to other colleagues, but also because
ill employees are likely to work less effectively
than usual, may be more prone to costly mistakes
and take longer to recover from their illness.
Presenteeism is also a sign of anxiety. Failure by
organisations to address employees’ concerns may
lead to mental health problems and costly longer-
term consequences. Organisations that had noted
an increase in presenteeism over the past year were
more likely to report an increase in stress-related
absence over the same period (49% compared with
33% of those who did not report an increase in
people coming to work ill).35
Mental healthLast year we noted a big increase in reported mental
health problems, such as anxiety and depression,
among employees; figures are similar this year with
nearly two-fifths (39%) reporting an increase over
the last 12 months (2010: 38%, 2009: 21%).
As with the findings on presenteeism reported
above, organisations that are planning to make
redundancies in the next six months were more
likely to report an increase in mental health
More than a quarter of employers have noticed an increase in the number of people coming to work ill in the last 12 months and nearly two-fifths report an increase in mental health problems, such as anxiety and depression, among employees.

AB
SEN
CE M
AN
AG
EM
EN
T 2011
43
2011problems (51% compared with 32% who are not
planning redundancies).36
More than a quarter of organisations (29%) report
they have increased their focus on employee
well-being and health promotion as a result of the
economic context. This is a slight increase on last
year, mainly due to an increase in the proportion of
public sector organisations reporting an increase in
focus (Table 33). More than two-fifths of the public
sector report an increase in focus compared with
just over one-fifth of the private sector.37
Once sector is taken into account, whether or
not organisations are planning redundancies has
no impact on their focus on well-being, despite
the negative impact this can have on employees,
including on those who are retained because they
often have to cope with increased workload as well
as the loss of colleagues.
Table 33: Respondents reporting an increased focus on employee well-being and health promotion as a result of the economic context (%)
All organisationsManufacturing and production
Private sector services Public services
Non-profit organisations
Yes 29 23 23 43 29
No 63 71 70 50 63
Don't know 8 5 7 8 9Base: 577
cipd.co.uk/2011absencemanagem
entsurvey
44
ABSENCE MANAGEMENT
CONCluSiONS
This year’s survey shows mixed results. Absence
rates remain at the 2010 low level overall, although
there is considerable variation across and within
sectors and industries. Two-fifths of organisations
report their absence levels have decreased
compared with the previous year, while just over a
quarter report they have increased.
Comparing absence levels across the past few
years suggests that they are not just a function of
management approach or organisational culture,
but are also related to the economic environment.
Consistent with this is the slight rise in absence
levels this year in the private sector corresponding
with small improvements in the employment
market and our findings that the public sector,
which faces most cuts and redundancies this year, is
more likely to report improvements in absence.
However, such improvements in absence levels
need to be regarded with caution, as when
unemployment levels are rising and redundancies
anticipated, concerns over job security can lead to
‘presenteeism’ – employees struggling to work ill
to demonstrate their commitment. Our findings
highlight the negative effects presenteeism can
have for both the individual and the organisation.
In addition, we are once again reporting high
levels of stress-related illness and mental health
problems, akin to last year’s worrying rates.
Nearly two-fifths of employers report an increase
in mental health problems, such as anxiety and
depression, among employees and this year stress
is the most common cause of long-term absence.
These figures are not surprising given the economic
context, but our results show that employers can
do more to address these issues as a priority.
Our survey findings and case studies over the
years have demonstrated that organisations’
approaches to absence and attendance have a
significant impact on absence and consequently
business efficiency and performance. We present
clear indicators that this is well recognised.
Almost all organisations surveyed have a written
absence/attendance management policy and
most organisations record their annual employee
absence rate and the causes of absence. Moreover,
just over half of organisations have introduced
changes to some aspect of their approach in
the last year, suggesting that their policies are
reviewed and adjusted. Another positive sign is
that the methods deemed by organisations to be
most effective in managing absence are also those
most commonly used.
At the same time, year after year, the majority of
respondents assert their belief that it is possible
to further reduce absence. So how can this be
achieved?
targeted actionClearly it is not enough to simply collect data on
the causes of absence. Targeted action across the
organisation as well as with observed ‘hot spots’
is required to address specific issues and aid early
return to work.
strong, attendance-focused leadershipThe high costs of absence make it an issue of
utmost relevance to organisation leaders, yet only
a minority of respondents report that attendance
is driven by the board. Cohesive leadership on
attendance is required to ensure illegitimate
absence is not tolerated and attendance-focused
initiatives are supported if real and lasting
improvements to absence levels are to be achieved.
It is surprising, particularly given the increased
focus on costs in the current climate, that fewer

AB
SEN
CE M
AN
AG
EM
EN
T 2011
45
2011than half of employers monitor the cost of absence.
These figures can help make a strong business case
for organisation investment in targeted and timely
initiatives to promote attendance and early return
to work.
Provide ongoing support to line managersGiving line managers primary responsibility for
managing absence remains one of the most
commonly used approaches for managing absence.
However, the approach of providing ongoing
support to line managers, such as online and via
HR, is used significantly less, despite its value,
especially when line managers are dealing with
complex cases. In particular, both stress and mental
health problems have increased in prevalence over
the past few years and these can often be difficult
issues for line managers to address, with commonly
held myths surrounding them which can impede
the level of support employees receive.
ensure an open and supportive cultureWithin a supportive work environment employees
are more likely to feel they can take time off
when they are genuinely ill, helping to reduce the
spread of such illnesses to colleagues and avoid
costly mistakes. The absence of such a culture will
encourage presenteeism, which we have found
associated with stress and mental health problems.
Having an open and supportive culture can also
make it easier for employees to return to work after
a period of absence, aiding the rehabilitation process.
Flexible/homeworkingSerious commitment to flexible working practices
may help reduce absence due to stress, home/
family responsibilities and ‘illegitimate’ reasons, all
of which remain common causes of absence for a
sizeable proportion of organisations.
Investment in employee well-being and engagement Despite the high costs of absence, organisations
vary considerably in how proactively they promote
employee well-being and manage stress at work.
Our findings imply that evaluations of well-being
spend generally conclude that the investment
is worthwhile. A focus on these issues and
employee engagement will promote attendance
and organisational performance. Professionally
conducted employee surveys that address well-
being and engagement concerns and are acted
upon by the senior executive can be useful in
promoting engagement and combating absence.
A proactive approach to managing stress Stress being the most common cause of long-
term absence is a worrying finding and makes an
even stronger case for why employers need to
be taking action. Half of public sector employers
say they have seen an increase in stress-related
absence in the past year (compared with one-third
of organisations overall). However, just 58% of
organisations say they are taking steps to identify
and manage stress at work, which indicates that
there is a lot more that needs to be done.
Overall, there is still more that can be done across
the board in terms of both absence management
and employee well-being. In particular, the public
sector is faced with a large degree of uncertainty
through which the workforce will require their
employer, and in particular their line manager, to
be increasingly aware of issues among staff and
provide the appropriate support. It is important
that the public sector maintains its proactive
approach to health promotion.
In sum, effective absence management involves
finding a balance between providing support
to help employees with health problems stay in
and return to work and taking consistent action
against employees who try to take advantage of an
organisation’s sick pay schemes. However, employers
need to be mindful about observed decreases in
absence levels, ensuring they are attributable to
the effective management of attendance and
active health promotion, rather than reflecting the
negative effects of presenteeism.

cipd.co.uk/2011absencemanagem
entsurvey
46
ABSENCE MANAGEMENT
BACkGrOuNd TO THE SurvEy
As in previous years, most respondents (82%)
answered the questions in relation to their whole
company/organisation, while 11% answered in
relation to a single site and 5% in relation to a
single division.
Respondents come from across the UK in a similar
spread to last year. A quarter responded in relation
to employees across the UK, while others replied
in relation to employees in specific UK regions (see
Table A1).
In June 2011 we received 592 valid responses to an online survey questionnaire. the survey comprised 40 questions exploring absence levels, causes and costs as well as how organisations attempt to manage absence and promote health and well-being at work and the impact of the economic climate on employee absence rates. two new sections this year explore the anticipated impact of the abolition of the default retirement Age on absence levels and strategies and finally levels of turnover due to ill health.
Table A1: Distribution of responses by region
Number of respondents
2011%
2011%
2010
East Anglia 20 3 4
East Midlands 25 4 6
West Midlands 32 5 7
North-east of England 18 3 4
North-west of England 54 9 7
South-west of England 50 9 7
Yorkshire and Humberside 33 6 5
South-east of England (excluding London)
67 12 13
London 62 11 10
Scotland 41 7 7
Wales 20 3 3
Northern Ireland 15 3 4
Ireland 8 1 0
Whole of UK 137 24 26Base: 582 (2011); 564 (2010)
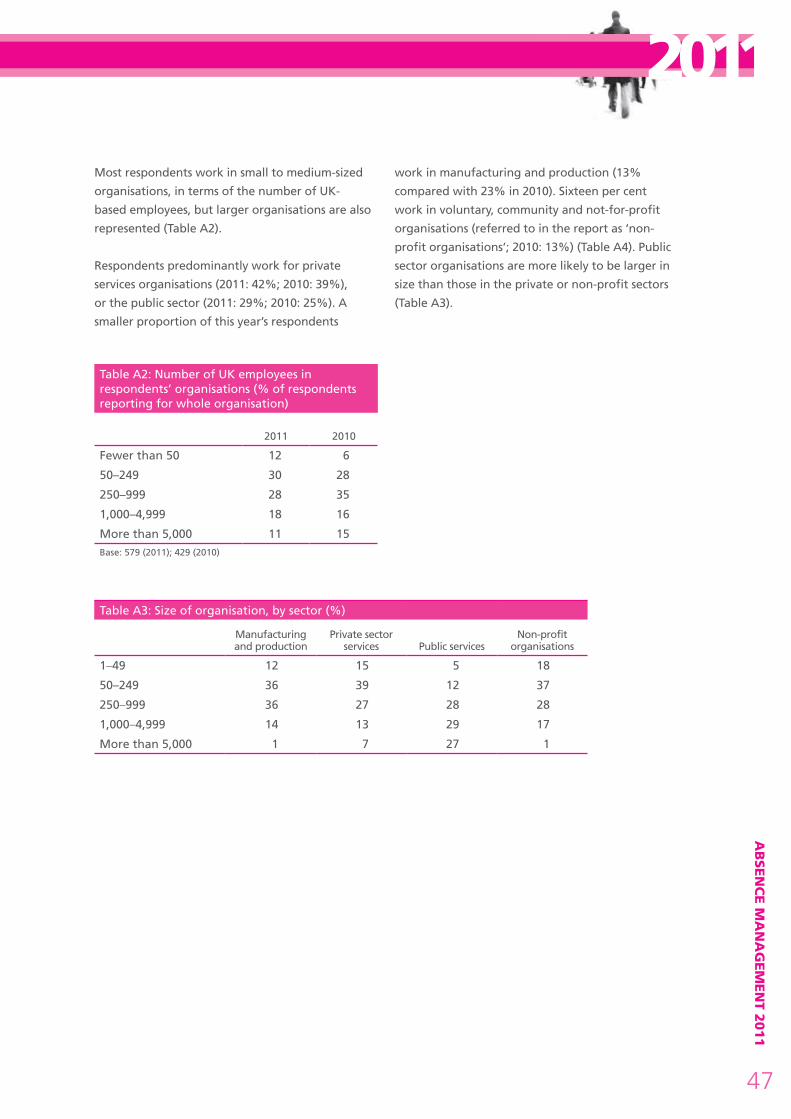
AB
SEN
CE M
AN
AG
EM
EN
T 2011
47
2011Most respondents work in small to medium-sized
organisations, in terms of the number of UK-
based employees, but larger organisations are also
represented (Table A2).
Respondents predominantly work for private
services organisations (2011: 42%; 2010: 39%),
or the public sector (2011: 29%; 2010: 25%). A
smaller proportion of this year’s respondents
work in manufacturing and production (13%
compared with 23% in 2010). Sixteen per cent
work in voluntary, community and not-for-profit
organisations (referred to in the report as ‘non-
profit organisations’; 2010: 13%) (Table A4). Public
sector organisations are more likely to be larger in
size than those in the private or non-profit sectors
(Table A3).
Table A2: Number of UK employees in respondents’ organisations (% of respondents reporting for whole organisation)
2011 2010
Fewer than 50 12 6
50–249 30 28
250–999 28 35
1,000–4,999 18 16
More than 5,000 11 15Base: 579 (2011); 429 (2010)
Table A3: Size of organisation, by sector (%)
Manufacturing and production
Private sector services Public services
Non-profit organisations
1–49 12 15 5 18
50–249 36 39 12 37
250–999 36 27 28 28
1,000–4,999 14 13 29 17
More than 5,000 1 7 27 1
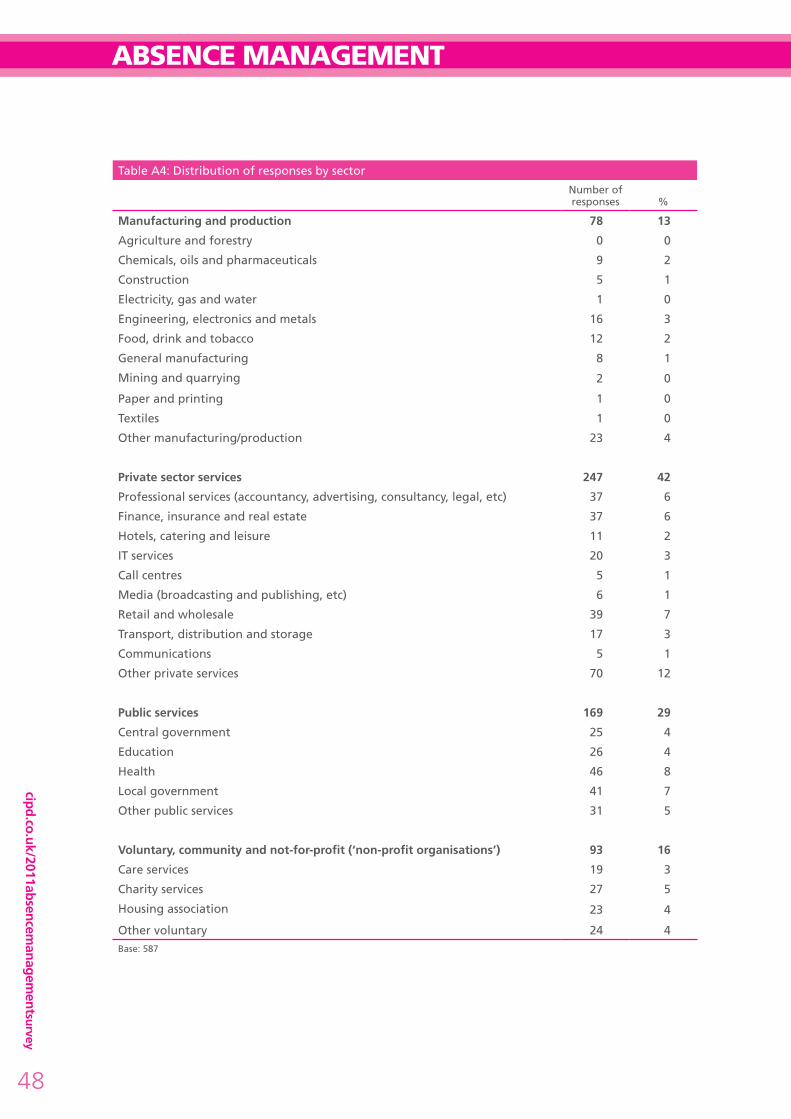
cipd.co.uk/2011absencemanagem
entsurvey
48
ABSENCE MANAGEMENT
Table A4: Distribution of responses by sector
Number of responses %
Manufacturing and production 78 13
Agriculture and forestry 0 0
Chemicals, oils and pharmaceuticals 9 2
Construction 5 1
Electricity, gas and water 1 0
Engineering, electronics and metals 16 3
Food, drink and tobacco 12 2
General manufacturing 8 1
Mining and quarrying 2 0
Paper and printing 1 0
Textiles 1 0
Other manufacturing/production 23 4
Private sector services 247 42
Professional services (accountancy, advertising, consultancy, legal, etc) 37 6
Finance, insurance and real estate 37 6
Hotels, catering and leisure 11 2
IT services 20 3
Call centres 5 1
Media (broadcasting and publishing, etc) 6 1
Retail and wholesale 39 7
Transport, distribution and storage 17 3
Communications 5 1
Other private services 70 12
Public services 169 29
Central government 25 4
Education 26 4
Health 46 8
Local government 41 7
Other public services 31 5
Voluntary, community and not-for-profit (‘non-profit organisations’) 93 16
Care services 19 3
Charity services 27 5
Housing association 23 4
Other voluntary 24 4Base: 587

AB
SEN
CE M
AN
AG
EM
EN
T 2011
49
2011Note on statistics and figures usedSome respondents did not answer all questions, so
where percentages are reported in tables or figures,
the respondent ‘base’ for that question is given.
‘Average’ in the report is used to refer to the
arithmetic mean; the standard deviation from the
mean is reported where appropriate. The median is
used in cases where the distribution is significantly
skewed and the 5% trimmed mean where there
are some extreme outliers. The 5% trimmed
mean is the arithmetic mean calculated when the
largest 5% and the smallest 5% of the cases have
been eliminated. Eliminating extreme cases from
the computation of the mean results in a better
estimate of central tendency when extreme outliers
exist. When the median or 5% trimmed mean is
used it is noted.
With the exception of average working time and
days lost, all figures in tables have been rounded
to the nearest percentage point. Due to rounding,
percentages may not always total 100.
Different statistical tests have been used, depending
on the type of analysis and the measures used in
the questionnaire to examine whether differences
between groups are significantly different than
could be expected by chance and to examine
associations between measures. Tests used include
Chi-Square ( χ2), t-tests, Spearman’s rho and Tau-b.
We report on statistics at the generally accepted
level of significance, p<0.05.

cipd.co.uk/2011absencemanagem
entsurvey
50
ABSENCE MANAGEMENT
furTHEr SOurCES Of iNfOrMATiONVisit cipd.co.uk/2011absencemanagementsurvey
to access related products and services and to view
previous Absence Management survey reports.
Absence measurement and management Read our factsheet, which provides guidance on
absence policies, measuring absence levels and
managing short- and long-term absence.
cipd.co.uk/atozresources
Acas have published an advisory booklet on how to
manage attendance and employee turnover.
Available at: www.acas.org.uk/
Download the guidance produced jointly by the
National Institute for Health and Clinical Excellence
(NICE) and the CIPD, which offers advice to
employers: Managing Long-term Sickness Absence
and Incapacity for Work.
cipd.co.uk/atozresources
well-being Read our change agenda What’s Happening with
Well-being at Work? which provides case study
examples of how employers are introducing
the concepts of employee well-being into their
organisations and identifies the impact of well-being
on individuals and organisations.
cipd.co.uk/atozresources
stress The CIPD factsheet Stress and Mental Health at Work
provides advice on identifying the key indicators
of employees’ stress and outlines steps that people
management specialists can take to manage
organisational stress.
cipd.co.uk/atozresources
Read our research insight Preventing Stress:
Promoting positive manager behaviour. This report
is the result of ongoing collaboration between
the CIPD, Investors in People and the Health and
Safety Executive on research into management
competencies for preventing and reducing stress at
work. Case studies are included of organisations that
have implemented the findings from previous stages
of the research.
cipd.co.uk/atozresources
Health and safety The CIPD factsheet Health and Well-being at Work
gives introductory guidance on employers’ duties to
provide a safe and healthy working environment. It
introduces the law on health and safety at work and
outlines employers’ obligations.
cipd.co.uk/atozresources
occupational health Take a look at our factsheet Occupational Health.
cipd.co.uk/atozresources
To stay up to date with the latest thinking from
the CIPD, visit cipd.co.uk/research
Sign up to receive our weekly e-newsletter
and get the latest news and updates on CIPD
research straight into your inbox. Sign up by
visiting cipd.co.uk/cipdupdate

AB
SEN
CE M
AN
AG
EM
EN
T 2011
51
2011
ACkNOwlEdGEMENTS
The CIPD is very grateful to those organisations and
individuals who gave their time to take part in this
research. They include:
• Annette Sinclair, Senior Researcher at Roffey
Park, for analysing the findings and writing this
comprehensive report
• all those who shared examples of their
organisation’s practices
• Simplyhealth for their support and commitment
at every stage of the research.
We hope that you find the research useful when
considering your own absence management
practices.
Please contact us if you have any questions or ideas
based on our findings ([email protected]).

cipd.co.uk/2011absencemanagem
entsurvey
52
ABSENCE MANAGEMENT
NOTES
1 Recording the annual employee absence rate
by size: Chi Square=21.6, df=4, p<0.001, n=560.
Recording the annual employee absence rate by
sector: Chi Square=26.1, df=3, p<0.001, n=568 2 One call centre reported an absence rate of 48%
of working time. 3 The 5% trimmed mean is the arithmetic mean
calculated when the largest 5% and the
smallest 5% of the cases have been eliminated.
Eliminating extreme cases from the computation
of the mean results in a better estimate of central
tendency when extreme outliers exist. 4 Rho=.37, p<.001, n=398 5 Chi Square=26.3, df=6, p<0.001, n=556 6 Chi Square=22.7, df=6, p<0.01, n=583 7 Chi Square=53.1, df=8, p<0.001, n=575 8 Paired sample t=2.6, df=53, p<.05, n=54 9 Paired sample t=-3.4, df=56, p<.01, n=5710 Percentage of absence accounted for by short-
term leave by UK workforce size: rho=-.36,
p<.001, n=33811 Chi Square=52.5, df=8, p<0.001, n=57912 Chi Square=19.5, df=6, p<0.01, n=587 13 Chi Square=19.6, df=3, p<0.001, n=54714 Chi Square=18.4, df=9, p<0.05, n=57315 Rho=-.31, p<.001, n=48116 Chi Square=17.4, df=6, p<0.01, n=58717 Chi Square=18.7, df=2, p<0.001, n=57818 Chi Square=59.6, df=6, p<0.001, n=585 19 Rho=-.14, p<.01, n=55320 Rho=.44, p<.001, n=43921 Organisational size and musculoskeletal injuries:
Rho=-.37, p<.001, n=182; organisational size
and back pain: Rho=-.37, p<.001, n=175;
Organisational size and stress: Rho=-.34, p<.001,
n=174; Organisational size and mental ill health:
Rho=-.28, p<.001, n=171; Organisational size
and acute medical conditions: Rho=-.34, p<.001,
n=183; Organisational size and other conditions:
Rho=-.40, p<.001, n=107;22 Chi Square=40.5, df=2, p<0.001, n=54823 Chi Square=40.1, df=4, p<0.001, n=54024 Kendal’s tau-b=.47, p<.001, n=36225 Compared with the last financial year, did your
organisation’s well-being spend this year…? By
sector: Chi Square=19.2, df=6, p<0.01, n=378; In
2012, do you predict that your organisation’s well-
being spend will...? by Sector: Chi Square=29.3,
df=6, p<0.001, n=39026 30% of respondents report they didn’t know.
They are excluded from the analysis here.27 Chi Square=0.05, df=2, p<0.05, n=38528 Chi Square=17.2, df=2, p<0.001, n=32529 Chi Square=11.8, df=2, p<0.01, n=32830 Chi Square=6.8, df=2, p<0.05, n=52631 Chi Square=58.3, df=4, p<0.001, n=54432 One in five (19%) report they didn’t know so are
excluded from this analysis.33 Chi Square=16.9, df=3, p<0.01, n=46934 Chi Square=17.9, df=2, p<0.001, n=36735 Chi Square=58.0, df=6, p<0.001, n=57036 Chi Square=35.4, df=6, p<0.001, n=581 (1 cell
has expected count less than 5. The minimum
expected count is 4.46)37 Chi Square=22.5, df=6, p<0.01, n=577

AB
SEN
CE M
AN
AG
EM
EN
T 2011
53
2011
OTHER TITLES IN THIS SERIES
RESOURCING AND TALENT PLANNINGThe annual Resourcing and Talent Planning survey contains valuable information on current and emerging trends in people resourcing practice. Now in its fifteenth year, the report provides benchmarking information to support employers on resourcing strategies, attracting and selecting candidates, labour turnover and employee retention. This report is brought to you in partnership with Hays.
EMPLOYEE ATTITUDES TO PAYThe annual Employee Attitudes to Pay survey investigates employee attitudes and expectations towards pay and bonuses. Now in its third year, this survey is carried out by YouGov and focuses on employees in the UK.
REWARD MANAGEMENTThe annual Reward Management survey has been running for ten years and provides practical insights into current trends, practices and issues affecting reward management in the UK. It examines strategic reward, base and variable pay, bonuses, incentives, pensions, reward measurement and total reward issues. This report is brought to you in partnership with Benefex.
LEARNING AND TALENT DEvELOPMENTThe annual Learning and Talent Development survey is now in its thirteenth year and provides valuable commentary on current and future issues and trends. It explores employer support for learning, talent management, employee skills, managing and evaluating coaching and training spend.

Chartered Institute of Personnel and Development
151 The Broadway London SW19 1JQ
Tel: 020 8612 6200 Fax: 020 8612 6201
Email: [email protected] Website: cipd.co.uk
Incorporated by Royal Charter Registered charity no.1079797
Issu
ed: O
ctob
er 2
011
Ref
eren
ce: 5
632
© C
hart
ered
Inst
itute
of
Pers
onne
l and
Dev
elop
men
t 20
11