annual report · tambrands, inc. and its global leading brand, tampax, the loreto y peña paper...
TRANSCRIPT

Annual Report
Maynard Danker knows a big idea when he sees one

F I N A N C I A L H I G H L I G H T S
Net Sales(Billions of Dollars)
Basic Net Earnings(Per Common Share)
Dividends(Per Common Share)
June ’ June ’
Value of $1,000 Invested in P&G Stock in June 1988(With Dividend Reinvestment)
For Years Ended June 30Millions of Dollars Except Per Share Amounts Percent Change
Net Sales $37,154 $35,764 4%Operating Income 6,055 5,488 10%Net Earnings 3,780 3,415 11%
Per Common ShareBasic Net Earnings 2.74 2.43 13%Diluted Net Earnings 2.56 2.28 12%Dividends 1.01 .90 12%
A B O U T P R O C T E R & G A M B L E Deep consumer understanding and leading-edge science andtechnologies go hand-in-hand at Procter & Gamble. Every day, the people of P&G work hard toprovide products of superior quality and value – products that improve the lives of consumers aroundthe world. Procter & Gamble markets approximately 300 brands to nearly five billion consumers,including Tide, Pampers,Ariel, Crest,Always,Whisper,Vicks, Didronel, Pantene Pro-V, Oil of Olayand Pringles. P&G employs 110,000 people worldwide, with world and North American head-quarters in Cincinnati, Ohio, USA, and regional headquarters in Europe,Asia and Latin America.
$1,000


4
ThermaCare: Ease your pain – with wearable heatThermaCare ultra-thin wraps fit comfortably under your clothes for soothing heat that helps relieve pain all day long.
Dryel: Care for "dry clean only" fabrics – at homeFor less than a $1 a garment and about 30 minutes a load, Dryel helps clean and freshen wool, rayon, silk and other “dry clean only” clothes in your home dryer.

5
new to the
Febreze: Clean bad smells out of fabrics – for goodJust spray Febreze on furniture, carpets, rugs, car interiors, clothing, even shoes – and odors trapped in fabrics are gone.
Olean: Enjoy great tasting snacks – with less fatOur Crisco people came up with a cooking oil that fries up great tasting snacks without adding any fat or a single calorie.
The fine mist penetrates fibers, cleaningaway odors as it evaporates.
world brands...

6
Pampers: Breakthrough technologyadvances baby skin care With its uniqueGentle Touch Liner, Pampers has surpassed competition to become the U.S. share leader in premium diapers.
Crest: Breakthrough ingredient introduced in CrestExtra Whitening Its patented, enamel-safe soft silica helps remove surface stains to let the naturalwhiteness of your teeth shine through.
new to thebrandinnovations

Actonel: New standard of care for Paget’s Disease,the second most common metabolic bone disorderFDA approves remission indication with only 1/3the treatment time of current leading therapies,moving Actonel closer to regulatory submission for osteoporosis.
Fairy Liquid: First anti-bacterial dish soap in theU.K. Fairy received RoyalInstitute of Public Healthand Hygiene certificationfor its innovative, germ-killing property that fightscross-contamination.
Nelson Watts, M.D., Director, Osteoporosis Program, Emory University, consults with a patient.
7
Pantene Elastesse: First major break-through in hair spray technology in over 40 years The natural, touchable, flexiblehold meets consumer needs and grows our global dollar share to #1.

8
Financial Results
Financial Review Responsibility for theFinancial Statementsand Report ofIndependentAccountants
Consolidated FinancialStatements
Notes to Consolidated Financial Statements
09 18 19 24
A tradition of growth through innovation.

1911: First all-vegetable shortening
The Procter & Gamble Company and Subsidiaries
9
F I N A N C I A L R E V I E W
Results of Operations
The Company achieved record sales, unit volume andnet earnings for the year ended June 30, 1998. Basicnet earnings per common share increased 13% to
$2.74. Worldwide net earnings for theyear were $3.78 billion, an 11% increaseover the prior year earnings of $3.42billion.
Worldwide net sales for the currentyear were $37.15 billion, an increase of4% on worldwide unit volume growthof 6%. The difference between the salesand volume growth rates was primarilydue to weaker currencies in Europe andAsia. Excluding these impacts, salesincreased 8%.
Worldwide gross margin for thecurrent year was 43.3% compared to42.7% in the prior year. The currentyear improvement reflects cost savings,primarily from the Company’s ongoingsimplification and standardization pro-gram, as ongoing cost savings generated
by the program exceeded the net cost to fund currentyear projects.
Worldwide marketing, research and administrativeexpenses were $10.04 billion compared to $9.77 billionin the prior year. This equates to 27.0% of sales,compared with 27.3% in the prior year. The 3%increase in total spending was primarily due toincreased marketing support behind new brands, suchas Tampax and Fat Free Pringles, and the expansion ofexisting brands into new markets.
Operating income grew 10%, primarily reflecting salesgrowth and cost-control efforts. The Company’s netearnings margin increased from 9.5% to 10.2%, the high-est level in 57 years.
Interest expense increased 20% to $548 million onincreased debt, due mainly to acquisitions. Otherincome, net, which consists primarily of interest andinvestment income, contributed $201 million in thecurrent year. In the prior year, other income, net, was$218 million.
The Company’s effective tax rate for the year was33.8% compared to 34.9% in the prior year. Thedecline reflects the benefits of lower tax rates in Europe,increased research and development tax credits inNorth America, and continued emphasis on effectivetax planning.
In 1997, the Company completed its $2.4 billionrestructuring program started in 1993, with annualcost savings in excess of $600 million after tax. TheCompany is continuing an ongoing program ofsimplification and standardization,which includes projects to consoli-date selected manufacturing facilities,re-engineer manufacturing and distri-bution processes, redesign organizations,simplify product line-ups and divestnon-strategic brands and assets. Thisprogram did not have a significantimpact on 1998 net earnings, as theaggregate pre-tax cost of projects wasoffset by gains on sales of non-strategicbrands and other assets. The net cost ofthese activities in 1997 was offset byincreased licensing activity in theHealth Care sector.
Net Earnings(Billions of Dollars)
Net Sales(Billions of Dollars)

1946: First heavy-duty synthetic laundry detergent10
F I N A N C I A L R E V I E W ( C O N T I N U E D )
The following provides perspective on the year ended June 30,1997 versus the prior year:
Worldwide net earnings increased 12% to $3.42billion in 1997. Net earnings for 1996 were $3.05 billionand included the settlement of the Bankers Trustlawsuit, profit from the sale of the Company’s share ofa health care joint venture, a reserve for estimated losseson a supply agreement entered into as part of the previ-ous divestiture of the commercial pulp business, andadoption of FASB Statement No. 121 covering recog-nition of impairment of long-lived assets. If these itemshad been excluded from 1996 earnings, the growth ratefor the year ended June 30, 1997 would have been 13%.
Worldwide net sales in 1997 were$35.76 billion, up 1% from the prioryear on unit volume growth of 3%. Thedifference between sales and volumegrowth rates was primarily due toweaker currencies in Europe and Asia.
Worldwide gross margin increased to 42.7% from 40.7% in 1996, reflect-ing cost savings from the Company’ssimplification and standardization effortsand the continuing benefits of therestructuring project initiated in 1993.
Worldwide marketing, research andadministrative expenses were 27.3% ofsales compared with 27.0% in 1996,primarily due to increases in advertisingand research.
Other income, net, was $218 million in 1997. In1996, other income, net, was $338 million and includeda $120 million benefit from reversing the reserve for two interest rate swap contractsfollowing settlement of a lawsuitagainst Bankers Trust; a $185million gain on the sale of theCompany’s 50% share of a healthcare joint venture to its venturepartner; and a $230 million chargeto increase the reserve for estimatedlosses on a supply agreemententered into as part of the previoussale of the Company’s commercialpulp business.
Net earnings margin increasedto 9.5% in 1997 from 8.6% in 1996,reflecting unit volume growth andcontinued emphasis on cost controlthrough the Company’s simplifica-tion and standardization program.
Financial Condition
Cash flow from operations was$4.89 billion, $5.88 billion and $4.16 billion in1998, 1997 and 1996, respectively. Operating cashflow provided the primary source of funds to financeoperating needs, capital expenditures and the sharerepurchase programs. Operating cash flow, combinedwith additional borrowings, provided the primarysource of funds to finance current year acquisitions.
Cash and cash equivalents decreased $801 million inthe current year to $1.55 billion, primarily due toacquisitions and increased capital expenditures.
Capital expenditures were $2.56 billion in 1998,$2.13 billion in 1997, and $2.18 billion in 1996. Currentyear expenditures included capacity expansions in thepaper and food businesses, primarily in tissue and toweland snacks. Capital expenditures are expected toincrease during the upcoming year, reflecting plannedcapacity increases and technological advances, primar-ily in the paper and laundry businesses.
Total Shareholder ReturnRelative to S&P 500
Net Earnings Margin %
The Procter & Gamble Company and Subsidiaries

1955: First fluoride toothpaste clinically proven to prevent cavities
The Procter & Gamble Company and Subsidiaries
11
Net cash used for acquisitions completed during1998 totaled $3.27 billion, the highest level in the Company’s history. Acquisitions were largelyconcentrated in paper businesses, and includedTambrands, Inc. and its global leading brand, Tampax,the Loreto y Peña paper company in Mexico, and theSsangyong Paper Company in Korea. The Companyalso increased ownership of various ventures in Asiaand Latin America. Current year acquisitions werefunded through a combination of existing cashbalances and the issuance of debt. Net cash used foracquisition activities in 1997 and 1996 totaled $150million and $358 million, respectively. The Companycontinued to divest certain non-strategic brands in1998 in order to focus organizational resources on theCompany’s core businesses. The proceeds from thesesales, the most significant of which was DuncanHines, and other asset sales, generated $555 million incash flow in the current year, compared to $520 mil-lion and $402 million in 1997 and 1996, respectively.
The Company initiated a sharerepurchase program in 1995 whichauthorized the Company to purchaseshares annually to mitigate the dilutiveimpact of management compensationprograms. The Company also initiateddiscretionary buy-back programs torepurchase additional outstanding sharesof up to $1 billion per year during 1997and 1998, in addition to purchases madeunder the 1995 program. Current yearpurchases under the repurchase pro-grams totaled $1.93 billion compared to$1.65 billion in the prior year. TheCompany has announced plans toincrease and accelerate its discretionaryshare repurchase programs in 1999 beyondits previous annual target of $1 billion.
Common share dividends grew 12% to $1.01per share in 1998, compared to $.90 and $.80 in1997 and 1996, respectively. For the coming year, theannual dividend rate will increase to $1.14 per commonshare, marking the forty-third consecutive year ofincreased common share dividend payments. Totaldividend payments, to both common and preferredshareholders, were $1.46 billion, $1.33 billion and $1.20 billion in 1998, 1997 and 1996, respectively.
Total debt was up $3.06 billion to $8.05 billion,primarily due to the issuance of commercial paper tofund current year acquisitions.
Long-term borrowing available under theCompany’s shelf registration statement filed in 1995, as amended in July 1997, was $2.0 billion at June 30,1998. Additionally, the Company has the ability to issuecommercial paper at favorable rates.
The following pages provide perspective on the Company’sgeographic operating segments. Geographic segments excludecorporate items, most notably certain financing and employeebenefit costs, goodwill amortization, segment eliminationsand projects related to the Company’s simplification andstandardization program.
Operating Cash Flow(Billions of Dollars)
Net Sales by Geographic Region (Billions of Dollars)
North America
Europe, Middle East and Africa
Asia
Latin America
Corporate
.
.
.
.
.

1956: First scouring cleanser with effective bleaching12
The Procter & Gamble Company and SubsidiariesF I N A N C I A L R E V I E W ( C O N T I N U E D )
North America Region
The North America region continued to deliver solidprogress, achieving record sales, unit volume and net earnings.
Net sales for the year were $18.46 billion, anincrease of 5% from the prior year level of $17.63billion, on unit volume growth of 4%.
Net earnings for the region were up 10% to $2.47 billion. The region achieved this earnings growththrough increased unit volume, a continued focus on
cost control through simplification andstandardization, and a lower tax rate,primarily related to increased research anddevelopment tax credits, partially offset byincreased spending on product initiatives.Prior year net earnings were $2.25 bil-lion, which represented a 15% increaseover 1996. Net earnings margin for theregion was 13.4%, compared to 12.8%and 11.3% in 1997 and 1996, respectively.
The Paper sector led the region’scurrent year volume progress, generat-ing 10% unit volume growth versus theprior year and delivering over half ofthe region’s total unit volume increase.This unit volume growth was achievedbehind the strength of the feminineprotection business, driven by theTambrands acquisition; diapers, due toinitiative programs; and tissue andtowel, as a result of prior year capacity
increases. The Paper sector also led the region’s profitimprovements, driven by volume growth, increasedpricing in tissue and towel, and cost reduction fromthe ongoing simplification and standardizationprogram. In the prior year, operating results weredriven by the diaper category, behind the acquisitionof baby wipes and the introduction of Pampers Baby-Dry, and by tissue and towel capacity increases.
The Laundry and Cleaning sector was also a strongcontributor to the region’s current year unit volumeprogress, with a 3% increase over a strong prior yearbase period. The volume gains weredriven by laundry, which also con-tributed heavily to the sector’s earningsprogress, and by fabric conditioners.
The Food and Beverage sectorachieved 1% unit volume growth in thecurrent year, despite reduced coffeevolumes resulting from commodity-based price increases and the sale ofDuncan Hines. The snacks categoryposted the highest increase, behind thelaunch of Fat Free Pringles. The sector’searnings were negatively impacted by theloss of profit contribution from DuncanHines, and by investments in new initia-tives. In 1997, unit volume growth wasled by the snacks category, whichachieved double-digit growth behindnew production capacity.
Unit volume in the Beauty Caresector grew 2% during the year, led by hair care anddeodorants. Net earnings for the sector increased overa strong prior year base, driven by the skin care andpersonal cleansing and the cosmetics and fragrancescategories. Earnings growth declined from the double-digit increases of prior years, due to intense competitionin hair care and deodorants, and increased investmentsin the development of future product initiatives.
North America Net Earnings(Millions of Dollars)
North America Net Sales(Billions of Dollars)
1961: First pleasant-to-use shampoo effective against dandruff
The Procter & Gamble Company and Subsidiaries
13
Unit volume in the Health Care sector was down1%, as volume softness caused by intense competitiveactivity in oral care was partially offset by improvedvolume in the pharmaceuticals category. The sector’sunit volume posted a 3% decline in 1997 compared to1996. Earnings declined in 1998, as the sector con-tinued to invest in research and development, primarilyin pharmaceuticals, and in marketing support in thehighly competitive oral care category. The sector willcontinue to invest heavily in research and development,with a pipeline for launching new pharmaceutical drugsin the coming years and a renewed focus on futureinnovations in other health care products.
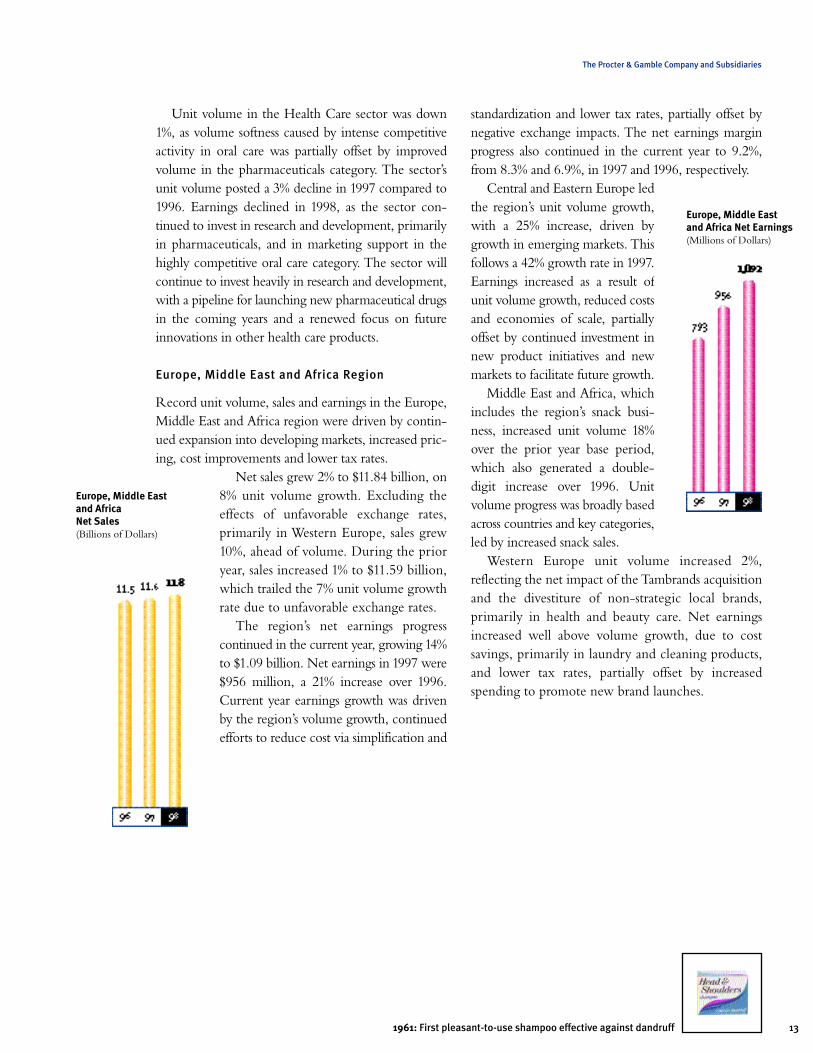
Europe, Middle East and Africa Region
Record unit volume, sales and earnings in the Europe,Middle East and Africa region were driven by contin-ued expansion into developing markets, increased pric-ing, cost improvements and lower tax rates.
Net sales grew 2% to $11.84 billion, on8% unit volume growth. Excluding theeffects of unfavorable exchange rates,primarily in Western Europe, sales grew10%, ahead of volume. During the prioryear, sales increased 1% to $11.59 billion,which trailed the 7% unit volume growthrate due to unfavorable exchange rates.
The region’s net earnings progresscontinued in the current year, growing 14%to $1.09 billion. Net earnings in 1997 were$956 million, a 21% increase over 1996.Current year earnings growth was drivenby the region’s volume growth, continuedefforts to reduce cost via simplification and
standardization and lower tax rates, partially offset bynegative exchange impacts. The net earnings marginprogress also continued in the current year to 9.2%,from 8.3% and 6.9%, in 1997 and 1996, respectively.
Central and Eastern Europe ledthe region’s unit volume growth,with a 25% increase, driven bygrowth in emerging markets. Thisfollows a 42% growth rate in 1997.Earnings increased as a result ofunit volume growth, reduced costsand economies of scale, partiallyoffset by continued investment innew product initiatives and newmarkets to facilitate future growth.
Middle East and Africa, whichincludes the region’s snack busi-ness, increased unit volume 18%over the prior year base period,which also generated a double-digit increase over 1996. Unitvolume progress was broadly basedacross countries and key categories,led by increased snack sales.
Western Europe unit volume increased 2%,reflecting the net impact of the Tambrands acquisitionand the divestiture of non-strategic local brands,primarily in health and beauty care. Net earningsincreased well above volume growth, due to costsavings, primarily in laundry and cleaning products,and lower tax rates, partially offset by increasedspending to promote new brand launches.
Europe, Middle East and Africa Net Sales(Billions of Dollars)
Europe, Middle Eastand Africa Net Earnings(Millions of Dollars)

1961: First successful, mass-marketed disposable diaper14
The Procter & Gamble Company and SubsidiariesF I N A N C I A L R E V I E W ( C O N T I N U E D )
Asia Region
The Asia region was negatively impacted by ageneral market contraction caused by the currencyand economic crises in Korea and the ASEANcountries (Thailand, Malaysia, Philippines, Indonesiaand Singapore) and the continuing economic reces-sion in Japan.
Net sales for the region were $3.45 billion, 3% belowthe prior year on 4% unit volume growth. Current yearvolume growth was driven by acquisitions, includingSsangyong, a paper business in Korea, and increasedownership of a venture in China, which more than
offset volume declines in the rest of theregion. Net sales lagged volume growthas the impact of improved pricing andproduct mix were more than offset by theimpact of unfavorable exchange ratemovements. Excluding adverse exchangeeffects, sales grew 10%, primarily due topricing aimed at recovering the currencydevaluation effects. In the prior year, netsales declined 8% to $3.57 billion on a7% unit volume decline. Excludingexchange effects in 1997, sales were down2% versus 1996.
The region’s net earnings were $174 million, a 37% decrease from theprior year. Current year earnings wereimpacted by lower sales, increased invest-ment in new product initiatives and thecurrency crisis. The prior year netearnings of $275 million represented a 1% increase over 1996. Net earningsmargin for the current year was 5.0%,
compared to 7.7% in 1997 and 7.0% in 1996. The 1998margin decline reflects lower sales, exchange impactsand initiative investments.
Greater China’s unit volume was up 6% versus theprior year.Volume increases were driven by increasedownership of a joint venture. Net earnings werehigher as the impact of increased volume was partiallyoffset by unfavorable sales mix and investmentbehind new product introductions.
In Japan, unit volume was relatively flat, reflecting thecontinued depressed state of the Japanese economy.Despite the economic troubles, the Company continuedto invest in new product initiatives andwas successful in increasing market sharesduring the second half of the year. Netearnings were lower due to unfavorablesales mix, investment in new productsand the weakened yen.
The balance of Asia was positivelyimpacted by the acquisition of theSsangyong Paper Company in Korea.The increased volume in Korea resultingfrom this acquisition more than offsetvolume declines brought about by the economic crisis. Earnings, however,declined as a result of the currency crisis.
The Asian markets are expected toremain weak through at least fiscal 1999.Because the Asia region accounted forless than 10% of the Company’s total salesand 5% of the Company’s total earningsin fiscal 1998, the economic situation isnot expected to be significant to the Company’s over-all growth rate for the coming year. While the region isexpected to recover from these difficulties, the depthand duration of the economic effects are still uncertain.
Latin America Region
Latin America continued its positive trends in net salesand net earnings, with current year results being drivenby acquisitions and the continued strengthening inMexico and Venezuela.
Net sales in the region grew 14% to $2.64 billion on12% unit volume growth, as pricing outpaced the nega-tive impact of currency devaluation. Volume gainsresulted from the acquisition of Loreto y Peña, a paper
Asia Net Sales(Billions of Dollars)
Asia Net Earnings(Millions of Dollars)

15
The Procter & Gamble Company and Subsidiaries
1967: First mass-marketed laundry detergent with enzymes for presoaking and washing
company in Mexico, the buy-out of apaper joint venture in the Southern Cone(Brazil, Argentina, Chile), the prior yearacquisition of a laundry and cleaningbusiness in Brazil, and the strengtheningof the base business in Mexico, Venezuelaand Argentina. In the prior year, sales forthe region grew 6% to $2.31 billion,while unit volume was down 2%, reflect-ing inflation-driven pricing action. InMexico, the Company’s largest operationin the region, business results were strong.Unit volume increased 16%, behind theacquisition of the Loreto y Peña papercompany and a general economic recov-ery in the market.
Net earnings for the region were $274 million, a 7% increase. Current yearearnings lagged behind sales growth due
to increased investment to support brand expansion inthe Southern Cone. Excluding these geographies, thebalance of the region’s earnings grew in double digits.Prior year net earnings were $256 million, a 17%increase over 1996. Net earnings margin for the current
year was 10.4% compared to 11.1% and10.1% in 1997 and 1996, respectively,reflecting initiative investments.
Prior to January 1, 1998, both Braziland Peru were highly inflationaryeconomies, and accordingly, the results ofthe Company’s subsidiaries in Brazil andPeru were measured using the UnitedStates dollar as their functional currency.Effective January 1, 1998, neither Brazilnor Peru qualified as a highly inflationaryeconomy. The impact of this change wasnot material.
Hedging and Derivative Financial Instruments
The Company is exposed to market risk, includingchanges in interest rates, currency exchange rates andcommodity prices. To manage the volatility relatingto these exposures on a consolidated basis, theCompany nets the exposures to take advantage ofnatural offsets and enters into various derivative trans-actions for the remaining exposures pursuant to theCompany’s policies in areas such as counterpartyexposure and hedging practices. The financialimpacts of these hedging instruments are offset bycorresponding changes in the underlying exposuresbeing hedged. The Company does not hold or issuederivative financial instruments for trading purposes.Note 5 to the consolidated financial statementsincludes a discussion of the Company’s accountingpolicies for financial instruments.
Derivative positions are monitored using techniquesincluding market value, sensitivity analysis and a value atrisk model. The tests for interest rate and currency rateexposures discussed below are based on a variance/co-variance value at risk model using a one-year hori-zon and a 95% confidence level. The model assumesthat financial returns are normally distributed andapproximates the financial return for options and othernon-linear instruments. The model also reflects theimpact of correlation and diversification from holdingmultiple currency and interest rate instruments.Estimates of volatility and correlations of market factorsare drawn from the JP Morgan RiskMetrics™ datasetas of June 30, 1998. In cases where data is unavailable inRiskMetrics™, a reasonable approximation is included.The effect of these estimates did not significantlychange the total value at risk.
The Company’s market risk exposures relative tointerest and currency rates, as discussed below, havenot changed materially versus the previous reportingperiod. In addition, the Company is not aware of anyfacts or circumstances that would significantly impactsuch exposures in the near-term.
Latin America Net Sales(Billions of Dollars)
Latin America Net Earnings(Millions of Dollars)

1968: First uniformly shaped, stackable potato chip16
The Procter & Gamble Company and SubsidiariesF I N A N C I A L R E V I E W ( C O N T I N U E D )
Interest Rate Exposure
Interest rate swaps are used to hedge underlying debtobligations. Certain currency interest rate swaps aredesignated to hedge the foreign currency exposure ofthe Company’s related foreign net investments.
Based on the Company’s overall interest rate exposure as of and during the year ended June 30,1998, including derivative and other interest ratesensitive instruments, a near-term change in interestrates, within a 95% confidence level based on histor-ical interest rate movements, would not materiallyaffect the consolidated financial position, results ofoperations or cash flows.
Currency Rate Exposures
The Company manufactures and sells its products ina number of countries throughout the world and, asa result, is exposed to movements in foreign currencyexchange rates. The major foreign currency exposuresinvolve the markets in Western Europe, Mexico andCanada. The primary purpose of the Company’sforeign currency hedging activities is to protectagainst the volatility associated with foreign currencypurchases of materials and other assets and liabilitiescreated in the normal course of business. Corporatepolicy prescribes the range of allowable hedgingactivity. The Company primarily utilizes forwardexchange contracts and purchased options withdurations of generally less than 12 months.
In addition, the Company enters into foreigncurrency swaps to hedge intercompany financingtransactions, and utilizes purchased foreign currencyoptions with durations of generally less than18 months and forward exchange contracts to hedgeagainst the effect of exchange rate fluctuations onroyalties and foreign source income.
Based on the Company’s overall currency rateexposure as of and during the year ended June 30,1998, including derivative and other foreign currencysensitive instruments, a near-term change in currencyrates, within a 95% confidence level based on histor-ical currency rate movements, would not materiallyaffect the consolidated financial position, results ofoperations or cash flows.
Commodity Price Exposure
Raw materials used by the Company are subject toprice volatility caused by weather, supply conditionsand other unpredictable factors. The Company usesfutures and options contracts, primarily in food andbeverage products, to manage the volatility related tocertain of these exposures. Gains and losses relating toqualifying hedges of firm commitments or anticipatedinventory transactions are deferred in prepaid expenses and are included in the basis of the under-lying transactions. Commodity hedging activity is notmaterial to the Company’s consolidated financialposition, results of operations or cash flows.
Organization 2005
The Company is currently designing Organization2005, a realignment of the organization structure,work processes and culture to accelerate growth andinnovation. While the details are not final, the designwill likely include:
• A move from current geographic business unitsto product-based Global Business Units (GBUs).
• The further strengthening of country-based organ-izations to provide even greater focus on deep locallevel consumer and customer knowledge.
• The establishment of centers of excellence for keyadministrative, logistics and support functions.
• Changes in the culture and reward systems toencourage greater speed, innovation and flexibility.
The nature, timing and implications related to this design change have not yet been determined.The Company expects to finalize plans and to makeavailable further details of the Organization 2005changes in Fall 1998.
Year 2000
The Company has developed plans to address thepossible exposures related to the impact on itscomputer systems of the Year 2000. Key financial,information and operational systems, including equip-ment with embedded microprocessors, have beeninventoried and assessed, and detailed plans are in placefor the required systems modifications or replacements.
1972: First effective dryer-added fabric softener
The Procter & Gamble Company and Subsidiaries
17
Progress against these plans is monitored and reportedto management and to the Audit Committee of theBoard of Directors on a regular basis. Implementationof required changes to critical systems is expected to becompleted during fiscal 1999. Testing and certificationof critical systems, which includes review of docu-mented remediation work and test results by technicalexperts, key users and a central project team, isexpected to be successfully completed by December 31,1999. In addition, the Company’s Internal Controlsorganization plans to review the testing and certificationprocess and observe the testing of selected criticalsystems in each region.
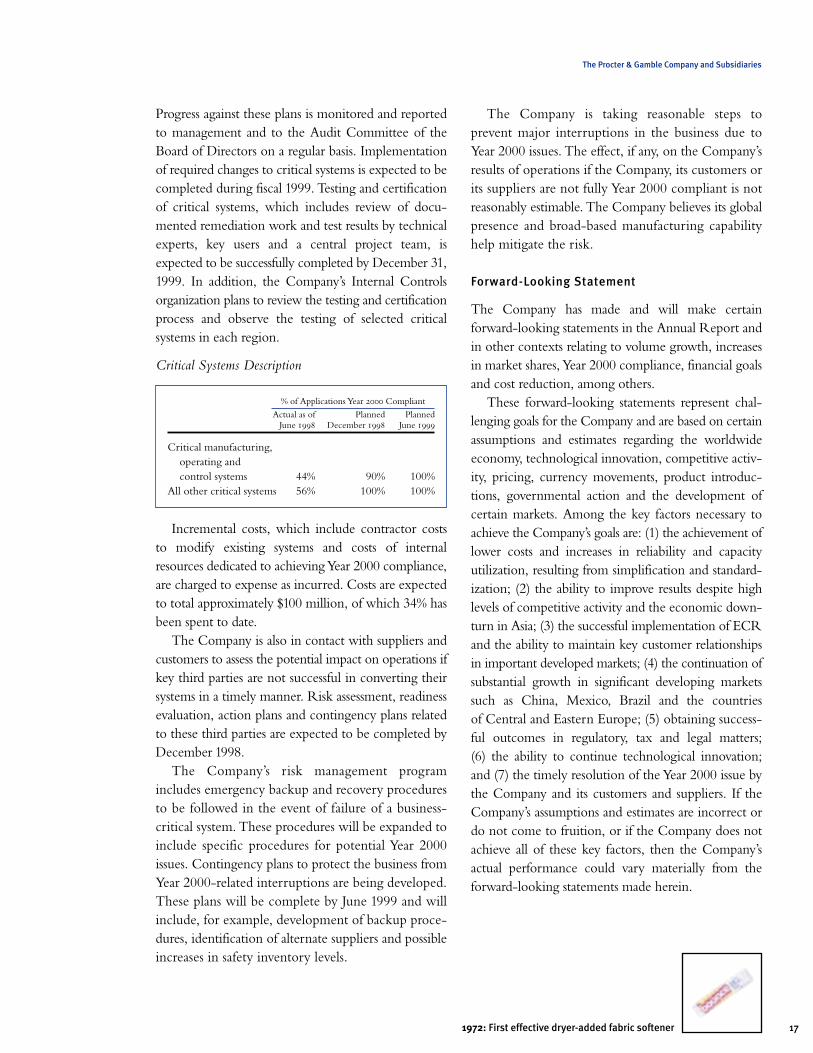
Critical Systems Description
% of Applications Year Compliant
Actual as of Planned PlannedJune December June
Critical manufacturing, operating and control systems 44% 90% 100%
All other critical systems 56% 100% 100%
Incremental costs, which include contractor costs to modify existing systems and costs of internalresources dedicated to achieving Year 2000 compliance,are charged to expense as incurred. Costs are expectedto total approximately $100 million, of which 34% hasbeen spent to date.
The Company is also in contact with suppliers andcustomers to assess the potential impact on operations ifkey third parties are not successful in converting theirsystems in a timely manner. Risk assessment, readinessevaluation, action plans and contingency plans relatedto these third parties are expected to be completed byDecember 1998.
The Company’s risk management programincludes emergency backup and recovery proceduresto be followed in the event of failure of a business-critical system. These procedures will be expanded toinclude specific procedures for potential Year 2000issues. Contingency plans to protect the business fromYear 2000-related interruptions are being developed.These plans will be complete by June 1999 and will include, for example, development of backup proce-dures, identification of alternate suppliers and possibleincreases in safety inventory levels.
The Company is taking reasonable steps toprevent major interruptions in the business due toYear 2000 issues. The effect, if any, on the Company’sresults of operations if the Company, its customers orits suppliers are not fully Year 2000 compliant is notreasonably estimable. The Company believes its globalpresence and broad-based manufacturing capabilityhelp mitigate the risk.
Forward-Looking Statement
The Company has made and will make certainforward-looking statements in the Annual Report andin other contexts relating to volume growth, increasesin market shares, Year 2000 compliance, financial goalsand cost reduction, among others.
These forward-looking statements represent chal-lenging goals for the Company and are based on certainassumptions and estimates regarding the worldwideeconomy, technological innovation, competitive activ-ity, pricing, currency movements, product introduc-tions, governmental action and the development ofcertain markets. Among the key factors necessary toachieve the Company’s goals are: (1) the achievement oflower costs and increases in reliability and capacityutilization, resulting from simplification and standard-ization; (2) the ability to improve results despite highlevels of competitive activity and the economic down-turn in Asia; (3) the successful implementation of ECRand the ability to maintain key customer relationships in important developed markets; (4) the continuation ofsubstantial growth in significant developing marketssuch as China, Mexico, Brazil and the countries of Central and Eastern Europe; (5) obtaining success-ful outcomes in regulatory, tax and legal matters; (6) the ability to continue technological innovation; and (7) the timely resolution of the Year 2000 issue bythe Company and its customers and suppliers. If theCompany’s assumptions and estimates are incorrect ordo not come to fruition, or if the Company does notachieve all of these key factors, then the Company’sactual performance could vary materially from theforward-looking statements made herein.
18
The Procter & Gamble Company and SubsidiariesR E S P O N S I B I L I T Y F O R T H E F I N A N C I A L S T A T E M E N T S
Consolidated financial statements and financial information included in this report are the responsibility ofCompany management. This includes preparing the statements in accordance with generally accepted accountingprinciples and necessarily includes estimates based on management’s best judgments.
To help insure the accuracy and integrity of Company financial data, management maintains internalcontrols designed to provide reasonable assurance that transactions are executed as authorized and accuratelyrecorded and that assets are properly safeguarded. These controls are monitored by an ongoing program of internalaudits. These audits are supplemented by a self-assessment program that enables individual organizations to evaluatethe effectiveness of their controls. Careful selection of employees and appropriate divisions of responsibility aredesigned to achieve control objectives. The Company’s “Worldwide Business Conduct Manual” sets forthmanagement’s commitment to conduct its business affairs with the highest ethical standards.
Deloitte & Touche LLP, independent public accountants, have audited and reported on the Company’s consol-idated financial statements. Their audits were performed in accordance with generally accepted auditing standards.
The Board of Directors, acting through its Audit Committee composed entirely of outside directors, oversees theadequacy of internal controls. The Audit Committee meets periodically with representatives of Deloitte & Touche LLPand internal financial management to review internal control, auditing and financial reporting matters. The indepen-dent auditors and the internal auditors also have full and free access to meet privately with the Audit Committee.
John E. Pepper Erik G. NelsonChairman and Chief Executive Chief Financial Officer
R E P O R T O F I N D E P E N D E N T A C C O U N T A N T S
250 East Fifth StreetCincinnati, Ohio 45202
To the Board of Directors and Shareholders of The Procter & Gamble Company:
We have audited the accompanying consolidated balance sheets of The Procter & Gamble Company andsubsidiaries as of June 30, 1998 and 1997 and the related consolidated statements of earnings, shareholders’ equity,and cash flows for each of the three years in the period ended June 30, 1998. These financial statements are theresponsibility of the Company’s management. Our responsibility is to express an opinion on these financialstatements based on our audits.
We conducted our audits in accordance with generally accepted auditing standards. Those standards requirethat we plan and perform the audits to obtain reasonable assurance about whether the financial statements are freeof material misstatement. An audit includes examining, on a test basis, evidence supporting the amounts anddisclosures in the financial statements. An audit also includes assessing the accounting principles used and significantestimates made by management, as well as evaluating the overall financial statement presentation. We believe thatour audits provide a reasonable basis for our opinion.
In our opinion, the financial statements referred to above present fairly, in all material respects, the financialposition of the Company at June 30, 1998 and 1997 and the results of its operations and cash flows for each of thethree years in the period ended June 30, 1998, in conformity with generally accepted accounting principles.
July 30, 1998

1972: First dishwashing liquid with grease-cutting superiority
The Procter & Gamble Company and Subsidiaries
19
C O N S O L I D A T E D S T A T E M E N T S O F E A R N I N G S
Years Ended June 30Amounts in Millions Except Per Share Amounts
Net Sales $37,154 $35,764 $35,284
Cost of products sold 21,064 20,510 20,938
Marketing, research and administrative expenses 10,035 9,766 9,531
Operating Income 6,055 5,488 4,815
Interest expense 548 457 484
Other income, net 201 218 338
Earnings Before Income Taxes 5,708 5,249 4,669
Income taxes 1,928 1,834 1,623
Net Earnings $ 3,780 $ 3,415 $ 3,046
Basic Net Earnings Per Common Share $ 2.74 $ 2.43 $ 2.14
Diluted Net Earnings Per Common Share $ 2.56 $ 2.28 $ 2.01
Dividends Per Common Share $ 1.01 $ .90 $ .80
See accompanying Notes to Consolidated Financial Statements.

1975: First contour-shaped diaper
The Procter & Gamble Company and Subsidiaries
20
C O N S O L I D A T E D B A L A N C E S H E E T S
June 30Amounts in Millions Except Per Share Amounts
ASSETS
Current Assets
Cash and cash equivalents $ 1,549 $ 2,350
Investment securities 857 760
Accounts receivable 2,781 2,738
Inventories
Materials and supplies 1,225 1,131
Work in process 343 228
Finished goods 1,716 1,728
Deferred income taxes 595 661
Prepaid expenses and other current assets 1,511 1,190
Total Current Assets 10,577 10,786
Property, Plant and Equipment
Buildings 3,660 3,409
Machinery and equipment 15,953 14,646
Land 539 570
20,152 18,625
Accumulated depreciation (7,972) (7,249)
Total Property, Plant and Equipment 12,180 11,376
Goodwill and Other Intangible Assets
Goodwill 7,023 3,915
Trademarks and other intangible assets 1,157 1,085
8,180 5,000
Accumulated amortization (1,169) (1,051)
Total Goodwill and Other Intangible Assets 7,011 3,949
Other Non-Current Assets 1,198 1,433
Total Assets $30,966 $27,544
See accompanying Notes to Consolidated Financial Statements.

1978: Didronel, the first global osteoporosis drug
The Procter & Gamble Company and Subsidiaries
21
June 30Amounts in Millions Except Per Share Amounts
LIABILITIES AND SHAREHOLDERS’ EQUITY
Current Liabilities
Accounts payable $ 2,051 $ 2,203
Accrued and other liabilities 3,942 3,802
Taxes payable 976 944
Debt due within one year 2,281 849
Total Current Liabilities 9,250 7,798
Long-Term Debt 5,765 4,143
Deferred Income Taxes 428 559
Other Non-Current Liabilities 3,287 2,998
Total Liabilities 18,730 15,498
Shareholders’ Equity
Convertible Class A preferred stock,
stated value $1 per share
(600 shares authorized) 1,821 1,859
Non-Voting Class B preferred stock,
stated value $1 per share (200 shares
authorized; none issued) – –
Common stock, stated value $1 per share
(5,000 shares authorized; shares outstanding:
1998–1,337.4 and 1997–1,350.8) 1,337 1,351
Additional paid-in capital 907 559
Reserve for employee stock ownership plan debt retirement (1,616) (1,634)
Accumulated other comprehensive income (1,357) (819)
Retained earnings 11,144 10,730
Total Shareholders’ Equity 12,236 12,046
Total Liabilities and Shareholders’ Equity $30,966 $27,544

1985: Superior paper-making technology yields stronger, more absorbent paper towels
The Procter & Gamble Company and Subsidiaries
22
C O N S O L I D A T E D S T A T E M E N T S O F S H A R E H O L D E R S ’ E Q U I T Y
AccumulatedDollars in Common Additional Reserve for Other TotalMillions/Shares Shares Common Preferred Paid-in ESOP Debt Comprehensive Retained Comprehensivein Thousands Outstanding Stock Stock Capital Retirement Income Earnings Total Income
Balance June 30, 1995 1,373,148 $1,373 $1,913 $129 $(1,734) $ 65 $ 8,843 $10,589Net earnings 3,046 3,046 $3,046Other comprehensive income:
Currency translation, net of $80 tax (483) (483) (483)
Other, net of tax 1 1 1Reclassifications to
net earnings (1) (1) (1)Total comprehensive income $2,563
Dividends to shareholders:Common (1,099) (1,099)Preferred, net of tax benefit (103) (103)
Treasury purchases (10,468) (10) (422) (432)Employee plan issuances 6,514 6 140 146Preferred stock conversions 1,952 2 (27) 25 0ESOP debt guarantee reduction 58 58Balance June 30, 1996 1,371,146 1,371 1,886 294 (1,676) (418) 10,265 11,722Net earnings 3,415 3,415 $3,415Other comprehensive income:
Currency translation, net of $38 tax (416) (416) (416)
Other, net of tax 13 13 13Reclassifications to
net earnings 2 2 2Total comprehensive income $3,014
Dividends to shareholders:Common (1,225) (1,225)Preferred, net of tax benefit (104) (104)
Treasury purchases (30,875) (31) (1,621) (1,652)Employee plan issuances 8,801 9 240 249Preferred stock conversions 1,771 2 (27) 25 0ESOP debt guarantee reduction 42 42Balance June 30, 1997 1,350,843 1,351 1,859 559 (1,634) (819) 10,730 12,046Net earnings 3,780 3,780 $3,780Other comprehensive income:
Currency translation, net of $25 tax (537) (537) (537)
Other, net of tax (1) (1) (1)Total comprehensive income $3,242
Dividends to shareholders:Common (1,358) (1,358)Preferred, net of tax benefit (104) (104)
Treasury purchases (24,716) (25) (1,904) (1,929)Employee plan issuances 8,777 9 312 321Preferred stock conversions 2,557 2 (38) 36 0ESOP debt guarantee reduction 18 18Balance June 30, 1998 1,337,461 $1,337 $1,821 $907 $(1,616) $(1,357) $11,144 $12,236
See accompanying Notes to Consolidated Financial Statements.

1986: Super-absorbent polymer technology provides unparalleled dryness in a thin diaper
The Procter & Gamble Company and Subsidiaries
23
C O N S O L I D A T E D S T A T E M E N T S O F C A S H F L O W S
Years Ended June 30Amounts in Millions
Cash and Cash Equivalents, Beginning of Year $ 2,350 $ 2,074 $ 2,028
Operating Activities
Net earnings 3,780 3,415 3,046
Depreciation and amortization 1,598 1,487 1,358
Deferred income taxes (101) (26) 328
Change in accounts receivable 42 8 17
Change in inventories (229) (71) 202
Change in accounts payable, accrued and other liabilities (3) 561 (948)
Change in other operating assets and liabilities (65) 503 (134)
Other (137) 5 289
Total Operating Activities 4,885 5,882 4,158
Investing Activities
Capital expenditures (2,559) (2,129) (2,179)
Proceeds from asset sales 555 520 402
Acquisitions (3,269) (150) (358)
Change in investment securities 63 (309) (331)
Total Investing Activities (5,210) (2,068) (2,466)
Financing Activities
Dividends to shareholders (1,462) (1,329) (1,202)
Change in short-term debt 1,315 (160) 242
Additions to long-term debt 1,970 224 339
Reductions of long-term debt (432) (724) (619)
Proceeds from stock options 158 134 89
Treasury purchases (1,929) (1,652) (432)
Total Financing Activities (380) (3,507) (1,583)
Effect of Exchange Rate Changes
on Cash and Cash Equivalents (96) (31) (63)
Change in Cash and Cash Equivalents (801) 276 46
Cash and Cash Equivalents, End of Year $ 1,549 $ 2,350 $ 2,074
Supplemental Disclosure
Cash payments for:
Interest, net of amount capitalized $ 536 $ 449 $ 459
Income taxes 2,056 1,380 1,339
Liabilities assumed in acquisitions 808 42 56
See accompanying Notes to Consolidated Financial Statements.

24
The Procter & Gamble Company and SubsidiariesN O T E S T O C O N S O L I D A T E D F I N A N C I A L S T A T E M E N T SMillions of Dollars Except Per Share Amounts
1 Summary of Significant Accounting Policies
Basis of Presentation: The consolidated financial state-ments include The Procter & Gamble Company and itscontrolled subsidiaries (the Company). Investments incompanies that are at least 20% to 50% owned, and overwhich the Company exerts significant influence butdoes not control the financial and operating decisions,are accounted for by the equity method. These invest-ments are managed as integral parts of the Company’ssegment operations, and the Company’s share of theirresults is included in net sales for the related segments.
Use of Estimates: Preparation of financial statements inconformity with generally accepted accounting princi-ples requires management to make estimates andassumptions that affect the amounts reported in theconsolidated financial statements and accompanyingdisclosures. These estimates are based on management’sbest knowledge of current events and actions theCompany may undertake in the future. Actual resultsmay ultimately differ from estimates.
Accounting Changes: In 1998, the Company adoptedseveral FASB statements. Statement No. 128,“Earnings per Share,” which revises the manner inwhich earnings per share is calculated, did not impactthe Company’s previously reported earnings per share.Statement No. 130, “Reporting ComprehensiveIncome,” requires the components of comprehensiveincome to be disclosed in the financial statements.Statement No. 131, “Disclosures about Segments ofan Enterprise and Related Information,” requirescertain information to be reported about operatingsegments on a basis consistent with the Company’sinternal organizational structure. Statement No. 132,“Employers’ Disclosures about Pensions and OtherPostretirement Benefits,” revises the disclosures forpensions and other postretirement benefits andstandardizes them into a combined format. Requireddisclosures have been made and prior years’ informa-tion has been reclassified for the impact of FASBStatements 130, 131 and 132.
New Pronouncements: In June 1998, the FASB issuedStatement No. 133, “Accounting for DerivativeInstruments and Hedging Activities,” which revises theaccounting for derivative financial instruments. In March 1998, the AICPA issued SOP 98-1,
“Accounting for the Costs of Computer Software Developed or Obtained for Internal Use,” which revisesthe accounting for software development costs and will require the capitalization of certain costs which the Company has historically expensed. TheCompany is currently analyzing the impacts of thesestatements, which are required to be adopted in 2000,and does not expect either statement to have a materialimpact on the Company’s financial position, results ofoperations or cash flows.
Currency Translation: Financial statements of subsidiariesoutside the U.S. generally are measured using the localcurrency as the functional currency. Adjustments totranslate those statements into U.S. dollars are accumu-lated in a separate component of shareholders’ equity.For subsidiaries operating in highly inflationaryeconomies, the U.S. dollar is the functional currency.Remeasurement adjustments for highly inflationaryeconomies and other transactional exchange gains(losses) are reflected in earnings and were $0, $1 and$(28) for 1998, 1997 and 1996, respectively.
Cash Equivalents: Highly liquid investments withmaturities of three months or less when purchased areconsidered cash equivalents.
Inventory Valuation: Inventories are valued at cost,which is not in excess of current market price. Cost isprimarily determined by either the average cost orthe first-in, first-out method. The replacement cost oflast-in, first-out inventories exceeds carrying value byapproximately $91 and $122 at June 30, 1998 and1997, respectively.
Goodwill and Other Intangible Assets: The cost ofintangible assets is amortized, principally on astraight-line basis, over the estimated periods bene-fited, generally 40 years for goodwill and periodsranging from 10 to 40 years for other intangible assets.The realizability of goodwill and other intangibles isevaluated periodically when events or circumstancesindicate a possible inability to recover the carryingamount. Such evaluation is based on various analyses,including cash flow and profitability projections thatincorporate the impact of existing Company busi-nesses. The analyses necessarily involve significantmanagement judgment to evaluate the capacity of anacquired business to perform within projections.Historically, the Company has generated sufficientreturns from acquired businesses to recover the cost ofthe goodwill and other intangible assets.
1986: First complete shampoo and conditioner in one

1986: Patented “Wings” technology combined with “Dri-Weave” topsheet creates superior feminine protection
The Procter & Gamble Company and Subsidiaries
25
Property, Plant and Equipment: Property, plant and equip-ment are recorded at cost reduced by accumulateddepreciation. Depreciation expense is provided based onestimated useful lives using the straight-line method.
Selected Operating Expenses: Research and developmentcosts are charged to earnings as incurred and were $1,546in 1998, $1,469 in 1997 and $1,399 in 1996. Advertisingcosts are charged to earnings as incurred and were $3,704in 1998, $3,466 in 1997 and $3,254 in 1996.
Net Earnings Per Common Share: Net earnings lesspreferred dividends (net of related tax benefits) aredivided by the weighted average number of commonshares outstanding during the year to calculate basic netearnings per common share. Diluted net earnings percommon share are calculated to give effect to stockoptions and convertible preferred stock.
Basic and diluted net earnings per share are recon-ciled as follows:
Years Ended June 30
Net earnings available to common shareholders $3,676 $3,311 $2,943
Effect of dilutive securitiesPreferred dividends,
net of tax benefit 104 104 103Preferred dividend
impact on funding of ESOP (25) (32) (39)
Diluted net earnings 3,755 3,383 3,007
Basic weighted average common shares outstanding 1,343.4 1,360.3 1,372.6
Effect of dilutive securitiesConversion of
preferred shares 99.8 101.9 103.8Exercise of stock options 22.3 24.8 19.8
Diluted weighted average common shares outstanding 1,465.5 1,487.0 1,496.2
Stock Split: In July 1997, the Company’s board ofdirectors approved a two-for-one stock split that waseffective for common and preferred shareholders ofrecord as of August 22, 1997. The financial statements,notes and other references to share and per-share datareflect the stock split for all periods presented.
Fair Values of Financial Instruments: Fair values of cashequivalents, short and long-term investments and short-term debt approximate cost. The estimated fair values of
other financial instruments, including debt and riskmanagement instruments, have been determined usingavailable market information and valuation method-ologies, primarily discounted cash flow analysis. These estimates require considerable judgment in interpretingmarket data, and changes in assumptions or estimationmethods may significantly affect the fair value estimates.
Major Customer: The Company’s largest customer, Wal-Mart Stores, Inc. and its affiliates, accounted for 11% and 10% of consolidated net sales in 1998 and1997, respectively. These sales occurred primarily inthe North America segment.
Reclassifications: Certain reclassifications of prior years’amounts have been made to conform with the currentyear presentation, primarily related to certain compo-nent parts of research and development costs.
2 Acquisitions
In July 1997, the Company acquired Tambrands, Inc., acompany in the feminine protection category, forapproximately $1,844 in cash. Other acquisitions in 1998totaled $1,425 and included the acquisition of paperbusinesses and increased ownership in various venturesin Latin America and Asia. These acquisitions, all ofwhich were accounted for using the purchase method,resulted in goodwill of $3,335. Acquisitions accountedfor as purchases in 1997 and 1996 totaled $150 and $358,respectively.
The following table reflects unaudited pro formacombined results of operations on the basis that the1998 acquisitions had taken place at the beginning ofthe year for each of the periods presented:
Years Ended June 30
Pro forma amountsNet sales $37,476 $37,008Net earnings 3,756 3,409Net earnings per common share
Basic 2.72 2.43Diluted 2.55 2.27
In management’s opinion, the unaudited pro formacombined results of operations are not indicative of the actual results that would have occurred under theownership and management of the Company.
1989: First North American laundry detergent with activated bleach26
The Procter & Gamble Company and SubsidiariesN O T E S T O C O N S O L I D A T E D F I N A N C I A L S T A T E M E N T S ( C O N T I N U E D )
Millions of Dollars Except Per Share Amounts
3 Supplemental Balance Sheet Information
June 30
Accrued and Other LiabilitiesMarketing expenses $1,109 $1,129Compensation expenses 485 461Other 2,348 2,212
3,942 3,802Other Non-Current LiabilitiesPostretirement benefits $1,193 $1,300Pension benefits 843 815Other 1,251 883
3,287 2,998
CurrencyTranslation Other Total
Accumulated OtherComprehensive IncomeBalance June 30, 1995 $ 64 $ 1 $ 65Current period change (483) 0 (483)Balance June 30, 1996 (419) 1 (418)Current period change (412) 11 (401)Balance June 30, 1997 (831) 12 (819)Current period change (536) (2) (538)Balance June 30, 1998 (1,367) 10 (1,357)
4 Short-Term and Long-Term Debt
June 30
Short-Term DebtU.S. obligations $1,435 $183Foreign obligations 560 343Current portion of long-term debt 286 323
2,281 849
The weighted average short-term interest rates were 6.2% and 6.9% as of June 30, 1998 and 1997,respectively.
Average June 30
Rate Maturities
Long-Term DebtU.S. notes and
debentures 6.96% 1998-2029 $2,897 $2,082ESOP Series A 8.33% 1998-2004 545 613ESOP Series B 9.36% 2021 1,000 1,000U.S. commercial
paper 1,207 585Foreign obligations 402 186Current portion of
long-term debt (286) (323)5,765 4,143
Long-term weighted average interest rates in thepreceding table are as of June 30, 1998 and includethe effects of related interest rate swaps discussed inNote 5. Certain commercial paper balances havebeen classified as long-term debt based on theCompany’s intent and ability to renew the obligationson a long-term basis. The Company has entered intoderivatives that convert certain of these commercialpaper obligations into fixed-rate obligations.
The fair value of the long-term debt was $6,412 and$4,509 at June 30, 1998 and 1997, respectively. Long-term debt maturities during the next five years are asfollows: 1999 – $286; 2000 – $387; 2001– $339;2002 – $427 and 2003 – $1,141.
5 Risk Management Activities
The Company is exposed to market risk, includingchanges in interest rates, currency exchange rates andcommodity prices. To manage the volatility relating tothese exposures on a consolidated basis, the Company nets the exposures to take advantage of natural offsetsand enters into various derivative transactions for theremaining exposures pursuant to the Company’s poli-cies in areas such as counterparty exposure and hedgingpractices. The financial impacts of these hedging instru-ments are offset by corresponding changes in theunderlying exposures being hedged. The Companydoes not hold or issue derivative financial instrumentsfor trading purposes.
Interest Rate ManagementThe Company’s policy is to manage interest cost usinga mix of fixed and variable rate debt. To manage thismix in a cost-efficient manner, the Company entersinto interest rate swaps, in which the Company agreesto exchange, at specified intervals, the differencebetween fixed and variable interest amounts calculatedby reference to an agreed-upon notional principalamount. These swaps are designated to hedge underly-ing debt obligations. For qualifying hedges, the interestrate differential is reflected as an adjustment to interestexpense over the life of the swaps.
Certain currency interest rate swaps are designatedto hedge the foreign currency exposure of theCompany’s related foreign net investments. Currencyeffects of these hedges are reflected in the accumu-lated other comprehensive income section of share-holders’ equity, offsetting a portion of the translationof the net assets.

1990: Breakthrough technology in a non-chlorine, gentle bleach
The Procter & Gamble Company and Subsidiaries
27
The following table presents information for allinterest rate instruments. The notional amount does notnecessarily represent amounts exchanged by the partiesand, therefore, is not a direct measure of the Company’sexposure to credit risk. The fair value approximates thecost to settle the outstanding contracts. The carryingvalue includes the net amount due to counterpartiesunder swap contracts, currency translation associatedwith currency interest rate swaps and any marked-to-market value adjustments of instruments.
June 30
Notional amount $2,149 $1,488Fair value $ 7 $ (54)Carrying value 28 (28)Unrecognized loss (21) (26)
Although derivatives are an important componentof the Company’s interest rate management program,their incremental effect on interest expense for 1998,1997 and 1996 was not material.
Currency Rate ManagementThe Company manufactures and sells its products ina number of countries throughout the world and, asa result, is exposed to movements in foreign currencyexchange rates. The major foreign currency exposuresinvolve the markets in Western Europe, Mexico andCanada. The primary purpose of the Company’sforeign currency hedging activities is to protectagainst the volatility associated with foreign currencypurchases of materials and other assets and liabilitiescreated in the normal course of business. Corporatepolicy prescribes the range of allowable hedgingactivity. The Company primarily utilizes forwardexchange contracts and purchased options with dura-tions of generally less than 12 months.
In addition, the Company enters into foreigncurrency swaps to hedge intercompany financing trans-actions, and utilizes purchased foreign currency optionswith durations of generally less than 18 months andforward exchange contracts to hedge against the effect ofexchange rate fluctuations on royalties and foreignsource income.
Gains and losses related to qualifying hedges offoreign currency firm commitments or anticipatedtransactions are deferred in prepaid expense and areincluded in the basis of the underlying transactions.To the extent that a qualifying hedge is terminated orceases to be effective as a hedge, any deferred gainsand losses up to that point continue to be deferredand are included in the basis of the underlying trans-action. All other foreign exchange contracts aremarked-to-market on a current basis, generally tomarketing, research and administration expense. Tothe extent anticipated transactions are no longer likelyto occur, the related hedges are closed with gains orlosses charged to earnings on a current basis.
Currency instruments outstanding are as follows:
June 30
Notional amountForward contracts $3,448 $2,607Purchased options 1,262 1,643Currency swaps 217 358
Fair valueForward contracts $ 30 $ (2)Purchased options 16 38Currency swaps 8 (1)
The deferred gains and losses on these instrumentswere not material.
In addition, in order to hedge currency exposuresrelated to the net investments in foreign subsidiaries,the Company utilizes local currency financingentered into by the subsidiaries, and currency interestrate swaps and other foreign currency denominatedfinancing instruments entered into by the parent.Gains and losses on instruments designated as hedgesof net investments are offset against the translationeffects reflected in shareholders’ equity.
Currency interest rate swaps, foreign currencyinstruments and foreign currency denominated debtthat have been designated as hedges of the Company’snet investment exposure in certain foreign subsidiarieshave notional amounts totaling $1,138 and $936 at June 30, 1998 and 1997, respectively. These hedgesresulted in gains of $42 and $63, net of $25 and $38 intax effects, reflected in shareholders’ equity.

1990: First tartar control toothpaste28
The Procter & Gamble Company and SubsidiariesN O T E S T O C O N S O L I D A T E D F I N A N C I A L S T A T E M E N T S ( C O N T I N U E D )
Millions of Dollars Except Per Share Amounts
Credit RiskCredit risk arising from the inability of a counterparty tomeet the terms of the Company’s financial instrumentcontracts is generally limited to the amounts, if any, bywhich the counterparty’s obligations exceed the obli-gations of the Company. It is the Company’s policy toenter into financial instruments with a diversity ofcreditworthy counterparties. Therefore, the Companydoes not expect to incur material credit losses on its riskmanagement or other financial instruments.
6 Stock Options
The Company has stock-based compensation plansunder which stock options are granted annually to keymanagers and directors at the market price on the dateof grant. The grants are fully exercisable after one yearand have a ten-year life. In 1998, the Company grantedstock options to all eligible employees not covered bythe key manager and director plans. These grants,which comprised 8.7 million of the 20.3 millionoptions granted in 1998, are fully exercisable after fiveyears and have a ten-year life. The Company issuesstock appreciation rights in countries where stockoptions have not been approved by local governments.
Pursuant to FASB Statement No. 123, “Accountingfor Stock-Based Compensation,” the Company haselected to account for its employee stock option plansunder APB Opinion No. 25, “Accounting for StockIssued to Employees.” Accordingly, no compensationcost has been recognized for these plans. Had compen-sation cost for the plans been determined based on thefair value at the grant date consistent with FASBStatement No. 123, the Company’s net earnings andearnings per share would have been as follows:
Years Ended June 30
Net earningsAs reported $3,780 $3,415 $3,046Pro forma 3,472 3,305 2,981
Net earnings per common share
BasicAs reported $ 2.74 $ 2.43 $ 2.14Pro forma 2.51 2.35 2.10
DilutedAs reported 2.56 2.28 2.01Pro forma 2.35 2.20 1.97
The fair value of each option grant is estimated on thedate of grant using the Binomial option-pricing modelwith the following weighted average assumptions:
Years Ended June 30
Interest rate 5.6% 6.6% 6.1%Dividend yield 2% 2% 2%Expected volatility 26% 22% 20%Expected life in years 6 6 6
Stock option activity was as follows:
Options in Thousands
Outstanding, July 1 68,514 66,657 63,384Granted 20,315 10,409 9,605Exercised (8,477) (8,357) (6,110)Canceled (434) (195) (222)Outstanding, June 30 79,918 68,514 66,657Exercisable 59,610 58,098 57,048Available for grant 31,558 28,538 24,418Average price
Outstanding, beginning of year $31.00 $24.79 $21.36
Granted 83.26 58.72 40.87Exercised 18.57 16.02 14.52Outstanding, end of year 45.58 31.00 24.79Exercisable, end of year 32.74 26.03 22.09
Weighted average grant date fair value of options 24.56 17.14 10.88
The following table summarizes informationabout stock options outstanding at June 30, 1998:
Options Outstanding
Number Weighted-AvgRange of Outstanding Weighted-Avg RemainingPrices (Thousands) Exercise Price Contractual Life
$ 8 to 30 33,626 $22.69 3.4 years33 to 46 16,821 37.85 7.157 to 71 9,349 60.42 8.571 to 85 20,122 83.39 9.5

1992: Breakthrough Carezyme technology prevents fuzzing and color fading
The Procter & Gamble Company and Subsidiaries
29
The following table summarizes informationabout stock options exercisable at June 30, 1998:
Options Exercisable
NumberRange of Exercisable Weighted-AvgPrices (Thousands) Exercise Price
$ 8 to 30 33,626 $22.6933 to 46 16,821 37.8557 to 71 9,163 60.2471 to 85 – –
7 Postretirement Benefits
The Company offers various postretirement benefitsto its employees.
Defined Contribution Retirement PlansWithin the U.S., the most significant retirementbenefit is the defined contribution profit sharing planfunded by an employee stock ownership plan(ESOP) and Company contributions. Annual creditsto participants’ accounts are based on individual basesalaries and years of service, and do not exceed 15%of total participants’ annual salaries and wages.
Years Ended June 30
ESOP preferred shares allocated at market value $235 $247 $200
Company contributions 58 35 75Benefits earned 293 282 275
Other Retiree BenefitsThe Company also provides certain health care andlife insurance benefits for substantially all U.S.employees who become eligible for these benefitswhen they meet minimum age and service require-ments. Generally, the health care plans require contri-butions from retirees and pay a stated percentage ofexpenses, reduced by deductibles and other coverages.Retiree contributions change annually in line withmedical cost trends. These benefits are partiallyfunded by an ESOP, as well as certain other assetscontributed by the Company.
Certain other employees, primarily outside theU.S., are covered by local defined benefit pension,health care and life insurance plans.
Summarized information on the Company’spostretirement plans is as follows:
OtherPension Benefits Retiree Benefits
Years Ended June 30
Change in Benefit ObligationBenefit obligation at
beginning of year $1,991 $1,886 $ 1,460 $ 1,405Service cost 106 100 42 45Interest cost 148 131 102 109Participants’
contributions 3 5 11 12Amendments 21 2 (6) 5Actuarial loss (gain) 87 54 (71) (50)Acquisitions 154 42 1 0Curtailments 13 0 0 0Currency exchange (85) (117) (7) (4)Benefit payments (156) (112) (67) (62)Benefit obligation
at end of year 2,282 1,991 1,465 1,460Change in Plan AssetsFair value of plan
assets at beginning of year 1,229 1,019 1,828 838
Actual return on plan assets 243 180 803 999
Acquisitions 131 42 0 0Employer
contributions 103 83 37 41Participants’
contributions 3 5 11 12Currency exchange (30) 12 (1) 0Benefit payments (156) (112) (67) (62)Fair value of plan
assets at end of year 1,523 1,229 2,611 1,828
Funded StatusFunded status at
end of year (759) (762) 1,146 368Unrecognized net
actuarial gain (163) (95) (2,354) (1,691)Unrecognized
transition amount 32 35 0 0Unrecognized prior
service cost 75 43 (21) (17)Net amount
recognized (815) (779) (1,229) (1,340)
Prepaid benefit cost $ 34 $ 52 $ 1 $ 0Accrued benefit cost (849) (831) (1,230) (1,340)Net liability
recognized (815) (779) (1,229) (1,340)

1992: First penetrating, pro-vitamin formula for hair with superior shine
N O T E S T O C O N S O L I D A T E D F I N A N C I A L S T A T E M E N T S ( C O N T I N U E D )
Millions of Dollars Except Per Share Amounts
30
The Procter & Gamble Company and Subsidiaries
The Company’s stock comprised $2,443 and $1,687of other retiree plan assets, net of Series B ESOP debt,as of June 30, 1998 and 1997, respectively.
OtherPension Benefits Retiree Benefits
Years Ended June 30
Weighted Average AssumptionsDiscount rate 7.0% 7.2% 6.8% 7.5%Expected return
on plan assets 9% 9% 9% 9%Rate of
compensation increase 5% 5% – –
Initial health care cost trend rate* – – 8% 9%
*Assumed to decrease gradually to 5% in 2006 and remain atthat level thereafter.
OtherPension Benefits Retiree Benefits
Years Ended June 30
Components of Net Periodic Benefit CostService cost $ 106 $100 $ 96 $ 42 $ 45 $ 47Interest cost 148 131 131 102 109 102Expected return
on plan assets (103) (87) (75) (171) (138) (121)Amortization of
prior service cost 7 5 6 (2) (2) (2)Amortization of
transition amount 3 0 0 0 0 0Curtailment loss 12 0 0 0 0 0Recognized net
actuarial gain 0 (7) (3) (41) (18) (15)Gross benefit cost 173 142 155 (70) (4) 11Dividends on ESOP
preferred stock 0 0 0 (78) (79) (79)Net periodic
benefit cost 173 142 155 (148) (83) (68)
The projected benefit obligation, accumulatedbenefit obligation and fair value of plan assets for thepension plans with accumulated benefit obligations inexcess of plan assets were $1,206, $984 and $155,respectively, as of June 30, 1998, and $1,172, $899 and$158, respectively, as of June 30, 1997.
Assumed health care cost trend rates have a signif-icant effect on the amounts reported for the healthcare plans. A one-percentage-point change inassumed health care cost trend rates would have thefollowing effects:
1-Percentage- 1-Percentage-Point Increase Point Decrease
Effect on total of service and interest cost components $ 26 $ (22)
Effect on postretirement benefit obligation 207 (181)
8 Employee Stock Ownership Plan
The Company maintains the Procter & GambleProfit Sharing Trust and Employee Stock OwnershipPlan (ESOP) to provide funding for two primarypostretirement benefits described in Note 7: adefined contribution profit sharing plan and certainU.S. postretirement health care benefits.
The ESOP borrowed $1,000 in 1989, which hasbeen guaranteed by the Company. The proceeds wereused to purchase Series A ESOP Convertible Class APreferred Stock to fund a portion of the definedcontribution plan. Principal and interest requirementsare $117 per year, paid by the trust from dividends onthe preferred shares and from cash contributions andadvances from the Company. The shares are convert-ible at the option of the holder into one share of theCompany’s common stock. The liquidation value isequal to the issue price of $13.75 per share.
In 1991, the ESOP borrowed an additional $1,000,also guaranteed by the Company. The proceeds wereused to purchase Series B ESOP Convertible Class APreferred Stock to fund a portion of retiree health carebenefits. Debt service requirements are $94 per year,funded by preferred stock dividends and cash contri-butions from the Company. Each share is convertible atthe option of the holder into one share of theCompany’s common stock. The liquidation value isequal to the issuance price of $26.12 per share.
Shares in Thousands
Shares OutstandingSeries A 60,635 62,952 64,562Series B 37,805 38,045 38,204

1992: Asacol launched for treatment of ulcerative colitis
The Procter & Gamble Company and Subsidiaries
31
Shares of the ESOP are allocated at original costbased on debt service requirements, net of advancesmade by the Company to the trust. The fair value ofthe Series A shares serves to reduce the Company’s cashcontribution required to fund the profit sharing plancontributions earned. The Series B shares are consid-ered plan assets of the other retiree benefits plan.Dividends on all preferred shares, net of related taxbenefit, are charged to retained earnings. The preferredshares held by the ESOP are considered outstandingfrom inception for purposes of calculating diluted netearnings per common share.
9 Income Taxes
Earnings before income taxes consist of the following:
Years Ended June 30
United States $3,632 $3,232 $3,023International 2,076 2,017 1,646
5,708 5,249 4,669
The income tax provision consists of the following:
Years Ended June 30
Current tax expenseU.S. Federal $ 996 $ 967 $ 776International 918 805 413U.S. State & Local 115 88 106
2,029 1,860 1,295Deferred tax expense
U.S. Federal 51 1 220International & other (152) (27) 108
(101) (26) 328Total 1,928 1,834 1,623
Taxes credited to shareholders’ equity for the yearsended June 30, 1998 and 1997 were $147 and $97,respectively. Undistributed earnings of foreign sub-sidiaries that are considered to be reinvested indefinitelywere $6,739 at June 30, 1998.
The effective income tax rate was 33.8%, 34.9%and 34.8% in 1998, 1997 and 1996, respectively,compared to the U.S. statutory rate of 35%.
Deferred income tax assets and liabilities arecomprised of the following:
June 30
Current deferred tax assets $ 595 $ 661
Non-current deferred tax assets (liabilities)Depreciation (1,058) (1,031)Postretirement benefits 435 475Loss carryforwards 167 84Other 28 (87)
(428) (559)
Included in the above are total valuationallowances of $177 and $113 in 1998 and 1997, respec-tively. The valuation allowance increased in 1998primarily due to the generation of additional netoperating loss carryforwards.
10 Commitments and Contingencies
The Company has purchase commitments for materi-als, supplies, and property, plant and equipment inci-dental to the ordinary conduct of business. In theaggregate, such commitments are not at prices in excessof current market.
The Company is subject to various lawsuits andclaims with respect to matters such as governmentalregulations, income taxes and other actions arising outof the normal course of business. The Company is alsosubject to contingencies pursuant to environmentallaws and regulations that in the future may require theCompany to take action to correct the effects on theenvironment of prior manufacturing and wastedisposal practices. Accrued environmental liabilities forremediation and closure costs at June 30, 1998 were$66, and in management’s opinion, such accruals areappropriate based on existing facts and circumstances.Current year expenditures were not material.
While the effect on future results of these items is notsubject to reasonable estimation because considerableuncertainty exists, in the opinion of management andCompany counsel, the ultimate liabilities resulting fromsuch claims will not materially affect the consolidatedfinancial position, results of operations or cash flows ofthe Company.

1992: Macrobid launched as a urinary tract anti-infective32
The Procter & Gamble Company and Subsidiaries
Europe,North Middle East Latin
America and Africa Asia America Corporate Total
Net Sales $18,456 $11,835 $3,453 $2,640 $ 770 $37,154 17,625 11,587 3,573 2,306 673 35,764 17,230 11,458 3,881 2,173 542 35,284
Net Earnings 2,474 1,092 174 274 (234) 3,780 2,253 956 275 256 (325) 3,415 1,953 793 273 219 (192) 3,046
Earnings Before Income Taxes 3,789 1,540 266 329 (216) 5,708 3,516 1,446 400 326 (439) 5,249 3,055 1,137 433 236 (192) 4,669
Identifiable Assets 11,063 5,998 2,499 1,519 9,887 30,966 10,280 5,433 2,726 1,389 7,716 27,544 10,382 5,853 2,770 1,270 7,455 27,730
Capital Expenditures 1,433 686 266 174 - 2,559 1,163 547 287 132 - 2,129 1,080 602 322 175 - 2,179
Depreciation and Amortization 755 374 174 97 198 1,598 693 405 167 83 139 1,487 633 380 143 48 154 1,358
Interest Expense - - - - 548 548 - - - - 457 457 - - - - 484 484
N O T E S T O C O N S O L I D A T E D F I N A N C I A L S T A T E M E N T S ( C O N T I N U E D )
Millions of Dollars Except Per Share Amounts
11 Segment Information
The Company has adopted FASB Statement No. 131,“Disclosures about Segments of a Business Enterpriseand Related Information.” The Company is managedin four operating segments: North America, whichincludes the United States and Canada; Europe, MiddleEast and Africa; Asia; and Latin America.
Corporate operations include certain financingand employee benefits costs, goodwill amortization,
other general corporate income and expense,segment eliminations and projects included in theCompany’s ongoing simplification and standardizationprogram, which includes costs for consolidation ofselected manufacturing facilities, re-engineering ofmanufacturing and distribution processes, organiza-tion redesign and simplified product line-ups, as wellas gains and losses on sales of non-strategic brands andassets. Corporate assets include primarily cash,investment securities and goodwill.
Product Net Sales InformationThe following is supplemental information on netsales by product groups, aligned as follows:
Laundry and Cleaning – dishcare, fabric condi-tioners, hard surface cleaners and laundry.
Paper – diapers, feminine protection, inconti-nence, tissue and towel, and wipes.
Beauty Care–cosmetics and fragrances, deodorants,hair care, and skin care and personal cleansing.
Food and Beverage – coffee, commercial services,juice, peanut butter, shortening and oil, and snacks.
Health Care – gastrointestinal, oral care, pharma-ceuticals and respiratory care.
Laundry and Beauty Food and Health CorporateCleaning Paper Care Beverage Care & Other Total
$11,099 $10,862 $7,160 $4,376 $2,849 $808 $37,154 10,892 10,101 7,101 4,107 2,895 668 35,764 10,683 10,161 6,916 4,066 2,939 519 35,284

1994: First body wash with puff that cleans and conditions your skin
The Procter & Gamble Company and Subsidiaries
33
12 Quarterly Results (Unaudited)
Quarters Ended TotalSept. Dec. Mar. June Year
Net Sales - $9,355 $9,641 $8,881 $9,277 $37,154- 8,903 9,142 8,771 8,948 35,764
Operating Income - 1,739 1,688 1,516 1,112 6,055- 1,547 1,521 1,383 1,037 5,488
Net Earnings - 1,087 1,046 961 686 3,780- 979 944 881 611 3,415
Basic Net Earnings Per Common Share - .79 .76 .69 .50 2.74- .70 .67 .63 .43 2.43
Diluted Net Earnings Per Common Share - .73 .71 .65 .47 2.56- .65 .63 .59 .41 2.28
Net Sales 37,154 35,764 35,284 33,482 30,385
Operating Income 6,055 5,488 4,815 4,244 3,670
Net Earnings 3,780 3,415 3,046 2,645 2,211
Net Earnings Margin 10.2% 9.5% 8.6% 7.9% 7.3%
Basic Net Earnings Per Common Share 2.74 2.43 2.14 1.85 1.54
Diluted Net Earnings Per Common Share 2.56 2.28 2.01 1.74 1.45
Dividends Per Common Share 1.01 .90 .80 .70 .62
Research and Development Expense 1,546 1,469 1,399 1,304 1,162
Advertising Expense 3,704 3,466 3,254 3,284 2,996
Total Assets 30,966 27,544 27,730 28,125 25,535
Capital Expenditures 2,559 2,129 2,179 2,146 1,841
Long-Term Debt 5,765 4,143 4,670 5,161 4,980
Shareholders’ Equity 12,236 12,046 11,722 10,589 8,832
F I N A N C I A L H I G H L I G H T SMillions of Dollars Except Per Share Amounts
D I R E C T O R S A N D O F F I C E R S O F T H E C O M P A N Y
34
The Procter & Gamble Company and Subsidiaries
Directors
Edwin L. Artzt Retired Chairman of the Board and Chief ExecutiveNorman R. Augustine Chairman of the Executive Committee, Lockheed Martin Corporation – aerospace,
electronics, information management, materials and energy systems and productsDonald R. Beall Retired Chairman and Chief Executive Officer, Rockwell International Corporation –
automation, avionics and communications and semiconductor systems – and Chairman of the Executive Committee, Rockwell International Corporation
Gordon F. Brunner Senior Vice PresidentRichard B. Cheney Chairman of the Board and Chief Executive Officer, Halliburton Company –
energy services, engineering and constructionHarald Einsmann Executive Vice PresidentRichard J. Ferris Retired Co-Chairman, Doubletree CorporationJoseph T. Gorman Chairman and Chief Executive Officer, TRW Inc. – automotive, space, defense
and information systemsDurk I. Jager President and Chief Operating OfficerCharles R. Lee Chairman and Chief Executive Officer, GTE Corporation – telecommunication servicesLynn M. Martin Professor, Davee Chair, J. L. Kellogg Graduate School of Management,
Northwestern UniversityJohn E. Pepper Chairman of the Board and Chief ExecutiveJohn C. Sawhill President and Chief Executive Officer, The Nature Conservancy – an international
conservation organizationJohn F. Smith, Jr. Chairman, Chief Executive Officer and President, General Motors Corporation –
automobile and related businessesRalph Snyderman Chancellor for Health Affairs, Dean, School of Medicine at Duke University,
and President/CEO of Duke University Health SystemRobert D. Storey Partner in the law firm of Thompson, Hine & Flory P.L.L.Marina v.N. Whitman Professor of Business Administration and Public Policy, University of Michigan
Board Committees
Executive CommitteeE. L. Artzt, ChairmanJ. E. PepperN. R. AugustineD. R. BeallR. J. FerrisJ. T. Gorman
Audit CommitteeD. R. Beall, ChairmanR. B. CheneyC. R. LeeJ. C. SawhillJ. F. Smith, Jr.R. SnydermanR. D. Storey
Compensation CommitteeN. R. Augustine, ChairmanD. R. BeallR. B. CheneyJ. T. GormanM. v.N. Whitman
Finance CommitteeR. J. Ferris, ChairmanE. L. ArtztN. R. AugustineJ. T. GormanL. M. MartinM. v.N. Whitman
Board Organization and Nominating CommitteeM. v.N. Whitman, ChairmanR. J. FerrisC. R. LeeL. M. MartinJ. C. SawhillJ. F. Smith, Jr.R. SnydermanR. D. Storey
Public Policy CommitteeR. D. Storey, ChairmanE. L. ArtztR. B. CheneyC. R. LeeL. M. MartinJ. C. SawhillJ. F. Smith, Jr.R. Snyderman

The Procter & Gamble Company and Subsidiaries
35
Corporate Officers
John E. Pepper Chairman of the Board and Chief ExecutiveDurk I. Jager President and Chief Operating OfficerWolfgang C. Berndt Executive Vice President (President – North America)Harald Einsmann Executive Vice President (President – Europe, Middle East and Africa)Alan G. Lafley Executive Vice President (President – Asia)Jorge P. Montoya Executive Vice President (President – Latin America)Richard L. Antoine Senior Vice President (Human Resources)Gordon F. Brunner Senior Vice President (Research and Development)Stephen N. David Senior Vice President (Customer Business Development)Todd A. Garrett Senior Vice President (Chief Information Officer)James J. Johnson Senior Vice President and General CounselGary T. Martin Senior Vice President (Product Supply)Erik G. Nelson Senior Vice President (Chief Financial Officer)Charlotte R. Otto Senior Vice President (Public Affairs)Robert L. Wehling Senior Vice President (Advertising, Market Research and Government Relations)Robert T. Blanchard Group Vice President (President, Beauty Care Products – North America,
Procter & Gamble North America)Brian J. Buchan Group Vice President (President, Paper Products – Asia)Bruce L. Byrnes Group Vice President (President, Health Care Products – North America,
Procter & Gamble North America)R. Kerry Clark Group Vice President (President, Laundry and Cleaning Products – North America,
Procter & Gamble North America)Michael Clasper Group Vice President (President, Laundry Products – Europe, Procter & Gamble Europe,
Middle East and Africa)Larry G. Dare Group Vice President (President, Paper and Beverage Products – Europe,
Procter & Gamble Europe, Middle East and Africa)Stephen P. Donovan, Jr. Group Vice President (President, Food and Beverage Products – North America,
Procter & Gamble North America)Jeffrey D. Jones Group Vice President on Special AssignmentMark D. Ketchum Group Vice President (President, Paper Products – North America, Procter & Gamble
North America)Fuad O. Kuraytim Group Vice President (President – Middle East, Africa and General Export,
Procter & Gamble Europe, Middle East and Africa)Claude L. Meyer Group Vice President – Europe, Middle East and AfricaMartin J. Nuechtern Group Vice President (President – ASEAN and Australasia, Procter & Gamble Asia)John O’Keeffe Group Vice President (President, Health and Beauty Care Products – Europe,
Procter & Gamble Europe, Middle East and Africa)Dimitri Panayotopoulos Group Vice President (President – China, Procter & Gamble Asia)Herbert Schmitz Group Vice President (President – Central and Eastern Europe, Procter & Gamble
Europe, Middle East and Africa)Clayton C. Daley, Jr. Vice President and TreasurerDavid R. Walker Vice President and ComptrollerTerry L. Overbey Secretary and Associate General Counsel
Organization Changes
The following changes in the senior management of the Company were announced during the past year:
Benjamin L. Bethell, Edwin H. Eaton, Jr., and Lawrence D. Milligan retired.Richard L. Antoine and Stephen N. David were elected Senior Vice Presidents.Brian J. Buchan and Michael Clasper were elected Group Vice Presidents.Jacobus Groot resigned from the Company.

S H A R E H O L D E R I N F O R M A T I O N
36
The Procter & Gamble Company and Subsidiaries
If . . .
• You need help with your account or if you needautomated access to your account
• You are interested in our Certificate Safekeeping service
• You need to change an address or discontinueduplicate mailings
• You want to arrange for direct deposit of dividends
• A stock certificate is lost, stolen or destroyed
• You want to participate in our ShareholderInvestment Program . . .
Contact P&G’s Shareholder Services Office in Cincinnati.
Call: 1-800-742-62531-513-983-3034 (outside the U.S.)
Write: The Procter & Gamble CompanyShareholder Services DepartmentP.O. Box 5572Cincinnati, Ohio 45201-5572
Financial information is available 24 hours a day. Justcall 1-800-764-7483.
You can also visit us on the World Wide Web. Ouraddress is www.pg.com/investor
Common Stock Price Range and Dividends
Price Range Dividends
- - - -
Quarter Ended High Low High Low
September 30 $77.56 $64.06 $48.75 $41.19 $.2525 $.2250December 31 83.44 62.00 55.50 45.75 .2525 .2250March 31 87.88 77.31 64.81 51.81 .2525 .2250June 30 92.50 80.19 71.94 56.63 .2525 .2250
Corporate Headquarters
The Procter & Gamble CompanyP.O. Box 599Cincinnati, Ohio 45201-0599
Transfer Agent/Shareholder Services
The Procter & Gamble CompanyShareholder Services DepartmentP.O. Box 5572Cincinnati, Ohio 45201-5572
Registrar
PNC Bank, N.A.P.O. Box 1198Cincinnati, Ohio 45201-1198
Exchange Listing
New York, Cincinnati, Amsterdam, Paris, Basle,Geneva, Lausanne, Zurich, Frankfurt, Brussels, Tokyo
Shareholders of Common Stock
There were 272,723 Common Stock shareholders ofrecord, including participants in the ShareholderInvestment Program, as of July 24, 1998.
Form 10-K
Beginning in October 1998, shareholders may obtain acopy of the Company’s 1998 report to the Securitiesand Exchange Commission on Form 10-K by going toP&G’s investor Web site at www.pg.com/investor or bycalling us at 1-800-742-6253. This information is alsoavailable at no charge by sending a request toShareholder Services at the address above.
Shareholders’ Meeting
The next annual meeting of shareholders will be heldon Tuesday, October 13, 1998. A full transcript of themeeting will be available from Linda D. Rohrer,Assistant Secretary, at a cost of $10. Ms. Rohrer canbe reached at One P&G Plaza, Cincinnati, Ohio45202-3315.

We make the brands you trust every day.

Features available for you on:
• Sign up to receive P&G earnings and dividend news releases via e-mail
• Receive future annual reports and proxystatements online
• Automatically update all of your personalinvestments with the latest prices
• Moving? Change your address
• Find our latest stock price
• Print forms to transfer shares, make optional cash payments and reinvest dividends
We are constantly striving to improve the quality of service for our Shareholders. You can now vote P&G’s proxy online – see theenclosed proxy card for more detail.
The Procter & Gamble Company One Procter & Gamble Plaza Cincinnati, Ohio 452020038-7103
Vote P&G’s proxy online
• Read stock market commentary every trading day
• Find answers to the most frequently askedshareholder questions
• Discover P&G’s historical stock performance versus the S&P 500
• Find 5 to 10 years worth of key financialperformance measures, such as operatingmargin and return on equity
• Review daily stock prices over the last 30 years
• Print a direct stock purchase plan application
http://www.pg.com/investor