annual tax collection report - louisiana revenue09.10)final.pdf · of ldr’s vehicle fleet was...
TRANSCRIPT
ANNUAL TAX COLLECTION REPORTLouisiana Department of Revenue • Contributing to a Better Quality of Life

ContentsMessage from the Secretary • 1
Who Benefits • 2
Total State Expenditures by Functional Area • 3
Organizational Chart/Mission, Values, & Vision Statements • 4
Department Profile • 5-6
Compliance Continuum • 7
Regional Offices • 8
SUMMARY OF COLLECTIONSTax Collections (Five-Year Comparison of Major Taxes) • 11
Tax Collections (2009-10 Monthly Cash Collections) • 12
Tax Collections (Cash Collection after Accrual Adjustments – Fy 2009-10) • 13
Tax Collections (Cash Collections – Five-Year Comparison of Total Collections) • 14
Tax Collections (Cash Collection after Accrual Adjustments – Two-Year Comparison) • 15
15-Year Cash Tax Collection Record • 16
Summary of Tax Collections & Refunds (By Tax/Fee Type) • 17
Comparison of All States’ Taxes (By Source) • 18
All States’ Total Tax Collections (Per Capita) • 19
Total State Taxes Except Severance Tax (Per Capita) • 20
Parish Comparison of Various & Per Capita Tax Collections • 21-22
Local Dedications State Hotel/Motel Tax Collections • 23-24
Various Fund Distributions • 25
Offers in Compromise • 26
DATA BY TAX TYPEAlcoholic Beverage Tax • 29-33
Corporation Income & Franchise Tax • 34-39
Gift & Inheritance Tax • 40
Individual Income Tax • 41-51
Petroleum Products Tax • 52-54
Sales Tax • 55-65
Severance Tax • 66-73
Tobacco Tax • 74-76
Louisiana Revised Statute 43:32 requires state government agencies to obtain a written request before mailing printed material more than ten pages in length. To receive
additional copies of this report, or to request the annual report for the next fiscal year, please send a letter or post card with your name and address to the following address:
Louisiana Department of Revenue
Tax Administration
Post Office Box 3193
Baton Rouge, LA 70821-3193
Fax: (225) 219.2692
This public document was published at a total cost of $1,825.00. Two hundred fifty copies of this public document were published in this first printing at a cost of $1,825.00. The
total cost of all printing of this document, including reprints, is $1,825.00. This document was duplicated in-house for the Louisiana Department of Revenue, Post Office Box 201,
Baton Rouge, LA 70821-0201, to establish a permanent record of state tax collection trends for use by governmental agencies and businesses, under authority of R.S. 36:454(7).
This material was printed in accordance with the standards for printing by state agencies established pursuant to R.S. 43:31.

MESSAGE from the SECRETARYTo the Honorable Governor Bobby Jindal and Members of the Louisiana Legislature
“It is my pleasure to present to you this annual report of services and accomplishments of the Louisiana Department of Revenue (LDR) for the fiscal year ended June 30, 2010.
In response to the state’s current fiscal outlook, LDR achieved a savings of more than $2 million by improving the efficiency of its tax collection program. Key cost-saving measures included our decision to cease mailing paper individual income tax booklets to taxpayers at a cost of $250,000, thus encouraging the use of online filing. Assisted by a multimedia educational campaign, produced internally at no cost, electronic filing of individual income tax returns increased more than 20 percent over the previous fiscal year.
LDR also consolidated customer service operations by closing two regional office facilities and expanding reliance on telecommuting by field audit and delinquent tax collection personnel. This initiative saved $1.8 million. Additionally, 10 percent of LDR’s vehicle fleet was returned to the state’s motor pool.
This agency successfully administered and implemented the Louisiana Tax Delinquency Amnesty Act of 2009, exceeding the $150 million revenue projection by over 200 percent. The program generated $483 million in amnesty receipts that helped fund coastal protection and restoration, and other initiatives of the State.
I hope you will join me in acknowledging the hard – and smart – work achieved by our talented staff in Fiscal Year 2009-2010. I remain proud of the remarkable commitment I witness every day from the employees at the Louisiana Department of Revenue.”Yours sincerely in public service,
Cynthia Bridges Secretary
1

2
WHO BENEFITS FROM TAXES, LICENSES, & FEES?(GENERAL FUND REVENUES)
• Our children: Public schools receive 55%
• Our families: Health & human services receive 21%
• Our neighborhoods: Public safety programs receive 9%
• Our colleges: Institutions of higher education receive 14%
• Our roads: State and local road funds are supported by motor fuel tax dollars

3
TOTAL STATE EXPENDITURES BY FUNCTIONAL AREA (FY 09-10)
(total excluding double counts & contingencies)
Education includes: Department of Education; Higher Education; Special Schools and Commissions; and Higher Education Debt Service.
Human Resources includes: Health and Hospitals (and related ancillary agencies); Social Services; Youth Services; Louisiana State University Medical Center Health Care Services Division; Mental Health Advocacy Service; Patients’ Compensation Fund Oversight Board; Office of Women’s Policy; Office of Elderly Affairs; and Veterans’ Affairs.
Public Safety includes: Corrections Services; Local Housing and State Offenders; Corrections Debt Service; Prison Enterprises; Public Safety Services (and related ancillary agencies); Governor’s Office of Homeland Security and Emergency Preparedness; Military Affairs; Office of the Attorney General; District Attorneys & Assistant District Attorneys; Supplemental Pay to Law Enforcement Personnel; Louisiana Commission on Law Enforcement; Municipal Fire and Police Civil Service; State Police Commission; Two Percent Fire Insurance Fund; and Emergency Medical Services-Parishes & Municipalities.
Business and Infrastructure includes: Economic Development; Culture, Recreation and Tourism; Labor; Insurance; Public Service Commission; Transportation and Development; Capital Outlay; Sales Tax Dedications; Parish Transportation; Sabine River Authority; Municipal Facility Revolving Fund; Louisiana Recovery Authority; Louisiana Manufactured Housing Commission; Workforce Commission Office; Louisiana Stadium and Exposition District; Louisiana State Racing Commission; Office of Financial Institutions; and Louisiana State Board of Cosmetology.
Environment and Natural Resources includes: Environmental Quality; Natural Resources; Wildlife and Fisheries; and Agriculture.
General Government includes: Executive Office; Office of Indian Affairs; Division of Administration (and related ancillary agencies and DOA Debt Service and Maintenance); Board of Tax Appeals; Secretary of State; Lieutenant Governor; Treasury; Revenue; Civil Service (except agencies listed in Public Safety); Retirement Systems; Interim Emergency Board; Video Draw Poker-Local Government Aid; Governor’s Conferences and Interstate Compacts; State Aid to Local Government Entities; Non-Appropriated Requirements; Judicial Expense; Legislative Expense; and Special Acts.
Area Expenditures
Business & Infrastructure $ 866,889,867
Education 4,518,081,543
Environment & Natural Resources 29,885,103
General Government 874,859,080
Human Resources 1,893,208,976
Public Safety 828,283,080
TOTAL $ 9,011,207,649
fety
ca
Business & Infrastructure
(9.6%)
Human Resources (21%)
Education (50%)
General Government
(9.7%)
Public Safety (9.2%)
Environment & Natural Resources (0.3%)
tion

MISSION & VISION“Our Vision: to be a results-based, innovative, and focused organization capable of responding rapidly to the needs of our stakeholders.”“Our Mission: to fairly and efficiently collect state revenues to fund public services; and to regulate the sale of alcoholic beverages, tobacco, and charitable gaming in Louisiana.”
ORGANIZATIONAL CHARTTo achieve its mission and realize its vision, the Louisiana Department of Revenue (LDR) is comprised of three programs: Tax Collection, Alcohol and Tobacco Control, and Charitable Gaming. The agency is organized into seven major offices.

5
DEPARTMENT PROFILE
The Louisiana Department of Revenue (LDR) is organized into seven management groups:
• Office of the Secretary
• Office of Alcohol and Tobacco Control
• Office of Charitable Gaming
• Office of Legal Affairs
• Office of Management and Finance
• Office of Tax Administration, Group II
• Office of Tax Administration, Group III
LDR receives General Fund and Self-Generated revenues for the administration of three programs:
1. Tax Collection, which administers the State’s tax laws and encompasses tax policy management, revenue collection and distribution, taxpayer assistance, enforcement, compliance, and administrative support activities.
2. The Office of Alcohol and Tobacco Control (ATC), which monitors, regulates, and licenses the alcoholic beverage and tobacco industries, and retail and wholesale dealers.
3. The Office of Charitable Gaming (OCG), which monitors, regulates, and licenses the charitable gaming industry.
DIVISIONS AND OFFICES, LISTED ALPHABETICALLY:
Alcohol and Tobacco Control – The Office of Alcohol and Tobacco Control (ATC) licenses and regulates the alcoholic beverage and tobacco industries. ATC monitors wholesale dealers to ensure compliance with Fair Trade Act regulations and retail dealers to prevent access or sale of alcohol or tobacco by persons legally defined as ineligible. ATC consists of two divisions: Certification and Enforcement.
The Certification Division licenses alcoholic beverage manufacturers, wine products, retailers, wholesalers, and wholesale tobacco product dealers, notifies license-holders of renewal dates, and collects permit fees and administrative fines.
The Enforcement Division investigates applicants and vendors for compliance with regulations. Enforcement agents conduct inspections to discover violations of law, educate vendors in compliance, and to deter sales of alcohol and tobacco to underage citizens.
Charitable Gaming – The Office of Charitable Gaming (OCG) monitors and regulates non-profit organizations that raise funds through games of chance. OCG conducts training for these organizations in the conduct of games, and to ensure compliance with legal responsibilities and reporting requirements. OCG consists of two divisions: Licensing and Auditing.
The Licensing Division manages and issues seven types of licenses for Organizations, Commercial Lessors, Distributors, and Manufacturers.
The Auditing Division, through audits and inspections of games, investigates and ensures all net proceeds are devoted to educational, charitable, patriotic, religious, or public-spirited uses.
Customer Service – The Customer Service Division provides general tax assistance and information via correspondence, telephone, and in person, issues tax clearances and letters of good standing.
Collections – The Collection Division pursues collections of unpaid, past-due receivables and tax returns.
Criminal Investigations – The Criminal Investigations Division is LDR’s primary criminal tax enforcement unit, investigating violations of tax laws and recommending prosecution, and investigating violations and serious misconduct by agency employees.
Deputy Secretary – The Deputy Secretary supervises the Office of Charitable Gaming, Criminal Investigations Division, Policy Services Division, Public Affairs Division, and Tax Administration Division
Financial Services – The Financial Services Division is responsible for all fiscal matters; annual LDR budget requests, tax revenue accounting, and the administration of agency expenditures.

6
DEPARTMENT PROFILE
Field Audit – The Field Audit Division is responsible for the examination of taxpayer’s books and records to ensure compliance with state tax laws and the discovery and generation of tax revenues that would go unreported and uncollected otherwise. This division operates the tax audit program from LDR offices located inside and outside the state.
Human Resources – The Human Resources Division manages personnel and payroll services, placement counseling, classification of positions, Civil Service rules and employment law interpretation, compliance monitoring, and performance planning and review.
Information Technology – The Information Technology Division supports the use of computers and communication technology, and identifying, maintaining, and improving technologies for the capture and distribution of information.
Internal Audit – The Internal Audit Division is responsible for safeguarding department resources; ensuring secure and reliable data; promoting effective, efficient operations; and encouraging compliance with laws and regulations and management’s plans, policies, and procedures.
Legal Affairs – The Assistant Secretary provides legal guidance to the Secretary and supervises the Legal Division and Policy Services Division.
Legal Division – The Legal Division represents LDR in the courts and before the Board of Tax Appeals; litigates bankruptcy cases, civil service appeals, and employment discrimination cases; drafts and reviews contracts for professional services and leases; reviews lien releases; and participates in taxpayer conferences.
Management and Finance – The Undersecretary supervises the Financial Services Division, Human Resources Division, Information Technology Division, Internal Audit Division, and Support Services Division.
Office Audit – The Office Audit Division performs reviews of certain refund and rebate claims, and conducts examinations of various tax returns to identify and collect unreported taxes.
Policy Services – The Policy Services Division operates as a single source of contact for tax policy guidance, internally and externally. It drafts and issues tax policy statements, including Rules, Revenue Rulings, Private Letter Rulings, and Revenue Information Bulletins; drafts and monitors tax legislation, and prepares fiscal notes.
Public Affairs – The Public Affairs Division administers all internal and external communication programs, including media relations, constituent-group outreach, document development and printing, publications, and public relations.
Revenue Processing Center – The Revenue Processing Center registers new businesses for applicable taxes and processes paper tax returns, remittances, supporting documentation, and correspondence.
Secretary – The Secretary of Revenue leads LDR’s Executive Management Team, which consists of the Deputy Secretary, Undersecretary, and four Assistant Secretaries. The Secretary of Revenue is a member of the Governor’s cabinet.
Special Programs – The Special Programs Division processes certification, exemption, and permit applications.
Support Services – The Support Services Division manages several functions necessary to the operation of other divisions, including mail, forms management and distribution, and safety management.
Tax Administration – The Tax Administration Division coordinates the implementation of new and revised tax laws, and the development, modification and delivery of tax courses for internal and external training purposes.
Tax Administration, Group II – The Assistant Secretary supervises the Collection Division, Customer Service Division, Regional Offices, Revenue Processing Center, and Special Programs.
Tax Administration, Group III – The Assistant Secretary supervises the Field Audit and Office Audit Divisions.
The Louisiana Bio-Fuels Panel advises the Secretary of Revenue on emerging issues, technology, and effective tax regulation for alternative and augmentative fuels.
The Louisiana Tax Free Shopping Commission is a five-member board administering the sales tax refund program that applies to retail purchases made by international visitors to Louisiana.
The Uniform Electronic Local Return and Remittance Advisory Council advises the Secretary of Revenue on improving automatic and electronic tax filing and remittance of local taxes.

7
COMPLIANCE CONTINUUMoffice of the secretary
Louisiana’s tax collection system is based on the concept of voluntary compliance – the expectation that taxpayers will pay the right amount of tax in a timely manner. LDR is active in a wide range of services that directly or indirectly promote voluntary compliance, from public education that anticipates taxpayer needs to criminal prosecution to fairly enforce all tax laws. This illustration places the range of both LDR and taxpayer activities on a Compliance Continuum to depict these relationships:
The Compliance Continuum illustrates two important points. First, the cost of tax administration and compliance, for both LDR and taxpayers, generally increases as one moves from left to right. Criminal enforcement against a minority of taxpayers is critical but an inherently inefficient means of collecting taxes. Second, activities on the left side of the continuum directly impact a much larger number of taxpayers acting voluntarily, and hence are more efficient.
LDR seeks to move taxpayers “up” the Compliance Continuum to achieve greater voluntary compliance. This conceptual framework helps us determine our priorities and activities in accomplishing this task.
LDR
Draft & negotiate tax legislation
Publish forms, instructions, & guidance
Assist & educate taxpayers
Capture return data & process payments
Resolve exceptions
Issue bills & resolve protest
Collect Audit LitigateCriminal enforcement
TAX
PA
YE
R
Review instructions
Ask questions
File returns & make payments
Answer questions arising from exceptions
Review bills & file protests
Collection defense
Undergo audit
Litigation defense
Criminal enforcement defense
Tax Administration More Taxpayers – Less cost
Compliance Fewer Taxpayers – Higher Cost

8
REGIONAL OFFICEStaxpayer guidance
LDR implemented streamlined operations with the Regional Offices during the 2009-10 fiscal year. The Statewide regional offices offer taxpayer assistance to businesses by appointment only.
Appointments are available on Tuesdays and Thursdays from 8 AM to Noon and from 1 PM to 4 PM. Appointments can be scheduled by phone Monday through Friday.
Walk-in customer service for businesses and individual taxpayers will remain available five days a week at LDR headquarters in Baton Rouge.
Region Contact Information
Alexandria900 Murray Street, Room B-100Alexandria, LA 71301(318) 487-5333
Lafayette
825 Kaliste Saloom RoadBrandywine III, Suite 150Lafayette, LA 70508(337) 262-5455
Lake CharlesOne Lakeshore Drive, Suite 1550Lake Charles, LA 70629(337) 491-2504
Monroe122 St. John Street, Room 105Monroe, LA 71201(318) 362-3151
New Orleans1555 Poydras Street, Suite 2100New Orleans, LA 70112(504) 568-5233
Shreveport1525 Fairfield AvenueShreveport, LA 71101(318) 676-7505
New Orleans
Alexandria
Lake Charles
Shreveport

SUMMARY OF COLLECTIONS


11
TAX CASH COLLECTIONS
TAX CASH COLLECTIONS
FIVE-YEAR COMPARISON of MAJOR TAXES
Collections (In Millions) FY 06 FY 07 FY 08 FY 09 FY 10
Sales $ 2,731 $ 2,802 $ 2,883 $ 2,800 $ 2,465
Individual Income 2,453 3,116 3,242 3,005 2,240
Severance 719 898 1,047 928 774
Corporation Franchise 261 284 248 195 145
Corporation Income 505 721 747 586 435
Petroleum Products 607 623 592 602 593
Liquor/Alcohol 53 53 56 56 55
Tobacco 135 143 147 147 137
Other 68 171 172 162 118
FIVE-YEAR COMPARISON of MAJOR TAXES
2006 2007 2008 2009 2010
Sales •
Petroleum Products •Corporation Franchise •
Tobacco •
• Individual Income
•Severance Income
•Corporation Income
Other • •Liquor/Alcohol

TAX COLLECTIONS 2009-10 monthly cash collections
TAX COLLECTIONS 2009-10 monthly cash collectionsTax Jul 09 Aug 09 Sept 09 Oct 09 Nov 09 Dec 09
Corporation Franchise $ 6,997,518.02 $ 24,196.08 $ 26,903,033.42 $ 4,667,618.26 $ 63,423,340.13 $ 27,557,832.20 Gift Tax 8,192.82 (19,727.00) 12,646.00 55,593.17 89,883.36 2,752.68 Hazardous Waste Disposal Tax 967,441.86 (789.16) (3,618.99) 688,852.38 4,323.90 (52.03)Income Taxes
Corporation 20,992,555.80 72,588.24 80,709,100.27 14,002,854.79 190,270,020.37 82,673,496.60 Fiduciary 550,618.97 136,725.57 (499,334.71) 218,255.57 105,493.09 (79,761.70)Individual, Declaration, & Withholding 203,917,691.02 214,493,818.41 253,781,854.27 180,315,712.32 264,773,892.08 207,851,264.84
Inheritance & Estate Transfer Tax 58,286.54 479,354.91 39,439.48 95,120.25 65,433.64 45,928.65 Liquor – Alcoholic Beverage Taxes
High Alcoholic Content (Liquor/Wine) 1,895,121.75 1,385,720.26 1,336,926.96 1,443,293.82 1,779,243.05 1,665,377.59 Low Alcoholic Content (Beer) 3,277,710.36 3,278,215.55 2,999,676.60 3,082,691.39 3,086,237.92 2,690,232.64 Out-of-State Shippers 43,662.83 14,063.25 5,744.73 6,273.74 (2,062.42) 3,634.89
Natural Resources – Severance Tax 64,196,896.85 65,283,043.08 66,225,370.25 67,513,849.10 60,257,143.93 58,767,312.20 Petroleum Products
Gasoline & Inspection Fees 38,961,886.99 37,994,157.80 38,082,717.11 36,307,540.57 37,944,473.06 35,650,456.86 Motor Vehicle Sales/Leases 263,291.69 537,258.47 477,738.33 427,431.26 437,175.67 418,700.34 Special Fuels & Inspection Fees 11,485,746.93 12,020,105.76 11,267,286.00 11,192,050.77 11,656,030.53 10,521,677.47
Public Utilities and CarriersInspection and Supervision Fee 549,059.02 205,203.71 1,184,933.72 356,557.13 441,526.73 1,138,347.00 Natural Gas Franchise Tax 592,150.00 (402,131.71) 0.00 315,710.29 57,332.50 0.00 Transportation & Communication Utilities Tax 445,217.84 1,602,199.05 246,620.91 6,216,520.17 353,171.14 239,099.99
Sales Tax 252,685,032.98 193,042,568.96 186,775,837.24 210,783,919.68 216,084,411.49 186,890,653.07 Tobacco Tax 12,929,027.41 10,035,048.86 12,049,900.51 11,378,435.68 11,077,883.47 13,087,763.75 Total State Taxes 620,817,109.68 540,181,620.09 681,595,872.10 549,068,280.34 861,904,953.64 629,124,717.04 Other Taxes 1,598,787.03 1,708,731.80 1,023,770.82 879,601.78 1,714,035.17 1,377,986.75 Hotel/Motel Room Occupancy Tax
LA Stadium and Exposition District 2,343,203.43 2,543,372.22 2,280,551.43 1,438,501.79 1,350,292.44 2,842,535.86 New Orleans Exhibition Hall Authority 1,462,450.46 1,618,478.53 1,420,602.23 857,463.14 838,404.58 1,913,376.09
New Orleans Exhibition Hall Authority TaxesFlat Room Occupancy Tax & Food & Beverage Taxes 1,067,602.03 1,015,644.71 898,339.26 747,718.32 741,511.10 1,006,101.81 Service Contractor Tax 64,138.69 140,220.52 145,298.80 99,659.74 24,719.49 72,603.53 Tour Tax 1,474.40 5,457.22 4,318.44 1,329.87 5,697.78 6,105.18
TOTAL CASH COLLECTIONS $ 627,354,765.72 $ 547,213,525.09 $ 687,368,753.08 $ 553,092,554.98 $ 866,579,614.20 $ 636,343,426.26
Tax Jan 10 Feb 10 March 10 April 10 May 10 June 10Corporation Franchise $ 7,883,724.41 $ (717,766.57) $ (11,662,890.23) $ 26,295,186.63 $ (15,204,961.79) $ 8,954,475.81 Gift Tax (1,034.00) 1,826.00 (623.00) 82,055.00 (806.00) (19,071.24)Hazardous Waste Disposal Tax 617,264.13 38,571.40 (13,995.15) 776,946.20 12,034.66 2,490.48 Income Taxes
Corporation 23,651,188.94 (2,153,299.71) (34,991,382.28) 78,885,559.88 (45,614,885.36) 26,863,427.41 Fiduciary 375,197.00 (631,312.84) 67,962.84 1,217,320.05 5,008,748.96 3,081,310.79 Individual, Declaration, & Withholding 279,125,643.05 (20,190,486.43) 69,491,095.70 75,233,939.83 210,354,760.16 301,116,153.36
Inheritance & Estate Transfer Tax (6,934.62) 438,195.64 232,913.34 (3,092.36) 17,484.17 143,870.41 Liquor – Alcoholic Beverage Taxes
High Alcoholic Content (Liquor/Wine) 2,479,961.78 1,239,938.27 1,586,500.70 1,627,414.23 1,601,909.82 1,537,052.55 Low Alcoholic Content (Beer) 3,097,352.82 2,313,742.84 2,639,230.34 2,906,945.88 3,237,970.80 3,017,058.84 Out-of-State Shippers 2,915.56 729.59 2,132.47 11,352.17 25,564.93 35,279.42
Natural Resources – Severance Tax 57,555,397.31 66,048,886.32 61,929,387.80 58,060,127.12 68,000,680.59 79,757,307.43 Petroleum Products
Gasoline & Inspection Fees 41,516,808.98 36,035,918.09 35,234,577.89 39,672,368.10 38,258,898.19 38,229,499.24 Motor Vehicle Sales/Leases 433,185.62 943,426.45 575,394.16 606,123.47 556,445.71 540,601.54 Special Fuels & Inspection Fees 12,976,296.57 11,171,307.35 10,823,725.53 12,074,522.19 11,604,381.43 12,149,421.00
Public Utilities and CarriersInspection and Supervision Fee 289,329.47 105,930.89 860,902.57 337,534.97 201,992.58 1,610,262.05 Natural Gas Franchise Tax 682,883.09 (45,560.48) 18,000.00 672,117.00 5,105.03 33,513.35 Transportation & Communication Utilities Tax 407,658.65 319,635.64 223,500.83 321,370.39 579,220.15 300,993.15
Sales Tax 221,597,094.23 156,709,328.68 186,516,588.03 204,978,788.02 218,404,234.94 230,674,025.69 Tobacco Tax 9,710,655.86 10,079,235.78 10,017,824.08 13,597,269.74 10,882,537.31 12,167,116.11 Total State Taxes 662,394,588.85 261,708,246.91 333,550,845.62 517,353,848.51 507,931,316.28 720,194,787.39 Other Taxes 713,873.03 1,442,892.01 1,148,325.22 1,064,139.67 1,617,193.22 1,463,750.56 Hotel/Motel Room Occupancy Tax
LA Stadium and Exposition District 2,209,992.42 2,369,215.37 1,874,822.45 3,207,856.96 3,078,573.27 3,377,657.04 New Orleans Exhibition Hall Authority 1,463,772.23 1,539,134.85 1,179,969.96 2,095,135.17 2,032,360.16 2,232,804.35
New Orleans Exhibition Hall Authority TaxesFlat Room Occupancy Tax & Food & Beverage Taxes 921,420.58 917,705.35 874,765.90 1,078,170.84 1,141,555.67 1,130,013.34 Service Contractor Tax 170,421.76 133,452.60 64,314.88 85,392.72 60,097.32 138,200.73 Tour Tax 4,787.92 10,750.51 4,283.52 9,107.33 11,916.45 5,121.34
TOTAL CASH COLLECTIONS $ 667,878,856.79 $ 268,121,397.60 $ 338,697,327.55 $ 524,893,651.20 $ 515,873,012.37 $ 728,542,334.75

13
TAX COLLECTIONS cash collection after accrual adjustments
FOR FISCAL YEAR ENDING JUNE 30, 2010
State Revenues Cash Collections Less 2008-09 Accruals Plus 2009-10 Accruals Total Net Collections
Automobile Rental Tax $ 4,856,349.32 $ 652,437.59 $ 468,942.26 $ 4,672,853.99 Contractor’s Fee 9,750.00 1,560.00 0.00 8,190.00 Corporation Franchise Tax 145,121,306.37 6,997,518.02 0.00 138,123,788.35 Electrical Co-op Fee 28,549.40 23,668.40 43,342.67 48,223.67 Gift Tax 211,687.79 8,192.82 911.78 204,406.75 Hazardous Waste Disposal Tax 3,089,469.68 968,600.53 680,258.64 2,801,127.79 Income Taxes
Corporation 435,361,224.95 (4,570,128.15) (46,894,926.62) 393,036,426.48 Fiduciary 9,551,223.59 550,618.97 899,535.94 9,900,140.56 Individual, Declaration, & Withholding 2,240,265,338.61 113,542,276.50 159,859,840.33 2,286,582,902.44
Inheritance Tax 1,606,000.05 58,286.54 2,519.04 1,550,232.55 Liquors – Alcoholic Beverage Taxes
High Alcoholic Content (Liquor/Wine) 19,578,460.78 1,896,627.46 1,862,411.40 19,544,244.72 Low Alcoholic Content (Beer) 35,627,065.98 3,277,710.36 3,437,213.70 35,786,569.32 Out-of-State Shippers 149,291.16 527.11 20,032.59 168,796.64
Marijuana & Controlled Dangerous Substance Tax 26,187.00 25.00 25.00 26,187.00 Minerals, Oil, and Gas
Pipeline Safety Inspection Fee 2,117.81 0.00 0.00 2,117.81 Surface Mining & Reclamation Fee 284,605.36 0.00 0.00 284,605.36 Oil Spill Contingency Fee 356.97 0.00 0.00 356.97 Oilfield Site Restoration – Gas 3,062,144.65 55,924.31 41,909.96 3,048,130.30 Oilfield Site Restoration – Oil 840,039.03 19,310.32 18,034.54 838,763.25
Natural Resources – Severance Tax 773,595,401.98 59,900,456.16 66,947,224.10 780,642,169.92 Petroleum Products
Gasoline Tax 450,459,537.84 38,337,945.14 38,481,385.07 450,602,977.77 Gasoline Inspection Fee 3,429,765.04 623,941.85 269,349.74 3,075,172.93 Special Fuels Tax 136,917,886.86 11,148,403.62 11,622,917.96 137,392,401.20 Special Fuels Inspection Fee 2,024,664.67 337,343.31 173,748.33 1,861,069.69 Motor Vehicle Sales-Leases 6,216,772.71 263,291.69 559,341.11 6,512,822.13
Public UtilitiesInspection and Supervision Fee 7,281,579.84 549,059.02 729,614.78 7,462,135.60 Natural Gas Franchise Tax 1,929,119.07 592,150.00 29,050.34 1,366,019.41 Transportation and Communication Utilities Tax 11,255,207.91 633,505.24 289,157.70 10,910,860.37
Sales Tax 2,445,935,154.37 249,817,122.26 238,773,649.50 2,434,891,681.61 Soft Drink Tax 0.00 0.00 0.00 0.00 Telecommunication Tax 1,061,341.10 212,988.55 2,913.11 851,265.66 Tobacco 137,012,698.56 13,096,936.41 12,599,666.02 136,515,428.17 SUBTOTALS – STATE REVENUES $ 6,876,790,298.45 $ 498,996,299.03 $ 490,918,068.99 $ 6,868,712,068.41 Other Taxes
Beer Taxes – Parish and Municipalities 5,480,135.20 0.00 482,051.04 5,962,186.24 Louisiana Tourism and Promotion District 19,207,328.64 2,032,295.76 1,847,408.25 19,022,441.13 Hotel/Motel Room Occupancy Tax
Louisiana Stadium and Exposition District 28,916,574.71 0.00 0.00 28,916,574.71 New Orleans Exhibition Hall Authority 18,653,951.76 0.00 0.00 18,653,951.76
New Orleans Exhibition Hall Authority TaxesFlat Room Occupancy Tax & Food & Beverage Taxes 11,540,548.91 0.00 0.00 11,540,548.91 Service Contractor Tax 1,198,520.79 0.00 0.00 1,198,520.79 Tour Tax 70,349.96 0.00 0.00 70,349.96
Consumer Use Tax – Local 70,162.13 3,702.16 788.27 67,248.24 Consumer Use Tax – Excise 6,369.79 252.03 401.75 6,519.51 Catalog Sales Tax – Local 24,979.30 3,952.00 2,654.80 23,682.10
SUBTOTAL – OTHER TAXES $ 85,168,921.18 $ 2,040,201.95 $ 2,333,304.11 $ 85,462,023.34 GRAND TOTALS $ 6,961,959,219.63 $ 501,036,500.98 $ 493,251,373.10 $ 6,954,174,091.75

14
TAX COLLECTIONS cash collections
TAX COLLECTIONS cash collections
FIVE-YEAR COMPARISON of TOTAL COLLECTIONS
Tax Collections FY 2005-06 FY 2006-07 FY 2007-08 FY 2008-09 FY 2009-10
Major State Taxes
Corporation
Franchise Tax $ 261,166,429.03 $ 284,390,805.05 $ 247,694,096.49 $ 195,562,939.51 $ 145,121,306.37
Income Tax 504,849,971.90 721,271,385.80 746,705,214.23 586,089,718.39 435,361,224.95
Individual, Declaration, & Withholding Tax 2,453,612,365.09 3,116,247,671.60 3,241,862,324.48 3,005,461,862.12 2,240,265,338.61
Natural Resources – Severance Tax 719,258,708.42 898,347,095.13 1,046,649,450.01 928,025,836.25 773,595,401.98
Petroleum Products
Gasoline Tax 459,700,612.37 471,989,220.25 448,207,376.97 455,444,136.75 450,459,537.84
Inspection Fees (Gas/Special Fuels) 3,044,406.26 4,835,095.91 5,648,843.49 5,425,321.90 5,454,429.71
Special Fuels Tax 142,740,534.05 146,064,408.17 137,857,051.85 137,881,277.34 136,917,886.86
Sales Tax 2,731,163,312.28 2,801,969,579.08 2,883,313,850.95 2,800,069,473.01 2,465,142,483.01
Miscellaneous State Taxes and Fees* 243,729,107.00 288,974,213.19 287,065,099.46 281,573,307.62 243,680,017.76
Other Taxes* 67,943,874.79 77,194,312.61 89,491,603.92 85,962,312.98 65,961,592.54
TOTAL $ 7,587,209,321.19 $ 8,811,283,786.79 $ 9,134,494,911.85 $ 8,481,496,185.87 $ 6,961,959,219.63
* Miscellaneous State Taxes include: Automobile Rental Tax, Contractor’s Fee, Electric Co-op, Gift Tax, Hazardous Waste Tax, Inheritance Tax, Beverage Tax, Marijuana Tax, Minerals Tax, Oil and Gas Tax, Occupational License Tax, Public Utilities Tax, Soft Drink Tax, Telecommunication Tax, and Tobacco Tax.
* Other Taxes include: Parish and Municipalities Beer Tax, Louisiana Tourism and Promotion Tax, Hotel/Motel Room Occupancy Tax, NOEH Authority Tax, Consumer Use Tax, Consumer Use Excise Tax, and Local Catalog Sales Tax.
FIVE-YEAR COMPARISON of TOTAL COLLECTIONS
09 10
08 09
07 08
06 07
05 06
$7,587,209,321.35
$8,811,283,786.79
$9,134,494,911.85
$8,481,496,185.87
$6,961,959,219.63

15
TAX COLLECTIONS cash collection after accrual adjustments
TWO-YEAR COMPARISON
State Revenues Total Net Collections FY 2008-09 Total Net Collections FY 2009-10 % Change
Automobile Rental Tax $ 5,217,140.43 $ 4,672,853.99 -10.43%Contractor’s Fee 15,991.11 8,190.00 -48.78%Corporation Franchise Tax 212,702,576.92 138,123,788.35 -35.06%Electrical Co-op Fee 38,791.40 48,223.67 24.32%Gift Tax 1,845,496.42 204,406.75 -88.92%Hazardous Waste Disposal Tax 3,595,586.46 2,801,127.79 -22.10%Income Taxes
Corporation 612,545,033.40 393,036,426.48 -35.84%Fiduciary 25,441,530.47 9,900,140.56 -61.09%Individual, Declaration, & Withholding 2,940,538,753.06 2,286,582,902.44 -22.24%
Inheritance Tax 3,223,113.71 1,550,232.55 -51.90%Liquors – Alcoholic Beverage Taxes
High Alcoholic Content (Liquor/Wine) 19,572,423.70 19,544,244.72 -0.14%Low Alcoholic Content (Beer) 37,308,853.56 35,786,569.32 -4.08%Out-of-State Shippers 35,411.97 168,796.64 376.67%
Marijuana & Controlled Dangerous Substance Tax 12,657.88 26,187.00 106.88%Minerals, Oil, And Gas
Pipeline Safety Inspection Fee 0.00 2,117.81 0.00%Surface Mining & Reclamation Fee 303,856.32 284,605.36 -6.34%Oil Spill Contingency Fee 99,894.80 356.97 -99.64%Oilfield Site Restoration – Gas 3,174,424.18 3,048,130.30 -3.98%Oilfield Site Restoration – Oil 867,100.04 838,763.25 -3.27%
Natural Resources – Severance Tax 870,343,454.20 780,642,169.92 -10.31%Petroleum Products
Gasoline Tax 453,928,738.76 450,602,977.77 -0.73%Gasoline Inspection Fee 3,401,672.02 3,075,172.93 -9.60%Special Fuels Tax 136,604,725.23 137,392,401.20 0.58%Special Fuels Inspection Fee 2,080,381.94 1,861,069.69 -10.54%Motor Vehicle Sales-Leases 3,346,929.47 6,512,822.13 94.59%
Public UtilitiesInspection and Supervision Fee 8,829,340.93 7,462,135.60 -15.48%Natural Gas Franchise Tax 3,957,843.75 1,366,019.41 -65.49%Transportation & Communication Utilities Tax 16,097,938.87 10,910,860.37 -32.22%
Sales Tax 2,781,539,530.62 2,434,891,681.61 -12.46%Soft Drink Tax 119,700.00 0.00 -100.00%Telecommunication Tax 1,248,800.53 851,265.66 -31.83%Tobacco 147,120,920.00 136,515,428.17 -7.21%Tobacco Permit 48,437.64 0.00 -100.00%SUBTOTALS – STATE REVENUES $ 8,295,207,049.79 $ 6,868,712,068.41 -17.20%Other Taxes
Beer Taxes – Parish and Municipalities 6,803,811.66 5,962,186.24 -12.37%Louisiana Tourism and Promotion District 22,374,792.61 19,022,441.13 -14.98%Hotel/Motel Room Occupancy Tax
Louisiana Stadium and Exposition District 27,582,294.68 28,916,574.71 4.84%New Orleans Exhibition Hall Authority 17,070,396.02 18,653,951.76 9.28%
New Orleans Exhibition Hall Authority TaxesFlat Room Occupancy Tax & Food & Beverage Taxes 10,558,980.78 11,540,548.91 9.30%Service Contractor Tax 1,251,545.73 1,198,520.79 -4.24%Tour Tax 62,526.20 70,349.96 12.51%
Consumer Use Tax – Local 48,472.56 67,248.24 38.73%Consumer Use Tax – Excise 3,968.35 6,519.51 64.29%Catalog Sales Tax – Local 117,147.00 23,682.10 -79.78%
SUBTOTAL – OTHER TAXES $ 85,873,935.59 $ 85,462,023.34 -0.48%GRAND TOTALS $ 8,381,080,985.38 $ 6,954,174,091.75 -17.03%

16
15-YEAR CASH tax collection record (in millions)
15-YEAR CASH tax collection record (in millions)Tax FY 96 FY 97 FY 98 FY 99 FY 00 FY 01 FY 02
Corporation Franchise $ 231.28 $ 244.30 $ 255.69 $ 296.04 $ 269.73 $ 247.67 $ 262.08 Gift Tax 3.49 3.86 5.25 9.23 5.11 4.68 4.32 Hazardous Waste Disposal Tax 5.18 5.20 4.45 4.23 3.92 4.58 4.32 Income Taxes
Corporation 320.10 389.47 364.60 286.94 222.57 284.81 270.03 Fiduciary 4.78 13.62 8.09 13.24 12.53 13.20 9.35 Individual, Declaration, & Withholding 1,151.07 1,263.77 1,443.14 1,516.81 1,584.20 1,724.88 1,774.20
Inheritance & Estate Transfer Tax 55.18 70.86 85.23 86.68 91.29 81.10 65.19 Liquor – Alcoholic Beverage Taxes
High Alcoholic Content (Liquor/Wine) 16.03 15.74 16.01 13.86 16.10 16.18 16.13 Low Alcoholic Content (Beer) 36.99 34.70 36.04 36.45 38.11 37.10 35.13 Out-of-State Shippers 0.00 0.00 0.00 0.01 0.02 0.02 0.02
Natural Resources – Severance Tax 351.66 418.19 355.91 261.92 376.67 463.90 493.21 Petroleum Products
Gasoline & Inspection Fees 427.98 382.81 421.98 423.31 432.33 425.22 435.97 Special Fuels & Inspection Fees 96.52 97.34 106.68 109.14 115.45 114.77 116.12
Public Utilities and CarriersInspection and Supervision Fee 3.91 4.12 4.18 4.14 4.79 5.13 5.19 Natural Gas Franchise Tax 7.54 7.17 7.88 7.32 9.93 6.75 5.31 Transportation & Communication Utilities Tax 5.79 3.00 3.78 5.68 3.01 2.44 2.85
Sales Tax 1,445.67 1,810.86 2,021.28 2,040.67 2,099.41 2,372.16 2,418.17 Tobacco Tax 87.99 87.97 86.80 85.57 90.30 91.94 113.99 Total State Taxes 4,251.16 4,852.98 5,226.99 5,201.24 5,375.47 5,896.53 6,031.58 Other Taxes 537.71 216.38 41.85 52.05 41.47 34.55 37.35 Hotel/Motel Room Occupancy Tax
LA Stadium and Exposition District 22.30 25.62 25.65 28.23 30.24 34.10 32.73 New Orleans Exhibition Hall Authority 9.63 11.24 11.10 12.31 13.32 14.95 14.51
New Orleans Exhibition Hall Authority TaxesFlat Room Occupancy Tax & Food & Beverage Taxes 7.84 8.29 8.30 8.83 8.73 10.23 10.19 Service Contractor Tax 0.72 1.20 1.34 1.44 1.70 1.88 1.61 Tour Tax 0.05 0.19 0.19 0.18 0.16 0.19 0.17
TOTAL CASH COLLECTIONS $ 4,829.41 $ 5,115.90 $ 5,315.42 $ 5,304.28 $ 5,471.09 $ 5,992.43 $ 6,128.14
Tax FY 03 FY 04 FY 05 FY 06 FY 07 FY 08 FY 09 FY 10Corporation Franchise $ 187.45 $ 182.77 $ 289.94 $ 261.17 $ 284.39 $ 247.69 $ 195.56 $ 145.10 Gift Tax 5.45 3.86 3.52 2.26 5.60 3.48 1.97 0.21 Hazardous Waste Disposal Tax 4.40 4.86 5.17 5.17 4.96 4.30 3.55 3.09 Income Taxes
Corporation 198.13 232.62 374.58 504.85 721.27 746.71 586.10 435.30 Fiduciary 4.81 4.44 13.08 10.55 42.72 32.26 25.47 9.50 Individual, Declaration, & Withholding 1,865.60 2,191.54 2,380.28 2,453.61 3,116.25 3,241.86 3,005.46 2,240.20
Inheritance & Estate Transfer Tax 53.23 43.95 27.88 10.87 5.07 7.89 3.28 1.60 Liquor – Alcoholic Beverage Taxes
High Alcoholic Content (Liquor/Wine) 16.09 16.85 17.08 16.80 16.99 19.35 19.39 19.50 Low Alcoholic Content (Beer) 36.42 36.10 36.57 36.42 36.48 36.36 37.30 35.60 Out-of-State Shippers 0.02 0.03 0.04 0.04 0.03 0.07 0.07 0.15
Natural Resources – Severance Tax 437.71 514.49 664.56 719.26 898.35 1,046.65 928.02 773.59 Petroleum Products
Gasoline & Inspection Fees 448.70 440.28 450.74 462.75 475.03 451.53 458.77 453.8Special Fuels & Inspection Fees 116.49 123.06 132.15 144.23 147.84 140.18 139.97 138.9
Public Utilities and CarriersInspection and Supervision Fee 5.09 5.58 0.00 5.38 5.80 8.42 8.86 7.20 Natural Gas Franchise Tax 14.77 3.31 7.99 4.04 12.50 5.40 4.72 1.90 Transportation & Communication Utilities Tax (0.87) 8.58 3.09 3.60 3.93 4.24 16.32 11.20
Sales Tax 2,284.06 2,166.22 2,305.30 2,731.16 2,801.97 2,883.31 2,800.07 2,465.10 Tobacco Tax 125.43 144.57 153.59 134.81 143.00 147.37 146.53 137.00 Total State Taxes 5,802.98 6,123.11 6,865.56 7,506.97 8,722.18 9,026.85 8,381.41 6,878.94 Other Taxes 40.15 28.86 34.04 36.30 40.48 46.90 43.57 22.76Hotel/Motel Room Occupancy Tax
LA Stadium and Exposition District 30.58 30.74 35.48 22.97 24.74 29.49 27.58 28.90 New Orleans Exhibition Hall Authority 19.34 20.23 24.27 13.17 14.97 18.77 17.07 18.60
New Orleans Exhibition Hall Authority TaxesFlat Room Occupancy Tax & Food & Beverage Taxes 11.86 12.73 13.70 7.18 8.39 10.76 10.55 11.54 Service Contractor Tax 1.43 1.36 1.90 0.58 0.49 1.08 1.25 1.19 Tour Tax 0.14 0.13 0.12 0.04 0.03 0.65 0.06 0.07
TOTAL CASH COLLECTIONS $ 5,906.48 $ 6,217.16 $ 6,975.07 $ 7,587.21 $ 8,811.28 $ 9,134.50 $ 8,481.49 $ 6,962.00

17
SUMMARY of tax collections & refunds (by tax/fee type)
FOR FISCAL YEAR ENDING JUNE 30, 2010
Tax/Fee Type Calculated Collections Before Refunds Amount Refunded Calculated
Collections*
Automobile Rental Tax $ 4,868,747.61 $ (12,398.29) $ 4,856,349.32
Contractors Fee, Nonresident 9,750.00 9,750.00
Corporation Franchise Tax 145,121,306.37 145,121,306.37
Electric Co-op Fee 28,549.40 28,549.40
Gift Tax 421,778.21 (210,090.42) 211,687.79
Hazardous Waste Site Cleanup Fund 3,126,020.65 (36,550.97) 3,089,469.68
Income Taxes
Corporation Income Tax 1,148,010,027.09 (712,648,802.14) 435,361,224.95
Declaration Individual 319,842,744.14 (3,547,801.57) 316,294,942.57
Fiduciary 15,000,338.95 (5,449,115.36) 9,551,223.59
Individual 351,521,480.03 (1,877.04) 351,519,602.99
Withholding, Individual 2,476,814,786.97 (904,363,993.92) 1,572,450,793.05
Inheritance Tax 1,815,423.21 (209,423.16) 1,606,000.05
Liquors – Alcoholic Beverages
High Alcoholic Content (Liquor/Wine) 19,580,363.42 (1,902.64) 19,578,460.78
Low Alcoholic Content (Beer) 35,653,628.82 (26,562.84) 35,627,065.98
Out-of-State Shippers 150,247.42 (956.26) 149,291.16
Parish & Municipal Beer Tax 5,480,135.20 5,480,135.20
Marijuana & Controlled Dangerous Substance 26,187.00 26,187.00
Minerals, Oil, and Gas
Oil Spill Contingency Fee – –
Oilfield Site Restoration – Gas 3,142,121.98 (79,977.33) 3,062,144.65
Oilfield Site Restoration – Oil 883,762.01 (43,722.98) 840,039.03
Pipeline Safety Inspection Fee 2,117.81 2,117.81
Surface Mining Reclamation 284,605.36 284,605.36
Natural Resources – Severance Tax 847,388,075.86 (73,792,673.88) 773,595,401.98
Petroleum Products
Gasoline & Inspection Fees 454,103,483.37 (214,180.49) 453,889,302.88
Special Fuels & Inspection Fees 142,783,768.17 (3,841,216.64) 138,942,551.53
Motor Fuels 10,591,680.30 (10,591,680.30) –
Motor Vehicle Sales-Leases 6,216,772.71 – 6,216,772.71
Public Utilities – Carriers
Inspection & Supervision Fees 7,572,835.10 (291,255.26) 7,281,579.84
Natural Gas Franchise Tax 2,849,402.67 (920,283.60) 1,929,119.07
Transportation & Communication 11,829,243.89 (574,035.98) 11,255,207.91
Catalog Sales 24,979.30 24,979.30
Consumer Use Tax 70,162.13 70,162.13
Sales Tax 2,604,054,973.99 (138,912,490.98) 2,465,142,483.01
Soft Drinks – –
Telecommunication Tax 1,061,341.10 1,061,341.10
Consumer Use – Excise 6,369.79 6,369.79
Tobacco 137,288,088.91 (275,390.35) 137,012,698.56
TOTALS $ 8,757,625,655.91 $ (1,856,046,382.40) $ 6,901,579,273.51
* This amount does not include adjustments for returned checks.

18
COMPARISON OF ALL STATES’ taxes (by source)
FOR FISCAL YEAR 2009 – Percent of tax collected
Sales & Use Individual Income Corporate Income Motor Fuels Licenses All Other
Alabama 24.9% 32.1% 5.9% 6.6% 5.8% 24.7%Alaska 0.0% 0.0% 12.8% 0.2% 2.7% 84.3%Arizona 50.4% 17.4% 5.3% 7.2% 3.6% 16.0%Arkansas 37.0% 30.0% 4.6% 6.2% 4.4% 17.8%California 28.7% 43.9% 9.4% 3.1% 8.3% 6.5%Colorado 24.5% 50.7% 3.8% 7.1% 4.2% 9.7%Connecticut 25.4% 49.3% 3.4% 3.8% 2.8% 15.2%Delaware 0.0% 32.5% 7.4% 4.1% 41.2% 14.9%Florida 60.2% 0.0% 5.7% 7.0% 5.7% 21.4%Georgia 33.0% 48.5% 4.3% 5.4% 3.0% 5.8%Hawaii 52.2% 28.4% 1.7% 1.9% 3.1% 12.6%Idaho 38.0% 37.1% 4.5% 6.9% 8.5% 5.1%Illinois 25.5% 31.4% 9.4% 5.0% 8.4% 20.3%Indiana 41.6% 29.0% 5.6% 5.4% 4.7% 13.7%Iowa 31.5% 38.7% 3.8% 6.2% 9.4% 10.4%Kansas 33.3% 40.8% 5.5% 6.3% 4.5% 9.6%Kentucky 29.3% 34.0% 4.0% 6.5% 4.9% 21.4%LOUISIANA 29.6% 29.4% 6.1% 6.0% 4.6% 24.3%Maine 29.0% 39.3% 4.1% 6.3% 7.0% 14.3%Maryland 25.5% 42.8% 5.0% 4.9% 4.6% 17.3%Massachusetts 19.9% 54.4% 9.2% 3.4% 3.9% 9.3%Michigan 40.2% 25.6% 2.8% 4.2% 5.7% 21.6%Minnesota 25.5% 40.5% 4.5% 4.4% 6.0% 19.2%Mississippi 46.5% 22.8% 5.0% 6.5% 6.2% 13.1%Missouri 29.3% 46.1% 2.7% 6.8% 6.2% 13.1%Montana 0.0% 34.4% 6.8% 7.9% 12.4% 38.5%Nebraska 37.6% 40.0% 5.0% 7.3% 4.2% 5.9%Nevada 48.2% 0.0% 0.0% 5.4% 9.4% 37.0%New Hampshire 0.0% 4.6% 23.2% 6.2% 10.7% 55.2%New Jersey 30.1% 39.2% 8.8% 2.0% 5.2% 14.7%New Mexico 38.9% 19.2% 4.2% 3.9% 4.4% 29.4%New York 17.0% 56.7% 6.8% 0.8% 2.4% 16.4%North Carolina 24.2% 46.6% 4.4% 7.4% 7.1% 10.3%North Dakota 25.2% 15.3% 5.4% 6.0% 5.9% 42.3%Ohio 30.6% 34.7% 2.2% 7.2% 12.0% 13.2%Oklahoma 26.5% 31.2% 4.2% 5.1% 12.2% 20.8%Oregon 0.0% 73.2% 3.5% 5.4% 11.4% 6.5%Pennsylvania 28.3% 31.8% 5.8% 6.7% 8.3% 19.1%Rhode Island 31.5% 37.2% 4.2% 4.7% 3.7% 18.7%South Carolina 40.7% 32.9% 3.1% 7.2% 6.3% 9.8%South Dakota 56.7% 0.0% 3.7% 8.8% 14.4% 16.4%Tennessee 60.9% 2.1% 7.8% 7.8% 10.9% 10.5%Texas 51.6% 0.0% 0.0% 7.4% 16.9% 24.1%Utah 32.2% 42.8% 4.5% 6.5% 6.6% 7.5%Vermont 12.8% 21.3% 3.5% 3.4% 3.9% 55.2%Virginia 20.8% 55.1% 3.9% 5.5% 4.1% 10.6%Washington 61.2% 0.0% 0.0% 7.2% 5.7% 26.0%West Virginia 23.2% 32.5% 8.8% 8.0% 4.0% 23.5%Wisconsin 28.2% 42.9% 4.3% 6.8% 5.7% 12.0%Wyoming 35.8% 0.0% 0.0% 2.4% 5.5% 56.2%ALL STATES 31.9% 34.4% 5.6% 4.9% 6.9% 16.2%
Source: U.S. Department of Commerce, Bureau of the Census, 2009 State Government Tax Collections

19
ALL STATES’ TOTAL tax collections (per capita)
FOR FISCAL YEAR 2009
Rank State Per Capita Total State Tax Collection
1 Alaska $ 7,0922 Wyoming 5,0783 Vermont 4,0304 North Dakota 3,7325 Connecticut 3,6746 Hawaii 3,6397 New York 3,3288 Minnesota 3,2599 Delaware 3,17010 New Jersey 3,12211 Massachusetts 2,95512 California 2,73313 Maryland 2,65414 Maine 2,64715 West Virginia 2,63216 Arkansas 2,58417 Wisconsin 2,56318 Montana 2,46919 Washington 2,46220 Rhode Island 2,45621 New Mexico 2,41422 Pennsylvania 2,38623 Kansas 2,37524 Michigan 2,36325 Iowa 2,32226 Indiana 2,32027 Illinois 2,26728 Kentucky 2,26129 LOUISIANA 2,22930 Nebraska 2,22731 Oklahoma 2,21332 Mississippi 2,20733 North Carolina 2,18534 Nevada 2,10535 Ohio 2,07536 Virginia 2,05537 Idaho 2,05238 Utah 1,94739 Oregon 1,93940 Alabama 1,76441 Colorado 1,72842 Missouri 1,72843 Florida 1,72444 Arizona 1,70645 Tennessee 1,65946 Texas 1,64647 South Dakota 1,64248 Georgia 1,63649 New Hampshire 1,60550 South Carolina 1,567– US AVERAGE $ 2,334
Source: U.S. Department of Commerce, Census Bureau

20
TOTAL STATE taxes except severance tax (per capita)
FOR FISCAL YEAR 2009
Rank State Per Capita Total State Tax Collection
1 Vermont $ 4,0302 Connecticut 3,6743 Hawaii 3,6394 New York 3,3285 Minnesota 3,2506 Delaware 3,1707 New Jersey 3,1228 Massachusetts 2,9559 Wyoming 2,87710 California 2,73211 Maryland 2,65412 Maine 2,64713 Arkansas 2,57314 Wisconsin 2,56215 Washington 2,45816 Rhode Island 2,45617 North Dakota 2,45318 West Virginia 2,42519 Pennsylvania 2,38620 Michigan 2,35721 Kansas 2,32422 Iowa 2,32223 Indiana 2,32024 Illinois 2,26725 Nebraska 2,22426 North Carolina 2,18527 Kentucky 2,17928 Mississippi 2,16829 Montana 2,11030 Ohio 2,07431 Virginia 2,05532 Nevada 2,05033 Idaho 2,04934 LOUISIANA 2,02735 New Mexico 1,95036 Oregon 1,93637 Oklahoma 1,92438 Utah 1,91139 Alabama 1,74040 Missouri 1,72841 Florida 1,71942 Arizona 1,70343 Colorado 1,67144 Tennessee 1,65845 Georgia 1,63646 South Dakota 1,63247 Alaska 1,60948 New Hampshire 1,60549 South Carolina 1,56750 Texas 1,551 – US AVERAGE $ 2,286
Source: U.S. Department of Commerce, Census Bureau

21
PARISH comparison of various & per capita tax collections
Parish
Population Estimates
Gross Sales Tax Due
Sales Tax (Per Cap)
Distribution of Local
Property Taxes for year 2009*
Property Taxes (Per Cap)
LA Adjusted Individual Income Tax
LA Adj. Inc. Tax (Per Cap)
July 1, 2009 FYE 10 FYE 10 2009 2009 FYE 10 FYE 10
Acadia 60,095 $ 16,695,714 $ 278 $ 20,285,768 $ 338 $ 22,759,952 $ 379
Allen 25,636 2,717,519 106 11,688,019 456 7,635,947 298
Ascension 104,822 46,867,897 447 87,539,910 835 66,761,461 637
Assumption 22,874 2,714,354 119 12,410,817 543 11,718,420 512
Avoyelles 42,511 6,298,681 148 5,622,025 132 14,210,536 334
Beauregard 35,419 6,815,610 192 20,132,474 568 12,741,125 360
Bienville 14,729 6,883,796 467 31,665,405 2,150 5,823,126 395
Bossier 111,492 36,477,481 327 79,211,164 710 55,027,561 494
Caddo 253,623 141,188,315 557 198,286,939 782 151,348,663 597
Calcasieu 187,554 80,959,436 432 156,457,844 834 108,313,422 578
Caldwell 10,439 1,569,239 150 5,636,564 540 3,758,884 360
Cameron 6,584 1,088,212 165 38,172,065 5,798 3,509,502 533
Catahoula 10,460 1,401,949 134 3,177,741 304 3,187,970 305
Claiborne 16,118 3,182,512 197 10,802,534 670 5,039,132 313
Concordia 18,989 5,487,996 289 12,504,100 658 5,395,410 284
DeSoto 26,401 7,228,230 274 41,666,366 1,578 15,233,655 577
East Baton Rouge 434,633 234,756,037 540 360,853,433 830 257,797,463 593
East Carroll 8,102 1,856,980 229 3,888,554 480 1,619,901 200
East Feliciana 20,970 1,600,587 76 5,155,648 246 8,852,099 422
Evangeline 35,330 4,831,825 137 10,886,148 308 13,840,842 392
Franklin 19,807 3,867,899 195 5,080,475 256 6,129,505 309
Grant 20,164 858,575 43 6,569,459 326 6,865,463 340
Iberia 75,101 24,112,237 321 31,851,715 424 38,037,255 506
Iberville 32,505 27,288,037 840 41,371,373 1,273 14,928,216 459
Jackson 15,063 2,117,560 141 18,882,513 1,254 5,565,546 369
Jefferson 443,342 252,273,126 569 312,030,422 704 252,513,359 570
Jefferson Davis 31,097 6,801,578 219 17,338,485 558 13,034,011 419
Lafayette 210,954 144,149,399 683 135,015,310 640 164,377,828 779
Lafourche 93,682 27,198,328 290 80,369,175 858 65,504,419 699
LaSalle 13,964 3,461,898 248 10,754,605 770 5,800,925 415
Lincoln 43,286 16,897,182 390 30,446,560 703 20,112,958 465
Livingston 123,326 21,579,944 175 44,585,194 362 60,446,099 490
Madison 11,385 1,282,693 113 9,993,506 878 2,312,336 203
Morehouse 28,223 7,622,369 270 11,720,891 415 8,974,456 318
Natchitoches 39,255 8,169,758 208 19,557,835 498 14,329,170 365

22
PARISH comparison of various & per capita tax collections
Parish
Population Estimates
Gross Sales Tax Due
Sales Tax (Per Cap)
Distribution of Local
Property Taxes for year 2009*
Property Taxes (Per Cap)
LA Adjusted Individual Income Tax
LA Adj. Inc. Tax (Per Cap)
July 1, 2009 FYE 10 FYE 10 2009 2009 FYE 10 FYE 10
Orleans** 354,850 $ 170,421,801 $ 480 $ 408,721,072 $ 1,152 $ 183,958,582 $ 518
Ouachita 151,502 96,264,686 635 81,011,018 535 68,684,203 453
Plaquemines 20,942 6,843,537 327 55,879,674 2,668 13,642,239 651
Pointe Coupee 22,447 4,415,790 197 16,770,789 747 10,188,717 454
Rapides 133,937 49,396,613 369 68,162,969 509 62,541,843 467
Red River 9,003 1,056,277 117 8,048,692 894 3,852,651 428
Richland 20,422 3,860,170 189 10,161,546 498 7,000,689 343
Sabine 23,733 4,668,897 197 8,569,592 361 9,822,364 414
St. Bernard 40,655 15,166,462 373 29,878,749 735 10,919,814 269
St. Charles 51,611 37,851,662 733 120,107,171 2,327 34,544,458 669
St. Helena 10,551 663,248 63 4,910,568 465 4,026,868 382
St. James 21,054 5,240,886 249 42,551,375 2,021 10,991,596 522
St. John the Baptist 47,086 23,256,665 494 41,429,137 880 21,319,162 453
St. Landry 92,326 17,558,001 190 28,238,291 306 41,288,840 447
St. Martin 52,217 9,860,418 189 23,548,986 451 23,215,224 445
St. Mary 50,815 19,443,928 383 49,090,786 966 27,253,678 536
St. Tammany 231,495 71,329,131 308 224,332,279 969 165,935,544 717
Tangipahoa 118,688 29,026,545 245 38,776,628 327 48,408,835 408
Tensas 5,609 1,142,096 204 4,366,190 778 1,662,939 296
Terrebonne 109,291 38,834,792 355 69,262,487 634 67,047,395 613
Union 22,584 6,384,695 283 8,790,792 389 7,588,399 336
Vermilion 56,141 10,687,840 190 29,210,986 520 28,385,834 506
Vernon 46,616 6,547,162 140 13,408,772 288 13,374,633 287
Washington 45,669 9,580,703 210 17,652,702 387 12,261,364 268
Webster 40,544 20,316,139 501 22,340,839 551 17,564,344 433
West Baton Rouge 22,638 22,418,974 990 28,404,578 1,255 12,706,803 561
West Carroll 11,329 1,739,978 154 3,581,619 316 3,217,928 284
West Feliciana 15,055 2,049,106 136 19,171,649 1,273 6,788,914 451
Winn 15,331 2,577,776 168 6,096,458 398 4,854,197 317
LOUISIANA’S ESTIMATED POPULATION: 4,492,076
* Exclusive of Homestead Exemption
**Orleans Parish property tax amounts are for 2010.
Source: U.S. Census Bureau Geographic area Population Estimates Estimates Base April 1, 2000
Source: Louisiana Tax Commission

23
LOCAL DEDICATIONS state hotel/motel tax collections
FOR FISCAL YEAR ENDING JUNE 30, 2010
Fund Total
Acadia Parish Visitor Enterprise Fund $ 67,396.92
Allen Parish Capital Improvement Fund 233,310.57
Ascension Parish Visitor Enterprise Fund 512,878.40
Avoyelles Parish Visitor Enterprise Fund 47,875.03
Beauregard Parish Community Improvement Fund 133,054.14
Bienville Parish Tour & Economic Development Fund 20,271.97
Bossier Parish Civic Center Fund 2,770,193.68
Caddo Shreveport Riverfront & Convention Center Fund 3,189,396.61
Caddo Shreveport-Bossier City Visitor Enterprise Fund 685,513.86
Calcasieu East of River Visitor (Ward 1,2 & 8) 612,654.93
Calcasieu East of River Visitor Enterprise Fund (Ward 3) 0.00
Calcasieu East of River Lake Charles Civic Center 570,635.34
Calcasieu West of River Community Center Fund (Ward 4,5,6 & 7) 845,111.03
Caldwell Parish Economic Development Fund 0.00
Cameron Parish Tourist Development Fund 21,269.19
Claiborne Parish Town of Homer Economic Development Fund 20,645.75
Concordia Parish Economic Development Fund 82,255.57
DeSoto Parish Visitor Enterprise Fund 69,153.48
East Baton Rouge Parish Baker Economic Development 37,926.61
East Baton Rouge Parish Riverside Centroplex Fund 1,048,145.12
East Baton Rouge Parish Community Improvement Fund 2,161,123.93
East Baton Rouge Parish Enhancement Fund 1,080,561.94
East Carroll Parish Visitor Enterprise Fund 9,435.28
East Feliciana Parish Tourist Commission Fund 1,542.60
Evangeline Parish Visitor Enterprise 44,411.39
Franklin Parish Visitor Enterprise Fund 40,121.42
Iberia Parish Tourist Commission Fund 335,432.45
Iberville Parish Visitor Enterprise Fund 76,576.08
Jackson Parish Economic Development & Tourism Fund 20,659.46
Jefferson Davis Parish Visit Enterprise Fund 136,324.06
Lafayette Parish Visit Enterprise Fund 2,240,318.49
Lafourche Parish Enterprise Fund 242,366.06
Lafourche Retarded Citizens, Training, & Development 238,730.66
LaSalle Parish Economic Development Fund 16,875.49
Lincoln Parish Visitor Enterprise Fund 206,452.59
Lincoln Parish Municipalities Fund 203,355.84
Livingston Parish Tourism Improvement Fund 319,417.58
Madison Parish Visitor Enterprise Fund 42,469.74
Morehouse Parish Visitor Enterprise Fund 32,037.12
Morehouse Parish Bastrop Municipal Center Fund 31,556.55
Natchitoches Parish Historic Development Fund 434,451.80
Natchitoches Parish Visitor Enterprise Fund 146,280.09
Ouachita Parish Visitor Enterprise Fund 1,195,365.00
Plaquemines Parish Visitor Enterprise Fund 237,174.22
Point Coupee Parish Visitor Enterprise Fund 24,030.96

24
LOCAL DEDICATIONS state hotel/motel tax collections
FOR FISCAL YEAR ENDING JUNE 30, 2010
Fund Total
Rapides Parish Economic Development Fund $ 363,392.87
Rapides Parish Coliseum 72,678.74
Rapides Alex/Pineville Area Tourism Fund 218,035.98
Rapides Alex/Pineville Exhibition Hall 244,944.77
Rapides City of Pineville Economic Development Fund 218,035.98
Red River Visitor Enterprise Fund 30,864.73
Richland Parish Visitor Enterprise Fund 99,739.70
Sabine Parish Tourism Improvement Fund 208,535.52
St. Bernard Parish Visitor Enterprise Fund 38,442.40
St. Charles Parish Visitor Enterprise Fund 111,948.65
St. Charles Parish River Parish Convention, Tourism & Visitor Fund 37,693.15
St. Helena Parish Tourist Community Fund 0.00
St. James Parish Enterprise Fund 15,400.93
St. James Parish River Parish Convention, Tourism & Visitor Fund 5,185.50
St. John the Baptist Parish Convention Facility Fund 277,866.32
St. John the Baptist River Parish Convention, Tourism & Visitor Fund 93,557.68
St. Landry Parish Tourist Community Fund 127,466.80
St. Landry Parish City Hall Market Fund 129,407.94
St. Martin Parish Enterprise Fund 172,541.13
St. Mary Parish Visitor Enterprise Fund 447,840.04
St. Tammany Parish Tourist Commission Fund 1,265,167.34
Tangipahoa Parish Tourist Commission Fund 393,597.37
Tangipahoa Parish Economic Development Fund 132,524.35
Tensas Parish Visit Enterprise Fund 1,625.52
Terrebonne Parish Houma Tourist Fund 492,743.33
Terrebonne Parish Visitor Enterprise Fund 485,352.04
Union Parish Visitor Enterprise Fund 27,664.33
Vermilion Parish Visitor Enterprise Fund 79,964.54
Vernon Parish Community Improvement Fund 279,121.07
Washington Parish Tourist Community Fund 32,255.70
Washington Parish Economic Development & Tourism Visitor Fund 10,860.51
Webster Parish Convention & Visitor Bureau Fund 200,134.56
West Baton Rouge Parish Visitor Enterprise Fund 372,654.77
West Carroll Parish Visitor Enterprise Fund 10,791.43
West Feliciana Parish St. Francisville Economic Development Fund 119,350.69
Winn Parish Tourism Fund 41,068.16
SUM OF ALL FUNDS $ 27,343,213.54

25
various fund distributions
For Fiscal Year ending June 30, 2010
Fund Distribution Amount
DeDicAtion oF StAte tAxeS collecteD
Aviation Fuels $ 29,800,000
Attakapas Conservation Fund 1,943,870
Ernest Morial Convention Center 2,000,000
Gasoline/Special Fuels Timed Account 117,475,485
Motor Fuels Inspection Fund 4,936,243
Sports Facility Assistance Fund 3,324,953
Military Assistance Fund 173,027
Telephone Company Property Assessment Fund 29,763,624
Tobacco Tax Healthcare Fund 34,251,476
Transportation Trust Fund 469,901,940
totAl $ 693,570,618
cooperAtive enDeAvorS (tax incremental Financing)
TIF – Algiers Economic Development $ 644,020
TIF – Bass Pro Shops 836,418
TIF – Cabelas 596,787
TIF – City of Broussard District Account 1,063,610
TIF – Garrett Road Economic Development District 2,909,318
TIF – Industrial Board of Lafayette 630,566
TIF – Ruston Cooperative Endeavor 2,646,469
TIF – Tower Drive Economic Development District 947,989
totAl $ 10,275,180
DiStribution oF louiSiAnA touriSm tAx
LA Economic Development Fund $ 8,456,532
LA Economic Marketing Fund 1,723,771
LA Tourism Promotion District 19,207,329
totAl $ 29,387,631
DiStribution oF locAl tAxeS collecteD by lDr
Auto Rental Tax $ 968,035
Consumer Use Tax 703,046
Parish & Municipal Beer 5,480,135
Sales Prepaid Cell Phone 1,452
totAl $ 7,152,668
DiStribution oF reFunDS DeSiGnAteD For certAin DiSpoSition
Animal Welfare Task Force $ 19,349
Garnishment Program 10,558,018
Income Tax Donations 55,591
START Contributions 239,322
Wildlife Habitat 28,739
totAl $ 10,901,019
SpeciAl tAxinG DiStrictS
LA Stadium and Expo District – Orleans/Jefferson $ 28,916,575
E Morial Exhibition Authority Room Rentals – Orleans only 18,653,952
E Morial Exhibition Occupancy and Food/Beverage Tax – Orleans only 11,540,549
E Morial Exhibition Service Contractor & Tour Tax – Orleans only 1,268,871
totAl $ 60,379,946

26
OFFERS IN COMPROMISE (fy 09-10)
Name Type of Tax Total Tax, Interest, Penalties & Fees
Amount Abated/ Compromised
Amount Paid in Compromise
Alicia Robinson Individual Income $ 16,898.06 $ 13,024.90 $ 3,873.13Allen Chaney Individual Income 4,496.51 1,730.20 2,766.31Alloy Products Inc of LA Sales 15,743.67 6,045.81 9,697.86Anna Bella Children’s Fine Clothing Inc. Sales 8,348.14 7,263.14 1,085.00Beverly Hayes Individual Income 8,851.95 7,983.95 868.00BST Enterprises Inc. Sales, Withholding & CIF 36,043.83 18,671.55 17,372.28Calvin Cockerham Sr. Individual Income 1,253.95 898.95 355.00Charles Copeland Individual Income 5,922.69 3,833.34 2,089.35Cherllyn Emery Individual Income 12,380.31 11,755.31 625.00Curtis Fitts Individual Income 7,175.51 4,916.51 2,259.00Cynthia Kessler Individual Income 6,246.70 3,809.70 2,437.00David K. Chauvin Individual Income 8,713.78 2,734.57 5,979.21Donna Santos Individual Income 7,587.27 7,060.27 527.00Frederick E. Nelson Individual Income 5,082.66 3,061.72 2,020.94George Werner Individual Income 2,300.60 1,600.60 700.00Gregory H. Drake Individual Income 3,361.84 2,846.03 515.81Harold & Karla Temple Jr. Individual Income 41,432.30 21,267.30 20,165.00Harry A. Turner Individual Income 18,144.64 5,775.25 12,369.39Jack Powell Automotive LLC LGST 6,843.70 2,407.63 4,436.07John Bertucci Individual Income 29,146.09 20,766.77 8,379.32Lori & Melvin D. Bordelon Motor Vehicle Sales 6,504.05 2,945.30 3,558.75Mac & Karen Shachat Individual Income 115,546.89 87,907.47 27,639.42Manuel Dugas Jr. Individual Income 25,602.48 10,762.44 14,840.04Mary J. Autery Individual Income 514.93 339.93 175.00Philip J. Geiger Sr. Individual Income 6,856.99 5,217.99 1,639.00
R Wall Investments Inc. Corporate Withholding & Sales 19,045.40 15,145.40 3,900.00
River City Press Inc. Sales & CIFT 7,366.77 5,523.94 1,842.83S &L Corporation Statewide Hotel/Motel 13,937.70 10,294.70 3,643.00Seals & Seals Inc Sales 12,619.75 10,354.79 2,264.96Stacy Neely Ghirardi Individual Income 2,819.70 1,919.10 900.00
Todd Matherne Marijuana & Controlled Dangerous Substance 52,092,263.14 52,090,263.14 2,000.00
Trak Food Store of Friday LLC LGST, Withholding 19,366.32 7,561.04 11,805.28United Steel Co. Inc. Sales & Withholding 15,114.03 9,027.30 6,086.73
Louisiana Revised Statute 47:1578, as amended by Act 1383 of the 1997 Regular Session of the Louisiana Legislature, authorizes the Secretary of Revenue, under certain conditions, to compromise a judgment for taxes and cancel or release a lien, privilege, mortgage, or other encumbrance.
Under this authority, the Secretary can accept less than full payment as a final settlement for a state tax liability. The statutory conditions for such a settlement are “serious doubt” as to collectibility of the tax due or the taxpayer’s liability for the tax, and a higher collection cost than the outstanding liability. The judgment for taxes compromised must be $500,000 or less, excluding interest and penalty.
Name Type of Tax Tax Period Amount of Interest Compromised
Jeremy Palmer Individual Income 2006 $ 463.26
Keith Hardwick Individual Income 2001 372.67
Furnance and Tube Service Inc. Withholding 06/2007-
03/2008 15,624.12
Joel Lusk Individual Income 2006 160.68
Dolphin Holdings, Inc. Corporate Income and Franchise
12/2007 12/2008 1,070.32
Donna Blanchard Individual Income 2006 516.48
William B. Cloughley Individual Income 2006 525.43
Mark Matthews Individual Income 2006 398.60
Lee Palmer Jr. Individual Income 2006 592.32
Donald Latil Jr. Individual Income 2006 646.02
Note: Compromise of interest under the provisions of R.S.47:1601(A)(2)(d)

DATA BY TAX TYPE


29
ALCOHOLIC beverage tax (comparison of LA & selected states)
ALCOHOLIC beverage tax (comparison of LA & selected states)
StateBeer
Per Gallon AlcoholicContent of 4.5%
Light WinePer Gallon Alcoholic
Content of 12%
LOUISIANA $ 0.32 $ 0.11
Alabama 1.05 1.70
Arkansas 0.21 0.77
Florida 0.48 2.25
Georgia 0.48 1.51
Mississippi 0.43 0.43
Texas 0.19 0.20
Source: The Tax Foundation
Beer:
1934 $1.50 per 31-gallon barrel
1948 $10.00 per 31-gallon barrel
Liquor:
1934 $.50 per wine gallon
1935 $.60 per wine gallon
1938 $1.00 per wine gallon
1940 $1.50 per wine gallon
1956 $1.68 per wine gallon
1970 $2.50 per wine gallon
1978 $.66 per liter
Sparkling Wines and Still Wines over 24 percent by volume:
1934 $ .50 per wine gallon
1935 $ .60 per wine gallon
1938 $1.00 per wine gallon
1940 $1.50 per wine gallon
1956 $1.58 per wine gallon
1978 $ .42 per liter
Still Wines not over 14 percent by volume
1934 $ .05 per wine gallon
1940 $ .15 per wine gallon
1942 $ .10 per wine gallon
1956 $ .11 per wine gallon
1978 $ .03 per liter
Still Wines between 14 and 24 percent by volume
1934 $ .10 per wine gallon
1940 $ .30 per wine gallon
1942 $ .20 per wine gallon
1956 $ .21 per wine gallon
1978 $ .06 per liter
The tax rates of beverages of alcoholic content have changed since 1934 as follows:

30
ALCOHOLIC beverage tax (cash collection after accrual adjustments)
ALCOHOLIC beverage tax (cash collection after accrual adjustments)
Fiscal Year Low Alcoholic Content High Alcoholic Content (Includes out-of-state shippers) Total % Change
2009-10 $ 35,786,569 $ 19,713,041 $ 55,499,611 -2.43%
2008-09 37,308,854 19,572,424 56,881,277 2.63%
2007-08 36,524,740 18,900,196 55,424,936 2.76%
2006-07 36,075,416 17,863,245 53,938,661 1.44%
2005-06 36,508,004 16,665,216 53,173,220 -0.94%
The tax levies are Beer – $10 per 31-gallon barrel; Liquor – 66¢ per liter; Sparkling Wine – 42¢ per liter; Still and Native Wine (alcoholic content 14% and under) – 3¢ per liter; Still and Native Wine (alcoholic content over 14%, but not over 24%) – 6¢ per liter.
The alcoholic beverage taxes are levied on beer, liquor, and wine, including wine from out-of-state shippers.
09 10
08 09
07 08
06 07
05 06
$53,173,220
$55,499,611
$55,424,936
$56,881,277
$53,938,661

31
ALCOHOLIC beverage tax (cash collections – barrels of beer equivalent)
ALCOHOLIC beverage tax (cash collections – barrels of beer equivalent)
FISCAL YEAR 2010
Period Cash Collections # of Barrels
1st Quarter $ 9,555,603 955,560
2nd Quarter 8,859,162 885,916
3rd Quarter 8,050,326 805,033
4th Quarter 9,161,976 916,198
TOTAL $ 35,627,066 3,562,707
Note: Tax Rate of $10 per barrel
FISCAL YEAR 2009
Period Cash Collections # of Barrels
1st Quarter $ 9,896,283 989,628
2nd Quarter 9,021,947 902,195
3rd Quarter 8,756,027 875,603
4th Quarter 9,635,407 963,541
TOTAL $ 37,309,665 3,730,966
Note: Tax Rate of $10 per barrel

32
ALCOHOLIC beverage tax (liters sold by category)
ALCOHOLIC beverage tax (liters sold by category)
LITERS SOLDFiscal Year 2010
Period Liquor Sparkling Wine High Alcoholic Content Wine Low Alcoholic Content Wine
1st Quarter 6,747,881 257,493 725,761 6,043,418
2nd Quarter 7,051,012 369,080 533,119 6,988,186
3rd Quarter 7,579,126 604,210 523,917 6,743,712
4th Quarter 6,888,819 319,878 504,875 6,794,169
TOTAL 28,266,838 1,550,661 2,287,672 26,569,486
TAX PER LITER $0.66 $0.42 $0.06 $0.03
GROSS TAX DUE* $18,656,113 $651,278 $137,260 $797,085
* Gross tax due before discounts, refunds, and other adjustments
LITERS SOLDFiscal Year 2009
Period Liquor Sparkling Wine High Alcoholic Content Wine Low Alcoholic Content Wine
1st Quarter 6,583,554 245,174 400,107 5,680,036
2nd Quarter 6,868,104 315,746 455,513 6,383,187
3rd Quarter 7,544,436 563,484 554,382 6,644,710
4th Quarter 6,870,540 290,002 499,876 6,417,495
TOTAL 27,866,634 1,414,407 1,909,878 25,125,428
TAX PER LITER $ 0.66 $ 0.42 $ 0.06 $ 0.03
GROSS TAX DUE* $ 18,391,978 $ 594,051 $ 114,593 $ 753,763
* Gross tax due before discounts, refunds, and other adjustments

33
ALCOHOLIC beverage licenses
AS of AUGUST 2010
License Type Count
AG.B - Class A General Beer 173
AG.BL - Class A General Beer and Liquor 2,831
AG.C - Caterer Attached to a Class A General 26
AG.CR - Class A General Conditional Restaurant 5
AG.L - Class A General Liquor 11
AR.B - Class A Restaurant Beer 636
AR.BL - Class A Restaurant Beer and Liquor 2,382
AR.BW - Class A Restaurant Beer and Light Wine 105
AR.L - Class A Restaurant Liquor 16
AR.MB - Class A Restaurant Microbrewer 2
AR.R - Class R Restaurant 3,138
AR.TR - Temporary Restaurant 1
AR.W - Class A Restaurant Light Wine 6
AR.C - A Restaurant - Caterer Attached 147
ARC - Restaurant Conditional 3
B.B - Class B Beer 920
B.BL - Class Beer and Liquor 3,704
B.C - Class B Caterer 5
B.L - Class B Liquor 13
C-A - Caterer Attached 2
C.BL - Class C Beer and Liquor 6
C.C - Class C Caterer 1
C.SA - Stand Alone Caterer 77
DC.L - Distribution Center Liquor Permit 1
M.B - Beer Manufacturer Permit 5
M.L - Liquor Manufacturer Permit 3
M.WP - Wine Producer Permit 9
OS.H - Out of State Man/Sup - Hi Al Content 597
OS.L - Out of State Man/Sup - Lo Al Content 11
S.IN - Solicitor - In State 846
S.OOS - Solicitor - Out of State 95
T.C - Tobacco Retail Certificate 5,209
T.P - Tobacco Retail Dealer Permit 226
T.T - Retail Tobacconist 24
T.VM - Retail Vending Machine 1,290
T.VO - Retail Vending Machine Operator 140
T.WD - Tobacco Wholesale Dealer Permit 64
T.WT - Wholesale Dealer Permit - Tobacconist 24
T.WVM - Wholesale Vending Machine 2
W.B - Malt Beverage Wholesale Permit 39
W.L - Liquor Wholesale Permit 42
W.P - Pseudo Wholesaler 159
TOTALS 22,996
Source: ATC

34
CORPORATION income tax (comparison of LA & selected states)
All corporations and entities taxed as corporations for federal income tax purposes deriving income from Louisiana sources, whether or not they have any net income, must file an income tax return.
Corporations are taxed on net income computed at the following rates:
• Four percent on the first $25,000 of net income
• Five percent on the next $25,000
• Six percent on the next $50,000
• Seven percent on the next $100,000
• Eight percent on the excess over $200,000
State Tax Base (business income1)
Tax Base (nonbusiness income1)
Is there a minimum tax?
State computation of taxable net income
LOUISIANA Louisiana does not apply the business/nonbusiness concepts outlined by the MTC. The two classes of income are apportionable and allocable.2
Louisiana does not apply the business/nonbusiness concepts outlined by the MTC. The two classes of income are apportionable and allocable.2
No Starts with federal taxable income before special deductions.
Alabama All income that arises from the conduct of trade or business operations of a taxpayer is business income.
Nonbusiness income means all income other than business income. Apply either a functional or transactional test.
No Starts with taxable income after special deductions.
Arkansas Uses the business/nonbusiness concepts outlined by the MTC.1
Uses the business/nonbusiness concepts outlined by the MTC.1
No Income and deductions based on Arkansas code.
Florida Activities and transactions in the regular course of taxpayer’s trade or business. Includes any amounts that could be included in apportionable income without violating the due process clause.
All income other than business income. Yes Starts with federal taxable income after special deductions.
Georgia All income except certain limited types of investment income.
Certain income from assets held for investment; certain gains from assets not held, owned or used in the trade/business; apply either a transactional or functional test.
No Starts with federal taxable income after special deductions.
Mississippi Income arising from transactions & activities in the regular course of taxpayer’s trade or business & always includes income from real, tangible, & intangible property if the acquisition, management, & disposition of the property constitute integral parts of the taxpayer’s regular trade or business operations.3
All nonbusiness income; non-U.S. interest and dividends; U.S. government interest; apply either a transactional or functional test.
No Starts with federal taxable income after special deductions.
Texas4 All income except income that a state could not tax even if the corporation had nexus in that state.
Income a state could not tax even if the corpora-tion had nexus in that state; constitutional standard.
N/A Other.
Comparison of Louisiana and Selected States, Corporate Tax ComparisonComparison of corporate tax bases, minimum tax, and computation of taxable net income, tax laws effective July 1, 2009
1 Multistate Tax Compact Article IV. Division of Income 1. As used in this Article, unless the context otherwise requires (a) “Business income” means income arising from transactions and activity in the regular course of the taxpayer’s trade or business and includes income from tangible and intangible property if the acquisition, management and disposition of the property constitute integral parts of the taxpayer’s regular trade or business operations (e) “Nonbusiness income” means all income other than business income.
2 The Louisiana income tax is imposed only upon that part of the net income of a corporation that is derived from sources within Louisiana. Corporations that do business outside of Louisiana must complete Form CIFT-620A, which provides schedules for the apportionment and allocation of net income. All corporations and entities taxed as corporations for federal income tax purposes deriving income from Louisiana sources, whether or not they have any net income, must file an income tax return.
3 Mississippi Business Income Items – In essence, all income that arises from the conduct of trade or business operations of a taxpayer is business income. The income of the taxpayer is business income unless clearly classifiable as non business income.
4 Effective January 1, 2008, Texas has replaced the prior tax based on capital and earned surplus with a new “margin tax.” Texas does not consider the margin tax as an income tax. A taxable entity’s margin is the lowest of three amounts: (1) total revenue minus cost of goods sold, (2) total revenue minus compensation, or (3) 70 percent of total revenue.
Source: 2010 Multistate Corporate Tax Guide, Volume 1 Multistate Tax Commission

35
CORPORATION income tax (based on cash collections)
CORPORATION income tax (based on cash collections)
Fiscal Year Amount Collected % Change
2009-10 $ 435,361,225 -25.72%
2008-09 586,089,718 -21.51%
2007-08 746,705,214 3.53%
2006-07 721,271,386 42.87%
2005-06 504,849,972 34.78%
$504,849,971
$721,271,386
$746,705,214
$586,089,718
09 10
08 09
07 08
06 07
05 06
$435,361,225

36
CORPORATION franchise tax (based on cash collections)
CORPORATION franchise tax (based on cash collections)
Fiscal Year Amount Collected % Change
2009-10 $ 145,121,306 -25.79%
2008-09 195,562,940 -21.05%
2007-08 247,694,096 -12.90%
2006-07 284,390,805 8.89%
2005-06 261,166,429 -9.92%
The corporation franchise tax is levied on any corporation doing business or qualified to do business in Louisiana, unless specifically exempt by statute.
The total taxable base consists of the corporation’s capital stock, surplus, undivided profits, and borrowed capital. Borrowed capital is currently being phased out and will be completely phased out after 1/1/2011. The tax is computed on the basis of the portion of the total taxable base employed in Louisiana.
The corporation franchise tax rate is as follows:
• $1.50 per each $1,000 of taxable base up to $300,000;
• $3.00 per each $1,000 of taxable base over $300,000
There is a minimum $10 corporation franchise tax for taxable periods beginning before January 1, 2010. The minimum franchise tax has been repealed for tax periods after January 1, 2010.
09 10
08 09
07 08
06 07
05 06
$261,166,429
$284,390,805
$195,562,940
$247,694,096
$145,121,306

37
CORPORATION income & franchise tax (quarterly cash collections)
CORPORATION income & franchise tax (quarterly cash collections)
FOR FISCAL YEAR ENDING JUNE 30, 2010
Period Corporation Income Tax Corporation Franchise Tax
1st Quarter $ 101,774,244 $ 33,924,748
2nd Quarter 286,946,372 95,648,791
3rd Quarter (13,493,493) (4,496,932)
4th Quarter 60,134,102 20,044,701
TOTAL $ 435,361,225 $ 145,121,306
Corporation income tax All corporations and entities taxed as corporations for federal income tax purposes deriving income from Louisiana sources, whether or not they have any net income, must file a corporation income tax return unless specifically exempted.
• Louisiana’s corporation income tax closely follows the federal system and employs the federal definition of income and deductions with certain modifications.
• For multistate corporations, Louisiana net income is generally determined through formula apportionment with total net income apportioned to Louisiana based on the average of some combination of three factors: property, revenue, and wages.
• Louisiana allows a deduction for federal income tax in computing taxable income.
Corporation franchise tax Any corporation meeting any of the following provisions, unless specifically exempted under the provisions of Louisiana Revised Statute 47:608, must file a Louisiana corporation franchise tax return:
• Organized under the laws of Louisiana.
• Qualified to do business in this state or doing business in this state.
• Exercising or continuing the corporate charter within this state.
• Owning or using any of the corporate capital, plant, or other property in this state in a corporate capacity.

38
CORPORATION franchise tax (liability by taxable base)
CORPORATION income tax (liability by taxable income bracket)
Taxable Base Range # of Returns % of Total Returns Taxable Base Franchise Tax Liability* % of Total Liability
less than 0 16,660 13.09% $ (12,773,599,238) $ 279,527 0.06%
0 37,108 29.16% 0 702,758 0.15%
1 - 25,000 22,635 17.78% 191,009,369 321,133 0.07%
25,001 - 100,000 17,235 13.54% 956,765,644 1,342,050 0.29%
100,001 - 500,000 18,981 14.91% 4,439,934,686 6,833,555 1.45%
500,001 - 1,000,000 5,181 4.07% 3,654,801,613 7,910,235 1.68%
1,000,001 - 10,000,000 7,541 5.93% 22,773,939,902 56,679,368 12.05%
10,000,001 - 50,000,000 1,420 1.12% 31,080,408,820 81,350,818 17.29%
50,000,001 - 100,000,000 243 0.19% 16,533,506,623 45,362,023 9.64%
100,000,001 - 500,000,000 219 0.17% 45,295,935,103 128,278,959 27.26%
500,000,001 - 1,000,000,000 34 0.03% 23,587,630,712 65,358,819 13.89%
> 1,000,000,000 14 0.01% 25,364,578,056 76,087,431 16.17%
TOTALS 127,271 100.00% $ 161,104,911,290 $ 470,506,676 100.00%
*This amount is the tax due on the return before credits or prepayments.
Taxable Income Bracket # of Returns % of Total Returns Taxable Income Income Tax Liability* % of Total Liability
less than 0 28,068 22.09% $ (64,679,461,613) $ 0 0.00%
0 76,751 60.40% 0 0 0.00%
1 - 25,000 12,561 9.89% 85,318,562 3,419,844 0.49%
25,001 - 50,000 2,810 2.21% 102,225,750 4,420,437 0.64%
50,001 - 100,000 2,299 1.81% 161,943,882 8,019,935 1.15%
100,001 - 500,000 2,780 2.19% 618,674,164 40,051,816 5.77%
500,001 - 1,000,000 679 0.53% 481,254,130 35,995,648 5.18%
1,000,001 - 2,000,000 467 0.37% 663,684,092 51,359,417 7.40%
2,000,001 - 10,000,000 509 0.40% 2,119,242,322 167,662,817 24.14%
> 10,000,000 147 0.12% 4,800,609,681 383,501,587 55.23%
TOTALS 127,071 100.00% $ (55,646,509,030) $ 694,431,501 100.00%
*This amount is the tax due on the return before credits or prepayments.

39
CORPORATION income & franchise tax (credits claimed on returns)NONREFUNDABLE CREDITS CLAIMED ON RETURNS Processed During Fiscal Year 2010
Credit Amount Claimed Against Corporation Income Tax
Amount Claimed Against Corporation Franchise Tax
Angel Investor Tax Credit* $ 0 $ 0 Apprenticeship 210,254 512,612 Atchafalaya Trace 0 0 Basic Skills Training 1,250 0 Biomedical/University Research 0 0 Bone Marrow Doner 0 N/ABrownfields Investor Credit 44,641 N/ACane River Heritage Area 0 0 Contributions to Educational Institutions 48 N/ACredit for Refunds Paid by Utilities 0 N/ADebt Issuance Costs 0 0 Dedicated Research Investments 4,101 N/ADigital Interactive Media 0 N/ADonations of Materials, Equipment, Advisors, Instructors 0 0 Donations to Public Schools 4,000 4,000 Donations to Qualified Playgrounds 0 0 Eligible Reentrants 500 N/AEmployee & Dependent Health Insurance 5,135 0 Employment of the Previously Unemployed 0 0 Enterprise Zone 10,522,276 7,409,498 Insurance Company Premium Tax 195,169,569 N/ALA Capital Companies 11,259 N/ALA Community Development Financial Institutions Act Credit 0 0 LA Community Economic Development 0 0 Manufacturing Establishments 0 942,404 Motion Picture Employment of Resident 439,720 329,034 Motion Picture Infrastructure Credit 7,490 N/AMotion Picture Investor Credit 9,496,411 N/ANeighborhood Assistance 0 N/ANew Jobs Credit 436,527 N/ANew Markets Credit 1,970,297 1,252,747 Nonviolent Offenders Employment Credit 200 N/APorts of Louisiana Import Export Cargo 0 0 Ports of Louisiana Investor 0 0 Quality Jobs* 0 0 Recycling Credit 41,231 242,570 Rehabilitation of Historic Structures 1,211,265 837,101 Research and Development* 559,181 12,365,160 Tax Equalization 5,721,983 477,538 Technology Commercialization* 0 0 Vehicle Alternative Fuels* 145,862 N/ATOTAL $ 226,003,200 $ 24,372,664 * These credits are reported as both Refundable and Nonrefundable due to statutory changes. See below for refundable amounts.
REFUNDABLE CREDITS CLAIMED ON RETURNS Processed During Fiscal Year 2010
Credit Amount Claimed
Inventory Tax Credit $ 307,145,105 Ad Valorem for Natural Gas 3,518,093 Ad Valorem for Offshore Vessels 18,210,094 Angel Investor 186,528 Conversion of Vehicle to Alternative Fuel 34,238 Louisiana Citizens Insurance Credit 1,864,040 Mentor-Protege 18,000 Milk Producers 200,000 Musical & Theatrical Productions 0 Prison Industry Enhancement 1,065 Quality Jobs 1,245,619 Research And Development 1,945,836
Credit Amount Claimed
Retention And Modernization 0 School Readiness Business Supported Child Care 157,700 School Readiness Child Care Provider 1,398,500 School Readiness Fees & Grants to Resource & Referral Agencies 60,000 Sound Recording Investment 0 Sugar Cane Trailer Conversion 109,279 Technology Commercialization 191,979 Telephone Company Property Tax 23,306,138 Urban Revitalization 2,778 Vehicle Alternative Fuel Credit 0 Wind and Solar Energy System 76,500 Other Refundable 980,740 TOTAL $ 360,652,232

40
GIFT & INHERITANCE tax (cash collections by quarter)
GIFT & INHERITANCE tax (based on cash collections)
GIFT TAX INHERITANCE TAX
Fiscal Year Amount Collected % Change Fiscal Year Amount Collected % Change
2009-10 $ 211,688 -89.27% 2009-10 $ 1,606,000 -51.05%
2008-09 1,972,767 -43.31% 2008-09 3,281,076 -58.39%
2007-08 3,479,982 -37.86% 2007-08 7,885,772 55.57%
2006-07 5,600,204 147.41% 2006-07 5,068,944 -53.44%
2005-06 2,263,491 -35.70% 2005-06 10,886,214 -61.01%
Gift taxActs 2007, No. 371 repealed the gift tax effective July 1, 2008. For gifts that were made before July 1, 2008, a gift tax return must be filed by every person making gifts to a single donee totaling more than the amount of the applicable exclusion. The gift tax is primarily due from the donor. The gift tax is two percent for the first $15,000 in taxable gifts and three percent for amounts above $15,000. The tax is computed by applying the tax rates to the total of all taxable gifts made since July 30, 1940, after allowing the annual exclusions and any portion of the claimed and allowed specific lifetime exemption.
Inheritance taxActs 2007, No. 371 provided that no inheritance tax shall apply to deaths occurring after June 30, 2004 and that all persons who paid inheritance taxes based upon a death which occurred after June 30, 2004 may claim a refund of those taxes between August 1, 2008 and December 31, 2009.
Acts 2008, No. 822 provided that inheritance taxes owed for deaths occurring before July 1, 2004 for which an inheritance tax return has not been filed before January 1, 2008, shall be due on January 1, 2008. The Act also repeals inheritance tax effective January 1, 2010.
GIFT TAXFor Fiscal Years Ending 6/30/2009 & 2010
INHERITANCE TAXFor Fiscal Years Ending 6/30/2009 & 2010
Period FYE 2009 FYE 2010 % Change Period FYE 2009 FYE 2010 % Change
1st Quarter $ 430,749 $ 1,112 -99.74% 1st Quarter $ 812,550 $ 577,081 -28.98%
2nd Quarter 192,936 148,229 -23.17% 2nd Quarter 137,071 206,483 50.64%
3rd Quarter 439,482 169 -99.96% 3rd Quarter 196,167 664,174 238.58%
4th Quarter 909,600 62,178 -93.16% 4th Quarter 2,135,288 158,262 -92.59%
TOTAL $ 1,972,767 $ 211,688 -89.27% TOTAL $ 3,281,076 $ 1,606,000 -51.05%

41
INDIVIDUAL income tax (donations per returns processed)
INDIVIDUAL income tax (comparison of LA & selected states)
INDIVIDUAL INCOME TAX: BASIC RATES, EXEMPTIONS & STANDARD DEDUCTIONS as of January 1, 2009
StateTax Rates
Range
Taxable Income Brackets Personal Exemptions
Dependents
Standard Deductions
Federal Income Tax DeductionUp To Over Single
Married/Jointly Single
Married/Jointly
LOUISIANASingle 2% - 6% $ 12,500 $ 50,000 $ 4,5001 $ 1,000
See Note1Yes
Married/Jointly 2% - 6% $ 25,000 $ 100,000 $ 9,0001
Alabama
Single 2% - 5% $ 500 $ 3,000 $ 1,500 See Note2 minimum $2,000
maximim $2,500
minimum $4,000
maximum $7,500
Yes
Married/Jointly 2% - 5% $ 1,000 $ 6,000 $ 3,000
Arkansas 1% - 7% $ 3,899 $ 32,600 $ 23tax credit
$ 46 tax credit
$ 23tax credit per
dependent $ 2,000 $ 4,000 No
Florida No State Individual Income Tax
GeorgiaSingle 1% - 6% $ 750 $ 7,000 $ 2,700 $ 3,000 $ 2,300 No
Married/Jointly 1% - 6% $ 1,000 $ 10,000 $ 5,400 $ 3,000
Mississippi 3% - 5% $ 5,000 $ 10,000 $ 6,000 $ 12,000 $ 1,500 $ 2,300 $ 4,600 No
Texas No State Individual Income Tax
1 This is a combined personal exemption/standard deduction
Source: FTA website (www.taxadmin.org), and state tax forms
2 $1,000, AGI < $20,000 $500, AGI > $20,000 < $100,000 $300, AGI > $100,000
DURING FISCAL YEAR ENDING JUNE 30, 2010
Fund Number of Donations Donation Amount Average Donation
Military Family Assistance Fund 3,994 $ 116,391 $ 29.14
Coastal Protection & Restoration Fund 3,234 72,645 22.46
Wildlife Trust Fund 2,378 42,960 18.07
LA Cancer Trust Fund 2,068 37,121 17.95
LA Animal Welfare Fund 1,987 31,270 15.74
Community Health Care Fund 1,332 27,230 20.44
National Lung Cancer 1,246 13,677 10.98
LA Housing Trust Fund 14 227 16.21
TOTAL 16,253 $ 341,521 $ 21.01

42
INDIVIDUAL income per capita (comparison of LA & selected states)
PER CAPITA INCOME
State 2005 2006 2007 2008 2009 2008-2009 % Change Rank 2008 Rank 2009
LOUISIANA $ 24,901 $ 31,821 $ 34,756 $ 36,271 $ 35,507 -2.11% 3 3
Alabama 29,306 30,894 32,404 33,643 33,096 -1.63% 5 5
Arkansas 26,989 28,473 30,060 31,266 31,946 2.17% 6 6
Florida 34,798 36,720 38,444 39,070 37,780 -3.30% 1 1
Georgia 31,193 32,095 33,457 33,975 33,786 -0.56% 4 4
Mississippi 25,490 27,028 28,845 29,569 30,103 1.81% 7 7
Texas 33,253 35,166 37,187 38,575 36,484 -5.42% 2 2
United States 34,757 36,714 38,611 39,751 39,138 -1.54% - -
PER CAPITA DISPOSABLE PERSONAL INCOME
State 2005 2006 2007 2008 2009 2008-2009 % Change Rank 2008 Rank 2009
LOUISIANA $ 22,608 $ 29,066 $ 31,728 $ 32,651 $ 32,953 0.92% 3 3
Alabama 26,523 27,811 29,077 30,297 30,597 0.99% 4 5
Arkansas 24,420 25,670 27,040 28,270 29,536 4.48% 6 6
Florida 30,919 32,391 33,802 34,880 34,880 0.00% 1 1
Georgia 27,701 28,304 29,349 30,082 30,926 2.81% 5 4
Mississippi 23,619 24,940 26,564 27,077 28,221 4.22% 7 7
Texas 30,241 31,765 33,424 34,850 33,818 -2.96% 2 2
United States 30,675 32,185 33,697 34,949 35,553 1.73% - -
DISPOSABLE PERSONAL INCOME as percent of personal income
State 2005 2006 2007 2008 2009
LOUISIANA 90.8% 91.3% 91.3% 90.0% 92.8%
Alabama 90.5% 90.0% 89.7% 90.1% 92.4%
Arkansas 90.5% 90.2% 90.0% 90.4% 92.5%
Florida 88.9% 88.2% 87.9% 89.3% 92.3%
Georgia 88.8% 88.2% 87.7% 88.5% 91.5%
Mississippi 92.7% 92.3% 92.1% 91.6% 93.7%
Texas 90.9% 90.3% 89.9% 90.3% 92.7%
United States 88.3% 87.7% 87.3% 87.9% 90.8%
Source: U.S. Department of Commerce, Bureau of Economic Analysis, “Survey of Current Business,” August 2010

43
INDIVIDUAL income tax per capita comparison
FOR FISCAL YEAR 2009
Rank State Per Capita
1 New York $ 1,885
2 Connecticut 1,813
3 Massachusetts 1,607
4 Oregon 1,421
5 Minnesota 1,319
6 New Jersey 1,225
7 California 1,200
8 Maryland 1,137
9 Virginia 1,131
10 Wisconsin 1,100
11 Maine 1,040
12 Hawaii 1,034
13 Delaware 1,029
14 North Carolina 1,019
15 Kansas 969
16 Rhode Island 912
17 Iowa 899
18 Nebraska 892
19 Colorado 876
20 Vermont 857
21 West Virginia 856
22 Montana 848
23 Utah 833
24 Missouri 797
25 Georgia 794
26 Arkansas 775
27 Kentucky 768
28 Idaho 761
29 Pennsylvania 758
30 Ohio 721
31 Illinois 711
32 Oklahoma 690
33 Indiana 672
34 LOUISIANA 655
35 Michigan 604
36 North Dakota 572
37 Alabama 565
38 South Carolina 516
39 Mississippi 503
40 New Mexico 464
41 Arizona 297
42 New Hampshire 74
43 Tennessee 35
* Seven states levy no individual income tax: Alaska, Florida, Nevada, South Dakota, Texas, Washington, and Wyoming
Source: U.S. Department of Commerce, Bureau of the Census
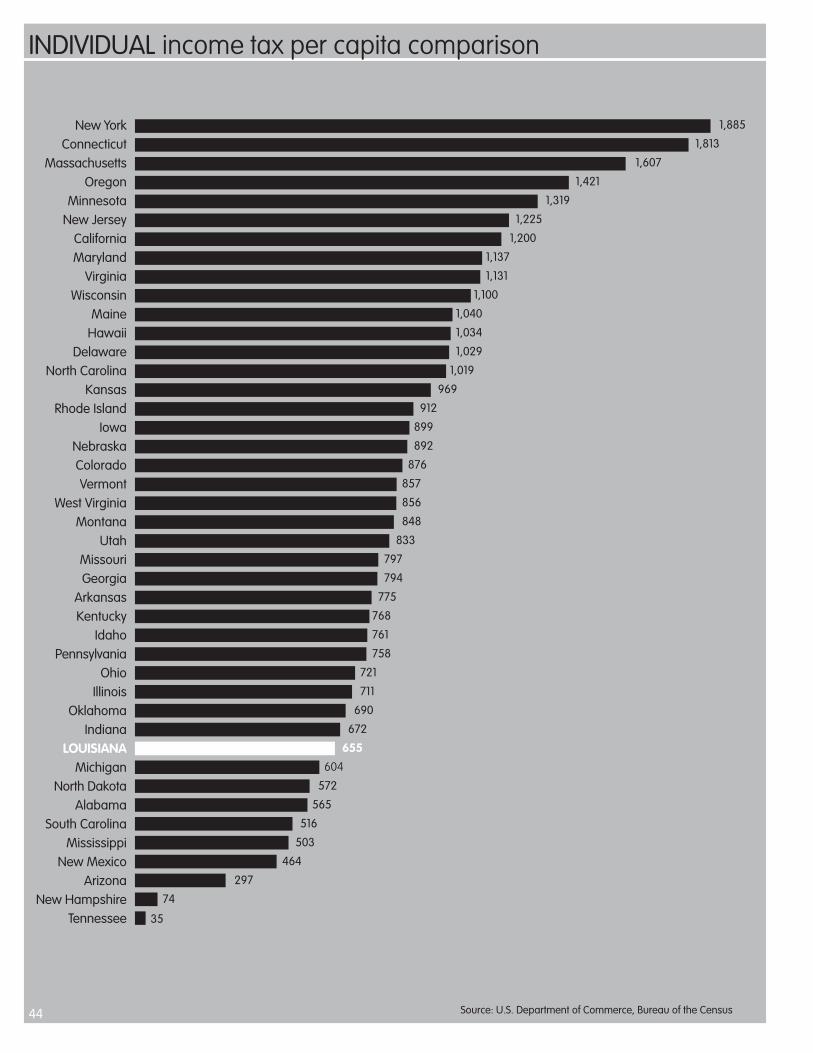
44
INDIVIDUAL income tax per capita comparison
Source: U.S. Department of Commerce, Bureau of the Census
New York 1,885
Connecticut 1,813
Massachusetts 1,607
Oregon 1,421
Minnesota 1,319
New Jersey 1,225
California 1,200
Maryland 1,137
Virginia 1,131
Wisconsin 1,100
Maine 1,040
Hawaii 1,034
Delaware 1,029
North Carolina 1,019
Kansas 969
Rhode Island 912
Iowa 899
Nebraska 892
Colorado 876
Vermont 857
West Virginia 856
Montana 848
Utah 833
Missouri 797
Georgia 794
Arkansas 775
Kentucky 768
Idaho 761
Pennsylvania 758
Ohio 721
Illinois 711
Oklahoma 690
Indiana 672
LOUISIANA 655
Michigan 604
North Dakota 572
Alabama 565
South Carolina 516
Mississippi 503
New Mexico 464
Arizona 297
New Hampshire 74
Tennessee 35

45
INDIVIDUAL income tax (cash collection after accrual adjustments)
INDIVIDUAL income tax (cash collection after accrual adjustments)Louisiana individual income tax is based on federal tax laws for simplification, although Louisiana’s tax is not a true “piggyback” system. The starting point for the computation of the tax is the federal adjusted gross income. A deduction is also allowed for the amount of federal income taxes paid.
The Louisiana individual income tax rates are:
A taxpayer filing single, married filing separately, or head of household:
• 2% of the first $12,500 of taxable income;
• 4% of the next $12,500;
• 6% of the taxable income over $25,000.
A qualified widow(er) or married persons filing jointly:
• 2% of the first $25,000 of taxable income;
• 4% of the next $25,000;
• 6% of the taxable income over $50,000.
* Act 396 of the 2008 Regular Session of the Louisiana Legislature amended La. Revised Statute 47:32(A) to expand the amount of taxable income to which the four percent and six percent income tax rates are applied effective January 1, 2009.
Fiscal Year Amount Collected % Change
2009-10 $ 2,286,582,902 -22.24%
2008-09 2,940,538,753 -6.25%
2007-08 3,136,711,084 -2.44%
2006-07 3,215,084,205 28.81%
2005-06 2,495,939,314 4.86%
09 10
08 09
07 08
06 07
05 06
$2,495,939,314
$3,215,084,205
$3,136,711,084
$2,940,538,753
$2,286,582,902

46
INDIVIDUAL income tax (payments & credits reported on returns)
INDIVIDUAL income tax (payments & credits reported on returns)
PROCESSED DURING FISCAL YEAR 2010
Payments/Credit Reported Amount* % of Total
Withholding Reported $ 2,487,536,569 73.23%
Credits Carried Forward 120,715,259 3.55%
Declaration Payments 461,895,316 13.60%
Payments with Extensions 136,574,965 4.02%
Payments Made with Composite Partnership Returns 5,630,269 0.17%
Payments Made with Return 184,382,083 5.43%
TOTAL $ 3,396,734,461 100.00%
* Payment made with return (PMR) represents gross payments before refunds and includes income tax and consumer use tax.
TOTAL $3,396,734,461
WR
CCF
DP
PE
PMC
PMR
$2,487,536,569 (73.23%)
$461,895,316 (13.60%)
$136,574,965 (4.02%)
$5,630,269 (0.17%)
$184,382,083 (5.43%)
$120,715,259 (3.55%)

47
INDIVIDUAL income tax (nonrefundable credits claimed on returns)
INDIVIDUAL income tax (refundable credits claimed on returns)
PROCESSED DURING FISCAL YEAR 2010
Nonrefundable Credits Amount Claimed
Angel Investors Credit $ 38,420 Apprenticeship 177,599 Atchafalaya Trace Heritage Zone Credit 6,793 Bone Marrow 1,627 Brownfields Investor 122,776 Cane River Heritage Credit 3,163 Child Care Credit (Includes Carry Forward from Prior Years) 4,779,179 Commercial Fishing Credit 119,556 Contributions to Educational Institutions 947,125 Credit for Certain Disabilities 3,230,300 Credit for Certain Federal Tax Credits 1,755,806 Credit for Liabilities Paid to Other States 75,031,657 Credit for Purchase of Bulletproof Vest 17,497 Credit for Refunds Paid by Utilities 46,411 Debt Issuance Cost Credit 33,210 Dedicated Research 1,258 Disabled Dependents Credit 507,700 Digital Interactive Media Producers Credit 184,101 Donations of Materials, Equipment, Advisors, Instructors 312,238 Education Credit 17,281,750 Employing Eligible Reentrants 1,200 Employing First Time Drug Offenders 10,489 Employing the Previously Unemployed 360,394 Enterprise Zone 13,041,478 Family Responsibility Credit 142,556 Insurance Premium Tax Credit 77,211 LA Basic Skills Training Credit 45,977
PROCESSED DURING FISCAL YEAR 2010
Nonrefundable Credits Amount Claimed
LA Biomedical Research Credit 1,745 LA Community Economic Development 34,183 LA Capital Company 211,642 Law Enforcement Degree 137,052 LCDFI Credit 6,487,406 Manufacturing Establishments 495 Motion Picture Employment of Resident 593,385 Motion Picture Infrastructure Credit 3,232,881 Motion Picture Investor Credit 119,454,073 Neighborhood Assistance Credit 13,815 New Jobs Credit 187,559 New Markets Credit 13,903,054 Nonviolent Offenders Employment Credit 12,191 Organ Donation Credit 36,481 Other 165,698 Playground Donation Credit 70,214 Ports of Louisiana Import Export Cargo 6,939 Ports of Louisiana Investor 0 Providing Employee & Dependent Health Ins. 0 Quality Jobs Program Rebate 767,044 Recycling Credit 221,758 Rehabilitation of Historic Structures 25,945,665 Research and Development Credit 3,986,215 School Readiness Credit (Includes Carry Forward from Prior Years) 378,221 Small Town Doctors/Dentists 1,308,232 Tax Equalization Credit 1,898,621 Vehicle Alternative Fuel Credit 17,379 TOTAL $ 297,349,419
PROCESSED DURING FISCAL YEAR 2010
Refundable Credits Amount Claimed
Ad Valorem on Natural Gas Storage Facilities Credit $ 183,637 Ad Valorem on OCS Vessels Credit 11,259,845 Angel Investor Credit** 2,279,331 Child Care Credit* 9,939,730 Historical Residence Credit 419,553 Inventory Tax Credit 9,562,537 LA Citizen's Insurance Credit 43,590,326 LA Earned Income Credit 45,409,738 LA Property Insurance Credit 8,408,355 Mentor-Protégé Credit 4,611 Military Hunting & Fishing License Fee Credit 108,931 Milk Producer's Credit 1,467,500 Musical & Theatrical Productions 30,024 Quality Jobs Program Rebate** 118,170
PROCESSED DURING FISCAL YEAR 2010
Refundable Credits Amount Claimed
Research & Development** 407,665 Retention & Modernization 2,045 School Readiness Business Supported Child Care 25,956 School Readiness Child Care Provider 1,298,150 School Readiness Child Care* 1,030,700 School Readiness Directors & Staff 3,043,050 School Readiness Fees & Grants to Resource & Referral Agencies 246,960 Sound Recording Credit 112,730 Sugarcane Trailer Conversion 88,363 Technology Commerce Credit 125,353 Vehicle to Alternative Fuel** 419,075 Wind and Solar Energy System 6,918,696 Other Refundable Credits 491,320 TOTAL $ 146,992,351
* These credits are both Refundable and Nonrefundable based on taxpayer’s AGI. See below for nonrefundable amounts.
** These credits are reported as both Refundable and Nonrefundable due to statutory changes. See below for nonrefundable amounts.

48
INDIVIDUAL income tax by parish (data from returns processed)
DURING FISCAL YEAR 2010 Includes both Resident and Nonresident Returns
L* Location Returns Federal AGI Federal TaxTotal
Nonrefundable Credits
LA Adjusted Tax **
Parish % of Total LA Adj. Tax
Avg. LA Adj. Tax Liability
Parish Rank
1 Acadia 23,123 $ 981,063,906 $ 92,942,418 $ 1,766,701 $ 22,759,952 0.88% $ 984 42
2 Allen 8,592 346,819,235 28,910,004 412,873 7,635,947 0.29% 889 49
3 Ascension 44,501 2,740,790,995 307,631,024 5,612,257 66,761,461 2.59% 1,500 5
4 Assumption 8,986 457,197,302 48,107,509 400,212 11,718,420 0.45% 1,304 14
5 Avoyelles 16,242 627,713,391 54,208,889 445,593 14,210,536 0.55% 875 52
6 Beauregard 12,714 586,640,112 53,614,434 530,823 12,741,125 0.49% 1,002 41
7 Bienville 5,655 250,649,263 26,201,716 154,071 5,823,126 0.22% 1,030 40
8 Bossier 46,394 2,543,450,814 282,491,030 6,893,207 55,027,561 2.13% 1,186 22
9 Caddo 109,105 6,694,011,410 913,265,538 42,228,659 151,348,663 5.87% 1,387 10
10 Calcasieu 81,941 4,259,706,563 475,846,101 4,034,550 108,313,422 4.20% 1,322 13
11 Caldwell 3,858 172,588,192 16,651,682 2,703,593 3,758,884 0.14% 974 44
12 Cameron 2,766 138,492,897 13,866,309 103,037 3,509,502 0.13% 1,269 16
13 Catahoula 3,829 152,142,819 12,936,017 300,024 3,187,970 0.12% 833 56
14 Claiborne 5,584 236,568,263 22,336,256 464,721 5,039,132 0.19% 902 47
15 Concordia 7,186 281,896,240 25,086,710 1,331,419 5,395,410 0.20% 751 62
16 DeSoto 11,187 620,283,569 81,537,154 1,215,860 15,233,655 0.59% 1,362 12
17 East Baton Rouge 188,174 11,196,363,464 1,516,430,227 46,880,432 257,797,463 10.01% 1,370 11
18 East Carroll 2,553 80,334,143 6,964,022 145,079 1,619,901 0.06% 635 63
19 East Feliciana 8,553 402,697,295 39,027,250 681,516 8,852,099 0.34% 1,035 39
20 Evangeline 12,021 550,884,101 55,622,972 322,052 13,840,842 0.53% 1,151 28
21 Franklin 7,874 294,892,430 24,067,328 460,084 6,129,505 0.23% 778 58
22 Grant 7,693 330,235,768 27,665,794 560,431 6,865,463 0.26% 892 48
23 Iberia 31,470 1,508,617,657 174,531,489 1,786,856 38,037,255 1.47% 1,209 20
24 Iberville 13,297 624,569,545 63,281,531 468,371 14,928,216 0.57% 1,123 32
25 Jackson 5,992 265,409,762 25,063,173 934,175 5,565,546 0.21% 929 46
26 Jefferson 194,252 10,544,213,404 1,297,328,316 34,018,843 252,513,359 9.80% 1,300 15
27 Jefferson Davis 11,719 529,033,668 52,792,983 364,490 13,034,011 0.50% 1,112 33
28 Lafayette 4,926 246,018,507 24,271,925 419,499 5,800,925 0.22% 1,178 23
29 Lafourche 95,411 6,086,456,604 854,014,804 11,211,517 164,377,828 6.38% 1,723 1
30 LaSalle 39,319 2,596,225,401 369,825,518 11,682,197 65,504,419 2.54% 1,666 2
31 Lincoln 16,433 863,766,328 95,822,417 1,527,030 20,112,958 0.78% 1,224 17
32 Livingston 50,019 2,552,071,624 241,924,875 2,256,640 60,446,099 2.34% 1,208 21
33 Madison 4,118 131,861,982 9,931,823 683,366 2,312,336 0.08% 562 64
34 Morehouse 11,026 433,775,947 42,929,519 1,598,615 8,974,456 0.34% 814 57
35 Natchitoches 14,616 641,960,216 67,445,550 951,272 14,329,170 0.55% 980 43
*Use these numbers as a legend for map on page 50.
**This amount is the tax due on the return before refundable credits or prepayments.

49
INDIVIDUAL income tax by parish (data from returns processed)
DURING FISCAL YEAR 2010 Includes both Resident and Nonresident Returns
L* Location Returns Federal AGI Federal TaxTotal
Nonrefundable Credits
LA Adjusted Tax **
Parish % of Total LA Adj. Tax
Avg. LA Adj. Tax Liability
Parish Rank
36 Orleans 130,760 $ 7,261,054,011 $ 1,019,853,307 $ 23,229,900 $ 183,958,582 7.14% $ 1,407 9
37 Ouachita 63,088 2,973,315,389 1,485,695,144 5,874,244 68,684,203 2.66% 1,089 34
38 Plaquemines 9,242 536,023,673 65,270,666 495,541 13,642,239 0.52% 1,476 7
39 Pointe Coupee 9,032 431,703,126 45,412,975 407,110 10,188,717 0.39% 1,128 31
40 Rapides 54,548 2,658,769,157 290,485,052 4,124,879 62,541,843 2.42% 1,147 29
41 Red River 3,275 174,783,490 20,928,223 841,325 3,852,651 0.14% 1,176 24
42 Richland 7,937 319,134,543 28,806,558 534,730 7,000,689 0.27% 882 50
43 Sabine 8,446 416,858,891 45,324,268 583,417 9,822,364 0.38% 1,163 26
44 St. Bernard 13,021 504,781,641 48,042,689 2,668,232 10,919,814 0.42% 839 55
45 St. Charles 23,136 1,341,554,522 153,756,081 999,660 34,544,458 1.34% 1,493 6
46 St. Helena 5,188 193,048,637 15,635,440 248,554 4,026,868 0.15% 776 59
47 St. James 9,645 467,864,871 46,868,950 1,520,216 10,991,596 0.42% 1,140 30
48 St. John the Baptist 20,248 898,908,044 82,788,717 739,513 21,319,162 0.82% 1,053 38
49 St. Landry 35,886 1,705,812,483 202,990,542 3,418,272 41,288,840 1.60% 1,151 27
50 St. Martin 21,758 987,980,120 103,329,638 2,101,320 23,215,224 0.90% 1,067 35
51 St. Mary 23,386 1,105,688,896 122,957,890 798,459 27,253,678 1.05% 1,165 25
52 St. Tammany 100,010 6,744,257,977 892,692,637 15,504,166 165,935,544 6.44% 1,659 3
53 Tangipahoa 45,814 2,069,856,872 208,156,742 2,789,539 48,408,835 1.87% 1,057 37
54 Tensas 1,896 72,706,342 7,151,385 77,324 1,662,939 0.06% 877 51
55 Terrebonne 46,692 2,719,512,608 340,173,685 10,642,906 67,047,395 2.60% 1,436 8
56 Union 9,012 381,866,196 34,346,517 1,497,922 7,588,399 0.29% 842 54
57 Vermillion 23,436 1,130,035,291 122,406,050 1,188,288 28,385,834 1.10% 1,211 18
58 Vernon 15,685 693,470,584 63,471,134 1,022,072 13,374,633 0.51% 853 53
59 Washington 16,152 601,365,961 48,296,981 830,347 12,261,364 0.47% 759 60
60 Webster 16,582 746,645,809 78,267,935 1,025,483 17,564,344 0.68% 1,059 36
61 West Baton Rouge 10,503 521,299,976 53,298,888 419,829 12,706,803 0.49% 1,210 19
62 West Carroll 4,284 175,867,210 14,486,846 858,247 3,217,928 0.12% 751 61
63 West Feliciana 4,378 285,681,105 37,119,732 872,910 6,788,914 0.26% 1,551 4
64 Winn 5,054 219,280,273 20,990,189 347,214 4,854,197 0.18% 960 45
TOTAL ATTRIBUTED TO A PARISH 1,849,223 $ 99,308,530,515 $ 13,143,579,168 $ 271,211,684 $ 2,376,554,674 92.27% $ 1,285 -
OUT-OF-STATE 189,089 $ 67,512,406,081 $ 12,830,239,063 $ 25,932,374 $ 198,091,905 7.69% $ 1,048 -
FOREIGN 516 $ 61,692,594 $ 15,383,466 $ 198,535 $ 372,496 0.01% $ 722 -
UNIDENTIFIED 442 $ 62,183,041 $ 12,934,654 $ 6,826 $ 374,006 0.01% $ 846 -
TOTAL 2,039,270 $ 166,944,812,231 $ 26,002,136,351 $ 297,349,419 $ 2,575,393,081 100.00% $ 1,263 -
*Use these numbers as a legend for map on page 50.
**This amount is the tax due on the return before refundable credits or prepayments.

50
INDIVIDUAL INCOME TAX (top 10 as a percent of parish total)
INDIVIDUAL income tax by parish (data from returns processed)
TOP 10 PARISHES with highest average tax liability per return
FOR FISCAL YEAR 2010
115.6% 111.7% 111.3%104.0% 100.6% 100.1% 98.9% 96.3% 94.4% 96.0%
(29) (30) (52) (63) (3) (45) (38) (55) (36) (9)

51
INDIVIDUAL income tax (by adjusted gross income bracket)
INDIVIDUAL income tax (top 10 parishes with highest average adjusted tax liability per return)
FOR FISCAL YEAR 2010
L* Top 10 Parishes Avg. LA Adjusted Tax Rank Top 10 as a Percent of Parish Average
29 Lafayette $ 1,723 1 115.56%
30 Lafourche 1,666 2 111.73%
52 St. Tammany 1,659 3 111.26%
63 West Feliciana 1,551 4 104.02%
3 Ascension 1,500 5 100.60%
45 St. Charles 1,493 6 100.13%
38 Plaquemines 1,476 7 98.99%
55 Terrebonne 1,436 8 96.31%
36 Orleans 1,407 9 94.36%
9 Caddo 1,387 10 93.02%
PARISH AVERAGE $ 1,285 – –
*Use these numbers as a legend for map on page 50.
FOR FISCAL YEAR ENDING JUNE 30, 2010
Federal AGI Range # of Returns Federal AGI Adjusted LA Tax*
Less than 0 7,651 $ (709,563,460) $ 110,127
0 104,399 0 5,196,829
1 - 25,000 755,861 10,192,168,676 109,180,282
25,001 - 50,000 484,343 17,471,305,945 330,222,000
50,001 - 75,000 267,195 16,422,415,373 342,076,594
75,001 - 100,000 164,539 14,226,563,706 320,572,328
> 100,000 255,282 109,341,921,991 1,468,034,921
TOTALS 2,039,270 $ 166,944,812,231 $ 2,575,393,081
* Depending upon the source of income, certain taxpayers may have income that is subject to Louisiana income tax, but exempt from Federal tax. For example, interest income from municipal sources.
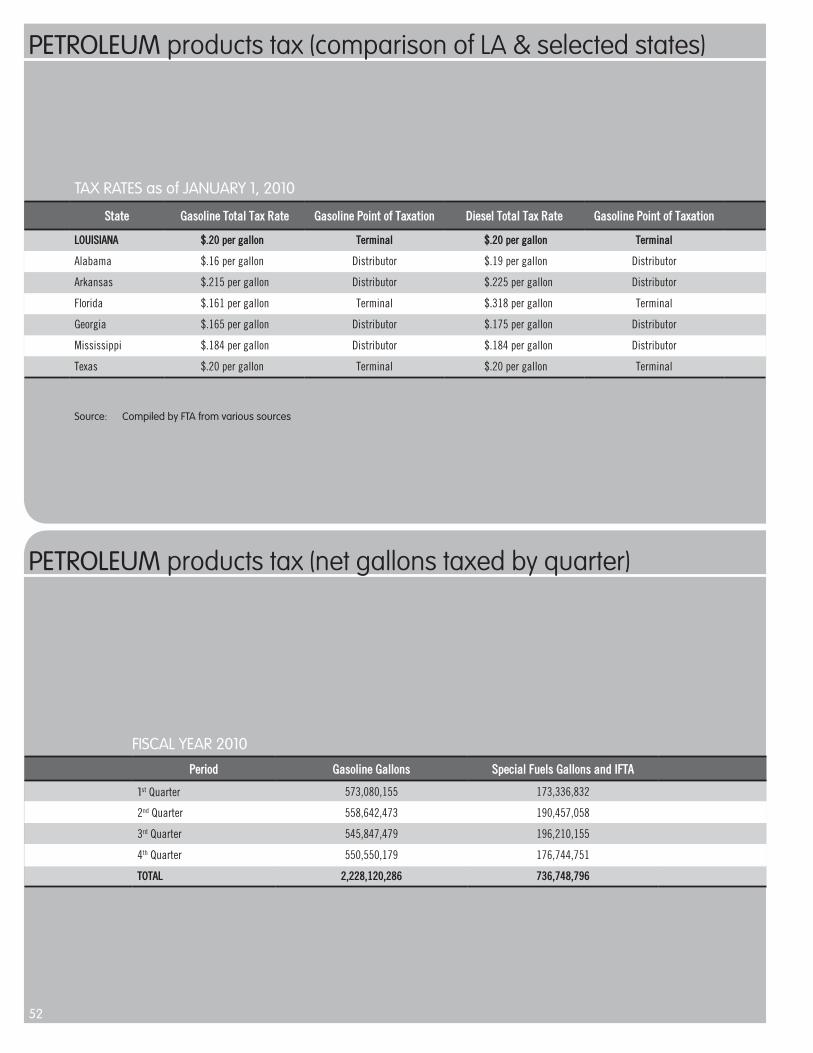
52
PETROLEUM products tax (net gallons taxed by quarter)
PETROLEUM products tax (comparison of LA & selected states)
TAX RATES as of JANUARY 1, 2010
State Gasoline Total Tax Rate Gasoline Point of Taxation Diesel Total Tax Rate Gasoline Point of Taxation
LOUISIANA $.20 per gallon Terminal $.20 per gallon Terminal
Alabama $.16 per gallon Distributor $.19 per gallon Distributor
Arkansas $.215 per gallon Distributor $.225 per gallon Distributor
Florida $.161 per gallon Terminal $.318 per gallon Terminal
Georgia $.165 per gallon Distributor $.175 per gallon Distributor
Mississippi $.184 per gallon Distributor $.184 per gallon Distributor
Texas $.20 per gallon Terminal $.20 per gallon Terminal
Source: Compiled by FTA from various sources
FISCAL YEAR 2010
Period Gasoline Gallons Special Fuels Gallons and IFTA
1st Quarter 573,080,155 173,336,832
2nd Quarter 558,642,473 190,457,058
3rd Quarter 545,847,479 196,210,155
4th Quarter 550,550,179 176,744,751
TOTAL 2,228,120,286 736,748,796

53
PETROLEUM products tax (cash collection after accrual adjustments)
PETROLEUM products tax (cash collection after accrual adjustments)
Fiscal Year Amount Collected % Change
2009-10 $ 592,931,622 -.52%
2008-09 596,015,518 -1.61%
2007-08 605,788,269 -1.12%
2006-07 612,651,175 1.10%
2005-06 605,976,677 4.14%
The State of Louisiana levies a tax on gasoline used or consumed in the state and on special fuels used to propel vehicles on Louisiana roads. The current tax rate, 20¢ per gallon for gasoline and diesel fuel, became effective January 1, 1990.
09 10
08 09
07 08
06 07
05 06
$605,976,677
$612,651,175
$605,788,269
$596,015,518
$592,931,622
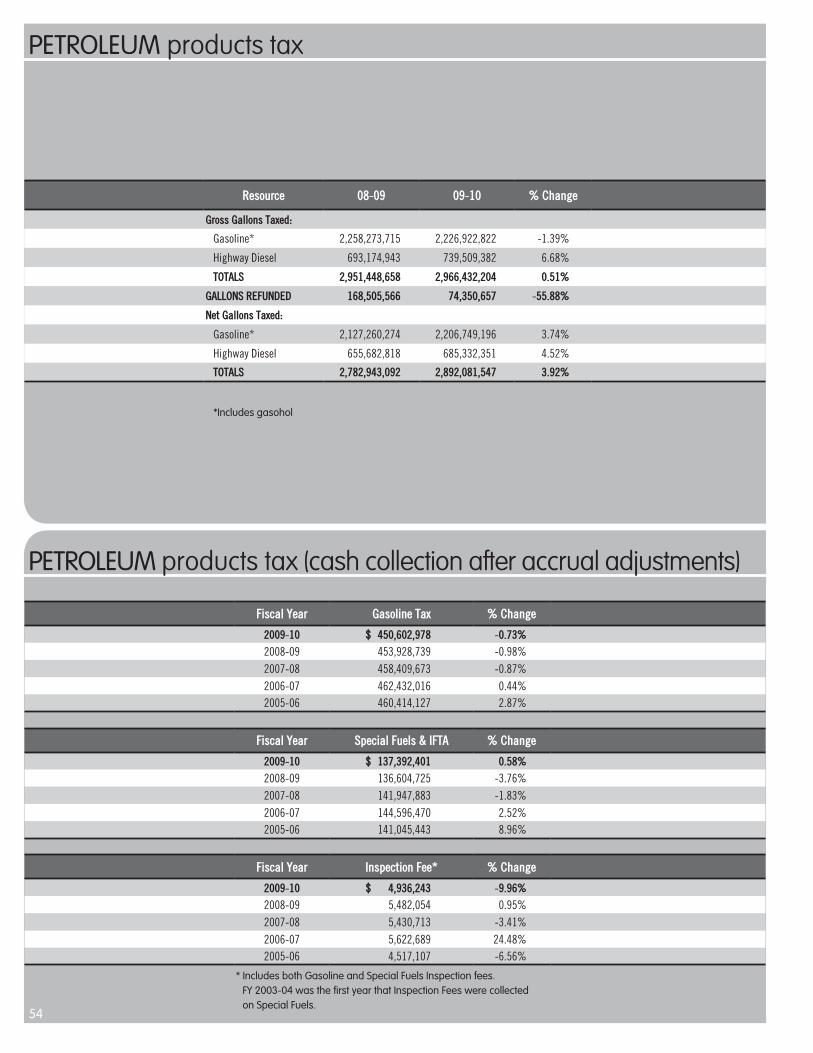
54
PETROLEUM products tax (cash collection after accrual adjustments)
PETROLEUM products tax
Resource 08-09 09-10 % Change
Gross Gallons Taxed:
Gasoline* 2,258,273,715 2,226,922,822 -1.39%
Highway Diesel 693,174,943 739,509,382 6.68%
TOTALS 2,951,448,658 2,966,432,204 0.51%
GALLONS REFUNDED 168,505,566 74,350,657 -55.88%
Net Gallons Taxed:
Gasoline* 2,127,260,274 2,206,749,196 3.74%
Highway Diesel 655,682,818 685,332,351 4.52%
TOTALS 2,782,943,092 2,892,081,547 3.92%
*Includes gasohol
Fiscal Year Gasoline Tax % Change
2009-10 $ 450,602,978 -0.73%2008-09 453,928,739 -0.98%2007-08 458,409,673 -0.87%2006-07 462,432,016 0.44%2005-06 460,414,127 2.87%
Fiscal Year Special Fuels & IFTA % Change
2009-10 $ 137,392,401 0.58%2008-09 136,604,725 -3.76%2007-08 141,947,883 -1.83%2006-07 144,596,470 2.52%2005-06 141,045,443 8.96%
Fiscal Year Inspection Fee* % Change
2009-10 $ 4,936,243 -9.96%2008-09 5,482,054 0.95%2007-08 5,430,713 -3.41%2006-07 5,622,689 24.48%2005-06 4,517,107 -6.56%
* Includes both Gasoline and Special Fuels Inspection fees. FY 2003-04 was the first year that Inspection Fees were collected on Special Fuels.

55
SALES tax (comparison of LA & selected states)
Comparison of state sales tax rates, filing period, reproduction of returns, option of local sales taxes, localities assessing tax, tax laws effective July 1, 2008
Item LOUISIANA Alabama Arkansas Florida Georgia Mississippi Texas
Tax Rate – General Sales and Use Tax 4% 4% 6% 6% 4% 7% 6.25%
State has approved local sales tax Yes Yes Yes Yes Yes Yes Yes
State has approved local use tax Yes Yes Yes Yes Yes No Yes
Filing Period Monthly Tax Liability > $500/mthQuarterly Tax Liability < 500/mth Annually State and local sales taxes due any department, agency, board, commission, or other entity of the State of Louisiana if less than $500
Monthly Monthly Tax Liability > $200/mth Quarterly Tax Liability < $200/mthAnnually Tax liability < $10 for preceding yr
Monthly Monthly Tax Liability > $100/mth Quarterly Tax Liability=$25 to $99/mthAnnually Tax Liability < $25/mth
Monthly Tax Liability = $1,000/yrQuarterly Tax Liability = $500/yrSemi-annually Tax Liability = $100/yr
Monthly Monthly Tax Liability > $200/mth Quarterly Tax Liability < $600/qtr Annually Tax liability < $600/yr
Monthly Annual Tax Liability > $3,600/yrQuarterly Tax Liability = $300 to $3,599/yrAnnually Tax Liability = $0 to $299/yr
Monthly Tax Liability > $24,000/yrQuarterly Tax Liability < $24,000/yrAnnually Tax Liability < $16,000/yr
Does state accept reproductions of the returns?
No Yes, amended returns only Yes No No No Yes
Percent or range of rates for local sales tax
1% - 7% 1% - 5% .25% - 4% .5% - 1.5% 1% - 4% .25% - 3% .125% - 2%
Localities assessing tax
City, parish, school board,
police jury, and special districts
City, county City, county County City (Atlanta), county City, county
City, county, special purpose
districts
Source: 2008 Multistate Corporate Tax Guide, Volume II

56
SALES tax collections (cash collection after accrual adjustments)
SALES tax collections (cash collection after accrual adjustments)
FIVE-YEAR TAX COLLECTION COMPARISON
Fiscal Year Amount Collected % Change
2009-10 $ 2,434,891,682 -12.46%
2008-09 2,781,539,531 -3.14%
2007-08 2,871,728,474 0.64%
2006-07 2,853,501,979 4.30%
2005-06 2,735,795,248 17.01%
The 4% state sales tax rate is composed of 3.97% general sales tax and .03% Louisiana Tourism Promotion District sales tax. The tax is levied on retail sales of tangible personal property, goods used or stored for use in Louisiana, leases and rentals of tangible personal property, and sales of certain services.
Although many exemptions are provided by statute, most exemptions were suspended from 1986 to July 1, 2009.
FIVE-YEAR TAX COLLECTION COMPARISON
09 10
08 09
07 08
06 07
05 06
$2,735,795,248
$2,853,501,979
$2,781,539,531
$2,871,728,474
$2,434,891,682

57
SALES tax quarterly collections (based on cash collections)
SALES tax quarterly collections (based on cash collections)
FISCAL YEAR ENDING JUNE 30th Cash Receipts in Millions of Dollars
FY 2010 • BY QUARTER In Millions of Dollars
TOTAL $2,445.9
2008 2009 2010
$2,883.4 $2,800.0
$2,445.9
JUNE
MARCH
DECEMBER
SEPTEMBER
SEPT 647.5
(25.66%)
DEC 608.4
(24.87%)
JUN 648.9
(26.53%)
MAR 561.1
(22.94%)
730.3 749.0 627.5
715.7 714.9608.4
728.5 695.9
561.1
708.9 640.2
648.9

58
STATE SALES & USE taxes (based on cash collections)
STATE SALES & USE taxes (based on cash collections)
FOUR-YEAR COMPARISON Fiscal Years 2007 to 2010 (In Millions of Dollars)
FOUR-YEAR COMPARISON
Fiscal Year Sales of TPP & Services Business Use Consumer Use General Fund Amount % Change
2010 $ 2,067,000,283 $ 398,072,038 $ 70,162 $ 2,465,142,483 -11.96%
2009 $ 2,249,683,403 $ 550,315,236 $ 70,834 $ 2,800,069,473 -2.89%
2008 $ 2,335,352,320 $ 547,919,933 $ 41,598 $ 2,883,313,851 2.90%
2007 $ 2,329,569,530 $ 472,272,079 $ 127,970 $ 2,801,969,579 2.59%
USE
SALES
2007 2008 2009 2010
$2,883.3 $2,800.0$2,801.9
$2,465.1

59
SALES tax (gross sales of tangible personal property by bracket)
SALES tax (gross sales tax by amount due)
FISCAL YEAR ENDING JUNE 30, 2010
Amount of Tax Due Tax Due by Bracket % of Tax Due # of Returns % of Returns
No Tax Due - 99.99 $ 3,832,699 0.15% 122,088 19.77%
100.00 - 199.99 7,656,561 0.30% 52,420 8.49%
200.00 - 499.99 32,868,336 1.27% 97,984 15.87%
500.00 - 999.99 70,132,450 2.71% 96,500 15.63%
1,000.00 - 1,999.99 137,524,225 5.30% 96,231 15.59%
2,000.00 - 2,999.99 111,788,192 4.31% 45,630 7.39%
3,000.00 - 3,999.99 90,498,971 3.49% 26,190 4.24%
4,000.00 - 4,999.99 72,819,681 2.81% 16,314 2.64%
5,000.00 - 9,999.99 227,037,851 8.76% 32,812 5.31%
10,000.00 - 24,999.99 280,494,932 10.82% 18,572 3.01%
25,000.00 - 49,999.99 194,916,449 7.52% 5,648 0.91%
50,000.00 - 99,999.99 212,512,392 8.20% 3,355 0.54%
100,000.00 & Over 1,150,348,102 44.37% 3,678 0.60%
TOTAL $ 2,592,430,841 100.00% 617,422 100.00%
FISCAL YEAR ENDING JUNE 30, 2010
Range of Gross Sales Total Gross Sales % of Gross Sales # of Returns % of Returns
0 - 499 $ (4,157,472) -0.01% 48,377 7.84%
500- 999 18,550,053 0.03% 25,340 4.10%
1,000 - 1,999 51,182,867 0.08% 34,941 5.66%
2,000 - 2,999 64,395,332 0.10% 26,001 4.21%
3,000 - 3,999 75,061,828 0.12% 21,558 3.49%
4,000 - 4,999 82,893,246 0.13% 18,483 2.99%
5,000 - 9,999 521,576,354 0.80% 71,118 11.52%
10,000 - 24,999 2,053,963,037 3.17% 123,244 19.96%
25,000 - 49,999 3,437,674,629 5.30% 96,190 15.58%
50,000 - 99,999 5,056,471,957 7.80% 71,801 11.63%
100,000 - 249,999 7,495,683,710 11.57% 49,118 7.96%
250,000 - 499,000 5,372,504,827 8.29% 15,636 2.53%
500,000 - 999,999 4,956,442,854 7.65% 7,190 1.16%
1,000,000 & Over 35,628,527,792 54.97% 8,425 1.36%
TOTALS $ 64,810,771,014 100.00% 617,422 100.00%

60
SALES & USE taxes (total gross tax reported by parish)
L* Parish FYE 6/09 FYE 6/10 PercentChange
FYE 2009Per Capita
FYE 09PC Rank
FYE 2010Per Capita
FYE 10PC Rank
1 Acadia $ 21,545,725 $ 16,695,714 -22.51% $ 359 24 $ 278 27
2 Allen 2,813,924 2,717,519 -3.43% 110 60 106 61
3 Ascension 68,538,343 46,867,897 -31.62% 673 8 447 13
4 Assumption 3,173,381 2,714,354 -14.46% 139 54 119 58
5 Avoyelles 6,654,697 6,298,681 -5.35% 157 52 148 52
6 Beauregard 6,849,542 6,815,610 -0.50% 196 45 192 42
7 Bienville 6,401,650 6,883,796 7.53% 435 16 467 12
8 Bossier 36,630,251 36,477,481 -0.42% 332 25 327 20
9 Caddo 158,252,775 141,188,315 -10.78% 626 11 557 7
10 Calcasieu 113,127,229 80,959,436 -28.44% 609 12 432 14
11 Caldwell 1,751,990 1,569,239 -10.43% 169 51 150 51
12 Cameron 1,457,382 1,088,212 -25.33% 201 43 165 49
13 Catahoula 1,843,411 1,401,949 -23.95% 175 48 134 57
14 Claiborne 4,016,979 3,182,512 -20.77% 249 36 197 38
15 Concordia 6,164,593 5,487,996 -10.98% 323 27 289 25
16 DeSoto 7,480,888 7,228,230 -3.38% 283 32 274 28
17 East Baton Rouge 281,564,677 234,756,037 -16.62% 657 9 540 8
18 East Carroll 2,056,340 1,856,980 -9.69% 252 35 229 33
19 East Feliciana 1,829,656 1,600,587 -12.52% 88 62 76 62
20 Evangeline 4,835,100 4,831,825 -0.07% 136 57 137 55
21 Franklin 3,500,538 3,867,899 10.49% 175 49 195 41
22 Grant 888,272 858,575 -3.34% 44 64 43 64
23 Iberia 27,989,191 24,112,237 -13.85% 373 23 321 22
24 Iberville 40,265,884 27,288,037 -32.23% 1,237 1 840 2
25 Jackson 1,954,122 2,117,560 8.36% 129 58 141 53
26 Jefferson 294,257,733 252,273,126 -14.27% 675 7 569 6
27 Jefferson Davis 7,363,242 6,801,578 -7.63% 236 37 219 34
28 Lafayette 169,052,819 144,149,399 -14.73% 817 3 683 4
29 Lafourche 30,649,543 27,198,328 -11.26% 331 26 290 24
30 LaSalle 4,142,786 3,461,898 -16.44% 295 29 248 31
31 Lincoln 17,470,054 16,897,182 -3.28% 410 18 390 15
32 Livingston 25,352,349 21,579,944 -14.88% 211 41 175 47
33 Madison 1,440,368 1,282,693 -10.95% 122 59 113 60
34 Morehouse 8,271,875 7,622,369 -7.85% 289 31 270 29
35 Natchitoches 8,725,419 8,169,758 -6.37% 220 39 208 36
36 Orleans 248,141,849 170,421,801 -31.32% 796 4 480 11
37 Ouachita 104,876,065 96,264,686 -8.21% 699 6 635 5
38 Plaquemines 8,594,265 6,843,537 -20.37% 404 19 327 21
39 Pointe Coupee 4,769,524 4,415,790 -7.42% 213 40 197 39
* Use these numbers as a legend for map on pages 62 and 63.
These are unaudited figures and reflect the filing location where the tax was reported, which is not necessarily the same parish where the tax was collected.
** Population based on U.S. Census Bureau estimate for July 1, 2009 - base April 1, 2000

61
SALES & USE taxes (total gross tax reported by parish)
L* Parish FYE 6/09 FYE 6/10 PercentChange
FYE 2009Per Capita
FYE 09PC Rank
FYE 2010Per Capita
FYE 10PC Rank
40 Rapides 64,946,781 49,396,613 -23.94% 488 15 369 18
41 Red River 945,691 1,056,277 11.69% 104 61 117 59
42 Richland 3,705,972 3,860,170 4.16% 181 47 189 45
43 Sabine 4,716,798 4,668,897 -1.02% 199 44 197 40
44 St. Bernard 19,305,882 15,166,462 -21.44% 512 14 373 17
45 St. Charles 54,394,019 37,851,662 -30.41% 1,055 2 733 3
46 St. Helena 683,858 663,248 -3.01% 65 63 63 63
47 St. James 8,520,804 5,240,886 -38.49% 401 20 249 30
48 St. John the Baptist 30,174,064 23,256,665 -22.92% 642 10 494 10
49 St. Landry 20,866,162 17,558,001 -15.85% 226 38 190 43
50 St. Martin 9,041,350 9,860,418 9.06% 174 50 189 46
51 St. Mary 28,380,213 19,443,928 -31.49% 556 13 383 16
52 St. Tammany 88,778,893 71,329,131 -19.66% 389 22 308 23
53 Tangipahoa 31,628,634 29,026,545 -8.23% 270 33 245 32
54 Tensas 1,163,745 1,142,096 -1.86% 204 42 204 37
55 Terrebonne 44,881,590 38,834,792 -13.47% 413 17 355 19
56 Union 7,058,007 6,384,695 -9.54% 311 28 283 26
57 Vermillion 22,137,101 10,687,840 -51.72% 395 21 190 44
58 Vernon 6,250,850 6,547,162 4.74% 137 55 140 54
59 Washington 13,232,177 9,580,703 -27.60% 291 30 210 35
60 Webster 10,381,710 20,316,139 95.69% 255 34 501 9
61 West Baton Rouge 16,809,078 22,418,974 33.37% 745 5 990 1
62 West Carroll 1,613,682 1,739,978 7.83% 140 53 154 50
63 West Feliciana 2,047,113 2,049,106 0.10% 136 56 136 56
64 Winn 2,852,002 2,577,776 -9.62% 185 46 168 48
TOTAL PARISHES $ 2,239,210,607 $ 1,846,906,931 -17.52% - - - -
TOTAL OUT OF STATE $ 914,258,662 $ 745,523,910 -18.46% - - - -
TOTAL $ 3,153,469,269 $ 2,592,430,841 -17.79% - - - -
* Use these numbers as a legend for map on pages 62 and 63.
These are unaudited figures and reflect the filing location where the tax was reported, which is not necessarily the same parish where the tax was collected.
** Population based on U.S. Census Bureau estimate for July 1, 2009 - base April 1, 2000

62
SALES & USE taxes (parishes with more than a 20% increase)
SALES & USE taxes (parishes with an increase in gross tax reported)
This chart shows the percentage change in gross sales and use tax due from Fiscal Year 2009 to Fiscal Year 2010.
L* Parish Percent Change Rank
60 Webster 95.69% 1
61 West Baton Rouge 33.37% 2
41 Red River 11.69% 3
21 Franklin 10.49% 4
50 St. Martin 9.06% 5
25 Jackson 8.36% 6
62 West Carroll 7.83% 7
7 Bienville 7.53% 8
58 Vernon 4.74% 9
42 Richland 4.16% 10
63 West Feliciana 0.10% 11
* Use these numbers as a legend for the map below.

63
SALES & USE taxes (top 10 parishes)
SALES & USE taxes (top 10 parishes)
L* Parish FYE 2010 Per Capita Rank
61 West Baton Rouge 990 1
24 Iberville 840 2
45 St. Charles 733 3
28 Lafayette 683 4
37 Ouachita 635 5
26 Jefferson 569 6
9 Caddo 557 7
17 East Baton Rouge 540 8
60 Webster 501 9
48 St. John the Baptist 494 10
* Use these numbers as a legend for the map below.
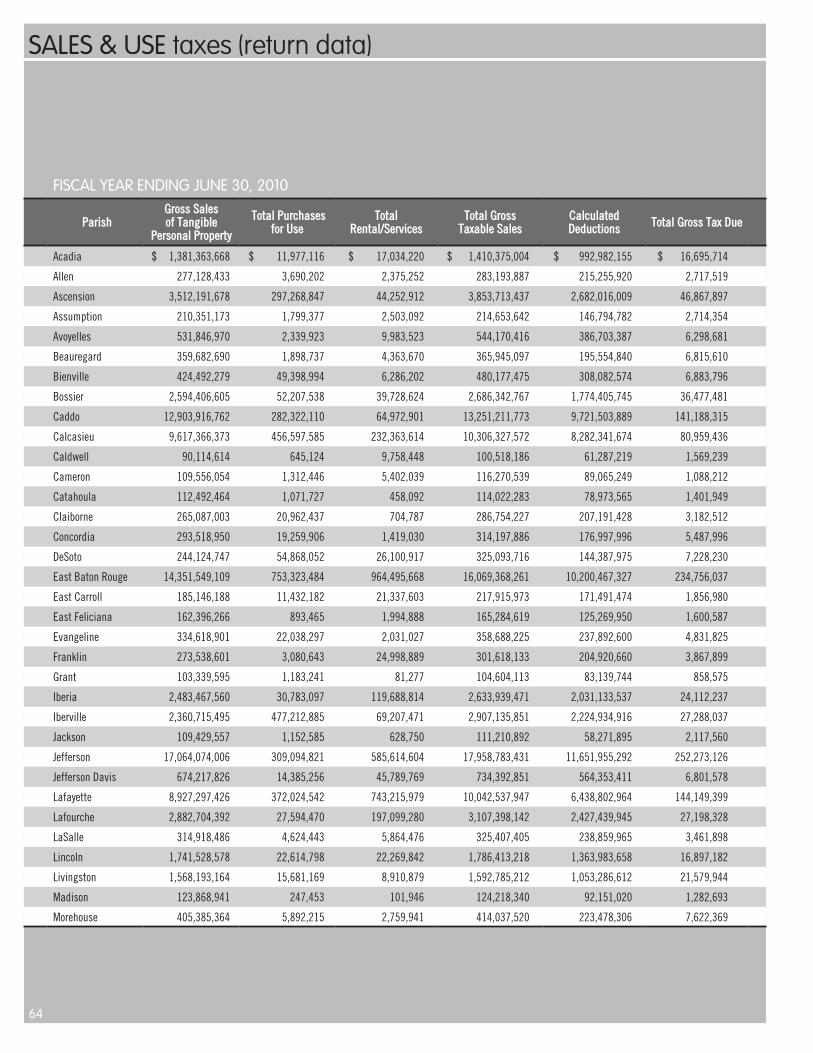
64
SALES & USE taxes (return data)
FISCAL YEAR ENDING JUNE 30, 2010
Parish Gross Sales of Tangible
Personal Property
Total Purchases for Use
Total Rental/Services
Total Gross Taxable Sales
Calculated Deductions Total Gross Tax Due
Acadia $ 1,381,363,668 $ 11,977,116 $ 17,034,220 $ 1,410,375,004 $ 992,982,155 $ 16,695,714
Allen 277,128,433 3,690,202 2,375,252 283,193,887 215,255,920 2,717,519
Ascension 3,512,191,678 297,268,847 44,252,912 3,853,713,437 2,682,016,009 46,867,897
Assumption 210,351,173 1,799,377 2,503,092 214,653,642 146,794,782 2,714,354
Avoyelles 531,846,970 2,339,923 9,983,523 544,170,416 386,703,387 6,298,681
Beauregard 359,682,690 1,898,737 4,363,670 365,945,097 195,554,840 6,815,610
Bienville 424,492,279 49,398,994 6,286,202 480,177,475 308,082,574 6,883,796
Bossier 2,594,406,605 52,207,538 39,728,624 2,686,342,767 1,774,405,745 36,477,481
Caddo 12,903,916,762 282,322,110 64,972,901 13,251,211,773 9,721,503,889 141,188,315
Calcasieu 9,617,366,373 456,597,585 232,363,614 10,306,327,572 8,282,341,674 80,959,436
Caldwell 90,114,614 645,124 9,758,448 100,518,186 61,287,219 1,569,239
Cameron 109,556,054 1,312,446 5,402,039 116,270,539 89,065,249 1,088,212
Catahoula 112,492,464 1,071,727 458,092 114,022,283 78,973,565 1,401,949
Claiborne 265,087,003 20,962,437 704,787 286,754,227 207,191,428 3,182,512
Concordia 293,518,950 19,259,906 1,419,030 314,197,886 176,997,996 5,487,996
DeSoto 244,124,747 54,868,052 26,100,917 325,093,716 144,387,975 7,228,230
East Baton Rouge 14,351,549,109 753,323,484 964,495,668 16,069,368,261 10,200,467,327 234,756,037
East Carroll 185,146,188 11,432,182 21,337,603 217,915,973 171,491,474 1,856,980
East Feliciana 162,396,266 893,465 1,994,888 165,284,619 125,269,950 1,600,587
Evangeline 334,618,901 22,038,297 2,031,027 358,688,225 237,892,600 4,831,825
Franklin 273,538,601 3,080,643 24,998,889 301,618,133 204,920,660 3,867,899
Grant 103,339,595 1,183,241 81,277 104,604,113 83,139,744 858,575
Iberia 2,483,467,560 30,783,097 119,688,814 2,633,939,471 2,031,133,537 24,112,237
Iberville 2,360,715,495 477,212,885 69,207,471 2,907,135,851 2,224,934,916 27,288,037
Jackson 109,429,557 1,152,585 628,750 111,210,892 58,271,895 2,117,560
Jefferson 17,064,074,006 309,094,821 585,614,604 17,958,783,431 11,651,955,292 252,273,126
Jefferson Davis 674,217,826 14,385,256 45,789,769 734,392,851 564,353,411 6,801,578
Lafayette 8,927,297,426 372,024,542 743,215,979 10,042,537,947 6,438,802,964 144,149,399
Lafourche 2,882,704,392 27,594,470 197,099,280 3,107,398,142 2,427,439,945 27,198,328
LaSalle 314,918,486 4,624,443 5,864,476 325,407,405 238,859,965 3,461,898
Lincoln 1,741,528,578 22,614,798 22,269,842 1,786,413,218 1,363,983,658 16,897,182
Livingston 1,568,193,164 15,681,169 8,910,879 1,592,785,212 1,053,286,612 21,579,944
Madison 123,868,941 247,453 101,946 124,218,340 92,151,020 1,282,693
Morehouse 405,385,364 5,892,215 2,759,941 414,037,520 223,478,306 7,622,369

65
SALES & USE taxes (return data)
FISCAL YEAR ENDING JUNE 30, 2010
Parish Gross Sales of Tangible
Personal Property
Total Purchases for Use
Total Rental/Services
Total Gross Taxable Sales
Calculated Deductions Total Gross Tax Due
Natchitoches $ 552,137,453 $ 15,110,288 $ 4,187,540 $ 571,435,281 $ 367,191,325 $ 8,169,758
Orleans 8,890,804,192 515,133,197 1,409,368,413 10,815,305,802 6,554,760,774 170,421,801
Ouachita 4,544,541,874 146,830,219 65,436,386 4,756,808,479 2,350,191,328 96,264,686
Plaquemines 896,266,597 14,990,888 31,832,434 943,089,919 772,001,492 6,843,537
Pointe Coupee 331,429,063 4,099,233 18,660,149 354,188,445 243,793,695 4,415,790
Rapides 2,858,352,281 133,798,294 250,525,625 3,242,676,200 2,007,760,873 49,396,613
Red River 74,244,369 647,148 2,444,084 77,335,601 50,928,685 1,056,277
Richland 461,963,439 49,649,148 1,482,519 513,095,106 416,590,845 3,860,170
Sabine 357,482,652 5,240,964 2,872,034 365,595,650 248,873,231 4,668,897
St. Bernard 4,343,692,603 144,865,565 19,073,402 4,507,631,570 4,128,470,015 15,166,462
St. Charles 7,740,389,335 521,806,088 62,480,082 8,324,675,505 7,378,383,957 37,851,662
St. Helena 90,319,571 3,226,015 1,032,624 94,578,210 77,997,004 663,248
St. James 7,257,753,508 74,153,167 21,728,501 7,353,635,176 7,222,613,032 5,240,886
St. John the Baptist 6,564,175,465 183,358,699 26,805,901 6,774,340,065 6,192,923,441 23,256,665
St. Landry 1,233,280,816 25,591,728 29,345,084 1,288,217,628 849,267,598 17,558,001
St. Martin 884,516,758 7,779,483 24,590,789 916,887,030 670,376,591 9,860,418
St. Mary 1,771,805,015 23,257,233 136,965,262 1,932,027,510 1,445,929,317 19,443,928
St. Tammany 21,314,016,735 75,997,524 76,531,362 21,466,545,621 19,683,317,340 71,329,131
Tangipahoa 2,329,007,573 226,914,581 18,531,710 2,574,453,864 1,848,790,233 29,026,545
Tensas 112,470,915 18,751 3,726,511 116,216,177 87,663,765 1,142,096
Terrebonne 3,487,121,817 61,122,564 434,623,715 3,982,868,096 3,011,998,286 38,834,792
Union 238,738,053 19,327,692 185,943 258,251,688 98,634,311 6,384,695
Vermilion 1,212,290,398 10,798,813 114,869,517 1,337,958,728 1,070,762,737 10,687,840
Vernon 366,967,941 3,426,708 1,421,642 371,816,291 208,137,234 6,547,162
Washington 782,196,912 38,315,867 6,515,859 827,028,638 587,511,054 9,580,703
Webster 1,261,801,478 238,124,874 5,430,143 1,505,356,495 997,453,032 20,316,139
West Baton Rouge 4,547,952,918 320,526,570 9,901,516 4,878,381,004 4,317,906,649 22,418,974
West Carroll 104,472,884 454,169 51,418 104,978,471 61,479,014 1,739,978
West Feliciana 117,974,876 5,034,923 6,647,100 129,656,899 78,429,248 2,049,106
Winn 320,259,202 2,026,623 1,177,853 323,463,678 259,019,290 2,577,776
Out-of-State $ 84,883,380,139 $ 3,062,771,955 $ 3,879,557,430 $ 91,825,709,524 $ 73,187,611,769 $ 745,523,910
TOTAL $ 256,925,836,750 $ 9,265,278,138 $ 9,951,800,974 $ 276,142,915,862 $ 211,332,144,848 $ 2,592,430,841

66
SEVERANCE oil (15 major oil producing states)
SEVERANCE tax (comparison of LA & selected states)
State Oil Severance Full Tax Rate
Oil Severance Taxation Base
Gas Severance Full Tax Rate
Gas SeveranceTaxation Base
LOUISIANA 12.50% Value at the time and place of severance 33.1¢ Per MCF
Alabama 8.00% Gross Value at pointof production 8.00% Gross value at point
of production
Arkansas 5.00% Value for wells producing more than 10 bbs./day 5.00% Market value of gas sold
Florida 8.00% Gross Value at point of production 56.3¢ Per MCF
Georgia No Severance Tax on oil and gas production
Mississippi 6.00% Value at point of production 6.00% Value at point of production
Texas 4.6% Market value of Oil(Production Tax) Tax on the Production of Oil 7.50% Market value of gas produced
and saved in the state
AS of SEPTEMBER 2010
Annual Production (Million Barrels)
Rank State 2007 2008 2009
1 Texas 396.9 398 403.7
2 Alaska 263.6 249.9 235.5
3 California 216.8 214.5 207
4 North Dakota 45.1 62.8 79.7
5 LOUISIANA 76.7 73.1 69
6 Oklahoma 61 64.1 67
7 New Mexico 58.8 59.4 61.1
8 Wyoming 54.1 52.9 51.3
9 Kansas 36.5 39.6 39.4
10 Montana 34.8 31.5 27.6
11 Colorado 23.2 24.1 28.3
12 Mississippi 20.4 22.1 23.2
13 Utah 19.5 22 22.9
14 Illinois 9.6 9.4 9
15 Alabama 7.2 7.5 7.1
Source: Energy Information Administration website

67
SEVERANCE tax (comparison of oil, timber, and gas tax reported)
SEVERANCE tax (comparison of oil, timber, and gas tax reported)
FISCAL YEARS 2008 through 2010
Year Oil Timber Gas Total % Change
2010 $ 462,436,755 $ 11,990,850 $ 282,430,592 $ 756,858,197 -16.98%
2009 $ 606,539,579 $ 14,007,992 $ 291,155,146 $ 911,702,717 -12.07%
2008 $ 703,116,080 $ 16,351,112 $ 317,376,750 $ 1,036,843,942 –
Note: Amounts represent tax reported on tax returns.
Severance tax rates on timber and minerals
1. Timber a. Trees and timber – 2.25 percent of current stumpage
value as determined by the Louisiana Forestry Commission
b. Pulpwood – 5 percent of current stumpage value as determined by the Louisiana Forestry Commission
c. Forest products grown on reforested lands – 6 percent of value. This tax is in lieu of all other taxes.
2. Sulphur – $1.03 per long ton of 2,240 pounds
3. Salt – $.06 per ton of 2,000 pounds
4. Coal – $.10 per ton
5. Ores – $.10 per ton
6. Marble – $.20 per ton
7. Stone – $.03 per ton
8. Sand – $.06 per ton
9. Shells – $.06 per ton
10. Salt content in brine, when used in the manufacture of other products and not marketed as salt — $.005 per ton
11. Lignite – $.12 per ton
2008 2009 2010
$756,858,197
$911,702,717
GAS
TIMBER
OIL
$1,036,843,942

68
SEVERANCE tax (collections by parish)
FOR FISCAL YEAR 2010
Parish Oil/Condensate Gas Timber/Pulpwood Minerals Total Tax Reported*
Acadia $ 7,630,368.80 $ 1,107,949.94 $ 163,344.95 $ 9,224.12 $ 8,910,887.81
Allen 2,117,334.95 1,163,634.12 566,717.64 26,072.82 3,873,759.53
Ascension 318,252.38 6,531.21 18,497.04 – 343,280.63
Assumption 3,081,578.24 1,271,431.96 5,194.16 34,592.77 4,392,797.14
Avoyelles 502,418.98 685.65 77,002.25 3,852.07 583,958.95
Beauregard 1,802,312.28 780,819.04 894,132.95 38.10 3,477,302.37
Bienville 2,355,076.67 17,899,649.44 722,154.75 6.13 20,976,887.00
Bossier 4,982,116.48 18,177,819.85 189,585.75 463.72 23,349,985.80
Caddo 8,064,667.45 13,577,452.33 122,286.43 212.41 21,764,618.63
Calcasieu 16,316,102.53 4,559,612.11 131,079.83 13,351.41 21,020,145.89
Caldwell 57,987.04 377,461.97 262,645.19 – 698,094.21
Cameron 25,869,738.26 13,580,625.68 7.29 – 39,450,371.23
Catahoula 937,576.48 (5,567.47) 51,100.16 464.28 983,573.45
Claiborne 10,792,032.88 3,139,975.58 472,853.34 – 14,404,861.81
Concordia 174,152.89 23,506.19 13,392.75 – 211,051.82
DeSoto 3,468,915.38 46,255,670.87 385,843.06 409,765.04 50,520,194.34
East Baton Rouge 5,299,268.72 1,281,562.35 36,022.48 20,477.93 6,637,331.48
East Carroll – (2,862.97) 1,672.38 – (1,190.59)
East Feliciana 21,125.56 9,339.46 155,155.30 9,050.53 194,670.84
Evangeline 9,583,658.94 656,205.35 288,404.27 – 10,528,268.56
Franklin 199,258.81 128,587.34 20,589.35 – 348,435.50
Grant 1,275,146.76 40,227.15 276,679.16 0.37 1,592,053.45
Iberia 18,469,767.70 6,418,578.97 188.55 208,229.71 25,096,764.93
Iberville 8,316,936.89 490,723.81 50,330.95 2,246.48 8,860,238.13
Jackson 278,556.50 12,810,645.72 469,867.27 – 13,559,069.49
Jefferson 10,852,683.84 3,506,505.47 149.95 160,055.39 14,519,394.65
Jefferson Davis 6,747,253.65 2,389,526.02 27,247.38 16,421.02 9,180,448.07
Lafayette 3,711,884.08 1,284,552.82 9,172.56 – 5,005,609.47
Lafourche 48,049,426.67 8,794,217.93 7,213.95 2,724.87 56,853,583.42
LaSalle 13,751,042.80 2,004,599.67 392,307.25 2,295.29 16,150,245.01
Lincoln 5,890,007.85 9,938,717.66 237,826.81 113.76 16,066,666.07
Livingston 651,920.64 155,501.16 200,196.65 33,101.97 1,040,720.42
Madison 12,238.68 250.91 41,334.89 – 53,824.48
* Tax reported amounts are based on tax return data before adjustments.

69
SEVERANCE tax (collections by parish)
FOR FISCAL YEAR 2010
Parish Oil/Condensate Gas Timber/Pulpwood Minerals Total Tax Reported*
Morehouse $ – $ 29,947.53 $ 80,245.40 $ 12,006.80 $ 122,199.73
Natchitoches 93,232.00 64,474.15 422,790.00 – 580,496.15
Orleans (7,154.34) 34,736.78 1,582.72 – 29,165.16
Ouachita 289,289.48 756,580.65 199,741.32 6,958.92 1,252,570.37
Plaquemines 123,772,267.43 15,914,252.05 287.75 17,181.90 139,703,989.12
Pointe Coupee 4,400,870.39 16,147,112.32 61,737.83 – 20,609,720.54
Rapides 1,732,307.70 219,878.56 561,919.54 16,293.42 2,530,399.22
Red River 74,583.35 18,619,553.70 126,955.66 58,222.20 18,879,314.92
Richland 104,683.33 25,815.61 9,512.23 – 140,011.17
Sabine 183,370.32 1,174,577.51 622,106.03 – 1,980,053.86
St. Bernard 2,353,705.85 3,135,058.71 55.70 9,049.08 5,497,869.33
St. Charles 4,055,949.47 1,455,623.78 124.61 36,209.98 5,547,907.84
St. Helena 2,340,636.63 71,044.23 375,366.85 32,897.23 2,819,944.94
St. James 528,645.00 213,946.78 3,995.34 260.99 746,848.11
St. John the Baptist 255,779.45 162.13 9,477.26 – 265,418.84
St. Landry 2,663,120.25 543,338.76 156,940.49 – 3,363,399.50
St. Martin 7,423,715.50 797,868.17 9,992.63 49,378.70 8,280,954.99
St. Mary 23,158,002.09 4,328,776.89 1,378.44 169,677.06 27,657,834.47
St. Tammany 9,813.06 495.51 103,832.97 83,174.14 197,315.68
Tangipahoa 4,613.79 – 166,741.30 28,919.49 200,274.58
Tensas 947,016.26 50,480.41 23,516.11 – 1,021,012.78
Terrebonne 33,792,124.89 19,220,935.12 3,852.30 133.22 53,017,045.53
Union 312,520.16 35,967.16 516,786.61 – 865,273.93
Vermillion 20,744,570.19 15,464,970.03 14,782.55 – 36,224,322.77
Vernon 1,388,148.91 231,602.32 1,098,152.95 17,744.65 2,735,648.83
Washington 6,706.18 16,838.89 188,517.62 25,078.24 237,140.92
Webster 6,981,305.98 11,082,926.45 155,877.38 20,436.34 18,240,546.16
West Baton Rouge 2,357,687.48 875,140.62 6,307.21 – 3,239,135.31
West Carroll 19,241.01 12,995.26 3,428.36 – 35,664.63
West Feliciana 41,191.18 578.32 53,061.86 5,995.28 100,826.63
Winn 828,001.74 80,776.43 721,586.16 3,552.51 1,633,916.84
TOTALS $ 462,436,754.51 $ 282,430,592.12 $ 11,990,849.87 $ 1,545,930.34 $ 758,404,126.84
* Tax reported amounts are based on tax return data before adjustments.

70
SEVERANCE tax (taxable barrels reported by parish)
FOR FISCAL YEAR ENDING JUNE 30, 2010
L* Parish Oil Bbls Rank
38 Plaquemines 14,468,209.82 1
29 Lafourche 5,845,191.84 2
55 Terrebonne 4,136,111.10 3
26 Jefferson 3,438,112.58 4
51 St. Mary 3,096,178.30 5
12 Cameron 2,899,804.32 6
23 Iberia 2,480,233.58 7
57 Vermillion 2,409,431.79 8
30 LaSalle 2,267,723.03 9
10 Calcasieu 2,024,572.61 10
9 Caddo 1,959,998.01 11
27 Jefferson Davis 1,812,627.72 12
14 Claiborne 1,715,112.25 13
8 Bossier 1,712,962.57 14
20 Evangeline 1,525,779.11 15
1 Acadia 1,137,077.42 16
24 Iberville 951,379.22 17
60 Webster 934,399.82 18
50 St. Martin 925,206.92 19
31 Lincoln 674,473.78 20
17 East Baton Rouge 565,974.37 21
39 Pointe Coupee 517,093.76 22
45 St. Charles 469,664.35 23
6 Beauregard 421,493.47 24
28 Lafayette 409,095.94 25
16 DeSoto 397,168.86 26
64 Winn 348,654.36 27
4 Assumption 304,363.56 28
44 St. Bernard 303,663.21 29
7 Bienville 302,237.81 30
49 St. Landry 301,163.41 31
61 West Baton Rouge 273,995.67 32
2 Allen 260,690.44 33
46 Saint Helena 254,650.80 34
40 Rapides 194,228.13 35
13 Catahoula 181,743.84 36
54 Tensas 171,343.04 37
22 Grant 161,345.34 38
58 Vernon 112,293.76 39
5 Avoyelles 95,605.96 40
15 Concordia 93,818.36 41
32 Livingston 72,445.07 42
47 St. James 64,269.66 43
43 Sabine 55,952.24 44
56 Union 46,279.90 45
FOR FISCAL YEAR ENDING JUNE 30, 2010
L* Parish Oil Bbls Rank
3 Ascension 38,077.28 46
48 St. John 34,632.07 47
37 Ouachita 32,914.11 48
25 Jackson 32,503.43 49
21 Franklin 26,016.15 50
41 Red River 19,903.18 51
42 Richland 19,134.78 52
35 Natchitoches 17,649.38 53
11 Caldwell 7,387.03 54
63 West Feliciana 4,517.98 55
62 West Carroll 4,046.53 56
33 Madison 2,699.03 57
19 East Feliciana 2,001.40 58
59 Washington 693.75 59
52 St. Tammany 10.02 60
18 East Carroll 0.00 61
34 Morehouse 0.00 62
36 Orleans 0.00 63
53 Tangipahoa 0.00 64
STATE TOTALS 63,036,007.22 –
* Use these numbers as a legend for the map on page 71.
Over 83 percent of the total taxable barrels was reported by the 16 parishes reporting taxable barrels of one million or more.

71
SEVERANCE tax (parishes reporting over 2 million barrels)
SEVERANCE tax (parishes reporting over 2 million barrels)
FOR FISCAL YEAR ENDING JUNE 30, 2010
L* Parish Oil Bbls Rank
38 Plaquemines 14,468,209.82 1
29 Lafourche 5,845,191.84 2
55 Terrebonne 4,136,111.10 3
26 Jefferson 3,438,112.58 4
51 St. Mary 3,096,178.30 5
12 Cameron 2,899,804.32 6
23 Iberia 2,480,233.58 7
57 Vermillion 2,409,431.79 8
30 LaSalle 2,267,723.03 9
10 Calcasieu 2,024,572.61 10
* Use these numbers as a legend for the map below.
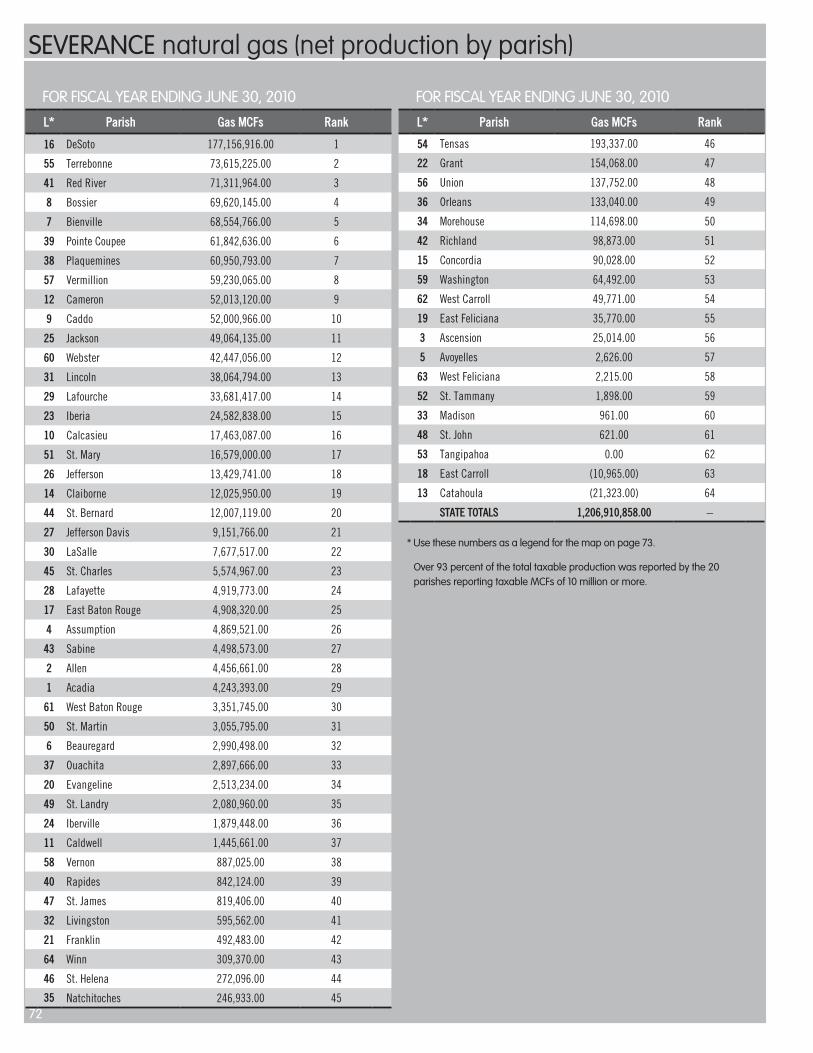
72
SEVERANCE natural gas (net production by parish)
FOR FISCAL YEAR ENDING JUNE 30, 2010
L* Parish Gas MCFs Rank
16 DeSoto 177,156,916.00 1
55 Terrebonne 73,615,225.00 2
41 Red River 71,311,964.00 3
8 Bossier 69,620,145.00 4
7 Bienville 68,554,766.00 5
39 Pointe Coupee 61,842,636.00 6
38 Plaquemines 60,950,793.00 7
57 Vermillion 59,230,065.00 8
12 Cameron 52,013,120.00 9
9 Caddo 52,000,966.00 10
25 Jackson 49,064,135.00 11
60 Webster 42,447,056.00 12
31 Lincoln 38,064,794.00 13
29 Lafourche 33,681,417.00 14
23 Iberia 24,582,838.00 15
10 Calcasieu 17,463,087.00 16
51 St. Mary 16,579,000.00 17
26 Jefferson 13,429,741.00 18
14 Claiborne 12,025,950.00 19
44 St. Bernard 12,007,119.00 20
27 Jefferson Davis 9,151,766.00 21
30 LaSalle 7,677,517.00 22
45 St. Charles 5,574,967.00 23
28 Lafayette 4,919,773.00 24
17 East Baton Rouge 4,908,320.00 25
4 Assumption 4,869,521.00 26
43 Sabine 4,498,573.00 27
2 Allen 4,456,661.00 28
1 Acadia 4,243,393.00 29
61 West Baton Rouge 3,351,745.00 30
50 St. Martin 3,055,795.00 31
6 Beauregard 2,990,498.00 32
37 Ouachita 2,897,666.00 33
20 Evangeline 2,513,234.00 34
49 St. Landry 2,080,960.00 35
24 Iberville 1,879,448.00 36
11 Caldwell 1,445,661.00 37
58 Vernon 887,025.00 38
40 Rapides 842,124.00 39
47 St. James 819,406.00 40
32 Livingston 595,562.00 41
21 Franklin 492,483.00 42
64 Winn 309,370.00 43
46 St. Helena 272,096.00 44
35 Natchitoches 246,933.00 45
FOR FISCAL YEAR ENDING JUNE 30, 2010
L* Parish Gas MCFs Rank
54 Tensas 193,337.00 46
22 Grant 154,068.00 47
56 Union 137,752.00 48
36 Orleans 133,040.00 49
34 Morehouse 114,698.00 50
42 Richland 98,873.00 51
15 Concordia 90,028.00 52
59 Washington 64,492.00 53
62 West Carroll 49,771.00 54
19 East Feliciana 35,770.00 55
3 Ascension 25,014.00 56
5 Avoyelles 2,626.00 57
63 West Feliciana 2,215.00 58
52 St. Tammany 1,898.00 59
33 Madison 961.00 60
48 St. John 621.00 61
53 Tangipahoa 0.00 62
18 East Carroll (10,965.00) 63
13 Catahoula (21,323.00) 64
STATE TOTALS 1,206,910,858.00 –
* Use these numbers as a legend for the map on page 73.
Over 93 percent of the total taxable production was reported by the 20 parishes reporting taxable MCFs of 10 million or more.
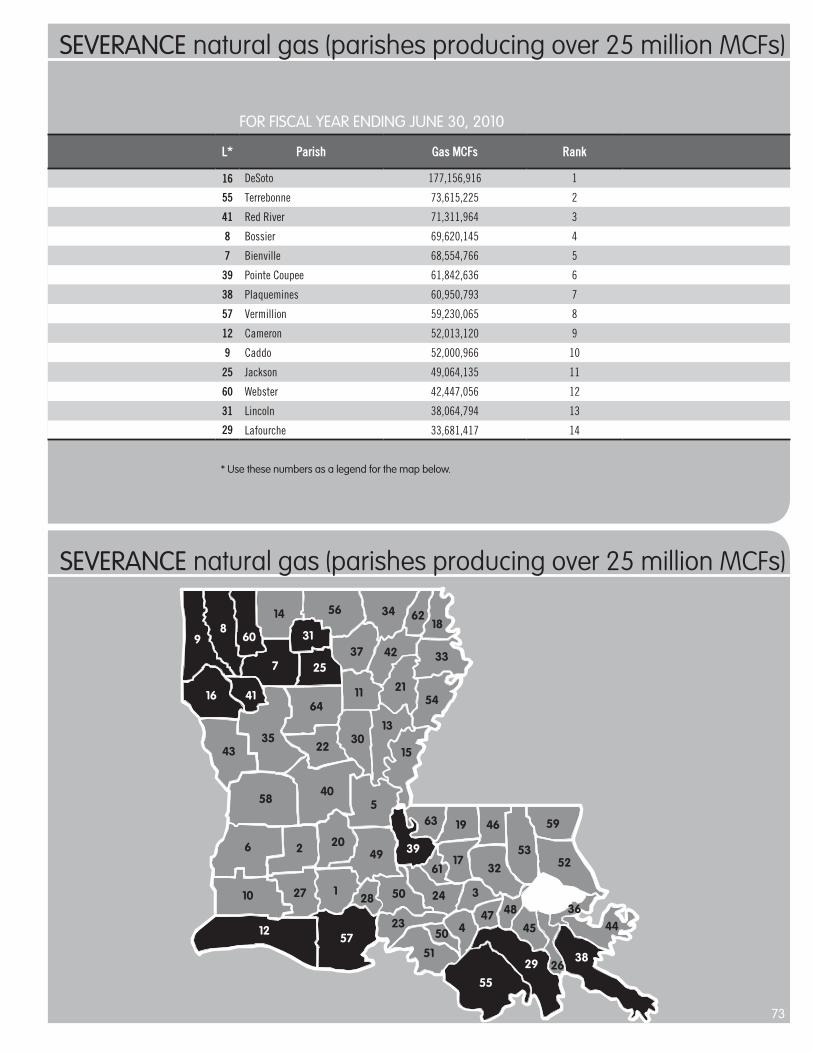
73
SEVERANCE natural gas (parishes producing over 25 million MCFs)
SEVERANCE natural gas (parishes producing over 25 million MCFs)
FOR FISCAL YEAR ENDING JUNE 30, 2010
L* Parish Gas MCFs Rank
16 DeSoto 177,156,916 1
55 Terrebonne 73,615,225 2
41 Red River 71,311,964 3
8 Bossier 69,620,145 4
7 Bienville 68,554,766 5
39 Pointe Coupee 61,842,636 6
38 Plaquemines 60,950,793 7
57 Vermillion 59,230,065 8
12 Cameron 52,013,120 9
9 Caddo 52,000,966 10
25 Jackson 49,064,135 11
60 Webster 42,447,056 12
31 Lincoln 38,064,794 13
29 Lafourche 33,681,417 14
* Use these numbers as a legend for the map below.

74
TOBACCO tax (comparison of LA & selected states)
State CigarettePer Pack of 20
LOUISIANA $ 0.36
Alabama $ 0.425
Arkansas $ 1.15
Florida $ 1.339
Georgia $ 0.37
Mississippi $ 0.68
Texas $ 1.41
Source: Tax Foundation Rates as of January 1, 2010
Tobacco tax The tobacco tax is collected on the sale of stamps for cigarettes and on monthly reports on cigars and other tobacco products.
Tax stamps can only be purchased from the Secretary of Revenue and must be affixed on the premises of the wholesale tobacco dealer.
Every registered tobacco dealer must affix tax stamps in the required denominations and amount on the cigarette packages immediately after receipt of any unstamped cigarettes.
Every registered tobacco dealer receiving and handling cigarettes, cigars, and other tobacco products in Louisiana upon which tax has not been previously paid must file a report with the secretary within 20 days after the end of each calendar month.

75
TOBACCO tax (cash collection after accrual adjustments)
TOBACCO tax (cash collection after accrual adjustments)
Fiscal Year Amount Collected % Change
2009-10 $ 136,515,428 -7.21%
2008-09 147,120,920 0.75%
2007-08 146,021,012 0.20%
2006-07 145,729,802 5.79%
2005-06 137,750,588 -7.63%
The tobacco tax is collected from the first dealer handling the tobacco product in the state.
Tax rates on tobacco products are as follows:
1. 36¢ per pack of 20 cigarettes2. Cigars (up to $120 per thousand), 8% of invoice price3. Cigars (over $120 per thousand), 20% of invoice price4. Smokeless tobacco, 20% of the invoice price5. Smoking tobacco, 33% of invoice price to wholesaler
09 10
08 09
07 08
06 07
05 06
$137,750,588
$145,729,802
$147,169,358
$146,251,276
$136,515,428

76
TOBACCO tax (tobacco collections)
TOBACCO tax (stamp sales)
FISCAL YEAR 2010
Period 36 Fuson 36 Sheets 45 Fuson Gross Tax Due
1st Quarter 84,510,000 43,200 16,000 $ 30,446,352
2nd Quarter 83,760,000 21,000 32,000 30,175,560
3rd Quarter 73,920,000 22,800 8,000 26,623,008
4th Quarter 90,750,000 26,850 35,000 32,695,416
TOTAL 332,940,000 113,850 91,000 $ 119,940,336
FISCAL YEAR 2009
Period 36 Fuson 36 Sheets 45 Fuson Gross Tax Due
1st Quarter 92,640,000 9,000 28,000 $ 33,366,240
2nd Quarter 96,240,000 31,500 16,000 34,664,940
3rd Quarter 85,980,000 58,500 12,000 30,979,260
4th Quarter 88,800,000 51,000 28,000 31,998,960
TOTAL 363,660,000 150,000 84,000 $ 131,009,400
Note: Amounts represent number of stamps purchased by bonded wholesalers.
FISCAL YEAR 2010
Period Gross Tax Due - Stamp Sales
Less: Returns and Discounts Net Cigarette Tax Tax Due on Cigars/
Other TobaccoTotal Tax Due Before
Adjustments
1st Quarter $ 30,446,352 $ 1,677,537 $ 28,794,270 $ 6,964,554 $ 35,758,825
2nd Quarter 30,175,560 1,535,505 28,676,206 7,264,528 35,940,734
3rd Quarter 26,623,008 1,497,010 25,133,178 4,378,518 29,511,696
4th Quarter 32,695,416 1,830,183 30,931,539 4,870,121 35,801,660
TOTAL $ 119,940,336 $ 6,540,235 $ 113,535,193 $ 23,477,721 $ 137,012,915
FISCAL YEAR 2009
Period Gross Tax Due - Stamp Sales
Less: Returns and Discounts Net Cigarette Tax Tax Due on Cigars/
Other TobaccoTotal Tax Due Before
Adjustments
1st Quarter $ 33,366,240 $ 1,955,763 $ 31,459,592 $ 5,290,389 $ 36,749,981
2nd Quarter 34,664,940 2,025,253 32,670,609 5,221,072 37,891,681
3rd Quarter 30,979,260 1,628,426 29,373,004 6,001,373 35,374,377
4th Quarter 31,998,960 1,873,655 30,218,627 6,360,626 36,579,253
TOTAL $ 131,009,400 $ 7,483,097 $ 123,721,832 $ 22,873,461 $ 146,595,293

