annualplan coalmin 2010-11
TRANSCRIPT

1
Ministry of Coal Shastri Bhavan
New Delhi Final Document

2
CONTENTS
Sl. No. Description Page No.1 Note on Annual Plan i - ix 2 Coal Demand / Supply / Movement Plan All India Coal Demand (Sector-wise) 1 Indigenous Coal Supply Plan – Sector-wise & Source-wise 2 - 3 Coal Supply Plan (Sector-wise Breakup) - CIL 4 Sector-wise Coal Off-take Plan of CIL & Subsidiaries and SCCL) 5 - 9 Company-wise / Mode-wise Coal Movement Plan of CIL Subsidiaries 10 - 13 Coal Movement Plan of SCCL 14 Field-wise Coal Movement Plan -CIL 15 Raw Coal Off-take & Wagon loading Programme 16 3 Coal Production Plan Company-wise 17 UG - OC break up 18 Coalfield-wise 19 State-wise 20 Group-wise 21 Technology-wise 22 - 23 Grade-wise 24 - 27 Status of Mechanised Longwall faces (CIL & SCCL) 28 - 30
Coking coal Availability and Washed Coal Production 31 Washery-wise Coking Coal 32 Washery-wise Non-Coking Coal 33 4 Manpower & Productivity Plan Company-wise Manpower reduction plan & VRS 34 - 35 Productivity (OMS) 36 5 Utilisation Plan System Capacity Utilisation 37 Utilisation / Productivity of HEMM 38 - 39 6 Investment Plan Company-wise 40 State-wise 41 Group-wise 42 -44 Statement of IEBR & Financing Pattern 45 - 57 7 Detailed Drilling Programme 58 - 59 8 Promotional Exploration Programme 60 - 62 9 Status of Coal resource in India 63 - 66 10 Up gradation of Coal Resources Inventory 67 - 68 11 S & T Programme 69 - 78 12 R & D Programme 79 - 84 13 Environmental Measures & Subsidence Control. (EMSC) 85 - 89 14 Energy Conservation Programme 90 - 91 15 SEB wise Outstanding dues 92

3
CONTENTS Sl. No. Description Page No.
16 State-wise Royalty Payment made by coal companies 93 17 Welfare Measures 94 - 95 18 Cost of Production & Sales Realisation 96 - 98 19 Scheme-wise Coal Production Plan Eastern Coalfields Ltd. 99 - 102 Bharat Coking Coal Ltd. 103 - 109 Central Coalfields Ltd. 110 - 111 Northern Coalfields Ltd. 112 Western Coalfields Ltd. 113 - 115 South Eastern Coalfields Ltd. 116 - 118 Mahanadi Coalfields Ltd. 119 - 120 Singareni Collieries Company Ltd 121 - 123
20 Schemewise Expenditure & Investment Plan Eastern Coalfields Ltd. 124 - 125 Bharat Coking Coal Ltd. 126 - 127 Central Coalfields Ltd. 128 Northern Coalfields Ltd. 129 Western Coalfields Ltd. 130 - 132 South Eastern Coalfields Ltd. 133 - 134 Mahanadi Coalfields Ltd. 135 - 136
Singareni Collieries Company Ltd 137 - 14621 Neyveli Lignite Corporation Ltd. (NLC) 147 - 180

i
ANNUAL PLAN: 2010 -11
BACK GROUND All India Scenarios Coal Demand: The original XI Plan document envisaged that the coal demand in the country would grow at 9.7% per annum as against 5.7 % per annum of X Plan consumption / off-take of coal. One of the factors contributing to the lower demand is the impact of the global crisis on economic growth. Further, during Mid Term exercise carried out in September 2009, coal consumption in the first 2 years of XI Plan period grew at 8.00 % and likely growth in consumption in first 3 years of XI Plan has been envisaged as 8.29 %. As per revised estimate, envisaged coal demand in the terminal year of XI Plan is 713.24 Mt (CAGR of 8.96 %) as against original estimate of 731.00 Mt (CAGR of 9.7 %.) Year wise / Sector wise coal consumption / Demand are as follows:
(In Mt) S.N Sector 2006-
07 TY X
PL
2007-08
2008-09
2009-10
Prov #
2010-11
TY XI Plan (2011-12)
Act. Consumption Demand Original Revised
MTA %
CAGR Orig.
% CAGR Rev.
1 Steel 35.17 39.02 37.66 40.69 50.51 68.50 68.50 9.41 14.26
2 Power (Utilities)
307.92 332.40 362.93 371.66 442.00 483.00 473.00 8.45 8.97
3 Cement 19.67 21.27 18.85 18.98 30.00 31.90 33.35 4.66 11.06
4 Others 101.11 111.60 126.66 150.99 133.80 147.60 138.39 7.86 6.35
5 Total 463.87 504.29 546.10 582.32 656.31 731.00 713.24 9.70 8.96
Coal Production As per original XI Plan document envisaged indigenous coal production in the terminal year of XI Plan (2011-12) was 680.00 Mt. However, as per the Mid-Term Appraisal (MTA) coal production of India is expected to reach 629.91 Mt. The Compounded Annualized Growth Rate (CAGR) was originally projected to be 9.56% in the XI Plan period against annualized growth of 5.62 % achieved in X Plan period. As per the MTA the projected the CAGR in the XI Plan period is now expected to be 7.89%. All India coal production grew @ 6.87 % in the first 2 year of XI plan. As per MTA likely Annualized growth in first 3 year is 7.23 %.

ii
Company wise coal production plan during the XI plan is given below:
(In Mt) SN Sector 07-08
Act 08-09 Act
09-10 Prov.*
10-11 Target
TY XI Plan 2011 - 12
Original Revised Latest Assessment
% CAGR
Original
% CAGR Revised
1 CIL 379.46 403.73 431.27 460.50 520.50 486.50 486.50 7.6
6.15
2 SCCL 40.60 44.54 50.42 46.00 40.80 47.00 47.00 1.59
4.50
3 Others 36.94 44.48 50.37 65.87 118.70 96.41 58.28 29.81
24.52
4 All India
457.00 492.75 532.06 572.37 680.00 629.91 591.78 9.56
7.89
Demand / Supply Gap
(In Mt) 07 - 08 08 - 09 09 - 10 10 - 11 11 - 12 Sector
Act Act Prov.* BE Original XI Plan
Revised MTA
Latest Assessment
Demand / Consump.
504.29 546.10 582.32 656.31 731.00 713.24 713.24
Supply / Production
454.49 490.02 514.58 573.42 680.00 629.91 591.78
Import / Gap
49.80 56.08 67.74 82.89 51.00 83.33 121.46
Coking 22.03 21.08 23.47 32.59 40.85 42.48 Non-
Coking 27.77 35.00 44.27 50.30 10.15 40.85
It may be observed that the due to revised coal production projections in the terminal year of XI plan (i.e. 2011-12) there is a production shortfall of around 50.09 Mt., indicating a growth of 7.89 % in coal production against 9.60 % envisaged initially. Initial projected gap between demand and availability of coal in the terminal year of XI plan was 51.00 Mt. (coking coal 40.85 Mt & non-coking coal – 10.15 Mt.). Now as per revised estimate demand / supply gap works out to be 83.33 Mt. The envisaged gap will be met up by import. (42.48 Mt - Coking coal and balance 40.85 Mt - Non-coking coal.)
XI Plan: Plan outlay & Expenditure Delay in taking up of new projects, delay in procurement of HEMM due to some court cases and decision of some of the coal companies to outsource overburden removal / coal loading & transport operations and slow progress in regard to central sector schemes have resulted in shortfall in capital expenditure in first two years of the plan. In view of above, during Annual Plan exercise, company-wise / scheme-wise expenditure has been revisited and originally projected and as proposed have been depicted below:

iii
Rs Cr. SN Company/ Scheme Approved
XI Plan Cumulative
expected Expenditure Till 09-10
Expenditure as % of XI Plan Outlay
Revised XI Plan
A. PSU 1 CIL 17390.00 7640.68 43.94 16090.68 2 SCCL 3440.00 1545.27 46.26 3802.07 3 NLC (Mines) 2993.00 1502.68 50.21 2334.39 3 NLC (Power) 12051.00 3717.02 30.84 6140.61 B. Central Sector
Schemes 1326.00 1501.23 113.21 4463.36
Total MoC 37,100.38 15,906.88 42.88 32,831.11 ANNUAL PLAN: 2009-10 In the Annual Plan 2009-10, All India Coal demand for the year 2009-10 was assessed by
Planning Commission at 604.34 Mt, which was revised at 597.98 Mt. Total domestic
production target was 532.83 Mt, out of which CIL’s shares was 435 Mt. In an endeavor to
accomplish this colossal demand the targets of CIL in respect of coal production, off take
were finalized as under:
Company Production (Mt) Off-take (Mt)
Capital Outlay (Revised) (Rs Crs)
CIL 435.00 437.40 3100.00
SCCL 45.00 45.00 633.94
Others 52.83 52.83 --
All India 532.83 535.23 3733.94
Actual Performance: 2009 - 10 (Act. Prov.)
Coal India Limited
Achievements of CIL for the year 2009-10 are as under: (In Mt)
2008 – 09 2009-10 Coal Production
(Mt) Actual Target Actual (Prov)
%Achievement Against Target
Growth Over
corrpdg. Period of last year
% UG 43.96 45.50 43.26 95.07 -1.59
Opencast 359.77 389.50 388.01 99.62 7.85 Total 403.73 435.00 431.27 99.14 6.82
Off take 401.46 437.00 415.86 95.16 3.59

iv
Singareni Collieries Company Limited (SCCL)
Achievements of SCCL for the year 2009-10 are as under: (In Mt)
2008-09 2009-10 Coal Production
(Mt) Actual
Target Actual
(Prov)
%Achievement Against Target
Growth Over last year (%)
Underground 12.087 12.800 11.969 94 -1 Opencast 32.455 31.700 38.456 121 18
Total 44.542 44.500 50.425 113 13 Off take 44.520 44.500 49.378 111 11
Neyveli Lignite Corporation (NLC)
Achievements of NLC for the year 2009-10 are as under:
09-10
Target Act (Prov)
%Achievement Against Target
Lignite (Mt) 21.75 22.34 102.70 Power (MU) 16600.00 17657.94 106.37
ANNUAL PLAN: 2010 – 11
Coal production
As per MTA, it has been planned that CIL is to produce 460.50 Mt. The main reasons for the reduction in production are:
• The delay in environmental and forest clearances of majors projects • The delay in land acquisition of the projects • R&R and law & order problem in some of the states
Company wise coal production in 2008-09, 2009-10 (Target / BE and anticipated) and 2010-11 Target / BE are as under:
(In Mt) 2009-10 2010-11
Target/ B.E COMPANY 2008-09
Actual Target Ach (Prov)
ECL 28.13 31.00 30.07 33.00 BCCL 25.51 28.00 27.51 29.00 CCL 43.24 48.00 47.08 50.00 NCL 63.65 66.50 67.67 72.00 WCL 44.70 45.00 45.74 46.50 SECL 101.15 106.00 108.01 112.00 MCL 96.34 109.30 104.08 116.75 NEC 1.01 1.20 1.11 1.25 CIL 403.73 435.00 431.27 460.50 SCCL 44.55 44.50 50.43 46.00 Others 44.48 52.83 50.15 65.87 All India 492.76 532.33 531.85 572.37

v
Production Programme of Neyveli Lignite Corporation
Particulars BE 2009-10 2009-10 Ach (Prov) BE 2010-11
Lignite (Million tonnes) 21.75 22.34 24.14 Power –Gross (Million Units) 16600 17657.94 18758 Coal Off take / Supply: Company wise off-take / coal supply in 2008-09 (Act.), 2009-10 (Target and Act. Prov.) and 2010-11 BE are as:
(Fig. In Million Tonnes) 2009-10 COMPANY 2008-09
Actual Target/B.E (Prov)) 2010-11
Target/B.E.
ECL 28.26 31.00 29.19 33.00 BCCL 24.60 28.00 25.11 29.00 CCL 43.84 50.00 44.21 50.00 NCL 64.23 66.50 66.65 72.00 WCL 45.37 45.00 45.51 46.50 SECL 103.02 106.00 106.07 112.00 MCL 91.29 109.30 98.15 116.75 NEC 0.84 1.20 1.07 1.25 CIL 401.45 437.00 415.96 460.50 SCCL 44.54 44.50 49.37 47.05 Others 44.04 52.83 49.25 65.87 All India 490.02 534.33 514.58 573.42 Capital Outlay: Business as usual scenario for capital outlay for 2010-11 BE of CIL is Rs 3800 Crore and an additional lump sum ad-hoc provision amounting Rs 6000.00 Crore has been kept for proposed acquisition of assets in abroad. Subsidiary wise capital outlay, actual 2008-09, BE & RE 2009-10 and BE 2010-11 are as under:

vi
(Rs. Crore) 2009-10 COMPANY 2008-09
Actual B.E Act (Prov) 2010-11 (B.E.)
ECL 191.88 210.00 165.02 400.00
BCCL 221.16 230.00 293.35 350.00
CCL 334.84 420.00 321.31 350.00
NCL 266.52 730.00 545.45 800.00
WCL 277.92 230.00 252.34 350.00
SECL 855.98 730.00 770.67 600.00
MCL 321.26 200.00 404.19 650.00
Others # 37.61 150.00 57.66 300.00
CIL 2507.17 2900.00 2809.99 3800.00 + 6000.00 ##
SCCL 650.44 580.57 1334.93
NLC 1559.41 1893.84 1983.46
# Others include NEC, CMPDIL, DCC, IICM & CIL (HQ) and R&D ## Additional Adhoc. Provision: Rs 6000 Crs (LS) for proposed acquisition of assets in abroad
Financing Pattern:
The estimates of IEBR as proposed in BE and RE 2009 - 10 and BE 2010 - 11 and actual of 2008- 09 are as under: Coal India Limited
(Rs. Crore) 2008 – 09 2009 - 10 2010 - 11 Head
(Actual) BE Actual BE
IR 32034.24 27670.95 41424.58 37080.55
EBR - - - -
Total IEBR 32034.24 27670.95 41424.58 37080.55
Total Outlay 2507.17 2900.00 2809.99 3800.00 (+6000.00 ##)
Resource Surplus (+) / Gap (-)
29527.04 24770.95 38614.59 33280.55 (27280.55 ##)
Budgetary Support from Govt.
- - - -
## Additional Ad-hoc Provision: Rs 6000 Cr (LS) for proposed acquisition of assets in abroad.

vii
Singareni Collieries Company Ltd (SCCL):
The estimates of IEBR as proposed in BE and RE 20009 – 10 and BE 2010 – 11 and actual of 2008 – 09 are as under:
(Rs. Crore) 2008 – 09 2009 – 10 2010 – 11 Head (Actual) BE RE BE
IR 650.44 30.57 353.94 513.93
Others* - 550.00 280.00 821.00
Supplier’s credit - - - -
Total IEBR 650.44 580.57 633.94 1334.93
Total Outlay 650.44 580.57 633.94 1334.93
Neyveli Lignite Corporation Ltd (NLC):
The estimates of IEBR as proposed in BE and RE 2009 – 10 and BE 2010 – 11 and are as under:
(Rs. Crore) 2009 – 10 2010 – 11 Head
BE RE BE IR 673.46 397.08 662.03
Rupee Loans / Bonds 720.38 834.26 1321.43
Foreign Currency Loan 500.00 0 0
Total Outlay 1893.84 1231.34 1983.46
Man Productivity (OMS) and Manpower Reduction Plan: Overall Man Productivity of CIL, in terms of Output (tonnes) per Man-shift, for the year 10-11 is now envisaged as 4.87 tonnes against the actual achievement of 4.45 tonnes for the year 09-10.
To achieve the increasing OMS trend, the manpower has been rationalized through proper deployment and reduction programme as given below: Coal India Limited
As on 31.3.09 Actual
31.3.10 (Target)
31.3.10 (Act)
31.3.2011 (Proj.)
Manpower Strength 412350 401891 397138 392545
08-09 (Actual)
09-10 (BE)
09-10 (Act.)
10-11 (BE)
Reduction 13727 11611 15212 11179

viii
Singareni Collieries Company Limited (SCCL)
As on 31.3.09 Actual
31.3.10 (Target)
31.3.10 (Antic)
31.3.2011 (Proj.)
Manpower Strength 70586 69182 69370 67692
08-09 (Actual)
09-10 (BE)
09-10 (Antic.)
10-11 (BE)
Reduction -4987 -1404 -1216 -1678
Conclusion: The proposed All India coal production target for the year 2010-11 is 572.37 Mt out of which, share of CIL, SCCL & Others are 460.50 Mt (80.45 %), 46.00 Mt (8.05 %) & 65.87 Mt (11.50 %) respectively. Similarly, All India coal off-take programme for the year 2010-11 has been pegged at 573.42 Mt out of which share of CIL, SCCL & Others are 460.50 Mt (80.45%), 47.05 Mt (8.10%) and 65.87 Mt (11.50%) respectively. The proposed Capital outlay of MoC for the year 2010-11 is Rs 7518.39 Crore. Additional Rs 6000 crore (Lumpsum) has been indicated for proposed acquisition of assets in abroad for CIL. Out of Rs 7518.39 Crore, investment in PSUs & Central Sector Schemes would be Rs 7118.39 Crore & 400.00 Crore respectively. Out of Rs 7118.39 Crore investment in PSUs, investments in CIL, SCCL & NLC are Rs 3800 Crore, Rs 1334.93 Cr & Rs 1983.46 Crore respectively. The plan outlay of MoC for 2009-10 (BE & RE) and 2010-11 (BE) comprising of the outlay for the three public sector undertakings viz. CIL, SCCL and NLC and departmental schemes is as under:

ix
Rs. Crore
Company / Scheme 2009-10 BE RE
2010-11 BE
• CIL 2900.00 3100.00 3800.00 + 6000.00 ##
• SCCL 580.57 633.94 1334.93
• NLC
-Mines 524.09 386.40 313.94
- Power 1369.75 844.94 1669.52
• Total NLC 1893.84 1231.34 1983.46
Sub Total (PSUs) 5374.41 4965.28 7118.39 +
6000.00 ##
• Science and Technology 20.00 11.00 10.00
• Regional exploration 30.39 30.39 68.00
• Detailed drilling- non CIL Block 60.00 60.00 110.00
• Environmental measures and subsidence control
(including RCFS/RFRP)
15.00 10.53 30.00
• Conservation and safety in coal mines 135.00 135.00 135.00
• Dev of transportation infrastructure in coalfield
areas
22.00 0.01 22.00
• Coal controller 0.31 0.33 0.25
• Information technology 3.00 0.25 0.45
• NE Component * 14.30 12.49 24.30
Sub Total (Dept schemes) 300.00 260.00 400.00
Grand Total (MOC) 5674.41 5225.28 7518.39 +
6000.00 ##
## Additional Ad-hoc Provision Rs 6000 Crs (LS) for proposed acquisition of assets in abroad

1
COAL DEMAND / SUPPLY – Sector-wise Break-up
ALL INDIA IN MILLION TONNES
2006-07 2007-08 2008-09 2009-10 2010-11 2011-12 2011-12
Sector Actual Actual Actual BE RE PROV1 BE Original MTA Revised
I. Coking Coal 1Steel / Coke Oven & Cokeries ( Indigenious)
17.30 16.99 16.58 20.29 17.26 17.23 17.92 23.78 26.02
2Steel (Import) 17.88 22.03 21.08 27.26 23.47 32.59 44.72 42.48 Sub Total 35.17 39.02 37.66 20.29 44.52 40.69 50.51 68.50 68.50 II. Non Coking Coal
3Power (Utilities) RC 307.92 332.40 362.93 397.54 401.00 371.66 442.00 483.00 473.00 MID (1.61) (1.45) (1.23) (1.58) (0.82) (0.80) (1.03)
4Power (Captive) RC 28.13 29.31 32.74 57.66 40.00 39.08 44.00 57.06 47.00 MID (1.64) (1.55) (1.38) (1.40) (1.52) (1.53) (1.70)
5Cement 19.67 21.27 18.85 25.59 25.59 18.98 30.00 31.90 33.35 6Sponge Iron/ CDI 17.47 20.92 19.78 44.33 28.80 23.09 28.80 28.96 28.96 7BRK & Others/Fert/Export/ RC 55.51 61.37 77.07 58.93 58.07 88.82 61.00 61.58 62.43
SSF/NLW Cok/Loco/Colly.con
MID
Sub TotalRC 428.70 465.27 511.37 584.05 553.46 541.63 605.80 662.50 644.74 MID (3.25) (3.00) (2.61) (2.98) (2.34) (2.33) (2.73)
Total Raw Coal 463.87 504.29 549.02 604.34 597.98 582.32 656.31 731.00 713.24 Middling (3.25) (3.00) (2.61) (2.98) (2.34) (2.33) (2.73) Note: Figs from 2006 - 07 to 2008 - 09 have been taken from Coal Directory published by the Office of the Coal Controller (CCO) 1 – 582.32 fig. has arrived as CIL’s supply has been taken as 415.96 Mt as per CIL’s Quick Report.

2
INDIGENOUS COAL SUPPLY PLAN – Sector-wise / Source-wise Break-up
(IN MILLION TONNES)
Sector 2008-09: Actuals 2009-10 : Target 2009-10: Anticipated (R.E.) 2009-10: Act. (Prov) 2010-11: Plan (B.E.)
CIL SCCL Others Total CIL SCCL Others Total CIL SCCL Others Total CIL SCCL Others Total CIL SCCL Others Total
I. Coking Coal 1 Steel (
Indigenious) 8.30 8.03 16.33 10.81 8.58 19.39 8.26 8.42 16.68 8.38 0.05 8.26 16.69 8.69 8.72 17.41
2 Private Cokeries/ Coke Oven
0.25 0.25 0.40 0.40 0.58 0.58 0.54 0.54 0.51 0.51
Sub Total (R/C) 8.55 0.00 8.03 16.58 11.20 0.00 8.58 19.78 8.84 0.00 8.42 17.26 8.92 0.05 8.26 17.23 9.20 0.00 8.72 17.92
II. Non Coking Coal 3 Power (Utilities) 296.24 30.44 19.047 345.72 312.17 27.80 22.300 362.27 311.86 28.50 23.600 363.96 298.87 33.85 22.585 355.31 333.92 29.00 26.650 389.57 (Middlings) (1.23) (1.23) (1.58) (1.58) (0.82) (0.82) (0.80) (0.80) (1.03) (1.03)4 Power (Captive) 27.54 2.66 2.55 32.74 37.94 2.41 2.30 42.65 38.90 2.10 2.20 43.20 33.90 2.44 2.74 39.08 40.69 2.90 2.60 46.19 (Middlings) (1.38) (1.38) (1.40) (1.40) (1.52) (1.52) (1.53) (1.53) (1.70) (1.70)5 Sponge Iron/ CDI 10.44 1.32 8.02 19.78 14.67 1.51 10.33 26.51 14.94 1.20 10.29 26.43 12.79 1.46 8.84 23.09 13.93 1.50 16.60 32.03 6 Cement 6.83 6.05 0.24 13.12 7.94 6.74 0.30 14.97 7.46 5.98 0.30 13.74 6.38 7.30 0.30 13.98 7.52 6.13 0.30 13.95 7 Fertiliser 2.43 2.43 2.95 2.95 2.79 2.79 2.61 2.61 3.02 3.02 8 Export 0.02 0.02 0.02 0.02 0.02 0.02 0.02 0.02 0.02 0.02 9 BRK & Others 48.68 3.95 6.16 58.79 49.40 5.93 9.02 64.34 51.91 7.10 8.02 67.03 51.79 4.17 6.53 62.50 51.52 7.40 11.00 69.92
10 Colliery Consumption
0.72 0.13 0.00 0.85 0.71 0.12 0.83 0.69 0.12 0.81 0.67 0.10 0.77 0.69 0.12 0.81
Sub-total (R/C) 392.90 44.54 36.01 473.44 425.80 44.50 44.25 514.55 428.56 45.00 44.41 517.97 407.04 49.32 41.00 497.35 451.30 47.05 57.15 555.50
TOTAL Raw Coal 401.44 44.54 44.04 490.02 437.00 44.50 52.83 534.33 437.40 45.00 52.83 535.23 415.96 49.37 49.25 514.58 460.50 47.05 65.87 573.42 (Middlings) (2.61) 0.00 0.00 (2.61) (2.98) (2.98) (2.33) (2.33) 0.00 0.00 (2.73) 0.00 (2.73)
Export & Middlings figures sourced from CIL-S&M Annual Report

3
COAL DEMAND/SUPPLY PLAN – Source wise Break-up
(MILLION TONNES) TARGET ANTIC'/R.E. PROV' PLAN/B.E. PROJ'N
COMPANY 2006-07 2007-08 2008-09 2009-10 2009-10 2009-10 2010-11 2011-12 MTA
CIL 351.14 375.33 401.44 437.00 437.40 415.96 460.50 486.50 SCCL 37.63 41.95 44.54 44.50 45.00 49.37 47.05 47.00 Other PSU 1.78 2.10 1.77 1.92 1.92 2.38 2.30 2.52 TISCO 7.04 7.22 7.28 7.30 7.30 7.22 7.30 6.50 Captive Mining 17.41 21.35 29.49 37.11 37.11 33.89 49.77 80.89 Meghalaya 5.79 6.54 5.49 6.50 6.50 5.77 6.50 6.50 TOTAL INDIGENOUS COAL SUPPLY / AVAILABILITY
420.79 454.49 490.02 534.33 535.23 514.58 573.42 629.91
TOTAL CONSUMPTION/DEMAND ** 474.18 492.50 550.00 604.34 597.98 597.98 656.31 713.24 DEMAND - SUPPLY (INDIGENOUS) GAP
53.39 38.01 59.98 70.01 62.75 83.40 82.89 83.33
MATERIALISATION THROUGH IMPORT
43.08 49.79 59.00 62.75 67.74 82.89 83.33
IMPORT: COKING COAL 17.88 22.03 21.08 27.26 23.47 32.59 42.48 IMPORT: NON-COKING COAL 25.20 27.77 37.92 35.49 44.28 50.30 40.85 TOTAL SUPPLY / AVAILABILITY 463.87 504.29 549.02 597.98 582.32 656.31 713.24 OVERALL DEMAND - SUPPLY GAP 10.31 -11.79 0.98 0.00 15.66 0.00 0.00 ** NOTE: DEMAND AS ASSESSED BY PLANNING COMMISSION;

4
COAL SUPPLY PLAN – Sector wise Break-up
COAL INDIA LIMITED Supply Supply Supply Supply Supply Supply Supply Sector 2006-07 2007-08 2008-09 Target (Antc’) (Prov') (Plan) 2009-10 2009-10 2009-10 2010-11 B.E. R.E. B.E.
I. Coking Coal 1 Steel 8.90 8.83 8.30 10.81 8.26 8.38 8.69 2 Private Cokeries/ Coke
Oven/Others 0.97 1.24 0.25 0.40 0.58 0.54 0.51
Sub Total Coking 9.87 10.07 8.55 11.20 8.84 8.92 9.20 II. Non Coking Coal 3 Power (Utilities) Raw Coal 262.12 280.13 296.24 312.17 311.86 298.87 333.92 Middling (1.61) (1.45) (1.23) (1.58) (0.82) (0.80) (1.03) 4 Power (Captive) Raw Coal 25.00 27.48 27.54 37.94 38.90 33.90 40.69 Middling (1.64) (1.55) (1.38) (1.40) (1.52) (1.53) (1.70) 5 Sponge Iron } 9.47 12.06 10.44 14.67 14.94 12.79 13.93 Mini Blast Furnace } Corex Process / CDI } 6 BRK & Others / Raw Coal 31.99 34.94 48.68 49.40 51.91 51.79 51.52 LTC/SSF Plant/BRQ/ Middling (0.00) Pvt./NLW Cokeries } Soft Coke/Fuel Coke } Sub Total (4+5+6) Raw Coal 66.45 74.48 86.66 102.01 105.75 98.49 106.14 Middling (1.64) (1.55) (1.38) (1.40) (1.52) (1.53) (1.70) 7 Cement 9.41 7.41 6.83 7.94 7.46 6.38 7.52 8 Fertiliser Raw Coal 2.45 2.47 2.43 2.95 2.79 2.61 3.02 9 Export 0.00 0.01 0.02 0.02 0.02 0.02 0.02 10 Colliery Consumption 0.84 0.76 0.72 0.71 0.69 0.67 0.69 Sub Total Non-Coking 341.27 365.26 392.90 425.80 428.56 407.04 451.30 Total Raw Coal 351.14 375.33 401.44 437.00 437.40 415.96 460.50 Middling (3.25) (3.00) (2.61) (2.98) (2.34) (2.33) (2.73)

5
SECTORWISE RAW COAL OFFTAKE (ACTUALS: 2008-09)
(IN MILLION TONNES)SECTOR ECL BCCL CCL NCL WCL SECL MCL NEC CIL
COKING COAL STEEL 0.023 3.477 3.951 0.698 0.148 8.30 COKERIES/C.OVENS/OTHERS 0.065 0.076 0.108 0.25 TOTAL COKING COAL 0.088 3.553 4.059 0.000 0.698 0.148 0.000 0.000 8.55 NON-COKING COAL POWER (UTILITIES) (R/C) 23.694 16.128 30.003 58.476 34.644 73.241 59.813 0.236 296.24
(MID) 0.678 0.235 0.320 1.23 POWER (CAPTIVE) (R/C) 0.951 0.211 1.699 3.239 1.213 9.574 10.653 27.54
(MID) 0.230 1.145 1.38 SPONGE IRON/COREX/CDI 0.614 0.873 0.020 0.231 4.436 4.267 10.44 SSF/BRQ/LTC/ BRK & OTHERS 2.330 3.580 6.241 2.496 6.921 10.197 16.365 0.549 48.68
(MID) 0.00 CEMENT 0.152 0.054 1.642 4.758 0.175 0.050 6.83 FERTILISER 0.881 0.900 0.640 0.011 2.43
(MID) 0.00 EXPORTS 0.020 0.02 COLLY.CONSUMPTION 0.410 0.249 0.014 0.000 0.016 0.024 0.005 0.002 0.72 TOTAL NON-COKING COAL 28.171 21.049 39.784 64.231 44.667 102.870 91.289 0.837 392.90 TOTAL (R/COAL+MIDDLINGS) 28.259 25.510 45.223 64.231 45.685 103.018 91.289 0.837 404.05
TOTAL RAW COAL OFFTAKE 28.259 24.602 43.843 64.231 45.365 103.018 91.289 0.837 401.44 MIDDLINGS 0.000 0.908 1.380 0.000 0.320 0.000 0.000 0.000 2.61
Note: Middlings include Washed Coal (Power) of CCL.

6
SECTORWISE RAW COAL OFFTAKE (TARGET / B.E.: 2009-10) - COAL INDIA LIMITED
(IN MILLION TONNES) SECTOR ECL BCCL CCL NCL WCL SECL MCL NEC CIL COKING COAL STEEL 0.030 5.150 4.700 0.752 0.173 10.81 COKERIES/C.OVENS/OTHERS 0.140 0.101 0.120 0.038 0.40 TOTAL COKING COAL 0.170 5.251 4.820 0.000 0.790 0.173 0.000 0.000 11.20 NON-COKING COAL POWER (UTILITIES) (R/C) 26.000 16.500 33.000 59.391 34.556 73.400 69.120 0.200 312.17
(MID) 1.060 0.250 0.270 1.58 POWER (CAPTIVE) (R/C) 0.550 0.050 2.200 4.568 1.321 11.247 18.000 37.94
(MID) 1.400 1.40 SPONGE IRON/COREX/CDI 0.900 1.250 0.216 0.229 4.837 7.240 14.67 SSF/BRQ/LTC/ BRK & OTHERS 2.791 4.849 7.560 2.325 6.292 10.170 14.440 0.970 49.40
(MID) 0.000 0.00 CEMENT 0.170 0.150 1.789 5.300 0.500 0.030 7.94 FERTILISER 1.100 1.000 0.853 2.95
(MID) 0.00 EXPORTS 0.020 0.02 COLLY.CONSUMPTION 0.399 0.250 0.020 0.023 0.020 0.000 0.71 TOTAL NON-COKING COAL 30.830 22.749 45.180 66.500 44.210 105.827 109.300 1.200 425.80 TOTAL (R/COAL+MIDDLINGS) 31.000 29.060 51.650 66.500 45.270 106.000 109.300 1.200 439.98
TOTAL RAW COAL OFFTAKE 31.000 28.000 50.000 66.500 45.000 106.000 109.300 1.200 437.00 MIDDLINGS 0.000 1.060 1.650 0.000 0.270 0.000 0.000 0.000 2.98
Note: Middlings include Washed Coal (Power) of CCL.

7
SECTORWISE RAW COAL OFFTAKE (ANTICIPATED / R.E.: 2009-10) - COAL INDIA LIMITED
(IN MILLION TONNES) SECTOR ECL BCCL CCL NCL WCL SECL MCL NEC CIL COKING COAL STEEL 0.030 4.000 3.600 0.471 0.160 8.26 COKERIES/C.OVENS/OTHERS 0.140 0.250 0.150 0.039 0.58 TOTAL COKING COAL 0.170 4.250 3.750 0.000 0.510 0.160 0.000 0.000 8.84 NON-COKING COAL POWER (UTILITIES) (R/C) 26.000 16.795 31.000 59.791 34.887 74.030 69.110 0.250 311.86
(MID) 0.500 0.150 0.169 0.82 POWER (CAPTIVE) (R/C) 0.940 1.225 2.000 4.568 1.497 10.670 18.000 38.90
(MID) 0.475 1.050 1.53 SPONGE IRON/COREX/CDI 0.900 1.500 0.108 0.418 4.650 7.360 14.94 SSF/BRQ/LTC/ BRK & OTHERS 2.401 4.440 8.640 2.033 6.757 12.700 14.220 0.718 51.91
(MID) 0.000 0.00 CEMENT 0.170 0.100 1.915 4.750 0.490 0.030 7.46 FERTILISER 1.045 1.000 0.620 0.120 2.79
(MID) 0.00 EXPORTS 0.020 0.02 COLLY.CONSUMPTION 0.399 0.245 0.010 0.016 0.020 0.000 0.002 0.69 TOTAL NON-COKING COAL 30.830 23.750 44.250 66.500 45.490 107.440 109.300 1.000 428.56 TOTAL (R/COAL+MIDDLINGS) 31.000 28.975 49.200 66.500 46.169 107.600 109.300 1.000 439.74
TOTAL RAW COAL OFFTAKE 31.000 28.000 48.000 66.500 46.000 107.600 109.300 1.000 437.40 MIDDLINGS 0.000 0.975 1.200 0.000 0.169 0.000 0.000 0.000 2.34
Note: Middlings include Washed Coal (Power) of CCL.

7
SECTORWISE RAW COAL OFFTAKE (ACT. PROV.): 2009-10
(IN MILLION TONNES)SECTOR ECL BCCL CCL NCL WCL SECL MCL NEC CIL
COKING COAL STEEL 0.008 4.053 3.668 0.502 0.150 8.38 COKERIES/C.OVENS/OTHERS 0.098 0.250 0.150 0.039 0.54 TOTAL COKING COAL 0.106 4.303 3.818 0.000 0.541 0.150 0.000 0.000 8.92 NON-COKING COAL POWER (UTILITIES) (R/C) 25.213 16.541 29.176 61.467 34.203 74.204 57.967 0.096 298.87
(MID) 0.517 0.006 0.273 0.80 POWER (CAPTIVE) (R/C) 0.955 0.816 2.826 3.176 2.009 11.177 12.868 0.077 33.90
(MID) 0.365 1.170 1.54 SPONGE IRON/COREX/CDI 0.417 0.000 1.193 0.103 0.290 4.289 6.497 12.79 SSF/BRQ/LTC/ BRK & OTHERS 1.936 2.088 6.229 1.906 7.284 10.961 20.569 0.819 51.79
(MID) 0.000 0.00 CEMENT 0.149 0.000 0.123 1.172 4.622 0.240 0.078 6.38 FERTILISER 1.137 0.831 0.000 0.644 0.000 0.000 2.61
(MID) 0.00 EXPORTS 0.020 0.02 COLLY.CONSUMPTION 0.398 0.221 0.013 0.011 0.023 0.005 0.000 0.67 TOTAL NON-COKING COAL 29.088 20.803 40.391 66.652 44.969 105.920 98.146 1.070 407.04 TOTAL (R/COAL+MIDDLINGS) 29.194 25.988 45.385 66.652 45.783 106.070 98.146 1.070 418.29
TOTAL RAW COAL OFFTAKE 29.194 25.106 44.209 66.652 45.510 106.070 98.146 1.070 415.96 MIDDLINGS 0.000 0.882 1.176 0.000 0.273 0.000 0.000 0.000 2.33
Note: Middlings include Washed Coal (Power) of CCL.

8
SECTORWISE RAW COAL OFFTAKE (TARGET / B.E: 2010-11) - COAL INDIA LIMITED
(IN MILLION TONNES) SECTOR ECL BCCL CCL NCL WCL SECL MCL NEC CIL COKING COAL STEEL 0.030 4.100 3.960 0.431 0.170 8.69 COKERIES/C.OVENS/OTHERS 0.140 0.150 0.180 0.039 0.51 TOTAL COKING COAL 0.170 4.250 4.140 0.000 0.470 0.170 0.000 0.000 9.20 NON-COKING COAL POWER (UTILITIES) (R/C) 26.400 18.445 34.200 63.695 34.401 76.945 79.630 0.250 333.97
(MID) 0.629 0.250 0.155 1.03 POWER (CAPTIVE) (R/C) 0.940 1.225 1.730 3.405 2.587 11.880 18.160 39.93
(MID) 0.500 1.200 1.70 SPONGE IRON/COREX/CDI 0.900 1.000 0.108 0.418 4.480 7.020 13.93 SSF/BRQ/LTC/ BRK & OTHERS 4.001 3.795 7.820 4.792 6.685 12.851 11.430 0.948 52.32
(MID) 0.000 0.00 CEMENT 0.170 0.100 1.916 4.804 0.390 0.050 7.43 FERTILISER 1.045 1.000 0.850 0.120 3.02
(MID) 0.00 EXPORTS 0.020 0.02 COLLY.CONSUMPTION 0.399 0.240 0.010 0.023 0.020 0.002 0.69 TOTAL NON-COKING COAL 32.830 24.750 45.860 72.000 46.030 111.830 116.750 1.250 451.30 TOTAL (R/COAL+MIDDLINGS) 33.000 30.129 51.450 72.000 46.655 112.000 116.750 1.250 463.23
TOTAL RAW COAL OFFTAKE 33.000 29.000 50.000 72.000 46.500 112.000 116.750 1.250 460.50 MIDDLINGS 0.000 1.129 1.450 0.000 0.155 0.000 0.000 0.000 2.73
Note: Middlings include Washed Coal (Power) of CCL.

9
Annual Plan 2010-11-MoC-SECTORAL COAL DEMAND/OFFTAKE
Company: SCCL Million tonnesSl. Sector 2006-07 2007-08 2008-09 2009-10 2010-11 No. Actual Actual Actual Target Ant. / RE Target
1 2 3 4 5 6 7 I Coking Coal
1 Steel 2 Coke Ovens
Sub-Total Coking: II Non-Coking
3 Power Utilities 26.885 29.850 29.978 27.800 28.500 28.300 4 Cement 5.147 5.410 5.359 6.735 5.980 6.130 5 Steel DR 0.742 0.690 1.213 1.510 1.200 1.500 6 Railways 7 Fertilisers 0.007 0.000 0.000 0.000 0.000 0.000 8 LTC/Soft Coke 9 Cokeries / Coke oven (NLW) 10 Export 11 Captive Power 1.509 2.070 2.371 2.410 2.100 2.900 12 BRK & Others 3.197 2.163 2.799 1.475 2.600 2.500 13 E BOOKING 1.610 2.690 4.450 4.500 4.550 Sub-Total NonCoking: 37.487 41.793 44.410 44.380 44.880 45.880
14 Colly. Consump. 0.142 0.157 0.122 0.120 0.120 0.120 Grand Total 37.629 41.950 44.532 44.500 45.000 46.000

10
MODEWISE COAL OFFTAKE (ACTUALS: 2008-09)
(IN MILLION TONNES) (IN BOX/DAY)
CO. RAIL COASTAL TOTAL ROAD MGR OTHERS TOTAL COLLY. TOTAL TOTAL WAGON
SHPMT. RAIL CONSM. OFFTAKE RAIL QTY. LOADING
(R/C) (R/C) (R/C) (R/C) (R/C) (R/C) (R/C) (R/C) (R/C+PDTS) (R/C+PDTS)
ECL 13.712 1.822 15.534 2.226 10.089 27.849 0.410 28.259 15.534 695
BCCL 17.472 17.472 6.881 24.353 0.249 24.602 20.845 935
CCL 24.019 24.019 19.810 43.829 0.014 43.843 33.880 1472
NCL 16.227 16.227 7.046 38.717 2.241 64.231 0.000 64.231 19.806 857
WCL 20.627 20.627 19.088 1.048 4.586 45.349 0.016 45.365 21.247 962
SECL 43.138 43.138 39.243 15.745 4.868 102.994 0.024 103.018 43.138 1878
MCL 42.476 11.703 54.179 18.664 17.082 1.359 91.284 0.005 91.289 54.179 2322
NEC 0.647 0.647 0.188 0.835 0.002 0.837 0.647 36
CIL 178.318 13.525 191.843 113.146 82.681 13.054 400.724 0.720 401.444 209.276 9158

11
MODEWISE COAL OFFTAKE (TARGET / B.E.: 2009-10) - COAL INDIA LIMITED
(IN MILLION TONNES) (IN BOX/DAY)
CO. RAIL COASTAL TOTAL ROAD MGR OTHERS TOTAL COLLY. TOTAL TOTAL WAGON
SHPMT. RAIL CONSM. OFFTAKE RAIL QTY. LOADING
(R/C) (R/C) (R/C) (R/C) (R/C) (R/C) (R/C) (R/C) (R/C+PDTS) (R/C+PDTS)
ECL 13.319 3.182 16.501 2.600 11.500 0.000 30.601 0.399 31.000 16.501 696
BCCL 21.500 21.500 6.250 27.750 0.250 28.000 25.680 1082
CCL 28.640 28.640 21.340 49.980 0.020 50.000 39.190 1652
NCL 17.644 17.644 6.523 39.633 2.700 66.500 66.500 21.000 885
WCL 20.902 20.902 19.280 1.000 3.795 44.977 0.023 45.000 21.540 908
SECL 42.210 42.210 35.430 23.700 4.640 105.980 0.020 106.000 42.210 1779
MCL 54.940 11.000 65.940 23.310 18.910 1.140 109.300 109.300 65.940 2779
NEC 1.000 1.000 0.200 1.200 0.000 1.200 1.000 42
CIL 200.155 14.182 214.337 114.933 94.743 12.275 436.288 0.712 437.000 233.061 9823

12
MODEWISE COAL OFFTAKE (ANTICIPATED / R.E: 2009-10) - COAL INDIA LIMITED
(IN MILLION TONNES) (IN BOX/DAY)
CO. RAIL COASTAL TOTAL ROAD MGR OTHERS TOTAL COLLY. TOTAL TOTAL WAGON
SHPMT. RAIL CONSM. OFFTAKE RAIL QTY. LOADING
(R/C) (R/C) (R/C) (R/C) (R/C) (R/C) (R/C) (R/C) (R/C+PDTS) (R/C+PDTS)
ECL 14.722 1.800 16.522 2.479 11.600 0.000 30.601 0.399 31.000 16.522 696
BCCL 20.180 20.180 7.570 0.000 0.000 27.750 0.250 28.000 23.680 998
CCL 27.230 27.230 20.760 0.000 0.000 47.990 0.010 48.000 37.240 1570
NCL 17.644 17.644 6.523 39.633 2.700 66.500 66.500 21.000 885
WCL 20.978 20.978 20.116 1.100 3.790 45.984 0.016 46.000 21.378 901
SECL 43.000 43.000 40.200 19.740 4.640 107.580 0.020 107.600 43.000 1812
MCL 54.940 11.000 65.940 23.310 18.910 1.140 109.300 109.300 65.940 2779
NEC 0.800 0.800 0.198 0.998 0.002 1.000 0.800 34
CIL 199.494 12.800 212.294 121.156 90.983 12.270 436.703 0.697 437.400 229.560 9676

12
MODEWISE COAL OFFTAKE (ACT. PROV.): 2009-10
(IN MILLION TONNES)(IN BOX/DAY)
CO. RAIL COASTAL TOTAL ROAD MGR OTHERS TOTAL COLLY. TOTAL TOTAL WAGON
SHPMT. RAIL CONSM. OFFTAKE RAIL QTY. LOADING
(R/C) (R/C) (R/C) (R/C) (R/C) (R/C) (R/C) (R/C) (R/C+PDTS) (R/C+PDTS)
ECL 14.968 1.800 16.768 2.008 10.020 0.000 28.796 0.398 29.194 16.768 755
BCCL 17.927 17.927 6.958 0.000 0.000 24.885 0.221 25.106 21.077 931
CCL 21.854 21.854 22.342 0.000 0.000 44.196 0.013 44.209 32.359 1373
NCL 19.473 19.473 7.112 38.535 1.532 66.652 66.652 22.995 981
WCL 20.679 20.679 19.577 1.171 4.072 45.499 0.011 45.510 21.185 966
SECL 40.680 40.680 40.517 19.483 5.367 106.047 0.023 106.070 40.680 1787
MCL 44.833 11.000 55.833 23.351 17.371 1.586 98.141 0.005 98.146 55.833 2403
NEC 0.802 0.802 0.268 1.070 0.000 1.070 0.802 47
CIL 181.216 12.800 194.016 122.133 86.580 12.557 415.286 0.671 415.957 211.699 9243

13
MODEWISE COAL OFFTAKE (PLAN (B.E.): 2010-11)
(IN MILLION TONNES) (IN BOX/DAY)
CO. RAIL COASTAL TOTAL ROAD MGR OTHERS TOTAL COLLY. TOTAL TOTAL WAGON
SHPMT. RAIL CONSM. OFFTAKE RAIL QTY. LOADING
(R/C) (R/C) (R/C) (R/C) (R/C) (R/C) (R/C) (R/C) (R/C+PDTS) (R/C+PDTS)
ECL 15.809 1.800 17.609 2.692 12.300 0.000 32.601 0.399 33.000 17.609 749
BCCL 21.970 21.970 6.790 28.760 0.240 29.000 25.890 1101
CCL 31.249 31.249 18.741 49.990 0.010 50.000 41.902 1782
NCL 20.843 20.843 10.407 40.250 0.500 72.000 72.000 24.199 1029
WCL 21.173 21.173 20.404 1.100 3.800 46.477 0.023 46.500 21.539 916
SECL 47.477 47.477 37.823 21.980 4.700 111.980 0.020 112.000 47.477 2019
MCL 63.220 14.000 77.220 16.920 20.910 1.700 116.750 116.750 77.220 3284
NEC 0.877 0.877 0.373 1.250 0.000 1.250 0.877 37
CIL 222.618 15.800 238.418 114.150 96.540 10.700 459.808 0.692 460.500 256.713 10917

14
ANNUAL PLAN 2010-11 - MoC COAL MOVEMENT PLAN
Company: SCCL (Million Tonnes)
Company Rail Coastal TOTAL ROAD MGR OTHERS TOTAL COLLY TOTAL TOTAL TOTALWagon Loading (FWW)
Year (R/C) Shipment (R/C) Rail (R/C) (R/C) CONSUMP. (R/C) OFFTAKE (R/C)
PRODUCTS (BY RAIL)
RAIL QTY
(R/C + PDTS)
R/C PDTS TOTAL
2006-07 ACTUAL CIL SCCL 21.596* 0.000 21.674 6.284 9.107 0.500 37.565 0.142 37.707 21.596 21.596 2355 0 2355 2007-08 ACTUAL CIL SCCL 25.629* 0.000 25.629 7.043 8.635 0.486 41.793 0.157 41.950 25.629 25.629 2720 0 2720 2008-09 ACTUAL CIL SCCL 25.379* 0.000 25.379 8.382 10.109 0.540 44.410 0.122 44.532 25.379 25.379 2679 0 2679 2009-10 BE CIL SCCL 26.600* 0.000 26.600 7.780 9.500 0.500 44.380 0.120 44.500 26.600 26.600 2803 0 2803 2009-10 RE CIL SCCL 26.940* 0.000 26.940 7.790 9.650 0.500 44.880 0.120 45.000 26.940 26.940 2839 0 2839 2010-11 PROPOSED CIL SCCL 27.930* 0.000 27.930 7.950 9.500 0.500 45.880 0.120 46.000 27.930 27.930 2943 0 2943
* Rail: INCLUDING RCR ** FWW INCLUDING RCR NOTE: Wagon Loading (FWW) is calculated at the rate of 65 tonnes per wagon, compared to 62 tonnes per wagon during last year.

15
COAL MOVEMENT PLAN FOR 2010-11 (B.E.)
(IN MILLION TONNES) STOCK OFFTAKE OTHER THAN RAIL AVAILABLE FOR RAIL WAGON GRAND COLLY. TOTAL
COMPANY FIELD ON PRODN. ROAD MGR C.SHPG. OTHERS TOTAL R/COAL PDTS. TOTAL LOADING TOTAL CONS. OFFTAKE 1/4/10 (RAIL-
SEA) (Box/day) (RAW
COAL) (1) (2) (3) (3) (4) (5) (6) (7) (8) (9) (10) (11) (12) (13) (14) (15) (4+5+7) (6+9+10) (8+11) (6+8+9+14)
ECL RNG 17.080 1.076 1.800 1.076 13.024 14.824 631 15.900 0.380 16.280 MUG/SLN/SPM 3.620 1.500 1.500 2.106 2.106 90 3.606 0.014 3.620 RAJMAHAL 12.300 0.120 12.300 12.420 0.675 0.675 29 13.095 0.005 13.100 TOTAL 3.342 33.000 2.696 12.300 1.800 0.000 14.996 15.805 0.000 17.605 749 32.601 0.399 33.000
BCCL TOTAL 8.331 29.000 6.790 0.000 0.000 0.000 6.790 21.970 3.920 25.890 1101 32.680 0.240 29.000 CCL S.KPA 5.230 1.700 1.700 3.750 0.510 4.260 181 5.960 0.002 5.452
N.KPA 25.300 6.001 6.001 19.369 5.950 25.319 1077 31.320 0.000 25.370 E.BKRO 11.750 5.640 5.640 5.900 2.155 8.055 343 13.695 0.008 11.548 W.BKRO 5.990 4.250 4.250 1.600 0.910 2.510 107 6.760 0.000 5.850 GIRIDIH 0.630 0.050 0.050 0.630 0.000 0.630 27 0.680 0.000 0.680 RAMGARH 1.100 1.100 1.100 0.000 1.125 1.125 48 2.225 0.000 1.100 TOTAL 16.102 50.000 18.741 0.000 0.000 0.000 18.741 31.249 10.650 41.899 1782 60.640 0.010 50.000
NCL TOTAL 2.028 72.000 10.407 40.250 0.500 51.157 20.843 3.356 24.199 1029 75.356 0.000 72.000 WCL WARDHA 29.570 15.355 1.100 2.200 18.655 10.697 10.697 455 29.352 0.005 29.357
UMRER 4.100 0.734 0.000 0.734 3.465 3.465 147 4.199 0.001 4.200 PAT'KRA 3.120 2.018 1.100 3.118 0.000 0.000 0 3.118 0.002 3.120 PEN/KAN 4.600 1.170 0.000 1.170 3.483 0.366 3.849 164 5.019 0.010 4.663 KMT/SYL 5.110 1.127 0.500 1.627 3.528 3.528 150 5.155 0.005 5.160 TOTAL 2.855 46.500 20.404 1.100 0.000 3.800 25.304 21.173 0.366 21.539 916 46.843 0.023 46.500
SECL K-REWA 25.150 2.010 1.080 3.090 22.040 22.040 938 25.130 0.020 25.150 KORBA 80.850 31.880 20.900 4.700 57.480 23.370 23.370 994 80.850 0.000 80.850 RAIGARH 6.000 3.930 0.000 3.930 2.070 2.070 87 6.000 0.000 6.000 TOTAL 6.753 112.000 37.820 21.980 0.000 4.700 64.500 47.480 0.000 47.480 2019 111.980 0.020 112.000
MCL IB 41.550 8.540 2.910 0.000 0.000 11.450 30.100 30.100 1280 41.550 0.000 41.550 TAL 75.200 8.380 18.000 14.000 1.700 28.080 33.120 47.120 2004 75.200 0.000 75.200 TOTAL 23.334 116.750 16.920 20.910 14.000 1.700 39.530 63.220 0.000 77.220 3284 116.750 0.000 116.750
NEC TOTAL 0.291 1.250 0.373 0.373 0.877 0.877 37 1.250 0.000 1.250 CIL TOTAL 63.036 460.500 114.151 96.540 15.800 10.700 221.391 222.617 18.292 256.709 10917 478.100 0.692 460.500
Quantity for 1 Box has been considered on the basis of 3800 Tonnes per rake of 59 Boxes i.e., 1 Box = 3800/59 = 64.41 Tonnes

16
COMPANYWISE RAW COAL OFFTAKE PROGRAMME
(IN MILLION TONNES)COMPANY 2002-03 2003-04 2004-05 2005-06 2006-07 2007-08 2008-09 2009-10 2009-10 2009-10 2010-11
Actual Actual Actual Actual Actual Actual Actual Target Ant (R.E.) Act. Prov'. Plan/B.E. ECL 27.29 27.43 27.17 28.69 29.79 25.44 28.26 31.00 31.00 29.19 33.00
BCCL 22.22 23.79 22.44 22.34 24.10 24.09 24.60 28.00 28.00 25.11 29.00 CCL 36.75 36.37 35.83 38.62 38.68 42.04 43.84 50.00 48.00 44.21 50.00 NCL 44.43 46.48 50.12 51.68 52.62 59.02 64.23 66.50 66.50 66.65 72.00 WCL 38.16 39.20 40.32 41.75 42.17 44.90 45.37 45.00 46.00 45.51 46.50 SECL 68.37 70.93 78.80 81.20 86.17 95.00 103.02 106.00 107.60 106.07 112.00 MCL 51.37 59.36 66.30 68.22 76.43 83.64 91.29 109.30 109.30 98.15 116.75 NEC 0.64 0.87 0.57 1.17 1.18 1.20 0.84 1.20 1.00 1.07 1.25
CIL-TOTAL 289.23 304.44 321.55 333.67 351.14 375.33 401.45 437.00 437.40 415.96 460.50 SCCL 33.48 33.94 34.83 35.45 37.63 41.95 44.53 44.50 45.00 45.00 47.05
COMPANYWISE WAGON LOADING PROGRAMME
(IN BOX / DAY) COMPANY 2002-03 2003-04 2004-05 2005-06 2006-07 2007-08 2008-09 2009-10 2009-10 2009-10 2010-11
Actual Actual Actual Actual Actual Actual Actual Target Ant (R.E.) Act. Prov' Plan/B.E. ECL 820 756 777 826 802 651 695 696 696 755 749
BCCL 862 930 865 930 963 956 935 1082 998 931 1101 CCL 1357 1329 1354 1436 1361 1487 1472 1652 1570 1373 1782 NCL 290 435 533 497 588 717 857 885 885 981 1029 WCL 1129 1053 1036 999 1023 996 962 908 901 966 916 SECL 1629 1671 1779 1616 1852 1888 1878 1779 1812 1787 2019 MCL 1602 1693 1826 1884 2137 2225 2322 2779 2779 2403 3284 NEC 23 34 18 44 46 48 36 42 34 47 37
CIL-TOTAL 7713 7901 8189 8230 8771 8967 9158 9823 9676 9243 10917 SCCL 854 827 850 897 942 1088 1072 1121 1136 1286 1193

17
COAL PRODUCTION PROGRAMME - COMPANY WISE
(Miilion Tonnes)
08 – 09 09 – 10 09 – 10 10 – 11 Company 07 – 08 Actual
Act. BE RE Act. (Prov.)
BE
11 – 12 (MTA)
ECL 24.06 28.13 31.00 31.00 30.07 33.00 36.00
BCCL 25.22 25.51 28.00 27.50 27.51 29.00 30.00
CCL 44.15 43.24 48.00 46.10 47.08 50.00 54.00
NCL 59.62 63.65 66.50 66.50 67.67 72.00 76.00
WCL 43.51 44.70 45.00 46.00 45.74 46.50 47.00
SECL 93.79 101.15 106.00 107.60 108.01 112.00 117.00
MCL 88.01 96.34 109.30 109.30 104.08 116.75 125.10
NEC 1.10 1.01 1.20 1.00 1.11 1.25 1.40
CIL-TOTAL 379.46 403.73 435.00 435.00 431.27 460.50 486.50
SCCL 40.60 44.55 44.50 45.00 50.43 46.00 47.00
Other Public Sec ## 2.02 1.84 1.92 1.92 2.60 2.30 2.52
Private - TISCO 7.21 7.28 7.30 7.30 7.21 7.30 6.50
Captive Mining 21.17 29.87 37.11 37.11 34.79 49.77 80.89
Meghalaya 6.54 5.49 6.50 6.50 5.77 6.50 6.50
All India 457.00 492.76 532.33 532.83 532.06 572.37 629.91
## - JKML, JSMDCL, DVC, IISCO, WBPDCL, SAIL & APMDTCL

18
COAL PRODUCTION PROGRAMME - UG / OC Break - up (Miilion Tonnes)
08 - 09 (Act) 09 - 10 09 - 10 10 - 11 11 - 12 Company OC / UG 07 - 08 Act. Prod % BE % RE % Act. (Prov.) % BE % Proj. %
ECL OC 15.74 19.74 70.17 21.75 70.16 22.50 72.58 21.83 72.62 23.50 71.21 26.00 72.63 UG 8.32 8.39 29.83 9.25 29.84 8.50 27.42 8.23 27.38 9.50 28.79 10.00 27.38 TOTAL 24.06 28.13 31.00 31.00 30.07 33.00 36.00 BCCL OC 20.75 21.38 83.80 23.45 83.75 23.45 85.27 23.61 85.82 24.75 85.34 25.50 85.00 UG 4.47 4.13 16.20 4.55 16.25 4.05 14.73 3.90 14.18 4.25 14.66 4.50 15.00 TOTAL 25.22 25.51 28.00 27.50 27.51 29.00 30.00 CCL OC 42.32 41.68 96.40 46.05 95.94 44.53 96.59 45.61 96.87 48.34 96.68 52.30 96.85 UG 1.83 1.56 3.60 1.95 4.06 1.57 3.41 1.47 3.13 1.66 3.32 1.70 3.15 TOTAL 44.15 43.24 48.00 46.10 47.08 50.00 54.00 NCL OC 59.62 63.65 100.00 66.50 100.00 66.50 100.00 67.67 100.00 72.00 100.00 76.00 100.00 UG 0.00 0.00 0.00 0.00 0.00 0.00 0.00 0.00 0.00 0.00 0.00 0.00 TOTAL 59.62 63.65 66.50 66.50 67.67 72.00 76.00 WCL OC 33.53 34.59 77.37 34.85 77.44 35.85 77.93 36.12 78.97 36.35 78.17 36.60 77.87 UG 9.98 10.12 22.63 10.15 22.56 10.15 22.07 9.62 21.03 10.15 21.83 10.40 22.13 TOTAL 43.51 44.70 45.00 46.00 45.74 46.50 47.00 SECL OC 77.05 83.58 82.63 88.50 83.49 89.60 83.27 90.18 83.49 93.50 83.48 97.20 83.08 UG 16.74 17.57 17.37 17.50 16.51 18.00 16.73 17.83 16.51 18.50 16.52 19.80 16.92 TOTAL 93.79 101.15 106.00 107.60 108.01 112.00 117.00 MCL OC 85.89 94.19 97.77 107.20 98.08 107.20 98.08 101.88 97.88 114.46 98.04 122.34 97.79 UG 2.12 2.15 2.23 2.10 1.92 2.10 1.92 2.20 2.12 2.29 1.96 2.76 2.21 TOTAL 88.01 96.34 109.30 109.30 104.08 116.75 125.10 NEC OC 1.01 0.97 95.54 1.20 100.00 1.00 100.00 1.11 100.00 1.25 100.00 1.40 100.00 UG 0.09 0.05 4.46 0.00 0.00 0.00 0.00 0.00 0.00 TOTAL 1.10 1.01 1.20 1.00 1.11 1.25 1.40 CIL OC 335.92 359.77 89.11 389.50 89.54 390.63 89.80 388.01 89.97 414.15 89.93 437.34 89.90 UG 43.54 43.96 10.89 45.50 10.46 44.37 10.20 43.26 10.03 46.35 10.07 49.16 10.10 TOTAL 379.46 403.73 435.00 435.00 431.27 460.50 486.50 SCCL OC 27.96 32.46 72.86 31.70 71.24 33.57 74.61 38.46 76.26 33.75 73.37 34.75 73.94 UG 12.65 12.09 27.14 12.80 28.76 11.43 25.39 11.97 23.74 12.25 26.63 12.25 26.06 TOTAL 40.60 44.54 44.50 45.00 50.43 46.00 47.00

19
COAL PRODUCTION PROGRAMME - FIELD WISE
(Million Tonnes) 09 - 10 10 - 11
Proj. Sub. Coalfields 07 - 08
Actual 08 - 09 Actual
BE RE Prov. BE
11 - 12 Proj.
ECL Ranigunj 13.98 14.53 15.81 15.94 15.23 17.08 17.80 Rajmahal / Deogarh / Mugma-
Salanpur 10.08 13.61 15.19 15.06 14.83 15.92 18.20
SUB - TOTAL 24.06 28.13 31.00 31.00 30.06 33.00 36.00 BCCL Raniganj 1.60 1.38 1.58 1.55 0.06 1.44 1.43 Jharia 23.62 24.14 26.42 25.95 27.45 27.56 28.57 SUB - TOTAL 25.22 25.51 28.00 27.50 27.51 29.00 30.00 CCL Giridih 0.61 0.63 0.60 0.63 0.63 0.63 West Bokaro 5.60 4.91 6.23 4.95 5.16 5.99 6.73 East Bokaro 9.98 9.91 10.17 10.90 13.28 11.75 12.66 Ramgarh 0.85 1.00 1.25 1.10 1.10 1.1 1.30 South Karanpura 4.94 4.84 5.03 4.90 3.98 5.23 5.32 North Karanpura 22.17 21.95 24.72 23.63 23.56 25.30 27.36 SUB - TOTAL 44.15 43.24 48.00 46.10 47.08 50.00 54.00 NCL Singrauli 59.62 63.65 66.50 66.50 67.67 72.00 76.00 SUB - TOTAL 59.62 63.65 66.50 66.50 67.67 72.00 76.00 WCL Wardha - Valley 27.79 28.90 28.34 29.27 29.32 29.57 29.99 Kamptee 4.36 4.26 4.88 4.19 5.03 4.1 4.10 Umrer 4.26 4.50 4.26 4.96 4.27 5.11 5.09 Pench - Kanhan 3.88 3.78 4.76 4.27 3.86 4.6 5.35 Pathakhera 3.23 3.26 2.76 3.32 3.26 3.12 2.47 SUB - TOTAL 43.51 44.70 45.00 46.00 45.74 46.50 47.00 SECL CIC* 23.40 23.35 23.86 24.34 24.72 25.15 27.93 KORBA 67.43 73.35 76.87 78.62 78.46 80.85 83.07 MAND RAIGARH 2.97 4.45 5.27 4.64 4.83 6.00 6.00 SUB - TOTAL 93.79 101.15 106.00 107.60 108.01 112.00 117.00 MCL IB VALLEY 34.35 38.80 41.68 41.68 44.34 41.55 44.89 TALCHER 53.66 57.53 67.63 67.63 59.74 75.20 80.21 SUB - TOTAL 88.01 96.34 109.30 109.30 104.08 116.75 125.10 NEC Assam / Makum 1.10 1.01 1.20 1.00 1.11 1.25 1.40 SUB - TOTAL 1.10 1.01 1.20 1.00 1.11 1.25 1.40 CIL TOTAL 379.46 403.73 435.00 435.00 431.27 460.50 486.50 CIC* - comprises of Bisrampur, Chirimiri, Jhilimili, Johila, Lakhanpur, Sundargarh, Sohagpur, Sonhat, Tatapani - Ramkola & Umaria. SCCL Godavari Valley 40.60 44.54 44.50 45.00 50.43 46.00 47.00

20
COAL PRODUCTION PROGRAMME - STATE WISE
(Million Tonnes)09 - 10 10 - 11 State Company 07 - 08
Actual 08 - 09 Actual
BE RE Prov. BE
11 - 12 Proj.
WB ECL 15.10 15.38 16.76 16.52 16.07 18.33 19.21
BCCL 0.13 0.10 0.10 0.10 0.03 0.00 0.00
SUB - TOTAL 15.23 15.48 16.86 16.62 16.11 18.33 19.21
JHARKHAND ECL 8.96 12.75 14.24 14.48 13.99 14.67 16.79
BCCL 25.09 25.42 27.90 27.40 27.48 29.00 30.00
CCL 44.15 43.24 48.00 46.10 47.08 50.00 54.00
SUB - TOTAL 78.19 81.41 90.14 87.98 88.55 93.67 100.79
ORISSA MCL 88.01 96.34 109.30 109.30 104.08 116.75 125.10
BCCL 0.00 0.00 0.00 0.00 0.00 0.00 0.00
SUB - TOTAL 88.01 96.34 109.30 109.30 104.08 116.75 125.10
UP NCL 11.43 12.03 14.20 14.00 13.97 15.50 15.50
MP NCL 48.20 51.62 52.30 52.50 53.70 56.50 60.50
WCL 7.11 7.04 7.32 7.54 7.12 7.72 7.82
SECL 12.21 12.43 12.27 12.65 13.03 12.04 13.44
SUB - TOTAL 67.51 71.09 71.89 72.69 73.86 76.26 81.76
CHATTISGARH SECL 81.59 88.72 93.73 94.95 94.97 99.96 103.56
MAHARASTRA WCL 36.40 37.66 37.68 38.47 38.61 38.78 39.18
ASSAM NEC 1.10 1.01 1.20 1.00 1.11 1.25 1.40
TOTAL - CIL 379.46 403.73 435.00 435.00 431.27 460.50 486.50
AP SCCL 40.60 44.54 44.50 45.00 50.43 46.00 47.00

21
COAL PRODUCTION PROGRAMME - GROUP WISE
(Million Tonnes)
09-10 10-11 Company Group 07 - 08 Actual
08 - 09 Actual BE RE BE
11 - 12 Proj.
ECL Existing 8.14 8.01 6.84 9.12 9.86 11.12 Completed 15.12 18.83 19.63 20.43 20.79 21.18 Ongoing Projects 0.80 1.29 1.43 1.45 2.35 3.00 Future Projects 0.00 0.00 3.10 0.00 0.00 0.70 Total 24.06 28.13 31.00 31.00 33.00 36.00 BCCL Existing 10.95 11.12 11.48 11.78 12.54 12.95 Completed 12.67 12.82 14.84 13.49 14.12 14.19 Ongoing Projects 1.60 1.58 1.69 2.24 2.34 2.86 Future Projects Total 25.22 25.51 28.00 27.50 29.00 30.00 CCL Existing 2.93 2.27 2.83 2.43 2.45 2.46 Completed 22.20 15.81 21.67 16.17 16.91 16.83 Ongoing Projects 19.02 25.15 23.20 26.60 29.74 32.96 Future Projects 0.30 0.90 0.90 1.75 Total 44.15 43.24 48.00 46.10 50.00 54.00 NCL Existing 4.52 3.86 4.00 4.00 3.00 4.00 Completed 19.21 19.62 19.75 19.75 21.00 17.00 Ongoing Projects 35.89 40.16 42.75 42.75 48.00 51.00 Future Projects 4.00 Total 59.62 63.65 66.50 66.50 72.00 76.00 WCL Existing 0.96 0.93 0.93 0.95 0.87 0.94 Completed 41.74 35.59 34.47 33.03 30.05 27.61 Ongoing Projects 0.82 8.19 9.25 12.02 15.43 16.20 Future Projects 0.00 0.35 0.00 0.15 2.25 Total 43.51 44.70 45.00 46.00 46.50 47.00 SECL Existing 2.98 3.00 2.46 2.95 2.60 2.69 Completed 26.85 23.71 20.78 23.78 22.34 21.29 Ongoing Projects 54.20 74.44 70.26 80.87 87.06 93.02 Future Projects 9.76 0.00 12.50 0.00 0.00 0.00 Total 93.79 101.15 106.00 107.60 112.00 117.00 MCL Existing 1.33 1.32 1.31 1.31 1.46 1.65 Completed 69.48 65.13 65.70 76.70 72.73 70.83 Ongoing Projects 17.20 29.88 32.00 31.30 42.56 52.62 Future Projects 10.30 0.00 0.00 Total 88.01 96.34 109.30 109.30 116.75 125.10 NEC Existing 1.10 1.01 1.05 1.00 1.10 1.10 Completed Ongoing Projects 0.00 Future Projects 0.15 0.15 0.30 Total 1.10 1.01 1.20 1.00 1.25 1.40 TOTAL CIL Existing 32.90 31.52 30.90 31.26 33.88 36.91 Completed 207.27 191.51 196.84 202.54 197.94 188.93 Ongoing Projects 129.52 180.69 180.58 197.21 227.48 251.66 Future Projects 9.76 26.70 4.00 1.20 9.00 TOTAL 379.46 403.73 435.00 435.00 460.50 486.50 SCCL Existing 1.86 2.17 1.79 1.90 1.61 1.41
Completed 37.14 35.38 25.00 32.43 31.94 30.83 Ongoing Projects 1.60 6.99 17.68 10.67 12.45 14.77 Future Projects 0.00 0.00 0.03 0.00 0.00 0.00 TOTAL 40.60 44.54 44.50 45.00 46.00 47.00

22
COAL PRODUCTION PROGRAMME - TECHNOLOGY WISE
(Million Tonnes) 09 -10 10 - 11 Company / Technology 07 - 08
Actual 08 - 09 Actual BE RE BE
11 - 12 Proj.
ECL Mechanised 15.74 19.74 21.75 22.5 23.5 26 TOTAL OPENCAST 15.74 19.74 21.75 22.50 23.50 26.00 Conventional B&P 4.39 3.93 3.57 3.50 3.29 3.04 Conventional LW 0.02 0.02 0.03 0.03 0.03 0.03 Mechanised B&P (SDL/LHD) 3.48 3.75 4.95 4.35 5.20 5.77 Mechanised LW (Incl. R/H) 0.16 0.12 0.16 0.16 0.16 0.16 Special Methods - BG Method Special Methods - Cable bolting Continuous Miner 0.27 0.57 0.54 0.45 0.82 1.00 TOTAL UNDERGROUND 8.32 8.39 9.25 8.50 9.50 10.00 TOTAL ECL 24.06 28.13 31.00 31.00 33.00 36.00 BCCL Mechanised 20.75 21.38 23.45 23.45 24.75 25.50 TOTAL OPENCAST 20.75 21.38 23.45 23.45 24.75 25.50 Conventional B&P 2.32 2.03 1.90 1.32 0.73 0.28 Conventional LW 0.05 0.03 0.05 0.04 0.05 0.05 Mechanised B&P(SDL/LHD) 1.96 1.89 2.39 2.50 3.00 3.40 Mechanised LW 0.10 0.10 0.12 0.12 0.40 0.70 Special / Other Methods 0.03 0.07 0.09 0.08 0.08 0.08 TOTAL UNDERGROUND 4.47 4.13 4.55 4.05 4.25 4.50 TOTAL BCCL 25.22 25.51 28.00 27.50 29.00 30.00 CCL Manual 0.32 0.35 0.15 0.35 0.30 0.30 Mechanised 42.00 41.33 45.90 44.18 48.04 52.00 TOTAL OPENCAST 42.32 41.68 46.05 44.53 48.34 52.30 Conventional B&P 1.39 1.17 1.40 1.20 1.26 1.23 Mechanised B&P(SDL/LHD) 0.44 0.39 0.55 0.37 0.40 0.48 Continuous Miner TOTAL UNDERGROUND 1.83 1.56 1.95 1.57 1.66 1.70 TOTAL CCL 44.15 43.24 48.00 46.10 50.00 54.00 NCL Mechanised 59.62 63.65 66.50 66.50 72.00 76.00 TOTAL OPENCAST 59.62 63.65 66.50 66.50 72.00 76.00 TOTAL NCL 59.62 63.65 66.50 66.50 72.00 76.00 WCL Mechanised 33.53 34.59 34.85 35.85 36.35 36.60 TOTAL OPENCAST 33.53 34.59 34.85 35.85 36.35 36.60 Conventional B&P 1.03 0.82 0.63 0.82 0.71 0.66 Mechanised B&P(SDL/LHD) 8.69 8.95 8.78 9.09 8.90 8.65 Mechanised LW Continuous Miner 0.26 0.34 0.74 0.24 0.54 1.09 TOTAL UNDERGROUND 9.98 10.12 10.15 10.15 10.15 10.40 TOTAL WCL 43.51 44.70 45.00 46.00 46.50 47.00 SECL Mechanised 77.05 83.58 88.50 89.60 93.50 97.20 TOTAL OPENCAST 77.05 83.58 88.50 89.60 93.50 97.20

23
COAL PRODUCTION PROGRAMME - TECHNOLOGY WISE (Million Tonnes)
09 -10 10 - 11 Company / Technology 07 - 08 Actual
08 - 09 Actual BE RE BE
11 - 12 Proj.
Conventional B&P 1.04 0.78 0.60 0.70 0.43 0.36 Mechanised B&P (SDL/LHD) 15.30 15.84 15.66 16.10 16.70 17.50 Mechanised LW 0.18 0.36 0.24 0.26 0.24 0.24 Continuous Miner 0.12 0.20 0.30 0.21 0.30 0.60 Special Methods 0.09 0.38 0.70 0.73 0.83 1.10 TOTAL UNDERGROUND 16.74 17.57 17.50 18.00 18.50 19.80 TOTAL SECL 93.79 101.15 106.00 107.60 112.00 117.00 MCL Mechanised 85.89 94.19 107.20 107.20 114.46 122.34 TOTAL OPENCAST 85.89 94.19 107.20 107.20 114.46 122.34 Conventional B&P 0.06 0.06 0.03 0.03 0.00 0.00 Mechanised B&P (SDL/LHD) 2.06 2.09 2.07 2.07 2.29 2.58 Special Methods Continuous Miner 0.18 TOTAL UNDERGROUND 2.12 2.15 2.10 2.10 2.29 2.76 TOTAL MCL 88.01 96.34 109.30 109.30 116.75 125.10 NEC Mechanised 1.01 0.96 1.20 1.00 1.25 1.40 TOTAL OPENCAST 1.01 0.96 1.20 1.00 1.25 1.40 Special Methods 0.09 0.05 0.00 0.00 0.00 0.00 TOTAL UNDERGROUND 0.09 0.05 0.00 0.00 0.00 0.00 TOTAL NEC 1.10 1.01 1.20 1.00 1.25 1.40 COAL INDIA LIMITED Manual 0.32 0.35 0.15 0.35 0.30 0.30 Mechanised 335.60 359.42 389.35 390.28 413.85 437.04 TOTAL OPENCAST 335.91 359.76 389.50 390.63 414.15 437.34 Conventional B&P 10.24 8.79 8.13 7.56 6.41 5.56 Conventional LW 0.07 0.05 0.08 0.07 0.08 0.08 Mechanised B&P (SDL/LHD) 31.94 32.92 34.40 34.48 36.49 38.38 Mechanised LW 0.44 0.58 0.52 0.54 0.80 1.10 Continuous Miner 0.64 1.12 1.58 0.90 1.66 2.87 Special Methods 0.21 0.50 0.79 0.81 0.91 1.18 TOTAL UNDERGROUND 43.54 43.96 45.50 44.36 46.35 49.16 CIL - TOTAL 379.46 403.73 435.00 435.00 460.50 486.50 SCCL Mechanised 27.96 32.46 31.70 33.57 33.75 34.75 TOTAL OPENCAST 27.96 32.46 31.70 33.57 33.25 34.75 Conventional B&P 4.83 4.13 3.17 3.05 1.62 1.23 Mechanised B&P (SDL/LHD) 5.23 5.95 6.44 6.06 7.62 6.15 Mechanised LW 1.13 0.89 1.19 0.89 0.99 2.88 Continous Miner 0.03 0.80 0.32 0.60 0.80 Scraper 0.00 0.00 0.00 0.10 0.07 0.00 Special Methods 1.46 1.09 1.20 1.02 1.35 1.20 TOTAL UNDERGROUND 12.65 12.09 12.80 11.43 12.25 12.25 SCCL - TOTAL 40.60 44.54 44.50 45.00 46.00 47.00

24
COAL PRODUCTION PROGRAMME – Grade-wise
(Million Tonnes)09 - 10 10 - 11 11 - 12 Company / Grade 07 - 08
Actual 08 - 09 Actual BE RE BE BE
ECL COKING (NLW)/Others W-II W-III 0.02 0.03 0.05 0.05 0.05 W-IV S.C-I 0.02 0.02 0.03 0.03 0.03 0.03
Sub Total 0.04 0.05 0.03 0.08 0.08 0.08 NON COKING Gr -A (LF) 1.00 0.93 0.91 0.65 1.00 1.05 Gr- B (LF) 9.65 10.61 10.44 9.99 10.78 11.31 Gr- C (LF) 2.86 3.13 3.97 3.65 3.63 3.73 Gr- D (LF) 1.69 1.10 1.90 2.95 3.04 3.18 Gr -A Gr- B 0.06 0.01 Gr- C 0.46 0.58 0.45 0.48 0.55 0.67 Gr- D 0.75 0.56 0.93 0.71 1.15 0.82 Gr- E 0.51 0.51 0.77 0.69 0.67 0.81 Gr- F 7.06 10.66 11.60 11.80 11.90 13.50 Gr-G 0.20 0.85
Sub Total 24.02 28.08 30.97 30.92 32.92 35.92 TOTAL - ECL 24.06 28.13 31.00 31.00 33.00 36.00 BCCL COKING (Met./LW) ST-I 0.08 0.08 0.10 0.08 0.16 0.16 ST-II 0.28 0.96 0.40 0.90 0.60 0.60 W-I 0.38 0.23 0.50 0.25 0.60 0.70 W-II 1.08 0.81 1.20 0.80 1.40 1.50 W-III 0.51 0.30 0.75 0.37 0.80 0.85 W-IV 1.20 1.11 1.30 1.70 0.70 0.79
Sub Total 3.54 3.48 4.25 4.10 4.25 4.60 COKING (Others) W-II W-III 0.15 0.07 0.16 0.17 0.18 W-IV 0.41 0.50 0.48 0.50 0.56 0.61 OTHERS (SLV) 0.03 0.01 0.03 0.06 0.02 0.02
Sub Total 0.59 0.58 0.66 0.55 0.75 0.81 COKING (NLW) NLW I & II 0.16 0.13 0.30 0.14 0.50 0.60 NLW III 2.88 3.52 3.10 3.20 4.50 5.90 NLW-IV 4.85 5.36 5.20 5.76 6.20 5.00
Sub Total 7.88 9.02 8.60 9.10 11.20 11.50 Total Coking 12.01 13.08 13.51 13.75 16.20 16.91 NON COKING (Others) Gr- A (LF) Gr- B (LF) Gr- C (LF) Gr -A Gr- B 0.07 0.08 0.08 0.09 0.03 0.03 Gr- C 5.19 4.39 5.74 5.05 7.07 6.76 Gr- D 6.64 5.92 6.97 7.31 5.20 5.80 Gr- E 1.32 2.04 1.70 1.30 0.50 0.50 Gr- F
Sub Total 13.21 12.43 14.49 13.75 12.80 13.09 TOTAL - BCCL 25.22 25.51 28.00 27.50 29.00 30.00

25
COAL PRODUCTION PROGRAMME – Grade-wise (Million Tonnes)
09 - 10 10 - 11 11 - 12 Company / Grade 07 - 08 Actual
08 - 09 Actual BE RE BE BE
CCL Coking (Met./LW) W-I 0.01 W-II 0.13 0.12 0.12 0.12 0.12 0.13 W-III 2.23 1.81 2.29 1.68 1.77 1.98 W-IV 2.15 1.62 2.29 1.80 2.06 2.24
Sub Total 4.50 3.55 4.70 3.60 3.96 4.35 Coking (NLW) W-II W-III 0.45 0.90 0.65 1.08 1.34 1.75 W-IV** 8.33 8.09 8.11 8.87 9.65 9.68
Sub Total 8.78 8.99 8.75 9.95 10.99 11.43 Total Coking 13.29 12.54 13.45 13.55 14.95 15.78 Non - Coking (Others) Gr -A Gr- B (Long Flame) 0.61 0.47 0.66 0.47 0.48 0.51 Gr- C (Long Flame) 2.39 2.19 2.25 2.17 2.55 2.92 Gr- D (Long Flame) 0.17 0.19 0.45 0.18 0.19 0.19 Gr- E 22.55 22.48 24.08 23.78 25.26 27.13 Gr- F 5.14 5.37 7.12 5.95 6.57 7.37 Gr- G 0.10
Sub Total 30.86 30.70 34.55 32.55 35.05 38.22 TOTAL - CCL 44.15 43.24 48.00 46.10 50.00 54.00 ** - Not suitable for feeding to washery due to poor washing characteristics. NCL NON COKING Gr -B (LF) 0.40 0.85 Gr -C (LF) 18.55 16.86 21.25 18.00 21.00 21.50 Gr -D (LF) 3.20 4.68 7.00 7.00 7.50 7.50 Gr- E 37.48 41.26 38.25 41.50 43.50 47.00 Gr- F TOTAL - NCL 59.62 63.65 66.50 66.50 72.00 76.00 WCL COKING (Met./LW) W-III 0.64 0.69 0.75 0.47 0.43 0.56 W - III (NLW) 0.03 0.04 0.04 0.04 0.04 0.04
Sub Total 0.68 0.73 0.79 0.51 0.47 0.60 NON COKING Gr -A (LF) Gr -B (LF) 0.56 0.60 0.51 0.44 0.50 0.50 Gr -C (LF) 1.25 2.29 1.32 1.41 1.52 1.66 Gr -D (LF) 19.24 16.12 18.97 19.46 19.45 18.80 Gr- E 21.79 24.97 23.27 24.19 24.41 25.14 Gr- F 0.14 0.15 0.30 Gr- G
Sub Total 42.84 43.97 44.21 45.49 46.03 46.40 TOTAL - WCL 43.51 44.70 45.00 46.00 46.50 47.00

26
COAL PRODUCTION PROGRAMME – Grade-wise (Million Tonnes)
09 - 10 10 - 11 11 - 12 Company / Grade 07 - 08 Actual
08 - 09 Actual BE RE BE BE
SECL Coking (Met./LW) W-IV S.C-I Sub Total Coking (NLW) S.C-II 0.16 0.15 0.17 0.16 0.17 0.17 Sub Total 0.16 0.15 0.17 0.16 0.17 0.17 NON COKING Gr -A (LF) Gr- B (LF) 0.00 0.00 0.30 0.37 0.30 0.30 Gr- C (LF) Gr- D (LF) Gr -A 2.81 2.61 1.74 2.58 2.56 1.89 Gr- B 9.74 9.86 9.92 9.61 9.81 9.92 Gr- C 10.02 9.58 9.14 9.54 9.59 10.99 Gr- D 3.73 4.44 5.58 4.73 5.42 7.85 Gr- E 0.00 0.00 0.20 0.00 0.00 Gr- F 67.34 74.52 78.95 80.61 84.15 85.88 Gr- G
Sub Total 93.63 101.00 105.83 107.44 111.83 116.83 TOTAL - SECL 93.79 101.15 106.00 107.60 112.00 117.00 MCL NON COKING Gr -A (LF) Gr -B (LF) 0.22 0.23 0.21 0.21 0.24 0.42 Gr -C (LF) 0.22 0.23 0.22 0.22 0.25 0.33 Gr -D (LF) 1.68 1.69 1.68 1.68 1.80 2.01 Gr- E 4.34 5.58 5.30 5.30 7.55 8.00 Gr- F 81.56 88.60 101.90 101.90 106.91 114.34 Gr- G
Sub Total 88.01 96.34 109.30 109.30 116.75 125.10 TOTAL - MCL 88.01 96.34 109.30 109.30 116.75 125.10 NEC NON COKING Gr -A (LF) 1.10 1.01 1.20 1.00 1.25 1.40 Gr -B (LF) Non Graded TOTAL - NEC 1.10 1.01 1.20 1.00 1.25 1.40 COAL INDIA LIMITED COKING (Met. /LW) ST-I 0.08 0.08 0.10 0.08 0.16 0.16 ST-II 0.28 0.96 0.40 0.90 0.60 0.60 W- I 0.38 0.24 0.50 0.25 0.60 0.70 W- II 1.21 0.93 1.32 0.92 1.52 1.63 W- III 3.38 2.80 3.79 2.52 3.01 3.39 W- IV 3.35 2.73 3.59 3.50 2.76 3.03 Sub Total 8.68 7.73 9.70 8.17 8.64 9.51

27
COAL PRODUCTION PROGRAMME – Grade-wise (Million Tonnes)
09 - 10 10 - 11 11 - 12 Company / Grade 07 - 08 Actual
08 - 09 Actual BE RE BE BE
COKING NLW / OTHERS W-II 0.00 0.00 0.00 0.00 0.00 0.00 W-III 0.62 1.00 0.81 1.13 1.56 1.98 W-IV 8.75 8.59 8.58 9.37 10.21 10.29 S.C-I & II 0.18 0.17 0.20 0.19 0.20 0.20 NLW-I 0.16 0.13 0.30 0.14 0.50 0.60 NLW-III 2.91 3.56 3.14 3.24 4.54 5.94 NLW-IV 4.85 5.36 5.20 5.76 6.20 5.00 OTHERS (SLV) 0.03 0.01 0.03 0.06 0.02 0.02 Sub Total 17.49 18.82 18.25 19.88 23.23 24.03 Sub Total (Coking) 26.17 26.56 27.95 28.05 31.87 33.54 NON COKING Gr -A (LF) 2.10 1.94 2.11 1.65 2.25 2.45 Gr- B (LF) 10.83 12.76 11.46 11.01 11.82 12.53 Gr- C (LF) 22.87 24.70 26.76 23.27 26.40 27.22 Gr- D (LF) 25.80 23.77 29.54 31.08 31.79 31.49 Gr -A 2.81 2.61 1.74 2.58 2.56 1.89 Gr- B 10.48 9.95 10.66 10.17 10.32 10.46 Gr- C 18.06 14.55 17.58 17.24 19.76 21.34 Gr- D 11.28 10.92 13.93 12.93 11.96 14.66 Gr- E 87.97 96.85 93.57 96.76 101.89 108.58 Gr- F 161.10 179.15 199.71 200.26 209.68 221.39 Gr- G 0.00 0.00 0.00 0.00 0.20 0.95 Sub Total (Non Coking) 353.30 377.17 407.05 406.95 428.63 452.96 CIL - TOTAL 379.46 403.73 435.00 435.00 460.50 486.50 SINGARENI COLLIERIES COMPANY LIMITED NON COKING Gr- A 0.04 Gr- B 0.547 0.752 1.180 0.890 0.860 0.805 Gr- C 7.181 7.053 6.100 6.270 6.170 5.695 Gr- D 7.094 8.013 10.150 9.496 10.105 10.945 Gr- E 12.884 14.326 14.955 16.028 15.555 17.560 Gr- F 11.819 13.231 11.145 10.942 11.880 11.575 Gr- G 1.077 1.071 0.970 1.072 1.430 0.420 Ungrade 0.002 0.100 0.000 0.263 0.000 0.000 SCCL - TOTAL 40.604 44.546 44.500 45.000 46.000 47.000

28
COAL PRODUCTION PROGRAMME - MASS PRODUCTION - TECHNOLOGY WISE
(Million Tonnes) Specification of Face 09 - 10 10 - 11 BE 11 - 12
BE Longwall Collaborator Support
(Tonnes) Shearer (KW)
Height (Mtrs) Length (Mtrs.)
Depth of Cut
(Mts)
07 - 08 Actual
08 - 09 Actual
BE RE BE BE
A. Longwall ECL - Chinakuri 0.016 0.023 0.03 0.03 0.03 0.03 Jhanjra
Churcha Set British 4x680 380 1.65-3.2 150 0.600 R6 / Panel AW10 0.12 0.11 0.11
Dhemomain Set Gullic 4x550 380 2-3 150 0.600 Satgram Set Gullic 4x550 380 1.82-3.4 150 0.600
Chinese / Russian 2x314 2x200 2-2.5 150 0.600 Panel - AE2 0.070 0.130
Total Longwall 0.07 0.093 0.15 0.160 0.14 0.14 Roadheader /
Cont.Miner / Others 0.52 0.62 0.96 0.58 0.87 1.05
Sub-Total * * Including road-header 0.59 0.712 1.11 0.74 1.01 1.19 BCCL - Moonidih 0.19 0.28
Dowty 4x325 200 2.50 60 0.60 Dowty 4x400 375 2.50 150 0.75 0.11 0.07 0.15 0.10 0.00
Jessop & W-Falia 2x360 100/200 1.20 150 0.60 Proposed New equip. 0.32 0.65
Roadheader Dev Sub-Total 0.11 0.07 0.15 0.10 0.32 0.65
SECL A. Longwall
Balrampur PSLW Chinese 4x440 375 2.0 150.00 0.60 0.06 0.36 0.24 0.26 0.24 0.24 New Kumda PSLW Chinese 4x440 375 2.0 150.00 0.60 0.00 0.00 0.00
Rajendra PSLW Chinese 4x440 375 2.5 150.00 0.60 0.13 0.00 0.00 Badauli Extn.
Sub-Total 0.19 0.36 0.24 0.26 0.24 0.24 Total LW 0.88 1.14 1.50 1.10 1.57 2.08

29
COAL PRODUCTION PROGRAMME - MASS PRODUCTION - TECHNOLOGY WISE
(Million Tonnes Specification of Face 09 - 10 10 - 11
BE 11 - 12
BE Mass Production Technology Collaborator Support
(Tonnes)Shearer (KW)
Height (Mtrs) Length (Mtrs.)
Depth of Cut
(Mts)
07 - 08 Actual
08 - 09 Actual
BE RE BE BE
B. Continuous Miner SECL
Chirmiri"0" Seam JOY KIER NCPH JOY KIER 0.12 0.20 0.30 0.21 0.30 0.30
Vindhya DBT Pinoura SANCHETI
Sheetaldhara Yet to be finalised 0.30 Sub-Total 0.12 0.20 0.30 0.21 0.30 0.60
WCL Tandsi Expn JOY ENGG. 0.20 0.23 0.31 0.15 0.21 0.33
Kumberkhani (Incl. C.M.Sch.) 0.06 0.11 0.18 0.09 0.18 0.18 Maori Block with CM Package 0.00 0.14 0.00 0.15 0.30
Saoner Mine - I Expn 0.00 0.11 0.00 0.00 0.05 Sub-Total 0.26 0.34 0.74 0.24 0.54 0.86
Total Cont. Miner (CIL) 0.37 0.54 1.04 0.45 0.84 1.46 SECL C. Short wall
Balrampur Chinese 0.09 0.26 0.24 0.30 0.30 Sub - Total 0.09 0.26 0.24 0.30 0.30 0.00
Total Short-wall (CIL) 0.09 0.26 0.24 0.30 0.30 0.00

30
ANNUAL PLAN 2010-11 - STATUS OF MECHANISED LONGWALL FACES - SCCL
Sl. Name of Face Manufacturer Support Shearer Face No. Tonnes KW Length
(Mt) 2008-09 2009-10 2010-11 2011-12
Height (Mt)
Depth of Cut (Mt)
Actual Target RE Proposed Proj. 1 EXISTING FACE i V.K.-7 U.K. 360 375 3 120 0.60 0.00 0.00 0.00 0.00 0.00 ii J.K.-5 U.K. 450 2x380 3 150 0.85 0.00 0.00 0.00 0.00 0.00 iii G.D.K.-10A. U.K.(MAMC/MECO) 4 = 750 2X375 3.3 150 0.85 0.43 0.70 0.70 0.70 0.60 iv VAKILPALLI BLOCK. CHINA. 4 = 750 2X375 3.3 120 0.85 0.34 0.33 0.00 0.00 0.00 v PADMAVATIKHANI-1 CHINA. 4 = 775 2X300 3 150 0.60 0.00 0.00 0.00 0.00 0.00 2 ON-GOING FACES. vi VKP BLOCK A 2 SEAM LW/GDK
10A 2 SEAM LW
vii ADRIYALA LW
3 NEW PROJECTS. - - - - -
GDK-7/9: THE PACKAGE IS SURVEYED OFF IN AUG.90. VK-7 MINI LW: THIS FACE IS FORMED FROM OUT LIVED V.K.-7 ORIGINAL LONGWALL EQUIPMENT. GDK-11A – I: TRANSFERRED TO VK-7 DURING 1994-95. GDK-11A - II: EQUIPMENT SURVEYED OFF IN FEB.99. GDK-11A - III: EQUIPMENT SURVEYED OFF IN FEB.99. PADMAVATIKHANI-II: TRANSFERRED TO VAKILPALLI BLOCK. R.K. NEW TECH. (2 UNITS): SCCL BOARD HAS APPROVED WITHDRAWAL OF LW -TECHNOLOGY IN FEB. 2001. JK-5: SURVEYED OFF PADMAVATIKHANI-I: SURVEYED OFF

31
COKING COAL AVAILABILITY AND WASHED COAL PRODUCTION PLAN
Million Tonnes 07 - 08 08 - 09 08-09 09 - 10 09 - 10 10 - 11 PARTICULARS Actual
BE RE Act BE RE BE
I. RAW COKING COAL (a) Washery Feed CIL Washeries BCCL 3.18 4.22 3.30 3.31 3.50 2.84 4.00 CCL 4.14 5.35 4.35 3.51 4.70 3.60 3.96 WCL 0.65 0.79 0.66 0.70 0.75 0.47 0.43 Sub Total 7.97 10.36 8.31 7.52 8.95 6.91 8.39 SAIL & Others Washeries BCCL 0.02 0.60 0.60 0.70 0.76 (b) Direct Feed BCCL 0.04 0.04 0.05 0.08 0.05 0.41 0.26 . (TISCO/ VIZAC/SAIL) ECL 0.02 0.03 0.03 0.03 0.03 0.03 0.03 SECL 0.16 0.16 0.17 0.15 0.17 0.16 0.17 Sub Total 0.22 0.23 0.25 0.26 0.25 0.60 0.46 (c) Own Hard Coke Ovens/ BCCL 0.16 0.03 0.03 0.05 0.05 0.10 0.10 Cokeries etc. CCL 0.00 ECL WCL 0.03 0.05 0.04 0.04 0.04 0.04 0.04 (d) DCOP, Pvt./ Others BCCL 0.04 0.03 0.02 0.03 0.05 0.05 0.05 Total Raw Coal - BCCL 3.41 4.34 4.00 4.25 4.10 5.17 Total Raw Coal - CIL 8.42 10.72 9.25 7.89 9.94 8.40 9.80 II. WASHED COAL TO STEEL PLANTS BCCL 1.66 2.41 1.83 1.60 2.10 1.52 1.70 CCL 1.84 2.40 2.00 1.71 2.20 1.80 2.00 WCL 0.33 0.39 0.32 0.37 0.37 0.23 0.21 WASHED COAL TO DCOP/
OTHERS BCCL
TOTAL CIL 3.83 5.20 4.16 3.68 4.67 3.55 3.91

32
COKING COAL PRODUCTION PROGRAMME - WASHERYWISE
CC - Clean Coal, RAW - Raw Coal Million Tonnes
Sl. Operating <------ACT 08 - 09 ----------> <------BE 09 - 10 ----------> <------RE 09 - 10 ----------> <------BE 10 - 11 ---------->
No Washery Capacity RAW CC % Yield Middling RAW CC % Yield Middling RAW CC % Yield Middling RAW CC % Yield Middling MTY INPUT OUTPUT INPUT OUTPUT INPUT OUTPUT INPUT OUTPUT
BCCL A. PRIME COKING
1 DUGDA 2.00 0.65 0.35 53.30 0.00 0.75 0.37 49.33 0.00 0.61 0.27 44.21 0.00 0.80 0.40 50.00 0.00 2 BHOJUDIH 1.70 0.80 0.49 60.63 0.25 0.90 0.54 60.00 0.27 0.74 0.36 48.98 0.32 0.90 0.52 57.78 0.29 3 PATHERDIH 1.60 0.24 0.09 37.71 0.12 0.25 0.10 40.00 0.12 0.19 0.07 38.92 0.08 0.30 0.12 40.00 0.15 4 SUDAMDIH 1.60 0.57 0.19 32.46 0.39 0.70 0.23 32.86 0.42 0.52 0.19 36.92 0.29 0.70 0.25 35.00 0.42 5 MOONIDIH 1.60 0.58 0.33 57.02 0.22 0.75 0.45 60.00 0.23 0.68 0.37 54.73 0.27 0.80 0.48 60.00 0.24 6 MADHUBAN** 0.37 0.07 0.07 0.00 1.00 0.28 28.00 0.50 0.00 0.00 0.00 0.00 0.00 0.00 0.00 0.00
SUB-TOTAL (A) 8.50 3.20 1.51 47.02 0.98 4.35 1.97 45.29 1.54 2.73 1.27 46.35 0.95 3.50 1.77 50.43 1.10 MEDIUM COKING
1 MOHUDA 0.63 0.11 0.10 86.73 0.01 0.15 0.13 86.67 0.02 0.11 0.10 88.07 0.02 0.20 0.18 87.50 0.03 TOTAL BCCL 9.13 3.31 1.60 48.37 0.99 4.50 2.10 46.67 1.56 2.84 1.36 47.96 0.96 3.70 1.94 52.43 1.13
** - MADHUBAN Washery is now temporarily washing Non – Coking Coal since 08 – 09.
CCL MEDIUM COKING
1 Kathara 3.00 0.84 0.32 38.00 0.34 1.20 0.48 40.00 0.42 0.80 0.30 37.50 0.30 0.90 0.34 37.80 0.40 2 Sawang 0.75 0.54 0.26 47.00 0.24 0.70 0.34 48.57 0.30 0.60 0.30 50.00 0.25 0.66 0.33 49.20 0.30 3 Rajrappa 3.00 1.04 0.61 59.00 0.26 1.50 0.84 56.00 0.39 1.20 0.70 58.30 0.30 1.30 0.78 60.00 0.35 4 Kedla 2.60 1.08 0.52 48.00 0.40 1.30 0.54 41.54 0.55 1.00 0.50 50.00 0.35 1.10 0.55 50.00 0.40
TOTAL CCL 9.35 3.50 1.71 48.80 1.24 4.70 2.20 46.81 1.65 3.60 1.80 50.00 1.20 3.96 2.00 50.51 1.45 WCL
1 Nandan 1.20 0.70 0.37 52.29 0.25 0.75 0.37 48.94 0.27 0.47 0.23 49.00 0.17 0.43 0.21 49.00 0.16
TOTAL - CIL 19.68 7.51 3.68 48.94 2.49 9.95 4.67 46.91 3.48 6.91 3.39 49.10 2.33 8.09 4.15 51.30 2.73
No. of Coking Coal Washery – 12.

33
NON COKING COAL PRODUCTION PROGRAMME - WASHERYWISE
CC - Clean Coal, RAW - Raw Coal Million Tonnes
Sl. Operating <------ACT 08 - 09 ----------> <------Target 09 - 10 ----------> <------RE 09 - 10 ----------> <------BE 10 - 11 ---------->
No Washery Capacity RAW CC % Yield % Utilisation
RAW CC % Yield % Utilisation
RAW CC % Yield % Utilisation
RAW CC % Yield % Utilisation
MTY INPUT OUTPUT INPUT OUTPUT INPUT OUTPUT INPUT OUTPUT
BCCL
1 Dugda - 1 1.00 0.33 0.26 80.06 32.60 0.30 0.25 30.00 0.41 0.29 70.73 41.00 0.36 0.29 80.58 36.00
Madhuban 2.50 0.47 0.61 129.70 18.72 0.30 0.27 90.00 12.00 0.40 50.00 0.00 0.00 0.40 50.00 0.00
Sub Total 3.50 0.79 0.87 109.32 22.69 0.60 0.52 86.67 17.14 0.41 0.69 57.02 11.71 0.36 0.69 59.48 10.29
CCL
1 Giddi 2.50 0.57 0.37 64.00 23.00 0.90 0.55 61.11 36.00 0.60 0.38 63.00 24.00 0.80 0.51 64.00 32.00
2 Kargali 2.72 0.58 0.54 94.00 21.00 0.75 0.70 93.33 27.57 1.00 0.78 78.00 37.00 1.13 0.86 77.00 42.00
3 Piparwar 6.50 6.82 5.93 87.00 105.00 6.60 5.55 84.09 101.54 6.85 5.95 87.00 105.00 6.85 5.95 87.00 105.00
Sub Total 11.72 7.97 6.84 85.75 68.04 8.25 6.80 82.42 70.39 8.45 7.11 84.14 72.10 8.78 7.32 83.37 74.91
NCL
1 Bina 4.50 4.01 3.58 89.23 89.11 3.95 3.36 85.01 87.73 3.95 3.36 85.01 87.73 3.95 3.36 85.01 87.73
Total CIL 19.72 12.78 11.28 88.31 64.80 12.80 10.68 83.42 64.90 12.81 11.16 87.10 64.95 13.09 11.37 86.84 66.37
No. of Non – Coking coal Washery – 5. Madhuban Washery is temporarily washing Non – Coking Coal.

34
MANPOWER ADDITION / REDUCTION PLAN
31.3.2007 31.3.2008 31.3.2009 31.3.2010 31.3.2010 31.3.2011
Actual Actual Actual BE RE Proj. Company / Items
06-07 07-08 08-09 09 - 10 09 - 10 10 - 11
ECL Manpower as on 98780 94943 90470 84756 85473 80954 Net - Addn (+)/Redn(-) -2694 -3837 -4473 -5156 -4997 -4519 BCCL Manpower as on 83578 80051 76369 72469 73304 69454 Net - Addn (+)/Redn(-) -3568 -3527 -3682 -4096 -3065 -3850 CCL Manpower as on 61610 58808 56553 52992 53815 50875 Net - Addn (+)/Redn(-) -2590 -2802 -2255 -2737 -2738 -2940 NCL Manpower as on 16726 16697 16450 17553 17553 17505 Net - Addn (+)/Redn(-) -188 -29 -247 314 1103 -48 WCL Manpower as on 65599 64160 62492 63385 63008 64270 Net - Addn (+)/Redn(-) -1779 -1439 -1668 -606 516 1262 SECL (incl. DCC) Manpower as on 85015 83423 82054 79643 81377 79811 Net - Addn (+)/Redn(-) -1503 -1592 -1369 -1917 -677 -1566 MCL Manpower as on 20591 20786 20869 23800 22155 23068 Net - Addn (+)/Redn(-) -285 195 83 2700 1286 913 CMPDIL Manpower as on 3127 3048 3065 3408 3160 3000 Net - Addn (+)/Redn(-) -107 -79 17 24 95 -160 NEC Manpower as on 3210 3072 2962 2824 2818 2602 Net - Addn (+)/Redn(-) -181 -138 -110 -123 -144 -216 CIL(HQ) Manpower as on 1107 1089 1066 1061 1061 1006 Net - Addn (+)/Redn(-) -49 -18 -23 -14 -5 -55 CIL 439343 426077 412350 401891 403724 392545 Net - Addn (+)/Redn(-) -12944 -13266 -13727 -11611 -8626 -11179 SCCL 82224 75573 70586 68989 69370 67692 Net - Addn (+)/Redn(-) -3801 -6651 -4987 -1853 -1216 -1678

35
VOLUNTARY RETIREMENT SCHEME (VRS) (Number of Employees)
Company 07 - 08 08 - 09 09 - 10 09 - 10 10 - 11
Actual Actual Tar/BE RE Tar/BE
ECL 491 330 1000 1000 NIL
BCCL NIL NIL NIL NIL NIL
CCL 347 220 500 500 350
NCL NIL NIL NIL NIL NIL
WCL 164 NIL NIL NIL NIL
SECL+DCC 45 47 50 50 NIL
MCL 52 33 55 10 50
Others # 49 19 25 32 30
CIL (Total) 1148 649 1630 1592 430
# Others include CMPDIL/NEC/CIL (HQ)

36
Productivity --- Output per Manshift (OMS)
(Tonnes / Manshift)COMPANY 07 - 08 08 - 09 2009 - 10 2010-11 Actual Actual BE RE BE ECL UG 0.43 0.46 0.52 0.49 0.58 OC 5.04 6.42 8.72 7.44 8.13 Total 1.07 1.33 1.53 1.52 1.71 BCCL UG 0.42 0.41 0.44 0.38 0.42 OC 3.08 2.91 6.34 5.41 5.83 Total 1.18 1.22 1.98 1.84 2.02 CCL UG 0.39 0.36 0.44 0.38 0.42 OC 4.66 4.65 5.51 5.33 5.35 Total 3.22 3.27 3.76 3.70 3.87 NCL UG OC 13.81 14.58 16.30 14.66 17.98 Total 13.81 14.58 16.30 14.66 17.98 WCL UG 1.11 1.14 1.12 1.12 1.12 OC 4.06 3.99 4.29 4.15 4.22 Total 2.52 2.55 2.60 2.60 2.62 SECL UG 1.19 1.26 1.21 1.29 1.33 OC 14.30 15.76 17.55 15.45 17.38 Total 4.83 5.26 5.45 5.46 5.84 MCL UG 1.18 1.25 1.14 1.15 1.23 OC 23.57 23.06 28.75 21.21 24.10 Total 16.19 16.60 19.57 15.88 17.67 NEC UG 0.20 0.10 0.00 0.00 0.00 OC 8.09 7.83 9.68 9.71 12.14 Total 1.88 1.77 2.05 2.05 2.56 Overall CIL UG 0.73 0.76 0.78 0.77 0.83 OC 8.60 8.95 10.91 9.81 10.62 Total 3.79 4.09 4.61 4.48 4.87 SCCL UG 1.02 1.05 1.18 1.04 1.18 OC 10.76 10.60 10.75 11.61 15.33 Total 2.63 3.01 3.30 3.25 3.63


38
% UTILISATION OF MACHINERY IN O.C. MINES w.r.t. STANDARD NORMS OF
CMPDIL (% Achievement of Norm) Sl. No. Company 2008-09 2009-10 2010-11 Actual Target Anticipd. Proposed I. DRAGLINE
1 ECL 108 123 110 110 2 BCCL 69 83 83 85 3 CCL - - - - 4 NCL 103 99 98 99 5 WCL 108 100 100 100 6 SECL 103 100 100 100 7 MCL 81 95 81 92 8 CIL 99 98 96 98
II. SHOVEL
1 ECL 84 80 85 85 2 BCCL 82 88 88 88 3 CCL 78 83 79 80 4 NCL 66 56 57 57 5 WCL 93 90 90 90 6 SECL 104 100 105 105 7 MCL 82 77 83 85 8 CIL 84 81 83 83
III. DUMPER
1 ECL 70 67 70 70 2 BCCL 63 63 63 64 3 CCL 68 74 70 71 4 NCL 71 59 58 59 5 WCL 83 73 73 73 6 SECL 87 100 84 88 7 MCL 58 62 59 62 8 CIL 72 69 68 69
IV. DRILL
1 ECL 55 55 55 55 2 BCCL 60 57 57 58 3 CCL 61 70 63 64 4 NCL 60 36 36 37 5 WCL 72 70 70 70 6 SECL 103 100 102 102 7 MCL 93 89 94 94 8 CIL 72 63 63 64
V. DOZER
1 ECL 66 63 67 67 2 BCCL 53 51 51 52 3 CCL 58 64 59 60 4 NCL 44 39 39 39 5 WCL 70 69 69 69 6 SECL 63 100 64 67 7 MCL 68 73 67 74 8 CIL 60 64 58 59

39
Singareni collierie Company Limited
ANNUAL PLAN 2010-11 - COMPANYWISE PRODUCTIVITY OF HEMM & % UTILISATION
2008-09 2009-10 2010-11 2011-12 SL.
NO. Company/ HEMM.
Actual Target Anticipated Proposed Proj. 1 DRAGLINE 53 73 47 70 70 2 SHOVEL 52 61 52 50 50 3 DUMPER 36 50 35 45 45 4 DRILLS - - - - - 5 DOZER 31 45 31 40 40
*Since drills are supposed to be worked for 2 shifts per day only (leaving the 3rd shift for
maintenance), CMPDIL had not assessed any net machine available hours for these
equipment. As such, these were not being included in the equipment.

40
CAPITAL EXPENDITURE / OUTLAY - MOC Rs Crores
Company 07 - 08 08 - 09 09 - 10 09 - 10 10 - 11 XI Plan Actual Act. BE RE BE Now
Revised (A) Central PSUs under MOC ECL 161.79 191.88 210.00 250.00 400.00 1503.67 BCCL 133.82 221.16 230.00 300.00 350.00 1424.98 CCL 297.84 334.84 420.00 350.00 350.00 1832.68 NCL 404.71 266.52 730.00 600.00 800.00 3071.23 WCL 176.05 277.92 230.00 350.00 350.00 1623.97 SECL 560.42 855.98 730.00 700.00 600.00 3316.40 MCL 276.16 321.26 200.00 400.00 650.00 2547.42 NEC 1.86 3.92 10.00 10.00 15.00 45.78 OTHERS ** 20.86 33.69 140.00 140.00 285.00 724.55 CIL 2033.51 2507.17 2900.00 3100.00 3800 +
6000 ## 16090.68
** CIL/DCC/IICM/CMPDIL/Exploration through Outsource/R&D ## Rs 6000 Crs. Ad-hoc provision for Acquisition of assets in abroad SCCL 573.97 650.44 580.57 633.94 1334.93 3802.07 NLC - MINES 578.54 400.05 524.09 386.40 313.94 2334.39 - POWER 1188.17 1159.10 1369.75 844.94 1669.52 6140.61 Total NLC 1766.71 1559.15 1893.84 1231.34 1983.46 8475.00
Total (Coal PSUs) 4374.19 4716.76 5374.41 4965.28 7118.39 + 6000 ##
28367.75
(B) Central Sector Schemes: Research & Dev. Programme (S&T) 12.86 10.00 20.00 11.00 10.00 75.35 Regional Exploration 34.99 30.00 30.39 30.39 68.00 305.82 Detailed Drilling-Non CIL Block 40.00 15.00 60.00 60.00 110.00 523.08 EMSC (incl. RCFS/RFRP IX Plan fig.) 17.99 10.00 15.00 10.53 30.00 1757.44 Conservation & Safety in coal mines 150.38 132.00 135.00 135.00 135.00 690.75 Development of transportation Infra-structure in Coalfield Areas
23.58 0.00 22.00 0.01 22.00 930.92
VRS (Funded thro' DBS)
-
Coal Controller 0.49 0.31 0.33 0.25 180.00 Information Technology 3.00 0.25 0.45
NE Component #1 14.30 12.49 24.30 Total Central Sector Schemes 279.80 197.49 300.00 260.00 400.00 4463.36 TOTAL MOC 4653.99 4914.25 5674.41 5225.28 7518.39 +
6000 ## 32831.11
Note: #1 The provision for NEC would depend on the final allocation of budgetary support to MoC for XI Plan as a whole. ## CIL has kept Rs 6000 Crs Adhoc provision for Acquisition of assets in abroad

41
STATEWISE BREAK-UP OF CAPITAL EXPENDITURE & OUTLAY
Rs. CroresSTATE COMPANY 07 - 08
Act. 08 - 09
Act. 09 - 10
BE 09 - 10
RE 10 – 11
BE
WB ECL 139.80 117.62 154.05 154.53 254.99 BCCL 0.80 0.03 1.00 1.00 0.50
TOTAL WB 140.60 117.65 155.05 155.53 255.49 JHARKHAND ECL 21.99 74.26 55.95 95.47 145.01 BCCL 133.02 221.13 229.00 299.00 349.50 CCL 297.84 334.84 420.00 350.00 350.00
TOTAL JHARKHAND 452.85 630.23 704.95 744.47 844.51 ORISSA MCL 276.16 321.26 200.00 400.00 650.00 U.P NCL 74.82 85.94 189.46 141.14 92.15 M.P NCL 329.89 180.58 540.53 458.86 707.85 WCL 29.38 23.38 38.20 64.10 69.87 SECL 66.53 94.57 69.10 70.10 54.03
TOTAL MP 425.80 298.53 647.83 593.06 831.75 CHATRISHGARH SECL 493.88 761.41 660.90 629.90 545.97 MAHARASTRA WCL 146.67 254.55 191.80 285.90 280.13 ASSAM NEC 1.86 3.92 10.00 10.00 15.00
Others** 20.86 33.69 140.00 140.00 285.00
CIL (Total) 2033.51 2507.17 2900.00 3100.00 3800.00 +6000.00 ##
Note: Others** - Consolidated expenditure / Budget spread in all States. ## - Rs. 6000.00 Crore Ad-hoc provision for acquisition of assets in abroad
AP SCCL 573.97 650.44 580.57 633.94 1334.93 TN NLC 1261.52 1074.40 1605.65 965.25 1765.23 RAJASTHAN NLC 505.00 484.59 275.34 260.89 194.17 ORISSA NLC 0.03 0.12 2.00 3.73 6.50 GUJRAT NLC 0.16 0.04 1.85 0.17 1.33 JHARKHAND NLC 1.00 0.10 1.00 MP NLC 2.00 0.10 1.70 Chattisgarh NLC 1.00 0.10 1.00 U.P 5.00 1.00 12.53
Note: Expenditure & outlay of the departmental schemes of MoC not included

42
GROUP-WISE CAPITAL EXPENDITURE & OUTLAY PLAN
Rs. CroreX Plan 07 - 08 08 - 09 09 - 10 10 - 11 GROUP/ COMPANY
Actual Actual Actual BE RE BE
ECL Existing Mines & Completed Projects 548.17 124.11 160.08 148.25 156.19 247.76 On Going Projects 22.09 28.39 25.40 13.50 60.28 109.09 Future Projects 14.77 0.00 27.48 12.10 19.15 TOTAL MINING 585.03 152.50 185.48 189.23 228.57 376.00 Other Non Mining 13.73 8.57 2.25 5.77 6.43 9.00 Exploration + P&D 10.76 0.72 4.15 15.00 15.00 15.00 Others 24.49 9.29 6.40 20.77 21.43 24.00
TOTAL ECL 609.53 161.79 191.88 210.00 250.00 400.00
BCCL Existing Mines & Completed Projects 628.16 112.89 192.56 183.80 227.60 232.95 On Going Projects 20.45 2.03 10.47 9.00 16.60 11.30 Future Projects 4.05 2.50 0.70 7.70 TOTAL MINING 652.66 114.92 203.03 195.30 244.90 251.95 Washery 2.20 0.46 0.31 15.50 19.25 51.35 Other Non Mining 2.29 0.04 5.50 5.10 11.70 Exploration + P&D 20.39 18.39 17.81 13.70 30.75 35.00 Others 24.88 18.89 18.13 34.70 55.10 98.05
TOTAL BCCL 677.54 133.82 221.16 230.00 300.00 350.00
CCL Existing Mines & Completed Projects 900.94 136.64 144.96 249.68 132.50 59.00 On Going Projects 176.28 128.21 136.18 123.82 165.00 233.00 Future Projects 0.00 3.00 3.00 3.00 Adv. Action Projects 9.09 TOTAL MINING 1086.31 264.85 281.14 376.50 300.50 295.00 Washery 12.72 0.99 2.23 6.50 5.00 20.00 Other Non Mining 105.87 18.48 19.18 10.50 18.00 10.00 Exploration + P&D 85.76 13.53 32.29 26.50 26.50 25.00 Others 204.35 32.99 53.70 43.50 49.50 55.00
TOTAL CCL 1290.66 297.84 334.84 420.00 350.00 350.00
NCL Existing Mines & Completed Projects 612.67 98.45 73.18 241.44 250.67 150.02 On Going Projects 674.80 290.05 177.11 431.78 295.74 588.23 Future Projects 56.15 Adv. Action Projects 3.01 TOTAL MINING 1346.63 388.50 250.29 673.22 546.41 738.25 Washery / D.plant Other Non Mining 51.06 16.21 56.78 28.59 35.75 Exploration + P&D 1.84 25.00 26.00 Others 52.90 16.21 16.23 56.78 53.59 61.75
TOTAL NCL 1399.53 404.71 266.52 730.00 600.00 800.00

43
GROUP-WISE CAPITAL EXPENDITURE & OUTLAY PLAN Rs. Crore
X Plan 07 - 08 08 - 09 09 - 10 10 - 11 GROUP/ COMPANY
Actual Actual Actual BE RE BE
WCL Existing Mines & Completed Projects 615.13 126.90 185.20 114.00 152.16 172.50 On Going Projects 154.94 21.91 51.07 70.42 127.44 108.62 Future Projects 5.65 4.16 10.40 TOTAL MINING 770.07 148.81 236.27 190.07 283.75 291.52 Washery 0.59 1.15 0.36 0.18 1.40 3.15 Other Non Mining 78.97 2.55 6.54 14.76 27.85 18.34 Exploration + P&D 105.49 23.54 34.75 25.00 37.00 37.00 Others 185.05 27.24 41.65 39.94 66.25 58.49
TOTAL WCL 955.13 176.05 277.92 230.00 350.00 350.00
SECL Existing Mines & Completed Projects 908.02 193.72 167.32 39.92 39.92 40.20 On Going Projects 277.70 315.32 624.14 522.76 580.53 478.39 Future Projects 12.76 109.32 2.50 Adv Action Projects TOTAL MINING 1198.48 509.04 791.46 672.00 620.45 521.09 Other Non Mining 84.99 19.13 64.52 17.62 24.55 23.91 Exploration + P&D 105.82 32.25 40.38 55.00 55.00 Others 190.81 51.38 64.52 58.00 79.55 78.91
TOTAL SECL 1389.29 560.42 855.98 730.00 700.00 600.00
MCL Existing Mines & Completed Projects 403.01 90.00 121.41 85.95 187.01 226.60 On Going Projects 250.71 114.77 121.96 75.55 132.40 152.33 Future Projects 13.74 1.60 Adv Action Projects TOTAL MINING 672.00 204.77 243.37 163.10 319.41 378.93 Washery 20.00 Other Non Mining 154.54 67.59 57.89 16.90 50.59 216.00 Exploration + P&D 1.93 3.80 20.00 20.00 30.00 35.07 Others 156.47 71.39 77.89 36.90 80.59 271.07
TOTAL MCL 828.46 276.16 321.26 200.00 400.00 650.00
NEC Existing Mines & Completed Projects 7.53 1.63 3.05 5.00 3.00 6.00 On Going Projects 0.00 Future Projects & Adv action 0.75 0.34 4.44 6.00 TOTAL MINING 8.27 1.63 3.38 5.00 7.44 12.00 Other Non Mining 0.53 0.50 0.50 Exploration 2.06 2.5 Others 0.96 0.23 0.53 5.00 2.56 3.00
TOTAL NEC 9.23 1.86 3.92 10.00 10.00 15.00

44
GROUP-WISE CAPITAL EXPENDITURE & OUTLAY PLAN Rs. Crore
X Plan 07 - 08 08 - 09 09 - 10 10 - 11 GROUP/ COMPANY
Actual Actual Actual BE RE BE
CIL Existing Mines & Completed Projects 4623.62 884.34 1047.76 1068.04 1149.05 1135.03On Going Projects 1581.51 900.68 1146.33 1246.83 1377.99 1680.96Future Projects 102.22 0.00 0.34 149.55 24.40 48.75 Adv Action Projects 12.10 0.00 0.00 0.00 0.00 0.00 TOTAL MINING 6319.44 1785.02 2194.42 2464.42 2551.43 2864.74Washery 15.51 2.60 2.90 22.18 25.65 74.50 Other Non Mining 492.41 132.80 150.91 132.83 163.67 327.70 Exploration + P&D 331.99 92.23 109.00 140.58 219.25 228.07 Others 839.91 227.62 279.05 295.59 408.57 650.27 (CMPDIL/CIL (HQ)/DCC/IICM/R&D)
48.87 20.86 33.69 140.00 140.00 285.00
TOTAL CIL 7208.22 2033.51 2507.17 2900.00 3100.00 3800.00 +6000.00
## ## Note: - Rs. 6000.00 Crore Ad-hoc provision for acquisition of assets in abroad.
SCCL MINING Existing Mines & Completed Projects 770.17 329.45 249.54 51.60 137.20 108.75 On Going Projects 392.28 141.82 250.43 399.60 329.93 392.18 Future Projects 3.86 0.00 2.60 24.00 90.00 135.00 TOTAL MINING 1166.31 471.27 502.57 475.20 557.13 635.93 NON-MINING Other Projects 279.28 102.16 146.37 102.37 74.31 696.00 Exploration + P&D 5.00 0.54 1.50 3.00 2.50 3.00 TOTAL NON-MINING 284.28 102.70 147.87 105.37 76.81 699.00
TOTAL SCCL 1450.59 573.97 650.44 580.57 633.94 1334.93

45
ESTIMATES OF INTERNAL & EXTERNAL BUDGETARY RESOURCES (IEBR) FOR XI th FIVE YEAR PLAN
(2007-08 to 2010-11) AND PERFORMANCE IN XTH FIVE YEAR PLAN
Appendix-3 / Annexure -III
NAME OF THE COMPANY: - COAL INDIA LIMITED
PART I: Retained Profit / Surplus
Tenth ELEVENTH PLAN SL D E S C R I P T I O N Plan 2007-08 2008-09 2009-10 2010-11 NO (Actual) Actual Actual RE BE 1 RECEIPTS
(i) Gross Sales/ 126227.06 32536.60 38788.83 42162.65 46641.43
Operating income
(NET OF LEVIES)
(ii) Other income 8583.65 2898.71 4641.67 3533.49 3440.46
(iii) Total 134810.71 35435.31 43430.50 45696.14 50081.89
2 OPERATING COST
(i) Salaries & Wages 47889.23 12384.56 19742.09 16273.60 17151.17
(iv) Other cost 43266.72 11420.96 14235.52 15963.82 17577.25
(v) Total (2) 91155.95 23805.52 33977.61 32237.42 34728.42
3 DEPERCIATION / PROVISION AND WRITEOFFS
(i) Depreciation 7443.95 1626.29 1736.90 1585.41 1745.32
(ii) DRE / Write-off (OBR adj.) 6419.88 1964.09 2131.19 2441.65 1544.48
(iii) Total (3) 13863.83 3590.38 3868.09 4027.06 3289.80
4 Accretion (+) or
Discretion (-) of stocks of Finished products 1029.55 155.34 133.61 72.26 1.75
5 Gross Profit/Loss 30820.48 8194.75 5718.41 9503.92 12065.42
6 INTEREST PAYMENTS to :
(i) Central Government 152.79
Less Penal Interest Waived (Rev)
(ii) Others 812.44 -543.69 -25.69 -79.74 -143.38
(iii) Total (6) 965.23 -543.69 -25.69 -79.74 -143.38
7 Provision for Income Tax 12905.45 4380.55 4214.76 3900.97 4640.55
8 Dividend Payment to 3309.56 1705.42 1705.42 1705.42 1705.42
Central Government
9 Investment in Securities if obligatory
due to statutory or other requirements
10 Retained Profit / Surplus carried over to part II 13640.24 2652.47 -176.08 3977.27 5862.83
(Item no.5 minus Item no 6 to 8)

46
ESTIMATES OF INTERNAL & EXTERNAL BUDGETARY RESOURCES (IEBR) FOR XI th FIVE YEAR
PLAN (2007-08 to 2010-11) AND PERFORMANCE IN XTH FIVE YEAR PLAN NAME OF THE COMPANY: - COAL INDIA LIMITED
Part II (GENERATED I&EBR for Plan) Appendix-3 / Annexure -III
Tenth ELEVENTH PLAN SL D E S C R I P T I O N Plan 2007-08 2008-09 2009-10 2010-11 NO (Actuals) Actual Actual RE BE 1 Retained profit 13640.24 2652.47 -176.08 3977.27 5862.83 2 Add: Deprn & Write-offs 13863.83 3590.38 3868.09 4027.06 3289.80 3 Deduct:
(i)Total loan repayment 5222.82 139.37 279.77 93.41 182.70 of which to GOI 980.88 Redemption of preference Share 904.18 (ii) Net increase in the margin for working
capital requirement -1211.20 -773.30 -7670.12 288.66 124.38
(iii) Discharging of pension fund liability 602.26 1090.00 200.00 (iv) Arrears of Pay Revision 2213.39 508.68 4413.31 (v) Non Plan capital (vi) Cash Credit (Banks) (vii) Decrease in overdue interest to Govt. (viii) Others (Past Dues) 38.89 -288.36 -198.83 -198.83 -198.83 Total 3 6866.16 -922.29 -7589.18 1781.92 4721.56
4 Adjusted internal resources available for plan schemes 20637.91 7165.14 11281.19 6222.41 4431.07 (1+2-3)
5 Carry forward surplus from previous year 35.37 15621.42 20753.05 29527.07 32649.48 6 Total int. resources (4+5) 20673.28 22786.56 32034.24 35749.48 37080.55 7 Extra Budgetary Resource (Other than from Govt. of India) i) Gross assistance from financial
Institutions for Plan Project 413.92
ii) Gross assistance from financial institutions for Plan Project foreign (Specify source)
iii) Foreign Commercial Borrowings Suppliers Credit iv) Bonds/Debentures issued during the year v) Inter-corporate transfers vi) Receipt from other funds i.e a) OIDB b) SDF c) Others (B.O.B) vii) Loan from CIL viii) Issue of Equity to Public (IPO) ix) Others, if any (Specify) IBRD 116.04 x) Securitisation of coal sales dues Total EBR 529.96 8 Total Internal and External resource available for financing plan expenditure on projects 21203.24 22786.56 32034.24 35749.48 37080.55 renewals and replacement etc. (6 +7) 9 Plan Outlay (according to printed budget 7208.24 2033.51 2507.17 3100.00 3800.00 documents) (+6000.00 ##)
RESOURCE GAP (8-9) 13995.00 20753.05 29527.07 32649.48 33280.55 (27280.55 ##) 10 i) Budgetary support from Government 103.50 ii) External Assistance through Budget 12.62 iii) External Assistance direct iv) Net Budgetary Support 116.12 11 Carry forward of surplus for next year 14111.12 20753.05 29527.07 32649.48 33280.55
(Adjustment in closing balance of Surplus) 1510.30 (27280.55 ##) Adjusted opening balance 15621.42 # Rs. 6000.00 crore ad-hoc provision for acquisition of assets in abroad; accordingly surplus will be reduced.

47
ESTIMATES OF INTERNAL & EXTRA BUDGETARY RESOURCES (IEBR) FOR
XIth FIVE YEAR PLAN - '(2007-08 TO 2010-11) NAME OF THE COMPANY: - COAL INDIA LIMITED
Achievement during 10th Plan 2002-2007 Appendix-3 / Annexure -IIISl no Name of Internal Bonds/ ECB/Supplier's Others Total
PSE Resources Debenture Credit IEBR 1 2 3 4 5 6 7
CIL 20673.28 529.96 21203.24
2007-08 (Actual) Sl no Name of Internal Bonds/ ECB/Supplier's Others Total
PSE Resources Debenture Credit IEBR 1 2 3 4 5 6 7
CIL 22786.56 0.00 22786.56
2008-09 (Actual) Sl no Name of Internal Bonds/ ECB/Supplier's Others Total
PSE Resources Debenture Credit IEBR 1 2 3 4 5 6 7
CIL 32034.24 0.00 32034.24
2009-10 (RE) Sl no Name of Internal Bonds/ ECB/Supplier's Others Total
PSE Resources Debenture Credit IEBR 1 2 3 4 5 6 7
CIL 35749.48 0.00 35749.48
2010-11 (BE) Sl no Name of Internal Bonds/ ECB/Supplier's Others Total
PSE Resources Debenture Credit IEBR 1 2 3 4 5 6 7
CIL 37080.55 0.00 37080.55

48
Xth Plan End and XIth Plan (2007-08 to 2010-11)
NAME OF THE COMPANY: - COAL INDIA LIMITED
2006-07 2007-08 2008-09 2009-10 2010-11 SL D E S C R I P T I O N Actual Actual Actual RE BE NO 1 Capital Structure
(i)Authorized Share Capital 8904.18 8904.18 8904.18 8904.18 8904.18 (ii) Paid-up Capital 6316.36 6316.36 6316.36 6316.36 6316.36 (iii) Preference Equity
2 Reserve/Surplus 11572.94 13026.00 12848.68 16825.95 22688.783 Net Worth 17889.30 19342.36 19165.04 23142.31 29005.144 Net Profit (+)/Loss (-) after
Interest and Depreciation before CPRA
8522.22 8738.44 5744.10 9583.66 12208.80
5 Debts 1836.05 1675.48 1980.54 1887.13 1704.43 6 Loans and Interest
Outstanding and Due: (a) Outstanding (i) Principal 1836.05 1675.48 1980.54 1887.13 1704.43 (ii) Interest (b) Overdue (i) Principal (ii) Interest
7 Investment a) Cash at Bank 15621.42 20753.05 29527.07 32649.48 33280.55 b) Securities 2025.88 1717.90 1505.18 1306.35 1107.52 c) Inter Corporate Transfer
d) Others 8 (i) Wages Bill (incl.Bonus) 10456.19 12384.56 19742.09 16273.60 17151.17
(ii)% Wages to Total Cost 44.38% 45.46% 52.02% 44.88% 45.28% (iii) No. of Employees 439343 426077 412350 403724 392545 (a) Officers 15986 16021 15317 15626 15185 (b) Others 423357 410056 397033 388098 377360 (iv) Persons availing vrs-no. 2105 1148 677 1592 430 (v) Impact of vrs. Rs. crore 102.16 65.45 44.03 80.48 30.09 (iv) Employees after vrs-no. 439343 426077 412350 403724 392545
9 Capital Restructuring, if any (Give Details of nature of Capital Restructuring)

49
Statement - I
PSE: Coal India Limited Rs. Crores
Sl no Parameter Actual Actual BE RE Estimates
2007-08 2008-09 2009-10 2009-10 2010-11
1 Carry over Surplus from previous year
15621.42 20753.05 25376.78 29527.07 32649.48
2 Add: Retained Profit 2652.47 -176.08 2366.38 3977.27 5862.83
3 Add: Depreciation/provisions 3590.38 3868.09 3882.66 4027.06 3289.80
4 Add: Receipts from sale of investments
5 Deduct Adjustments -922.29 -7589.18 3954.87 1781.92 4721.56
6 Total Internal Resources 22786.56 32034.24 27670.95 35749.48 37080.55
7 Bonds / Debentures
8 ECB / Suppliers' Credit
9 Others
10 Total I&EBR 22786.56 32034.24 27670.95 35749.48 37080.55
11 Plan Outlay 2033.51 2507.17 2900.00 3100.00 3800.00
(+6000.00 ##)
12 Net Budgetary Support
Equity
Loan
Total 0 0 0 0 0
13 Carry forward surplus to next year 20753.05 29527.07 24770.95 32649.48 33280.55
(27280.55 ##)# Rs. 6000.00 crore ad-hoc provision for acquisition of assets in abroad; accordingly surplus will be reduced.

50
Statement - IIPSE: Coal India Limited
Rs. Crores
Sl no Parameter RE BE 2009-10 2010-11
1 Carry over Surplus from previous year 29527.07 32649.48
2 Add: Retained Profit 3977.27 5862.83
3 Add: Depreciation/provisions 4027.06 3289.80
4 Add: Receipts from sale of investments
5 Deduct Adjustments 1781.92 4721.56
6 Total Internal Resources 35749.48 37080.55
7 Bonds / Debentures
8 ECB / Suppliers' Credit
9 Others
10 Total I&EBR 35749.48 37080.55
11 Plan Outlay 3100.00 3800.00 (+6000.00 ##)
12 Net Budgetary Support Equity Loan Total
13 Carry forward surplus to next year 32649.48 33280.55 (27280.55 ##)
# Rs. 6000.00 crore ad-hoc provision for acquisition of assets in abroad; accordingly surplus will be reduced.

51
Statement III
PSE: Coal India Limited Rs. Crore
Name of BUDGET ESTIMATES - 2010-11 PSE Internal Bonds ECB Others Total Total Total
Resources Debentures Supplier's IEBR Budgetary Plan Credit Support Outlay
(1) (2) (3) (4) (5) (6) (7) (8) COAL INDIA 37080.55 37080.55 3800.00 LIMITED (+6000.00 ##) # Rs. 6000.00 Crore ad-hoc provision for acquisition of assets in abroad; accordingly surplus will be reduced.
Name of REVISED ESTIMATES - 2009-10 PSE Internal Bonds ECB Others Total Total Total
Resources Debentures Supplier's IEBR Budgetory Plan Credit Support Outlay
(1) (2) (3) (4) (5) (6) (7) (8) COAL INDIA 35749.48 35749.48 3100.00 LIMITED

52
APPENDIX- 3 - Annexure - VI
ANNUAL PLAN SUMMARY STATEMENT (Rs. Crore)
10th Plan 10th Plan 11th Plan Annual Annual Annual Annual Annual (2002-2007) (2002-2007) (2007-2012) Plan Plan Plan Plan Plan (2007-2008) (2008-2009) (2009-2010) (2009-2010) (2010-2011) Approved Actual Approved Actual Actual Approved Anticipated Proposed Outlay Expenditure Outlay Expenditure Expenditure Outlay Expenditure Outlay
1 2 3 4 5 6 7 8 9 A. Domestic Budgetary Support B. Externally Aided Projects (EAP) C. Gross Budgetary Support (A+B) 0.00 0.00 0.00 0.00 0.00 0.00 0.00 0.00 D. IEBR 14310.00 7208.24 17390.07 2033.51 2507.17 2900.00 3100.00 3800.00 (+6000.00 ##) E. Grand Total (C+D) 14310.00 7208.24 17390.07 2033.51 2507.17 2900.00 3100.00 3800.00 (+6000.00 ##) # Rs. 6000.00 crore ad-hoc provision for acquisition of assets in abroad; accordingly surplus will be reduced.

53
ANNUAL PLAN 2010-11 - MoC YEARWISE FINANCING PATTERN FOR X PLAN (Approved Outlay), X PLAN (CUMULATIVE ACHIEVEMENT), AP 2006-07(ACTUAL), AP
2007-08 (ACTUAL), AP 2008-09 (ACTUAL), AP 2009-10 (BE&RE), 2010-11 PROPOSED AND 2011-12 TARGET
Format-27Company: SCCL Rs. Crore
SL. COMPANY / HEAD IR BONDS SUPPLIER'S ARM OTHERS TOTAL EAP DBS GBS TOTAL
NO. CREDIT IEBR
0 1 2 3 4 5 6 (2 to 6)7 8 9 (8+9) 10 (7+10) 11
SCCL 424.80 424.80 0.00 0.00 0.00 424.80 X PLAN APPROVED OUTLAY SCCL 1471.50 641.73* 2113.23 2113.23 X PLAN CUMULATIVE 2002-07 SCCL -67.17 1317.73* 1450.56 0.00 0.00 0.00 1450.56 ANNUAL PLAN 2006-07 ACTUAL SCCL 22.14 426.49 * 448.63 0.00 0.00 0.00 448.63 ANNUAL PLAN 2007-08 ACTUAL SCCL 286.47 287.50 * 573.97 0.00 0.00 0.00 573.97 ANNUAL PLAN 2008-09 ACTUAL SCCL 650.44 0.00 650.44 0.00 0.00 0.00 650.44 ANNUAL PLAN 2009-10 B.E. SCCL 30.57 550.00 * 580.57 0.00 0.00 0.00 580.57 ANNUAL PLAN 2009-10 R.E. SCCL 353.94 280.00 * 633.94 0.00 0.00 0.00 633.94 ANNUAL PLAN 2010-11 PROPOSED SCCL 513.93 821.00* 1334.93 0.00 0.00 0.00 1334.93 ANNUAL PLAN 2011-12 TARGET SCCL 848.27 170.00 * 1018.27 1018.27 * SALE OF INVESTMENTS - VIDYUT BONDS/REDEMPTION OF STDRs
** GROSS ASSISTANCE FROM FINANCIAL INSTITUTIONS

54
ANNUAL PLAN 2010-11 - MoC - SCCL INTERNAL & EXTRA BUDGETARY RESOURCES
STATEMENT.ISINGARENI COLLIERIES COMPANY LIMITED FORMAT -28
Rs.CroresSl. DESCRIPTION X Plan XI PLAN XI Plan
NO. 2002-07 2006-07 2007-08 2008-09 2009-10 2010-11 2011-12 2007-12 Total
ACTUAL ACTUAL (ALLOCATED) Actual Actual BE Ant. Proposed Target 1 2 3 4 5 6 7 8 9 10 11
1. RECEIPTS (i) GROSS SALES/OPERATING INCOME 17557.03 3891.63 19675.15 4642.63 5680.86 5305.61 5942.63 5958.81 6200.20 28425.14 (ii) OTHER INCOME 0.00 (iii) TOTAL (1) 17557.03 3891.63 19675.15 4642.63 5680.86 5305.61 5942.63 5958.81 6200.20 28425.14 2. OPERATING COST (i) SALARIES & WAGES 7673.28 1688.55 7182.10 1878.88 2171.27 1627.43 2108.89 1989.79 1797.27 9946.09 (ii) BONUS 186.97 61.13 47.95 73.59 62.00 70.00 70.00 70.00 331.54 (iii) MAINTENANCE COST 473.56 112.94 100.06 165.70 110.07 170.67 170.67 170.67 777.77 (iv) OTHER COST 6842.43 1750.98 9408.32 2079.73 2918.19 2526.53 2869.01 2884.56 2969.77 13721.26 (v) TOTAL (2) 15176.24 3613.60 17333.82 4106.62 5328.75 4326.03 5218.56 5115.02 5007.71 24776.67 3. DEPRECIATION & WRITEOFFS (i) DEPRECIATION 1018.56 216.39 1393.83 243.12 248.91 246.00 264.82 287.99 335.54 1380.38 (ii) DRE. WRITEOFFS 168.17 29.76 150.00 48.42 0.00 26.02 10.00 10.00 10.00 78.42 (iii) TOTAL (3) 1186.73 246.15 1543.83 291.54 248.91 272.02 274.82 297.99 345.54 1458.80 4. (+)ACCRETION OR (-) DECRETION OF STOCK 40.44 -28.31 0.00 -69.14 -69.14 OF FINISHED PRODUCTS 5. GROSS PROFIT/LOSS (Item 1 minus items 2 to 4) 1234.49 3.57 797.49 175.33 103.20 707.56 449.25 545.80 846.95 2120.53 6. INTEREST PAYMENTS TO (i) CENTRAL GOVERNMENT 0.00 0.00 0.00 0.00 (ii) OTHERS (Interest Paid - Interest Received) -767.05 -113.62 397.28 -114.78 -145.12 -141.00 -94.44 -64.92 -11.63 -430.88 (iii) TOTAL (6) -767.05 -113.62 397.28 -114.78 -145.12 -141.00 -94.44 -64.92 -11.63 -430.88 7. PROVISION FOR INCOME TAX 542.45 71.62 410.70 122.36 323.75 288.43 160.80 90.29 282.05 979.25 8 DEVELOPMENT EXPENDITURE
WRITTEN OFF 60.10
9 DEFERRED TAX 145.23 -37.46 0.00 -6.61 -206.65 -78.20 46.03 66.87 -178.56 10 PROVISION FOR DIVIDEND PAYMENTS TO
CENTRAL GOVT.

55
ANNUAL PLAN 2010-11 - MoC - SCCL INTERNAL & EXTRA BUDGETARY RESOURCES
SINGARENI COLLIERIES COMPANY LIMITED STATEMENT.I FORMAT -28 Rs.Crores
Sl. X Plan XI PLAN XI Plan NO. 2002-07 2006-07 2007-08 2008-09 2009-10 2010-11 2011-12 2007-12
Total
DESCRIPTION
ACTUAL ACTUAL (ALLOCATED) Actual Actual BE Ant. Proposed Target 1 2 3 4 5 6 7 8 9 10 11 11 INVST. IN SECURITIES IF OBLIGATORY DUE TO
STATUTORY OR OTHER REQUIREMENTS
12 RETAINED PROFIT / SURPLUS CARRIED OVER TO PART II (ITEM NO 5 - ITEM NO.6 TO 11)
1253.76 83.03 -10.49 174.36 131.21 560.14 461.09 474.40 509.66 1750.73
1. RETAINED SURPLUS FROM PART-I 1253.76 83.03 -10.49 174.36 131.21 560.14 461.09 474.40 509.66 1750.73 2. ADD DEPRECIATION & WRITE OFFS 1186.73 246.15 1543.83 291.54 248.91 272.02 274.82 297.99 345.54 1458.80
2A. INTEREST (ACCRUED-DUE)\VIII PLAN MORITORIUM 0.00 2B. PROV.FOR GRATUITY & LEAVE ENCASHMENT &
NCWA VIII 1379.66 308.93 287.18 332.59 619.77
2C. VRS DEFERRED REV.A/C 45.65 128.00 269.30 269.30 2D DEFERRED TAX 196.04 -37.46 -6.61 -206.65 -78.20 46.03 66.87 -178.56 2G SUB TOTAL (1+2+2A+2B+2C+2D+2E+2F) 4061.84 600.65 1661.35 746.47 775.36 832.16 657.71 818.43 922.07 3920.04 3. DEDUCT i. LOAN INSTALLMENT DUE UPTO 3/97 ii. TOTAL LOAN REPAYMENT TO GOI iii. DIVIDEND PAYMENT & TAX THEREON 392.53 98.81 24.33 40.56 40.55 40.56 40.56 40.56 186.57 iv. NET INCREASE IN THE MARGIN FOR WORKING
CAPITAL REQ. 1357.51 13.70 168.92 -6.26 -52.86 1.67 -0.17 -0.91 -5.67
v. Provn..for ob backlog/advance action removal 0.00 189.63 -49.85 -177.40 433.57 -56.69 197.77 -32.18 -118.35 vi non-plan capital req. (break-up of major items like 0.00 0.00 Replacements repairs & maint. Need to be indicated) 0.00 0.00 vii OTHERS: SPECIFY.(V . R. S ) 145.27 12.00 0.00 47.44 18.00 65.44 viii INSTALMENTS ON MARKET BORROWINGS 743.59 1170.00 0.00 0.00 0.00 0.00 ix NCWA VI ARREARS 195.35 0.00 0.00 x NCWA VII ARREARS/VIII /IR 544.00 374.00 850.00 520.00 583.00 583.00 xi LUMPSUMP PAYMENT IN LIEU OF
DEP.EMPLOYMENT/MMC 195.22 0.00
Moratorium payment (GOI) 330.00 132.66 66.33 66.33 66.33 331.65 xii GRATUITY FUND PAYMENT 555.54 80.00 300.00 224.34 100.00 224.34 TOTAL (3) 4129.01 578.51 3008.55 240.00 -4.18 1041.26 652.87 304.49 73.80 1266.98 4. Adjusted internal resources available for plan -67.17 22.14 -1347.20 506.47 779.54 -209.10 4.84 513.93 848.27 2653.05 SCHEMES.(3-2G) 5. Carry forward surplus available from previous years 220.00 139.68 349.10 0.00 0.00 0.00

56
ANNUAL PLAN 2010-11 - MoC - SCCL INTERNAL & EXTRA BUDGETARY RESOURCES - STATEMENT.I
SINGARENI COLLIERIES COMPANY LIMITED Rs.Crores
Sl. X Plan XI PLAN XI Plan NO. 2002-07 2006-07 2007-08 2008-09 2009-10 2010-11 2011-12 2007-12
Total
DESCRIPTION
ACTUAL ACTUAL (ALLOCATED) Actual Actual BE Anticipated Proposed target 1 2 3 4 5 6 7 8 9 10 11 6. TOTAL INTERNAL RESOUCES (4 + 5) -67.17 22.14 -1347.20 506.47 999.54 -69.43 353.94 513.93 848.27 2653.05 7. EXTRA BUDGETORY RESOURCES OTHER THAN FROM GOI i. Gross assistance from financial institutions for the plan projects 200.00 0.00 4300.00 0.00 0.00 0.00 0.00 0.00 0.00 ii. Gross assistance from financial institutions for the plan projects foreign specify source * iii. FOREIGN COMMERCIAL BORROWING/SUPPLIERS' CREDIT ** iv. BONDS AND DEBENTURES ISSUED DURING THE YEAR v. INTER CORPORATE TRANSFERS $ vi. RECEIPT FROM OTHER FUNDS i.e. a) OIDB b) SDF c) OTHERS vii. ISSUE OF EQUITY TO PUBLIC $$ a) b) c) viii. OTHERS, IF ANY SPECIFY a) GOVT.OF A.P EQUITY b) SALE OF INVESTMENTS-VIDYUT BONDS/MATURITY OF FDRS 1317.73 426.49 387.50 287.50 650.00 280.00 821.00 170.00 1558.50
8. TOTAL INTERNAL AND EXTERNAL RESOURCES AVAILABLE FOR FINANCING PLAN EXPENDITURE ON PROJECTS, RENEWALS AND REPLACEMENTS ETC. (6 + 7) 1450.56 448.63 3340.30 793.97 999.54 580.57 633.94 1334.93 1018.27 4211.55
9. PLAN OUTLAY (ACCORDING TO PRINTED 1450.59 448.63 3340.30 573.97 650.44 580.57 633.94 1334.93 1018.27 4211.55 BUDGET DOCUMENT) Plan Outlay Ongoing Projects 392.11 145.09 303.40 141.81 250.43 383.60 329.93 392.18 750.20 1864.55 New Projects 4.03 2.61 2193.67 0.00 2.60 0.00 90.00 135.00 15.00 242.60 Additions / Modifications & Replacements (AMR) AMR - Completed Projects 643.37 150.68 484.72 307.80 245.17 80.60 133.80 105.37 60.44 852.58 AMR - Existing Projects 126.80 25.62 68.51 21.66 4.37 11.00 3.40 3.38 2.63 35.44 POWER PROJECTS 24.05 625.00 130.00 779.05 NON-MINING PROJECTS. 284.28 124.63 290.00 102.70 147.87 105.37 52.76 74.00 60.00 437.33 TOTAL PLAN OUTLAY 1450.59 448.63 3340.30 573.97 650.44 580.57 633.94 1334.93 1018.27 4211.55 RESOURCE GAP (9-8) * * *

57
ANNUAL PLAN 2010-11 - MoC - SCCL INTERNAL & EXTRA BUDGETARY RESOURCES
SINGARENI COLLIERIES COMPANY LIMITED STATEMENT.I FORMAT -28 Rs. CroresSl. X Plan XI PLAN XI Plan
NO. 2002-07 2006-07 2007-08 2008-09 2009-10 2010-11 2011-12 2007-12 Total
DESCRIPTION
ACTUAL ACTUAL (ALLOCATED)
Actual Actual BE Ant. Proposed Target
1 2 3 4 5 6 7 8 9 10 11 10. (i) Budgetary support from Government (ii) External Assistance through Budget (iii) External Assistance Direct (iv) Net Budgetary Support (i-ii) 11. Provision for North Eastern Region 12. CARRY FORWARD OF SURPLUS
FOR NEXT YEAR 220.00 349.10 0.00
Memorandum items (i) Installed Coal Production Capacity (ii) Production Plan (iii) Percentage of Capacity Utilisation (%) Revision of Price/Tariff etc (i) Price revision per unit (Rs./T) (ii) Date of Price revison Revision of Price/ Tariff etc. Price revision per unt To fix 'A' Grade ROM coal price @ Rs. 2607.54 per tonne B' Grade ROM coal price revised from Rs. 1702.80 per tonne to Rs. 2213.64 per tonne Date of Price Revision Price revision w.e.f from 1-4-2009 vide Notification No. 13/2008-09 Dt. 28-3-2009 * Expenditure wrf to Format-29 is varied due to change in schemes

58
PHASING OF DETAILED DRILLING PROGRAMME - COMPANYWISE & AGENCYWISE Agency/ 2007-08 2008-09 2009-10 2009-10 2010-11 2011-12Company Command Area Actual Actual BE RE BE Proj. DRILLING (IN METRE): 1. CIL Blocks - CIL Funding: A. Departmental Drilling: ECL 22353 25666 21150 19950 14945 13600 CCL 26912 27679 17000 18190 15510 15900 NCL 3072 14104 12650 12450 11960 20700 WCL 26513 23381 18000 21100 19115 14900 SECL 47032 48358 44400 51920 40660 59000 MCL 27825 23407 27000 32250 40255 45000 Total Departmental (A) in CIL Blocks: 153707 162595 140200 155860 142445 169100 B. Contractual Drilling (Outsourcing/Tendering): i. MP/Chhattis.Govt. /SECL (outsourcing) 3832 3321 2500 2500 2500 2500 ii. Orissa Govt./MCL (outsourcing) 2448 5019 2500 2500 2500 2500 iii. MECL/WCL (outsourcing) 1071 0 0 0 0 0 iv. Tendering/ECL 0 0 0 0 0 10000 v. Tendering/BCCL 0 5259 30000 15000 16000 30000 vi. Tendering/CCL 0 0 0 0 0 vii. Tendering/WCL 0 3563 400 2910 6000 viii. Tendering/SECL 0 8895 1750 290 0 ix. Tendering/NE region 0 3733 3450 9700 0 0 Total Contractual (B) in CIL Blocks: 7351 29790 40600 32900 21000 51000 C. Contractual Drilling (Under MOU with MECL): i. MOU/ BCCL 0 0 0 1600 1000 1000 ii. MOU/ NCL 0 0 40000 13400 13000 15000 iii. MOU/ SECL 0 0 10000 5100 15000 25000 Total Contractual (C) in CIL Blocks: 0 0 50000 20100 29000 41000 Grand Total Departmental and 161058 192385 230800 208860 192445 261100 Contractual Drilling in CIL Blocks: 2. Non-CIL Blocks - MoC Funding (Departmental & Contractual): A. Departmental Drilling: ECL 0 0 0 8900 19200 26000 CCL 5233 9485 11600 12760 11020 17300 NCL 9396 0 0 0 0 0 WCL 5886 10705 12000 13250 11850 23400 SECL 7763 7570 6800 7480 5285 0 MCL 16873 32176 27200 30000 27200 22100 Total Departmental (A) in Non-CIL Block: 45151 59936 57600 72390 74555 88800 B. Contractual Drilling (Through Tendering): ECL 0 0 6000 12000 12000 6000 CCL 0 0 0 0 7000 15000 SECL 0 14394 53400 85000 77500 52000 Total Contractual (B) in Non-CIL Blocks: 0 14394 59400 97000 96500 73000 C. Contractual Drilling (Under MOU with MECL): i. MOU/ NCL 0 0 0 0 13500 15000 Grand Total Departmental and 45151 74330 117000 169390 184555 176800

59
PHASING OF DETAILED DRILLING PROGRAMME - COMPANYWISE & AGENCYWISE
Agency/ 2007-08 2008-09 2009-10 2009-10 2010-11 2011-12 Company Command Area Actual Actual BE RE BE Proj. Contractual Drilling in Non-CIL Blocks: 3. Captive Blocks Allotted to St. Govts. PSU's - St. Govts. PSUs Funding (Departmental): A. Departmental Drilling: SECL/CSEB 0 0 0 3000 13000 0 Total in St.Govts. PSUs Blocks: 0 0 0 3000 13000 0 4. Promotional (Regional) Drilling by CMPDI: ECL 0 0 2000 0 0 0 CCL 1892 0 4500 4500 6000 10100 NCL 348 0 500 150 500 0 WCL 514 1916 1700 1600 2000 2000 SECL 238 3730 3500 2500 1500 0 Grand Total Promotional by CMPDI: 2992 5646 12200 8750 10000 12100 Total Departmental Drilling by CMPDI 201850 228177 210000 240000 240000 270000 Sub-total Ex-MOU-MECL
Contractual Drilling: 7351 44184 100000 129900 117500 124000
Sub-total MOU-MECL Contractual Drilling:
0 0 50000 20100 42500 56000
Total Contractual Drilling: 7351 44184 150000 150000 160000 180000 Grand Total of above all drilling: 209201 272361 360000 390000 400000 450000 FINANCIAL (Rs. Crore): 1) CIL Drilling: (Departmental & Contractual) through CIL Budget a) Demand for departmental work: 78.55 123.02 68.93 116.78 106.87 122.64 b) Demand for coal testing & State Govt work:
2.38 3.04 2.98 2.42 2.29 2.77
c) Demand for outsourcing/tendering work: (incl. Demand for MECL-MOU work)
0.45 12.26 50.00 29.41 32.32 50.79
d) Total demand: 81.38 138.32 121.91 148.61 141.48 176.20 2) Non-CIL Drilling: MoC Release/Outlay
a) Ex-NE Area: 40.00 15.00 60.00 60.00 110.00 107.24 b) For NE region 6.80 6.80 11.44 11.92 c) Total release/demand from MoC: 40.00 15.00 66.80 66.80 121.44 119.16 d) Due for Payment related to 2007-08 & 08-09 18.11 e) Balance fund demand from CIL 5.41 3) Promotional Drilling: MoC Release/Outlay for coal & lignite is given in separate table Note: 1. Contractual drilling in Non-CIL/CIL blocks includes non-coring drilling also at places. 2) Achievement of enhanced targets from 2010-11 onwards depends on availability of high-tech machines for departmental capacity expansion, suitable agencies for contractual drilling, clearance from Forest Authorities & revision of Forestry Norms to 15-20 borehole/sq.km. for exploration in forest area.

60
PHASING OF PROMOTIONAL (REGIONAL) EXPLORATION IN COAL & LIGNITE IN XI PLAN
Agency/ 2007-08 2008-09 2009-10 2009-10 2010-11 2011-12
Company Command Area Actual Actual BE RE BE Proj.
PROMOTIONAL DRILLING (in Metre):
A. GSI
CIL -Ex. NEC 11473 15572 15400 16500 14850 17600
SCCL 0 0 0 0 0 0
NLC 7487 7963 12100 8050 8650 8800
Total GSI: 18960 23535 27500 24550 23500 26400
B. MECL
CIL -Ex. NEC 37999 27944 37700 37950 45000 50655
CIL -NEC 564 504 700 800 800 0
SCCL 17154 14730 15000 17000 14000 13400
NLC 37863 54454 65000 69050 61700 76000
Total MECL: 93580 97632 118400 124800 121500 140055
C. CMPDI
CIL -Ex. NEC 2992 5646 12200 8750 10000 12100
CIL -NEC 0 0 0 0 0 0
Total CMPDI: 2992 5646 12200 8750 10000 12100
D. OVERALL
CIL -Ex. NEC 52464 49162 65300 63200 69850 80355
CIL -NEC 564 504 700 800 800 0
SCCL 17154 14730 15000 17000 14000 13400
NLC 45350 62417 77100 77100 70350 84800
Grand Total of Drilling (in metre): 115532 126813 158100 158100 155000 178555
II. Financial: MoC Release/ Outlay (in Rs. Crore):
i) Drilling & Supplementary Services 30.25 28.46 23.29 57.17 58.22 72.54
ii) Coal Resource Inform. System 2.50 1.53 3.48 4.73 5.86 4.76
iii) Lignite Resource Info. System 1.64 0.00 1.74 2.09 2.09 2.09
iv) CBM Studies in Coal & Lignite 0.60 0.01 1.88 2.40 1.83 1.93
Sub Total Ex. NE region: 34.99 30.00 30.39 30.39 68.00 81.32
10% for NE region: 3.45 3.45 7.56 9.04
Total Outlay Promot. Expl.(Rs.Crore): 34.99 30.00 33.84 33.84 75.56 90.36
Balance to be provided by CIL: 34.87
Note: 1) Drilling indicated above is subject to provision of adequate exploration resources by executing agencies and availability of potential area in lignite sector. 2) Above drilling is also subject to availability of permission from Forest Authorities to explore in forest areas

61
ANNUAL PLAN 2010-11 - MoC DETAILED EXPLORATION PROGRAMME
Company: SCCL (in metres)Agency X Plan 2007-082008-09 2009-10 2010-11 2011-12 Actual Actual Actual Target Anticip. Proposed Proj. I. DEPARTMENTAL
DRILLING (mts)
CIL SCCL 334624 79380 84486 100000 85000 100000 100000 NLC Sub-Total I: 334624 79380 84486 100000 85000 100000 100000II. CONTRACTUAL DRILLING (mts)
Agencywise CIL SCCL NLC Sub-Total II: III. NON-CIL BLOCKS/ Captive Blocks Agencywise
MECL CMPDI State Govt. Agencies Others Sub-Total III: GRAND TOTAL: 334624 79380 84486 100000 85000 100000 100000 II. FINANCIAL (Rs..cr.) A. Dept. & Contractual CIL SCCL 75.69 16.81 20.65 22.00 22.00 24.20 24.20 NLC Sub-Total Departmental & Contractual:
75.69 16.81 20.65 22.00 22.00 24.20 24.20
B. Non-CIL through Budget GRAND TOTAL A+B: 75.69 16.81 20.65 22.00 22.00 24.20 24.20

62
ANNUAL PLAN 2010-11 - MoC PROMOTIONAL EXPLORATION PROGRAMME
Company: SCCL (in metres)Agency 2006-07 X PLAN 2007-08 2008-09 2009-10 2010-11 2011-12
Actual Cumulative Actual Actual Target Anticip. Proposed Proj. A. REGIONAL EXPLORATION
I. DRILLING (mts)
(I) GSI
(ii) State Govt. Agencies
B. PROMOTIONAL EXPLORATION
I. DRILLING (mts)
GSI
CIL
SCCL NOT APPLICABLE
NLC
Sub-Total GSI:
MECL
CIL
SCCL 18212 18212 17154 14730 17000 14000 14000 13000
NLC
Sub-Total MECL: 18212 18212 17154 14730 17000 14000 14000 13000
CMPDIL
CIL
Sub-Total CMPDIL:
GRAND TOTAL: 18212 18212 17154 14730 17000 14000 14000 13000
II. FINANCIAL (Rs.Cr.) * * * * * * * *
* Bills are directly paid by CMPDIL to MECL.

63
COMPANY COMMAND AREA-WISE TOTAL GEOLOGICAL RESOURCES OF INDIAN COAL
ASSESSED ON 1.4.2009 (Source: Inventory by GSI)
COMPANY Depth Proved Indicated Inferred Total COMMAND AREA (In metre) (M.T) (M.T) (M.T) (M.T)
EASTERN COALFIELDS LTD 0-300 14169 9590 1029 24788 300-600 1958 9482 3813 15252 600-1200 46 3091 1862 4999 Total 16173 22163 6704 45039 BHARAT COKING COAL LTD. 0-600 13710 502 0 14212 600-1200 1367 3850 0 5218 Total 15078 4352 0 19430 CENTRAL COALFIELDS LTD. 0-300 18138 7433 1138 26708 300-600 1488 6799 2388 10676 600-1200 256 1751 1339 3346 Total 19882 15983 4866 40730 WESTERN COALFIELDS LTD 0-300 6483 2097 455 9035 300-600 447 1639 1783 3869 600-1200 0 44 139 183 Total 6930 3779 2377 13086 SOUTH-EASTERN COALFIELDS LTD 0-300 12723 22426 3073 38221 300-600 189 9324 1510 11022 600-1200 0 851 22 873 Total 12911 32601 4604 50116 NORTHERN COALFIELDS LTD 0-300 5117 2856 1040 9013 300-600 115 3313 993 4421 600-1200 0 40 4 44 Total 5232 6209 2037 13478 MAHANADI COALFIELDS LTD 0-300 19938 18915 6364 45216 300-600 6 11578 6969 18553 600-1200 0 992 466 1458 Total 19944 31484 13799 65227 SINGARENI COLLIERIES COMP. LTD 0-300 5869 2329 113 8311 300-600 3315 3307 649 7271 600-1200 9 1113 2223 3345 Total 9194 6748 2985 18927 NORTH EASTERN REGION 0-300 334 140 549 1023 300-600 144 11 0 155 Total 478 151 93 1177 GRAND TOTAL 0-300 82771 65784 13760 162315 300-600 7661 45453 18105 71219 0-600 * 13710 502 0 14212 600-1200 1678 11730 6056 19464 Total 105820 123470 37921 267211 Note: 1) * is for BCCL only. The reserves of BCCL in Raniganj coalfield are covered in ECL area. 2) Total reserves within the coalfield/command area have been considered. 3) Figures in decimal are suppressed.

64
STATEWISE GEOLOGICAL RESOURCES OF COAL OF INDIA AS ON 01.04.2009
Category-wise Coal Resources (in Million Tonnes) STATE Depth Proved Indicated Inferred Inferred Total (metre) (Exploration) (Mapping) WEST BENGAL 0-1200 11652.84 11603.25 5070.70 0.00 28326.79 BIHAR 0-300 0.00 0.00 160.00 0.00 160.00 JHARKHAND 0-1200 39479.33 30894.31 6338.32 0.00 76711.96 MADHYA PRADESH 0-1200 8041.18 10294.58 2645.25 0.00 20981.01 CHHATTISGARH 0-1200 10910.64 29191.79 4380.67 0.00 44483.10 UTTAR PRADESH 0-300 866.05 195.75 0.00 0.00 1061.80 MAHARASHTRA 0-1200 5255.36 2907.21 1992.17 0.00 10154.74 ORISSA 0-1200 19943.63 31484.05 13799.18 0.00 65226.86 ANDHRA PRADESH 0-1200 9193.61 6748.04 2985.27 0.00 18926.92 SIKKIM 0-300 0.00 58.25 42.98 0.00 101.23 ASSAM 0-600 348.65 35.85 0.50 2.52 387.52 ARUNACHAL PRADESH 0-300 31.23 40.11 12.89 6.00 90.23 MEGHALYA 0-300 89.04 16.51 27.58 443.35 576.48 NAGALAND 0-300 8.76 0.00 8.60 4.58 21.94 GRAND TOTAL 0-1200 105820.32 123469.70 37464.11 456.45 267210.58 Source: Geological Survey of India's Inventory of Geological Resources of Indian Coal as on 1.4.09. The inventory did not take into account the mined out reserves (about 9808 Mt since 1950).

65
TYPE-WISE GEOLOGICAL RESOURCES OF INDIAN COAL (As on 1.4.09)
(Resources in Million Tonnes)TYPE OF COAL DEPTH (m) PROVED TOTAL
COKING 0-300 7294 11818 300-600 988 6628 0-600* 8104 8110 600-1200 1160 6856 Total 0-1200 17545 33413 NON COKING 0-300 75143 149578 300-600 6530 64436 0-600* 5607 6102 600-1200 518 12608 Total 0-1200 87798 232724 High Sulphur Tertiary Coal 0-300 334 919 300-600 144 155 Total 0-600 478 1073 Grand Total All Type of Coal 0-300 82771 162315 300-600 7661 71219 0-600* 13710 14212 600-1200 1678 19464 Total 0-1200 105820 267211 Note: 1. * is for Jharia coalfield only. 2. Above estimates are based on Inventory prepared by GSI. 3. Figures in decimal are suppressed in above table.

66
YEAR-WISE UPGRADATION OF INVENTORY OF GEOLOGICAL RESOURCES OF INDIAN COAL
Sl. Coal Proved Indicated Inferred Total Recoverable GRs prepared by CMPDI FRs No. Resources (Mt.) (Mt.) (Mt.) (Mt.) from proved No. of GRs Established No. of Miniable
as on reserves Reserves FRs Reserves (Mt.) (Bt.) (mt.)
1 1.4.2007 99060 120177 38144 257381 N.A. 17.00 1.78 N.A. N.A. (Actual) (2006-07) (2006-07)
2 1.4.2008 101829 124216 38490 264535 N.A. 17.00 3.19 N.A. N.A. (Actual) (2007-08) (2007-08)
3 1.4.2009 105820 123470 37921 267211 N.A. 20.00 2.73 N.A. N.A. (Actual) (2008-09) (2008-09)
Note: - 4 1.4.2010 1. The inventory of Geological Resources of Indian Coal is updated by GSI every year, on 1st April now instead of 1st January.
(Target) 2. The programme of Regional Exploration is formulated and executed by GSI. It is, therefore, not possible to indicate yearly projections of likely increase in the total inventory of coal.
3. Sub-Group-III on Coal & Lignite Exploration for Formulation of XI Plan has envisaged that the Regional/promotional exploration programme is expected to add 30 Bt of coal resources in Indicated/Inferred category and Detailed Exploration is expected to upgrade 35 Bt. of coal resources into Proved category during the XI Plan period. 4. CMPDI and its contractual agencies carry out detailed exploration in the command area of CIL. On an average, 2-3 Bt/year of coal resources are upgraded to Proved category, which is likely to enhance in XI plan. However, the increase in inventory is largely from regional/promotional exploration work, in Indicated & Inferred categories.

67
GEOLOGICAL RESOURCES OF INDIAN COAL ASSESSED ON 1.4.2009 A. Category-wise and Depth-wise Resources:
(In Million Tonnes) Depth (m) Proved Indicated Inferred Total % share
0-300 82,770.63 65,784.33 13,760.24 162,315.20 60.75
300-600 7,661.28 45,452.79 18,104.64 71,218.71 26.65
0-600(For Jharia only) 13,710.33 502.09 0.00 14,212.42 5.32
600-1200 1,678.08 11,730.49 6,055.68 19,464.25 7.28
Total 105,820.32 123,469.70 37,920.56 267,210.58 100.00
B. Category-wise and Type-wise Resources:
(In Million Tonnes) Type of Coal Proved Indicated Inferred Total % share
Prime Coking 4,614.35 698.71 0 5,313.06 1.99
Medium Coking 12,448.44 12,063.93 1,880.23 26,392.60 9.88
Semi Coking 482.16 1,003.29 221.68 1,707.13 0.64
Sub total of Coking 17,544.95 13,765.93 2,101.91 33,412.79 12.51
Non Coking 87,797.69 109,614.09 35,312.63 232,724.41 87.09
Tertiary coal 477.68 89.68 506.02 1,073.38 0.40
Total coal 105,820.32 123,469.70 37,920.56 267,210.58 100.00
% share 39.60 46.21 14.19 100.00
Source: Geological Survey of India

68
ANNUAL PLAN 2010-11 - YEARWISE UPGRADATION OF COAL RESOURCE INVENTORY - SCCL
(Million Tonnes)
Sl. Reserves Proved Indicated Inferred Total Recov. No. of Blocks Area covered GRs FRs
No. as on Reserves Explored in Sq.Kms. No Recov. No of Mineable
Reserves FRs Reserves
SCCL:
1 1.1.2006 (Actual) 8403.18 6158.17 2584.25 17145.60 2823.00 2 7.52 2 2823.00 8 298.840
2 1.1.2007 (Actual) 8791.13 6265.58 2657.75 17714.46 2823.00 2 11.47 2 2823.00 8 325.370
3 1.1.2008 (Actual) 9007.13 6710.65 2978.81 18696.59 2995.50 4 14.80 4 2995.50 6 348.000
4 1.1.2009 (Actual) 9193.61 6748.04 2985.27 18926.92 3064.23 2 8.36 2 3064.23 2 17.067
5 1.1.2010 (BE/RE) 9343.00 NA NA NA 3114.02 1 8.00 1 3114.02 NA NA
6 1.1.2011 (Target) 9493.00 NA NA NA 3164.02 2 12.00 2 3164.02 NA NA
(*) As per GSI Coal Inventory. NOTE: 'Recoverable reserves are approximately only.
Note: The Reserves are added to the National inventory in the Financial year with effect from 01.04.2007

69
S&T PROGRAMME OF MoC - 2010 - 11
Rs in lakhDisbursement Disbursement
during BE RE BE
Progressive upto
Actual 2009 - 10 2009 - 10 2009 - 10 2010 - 11
31.03.2010 2008 - 09 (31.03.2010)
Sl. No. Name of the project & Implementing Agency
Date of Compl.
Approved Outlay
1 2 3 4 5 6 7 8 9 10 A On-Going Projects 1 Stability of parting between coal
pillars workings in level contiguous seams during depillaring - MT/137
Jun. 2010 50.54 42.00 - - - - -
Implementing Agency: CMRI 2 Indigenous development of prototype
longwall supports (chock - shield) - MT/143
Aug. 2009 228.47 197.00 80.00 - - - -
Implementing Agency: SCCL S&T Grant - 197.97 Cont. SCCL - 30.50 3 Development of a micro-seismic
monitoring system for stability analysis of
Sep. 2009 47.849 40.00 - - - - -
UG mine workings under Difficult to cave roof conditions - MT/145
Implementing Agency: CMRI & ECL 4 Characterisation of rock and explosive
parameters for optimal explosive Mar. 2010 270.37 215.91 91.98 68.02 125.00 100.00 -
energy utilisation in opencast blasting- MT/146
For CMPDI -206.15
CMPDI - 154.91
CMPDI - 81.98
CMPDI - 63.02
Implementing Agency: CMPDI & CMRI For CMRI - 64.22
CMRI - 61.00 CMRI - 10.00
CMRI - 5.00
For CMRI- 2.00 Sub-total 171.98 68.02 125.00 100.00 - Progressive 171.98 68.02 125.00 100.00 -

70
S&T PROGRAMME OF MoC - 2010 - 11
Rs in lakhDisbursement Disbursement
during BE RE BE
Progressive upto
Actual 2009 - 10 2009 - 10 2009 - 10 2010 - 11
31.03.2010 2008 - 09 31.03.2010
Sl. No. Name of the project & Implementing Agency
Date of Compl.
Approved Outlay
1 2 3 4 5 6 7 8 9 10 5 Establishment of standard method for
assessment of incendivity of 32mm dia permitted explosive- MT/149
Sep.2009 41.19 33.00 - - 5.00 - -
Implementing Agency: CMRI 6 Underground coal gasification and its
utilisation for power generation Aug. 2009 1125.00 220.00 - - 50.00 - -
studies in lignite deposit of Rajasthan (Phase - I) - MT/150
S&T Grant - 562.50
Implementing Agency: NLC Cont DST - 375.00 Cont NLC - 187.50 7 Investigation of cavability of overlying
strata and development of guidelines Mar. 2010 461.3674 255.00 25.00 - 20.00 -
of support capacity for longwall faces - MT/151
For CMRI - 200.142
CIMFR - 70.00
Implementing Agency: CMRI, NIRM, ISM, CMPDI, SECL, SCCL,
For NIRM - 187.91
NIRM - 130.00
ECL & BCCL For ISM - 63.3154 ISM - 55.00 ISM -10.00 For CMPDI - 10.00 8 Delineation of barrier thickness
against waterlogged workings in underground coal mines - MT/153
Oct.2010 342.2692 170.00 70.00 - 100.00 100.00 70.00
Implementing Agency: CMRI Sub-total 95.00 10.00 155.00 120.00 70.00 Progressive 266.98 78.02 280.00 220.00 70.00

71
S&T PROGRAMME OF MoC - 2010 - 11
Disbursement Disbursement during BE RE BE Progressive upto Actual 2009 - 10 2009 - 10 2009 - 10 2010 - 11
31.03.2010 2008 - 09 31.03.2010
Sl. No. Name of the project & Implementing Agency
Date of Compl.
Approved Outlay
1 2 3 4 5 6 7 8 9 10 9 Model studies on gravity blind back filling
method and evaluation Feb. 2011 402 320.00 20.00 70.00 80.00 90.00 45.00
of a pre-jamming indication parameter in the field - MT/154
Implementing Agency: IIT, Kharagpur 10 High resolution seismic monitoring for
early detection and Feb. 2011 124.30 95.00 - 5.00 7.00 5.00 4.00
of slope failures in opencast mines -MT/155
S&T Grant -99.44
Implementing Agency: Anna university Cont SCCL- 24.86 11 Coal bed methane recovery and its commercial
utilisation - CE/27 Dec. 2010 9242.70 1789.74 100.82 150.00 150.00 10.00 -
Implementing Agency: CMPDI & BCCL UNDP/GEF - 4143.70 UNDP/India - CCF-545.10 ONGC Co-Sharing - 1215.70 S&T Grant -1805.80 GoI Kind - 699.40 Part of the Revenue - 833.0 Cost met out of the income generated from the project
12 Hydrogeological studies for control of ground water for safe and economic
Mar.2010 182.12 100.00 - - - 10.00 -
mining of lignite deposits in Nagaur Dist of Rajasthan -CE/28
S&T Grant - 145.696
Implementing Agency: RSMML, Udaipur Cont. RSMML - 36.424 13 Application of Vorsyl separator for recovery of
clean coal from Mar.2009 125.40 52.42 - - - - -
middlings and rejects-CP/42 For RRL (B)- 85.40 RRL (B) - 25.00 Implementing Agency: RRL (Bhopal) &
CMPDI S&T Grant -
54.765 CMPDI - 27.42
Cont DST- 30.365 For CMPDI - 40.00 Sub-total 120.82 225.00 237.00 115.00 49.00 Progressive 387.80 303.02 517.00 335.00 119.00

72
S&T PROGRAMME OF MoC - 2010 - 11 Rs in lakh
Disbursement Disbursement BE RE BE Progressive upto Actual during 2009 - 10 2009 - 10 2009 - 10 2010 - 11
31.03.2010 2008 - 09 31.03.2010
Sl. No. Name of the project & Implementing Agency Date of Compl.
Approved Outlay
1 2 3 4 5 6 7 8 9 10
14 Agglomeration formation in reducing condition in pressurised fluidised
Sep. 2009 338.58 321.48 45.00 8.88 - 10.00 -
bed gasification (PFBG) with Low rank For CFRI - 283.48
CFRI - 279.50
high ash coals - CU/48 For CET - 42.71 CET - 35.00 Implementing Agency : CFRI, CET, Osmania Univ. &
CMPDI For CMPDI -
12.39 CMPDI - 11.72
15 Production of {60} {70} fullernes, heterofullernes and carbon nanotubes
Feb. 2011 175.80 150.00 5.00 35.00 25.00 10.00 20.00
from coal - CU/52 For CFRI - 145.92
CFRI - 125.00 CFRI - 25.00
Implementing Agency : CFRI & BHU For BHU - 29.88 BHU - 25.00 BHU - 10.00 16 Pulse detonation combustion of coal for energy
applications - CU/53 Feb.2010 22.60 22.00 - 5.00 5.00 5.00 -
Implementing Agency : IISc, Banglore 17 Catalytic Liquefaction of Neyveli Lignite -
CU/54 Jan. 2012 14.00 9.00 5.00 4.00 - 4.00 5.00
Implementing Agency : MEPCO Schlenk Engg. College, Sivakasi
18 Biological Production of Clean Fuels from Coal - CU/55
Jan. 2012 45.36 30.00 30.00 - 5.00 10.00
Implementing Agency : R.V. College of Engg. Bangalore 19 Re-design and Fabrication of Biomass
Gasification Plant Coal Jan. 2010 40.06 25.00 25.00 - - 10.00 -
Fuel Utilisation - CU/56 Implementing Agency : R.V. College of Engg. Bangalore
20 Fly ash characterisation for mine void reclamation - EE/30
Jul. 2010 287.684 55.92 11.82 13.45 - 100.00 -
Implementing Agency : CMPDI Sub-total 121.82 66.33 30.00 144.00 35.00 Progressive 509.62 369.35 547.00 479.00 154.00

73
S&T PROGRAMME OF MoC - 2010 - 11
Rs in lakhDisbursement Disbursement during BE RE BE
Progressive upto Actual 2009 - 10 2009 - 10 2009 - 10 2010 - 11 Sl. No. Name of the project & Implementing Agency Date of
Compl. Approved
Outlay 31.03.2010 2008 - 09 31.03.2010
1 2 3 4 5 6 7 8 9 10 21 Devlopment of suitable biological waste water
treatement technology through constructed Dec.2010 78.62 23.76 - - - 25.00 25.00
wetlands for treatments of acid mine drainage from coal projects - EE/31 Implementing Agency: CMPDI
22 Investigation into low cost liner for disposal of coal ash in abandoned opencast mine - EE/34
Dec. 2009 44.14 42.00 3.00 5.00 - 5.00 -
Implementing Agency: CMRI 23 Study on blasting dust management system in an
opencast coal mine - EE/35 Sep. 2010 48.33 45.00 10.00 10.00 10.00 5.00 5.00
Implementing Agency: NIRM, MCL & NCL 24 Development and use of fly ash based pesticides
- EE/36 Apr. 2011 304.92 200.00 20.00 25.00 25.00 30.00
Implementing Agency: NLC, Annamalai Univ. VCRC, Pondichery
For NLC - 131.737
NLC - 100.0
For AMU - 89.82 AMU - 65.00 AMU - 25.00 For VCRC - 53.82 VCRC - 35.00 Cont NLC - 29.543
25 Survey and ecological conservation of NLC environment through bioremediation
Apr. 2010 77.87166 56.50 - 19.50 10.00 5.00 25.00
Bioremediation with tree species - EE/37 For NLC - 25.30 NLC - 19.50 NLC - 4.50 Implementing Agency : NLC & TNAU For TNAU -
52.57166 TNAU - 47.00 TNAU - 15.00
26 Low cost input technology for revegetation of coal mine spoils in order to protect the
Apr. 2010 26.263 24.00 9.00 5.00 8.00 - 2.00
environment - EE/38 Implementing Agency: T M Bhagalpur University , MCL & NCL
27 Development of Methodology for Estimation of Greenhouse Gas Emissions
Jan. 2012 354.491 296.00 290.00 6.00 - 6.00 10.00
in Mine Fire Areas and their Mitigation through Terrestrial Sequestration EE (EoI) /39
For CIMFR - 341.77
CIMFR - 290.00
For BHU - 12.721 BHU - 6.00 Implementing Agency: CIMFR & BHU
28 Carbon Sequestration in re-vegetated coal mine wastelands - EE/40
Jan. 2012 64.76 30.00 30.00 - - 10.00 4.00
Implementing Agency: CIMFR Sub-total 362.00 70.50 53.00 81.00 101.00 Progressive 871.62 439.85 600.00 560.00 255.00

74
S&T PROGRAMME OF MoC - 2010 - 11
Rs in lakhDisbursement Disbursement during BE RE BE
Progressive upto Actual 2009 - 10 2009 - 10 2009 - 10 2010 - 11 Sl. No. Name of the project & Implementing Agency Date of
Compl. Approved
Outlay 31.03.2010 2008 - 09 31.03.2010
1 2 3 4 5 6 7 8 9 10 B Newly sanctioned S&T Projects commenced w.e.f Jan. 2010
29 Application of high strength steel roof-bolts in underground coal mines - MT/156
Dec. 2011 103.22 70.00 - 70.00 - - 8.00
Implementing Agency: RDCIS, DGMS & CMPDI For RDCIS - 89.02 For CMPDI - 14.20
30 Prototype development for methane alarm system using carbon nanofibres - MT/157
Dec. 2011 30.85 15.00 - 15.00 - - 5.00
Implementing Agency: Jadavpur University 31 Development and optimisation of coal bed
recovery process for CO2 sequestration - CE/29 Dec. 2011 22.30 15.00 - 15.00 - - 2.00
Implementing Agency: ISM 32 Development of Indigenous catalyst through
Pilot Scale Studies of Coal-to- Dec.2012 805.40 250.00 - 250.00 - - 150.00
Liquid (CTL) conversion technology - CU/57 For CIMFR - 688.50 Implementing Agency: CIMFR & CMPDI For CMPDI - 116.90
33 An approach to explore the applicability of spectro-radiometry as a tool
Dec.2012 147.61 125.00 - 125.00 - - 5.00
for assessment of coal quality - CU/58 Implementing Agency: CIMFR
34 Treatment of acid mine water generated in Indian coal mines using low cost material - EE/41
Dec.2012 44.17 20.00 - 20.00 - - 10.00
Implementing Agency: CIMFR 35 Emissions from coal-based industries -
development of predictive models - EE/42 Dec.2012 82.46 20.00 - 20.00 - - 20.00
Implementing Agency: NEIST, Jorhat C Projects in pipelne/new projects - - 1240.00 300.00 310.00 D S&T Co - ordination I Manpower 107.33 181.06 125.00 200.00 200.00 II Publication/ Equipment 1.08 - 10.00 5.00 10.00 III Seminars/Workshops/Meetings 0.34 0.29 10.00 5.00 10.00 E Completed / Terminated Projects 71.65 27.32 10.00 25.00 10.00 F Re application of Successful S&T Projects - - 5.00 5.00 5.00 Sub-total (B+C+D+E+F) 180.40 723.67 1400.00 540.00 745.00 Grand Total (A+B+C+D+E+F) 1052.02 1163.52 2000.00 1100.00 1000.00

75
ANNUAL PLAN 2010-11 - MoC DETAILS OF SCIENCE & TECHNOLOGY SCHEMES
Company: SCCL A. COMPLETED SCHEMES (Rs. Crores )
Cum. Expdr. X Plan
2002-2007
2007-08 ACTUAL EXPDR
2008-09 ACTUAL EXPDR
2009-10 2010-11 PROPOSED
Sl.No. Name of the R&D Project
BE RE 1 Design and experimentation of cable bolting for adverse ground
conditions in thick seams containing clay bands.
2 Design and experimentation of cable bolting for adverse ground conditions in thick seams for long gate roads and face dips
3 Development of roof bolting equipment and drilling accessories for mechanised board and pillar workings and fast roadway drivages.
4 Evaluation of explosive's performance through in-the-hole detonation velocity measurement
5 Development of micro controller based system for monitoring of long wall powered supports and its applications for continuous automatic evaluation of the strata behavior.
6 Optimal extraction of coal locked in pillars of multiple and thick seams 7 Development of microprocessor based solid state controller for
improving hauler efficiency
8 Study on occurrence of spontaneous heating in blasting gallery method and to evaluate suitable measures to prevent and control spontaneous heating in thick coal seams
9 Investigations to optimise blast design and charge loading parameters in coal for ring hole blasting and in stone for induced blasting in degree - I seams for blasting gallery method in underground mines of the SCCL.

76
ANNUAL PLAN 2010-11 - MoC DETAILS OF SCIENCE & TECHNOLOGY SCHEMES
Company: SCCL A. COMPLETED SCHEMES ( Rs. Crores )
Cum. Expdr. X Plan
2002-2007
2007-08 ACTUAL EXPDR
2008-09 ACTUAL EXPDR
2009-10 2010-11 PROPOSED
Sl.No. Name of the R&D Project
BE RE 10 Frequency analysis and modeling of noise pollution for an opencast coal project 11 Optimisation of production from underground coal mines by achieving longer pull
(Phase-I)
12 Development of a model vis-à-vis study of parameters influencing abutment loading of pillars at a depillaring face of shallow depth cover and under massive roof strata
13 Role of blast design parameters on ground vibration and correlation of vibration level to blasting damage to surface structures
0.0300
14 Study into extent of abutment loading trend and design of advance support during pillar extraction by stowing in a coal mine
15 Development of mining method for final extraction of critically thick coal seam standing on pillars and the development made along the roof horizon
0.0240
16 Development of integrated mine operation management system for a large opencast mine
0.0360
17 Development of support guidelines for depillaring panels in Indian Coal mines 18 Studies on the advance detection of fires in coal mines with special reference to
SCCL
19 Environmental impact of subsidence movements caused due to caving on ground water and forest cover in Godavari Valley coal fields
0.1120
20 Optimisation of pillar parameters for development and final extraction of highly inclined seams at SCCL mines
21 Efficacy of rock bolt in underground fire zones and water bearing exacavations 0.1400 22 Direct sourcing of coal for value added chemicals
Sub - Total (A) 0.3420

77
ANNUAL PLAN 2010-11 - MoC DETAILS OF SCIENCE & TECHNOLOGY SCHEMES
Company: SCCL
B. ON-GOING SCHEMES ( Rs. Crores ) Cum.
Expdr. X Plan
2002-2007
2007-08 ACTUAL EXPDR
2008-09 ACTUAL EXPDR
2009-10 2010-11 PROPOSED
Sl.No. Name of the R&D Project
BE RE
1 Indigenous development of proto-type long wall supports (Chock shields)
0.6450
2 Stability of parting between coal pillar workings in level contiguous seams during depillaring.
3 Investigations of cavability of overlying strata and development of guidelines for estimation of support capacity for long wall faces
4 High resolution seismic monitoring for early detection and analysis of slope failures in opencast mines
0.20818 0.02018 0.02018 0.2024
Sub - Total (B) 0.6450 0.20818 0.02018 0.02018 0.2024

78
ANNUAL PLAN 2010-11 - MoC DETAILS OF SCIENCE & TECHNOLOGY SCHEMES
Company: SCCL C. New Schemes (Rs. Crores)
Cum. Expdr. X Plan
2002-2007
2007-08 ACTUAL EXPDR
2008-09 ACTUAL EXPDR
2009-10 2010-11 PROPOSED
Sl.No. Name of the R&D Project
BE RE
1 Studies on FISCHERTROPSCH synthesis for production of liquid fuels from coal – derived Syngas: Suitability of moving bed gasification of high ash Indian coals
2 Optimisation of energy utilisation of mine fans using wind mill generator tapping wasteful energy of mine main fans
3 Physico mechanical studies of disturbances in coal mine strata and design of monitoring system for early prediction and warning of roof falls based on advent acoustic emission technology.
4 Study on the impact of blending of coals on combustion behavior in PFfired power plants
5 Insitu stress mapping by hydro fracturing technique in soft Barakar strata and coal in Godavari valley coal fields
6 Extraction of already developed standing pillars by CMT technology or short wall mining
7 Barrier less mining by fly ash stowing for 100% extraction from standing pillars 8 Subsidence, fires and pillar stability in proposed High wall mining in SCCL 9 Introduction of Hydraulic mining in hard, high quality and steep gradient coal seams
in SCCL
10 Feasibility studies on Indian coals adopting Top coal caving technologies 11 Development of On line monitoring and decision support for mechanized mines 12 Assessment of Geo mechanics in 250m LW face with 2.5 MT capacity 13 Effect of UG coal gasification on surface and neighborhood coal seams 14 Environmental studies in deep OC mines having depth up to 500m. 15 Introduction of advanced technologies in coal exploration
Sub - Total (C) 0.0000 0.0000 0.0000 0.0000 0.0000 0.0000 Grand Total (A+B+C) 0.9870 0.0000 0.2082 0.0202 0.0202 0.2024

79
ANNUAL PLAN FOR 2010-11 CIL R&D BOARD PROJECTS
(Rs in lakh)Sl. No Name of the Project Implementing Approved Disbursement Disb. During BE RE BE
Agency Outlay Prog. upto Actual 2009-10 2009-10 2009-10 2010-11
Date of Compl.
(Aug.09) 2008-09 (till Aug.09) 1 2 3 4 5 6 7 8 9 10 11 A. On-Going Projects 1 Installation of spiral concentrator demonstra- CMPDI/BCCL 817.94 May.2010 38.92 1.17 0.00 200.00 100.00 650.00 tion plant for beneficiation of fine coal at Moonidih Washery, BCCL 2 High concentration fly ash slurry stowing BCCL/ 721.41 Dec.2009 81.71 0.00 0.00 150.00 100.00 400.00 at Madhuband Colliery, BCCL. CIMFR Dec.2006 Jun.2004 3 Development of CIL / CMPDI’s capacity for CMPDI 1991.91 Jan.2011 1353.83 189.41 0.02 200.00 100.00 100.00 pursuing exploration of CBM in deep seated coal deposits of Jharia / Raniganj Coalfields 4 Technical study for old & active OB dumps of IIT Kgp./ 359.65 Mar.2009 358.00 150.00 0.00 50.00 - - open cast mines in WCL to determine stability WCL Oct.2008 Characteristics and dimensional parameters Sub-Total 340.58 0.02 600.00 300.00 1150.00

80
CIL R&D BOARD PROJECTS
(Rs in lakh)Sl. No Name of the Project Implementing Approved Disbursement Disb. During BE RE BE
Agency Outlay Prog. upto Actual 2009-10 2009-10 2009-10 2010-11
Date of Compl.
(Aug.09) 2008-09 (till Aug.09) 1 2 3 4 5 6 7 8 9 10 11
5 Investigation on augmentation of life of IIT Kgp / 148.69 May.2009 143.36 30.00 0.00 - - - dump truck tyres through the improvement ECL/NCL Oct.2008 of tyre retreading compound and deve- lopment of an optimum road maintenance management system. 6 Inventory and monitoring of underground and Presidency 138.40 Jan.2010 124.80 25.00 5.00 10.00 10.00 - surface coal mine fire for modeling fire College July.2009 dynamics coal field, Jharkhand using satellite Kolkata/ thermal remote sensing data BCCL 7 Development of methodology for rapid volumetric CMPDIL/ 388.00 Apr.2009 343.07 248.01 21.50 10.00 15.00 - analysis of excavated insitu overburden integrating NRSA July.2008 high resolution satellite, air borne laser scanner data supported with ETS through digital photogrammetric technique. 8 Operational improvement of HEMMs through ISM/CCL 129.69 July.2009 115.00 0.00 0.00 - - - lube oil analysis programme. 9 Indigenous development of PLC based CMPDIL /
SAIL 182.00 Jan.2010 148.30 80.00 0.00 30.00 30.00 -
integrated control and monitoring system for July.2009 conveyors and other equipment of UG mines.
Sub-Total 383.01 26.50 50.00 55.00 - Progressive Sub- Total 723.59 26.52 650.00 355.00 1150.00

81
CIL R&D BOARD PROJECTS
(Rs in lakh)Sl. No Name of the Project Implementing Approved Disbursement Disb. During BE RE BE
Agency Outlay Prog. upto Actual 2009-10 2009-10 2009-10 2010-11
Date of Compl.
(Aug.09) 2008-09 ( till Aug.09)
1 2 3 4 5 6 7 8 9 10 11
10 Development of immediate roof fall prediction IIT, Kharagpur 216.98 Oct.2010 115.00 115.00 0.00 50.00 50.00 50.00
system in U/G mines use in wireless network /ECL
11 Development of CMPDI capacity for delineation CMPDI 522.00 Nov.2010 0.00 0.00 0.00 200.00 250.00 250.00
of viable coal mine methane (CMM)abandoned
mine methane(AMM) Blocks in the existing and
would be mining areas having partly destressed
coal in Virgin coal seams.
12 Cost effective technology for beneficiation and * CMPDI/BCCL 2714.24 May.2010 0.00 0.00 0.00 200.00 25.00 500.00
recovery of the fine coal.
13 Development of a Coal Preparation Plant ** CMPDI / 530.90 May.2010 0.00 0.00 0.00 150.00 50.00 480.00
Simulator. CIMFR & BHEL
Sub- Total 115.00 0.00 600.00 375.00 1280.00Progressive Sub-total 838.59 26.52 1250.00 730.00 2430.00

82
CIL R&D BOARD PROJECTS
( Rs in lakh)Sl. No Name of the Project Implementing Approved Disbursmenent Disb. During BE RE BE
Agency Outlay Prog. upto Actual 2009-10 2009-10 2009-10 2010-11
Date of Compl.
(Aug.09) 2008-09 ( till Aug.09) 1 2 3 4 5 6 7 8 9 10 11
14 Delineation of workings below railway lines near Ratibati colliery, stability analysis by
CIMFR, Dhanbad / ECL
20.90518 Jul.2009 20.42 20.42 0.00 - - -
numerica modeling and possible remedial measures.
15 Exploration and determination of coal fire hot ECL / Ms DMT- 444.23 Apr.2009 444.00 444.00 0.00 - - - spots to prepare the strategy to put off the fire Avantika , in Nimcha & Samdih mines. Hyderabad
16 Analysis of in-situ stress for CBM Exploration in Jharia Coalfield
Exploration Department
168.597 Feb.2012 24.00 24.00 0.00 - 100.00 20.00
CMPDI,Ranchi / CMPDI-126.0 ISMU,Dhanbad ISMU-42.597
17 Recovery and Utilisation of Coal mine methane in Jharia and Raniganj Coalfields.
CIMFR, Dhanbad/
3339.98 May.2011 0.00 0.00 2100.00 - 2100.00 800.00
CIMFR-217.90 (1st year prov.) Molopo Austrlia Ltd,
Melbourne./ Molopo Aus-3073.72
Molopo Energy India Pvt. Ltd, Kolkata/
Molopo Ener(I)-48.36
Greentech Solutions Pvt. Ltd, Kolkata / ECL/ BCCL
Sub-total 488.42 2100.00 - 2200.00 820.00Progressive Sub-total 1327.01 2126.52 1250.00 2930.00 3250.00

83
CIL R&D BOARD PROJECTS
(Rs in lakh)Sl. No Name of the Project Implementing Approved Disbursement Disb. During BE RE BE
Agency Outlay Prog. upto Actual 2009-10 2009-10 2009-10 2010-11
Date of Compl.
(Aug.09) 2008-09 ( till Aug.09)
1 2 3 4 5 6 7 8 9 10 11
18 GPS Based production Reporting system System Depptt., 54.00 Aug.2010 0.00 0.00 0.00 - 30.00 24.00
in OCP CIL, Kolkata/
System Depptt. ECL
19 Studies of techno-commercial efficacy of CMPDI, Ranchi / 206.8 Feb.2011 0.00 0.00 0.00 - 150.00 56.00
ANFO with low density porous prilled D FPCL, Pune
Ammonium Nitrate for blasting overburden
in Coal mines
20 Effective Utilisation of low rank and low CMPDI, Ranchi/ 265.00 Aug.2011 0.00 0.00 0.00 - 50.00 150.00
volatile high rank Indian coking coals for RDCIS (SAIL),
blast furnace (BF) coke making Ranchi
Sub-total 0.00 0.00 - 230.00 230.00
Progressive Sub-total 1327.01 2126.52 1250.00 3160.00 3480.00

84
CIL R&D BOARD PROJECTS
(Rs in lakh)Sl. No Name of the Project Implementing Approved Disbursement Disb. During BE RE BE
Agency Outlay Prog. upto Actual 2009-10 2009-10 2009-10 2010-11
Date of Compl.
(Aug.09) 2008-09 ( till Aug.09)
1 2 3 4 5 6 7 8 9 10 11
B. Expected reimbursement to Completed projects 21 Introduction of short wall technology for 3513.05 Dec'06 246.31 0.00 - 1700.00 - extraction of standing pillars with powered roof CIL- 2000 Dec'03 support in pillars of passing seam of SECL-1513.05 Balrampur underground project.
22 Development of accurate and rapid method of CMPDI 181.85 July.08 155.20 12.75 0.00 - - - Correlation survey of UG Mines Oct.07 July.06
23 Resource Assessment and characterisation CMPDI 295.00 Sep.08 179.39 64.406 2.70 - - - study of non- coking coal for sponge iron Jan'07 industry
C. New CIL R&D projects to be sanctioned 0.00 250.00 300.00 1000.00
Sub- Total 77.156 2.70 250.00 2000.00 1000.00Grand Total (A+B+C) 1404.17 2129.22 1500.00 5160.00 4480.00

85
EMSC - ANNUAL PLAN 2010 - 11
( Rs. in Lakhs )Sl. No.
EMSC CODE
Name of the scheme Company Scheduled/ Revised
completion date
Approved cost
Disbursement up to Feb' 10
Actual expenditure at Project up to Feb'
10
Balance available with the
Project ( Feb' 2010)
B.E 09-10
R.E 09-10
B.E 10- 11
Proj. B.E
11- 12
Remarks
(A) ENVIRONMENTAL MEASURES SCHEMES: 2 SCHEMES 1 EMSC-
21 Scheme for dealing with fire and subsidence at Rajapur / South Jharia colliery,
BCCL 31.3.04 (O) 30.6.06 (R )
471.87 376.68 341.01 35.67 25.00 0.00 0.00 0.00
2 EMSC-34
Scheme for reclamation of degraded land in Govindpur, Katras and P.B area. (125 Ha)
BCCL 31.08.08(O) 31.03.09
(R)
66.25 54.00 40.58 13.42 0.00 0.00 0.00 0.00
The Cabinet Committee on Infrastructure has approved the Master Plan dealing with fire, subsidence and rehabilitation and diversion of surface infrastructure within the leasehold of Bharat Coking Coal Limited (BCCL) & Eastern Coalfields Limited (ECL) on 30th July, 2009 at an estimated investment of Rs. 9657.61 crores (Rs. 7028.40 crores for Jharia Coal Field (JCF) and Rs. 2629.21 crores for Raniganj Coal Field (RCF) excluding Rs.116.23 crores sanctioned earlier for various Environmental Measures & Subsidence Control (EMSC) schemes.EMSC schemes have been merged with Master Plan dealing with fire, subsidence and rehabilitation and diversion of surface infrastructures.
TOTAL ( A ) 538.12 430.68 381.59 49.09 25.00 0.00 0.00 0.00 (B) SUBSIDENCE CONTROL SCHEMES: 9 SCHEMES
1 EMSC-01
Stabilisation of inaccessible waterlogged voids beneath Fatehpur village.
ECL 31.3.00 (O) 31.12.08(R)
500.00 397.00 387.11 9.89 10.00 10.00 0.00 0.00
2 EMSC-15
Stabilisation of inaccessible waterlogged voids beneath Palasban Area.
ECL 30.9.01 (O) 31.12.09 (R
)
187.77 85.00 91.42 -6.42 5.00 5.00 0.00 0.00
3 EMSC-16
Stabilisation of inaccessible waterlogged voids beneath Gwala Basti.
ECL 30.9.01 (O) 31.12.09
(R)
187.77 185.00 187.77 -2.77 0.00 0.00 0.00 0.00
4 EMSC-18
Stabilisation of inaccessible waterlogged voids beneath Pottary Area.
ECL 30.9.01 (O) 30.4.09(R)
187.77 160.00 163.05 -3.05 15.00 15.00 0.00 0.00
5 EMSC-26
Stabilisation of inaccessible waterlogged voids beneath Haripur village.
ECL 31.7.99 (O) 31.12.09(R)
187.77 165.00 187.77 -22.77 0.00 0.00 0.00 0.00
6 EMSC-29
Stabilisation of inaccessible waterlogged voids beneath Sanctoria village and other areas.
ECL 31.12.05 (O)
31.12.09(R)
478.38 225.00 151.54 73.46 0.00 0.00 0.00 0.00
7 EMSC-31
Stabilisation of govt. colony, Jeebnepara village, Vivekananda School, Satgram Area
ECL 31.08.07(O)
31.08.09( R)
140.00 20.00 0.00 20.00 20.00 20.00 0.00 0.00

86
EMSC - ANNUAL PLAN 2010 - 11 ( Rs. in Lakhs )
Sl. No.
EMSC CODE
Name of the scheme Company Scheduled/ Revised
completion date
Approved cost
Disbursement up to Feb' 10
Actual expenditure at Project up to Feb'
10
Balance available with the
Project ( Feb' 2010)
B.E 09-10
R.E 09-10
B.E 10- 11
Proj. B.E
11- 12
Remarks
8 EMSC-32
Stabilisation of inaccessible waterlogged voids beneath Narsamuda village, (Phase I)
ECL 31.08.09 (O)
202.00 40.00 0.63 39.37 0.00 0.00 0.00 0.00
9 EMSC-33
Stabilisation of inaccessible waterlogged voids beneath Alluthia / Bharatchak (Phase-I)
ECL 31.08.09 (O)
212.00 40.00 3.01 36.99 0.00 0.00 0.00 0.00
TOTAL ( B ) 2283.46 1317.00 1172.30 144.70 50.00 50.00 0.00 0.00(C ) REHABILITATION ( SOCIAL MITIGATION ) SCHEMES : 2 SCHEMES
1 EMSC-24
Shifting of people from most endangered areas of BCCL.
BCCL 31.05.00(O) 31.03.09
(R)
6109.00 5092.00 3240.13 1851.87 0.00 100.00 0.00 0.00
2 EMSC-25
Rehabilitation of four unstable localities in ECL.
ECL 31.5.01(O) 31.03.11(R)
3252.49 2350.00 50.82 2299.18 0.00 0.00 0.00 0.00
TOTAL ( C ) 9361.49 7442.00 3290.95 4151.05 0.00 100.00 0.00 0.00 (D ) FIRE CONTROL SCHEMES : 3 SCHEMES
1 RCFS-01 Scheme for control of fire and subsidence for protection of Dhanbad - Patherdih Railway line at Lodna and Bagdidi colliery.
BCCL 31.12.05 (O)
30.06.09 ( R)
635.23 Revised to
292.00
144.00 2.28 141.72 0.00 0.00 0.00 0.00
2 RCFS-02 Scheme for dealing with fire for protection of Adra-Gomoh Railway line at Block-II OCP and Phularitand colliery
BCCL 31.12.05 (O)
31.08.10 (R )
578.41 320.00 226.83 93.17 0.00 0.00 0.00 0.00
3 RCFS-03 Scheme for dealing with fire for protection of Chatkari jore at Jeenagora / Bararee colliery.
BCCL 31.12.05 (O)
31.08.08 (R )
769.82 430.00 244.59 185.41 0.00 0.00 0.00 0.00
The Cabinet Committee on Infrastructure has approved the Master Plan dealing with fire, subsidence and rehabilitation and diversion of surface infrastructure within the leasehold of Bharat Coking Coal Limited (BCCL) & Eastern Coalfields Limited (ECL) on 30th July, 2009 at an estimated investment of Rs. 9657.61 crores (Rs. 7028.40 crores for Jharia Coal Field (JCF) and Rs. 2629.21 crores for Raniganj Coal Field (RCF) excluding Rs.116.23 crores sanctioned earlier for various Environmental Measures & Subsidence Control (EMSC) schemes. EMSC schemes have been merged with Master Plan dealing with fire, subsidence and rehabilitation and diversion of surface infrastructures.
TOTAL (D ) 1348.23 894.00 473.70 420.30 0.00 0.00 0.00 0.00 (E ) Co-ordination of EMSC schemes 40.00 20.00 0.00 0.00 TOTAL ( A+B+C+D+E) 5318.54 4765.14 115.00 170.00 0.00 0.00

87
ANNUAL PLAN 2010-11 - MoC DETAILS OF SCHEMES OF EMSC CONTROL, REHABILITATION AND CONTROL OF FIRES
Company: SCCL Rs. Crores
Sl. Title of the Scheme 2006-07 Cumulative during X Plan (2002-07)
2007-08 2008-09 2009-10 2010-11
No. ACTUAL BE RE ACTUAL ACTUAL BE RE Proposed Singareni Collieries Co. Ltd. A Environmental measures (i) Ongoing projects a) Baseline data generation, preparation of EMP etc. 0.190 Nil 0.065 0.049 0.000 0.000 0.000 for proposed projects viz. Kasipet, Abbapur and Dorli Blocks.
b) Baseline data generation, preparation of EMP for JVR OC-I 0.047 0.347 0.026 0.026 0.000 c) Baseline data generation and preparation of EMPs for 0.060 0.315 0.315 Projects JK-5 OC, MNG.OC-II Ext., RG OC-III Exp and
MNG OCP. 0.026 0.000 0.000 0.012
d) Baseline data generation and preparation of EMPs for 0.113 0.300 0.113 0.138 0.036 New Projects.SRP OC-II, Sravanapalli OC and Indaram
OC
e) Baseline data generation, preparation of EMP etc. for 0.298 0.102 0.102 0.000 0.000 0.000 proposed projects viz. Koyagudem OC-I(Phase-II), Koyagudem OC-II, RG.OC-I (Expansion), Adriyala Shaft
Block
Jallaram Shaft, Shanthikhani Longwall. f) Construction of Check dams/rock fill dams/settling
ponds/toe walls/ 0.200 0.200 3.569 3.569 3.391 1.620 1.078 1.078 1.000
garland drains, ETPs, RWHS etc. at OCPs as per the requirements.
g) Payment of Statutory fees under Air & Water acts for 0.298 0.150 0.400 0.085 0.230 0.000 0.000 0.500 obtaining consent for Establishment (CFE) for New
Projects.
h) Asphalting of internal roads and approach roads 2.522 2.522 20.000 20.000 10.000 i) Pollution monitoring facilities 0.524 0.446 0.545 0.545 0.500 j) Greenbelt development and bio-engineering 0.892 0.892 1.180 1.180 1.000 k) Plant and Machinery , Equipment for Environment
Protection 4.760 4.760 4.000 0.780 10.977 10.977 20.000
l) Noise & Blast vibration control measures 0.150 0.150 0.020 0.020 0.050 m) Reclamation / Subsidence Management 0.386 0.386 0.500 0.500 0.500 n) Others i.e disposal of shale and waste material 0.025 0.025 0.400 0.400 0.400 o) Pollution abatement including dust extraction systems 0.300 0.000 0.000 0.945 0.945 3.000 /Water spray equipment at CHPs & OCPs.
p) Vehicles for Environment Department (Corporate & RGM Region)
0.100 0.200 0.200 0.000 0.000 0.000

88
ANNUAL PLAN 2010-11 - MoC DETAILS OF SCHEMES OF EMSC CONTROL, REHABILITATION AND CONTROL OF FIRES Company: SCCL
Rs. CroresSl. Title of the Scheme 2006-07 Cumulative during
X Plan (2002-07) 2007-08 2008-09 2009-10 2010-11
No. ACTUAL BE RE ACTUAL ACTUAL BE RE Proposed q) Furniture for Environment Department 0.100 0.100 0.100 0.005 0.005 0.000 r) Expenditure for Environmental Clearances and scientific
studies 0.050 0.100 0.100 0.008 0.005 0.005 0.200
as advised by MoEF (ii) New projects a) Baseline data generation and EIA/EMP preparation for new
projects 0.128
(KTK Long wall, RKP shaft block) b) Baseline data generation and preparation of EMPs for 0.000 0.000 0.038 0.140 0.140 0.020 power plants
c) Baseline data generation and preparation of EMPs for 0.062 0.062 0.000 0.062 0.036 0.012 0.000 0.000 0.012 Rampur shaft block
d) Baseline data generation and preparation of EMPs for 0.060 0.315 0.315 0.075 0.074 0.074 0.018 New Projects (JVR OC-II, Kunavaram OCP)
e) Baseline data generation for proposed Peddampet Shaft 0.037 0.075 0.075 0.057 0.000 0.000 0.000 Block. f) Baseline data generation and preparation of EMPs for 0.062 0.386 0.386 1.000 proposed coal mining Projects
g) Ground water Clearances 0.045 0.045 0.050 h) Pollution monitoring equipment / facilities 0.500 0.500 0.500 i) Scientific studies including subsidence prediction, slope
stability, 0.730 0.730 0.550
Socio-economic study, Natural resource accounting, CDM project etc.,
j) CFE fee to be paid to APPCB 0.840 0.840 0.000 (iii) Completed projects a) Baseline data generation for SRP 2&2A OC 0.020 b) Baseline data generation for KTK-7 and KTK-8 Inclines 0.017 c) Baseline data generation, EMP preparation for existing
mines 1.316 1.316 0.685 0.000 0.000 0.100
under violation category d) Environment awareness 0.252 0.086 0.086 0.013 0.200 0.200 0.150 e) Asphalting of internal roads and approach roads 6.372 6.572 6.400 1.000 1.000 1.000 f) Dust suppression measures 0.920 0.920 0.007 15.290 1.000 1.000 1.000 g) Plantation 0.656 0.656 0.780 0.750 0.750 1.000 h) Plant and Machinery , Equipment for Environment
Protection 6.308 6.308 5.970 0.500 0.500 0.500
i) Noise & Blast vibration control measures 0.715 0.715 0.900 0.900 0.500

89
ANNUAL PLAN 2010-11 - MoC DETAILS OF SCHEMES OF EMSC CONTROL, REHABILITATION AND CONTROL OF FIRES Company: SCCL
Rs. CroresSl. Title of the Scheme 2006-07 Cumulative during
X Plan (2002-07) 2007-08 2008-09 2009-10 2010-11
No. ACTUAL BE RE ACTUAL ACTUAL BE RE Proposed j) Reclamation / Subsidence Management 1.820 1.820 1.000 1.000 1.000 k) Others i.e disposal of shale and waste material 0.060 0.060 1.000 1.000 0.500 l) Construction of Check dams/rock fill dams/settling
ponds/toe walls/ 3.140 3.140 0.500 0.500 1.000
garland drains etc. at OCPs as per the requirements. Sub-Total (A): 0.375 3.835 34.374 36.214 19.925 20.072 45.246 45.246 46.062
B. Subsidence study & control measures i) Completed projects a) 21 Incline 0.018 b) Goleti 1&1A 0.066 ii) Ongoing projects a) Jallaram Shaft 0.018 ii) New projects a) Subsidence prediction study for renewal of mining leases
and control 0.100 0.100 0.100 0.031 0.053 0.500 0.500 0.100
b) Subsidence prediction study for new mines 0.100 0.200 c) Peddampet Shaft 0.024 Sub-Total (B) 0.302 0.100 0.100 0.031 0.053 0.500 0.500 0.300
C) Monitoring a) Post-Project environmental monitoring data on Air and 0.121 0.535 0.500 0.500 0.250 0.250 0.500 0.500 0.600 water quality at all the SCCL Areas.
b) Consultancy payments & Scientific studies in the field of Environment.
0.037 0.075 1.768 1.768 0.139 0.300 0.300 0.400
c) Preparation of Vegetation and land cover details using 0.023 Nil 0.500 0.100 0.100 0.100 satellite imageries for existing projects
d) Environmental quality monitoring equipment 0.402 0.448 0.014 0.500 0.500 1.050 f) Ground water studies NIL 0.500 0.050 0.050 0.050 Sub-Total (C) 0.158 0.633 2.670 3.216 0.403 0.250 1.450 1.450 2.200 Total A+B+C 0.533 4.770 37.144 39.530 20.359 20.375 47.196 47.196 48.562

90
ENERGY CONSERVATION PROGRAMME RE 09-10& BE 11-12
(Rs. in Crores)
2009 - 2010 Company Activity Actual
Expenditure(08-09) B E R E
2010 – 11
BE / Target
0.120 - 0.227 0.342 1.266 0.100 -
0.100 - 0.200 0.400 1.500 0.100 0.030
0.130 - 0.200 0.400 1.650 0.100 0.030
0.130 0.04 0.300 0.400 2.000 0.100 0.100
ECL 1.Segregation of domestic load from industrial load to get exemption of electricity duty. 2.Installation of demand controller / energy saving device. 3. Installation of Capacitor bank 4. Energy Audit for u/g mines 5.Re-organisation of power supply system 6. Cable and Pumping through bore hole 7. Installation of energy efficient lamp 2.055 2.330 2.510 3.070
0.045 0.650 2.250 1.500
0.050 0.800 3.220 1.500
0.060 0.650 2.200 2.500
0.050 0.800 3.480 3.500
BCCL 1.Capacitor installation 2.Energy conservation reports prepared by CMPDI for mines/ projects 3.Implementation of the above reports (including carrying 3.3kv to u/g mines) 4. Re-organisation of pump
4.445 5.570 5.410 7.830 0.539 0.010 0.130 0.010 0.006 0.003
0.400 0.100 0.600 0.120 0.006 0.006
0.592 0.300 0.120 0.120 0.006 0.006
0.800 0.300 0.600 0.120 0.006 0.006
CCL 1.Energy Audit report (Electrical energy, Diesel/ Lub oil) 2.Energy Conservation 3.Power factor correction /Capacitor installation. 4.POL Conservation 5.Seminar held 6.Energy conservation awareness programme
0.698 1.232 1.144 1.832 NCL 1.Energy Audit report formulation
2.Use of solar photo voltaic street light system 3.Use of energy efficient lamp (SVL) for street & flood lighting. 4. Using static capacitor/capacitor bank for power factor improvement and soft starters 5. Installation of energy meter & P.F meter in mines and township. 6. Time switch for street light
- - 0.3984 0.02 0.0278 0.1073
0.500 - 0.500 0.500 0.100 0.100
- 0.120 0.400 0.350 0.100 0.150
0.50 0.10 . 0.50 0.50 0.10 0.10

91
2009 - 2010
Company Activity Actual Expenditure
(08-09) B E R E
2010 – 11
BE / Target
0.5535 1.700 1.120 1.800 0.212 0.440 0.08 0.800 0.180 -
0.15 0.500 0.50 0.05 0.50 1.000
0.150 14.00 0.800 0.300 0.500 0.500
0.15 0.50 0.050 0.05 0.50 1.000
WCL 1.Addition of capacitors 2. Reorg. of power supply 3. Segregation of domestic feeder 4. Re-organisation of pumping 5. Conducting energy audit 6. Installation of underground bunker
1.712 2.700 16.250 2.25 0.420 0.100 2.000 0.160 0.800 0.030 0.230 0.400 0.000
0.500 0.080 10.200 0.070 2.000 0.080 0.850 2.300 1.000
0.100 0.120 2.000 0.400 0.500 0.020 0.160 0.600 0.200
0.250 0.300 3.000 0.200 5.800 0.340 0.320 1.350 1.250
MCL 1. Power factor improvement 2.Demand management 3. Re-organisation of power Supp. 4. Awareness programme 5. Energy efficient lighting 6. Power system design Improv. 7. Construction of strata bunker 8. Re-organisation of pumping circuit 9. Energy Audit Report formulation
4.140 17.080 4.100 12.810 SECL 1. Power factor Correction
2. Re-organization of dewatering pipe 3. Bore hole pumping 4. Construction of strata Bunker 5. Ventilation System Improvement 6. Re-organisation of Transport System 7. Re-organisation of Power supply 8. Energy Efficient Lighting 9. Others
0.582 0.680 0.332 0.509 0.350 0.100 1.334 2.723 0.335
0.750 0.770 0.565 0.680 0.430 0.120 1.229 1.854 0.125
0.750 0.770 0.565 0.680 0.430 0.120 1.229 1.854 0.125
0.800 0.700 0.400 0.500 0.400 0.100 1.000 1.800 0.800
6.945 6.523 6.523 6.500 TOTAL CIL 20.6165 23.782 36.857 34.842 SCCL 0.350 2.500 1.750 3.000

92
COAL SALE OUTSTANDING DUES AS ON 31.03.08 & 31.03.09 OF POWER & OTHERS
COAL INDIA LIMITED Rs.crores
SL.NO SECTORS 31.3.2008 31.03.2009 POWER 1 BSEB 185.80 177.10 2 JSEB 100.92 140.26 3 UPRVUNL 48.91 15.18 4 PSEB 107.51 64.26 5 TNEB 67.85 28.60 6 HPGCL 13.74 5.60 7 RRVUNL 70.92 84.93 8 MSPGCL 50.84 62.47 9 MPPGCL 320.44 304.57 10 CSEB 49.31 30.15 11 GEB (GSECL) -25.40 -61.08 12 WBSEB 1.29 1.29 13 WBPDCL 173.42 130.56 14 APGENCO 1.46 2.60 15 ASEB -0.01 -0.01 16 KPCL 20.04 11.68 17 DPL -7.35 12.29 18 DVC 71.22 169.35 19 DVB 5.82 7.98 20 BTPS 18.69 60.61 21 NTPC 375.73 241.16 22 VPGC -0.68 -4.51 23 BALCO 0.58 -9.27 24 CESC 1.29 15.59 25 AEC 2.48 5.33 26 BSES 3.27 -3.82 27 DPS 1.89 3.15 28 TVNL 167.33 188.16 29 HPCL 30 OPGC 6.52 11.07 31 BOKARO PS -2.18 -13.41 32 RP Co. 33 TATA Hydro. -0.02 -0.02 TOTAL POWER 1831.63 1681.82
34 OTHERS 221.44 260.53 G. TOTAL 2053.07 1942.35 OUTSTANDING DUES OF COAL SALES - SCCL PARTICULARS March-09 March-10 (Anticipated) SCCL APGENCO (A.P) 134.00 55.00 MSEB (MAHARASTRA) 10.00 25.00 TNEB (TAMILNADU) KPCL (KARNATAKA) 27.00 12.00 NTPC 26.00 35.00 TOTAL SCCL 197.00 127.00

93
STATEMENT OF ROYALTY PAYMENT MADE BY COAL COMPANIES
(Fig. in Rs. Crores)COAL INDIA LIMITED
COMPANY STATE 2007 - 08 2008 - 09 2009 - 10 ACTUAL ACTUAL ANTICIPATED
ECL WEST BENGAL 9.27 9.51 9.66 JHARKHAND 93.41 128.57 159.79
BCCL WEST BENGAL 0.17 0.12 0.05 JHARKHAND 310.23 377.46 420.83
CCL JHARKHAND 485.53 556.46 561.48
MCL ORISSA 624.51 762.14 872.38
WCL MAHARASHTRA 410.37 503.06 496.87 MADHYA PRADESH 89.86 106.35 99.04
SECL MADHYA PRADESH 173.15 212.41 207.77 CHHATTISGARH 765.23 887.51 898.44
NCL MADHYA PRADESH 504.40 645.17 624.47 UTTAR PRADESH 115.17 93.40 169.17
NEC ASSAM 20.92 19.00 24.98
TOTAL CIL 3602.22 4301.16 4544.93
SCCL AP ROYALTY 479.02 556.82 546.17 APMBL Cess 35.78 TOTAL SCCL 514.80 556.82 546.17

94
Welfare Measures -- Year wise Status
Coal India Limited Status Target Antic. Projection As on As on As on As on 01.04.2009 01.04.2010 01.04.2010 01.04.2011
08 - 09 (Actual) 09 - 10 (Tar) 09 - 10 (Ant) 10 - 11
1 (a) No of Houses 4113308 414348 414337 414113
(b) Manpower 412350 401891 403724 392545
2 (a) No of Hospitals 85 85 86 87
(b) No of Beds 5835 5970 5970 5970
(c) No of Dispensaries 424 424 424 424
3 - Water Supply 2294043 2297349 2295088 2297173
(Total Population covered)

95
ANNUAL PLAN 2010-11 - MoC COMPANY WISE SAFETY & WELFARE MEASURES
Company: SCCL Sl. Company 2006-07 2007-08 2008-09 2009-10 2010-11 2011-12 No. Actual Actual Actual Target Anticipated Proposed Projected0 1 2 3 4 5 6 7 8
SCCL
1 Fatality Rate (Per MT of Coal produced)
0.50 0.27 0.30
2 No. of Houses 47,604 49,705 50,056 50,610 50,610 50,802 50,802
Manpower 82,224 75,573 70,586 69,182 69,370 67,692 63,176
Housing satisfaction (%)
58% 66% 71% 73% 73% 75% 80%
3 No. of Hospitals 8 8 8 7 7 7 7
No. of Beds 1058 1058 1008 845 845 845 845
No. of Dispensaries 40 40 36 28 28 28 28
4 Water Supply 31.55 31.50 31.50 31.50 31.50 31.50 31.50
(Total Population covered)
650,000 650,000 650,000 650,000 650,000 650,000 650,000

96
Cost of Production
(Rs. Per Tonne) Company 2006-07 2007-08 2008-09 2009-10 2009-10 2010-11
Actual Actual Actual BE RE BE ECL OC 505.08 742.99 792.32 UG 3059.96 3608.88 4930.41 Overall 1172.48 1702.81 1984.67 1545.47 1646.66 1592.76 BCCL OC 621.84 659.65 927.51 UG 3284.55 4059.40 6480.00 Overall 1140.92 1238.82 1794.40 1459.61 1507.98 1475.35 CCL OC 514.58 549.86 663.59 UG 2881.52 3464.67 5652.13 Overall 625.69 670.28 842.72 750.60 833.95 810.60 NCL OC 544.78 527.93 601.06 UG Overall 544.78 527.93 601.06 595.47 625.72 634.92 WCL OC 619.62 706.75 821.20 UG 1455.44 1618.05 2123.20 Overall 811.10 915.47 1115.76 1095.37 1127.90 1194.15 SECL OC 346.17 353.15 378.67 UG 1424.22 1612.58 1963.78 Overall 543.19 576.95 652.38 660.58 651.20 672.24 MCL OC 214.46 229.56 324.00 UG 1292.05 1395.00 1664.06 Overall 240.97 257.59 353.84 316.07 391.28 343.19 CIL OC 426.76 452.29 536.13 UG 2017.61 2318.71 3114.36 Overall 614.88 663.42 812.71 736.64 781.70 772.10

97
ANNUAL PLAN 2010-11 - MoC COST OF PRODUCTION UG, OC, OVERALL & AVERAGE SALES REALISATION
Company: SCCL (Rs. Crs.)
Sl. Company 2006-07 2007-08 2008-09 2009-10 AP 2010-11 AP 2011-12
No. Actual Actual Actual Target Anticip. Proposed Projected
0 1 2 3 4 5 6 7 8
Cost of Production
SCCL OC 1650.90 2156.53 2900.91 2454.38 2980.34 2850.55 2812.33
UG 2148.62 2240.80 2531.62 2291.10 2418.60 2497.54 2529.29
Overall 3799.52 4397.33 5432.53 4745.48 5398.94 5348.09 5341.62
Average Overall Sales Realisation
SCCL 3863.32 4573.49 5680.86 5305.61 5942.63 5958.81 6200.20

98
Sales Value of Production
(Rs. Per Tonne)
Company 2006-07 2007-08 2008-09 2009-10 2009-10 2010-11 Actual Actual Actual BE RE BE
ECL OC 991.37 1173.82 1169.77 UG 1699.16 1710.29 1936.04 Overall 1176.26 1353.49 1390.57 1291.31 1712.87 1771.60 BCCL OC 930.71 979.66 1224.30 UG 1299.25 1356.51 1626.82 Overall 1002.55 1043.86 1287.15 1290.98 1499.25 1594.39 CCL OC 763.14 811.60 958.21 UG 1290.08 1380.09 1494.07 Overall 787.88 835.08 977.45 889.33 960.00 1010.00 NCL OC 872.59 909.31 1010.07 UG Overall 872.59 909.31 1010.07 970.17 1020.00 1070.00 WCL OC 965.51 1070.25 1188.27 UG 1136.60 1269.59 1435.90 Overall 1004.70 1115.91 1244.31 1149.51 1183.74 1255.64 SECL OC 591.20 652.27 708.30 UG 1244.03 1249.54 1411.32 Overall 710.51 758.41 829.69 810.15 817.60 846.47 MCL OC 462.37 483.64 550.47 UG 919.32 949.92 926.62 Overall 473.61 494.86 558.84 510.26 582.24 604.28 CIL OC 719.97 765.78 856.99 UG 1297.20 1342.49 1514.11 Overall 788.23 831.01 927.48 873.09 954.72 997.96

99
SCHEMEWISE PRODUCTION PLAN PROD - 2
Eastern Coalfields Ltd Figures in MtSL NO
GROUP TYPE OF
MINE
Capacity as assessed as on
1.4.09
Actual (08 - 09)
09-10 (BE)
09-10 (RE)
10-11 (BE)
11-12 (Proj)
A Existing Mines 1 Badjna UG MS 0.063 0.04 0.03 0.04 0.05 0.06 2 Bansra Comp 0.13 Shown in Complted project 3 Begunia UG MS 0.038 0.02 0.02 0.02 0 0.00 4 Bejdih UG RNJ 0.063 0.05 0.05 0.06 0.06 0.06 5 Belbaid UG RNJ 0.115 0.12 0.1 0.13 0.14 0.14 6 C L Jambad UG RNJ 0.044 0.04 0.05 0.04 0.06 0.06 7 Chakballavpur UG MS 0.028 0.01 0.02 0.01 0.00 0.00 8 Chapuikhas UG RNJ 0.057 0.03 0.03 0.02 0.03 0.05 9 Chora 7 & 9 pit UG RNJ 0.122 0.06 0.06 0.07 0.11 0.11
10 Dabor UG MS 0.043 0.03 0.03 0.03 0.04 0.00 11 Dalurband UG RNJ 0.174 0.16 0.15 0.16 0.16 0.16 12 Ghusick UG RNJ 0.057 0.04 0.04 0.03 0.05 0.05 13 Haripur UG RNJ 0.122 0.07 0.06 0.07 0.08 0.08 14 Jambad UG RNJ 0.177 0.09 0.12 0.09 0.09 0.09 15 Jemehari UG RNJ 0.021 0.01 0.01 0.01 0 0.00 16 Kalipahari RNJ 0.05 0.03 0.04 0.03 0.04 0.05 17 Kendra UG RNJ 0.038 0.03 0.03 0.03 0.00 0.00 18 Khandra UG RNJ 0.174 0.12 0.11 0.12 0.13 0.14 19 Khas Kajora UG RNJ 0.197 0.23 0.24 0.24 0.24 0.27 20 Kuardih UG RNJ 0.057 0.04 0.05 0.04 0.04 0.04 21 Kumardhubi UG RNJ 0.09 0.03 0.02 0.03 0.03 0.04 22 Kumardihi A UG RNJ 0.158 0.12 0.1 0.11 0.13 0.14 23 Kumardihi B UG RNJ 0.078 0.08 0.1 0.07 0.10 0.09 24 Kusadanga UG RNJ 0.05 0.03 0.04 0.03 0.04 0.05 25 Lachipur UG RNJ 0.047 0.05 0.05 0.05 0.04 0.04 26 Lakhimata UG MS 0.112 0.08 0.07 0.09 0.09 0.09 27 Madaipur UG RNJ 0.165 0.15 0.15 0.15 0.16 0.17 28 Madhabpur UG RNJ 0.083 0.08 0.08 0.07 0.06 0.06 29 Madhusudanpur 3 &
4 Pit UG RNJ 0.03 0 0.00 0.00 0.00
30 Manderboni UG RNJ 0.155 0.10 0.11 0.1 0.12 0.13 31 Mandman UG MS 0.057 0.02 0.03 0.03 0.03 0.03 32 Methani UG RNJ 0.034 0.03 0.04 0.04 0.04 0.05 33 Mithapur UG RNJ 0.032 0.02 0.03 0.02 0.00 0.00 34 Moira UG RNJ 0.099 0.06 0.05 0.08 0.08 0.09 35 Monoharbahal UG MS 0.03 0.03 0.03 0.03 0.00 0.00 36 Nabakajora UG RNJ 0.109 0.06 0.08 0.06 0.07 0.05 37 New Kenda UG RNJ 0.072 0.04 0.05 0.05 0.06 0.06 38 Nimcha UG RNJ 0.363 0.20 0.3 0.23 0.27 0.28 39 Ningah UG RNJ 0.127 0.04 0.04 0.04 0.05 0.06 40 Pandaveswar UG RNJ 0.145 0.11 0.1 0.12 0.14 0.14 41 Parascole UG RNJ 0.237 0.20 0.24 0.19 0.2 0.2 42 Parasea UG RNJ 0.182 0.23 0.21 0.24 0.24 0.24 43 Parbelia UG RNJ 0.155 0.10 0.12 0.1 0.10 0.10 44 Pure Searsole UG RNJ 0.024 0.02 0.02 0.02 0.02 0.03 45 Shampur B UG MS 0.121 0.06 0.07 0.06 0.08 0.08 46 Shankarpur UG RNJ 0.123 0.10 0.07 0.07 0.07 0.07 47 Siduli UG RNJ 0.103 0.09 0.1 0.09 0.12 0.12 48 Sripur Seam Incline UG RNJ 0.058 0.04 0.05 0.04 0.05 0.05 49 Tilaboni UG RNJ 0.2 0.18 0.19 0.2 0.2 0.20 50 Tirath UG RNJ 0.046 0.03 0.03 0.02 0 0.00

100
SCHEMEWISE PRODUCTION PLAN PROD - 2 Eastern Coalfields Ltd Figures in Mt
SL NO
GROUP TYPE OF
MINE
Capacity as assessed as on
1.4.09
Actual (08 - 09)
09-10 (BE)
09-10 (RE)
10-11 (BE)
11-12 (Proj)
A Existing Mines Sub-total (Existing ) UG 4.895 3.58 3.94 3.67 3.91 4.02
51 Gourangdih OC( Dept) MS 0.02 0.04 0.00 0.00 0.00 0.00 52 Simlong OC( Dept) RAJ 0 0.00 0.00 0.00 0.00 0.00 53 Sitaldasji OC( Dept) RNJ 0 0.03 0.00 0.00 0.00 0.00 54 North Searsole OC( Dept) RNJ 0 0.00 0.00 0.00 0.00 0.00 55 Mahabir OC( Dept) RNJ 0.33 0.26 0.00 0.22 0.2 0.00 56 Shyampur
A/Gopinathpur OC OC( Dept) MS 0.06 0.09 0.00 0.10 0.10 0.10
OC Patchesby outsoursing
1 Bilpahari OC(H) RNJ 0.00 0.00 0.00 0 0.00 2 Dalurband Ph-II OC(H) RNJ 0.14 0.10 0.25 0.02 0.00 3 Samla OC(H) RNJ 0.00 0.00 0.00 0.00 0.16 4 Madhaipur OC(H) RNJ 0.00 0.00 0.00 0.00 0.20 5 Avirampur OC(H) RNJ 0.00 0.00 0.00 0.00 0.00 6 Sankarpur OC(H) RNJ 0.00 0.00 0.00 0.00 0.00 7 Bankola OC(H) RNJ 0.01 0.10 0.14 0.20 0.09 8 Nakrakonda B OC(H) RNJ 0.89 1.00 1.20 1.20 1.05 9 Nabakajora OC(H) RNJ 0.02 0.00 0.00 0.00 0.00
10 Madhabpur OC(H) RNJ 0.21 0.00 0.00 0.00 0.00 11 Bonbohal OC(H) RNJ 0.00 0.00 0.00 0.07 0.15 12 Narainkuri OC(H) RNJ 0.00 0.00 0.00 0.31 0.40 13 Hansdia/Repl. OC(H) RNJ 0.30 1.00 1.00 1.00 1.20 14 Damalia OC(H) RNJ 0.02 0.10 0.12 0.00 0.00 15 Dubeswari OC(H) RNJ 0.00 0.00 0.00 0.00 0.00 16 Khorabad PhIII/IV/V OC(H) MUG-
SAL 0.17 0.00 0.00 0.20 0.30
17 Sangramgarh OC(H) MUG-SAL
0.19 0.00 0.00 0.00 0.00
18 Dabor OC(H) MUG-SAL
0.00 0.00 0.02 0.14 0.20
19 Badjna ( khusria) OC(H) MUG-SAL
0.00 0.00 0.00 0.00 0.00
20 Khoodia OC(H) MUG-SAL
0.10 0.10 0.10 0.11 0.10
21 Kapasara OC(H) MUG-SAL
0.00 0.00 0.00 0.10 0.10
22 Chapapur 10 OC(H) MUG-SAL
0.00 0.00 0.00 0.00 0.00
23 Badjna patch II OC(H) MUG-SAL
0.00 0.00 0.00 0.00 0.00
24 Rajmahal s-W OC(H) RAJ 1.98 0.10 0.80 0.00 0.00 25 Rajmahal deepmining
Zone OC(H) RAJ 0.00 0.00 1.00 1.70 2.00
26 Simlong OC(H) RAJ 0.00 0.40 0.50 0.40 0.20 27 Hura C south-East OC(H) RAJ 0.00 0.00 0.00 0.20 0.85 28 Chuperbhita S-W OC(H) RAJ 0.00 0.00 0.00 0.00 0.00 29 Bhanora OC(H) RNJ 0.00 0.00 0.00 0.00 0.00 Total OC (H) 4.02 2.90 5.13 5.65 7.00 Sub-total (Existing ) OC(
D+H) 0.41 4.44 2.90 5.45 5.95 7.10
TOTAL (Existing) UG+OC 5.305 8.01 6.84 9.12 9.86 11.12

101
SCHEMEWISE PRODUCTION PLAN PROD - 2 Eastern Coalfields Ltd Figures in Mt
SL NO
GROUP TYPE OF
MINE
Capacity as assessed as on
1.4.09
Actual (08 - 09)
09-10 (BE)
09-10 (RE)
10-11 (BE)
11-12 (Proj)
A Existing Mines Completed Projects 1 Amrasota UG RNJ 0.118 0.07 0.07 0.08 0.08 0.08 2 Amritnagar UG RNJ 0.121 0.10 0.13 0.11 0.12 0.12 3 Bahula UG RNJ 0.341 0.24 0.25 0.24 0.26 0.27 4 Bankola UG RNJ 0.277 0.26 0.27 0.25 0.27 0.28 5 Bansra UG RNJ 0.349 0.23 0.13 0.24 0.25 0.25 6 Bhanora West UG RNJ 0.093 0.04 0.05 0.03 0.06 0.06 7 Central Kajora UG RNJ 0.106 0.08 0.08 0.09 0.11 0.11 8 Chapapur UG MS 0.133 0.07 0.06 0.07 0.07 0.07 9 Chinakuri I UG RNJ 0.084 0.02 0.03 0.03 0.03 0.03
10 Chinakuri III UG RNJ 0.086 0.09 0.09 0.09 0.11 0.12 11 Chora 10 UG RNJ 0.095 0.06 0.06 0.06 0.06 0.06 12 Chora Ph-I UG RNJ 0.063 0.03 0.05 0.04 0.06 0.07 13 Dhemomain UG RNJ 0.131 0.07 0.11 0.07 0.10 0.10 14 Dubeswari UG RNJ 0.078 0.08 0.1 0.08 0.12 0.12 15 Hariazam UG MS 0.066 0.05 0.04 0.05 0.06 0.07 16 Jhanjra UG RNJ 1.224 0.66 0.7 0.6 0.56 0.42 17 Kalidaspur UG RNJ 0.165 0.12 0.12 0.13 0.14 0.14 18 Khoodia UG MS 0.055 0.03 0.03 0.03 0.04 0.04 19 Khottadih UG RNJ 0.461 0.44 0.46 0.46 0.46 0.40 20 Kunustoria UG RNJ 0.211 0.17 0.23 0.17 0.2 0.2 21 Madhusudanpur7 Pit
& incline UG RNJ 0.132 0.11 0.13 0.1 0.13 0.13
22 Nakrakonda UG RNJ 0.078 0.06 0.1 0.06 0.08 0.08 23 Narsamuda UG RNJ 0.142 0.09 0.11 0.09 0.11 0.11 24 North Searsole UG RNJ 0.191 0.13 0.19 0.13 0.15 0.16 25 Parasea 6&7 UG RNJ 0.05 0.05 0 0.05 0.06 0.06 26 Patmohana / BC
Incline UG RNJ 0.075 0.07 0.08 0.08 0.1 0.10
27 Purushottampur/SouthSamla
UG RNJ 0.129 0.08 0.09 0.08 0.09 0.09
28 Ratibati UG RNJ 0.081 0.03 0.06 0.03 0.04 0.04 29 Satgram UG RNJ 0.217 0.12 0.2 0.13 0.13 0.14 30 Sodepur UG RNJ 0.067 0.05 0.06 0.06 0.06 0.06 Sub-total (Comp.
UG-31) UG 5.419 3.69 4.080 3.730 4.110 3.980
32 Barmuri OC MS 0.29 0.16 0 0.18 0.19 0.20 33 Bonjemehari OC MS 0 0.03 0 0 0.19 0.20 34 Chitra Ph-I OC MS 0.92 1.28 1.25 1.3 1.2 1.20 35 Chora/Sidhuli OC RNJ 0.23 0.13 0 0.13 0.00 0.00 36 Jambad OC RNJ 0.41 0.23 0.3 0.3 0.30 0.30 37 Khottadih OC RNJ 0.92 0.45 0.6 0.45 0.45 0.45 38 Mohanpur OC MS 0.61 0.39 0.5 0.5 0.41 0.41 39 Nirsha OC MS 0.00 0.00 0.00 0.00 0.10 40 Parasea/Belbaid OC RNJ 0.11 0.20 0 0.17 0.2 0.20 41 Rajmahal OC RAJ 7.25 8.69 9.50 10.00 10.00 10.50 42 Rajpura OC MS 0.2 0.10 0.00 0.10 0.05 0.00 43 Shankarpur
Extension/C.L. Jambad OC
OC RNJ 0.33 0.26 0.00 0.24 0.24 0.24
44 Sonepur Bazari OC RNJ 2.56 3.20 3.40 3.30 3.40 3.40 45 West Kenda OC RNJ 0.02 0.03 0.00 0.03 0.05 0.00

102
SCHEMEWISE PRODUCTION PLAN PROD - 2 Eastern Coalfields Ltd Figures in Mt
SL NO
GROUP TYPE OF
MINE
Capacity as assessed as on
1.4.09
Actual (08 - 09)
09-10 (BE)
09-10 (RE)
10-11 (BE)
11-12 (Proj)
A Existing Mines Sub-total (Comp.
OC-16) OC 13.85 15.14 15.55 16.70 16.68 17.20
TOTAL (Completed 47)
UG+OC 19.27 18.83 19.63 20.43 20.79 21.18
Ongoing Projects Sanc.Cap (Mty) 1 JK Nagar UG RNJ 0.44 0.21 0.300 0.24 0.27 0.27 2 Sarpi Aug UG RNJ 0.76 0.23 0.320 0.29 0.60 0.66 3 Siduli UG RNJ 0.30 0.00 0.00 0.00 0.00 0.00 4 Nabakajora UG RNJ 0.30 0.00 0.00 0.00 0.00 0.00 5 Jhanjra CM UG RNJ 0.44 0.57 0.440 0.45 0.48 0.50 6 Parasea Dobrana UG RNJ 0.16 0.00 0.00 0.00 0.00 0.03 7 Bankola VI Seam UG RNJ 0.24 0.00 0.00 0.00 0.00 0.02 8 Kumardihi B UG RNJ 0.42 0.00 0.05 0.00 0.00 0.05 9 Khandra NKJ UG RNJ 0.29 0.00 0.00 0.00 0.00 0.03
10 Shankarpur UG RNJ 0.24 0.12 0.120 0.12 0.13 0.14 11 Jhanjra L/W R-VI UG RNJ 1.70 0.00 0.000 0.00 0.00 0.20 12 Belbaid ( Dhasal) UG RNJ 0.36 0.00 0.00 0.00 0.00 0.00 13 Narainkuri UG RNJ 0.54 0.00 0.00 0.00 0.00 0.00 14 Jhanjra 2nd set CM UG RNJ 0.51 0.00 0.00 0.00 0.00 0.10 Sub-Total UG UG 5.29 1.12 1.23 1.10 1.48 2.00
15 Khottadih Augm OC RNJ 1( 0.55 Incr) 0.17 0.200 0.35 0.40 0.40 16 Rajmahal Expn OC RAJ 17.0 (6.50 Icr) 0.00 0.00 0.00 0.00 0.00 17 Chitra East OC MS 1.30 Inc 0.00 0.00 0.00 0.20 0.30 18 Mohanpur Expansion OC MS 1( 0.59 Incre) 0.00 0.000 0.00 0.27 0.30 Sub-Total OC 0.17 0.20 0.35 0.87 1.00 Sub-Total Ongoing UG 1.12 1.23 1.10 1.48 2.00 OC 0.17 0.20 0.35 0.87 1.00 TOTAL 1.29 1.43 1.45 2.35 3.00 New/Future Projects Sanc/Estimated.Cap
(Mty)
1 Rangamati A UG RNJ 0.36 0.00 0.00 0.00 0.00 0.00 2 Rangamati B UG RNJ 0.36 0.00 0.00 0.00 0.00 0.00 3 Tilaboni UG RNJ 1.0-2.0 0.00 0.00 0.00 0.00 0.00 4 Kunustoria (Dobrana) UG RNJ 0.54 0.00 0.00 0.00 0.00 0.00 5 Bansra CM UG RNJ 0.43 0.00 0.00 0.00 0.00 0.00 6 Haripur CM UG RNJ 0.51 0.00 0.00 0.00 0.00 0.00 7 Khottadih CM UG RNJ 0.51( incre) 0.00 0.00 0.00 0.00 0.00 Sub-Total UG UG 0.00 0.00 0.00 0.00 0.00 8 Sonepur (Comb) OC RNJ 8.0 (4.60 Icr) 0.00 1.00 0.00 0.00 0.00 9 Chuperbhita OC RAJ 4.0 0.00 0.75 0.00 0.00 0.70
10 Hura-C OC RAJ 3.0 0.00 1.00 0.00 0.00 0.00 11 Other OC ( Rajmahal
Expansion) OC 0.00 0.00 0.35 Rajmahal Expansion OC in
ongoing Project Sub-Total OC 0.00 3.10 0.00 0.00 0.70 Sub-total New
Projects UG 0.00 0.00 0.00 0.00 0.00
OC 0.00 3.10 0.00 0.00 0.70 Sub-Total 0.00 3.10 0.00 0.00 0.70 GRAND TOTAL UG 10.996 8.39 9.25 8.50 9.50 10.00 OC 17.58 19.74 21.75 22.50 23.50 26.00 TOTAL 28.576 28.13 31.00 31.00 33.00 36.00

103
SCHEMEWISE PRODUCTION PLAN Prod-2
BHARAT COKING COAL LIMITED Million Tonnes Group
No. Sl. No.
Name of Mine/Project Type of
Mine
Name of the Area
Type of
Coal
Latest CMPDI
Cap(mty) 1.04.09
Sanction Date
PR Cap 08-09 (Actual)
09-10 (Target)
09-10 (Ant)
Target 10-11
08-09 Revised
10-11 (Tar)
Target 11-12
Remarks - Conditions/Reasons for Variation/ Constraints envisaged in incremental production.
A1 Existing Mines 1 Akashkinaree UG GOVIND NC 0.115 0.106 0.150 0.140 0.090 0.125 0.130 0.150 Mechanisation proposed 2 Alkusa UG KUSTORE NC 0.184 0.092 0.090 0.090 0.000 0.105 0.090 0.090 To continue prodcution 3 Angarpathra(AARC) UG KATRAS NC 0.265 0.100 0.115 0.100 0.100 0.120 0.100 0.100 4 Balihari 5&6 pit UG PB C 0.064 0.000 0.000 0.000 0.000 0.020 0.000 0.000 5 Basdeopur UG SIJUA C 0.000 0.000 0.010 0.000 0.020 0.000 0.000 0.000 6 Basdeopur UG SIJUA NC 0.098 0.071 0.040 0.050 0.060 0.070 0.050 0.050 7 Bassuriya OC KUSUNDA NC 0.000 8 Bassuriya UG KUSUNDA NC 0.060 0.050 0.030 0.030 0.000 0.030 0.000 0.000 9 Bastacolla/Bera OC BASTA NC 0.600 0.170 0.100 0.100 0.000 0.100 0.000 0.000 10 Bastacolla UG BASTA NC 0.393 0.200 0.235 0.180 0.200 0.245 0.230 0.230 11 Bastacolla(Kuya/Dobari/
Ghanoo.) UG BASTA C 0.000 0.000 0.000 0.000 0.000 0.000 0.000
12 Bera UG BASTA NC 0.133 0.090 0.145 0.120 0.150 0.140 0.120 0.120 13 Bhagaband UG PB C 0.057 0.042 0.040 0.040 0.000 0.040 0.030 0.030 14 Bhatdih UG W/JHARIA C 0.000 0.000 0.000 0.000 0.080 0.000 0.000 0.000 15 Bhowrah North UG E/JHARIA C 0.090 0.047 0.065 0.065 0.000 0.060 0.050 0.050 16 Bhowrah South UG E/JHARIA C 0.161 0.024 0.090 0.090 0.100 0.085 0.080 0.080 Bhowrah South UG E/JHARIA NC 0.000 0.043 0.000 0.000 0.000 0.000 17 Dahibari UG C.VIC NC 0.000 0.000 0.000 0.000 0.000 0.000 0.000 0.000 18 Damoda UG BARORA NC 0.132 0.055 0.065 0.065 0.000 0.075 0.060 0.060 19 Dhansar UG KUSUNDA NC 0.138 0.100 0.125 0.100 0.300 0.110 0.100 0.100 20 Dobari UG BASTA NC 0.332 0.221 0.210 0.180 0.240 0.245 0.230 0.230 21 East Bassuriya OC KUSUNDA NC 0.000 0.000 0.000 0.000 0.000 0.000 0.000 0.000 22 East Bassuriya UG KUSUNDA NC 0.050 0.031 0.000 0.000 0.000 0.020 0.000 0.000 23 Ena OC KUSTORE C 0.190 0.113 0.030 0.030 0.000 0.090 0.100 0.100 24 Ghanoodih OC BASTA C 0.000 0.036 0.300 0.400 0.500 0.600 0.250 0.250 25 Ghanoodih UG BASTA NC 0.000 0.000 0.000 0.000 0.000 0.000 0.000 0.000 26 Godhur UG KUSUNDA NC 0.193 0.121 0.135 0.110 0.000 0.120 0.110 0.110 27 Gondudih UG KUSUNDA NC 0.000 0.000 0.000 0.000 0.000 0.000 0.000 0.000 28 Gopalichak UG PB C 0.000 0.012 0.000 0.000 0.000 0.050 0.030 0.030 29 Govindpur UG UG GOVIND NC 0.115 0.110 0.120 0.120 0.090 0.120 0.100 0.120 30 Jealgora UG LODNA C 0.000 0.000 0.000 0.000 0.000 0.000 0.000 0.000 31 Jeenagora UG LODNA NC 0.000 0.000 0.000 0.000 0.000 0.000 0.000 0.000 32 Jogidih/Govindpur UG GOVIND C 0.000 0.000 0.000 0.000 0.000 0.000 0.000 0.000 33 Jogidih UG GOVIND NC 0.101 0.087 0.100 0.100 0.210 0.105 0.100 0.110

104
Group No.
Sl. No.
Name of Mine/Project Type of
Mine
Name of the Area
Type of
Coal
Latest CMPDI
Cap(mty) 1.04.09
Sanction Date
PR Cap 08-09 (Actual)
09-10 (Target)
09-10 (Ant)
Target 10-11
08-09 Revised
10-11 (Tar)
Target 11-12
Remarks - Conditions/Reasons for Variation/ Constraints envisaged in incremental production.
34 Joyrampur OC LODNA C 0.000 0.000 0.000 0.000 0.000 0.000 0.000 0.000 35 Joyrampur UG LODNA NC 0.151 0.088 0.105 0.090 0.000 0.105 0.090 0.090 36 Kankanee UG SIJUA C 0.000 0.000 0.000 0.000 0.000 0.040 0.000 0.000 37 Keshalpur UG KATRAS NC 0.000 0.000 0.000 0.000 0.000 0.000 0.000 0.000 38 Kharkharee UG GOVIND C 0.073 0.058 0.065 0.065 0.090 0.090 0.080 0.080 39 Khas Kusunda OC KUSUNDA NC 0.460 0.000 0.000 0.000 0.000 0.000 0.000 0.000 40 Khas Kusunda UG KUSUNDA NC 0.000 0.000 0.000 0.000 0.000 0.000 0.000 0.000 41 Kooridih/Block-IV UG GOVIND NC 0.035 0.043 0.060 0.060 0.000 0.060 0.060 0.000 42 Kustore UG KUSTORE C 0.000 0.000 0.000 0.000 0.000 0.000 0.000 0.000 43 Kustore UG KUSTORE NC 0.000 0.000 0.000 0.000 0.000 0.000 0.000 0.000 44 Kusunda UG KUSUNDA NC 0.000 0.000 0.000 0.000 0.000 0.000 0.000 0.000 45 Kuya UG BASTA NC 0.135 0.072 0.075 0.070 0.070 0.080 0.070 0.070 46 Lohapatti UG W/JHARIA C 0.000 0.000 0.000 0.000 0.000 0.000 0.000 0.000 47 Lohapatti UG W/JHARIA NC 0.032 0.023 0.027 0.027 0.000 0.025 0.025 0.025 48 Mudidih UG SIJUA C 0.000 0.000 0.000 0.000 0.000 0.000 0.000 0.000 49 Mudidih UG SIJUA NC 0.092 0.099 0.105 0.100 0.000 0.100 0.100 0.100 50 Muraidih OC BARORA NC 1.428 1.708 1.512 1.663 1.800 1.568 1.736 1.960 51 Nichitpur OC SIJUA NC 1.020 0.684 0.500 0.455 0.000 0.600 0.450 0.450 52 Nichitpur UG SIJUA NC 0.000 0.000 0.000 0.000 0.000 0.000 0.000 0.000 53 North Tisra UG LODNA C 0.110 0.000 0.000 0.000 0.000 0.000 0.000 0.000 54 North Tisra UG LODNA NC 0.000 0.098 0.100 0.090 0.000 0.095 0.090 0.090 55 Patherdih UG E/JHARIA C 0.046 0.028 0.036 0.036 0.000 0.045 0.025 0.025 56 Phularitand OC BARORA C 0.000 0.000 0.000 0.000 0.000 0.000 0.000 57 Phularitand OC BARORA NC 0.000 0.000 0.000 0.000 0.000 0.000 0.000 58 Phularitand UG BARORA C 0.112 0.029 0.030 0.030 0.000 0.030 0.030 0.030 59 Pootkee UG PB C 0.000 0.000 0.000 0.000 0.000 0.000 0.000 0.000 60 Ramkanali OC KATRAS NC 0.000 0.000 0.000 0.000 0.000 0.000 0.000 0.000 61 Salanpur OC 0 NC 0.000 0.000 0.000 0.000 0.000 0.000 0.000 62 Ramkanali (AARC) UG KATRAS NC 0.000 0.101 0.115 0.100 0.100 0.120 0.100 0.120 63 Salanpur UG KATRAS NC 0.141 0.091 0.080 0.080 0.000 0.090 0.075 0.000 64 Sendra Bansjora UG SIJUA C 0.000 0.000 0.045 0.040 0.050 0.070 0.000 0.000 65 Sendra Bansjora UG SIJUA NC 0.161 0.179 0.165 0.160 0.300 0.130 0.160 0.160 66 South Govindpur UG GOVIND C 0.000 0.000 0.000 0.000 0.000 0.000 0.000 0.000 67 Tetulmari UG SIJUA NC 0.093 0.128 0.135 0.100 0.000 0.145 0.100 0.100 68 Victoria West UG C.VIC C 0.000 0.000 0.000 0.000 0.000 0.000 0.000 69 West Mudhidih UG KATRAS NC 0.234 0.147 0.175 0.150 0.150 0.185 0.140 0.140 UG 4.096 2.786 3.083 2.778 2.400 3.295 2.755 2.690 More prodcution for mechanisation &
continuance of prodcution in UG mines, some of the UG were earlier proposed for closure.
OC 3.698 2.711 2.442 2.648 2.300 2.958 2.536 2.760 Muraidih to be operated as Block-III by 11-12.

105
Group No.
Sl. No.
Name of Mine/Project Type of
Mine
Name of the Area
Type of
Coal
Latest CMPDI
Cap(mty) 1.04.09
Sanction Date
PR Cap 08-09 (Actual)
09-10 (Target)
09-10 (Ant)
Target 10-11
08-09 Revised
10-11 (Tar)
Target 11-12
Remarks - Conditions/Reasons for Variation/ Constraints envisaged in incremental production.
Total Existing Mines (A1) 7.794 5.497 5.525 5.426 4.700 6.253 5.291 5.450 A2. Hired HEMM 1 Bagdigi Patch OC LODNA C 0.175 0.200 0.200 0.180 0.250 0.000 0.000 2 Bararee/Lodna Patch(D-P Line) OC LODNA C 0.109 0.200 0.200 0.400 0.250 0.175 0.060 3 Basdeopur Patch OC SIJUA C 0.190 0.040 0.040 0.000 0.110 0.000 0.000 4 Basdeopur Patch OC SIJUA NC 0.000 0.000 0.000 0.000 0.000 0.000 0.000 5 Bhatdih Patch OC W/JHARIA C 0.000 0.000 0.000 0.000 0.000 0.000 0.000 6 Block-II/Nudkharkee OC BL-II NC 0.000 0.000 0.000 0.000 0.000 0.000 0.000 7 Chandore Patch II OC KATRAS NC 0.036 0.000 0.300 0.300 0.600 0.200 0.200 The patch will discontiue. 8 Crusher Patch Benedih/Block-II OC BL-II NC 0.887 0.000 0.400 0.200 0.650 0.750 0.500 The patch will discontiue. 9 Damoda Patch ND OC BARORA NC 0.027 0.000 0.000 0.000 0.000 0.000 0.050 10 East Bassuriya Patch OC KUSUNDA NC 0.000 0.000 0.000 0.000 0.000 0.000 0.000 11 Ghutway OC BARORA NC 0.000 0.000 0.000 0.000 0.000 0.000 0.000 12 Gondudih Patch OC KUSUNDA NC 0.207 0.800 0.778 0.300 0.100 0.560 0.630 The patch has been proposed for prodcution. 13 Ena Hired OC Kustore C 0.000 0.000 0.000 0.000 0.000 0.185 0.115 14 Rajapur Aug Hired OC Kustore NC 0.006 0.000 0.250 0.000 0.400 0.200 0.285 15 Bhagaband XVII Seam OC PB C 0.000 0.000 0.000 0.000 0.000 0.000 0.000 16 Gopalichuck XV Seam OC PB C 0.019 0.025 0.000 0.000 0.070 0.000 0.000 17 Kenduadih XI/XII Seam OC PB C 0.000 0.100 0.070 0.000 0.000 0.000 0.000 18 South Tisra Patch OC LODNA NC 0.000 0.000 0.000 0.000 0.000 0.000 0.000 19 Jogidih(Abandoned quarry) OC GOVIND C 0.000 0.000 0.000 0.000 0.000 0.000 0.000 20 Shiv Mandir Patch OC BL-II NC 0.000 0.000 0.000 0.000 0.000 0.000 0.000 21 Kalimandir Patch/Jamunia OC BL-II NC 0.873 0.000 0.350 0.300 0.650 0.450 0.450 22 Basantimata OC CV NC 0.000 0.000 0.000 0.000 0.000 0.200 0.200 23 Kusunda Patch B OC KUSUNDA NC 1.010 0.500 0.500 0.000 0.600 1.000 1.000 24 Khas Kusunda Patch C & D OC KUSUNDA C 0.000 0.000 0.000 0.000 0.000 0.000 0.000 25 Kumari Jore Patch OC KATRAS NC 0.000 0.000 0.000 0.000 0.000 0.000 0.000 26 Kuya Patch OC BASTACOLLA NC 0.000 0.000 0.000 0.000 0.000 0.000 0.000 27 Bastacolla OC BASTACOLLA NC 0.000 0.600 0.250 0.000 0.000 0.000 0.000 28 Kujama Patch OC BASTACOLLA C 0.000 0.000 0.000 0.000 0.000 0.300 0.300 29 GOCP OC BASTACOLLA NC 0.000 0.000 0.000 0.000 0.000 0.000 0.000 30 Jeenagora Patch OC LODNA NC 0.000 0.000 0.000 0.190 0.000 0.000 0.220 31 Maheshpur Patch OC GOVIND C 0.000 0.412 0.412 0.000 0.000 0.000 0.000 32 Mudidih Patch OC SIJUA C 0.057 0.000 0.000 0.000 0.000 0.000 0.000 33 Muraidih OC BARORA NC 0.000 0.000 0.000 0.000 0.000 0.200 0.200 34 Murulidih Patch OC W/JHARIA NC 0.000 0.000 0.000 0.000 0.000 0.000 0.000 35 Murulidih Patch OC W/JHARIA C 0.000 0.000 0.000 0.000 0.000 0.000 0.000 36 Shatabdi OC BARORA NC 0.631 0.700 0.700 0.000 0.700 0.430 0.380 37 Mandra Patch OC 0 C 0.000 0.100 0.000 0.000 0.000 0.050 0.050 38 Nath Khas OC BARORA NC 0.000 0.000 0.000 0.000 0.000 0.000 0.000 39 Kankanee OC SIJUA C 0.394 0.250 0.200 0.000 0.360 0.070 0.100 New patches identified.

106
Group No.
Sl. No.
Name of Mine/Project Type of
Mine
Name of the Area
Type of
Coal
Latest CMPDI
Cap(mty) 1.04.09
Sanction Date
PR Cap 08-09 (Actual)
09-10 (Target)
09-10 (Ant)
Target 10-11
08-09 Revised
10-11 (Tar)
Target 11-12
Remarks - Conditions/Reasons for Variation/ Constraints envisaged in incremental production.
40 Jogta OC SIJUA C 0.000 0.500 0.000 0.000 0.000 0.200 0.100 New patches identified. 41 Kankanee OC NC 0.300 0.350 0.330 0.400 42 Jogta OC NC 0.000 0.500 0.000 0.200 43 Sendra Bansjora Patch OC SIJUA C 0.000 0.000 0.000 0.000 0.000 0.100 0.100 44 Tetulmari Patch OC SIJUA NC 0.000 0.000 0.000 0.000 0.000 0.180 0.200 45 Salanpur Patch OC KATRAS NC 0.000 0.000 0.000 0.000 0.000 0.100 0.100 46 West Mudidih/Kanta pahari OC KATRAS NC 0.000 0.000 0.000 0.000 0.000 0.200 0.200 47 Gaslitand OC 0 C 0.000 0.000 0.210 0.300 48 Block-IV OC GOVIND C 0.000 0.000 0.000 0.000 0.260 0.000 0.000 49 Akashkinaree OC GOVIND NC 0.946 1.223 0.700 0.000 0.900 0.810 0.810 50 Mohulbani Patch OC EJ C 0.000 0.000 0.000 0.000 0.000 0.000 0.000 51 Bhowra (N) Patch OC EJ C 0.025 0.000 0.100 0.000 0.100 0.150 0.150 52 Bhowra (S) Patch OC EJ C 0.000 0.000 0.050 0.000 0.000 0.000 0.000 53 New Akash kinaree Patch
B/Block-IV OC GOVIND NC 0.031 0.000 0.000 0.000 0.000 0.200 0.200
UG 0.000 0.000 0.000 0.000 0.000 0.000 0.000 0.000 OC 0.000 5.623 5.950 6.350 1.870 6.000 7.250 7.500 For identification of few new patches and
continuance of earlier patches. Total (A2) 0.000 5.623 5.950 6.350 1.870 6.000 7.250 7.500 UG 4.096 2.786 3.083 2.778 2.400 3.295 2.755 2.690 OC 3.698 8.334 8.392 8.998 4.170 8.958 9.786 10.260 Total Existing Mines (A1+A2) 7.794 11.120 11.475 11.776 6.570 12.253 12.541 12.950 B. Completed Projects 1 Akashkinaree OCP (0.47) OC GOVIND NC 0.000 June-92 0.470 0.000 0.000 0.000 0.000 0.000 0.000 0.000 2 Begunia UG C.VIC C 0.077 0.180 0.033 0.000 0.000 0.080 0.040 0.030 0.000 3 Bhalgora (0.700) /Simlabahal
/Burragarh /Hurriladih UG KUSTORE C 0.334 Oct-80 0.700 0.183 0.210 0.180 0.000 0.235 0.235 0.200 Earlier the mine was proposed for closure.
4 Bhalgora (0.700) /Simlabahal /Burragarh /Hurriladih
UG KUSTORE NC 0.010 0.030 0.020 0.000 0.030 0.030 0.030 Earlier the mine was proposed for closure.
5 Bhowrah North COCP(Chandan) OC E/JHARIA NC 0.280 0.120 0.000 0.000 0.000 0.000 0.000 0.000 6 Bhowrah OCP (0.36) /3 Pit OC E/JHARIA C 0.040 0.360 0.000 0.000 0.000 0.000 0.000 0.000 0.000 7 Block II OCP Mine (N Coking) OC BL-II NC 0.710 1.157 2.000 1.800 2.700 1.750 1.900 1.900 The mine is proposed to be operated as expansion
project Block-II and taken in XIth plan projects. 8 Block II OCP(Coking) (2.50) OC BL-II C 0.000 2.500 0.100 0.150 0.100 0.400 0.000 0.200 0.200 Block-II coking could not be started till dated
hence prodcution accordingly shifted. 9 Block IV OCP(C)(0.50) OC GOVIND C 1.450 0.500 0.688 0.000 0.600 0.000 0.000 0.600 0.600 10 Block IV OCP(NC) (0.75) OC GOVIND NC 0.000 0.750 0.200 1.100 0.300 1.300 1.100 0.400 0.400 Now proposed to be taken in XI plan projects. Jogidih OCP OC GOVIND NC 0.000 0.000 0.000 0.000 0.000 0.000 0.000 11 BlockIIOCP(NC)Benedih (0.90) OC BL-II NC 0.900 0.000 0.000 0.000 0.000 0.000 0.000 0.000 12 BlockIIOCP(NC)Nudkrkee
(0.80) OC BL-II NC 0.800 0.000 0.000 0.000 0.000 0.000 0.000 0.000

107
Group No.
Sl. No.
Name of Mine/Project Type of
Mine
Name of the Area
Type of
Coal
Latest CMPDI
Cap(mty) 1.04.09
Sanction Date
PR Cap 08-09 (Actual)
09-10 (Target)
09-10 (Ant)
Target 10-11
08-09 Revised
10-11 (Tar)
Target 11-12
Remarks - Conditions/Reasons for Variation/ Constraints envisaged in incremental production.
13 Damagoria OC/Borea (0.60) OC C.VIC NC 0.480 0.420 0.096 0.100 0.100 0.100 0.100 0.000 0.000 14 Damoda OCP/Albion
Expn.OCP(0.66) OC BARORA NC 0.210 June-92 0.660 0.269 0.200 0.110 0.500 0.200 0.200 0.100 The mine be operated in Damoda BJ ongoing
project. 15 Damodar/Chandan (0.30) OC E/JHARIA C 0.000 0.300 0.000 0.000 0.000 0.000 0.000 0.000 0.000 16 Damodar/Chandan/Pathardih OC E/JHARIA NC 0.260 0.218 0.300 0.200 0.000 0.250 0.300 0.300 The mine is proposed to continue prodcution. 17 East Bhaggatdih 9/10 pits UG KUSTORE NC 0.000 0.000 0.000 0.000 0.000 0.000 0.000 0.000 18 East Bhaggatdih 9/10 pits (0.21) UG KUSTORE C 0.210 0.000 0.000 0.000 0.000 0.000 0.000 0.000 19 Ganga OCP(0.36)/ Gondudih OC KUSUNDA NC 0.000 0.360 0.000 0.000 0.000 0.000 0.000 0.000 0.000 20 Ghanudih Expn.OCP (0.56) OC BASTA NC 1.010 0.560 0.668 0.800 0.300 0.950 0.000 1.200 1.200 The project is facing land problems. 21 Godhur OCP OC KUSUNDA NC 0.000 0.000 0.000 0.200 0.000 0.000 0.000 The mine is closed. 22 Godhur OCP (0.21) OC KUSUNDA C 0.000 0.210 0.014 0.000 0.000 0.030 0.000 0.000 0.000 The mine is closed. 23 Goluckdih OC BASTA C 0.000 0.000 0.000 0.000 0.000 0.000 0.000 24 Goluckdih (0.72) / Kuya OC BASTA NC 0.640 0.720 0.594 0.600 0.600 0.000 0.600 0.600 0.300 The mine proposed to continue prodcution form
Kuya sector. 25 Gondudih OC KUSUNDA NC 0.000 0.168 0.000 0.000 0.000 0.000 0.000 0.000 26 Jamunia OCP (0.27) OC BL-II NC 0.520 0.270 0.308 0.700 0.700 0.700 0.700 0.000 0.000 27 Jeenagora Patch (0.31) OC LODNA NC 0.290 0.310 0.352 0.400 0.400 0.400 0.380 0.350 0.350 28 Katras (0.9) Proj./E.K.C. UG KATRAS C 0.000 0.000 0.000 0.000 0.000 0.000 0.000 29 Katras (East Katras) UG KATRAS NC 0.000 0.900 0.000 0.000 0.000 0.120 0.000 0.000 0.000 East Katras has been closed. 30 Katras Choitudih UG KATRAS C 0.148 0.060 0.040 0.040 0.000 0.085 0.030 0.030 31 Keshalpur 2nd Expn OCP
(1.00)/West Mudidih OC KATRAS NC 1.680 1.000 1.614 1.500 1.740 1.500 1.450 1.800 1.800
32 Kusunda OCP OC KUSUNDA C 0.150 1.000 0.179 0.300 0.230 0.500 0.350 0.000 0.000 33 Kusunda OCP/Dhansar OC KUSUNDA NC 0.510 0.237 0.200 0.170 0.000 0.280 0.000 0.000 34 Lodna Aug. (0.240) UG LODNA C 0.101 0.240 0.072 0.100 0.070 0.000 0.110 0.070 0.080 35 Loyabad Augmentation (0.150) UG SIJUA C 0.061 0.150 0.056 0.040 0.040 0.000 0.060 0.000 0.000 36 Madhuband Sector A (0.21) UG BARORA C 0.063 0.210 0.026 0.025 0.025 0.040 0.035 0.030 0.030 Earlier the mine was proposed for closure. 37 Mech Ldg. Basantimata(0.130) UG C.VIC NC 0.226 0.135 0.175 0.150 0.180 0.180 0.130 0.130 38 Mech. Extrn.& Dev/Dep. IX
Seam Maheshpur(0.14) UG GOVIND NC 0.066 0.140 0.059 0.000 0.000 0.000 0.060 0.000 0.000
39 Moonidih (1.50) UG W/JHARIA C 0.252 1.500 0.174 0.252 0.152 0.860 0.205 0.400 0.750 PSLW revised prod. shedule as per Global Tender. 40 Muraidih Expn.OCP OC BARORA NC 1.122 Dec-94 0.960 1.347 1.188 1.307 1.330 1.232 1.364 1.540 The Mine has been taken in Xith plan project. 41 Murulidih 20/21 Patch OC W/JHARIA C 0.000 0.000 0.000 0.000 0.000 0.000 0.000 42 Murulidih 20/21 RPR (0.24) UG W/JHARIA C 0.145 0.240 0.110 0.176 0.176 0.240 0.115 0.110 0.110 Delay in implementation of mechanisation scheme 43 N.L.O.C.P. / K.C.OCP (0.36) OC C.VIC NC/C 0.000 0.360 0.000 0.000 0.000 0.000 0.000 0.000 0.000 44 N.TISRA (NC) OCP (0.70) OC LODNA NC 1.860 0.700 1.101 1.700 1.500 0.600 1.200 1.600 1.600 The Mine has been amalgamated and taken in XIth
plan project also. 45 North Amlabad (0.57) UG E/JHARIA C 0.049 0.570 0.000 0.000 0.000 0.000 0.000 0.000 0.000 46 Rajapur Augmntn (0.42) /ROCP OC KUSTORE NC 1.270 0.420 0.972 0.770 0.745 0.600 0.765 0.850 0.850 47 Rajapur Augmntn (0.42) /South
Jharia OC KUSTORE C 0.000 0.000 0.000 0.000 0.000 0.000 0.000 0.000

108
Group No.
Sl. No.
Name of Mine/Project Type of
Mine
Name of the Area
Type of
Coal
Latest CMPDI
Cap(mty) 1.04.09
Sanction Date
PR Cap 08-09 (Actual)
09-10 (Target)
09-10 (Ant)
Target 10-11
08-09 Revised
10-11 (Tar)
Target 11-12
Remarks - Conditions/Reasons for Variation/ Constraints envisaged in incremental production.
48 Sendra Bansjora Aug(0.60) OC SIJUA NC 0.790 0.270 0.298 0.300 0.250 0.620 0.285 0.300 0.300 The mine has land problem - prodcution reduced. 49 Shatabdi OC(0.80) OC BARORA NC 1.040 Dec-02 0.800 0.635 0.900 0.900 0.800 1.000 0.800 0.800 50 South Tisra Expn.(0.43) OC LODNA NC 0.000 1.230 0.000 0.000 0.000 0.600 0.000 0.000 0.000 Have been taken in Amalgamted OC North Tisra. 51 Sudamdih (0.60) UG E/JHARIA C 0.220 0.600 0.097 0.084 0.084 0.000 0.135 0.090 0.090 52 Sulunga-Jeenagora OCP(0.7) OC LODNA NC 0.000 Sept-97 0.700 0.000 0.000 0.000 0.000 0.000 0.000 0.000 53 Tetulmari Augmentation(0.70) OC SIJUA NC 0.620 0.480 0.469 0.500 0.500 0.600 0.600 0.500 0.500 The mine has land problems and limits the area. UG 1.742 1.015 1.132 0.937 1.520 1.290 1.155 1.450 OC 14.932 11.803 13.708 12.552 14.430 12.242 12.964 12.740 The various mine have been considered in XIth
Plan projects under expansion PR. Total(B) 16.674 12.818 14.840 13.489 15.950 13.532 14.119 14.190 C. Ongoing Projects As on 31.3.08 1 Bagdigi Augmentatn. (0.270) UG LODNA C 0.073 0.270 0.048 0.050 0.050 0.000 0.070 0.050 0.060 The mine was earlier proposed for closure. 2 Bararee IX & X Seam RPR(0.24) UG LODNA C 0.098 0.240 0.053 0.045 0.045 0.000 0.050 0.050 0.060 3 Bhagaband (Aug)/Bhutgoria UG PB C Feb-98 0.270 0.000 0.000 0.000 0.000 0.000 0.000 0.000 4 Bhowrah XVIIseam Incl. (0.12) UG E/JHARIA C 0.120 0.000 0.000 0.000 0.000 0.000 0.000 0.000 5 Block III OCP(Coking)(0.45) OC BARORA C 0.450 0.000 0.000 0.000 0.000 0.000 0.000 0.000 6 Chaptoria OCP(0.55) OC CV C Aug-03 0.550 0.000 0.000 0.000 0.350 0.000 0.000 0.000 Getting delayed due to land acquisition problems. 7 Dahibari-Basantimata Project(1.30) OC C.V. NC 1.410 Oct-03 1.300 1.244 1.300 1.400 1.300 1.300 1.300 1.300 Increm. prodcution envisged after compl. report. 8 Damoda BJ Section OCP(0.60) OC BARORA C Aug-03 0.600 0.000 0.000 0.000 0.400 1.400 0.000 0.200 Delayed due to R&R and land problems and production resheduled. 9 Goluckdih (NC) OCP(1.20) OC BASTACOLLA NC Aug-03 1.200 0.000 0.000 0.500 0.000 0.000 0.300 Delayed due to land problems and production resheduled. 10 Kuya Phase-I UG BASTACOLLA C Sept-02 0.290 0.000 0.000 0.000 0.000 0.000 0.000 0.000 11 Pootkee Balihari
RPR(0.68)+Turn key project UG PB C 0.370 Apr-03 0.680 0.232 0.240 0.240 0.480 0.295 0.240 0.240 Foreclosed at 0.24 mtpa augmentation by Global
tendering is envisages. 12 Viswakarma OCP(0.7) OC KUSUNDA NC Sep-97 0.700 0.000 0.050 0.500 0.350 0.000 0.700 0.700 Delayed due to land & R&R problems. UG 0.541 0.333 0.335 0.335 0.480 0.415 0.340 0.360 Loss in prods. for fore closure of PB project OC 1.410 1.244 1.350 1.900 2.900 2.700 2.000 2.500 Loss in prods. Rescheduled prod for land and other
issues. Total (C) 1.951 1.577 1.685 2.235 3.380 3.115 2.340 2.860 D. Future Projects (To be formulated) Xth Plan Projects 2 Exploitation of seam I/II by
Continuous Miner Technology at Block-II
UG BL-II NC Sept'09 0.45 0.000 0.000 0.000 0.350 0.000 0.000 0.000 Delayed for approval due to un-economic and being proposed at cost plus basis.
3 Exploitation of seam IV by Continuous Miner Technology at Dhansar UG
UG KUSUNDA NC NA 1 0.000 0.000 0.000 0.000 0.000 0.000 0.000 The final PR could not be processed for approval due to poor IRR.
UG 0.000 0.000 0.000 0.000 0.350 0.000 0.000 0.000 OC 0.000 0.000 0.000 0.000 0.000 0.000 0.000 0.000 Total (D) 0.000 0.000 0.000 0.000 0.350 0.000 0.000 0.000

109
Group No.
Sl. No.
Name of Mine/Project Type of
Mine
Name of the Area
Type of
Coal
Latest CMPDI
Cap(mty) 1.04.09
Sanction Date
PR Cap 08-09 (Actual)
09-10 (Target)
09-10 (Ant)
Target 10-11
08-09 Revised
10-11 (Tar)
Target 11-12
Remarks - Conditions/Reasons for Variation/ Constraints envisaged in incremental production.
E. XIth Plan Projects 1 Block-IV OCP OC GOVIND NC NA 4.000 0.000 0.000 0.000 0.300 0.000 0.000 0.000 The incremntal production due to expansion PR
and to be adjusted against existing and Completed projects.
2 Amalgamated Kharkharee Dharmaband Exten. Block
UG GOVIND C NA 0.270 0.000 0.000 0.000 0.000 0.000 0.000 0.000
3 Moonidih XV Seam UG WJ C NA 1.500 0.000 0.000 0.000 0.000 0.000 0.000 0.000 The project will be taken in XII plan period. 4 Kapuria UG UG WJ C NA 2.000 0.000 0.000 0.000 0.000 0.000 0.000 0.000 The project be taken by Global tendering basis. 5 Block-III OCP including SOCP
& MOCP OC BARORA NC NA 6.000 0.000 0.000 0.000 0.500 0.000 0.000 0.000
6 Muraidih& Shatabdi Turnkey UG UG NC NA 2.000 7 Madhuband Turn key UG UG BARORA C NA 1.000 0.000 0.000 0.000 0.000 0.000 0.000 0.000 The Block-III OC will be in operation and
prodcution from Muraidih has been considered here also.
8 South Tisra/North Tisra Aug. NC OC(2.00)
OC LODNA NC NA 6.000 0.000 0.000 0.000 0.950 0.000 0.000 0.000
9 Lodna CM UG project UG NC NA 1 10 Rajapur CM UG UG NC NA 0.5 11 Simlabahal Aug UG C NA 0.5 12 Ena OC Expn OC C NA 2 13 Ena UG UG C NA 0.5 14 Goluckdih CM UG UG NC NA 0.6 15 Amlabad Turnkey UG UG C NA 0.5 16 Sudamdih Incline Aug UG C NA 0.5 17 Sudamdih Shaft dip side Extn UG C NA 0.5 18 Opencast Block II OCP Aug. OC BL-II C NA 1.000 19 Opencast Block II OCP Aug. OC BL-II NC NA 4.000 0.000 0.000 0.000 0.000 0.000 0.000 0.000 The Expansion PR of Block-II will continue. Total (E) 0.000 0.000 0.000 0.000 1.750 0.000 0.000 0.000 UG 6.379 4.134 4.550 4.050 4.750 5.000 4.250 4.500 OC 20.040 21.381 23.450 23.450 23.250 23.900 24.750 25.500 Total (BCCL) 26.419 25.514 28.000 27.500 28.000 28.900 29.000 30.000

110
Scheme-wise Coal Production Plan
Subsidiary: Central Coalfields Ltd In MtCoal Capacity as on 1.4.2009 (MTY) as
per CMPDI
ACTUAL BE RE BE Proj. Sl No
Name of the Project / Mine
Type of Coal
Cok / NC
Specific ROM Grade
Total Depart mental
2008-09 2009-10 2010-11 2011-12
Existing Mines 1 Dhori Khas OC (Pichri) 2 Karo-I OC COK/NC E/WIII/WIV 3 Selected Dhori (Man.) COK/NC F/WII/IV 0.4000 0.00 1.4865 1.60 1.60 1.60 1.60 4 Tarmi (Outsourcing) 5 Topa OC 6 Argada UG NC C 0.098 0.098 0.056 0.09 0.06 0.06 0.06 7 Bhurkunda UG NC B/C 0.199 0.199 0.121 0.17 0.16 0.16 0.16 8 Dhori Khas UG COK WII/IV 0.113 0.113 0.064 0.06 0.07 0.07 0.07 9 Jarangdih UG COK WII/IV 0.081 0.081 0.084 0.10 0.10 0.10 0.10 10 Karo UG COK WIV 11 Khasmahal UG COK WIII/IV 12 N.S.Dhori UG COK WIII 0.055 0.055 0.052 0.06 13 Sarubera UG COK WIV 0.148 0.148 0.063 0.09 0.07 0.07 0.07 14 Saunda UG NC B/C 0.000 15 Sawang UG COK WII/IV 0.087 0.087 0.108 0.12 0.10 0.11 0.11 16 Sayal D UG NC C/D 0.159 0.159 0.152 0.17 0.15 0.16 0.16 17 Sirka UG NC B 0.044 0.044 0.031 0.035 0.03 0.07 0.07 18 Topa UG COK WIII/IV 0.072 0.072 0.050 0.105 0.06 0.07 0.07 Total UG 1.056 1.056 0.78 0.93 0.83 0.85 0.86 Total OC 0.400 0.000 1.49 1.60 1.60 1.60 1.60 Total Existing Mines 1.456 1.056 2.268 2.530 2.434 2.446 2.460 Completed Projects 1 Dakra OC NC E 0.630 0.630 0.452 0.500 0.460 0.460 0.500 2 Dhori East OC RO COK/NC F/WIII/IV 0.560 0.560 0.330 0.500 0.300 0.450 0.450 3 Giddi-A OC NC C 0.260 0.260 0.413 0.400 0.420 0.420 0.450 4 Jarangdih OC RO COK WIV 0.580 0.580 0.489 0.800 0.500 0.500 0.500 5 Jharkhand OC COK WIV 1.250 1.250 0.921 0.850 0.950 0.950 1.000 6 Kabribad OC NC E 0.630 0.630 0.626 0.600 0.630 0.630 0.630 7 Karkatta OC NC E 0.740 0.290 1.135 0.800 1.150 1.200 1.200 8 Kathara Int OC RO COK WIV 0.790 0.790 0.469 0.900 0.705 0.750 0.750 9 KD Hesalong OC NC E 4.230 3.230 3.137 3.700 3.200 3.500 3.500 10 Kedla OC COK WIV 0.590 0.590 0.458 0.430 0.460 0.460 11 Khasmahal OC COK/NC E/WIV 0.660 0.660 0.700 0.600 0.700 0.700 0.700 12 New Giddi C OC NC C 0.430 0.430 0.446 0.400 0.450 0.450 0.450 13 New Sawang OC COK WIV 0.400 0.400 0.545 14 Parej East OC COK/NC E/WIV 1.050 1.050 1.358 1.600 1.500 1.550 1.600 15 Phusro / Kargali OC COK WIII 0.200 0.200 0.231 0.150 0.250 0.250 0.250 16 Pundi OC RO COK WIII/IV 0.690 0.690 0.427 0.725 0.500 0.600 0.600 17 Rajhara NW OC NC D 0.120 0.120 0.119 0.050 0.140 0.140 0.140 18 Rajrappa OC COK WIII 1.480 1.480 1.001 1.250 1.100 1.100 1.300 19 Religera OC NC C 0.510 0.510 0.265 0.250 0.250 0.270 0.270 20 Sangam OC NC B/C 0.180 0.180 0.158 0.300 0.160 0.210 0.210 21 Sel Dhori OC / Kalyani RO COK WIII/IV 1.680 1.680 1.465 1.600 1.700 1.700 1.700 22 Sirka OC NC C 0.200 0.200 0.212 0.175 0.230 0.230 0.230 23 Govindpur UG COK WIII/IV 0.093 0.093 0.083 0.110 0.095 0.100 0.100 24 Karo Sp.(KSP-II)UG COK WIV 0.047 0.047 0.026 0.030 0.026 0.026 0.030 25 Kedla UG COK WIII/IV 0.226 0.226 0.160 0.190 0.150 0.170 0.170 26 Ray Bachra UG NC B 0.107 0.107 0.101 0.080 0.060 27 Saunda-D UG NC B/C/D 0.153 0.153 0.088 0.130 0.080 0.095 0.100 Total UG 0.626 0.626 0.458 0.540 0.411 0.391 0.400 Total OC 17.860 16.410 15.356 16.580 15.755 16.520 16.430 Total Completed Projects 18.486 17.036 15.813 17.120 16.166 16.911 16.830 Ongoing Projects 1 Amlo OC COK/NC E/WIII/IV 1.810 0.910 2.813 2.000 3.000 3.000 3.000 2 Ara RO OC COK WIV 0.050 0.050 0.019 0.250 0.025 0.100 0.200 3 Ashok Expn. OC NC E 4.500 7.103 9.000 8.000 8.750 9.400 4 Bokaro (Bermo Seam) OC COK WII/WIV 0.400 0.400 0.172 0.170 0.175 0.175 0.175 5 Chainpur OC COK WIV 0.120 0.120 0.037 0.025 0.050 0.100 6 Karma OC NC C 0.250 0.250 0.195 0.300 0.200 0.300 0.400 7 Karo OC COK/NC E/WIII/IV 1.950 1.550 0.766 1.100 0.600 1.000 1.195 8 Konar OC NC E 0.300 9 Magadh OC 10 N Urimari OC 0.270 0.270 0.352 0.500 0.300 0.500 0.750 11 Piparwar OC NC E/F 12.360 8.860 9.005 10.000 9.500 9.750 10.00012 Purnadih OC 0.200 0.600 0.850
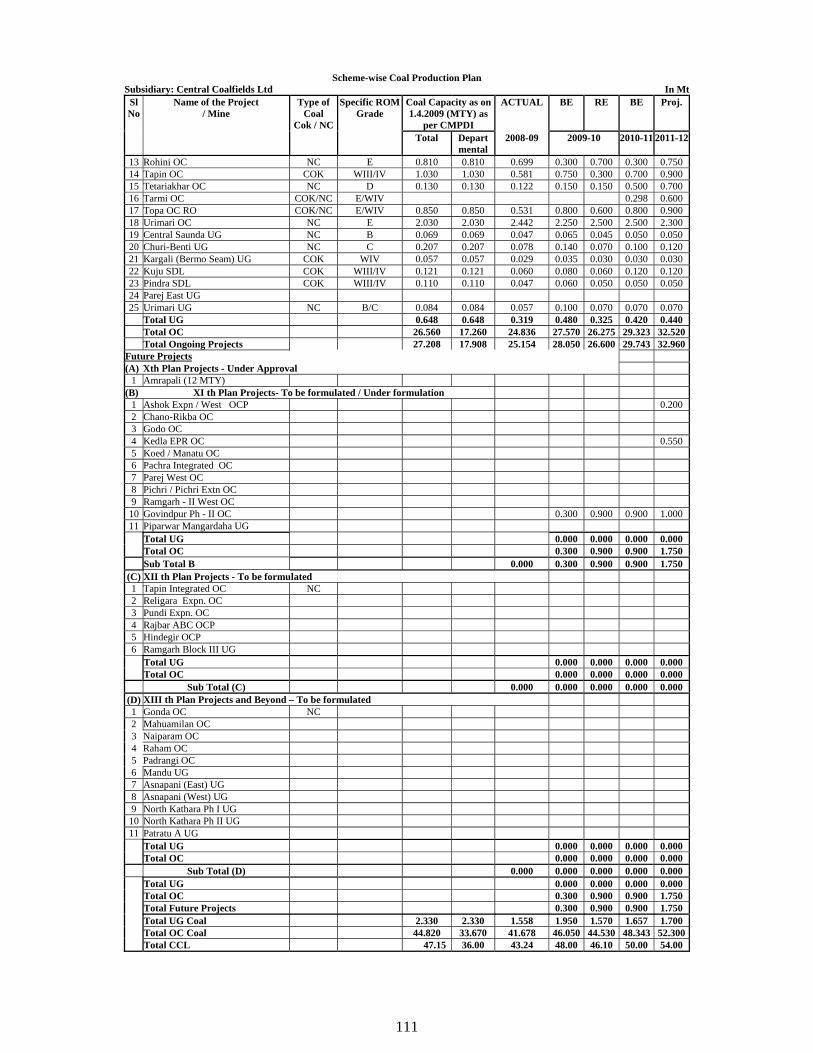
111
Scheme-wise Coal Production Plan Subsidiary: Central Coalfields Ltd In Mt
Coal Capacity as on 1.4.2009 (MTY) as
per CMPDI
ACTUAL BE RE BE Proj. Sl No
Name of the Project / Mine
Type of Coal
Cok / NC
Specific ROM Grade
Total Depart mental
2008-09 2009-10 2010-11 2011-12
13 Rohini OC NC E 0.810 0.810 0.699 0.300 0.700 0.300 0.750 14 Tapin OC COK WIII/IV 1.030 1.030 0.581 0.750 0.300 0.700 0.900 15 Tetariakhar OC NC D 0.130 0.130 0.122 0.150 0.150 0.500 0.700 16 Tarmi OC COK/NC E/WIV 0.298 0.600 17 Topa OC RO COK/NC E/WIV 0.850 0.850 0.531 0.800 0.600 0.800 0.900 18 Urimari OC NC E 2.030 2.030 2.442 2.250 2.500 2.500 2.300 19 Central Saunda UG NC B 0.069 0.069 0.047 0.065 0.045 0.050 0.050 20 Churi-Benti UG NC C 0.207 0.207 0.078 0.140 0.070 0.100 0.120 21 Kargali (Bermo Seam) UG COK WIV 0.057 0.057 0.029 0.035 0.030 0.030 0.030 22 Kuju SDL COK WIII/IV 0.121 0.121 0.060 0.080 0.060 0.120 0.120 23 Pindra SDL COK WIII/IV 0.110 0.110 0.047 0.060 0.050 0.050 0.050 24 Parej East UG 25 Urimari UG NC B/C 0.084 0.084 0.057 0.100 0.070 0.070 0.070 Total UG 0.648 0.648 0.319 0.480 0.325 0.420 0.440 Total OC 26.560 17.260 24.836 27.570 26.275 29.323 32.520 Total Ongoing Projects 27.208 17.908 25.154 28.050 26.600 29.743 32.960
Future Projects (A) Xth Plan Projects - Under Approval
1 Amrapali (12 MTY) (B) XI th Plan Projects- To be formulated / Under formulation
1 Ashok Expn / West OCP 0.200 2 Chano-Rikba OC 3 Godo OC 4 Kedla EPR OC 0.550 5 Koed / Manatu OC 6 Pachra Integrated OC 7 Parej West OC 8 Pichri / Pichri Extn OC 9 Ramgarh - II West OC 10 Govindpur Ph - II OC 0.300 0.900 0.900 1.000 11 Piparwar Mangardaha UG Total UG 0.000 0.000 0.000 0.000 Total OC 0.300 0.900 0.900 1.750 Sub Total B 0.000 0.300 0.900 0.900 1.750
(C) XII th Plan Projects - To be formulated 1 Tapin Integrated OC NC 2 Religara Expn. OC 3 Pundi Expn. OC 4 Rajbar ABC OCP 5 Hindegir OCP 6 Ramgarh Block III UG Total UG 0.000 0.000 0.000 0.000 Total OC 0.000 0.000 0.000 0.000 Sub Total (C) 0.000 0.000 0.000 0.000 0.000
(D) XIII th Plan Projects and Beyond – To be formulated 1 Gonda OC NC 2 Mahuamilan OC 3 Naiparam OC 4 Raham OC 5 Padrangi OC 6 Mandu UG 7 Asnapani (East) UG 8 Asnapani (West) UG 9 North Kathara Ph I UG 10 North Kathara Ph II UG 11 Patratu A UG Total UG 0.000 0.000 0.000 0.000 Total OC 0.000 0.000 0.000 0.000 Sub Total (D) 0.000 0.000 0.000 0.000 0.000 Total UG 0.000 0.000 0.000 0.000 Total OC 0.300 0.900 0.900 1.750 Total Future Projects 0.300 0.900 0.900 1.750 Total UG Coal 2.330 2.330 1.558 1.950 1.570 1.657 1.700 Total OC Coal 44.820 33.670 41.678 46.050 44.530 48.343 52.300 Total CCL 47.15 36.00 43.24 48.00 46.10 50.00 54.00

112
NORTHERN COALFIELDS LIMITED
ANNUAL PLAN 2010-11 SCHEMEWISE COAL PRODUCTION PLAN
Million TonnesSl. Name of the Type of Type Period Type Specific 08-09 09-10 09-10 10-11 11-12 Coal State Specific No. Project/Mine Project of of of ROM Sanction Actual Target RE/Ant. Target Proj. Field Code Consumer
New/ Mine App. Coal Grade cap. (MT) Code Code/ Reorg. UG/OC Cok/NC Linkage A. EXISTING MINES 1 Jhingurda New OC NC E/F 3.00 3.86 4.00 4.00 3.00 2.00 SGR MP POW(C) TOTAL (A) 3.86 4.00 4.00 3.00 2.00
B. COMPLETED PROJECTS 1 Jayant New OC NC C/D/E 10.00 13.02 12.75 12.75 14.00 10.00 SGR MP POW (U) 2 Kakri New OC NC E 3.00 2.93 3.00 3.00 3.00 3.00 SGR UP POW (U) 3 Khadia New OC NC C/D 4.00 3.68 4.00 4.00 4.00 4.00 SGR MP&UP POW (U) TOTAL (B) 19.62 19.75 19.75 21.00 17.00
C. ON GOING PROJECTS 1 Amlohri Expn.(10.0) New OC X NC C/D/E 10.00 5.28 5.50 5.50 6.00 8.50 SGR MP 2 Bina Extn.(6.0) New OC X NC E 6.00 5.44 5.50 5.50 6.00 6.00 SGR UP/MP 3 Block-B(3.5) New OC X NC C/D/F 3.50 3.43 3.00 3.00 4.00 3.50 SGR MP 4 Krishnasila(4.0) New OC X NC D 4.00 1.08 3.00 3.00 4.00 4.00 SGR UP POW (U/C)5 Dudhichua Expn.(15.0) New OC XI NC C-E 15.00 13.27 12.75 12.75 14.00 14.00 SGR MP POW (U) 6 Nigahi Expn.(15.0) New OC XI NC C/D/E 15.00 11.66 13.00 13.00 14.00 15.00 SGR MP TOTAL (C) 40.16 42.75 42.75 48.00 51.00
D. FUTURE PROJECTS-Xth PLAN D1. Awaiting approval NIL D2. To be formulated NIL D3. Sc. for maintenance of coal production NIL
TOTAL (D) 0.00 0.00 0.00 0.00 0.00 E. ADVANCE ACTION PROJECTS a) ONGOING NIL b) FORMULATED BUT NOT YET APPROVED FUTURE PROJECT-XI th PLAN 1 Khadia Expn.(6.0) New OC X NC D 6.00 0.00 2.00 SGR UP/MP POW(U) 2 Jayant Expn.(5.0) New OC XI NC C/D/E 5.00 4.00 SGR MP POW(U) 3 Kakri Extn New OC XI NC E 3.00 SGR UP/MP POW(U/C) TOTAL (E) 0.00 0.00 0.00 0.00 6.00 GRAND TOTAL 63.65 66.50 66.50 72.00 76.00

113
SCHEMEWISE COAL PRODUCTION PLAN Prod 2
COMPANY: WESTERN COALFIELDS LIMITED In Mt Period of Group Type of Approval Type of Specific Latest Sanction No. Sl. Name of the Project/ Mine or to be Coal ROM Capacity Date Actual 09-10 09-10 10-11
No Mine UG/OC taken up Cok/NC Grade (Mty) 2008-09 B.E./Tar. RE/ Antic B.E./Tar. A. EXISTING MINE EXISTING MINE(EXISTING AT THE TIME OF NATIONALISATION) 1 Ambara UG NC D 0.105 0.107 0.150 0.110 0.110 2 Chanda Rayatwari UG NC D 0.086 0.073 0.090 3 Ganpati UG NC D 0.079 0.081 0.080 0.080 0.080 4 Mahakali UG NC D 0.192 0.205 0.230 0.200 0.200 5 Mohan UG NC D 6 New Majri UG NC C 0.310 0.340 0.320 0.330 0.340 7 Rawanwara Khas UG NC D 0.104 0.124 0.150 0.110 0.140 Existing Mines Closed TOTAL (A) 0.877 0.930 0.930 0.920 0.870 B COMPLETED PROJECTS:
1 Adasa UG IX PLAN NC D 0.183 12/00 0.260 0.210 0.210 0.260 2 Ballarpur RO UG VII PLAN NC B 0.210 01/88 0.215 0.230 0.230 0.260 3 Chattarpur I UG AP 90-92 NC D 0.226 05/91 0.192 0.225 0.250 0.350 4 Chatarpur II UG VIII PLAN NC D 0.191 03/94 0.201 0.200 0.210 0.200 5 Damua East PH-I UG AP 90-92 COK WG-II 0.056 09/90 0.070 0.040 0.060 0.060 6 Durgapur Rayatwari RPR UG VI &
EARLIER NC D 0.348 09/92 0.391 0.400 0.380 0.400
7 Gajendoh UG VII PLAN NC C 07/87 0.098 8 Hindusthan Lalpeth UG VI &
EARLIER NC D 0.353 10/80 0.416 0.420 0.395 0.400
9 Inder UG VI & EARLIER
NC D 10/80 Converted into OC Mines.
10 Jharna UG VI & EARLIER
NC B 0.201 09/83 0.231 0.150 0.210 0.240
11 Kumberkhani (Including C.M. Scheme)
UG IX PLAN NC D 0.327 07/02 0.329 0.400 0.360 0.420
12 Mahadeopuri UG VI & EARLIER
NC D 0.057 02/86 0.042 0.080 0.060 0.060
13 Mathani UG VII PLAN NC C 0.124 09/89 0.080 0.140 0.130 0.130 14 Mauri Block UG AP 90-92 NC D 0.393 07/96 0.450 0.400 0.450 0.300 15 Morpar UG VII PLAN NC D 0.082 06/89 0.083 0.100 0.090 0.100 16 Naharia UG VIII PLAN NC C 0.198 06/96 0.220 0.280 0.220 0.290 17 Nandan UG VI &
EARLIER COK WG-II 0.147 09/85 0.159 0.250 0.150 0.090
18 Patansaongi RPR (Incl. P.saongi Scheme)
UG VII PLAN NC D 0.140 11/89 0.152 0.150 0.150 0.160
19 Pathakhera Exp. UG VI & EARLIER
NC D 0.291 06/83 0.456 0.200 0.320 0.170
20 Pipla UG VI & EARLIER
NC C 0.129 08/80 0.130 0.130 0.140 0.150
21 Rajur (Incl. RO) UG AP 90-92 NC D 0.154 05/97 0.174 0.190 0.170 0.180 22 Saoner (Incl. Expn.) UG VI &
EARLIER NC D 0.786 07/95 0.874 0.850 0.900 0.900
23 Sarni (Incl. D2 Dyke) UG VI & EARLIER
NC E 0.494 09/79 0.531 0.420 0.550 0.600
24 Sasti RO UG VIII PLAN NC C 0.224 04/93 0.275 0.240 0.240 0.250 25 Satpura UG VI &
EARLIER NC E 0.325 10/80 0.496 0.240 0.360 0.290
26 Shobhapur UG VI & EARLIER
NC E 0.581 05/86 0.512 0.525 0.650 0.570
27 Silewara Ph-II UG VI & EARLIER
NC D 0.476 09/92 0.511 0.520 0.510 0.500
28 Tandsi Expansion( Incl. Tandsi RPR)
UG VII PLAN COK WG-II 0.276 07/01 0.502 0.500 0.300 0.320
29 Tandsi RPR UG VII PLAN COK WG-II 05/00 30 Tawa Phase - I UG VIII PLAN NC D 0.543 07/94 0.635 0.600 0.620 0.680 31 Thesgora UG VII PLAN NC C 0.133 09/89 0.102 0.135 0.135 0.140 32 Vishnupuri -I UG AP 90-92 NC C 0.075 05/90 0.047 0.080 0.080 0.110 33 Vishnupuri II UG AP 90-92 NC C 0.107 01/91 0.073 0.125 0.110 0.110 Completed Mines Closed SUB TOTAL UG 7.829 8.904 8.430 8.640 8.690 34 Ambara & other Quarry
Patches OC VII PLAN NC D 0.445 12/88 0.321 0.400 0.460 0.560
35 Ballarpur Expn. OC VII PLAN NC E 10/87 0.300 36 Bhatadih OC VII PLAN NC D 04/97 37 Chargaon OC VII PLAN NC 11/89 38 Chhinda OC VIII PLAN NC E 07/96 0.150 39 Dhurwasa OC X PLAN NC E/D 0.398 11/01 1.378 1.200 0.450 40 Durgapur RCE (Incl. Expn.) OC VI &
EARLIER NC E/D 0.596 10/78 0.870 0.640 0.700
41 Explo.of Patch Pench OC VII PLAN NC E 0.768 09/86 0.457 0.600 0.800 0.800 42 Gauri I (IInd RCE) OC VII PLAN NC E/D 05/95 Bal. Res. considered with Gauri - I & II Expn. OC 43 Gauri II RPR OC VII PLAN NC E/D 05/97 Bal. Res. considered with Gauri - I & II Expn. OC 44 Ghorawari Patch OC VIII PLAN NC E 0.624 09/92 0.618 0.600 0.650 0.660 45 Ghugus RCE OC VI &
EARLIER NC E 02/91
46 Gondegaon RCE OC VIII PLAN NC E/D 08/98

114
SCHEMEWISE COAL PRODUCTION PLAN Prod 2 COMPANY: WESTERN COALFIELDS LIMITED In Mt Period of Group Type of Approval Type of Specific Latest Sanction No. Sl. Name of the Project/ Mine or to be Coal ROM Capacity Date Actual 09-10 09-10 10-11
No Mine UG/OC taken up Cok/NC Grade (Mty) 2008-09 B.E./Tar. RE/ Antic B.E./Tar. 47 Hindustan Lalpeth RCE OC VI &
EARLIER NC E/D 0.657 04/87 0.292 0.500 0.700 0.650
48 Junad - I RCE OC AP 90-92 NC E/D 03/99 0.585 49 Kamptee UG to OC OC IX PLAN NC E 0.984 05/00 1.036 1.000 1.050 1.040 50 Kolarpimpri Ph-I OC VIII PLAN NC E/D 0.278 09/92 1.134 0.300 51 Makardhokra - II UG to OC OC X PLAN NC D 0.952 01/03 1.102 1.300 1.100 1.000 52 Mungoli (Including Nirguda
OC) OC VIII PLAN NC E 1.781 01/95 2.039 1.900 2.000 1.900
53 Naigaon/Bellora OC AP 90-92 NC E 01/91 0.922 0.090 54 Navinkunada Ph-I Incl.
N'kunada Expn. OC X PLAN NC E/D 1.185 07/97 1.075 1.400 1.360 1.600
55 New Dhuptala SECTOR C/E/F/G
OC VIII PLAN NC E 0.141 10/93 0.107 0.050 0.140
56 New Majri / Kawadi OC VI & EARLIER
NC E/D 1.070 07/84 1.120 1.100 1.150 1.000
57 Niljai OC VII PLAN NC E/D 2.624 04/87 3.025 2.840 3.000 3.000 58 Nirguda (Amalgamted to
Mungoli OC) OC IX PLAN NC E 05/99 Included in Mungoli OC.
59 Padampur RCE OC VIII PLAN NC E/D 2.191 05/92 2.435 2.350 2.350 2.350 60 Pauni OC VIII PLAN NC E/D 0.553 09/96 0.402 0.600 0.600 0.600 61 Pimpalgaon OC AP 90-92 NC E 0.883 03/91 0.952 0.900 0.950 1.000 62 Sasti RCE OC VI &
EARLIER NC E/D 1.538 09/89 1.679 1.600 1.700
63 Telwasa OC VIII PLAN NC E/D 02/95 0.254 0.300 64 Ukni OC AP 90-92 NC E/D 1.745 01/92 1.801 1.570 1.950 1.600 65 Umrer (Incl. Expn.) OC VI &
EARLIER NC D 2.611 03/85 3.079 2.900 3.000 3.000
Umrer Extent. (Kanhwa)(Incl. MKD-II UG to OC)
OC VIII PLAN NC D 09/96
Completed Mines Closed SUB TOTAL OC 22.023 26.681 23.650 24.350 21.460 TOTAL COMPLETED
PROJECTS TOTAL 29.852 35.585 32.080 32.990 30.150
TOTAL EXISTING AND COMPLETED PROJECTS 30.728 36.515 33.010 33.910 31.020 C ONGOING PROJECTS as on 1/08/2009 :
1 Durgarpur Ryt. 6,7,& 8 Inclines
UG IX PLAN NC D 0.201 04/01 0.047 0.230 0.230 0.280
2 Kumberkhani C.M. Scheme UG NC D 04/06 Production considered in Kumberkhani UG. 3 Sarni Sch. (For working
propoerty beyond D2 Dyke) UG NC E 10/05 Production considered in Sarni UG.
4 Tawa - II UG X PLAN NC D 0.321 03/04 0.234 0.310 0.360 0.360 5 Waghoda UG XI PLAN NC D 04/08 Ongoing Mines Dropped/Closed SUB TOTAL 0.522 0.281 0.540 0.590 0.640 6 Bhanegaon OC X PLAN NC E 11/03 0.050 0.150 7 Bhatadih Expn. OC X PLAN NC D 0.525 05/07 0.361 0.400 0.600 0.600 8 Durgapur Expn. Deep OC X PLAN NC E/D 1.360 05/07 1.720 2.000 1.600 1.800 9 Gauri Deep OC X PLAN NC E 11/01 0.050 0.050 10 Gauri I & II Expn. Scheme OC XI PLAN NC E/D 1.145 04/07 2.107 1.600 1.400 1.400 11 Ghonsa RPR OC X PLAN NC E 0.246 10/01 0.088 0.300 0.300 0.300 12 Ghugus Deep Scheme OC XI PLAN NC E 1.378 01/07 1.729 1.700 1.700 1.700 13 Gokul OC XI PLAN NC D 06/06 14 Gondegaon Expn. OC X PLAN NC E/D 1.264 09/04 1.500 1.350 1.400 1.500 15 Inder UG to OC OC X PLAN NC E 0.535 12/04 0.038 0.400 0.600 0.500 16 Junad Extn. OC XI PLAN NC E 0.478 11/07 0.500 0.550 0.500 17 Junakunada OC X PLAN NC E 03/03 0.150 0.050 18 Kolar pimpri Extn. OC X PLAN NC E/D 0.978 06/06 1.100 1.100 1.260 19 Kolgaon OC X PLAN NC E 0.359 11/01 0.363 0.400 0.400 0.400 20 Makardhokra I OC X PLAN NC D 04/05 0.050 21 Pauni-II OC X PLAN NC E 11/03 0.050 22 Penganga (Mugoli Extn.) OC XI PLAN NC E 10/08 23 Scheme for Ballarpur OC OC NC E 0.260 06/08 0.300 0.640 24 Scheme for Bellora / Naigaon
Deep OC NC E 0.816 12/08 0.850 0.950 0.600
25 Scheme for Telwasa Expn. OC
OC NC E/D 10/08 0.600
26 Scheme for Dhurwasa Expn. OC
OC NC E/D 0.402 06/08 0.450 0.750
27 Scheme for Deepening Niljai OC
OC NC E/D 04/09
28 Sasti Expn. OC X PLAN NC E/D 11/04 1.600 29 Singori OC X PLAN NC E/D 03/04 0.050 30 Urdhan OC X PLAN NC E 0.140 07/02 0.150 0.150 0.250 31 Yekona -I OC X PLAN NC E 12/04

115
SCHEMEWISE COAL PRODUCTION PLAN Prod 2 COMPANY: WESTERN COALFIELDS LIMITED In Mt Period of Group Type of Approval Type of Specific Latest Sanction No. Sl. Name of the Project/ Mine or to be Coal ROM Capacity Date Actual 09-10 09-10 10-11
No Mine UG/OC taken up Cok/NC Grade (Mty) 2008-09 B.E./Tar. RE/ Antic B.E./Tar. 32 Yekona -II OC X PLAN NC E 08/03 0.050 0.040 SUB TOTAL 9.887 7.904 11.200 11.500 14.690 TOTAL ONGOING (UG+OC): - UG+OC 10.409 8.185 11.740 12.090 15.330 D FUTURE PROJECTS
D1. AWAITING APPROVAL: PR CAP. 1 Bhakra UG XII PLAN NC/COK D/W-II 0.270 2 Dhankasa UG XI PLAN NC D 1.000 3 Dhau North UG XII PLAN COK WG-II 0.360 4 Harradol UG XII PLAN COK WG-II 0.135 5 Jamuniya UG XI PLAN NC D/C 0.720 6 Maori Block with C.M.
Package UG XI PLAN NC F 0.900 0.140 0.150
7 Saoner Mine-I Expn. UG XI PLAN NC E 0.750 0.110 8 Sharda UG XI PLAN NC C/D 0.315 SUB TOTAL UG 4.450 0.250 0.150 9 Bellora / Naigaon Deep OC XI PLAN NC E 1.000 10 Chincholi OC XI PLAN NC E/D 0.300 11 Dhuptala ( Sasti UG to OC) OC XI PLAN NC F 1.700 12 Dinesh (Makardhokra - III) OC XI PLAN NC D 3.000 13 Motaghat OC XI PLAN NC F 1.250 14 New Majri UG to OC OC XI PLAN NC F 0.800 15 Pauni-III (Sakhari - Irawati) OC XI PLAN NC E/D 1.250 16 Ukni Deep OC XI PLAN NC E 2.000 17 Yekona - I Extn. OC XI PLAN NC E 0.500 SUB TOTAL OC 11.800 TOTAL AWAITING APPROVAL: UG+OC 16.250 0.250 0.150 D2. TO BE FORMULATED: 1 Antargaon UG XII PLAN NC E 0.500 2 Borda UG XI PLAN NC D 4.000 3 Chatarpur - III / Umri UG XII PLAN NC E 0.289 4 Dhanwa UG XI PLAN COK WG-II 0.500 5 Gandhigram UG XII PLAN NC D 1.170 6 Mathra Incl. Extn. UG XII PLAN NC D/C 0.400 7 Murpar Expn.(Including
Bhansuli&Surmanjari UG) UG XI PLAN NC D 3.000
8 Nand UG XI PLAN NC C 0.700 9 Nokoda South UG UG XII PLAN NC D 0.600 10 Pauni Deep Expn. UG XII PLAN NC D/E 0.500 11 Pisgaon UG XII PLAN NC D/E 0.240 12 Shakithgarh UG XII PLAN NC D 2.000 13 Thesgora - C UG XII PLAN NC C 0.300 SUB TOTAL UG 14.199 14 Antargaon OC XII PLAN NC E 1.600 15 Bhatadi North - West OC XI PLAN NC E 0.700 16 Chikalgaon / Chinchala OC XI PLAN NC E/F 4.500 17 Ghonsa Extn. (Including
Parsoda UG) OC XI PLAN NC E 0.600
18 Junakunda Deep OC XI PLAN NC E 0.600 19 Kamptee Deep OC XI PLAN NC D 1.500 20 Kolgaon Deep OC XI PLAN NC E 0.400 21 Mugoli / Nirguda Deep OC XII PLAN NC E 1.500 22 New Majri Sector A Extn. OC XI PLAN NC E/D 1.500 23 Niljai Deep OC XI PLAN NC E/D 2.500 24 Nokoda UG to OC OC XI PLAN NC E/D 0.500 25 Padmapur Deep OC XI PLAN NC E/D 2.000 26 Pauni-II Deep OC XII PLAN NC E/D 0.600 27 Pauni Deep OC XI PLAN NC E 2.000 28 Yekona - II Extn. OC XI PLAN NC E 1.000 SUB TOTAL 21.500 TOTAL TO BE
FORMULATED: UG+OC 35.699
TOTAL FUTURE PROJECTS UG 18.649 0.250 0.150 OC 33.300 TOTAL 51.949 0.250 0.150 E ADVANCE ACTION PROJECTS
ONGOING A.A. FUTURE A.A. GRAND TOTAL W.C.L. :- UG 27.876 10.115 10.150 10.150 10.350 OC 65.210 34.585 34.850 35.850 36.150 TOTAL 93.086 44.700 45.000 46.000 46.500

116
SCHEMEWISE COAL PRODUCTION
COMPANY: - SOUTH EASTERN COALFIELD LIMITED Prod 2 (in MT)
SL Name of Mine / Project Area Type ACTUAL BE RE BE Proj. No. 08-09 09-10 09-10 10-11 11-12
EXISTING MINES 1 CHIRIMIRI UG CIC-CHR UG 0.59 0.60 0.72 0.65 0.60 2 KURASIA UG CIC-CHR UG 0.34 0.36 0.35 0.30 0.27 3 NORTH CHIRIMIRI UG CIC-CHR UG 0.26 0.00 0.25 0.00 0.00 4 WEST JKD A SEAM UG/S.JKD. CIC-HSD UG 0.33 0.33 0.32 0.37 0.45 5 BANKI 9/10,MAIN, SURAKACHAR 5/6
UG K UG 0.27 0.30 0.31 0.30 0.30
6 SURAKACHAR MAIN, 3/4 UG K UG 0.49 0.42 0.50 0.42 0.42 7 BIRSINGPUR UG/ 3&4 INCL. CIC-JHL UG 0.10 0.12 0.10 0.12 0.15 8 NOWROZABAD (W) UG converted to OC
from 11-12 CIC-JHL UG 0.23 0.15 0.24 0.24 0.30
9 NOWROZABAD (E) UG CIC-JHL UG 0.00 0.00 0.00 0.00 0.00 10 AMLAI/NEW AMLAI UG CIC-SGP UG 0.22 0.00 0.00 0.00 0.00 11 DHANPURI RO UG CIC-SGP UG 0.16 0.18 0.17 0.20 0.20 UG 3.00 2.46 2.95 2.60 2.39 OC 0.00 0.00 0.00 0.00 0.30 TOTAL (A) 3.00 2.46 2.95 2.60 2.69 COMPLETED PROJECTS
12 BISRAMPUR UG RO (JAINAGAR NEW & OLD)
CIC-BIS UG 0.12 0.15 0.00 0.00 0.00
13 KUMDA (OLD) UG CIC-BIS UG 0.00 0.00 0.00 0.00 0.00 14 BALARAMPUR UG / PSLW CIC-BIS UG 0.48 0.40 0.69 0.50 0.30 15 NEW KUMDA UG / PSLW CIC-BIS UG 0.31 0.35 0.35 0.45 0.25 16 REHAR UG CIC-BIS UG 0.26 0.30 0.29 0.45 0.50 17 BISRAMPUR OC CIC-BIS OC 0.62 0.70 0.71 0.35 18 BHATGAON UG RCE CIC-BHAT UG 0.44 0.45 0.44 0.45 0.45 19 MAHAMAYA UG CIC-BHAT UG Shown in ongoing group 20 SHIVANI CIC-BHAT UG 0.24 0.27 0.27 0.36 0.36 21 KALYANI UG CIC-BHAT UG 0.08 0.08 0.09 0.10 0.12 22 DUGGA OC CIC-BHAT OC 0.75 1.00 23 JHILIMILI UG CIC-BKP UG 0.38 0.35 0.40 0.40 0.42 24 CHURCHA EXPN UG / CHURCHA
WEST RPR CIC-BKP UG
25 CHURCHA WEST RPR CIC-BKP UG Merged with Churcha 26 PANDAVPARA UG CIC-BKP UG 0.30 0.30 0.30 0.25 0.25 27 KATKONA UG REAPPRISAL 1/2 & 3/4 CIC-BKP UG 0.25 0.30 0.25 0.30 0.42 28 NCPH UG RO CIC-CHR UG 0.55 0.51 0.40 0.51 0.51 29 KURASIA OC RCE CIC-CHR OC 0.82 0.00 0.65 0.60 0.60 30 CHIRIMIRI OC CIC-CHR OC 0.97 1.50 1.15 1.25 1.25 31 WEST CHRM OC/KOREA OC CIC-CHR OC 0.19 0.00 0.05 0.15 0.00 32 BALGI UG K UG 0.41 0.36 0.40 0.28 0.25 33 DILWADI UG K UG 0.28 0.26 0.28 0.30 0.35 34 PAWAN INC PR K UG 0.16 0.00 0.13 0.10 35 RAJGAMAR UG RO K UG 0.21 0.22 0.24 0.30 0.30 36 SINGHALI UG K UG 0.30 0.27 0.30 0.25 0.25 37 MANIKPUR OC K OC 2.87 2.70 3.27 2.45 2.90 38 BAGDEVA UG 0.61 0.59 0.60 0.60 0.60 39 LAXMAN OC K-K OC 2.28 1.50 2.00 1.50 1.50 40 CHHAL UG converted to OC from 11-12 K-RAI UG 0.15 0.13 0.15 0.15 41 DHARAM UG converted to OC from 11-12 K-RAI UG 0.14 0.14 0.15 0.15 42 PALKIMARA UG M/SCH. CIC-HSD UG 0.11 0.10 0.12 0.08 0.08 43 B SEAM UG CIC-HSD UG 0.08 0.00 0.09 0.00 0.00 44 BAHERABAND UG CIC-HSD UG 0.51 0.52 0.52 0.52 0.52 45 KAPILDHARA AUG UG CIC-HSD UG 0.58 0.55 0.57 0.57 0.57 46 RAJNAGAR RO RCE UG 7/8 & 5/6 CIC-HSD UG 0.58 0.60 0.52 0.55 0.40

117
SCHEMEWISE COAL PRODUCTION COMPANY: - SOUTH EASTERN COALFIELD LIMITED
Prod 2 (in MT) SL Name of Mine / Project Area Type ACTUAL BE RE BE Proj. No. 08-09 09-10 09-10 10-11 11-12 47 RAMNAGAR RO UG (Malga &
S.Jhimar/Jhiria) CIC-HSD UG 0.67 0.63 0.65 0.65 0.65
48 SOMNA UG CIC-HSD UG 0.24 0.22 0.25 0.12 0.12 49 BIJURI UG CIC-HSD UG 0.42 0.41 0.43 0.41 0.45 50 RAJNAGAR OC CIC-HSD OC 1.07 1.25 1.10 0.80 1.25 51 BHADRA UG/NARAYAN INCL. CIC-JK UG 0.12 0.14 0.15 0.16 0.20 52 GOVINDA UG RO/MEERA CIC-JK UG 0.23 0.22 0.24 0.24 0.15 53 JAMUNA RO UG, 1,5,9,11 CIC-JK UG 0.44 0.42 0.43 0.40 0.40 54 KOTMA WEST UG (3/4 & 7/8) CIC-JK UG 0.00 0.00 0.00 0.00 0.00 55 JAMUNA OC CIC-JK OC 1.31 0.75 0.92 0.70 0.00 56 PALI UG CIC-JHL UG 0.24 0.26 0.24 0.25 0.42 57 UMARIA REO UG CIC-JHL UG 0.13 0.20 0.17 0.15 0.24 58 PIPARIYA RPR UG CIC-JHL UG 0.15 0.21 0.19 0.17 0.24 59 BANGWAR UG CIC-SGP UG 0.36 0.40 0.36 0.42 0.42 60 NAVEGAON UG RCE CIC-SGP UG 0.19 0.00 0.19 0.20 0.00 61 RAJENDRA-PSLW CIC-SGP UG 0.16 0.28 0.35 0.30 0.40 62 BAIGA OC CIC-SGP OC 0.12 0.00 0.20 0.10 0.00 63 SHARDA OC/BAKHO CIC-SGP OC 0.40 0.00 0.30 0.30 0.10 64 AMLAI OC RCE CIC-SGP OC 1.15 0.59 0.80 0.80 0.60 65 DHANPURI OC RCE CIC-SGP OC 1.00 1.20 1.25 1.20 1.20 NCPH SEAM V UG / R6 UG 0.30 0.30 UG 10.91 10.59 11.15 11.39 10.99 OC 12.80 10.19 12.63 10.95 10.30 TOTAL (B) 23.71 20.78 23.78 22.34 21.29
UG 13.91 13.05 14.10 13.99 13.38 OC 12.80 10.19 12.63 10.95 10.60
A Existing Mines & Completed Projects
Sub Total 26.71 23.24 26.73 24.94 23.98 B ON GOING PROJECTS 1 NAWAPARA UG CIC-BHAT UG 0.14 0.20 0.18 0.22 0.36 2 MAHAN OC CIC-BHAT OC 0.04 0.36 0.11 0.05 0.30 3 GAYATRI UG CIC-BIS UG 0.11 0.18 0.20 0.25 0.25 4 AMERA OC CIC-BIS OC 0.00 0.70 0.19 0.60 0.80 5 NCPH SEAM V UG / R6 UG CIC-CHR UG 0.20 0.30 0.21 completed in BE 10-
11 6 RANI ATARI UG CIC-CHR UG 0.19 0.33 0.32 0.42 0.48 BAGDEVA UG 7 KURJA / SHEETALDHARA UG UG 0.47 0.50 0.50 0.52 0.70 8 BARTARAI / AMADAND UG CIC-JK UG 0.32 0.35 0.35 0.40 0.43 9 PINOURA UG AUG PR CIC-JHL UG 0.18 0.30 0.21 0.20 0.30 10 VINDHYA AUG PR UG CIC-JHL UG 0.21 0.30 0.23 0.20 0.30 11 KANCHAN OC CIC-JHL OC 0.36 0.65 0.50 0.60 0.65 12 DAMINI UG CIC-SGP UG 0.10 0.20 0.20 0.42 0.48 13 AMADAND OC CIC-JK OC 0.00 0.50 0.13 0.60 1.05 14 KETKI UG CIC-BIS UG 0.00 0.05 0.00 0.10 0.30 15 BINCARA UG CIC-BIS UG 0.00 0.00 0.00 0.05 0.27 16 AMGAON OC CIC-BIS OC 0.00 0.00 0.00 0.20 0.60 17 VIJAY WEST UG CIC-CHR UG 0.00 0.00 0.00 0.05 0.30 18 HALDIBARI UG CIC-HSD UG 0.00 0.12 0.00 0.05 0.30 19 SARAIPALLI OC K OC 0.00 0.50 0.00 1.00 1.20 20 CHAAL OC K-RAI OC 2.60 2.50 2.64 3.10 3.00 21 BAROUD EXPN OC K-RAI OC 1.56 2.50 1.70 1.80 3.00 22 KHAIRAHA UG CIC-SGP UG 0.00 0.05 0.00 0.05 0.25 23 GEVRA EXPN OC (25.00 MT) K-G OC 25.00 25.00 25.00 25.00 25.00 24 DIPKA EXPN OC (20.00 MT) K-G OC 18.31 20.00 19.50 20.00 20.00

118
SCHEMEWISE COAL PRODUCTION COMPANY: - SOUTH EASTERN COALFIELD LIMITED
Prod 2 (in MT) SL Name of Mine / Project Area Type ACTUAL BE RE BE Proj. No. 08-09 09-10 09-10 10-11 11-12 25 MAHAN II OC CIC-BHAT OC 0.00 0.00 0.30 0.60 1.00 26 KUSMUNDA EXPN OC (10.00 MT) KSM OC 6.81 9.00 10.00 10.00 10.00 27 MAHAMAYA UG AUG UG 0.27 0.35 0.30 0.33 0.45 28 DUGGA EXPN. OC OC 0.75 0.85 0.80 Completed in BE 10-
11 29 CHURCHA RO UG UG 1.21 1.22 1.20 1.25 1.25 30 JAMPALI OC OC 31 KARTALI EAST OC OC 32 AMBICA OC OC 33 BATURA OC OC 34 PELMA OC OC 35 BIJARI OC OC 36 JAGANNATHPUR OC OC
ON GOING R&D PROJECT BALRAMPUR SHORTWALL UG 0.26 Production shown with Balrampur from 09-10 UG 3.66 4.45 3.90 4.51 6.42 TOTAL ONGOING PROJECTS OC 70.78 78.31 76.97 82.55 86.60 Sub Total 74.44 82.76 80.87 87.06 93.02 C NEW PROJECTS XI PLAN PROJECTS JAMPALI OC DIPKA EXPN OC (20 to 25 MTY) KUSMUNDA EXPN OC (10 to 15 MTY
incremental.)
GEVRA EXPN OC (25 to 35 MTY) KUSUMGHAT OC RAI WEST 1 PATHAKPUR UG CIC-BHAT UG 2 JAMDAI UG CIC-BIS UG 3 GUMGARA UG CIC-BIS UG 4 VIJAY EAST UG CIC-CHR UG 5 BAKULMUNI UG CIC J&K UG 6 RAI EAST OC RAI OC 7 PORDA OC RAI OC 8 CHIMTAPANI OC RAI OC 9 DURGAPUR OC RAI OC 10 BODRI / BODRI NORTH UG SGP UG 11 AMRITDHARA UG J&K UG 12 AMBA UG CIC-BHAT UG 13 BADAULI EXTN UG CIC-BIS UG UG 0.00 0.00 0.00 0.00 0.00 TOTAL NEW PROJECTS OC 0.00 0.00 0.00 0.00 0.00 Sub Total 0.00 0.00 0.00 0.00 0.00 UG 17.57 17.50 18.00 18.50 19.80 GRAND TOTAL OC 83.58 88.50 89.60 93.50 97.20 SECL Total 101.15 106.00 107.60 112.00 117.00

119
SCHEMEWISE COAL PRODUCTION PLAN
COMPANY: MAHANADI COALFIELDS LIMITED PROD-2 Type of CMPDIL Coal
Sl. Name of the Project/ Mine Capacity (Mt) Actual 09-10 09-10 10-11 11-12 Field StateNo Mine UG/ OC as on 01.04.09 08-09 BE RE BE Proj Code Code
A. EXISTING MINES 1 H.R.C. UG 0.19 0.16 0.16 0.16 0.21 0.21 IB(S) ORI2 Orient No.1&2 UG 0.30 0.31 0.33 0.33 0.33 0.45 IB(S) ORI3 Orient No.3 UG 0.46 0.59 0.58 0.58 0.58 0.60 IB(S) ORI4 Orient No.4 UG 0.08 0.03 0.03 0.03 0.10 0.15 IB(S) ORI5 Talcher UG 0.28 0.23 0.21 0.21 0.24 0.24 TAL ORI UG 1.31 1.32 1.31 1.31 1.46 1.65 OC 0.00 0.00 0.00 0.00 0.00 0.00 Sub-Total (A) 1.31 1.32 1.31 1.31 1.46 1.65
B. COMPLETED PROJECTS 1 Ananta OC 12.00 5.50 5.50 5.50 5.50 5.50 TAL ORI2 Ananta Expansion OC Inc. in Ananta TAL ORI3 Ananta Expn. Ph-II OC Inc. in Ananta 7.02 8.00 8.00 6.50 6.50 TAL ORI4 Balram OC 6.12 3.50 6.00 6.00 8.00 8.00 TAL ORI5 Basundhara (West) OC 6.11 6.08 2.40 2.40 2.40 2.40 IB (N) ORI6 Belpahar OC 5.50 2.00 2.00 2.00 2.00 2.00 IB (S) ORI7 Belpahar Expn. OC Inc. in Belpahar 3.00 3.00 3.00 1.50 1.50 IB (S) ORI8 Bharatpur OC 10.55 5.00 5.00 5.00 5.00 5.00 TAL ORI9 Bharatpur Expansion OC Inc. in Bharatpur TAL ORI10 Chhendipada OC 0.27 0.50 0.50 0.50 0.00 TAL ORI11 HBI UG 0.66 0.59 0.58 0.58 0.58 0.60 IB(S) ORI12 Hingula-II OC 10.40 2.00 2.00 2.00 2.00 2.00 TAL ORI13 Hingula-II Expn. Ph-I OC Inc. in Hingula 2.00 2.00 2.00 TAL ORI14 Hingula-II Expn. Ph-II OC Inc. in Hingula 4.00 4.00 4.00 TAL ORI15 Jagannath/Jagannath Extn. OC 5.50 4.00 4.00 4.00 4.00 4.00 TAL ORI16 Jagannath OC Expn. Ph-II OC Inc. in Jagannath 1.42 1.50 1.50 2.00 0.50 TAL ORI17 Lajkura/Lajkura Extn. OC 2.02 1.01 1.50 1.50 1.00 1.00 IB (S) ORI18 Lakhanpur OC 12.00 5.00 5.00 5.00 5.00 5.00 IB (S) ORI19 Lilari OC 1.62 0.60 0.50 0.50 0.50 0.50 IB (S) ORI20 Lingaraj OC 12.50 5.00 5.00 5.00 5.00 5.00 TAL ORI21 Lingaraj Expansion Ph-I OC Inc. in Lingaraj 5.00 5.00 5.00 5.00 5.00 TAL ORI22 Lingaraj Expn. Ph-II OC Inc. in Lingaraj 2.90 3.00 3.00 3.00 3.00 TAL ORI23 Nandira (Augmentation) UG 0.34 0.23 0.22 0.22 0.25 0.33 TAL ORI24 Samaleswari OC 16.72 3.00 3.00 3.00 3.00 3.00 IB (S) ORI25 Samleswari Expn. Ph-I & II OC Inc. in Samleswari 2.00 2.00 2.00 2.00 2.00 IB (S) ORI26 Samleswari Expn. Ph-III OC Inc. in Samleswari 5.00 2.00 2.00 IB (S) ORI UG 1.00 0.83 0.80 0.80 0.83 0.93 OC 101.04 64.31 64.90 75.90 71.90 69.90 Sub-Total (B) 102.04 65.13 65.70 76.70 72.73 70.83
C. ON GOING PROJECTS as on 31.08.2009 1 Ananta Expn. Ph-III OC Inc. in Ananta TAL ORI2 Balram OC Extn. OC Inc. in Balram TAL ORI3 Basundhara (West) Expn. OC Inc. in
Basundhara(W) 4.60 4.60 4.60 IB(N) ORI
4 Bharatpur Expn. Ph-II OC Inc. in Bharatpur 5.43 6.00 6.00 6.00 6.00 TAL ORI5 Bharatpur OC Expn. Ph-III OC Inc. in Bharatpur 0.91 2.00 2.00 4.00 6.71 TAL ORI6 Bhubaneswari OC 4.50 1.85 4.00 4.00 8.00 9.00 TAL ORI7 Gopalprasad OC 0.00 0.00 0.00 0.00 0.00 0.00 TAL ORI8 HBI Augmentation UG Inc. in HBI 0.00 0.00 0.00 0.00 0.00 IB(S) ORI9 Hingula-II Expn Ph-III. OC Inc. in Hingula 0.00 2.70 1.50 2.50 TAL ORI

120
SCHEMEWISE COAL PRODUCTION PLAN COMPANY: MAHANADI COALFIELDS LIMITED PROD-2
Type of CMPDIL Coal Sl. Name of the Project/ Mine Capacity (Mt) Actual 09-10 09-10 10-11 11-12 Field StateNo Mine UG/ OC as on 01.04.09 08-09 BE RE BE Proj Code Code10 Jagannath UG 0.00 0.00 0.00 0.00 0.00 0.00 TAL ORI11 Kaniha OC 3.00 0.00 1.00 1.00 2.71 4.75 TAL ORI12 Kulda OC 4.00 2.47 3.00 3.00 5.00 6.50 IB (N) ORI13 Lajkura OC Expn. OC Inc. in Lajkura 0.00 0.00 0.00 0.75 1.50 IB (S) ORI14 Lakhanpur Expansion OC Inc. in Lakhanpur 6.78 5.00 5.00 5.00 5.00 IB (S) ORI15 Lakhanpur OC Expn.Ph-II OC Inc. in Lakhanpur 0.00 3.00 5.00 5.00 IB (S) ORI16 Natraj UG 0.00 0.00 0.00 0.00 0.00 0.00 TAL ORI17 Talabira OC 0.00 0.00 0.00 0.00 0.00 0.88 IB (S) ORI18 Talcher (West) UG 0.00 0.00 0.00 0.00 0.00 0.18 TAL ORI Others 1 Hingula-II Expn. Ph-I OC 2.00 2.00 TAL ORI2 Hingula-II Expn. Ph-II OC 5.27 4.00 TAL ORI3 Samleswari Expn. Ph-III OC 5.19 5.00 IB (S) ORI Total Others 12.45 11.00 UG 0.00 0.00 0.00 0.00 0.00 0.18 OC 11.50 29.88 32.00 31.30 42.56 52.44 Sub-Total (C) 11.50 29.88 32.00 31.30 42.56 52.62
D. FUTURE PROJECTS D1. Awaiting approval
1 Garjanbahal OC IB (N) ORI2 Kaniha-II OC TAL ORI
D2. To be formulated 1 Kaniha OC Expn. OC TAL ORI2 Madhupur OC IB (N) ORI3 Siarmal OC IB (N) ORI4 Siarmal (West) Extn. OC IB (N) ORI Others 1 Basundhara (West) Expn. OC 4.60 IB (N) ORI2 Hingula-II Expn Ph-III. OC 0.00 2.70 TAL ORI3 Lakhanpur OC Expn.Ph-II OC 0.00 3.00 IB (S) ORI Total Others 10.30 UG 0.00 0.00 0.00 0.00 0.00 0.00 OC 0.00 0.00 10.30 0.00 0.00 0.00 Sub-Total (D) 0.00 0.00 10.30 0.00 0.00 0.00
E. ADVANCE ACTION PROJECTS (A) ONGOING AA 0.00 (B) FUTURE AA
1 Balabhadra OC TAL ORI2 Balram OC Expn. OC TAL ORI3 Chhendipada OC Expn. OC TAL ORI UG 0.00 0.00 0.00 0.00 0.00 0.00 OC 0.00 0.00 0.00 0.00 0.00 0.00
TOTAL (E) 0.00 0.00 0.00 0.00 0.00 0.00 GRAND TOTAL UG 2.31 2.15 2.10 2.10 2.29 2.76
OC 112.54 94.19 107.20 107.20 114.46 122.34 Total 114.85 96.34 109.30 109.30 116.75 125.10 IB NORTH 10.11 8.55 10.00 10.00 12.00 13.50 IB SOUTH 39.56 30.25 31.68 31.68 29.55 31.39 TALCHER 65.18 57.53 67.63 67.63 75.20 80.21 TOTAL 114.85 96.34 109.30 109.30 116.75 125.10

121
ANNUAL PLAN 2010-11 - MoC - COMPANYWISE/SCHEMEWISE PRODUCTION PLAN
Company: SCCL (Million Tonnes) Sl. Project/Mine 2006-07 2007-08 2008-09 2009-10 2009-10 2010-11 2011-12 No. Actual Actual Actual BE RE Prop. Proj. A EXISTING MINES. 1.886 1.863 2.173 1.793 1.902 1.610 1.410 B COMPLETED PROJECTS. 34.529 37.139 35.382 30.382 32.426 31.940 30.825 C ON-GOING PROJECTS. 1.292 1.602 6.987 12.325 10.672 12.450 14.765 D NEW PROJECTS - IX, X & XI PLAN i) formulated awaiting approval. 0.000 0.000 0.000 0.000 0.000 0.000 0.000 ii) Yet to be formulated Projects. 0.000 0.000 0.000 0.000 0.000 0.000 0.000
SUB-TOTAL NEW PROJECTS (i+ii): 0.000 0.000 0.000 0.000 0.000 0.000 0.000 TOTAL MINING SCCL (A+B+C+D): 37.707 40.604 44.542 44.500 45.000 46.000 47.000
A EXISTING MINES: 1 5 INC. 2 5B INC. 0.008 0.164 0.155 0.019 3 VK-7 4 21 INC. LHD 0.195 0.214 0.066 0.225 0.177 0.050 0.100 5 GDK-1&3 HS&SDL 0.162 0.217 0.298 0.240 0.310 0.280 0.250 6 GDK-2 HS&SDL 0.143 7 GDK-2A 0.164
0.368 0.367
0.360 0.389 0.480
0.300
8 GDK-3 9 GDK-5 0.001 10 GDK-5A 0.162 0.102 11 GDK-6 0.067 12 GDK-6A 0.099 0.063 0.044 13 GDK-6B 0.257 0.074
14 MK-4 HS 0.385 0.401 0.215 0.088 0.012 15 RK-1 16 KK-1 SDL 0.003 0.001 0.245 0.160 0.212 0.160 0.160 17 KK-2 SDL 0.036 0.232 0.276 0.240 0.227 0.240 0.200 18 KK-5 SDL 0.097 0.027 0.507 0.480 0.557 0.400 0.400 19 KK-5A 20 SMG-1 0.107 21 SMG-3
SUB-TOTAL (A): 1.886 1.863 2.173 1.793 1.902 1.610 1.410 B COMPLETED PROJECTS. 1 PADMAVATHI KHANI 0.279 2 VK-7 BG 0.153 0.230 3 VK-7 LHD 0.291 0.120 0.209 0.120 0.120 4 HEMACHANDRAPURAM. 5 JK-3 OC BLOCK-C 6 JK-5 0.286 7 YLD OCP BLOCK-D 8 YLD.OC-II 9 KOYAGUDEM OCP.I (PHASE-I) 1.670 1.752 1.392 10 YLD OCP.BLOCK-E 0.685 0.847 0.888 0.550 0.709 0.700 11 CENT.OC,MNG. 0.585 0.251 12 MNG. OC-II 3.089 3.016 2.797 3.000 2.223 3.900 4.000 13 MANUGURU OC-IV. 1.800 2.345 3.291 3.000 2.917 3.000 3.000 14 PK-1 0.212 0.227 0.125 0.079 0.000 15 PK-2 0.076 0.015 16 GDK-11A LHD 0.250 0.000 0.100 17 GDK-7 LEP. SDL&LHD 0.211 0.278 0.301 0.280 0.292 0.290 0.325 18 GDK-5 INC. - LHDs. 0.179 0.329 0.352 0.300 0.426 0.360 0.360 19 GDK-5, GDK-6B, GDK-9 SDLs. 0.285 0.198 0.132 20 GDK-6B BG-I. (11A BG1) 0.199 0.221 0.201 0.300 0.237 0.300 0.300 21 GDK-10 22 GDK-10 BG -I 0.238 0.242 0.362 0.300 0.323 0.300 0.300 23 GDK-10 BG -II. 24 GDK-10A LW & RH 0.442 0.867 0.516 0.675 0.571 0.740 0.700 GDK-10A SDL 0.080
25 GDK-8 & 8A 0.044 26 GDK-8 BG -I 27 GDK-8 BG-II 0.203 0.300 0.243 0.300 0.284 0.300 28 GDK-9 LW&RH 0.020 0.373 0.300 0.314 29 VAKILPALLI BLOCK-A LHD 0.185 0.406 0.166 0.360 0.207 0.300 0.270 30 RG.OC-I (INCL.MS) 3.004

122
ANNUAL PLAN 2010-11 - MoC - COMPANYWISE/SCHEMEWISE PRODUCTION PLAN Company: SCCL (Million Tonnes)
Sl. Project/Mine 2006-07 2007-08 2008-09 2009-10 2009-10 2010-11 2011-12 No. Actual Actual Actual BE RE Prop. Proj. 31 RG.OC-II 2.432 2.628 2.567 2.000 3.004 3.200 3.350 32 RG.OC-III 4.565 4.006 4.108 3.500 3.432 3.600 4.000 33 KTK-1 & 1A HS 0.224 0.240 0.117 0.150 0.121 0.070 0.000 34 KTK-2 & 2A SDL 0.286 0.290 0.352 0.350 0.341 0.390 0.280 35 KTK-5. HS & SDL 0.258 0.277 0.273 0.290 0.266 0.390 0.350 36 IK-1 & 1A. HS & SDL 0.206 0.198 0.191 0.250 0.183 0.240 0.250 37 R.K.-7 (HS&SDL) 0.520 0.552 0.587 0.490 0.466 0.480 0.400 38 RK-8 (HS & SDL) 0.133 0.125 0.124 0.240 0.126 0.160 0.160 39 SRP-1 HS 0.209 0.242 0.236 0.250 0.250 0.240 0.200 40 SRP-2 41 SRP-2A 0.006 42 SRP-3 & 3A. HS&SDL 0.391 0.408 0.402 0.377 0.361 0.330 0.360 43 R.K.-5 . (Incl. MS) HS&SDL 0.408 0.469 0.514 0.480 0.527 0.450 0.360 44 R.K.-6 HS 0.328 0.491 0.233 0.240 0.210 0.070 0.070 45 RK-1A HS 0.274 0.294 0.326 0.240 0.305 0.200 0.090 46 RK-5 MARG. SCHEME 47 KASIPET HS&SDL 0.261 0.277 0.255 0.275 0.255 0.310 0.175 48 S.K. EXTN. (PHASE-I) 0.027 0.480 0.051 0.140 0.005 0.040 0.135 49 BPA.OC-II 50 GOLETI-1 HS 0.197 0.184 0.172 0.135 0.000 51 GOLETI-2 52 MVK-1 53 MVK-5 54 GK.OCP 2.902 2.792 3.350 2.750 3.097 3.000 3.000 55 MEDAPALLI OCP 1.367 2.503 56 RK. NEW TECH. 0.224 0.431 0.048 0.067 57 CHENNUR-1&1A. 58 NO.21 INC. BG. 0.241 0.304 0.281 0.300 0.173 0.300 0.300 59 GOLETI - 1A SDL 0.221 0.226 0.240 0.280 0.278 0.240 0.240 60 MANUGURU OC-III 1.062 1.286 0.784 0.500 0.974 61 Semi-mechanisation by LHDs in GDK-8,
GDK-9 & GDK-10 Incs. of RG-II area and PVK-5 Inc. of Kgm. Area.
0.357 0.363 0.326 0.540 0.399 0.790 0.170
62 Conversion into continuous Miner extraction at GDK-5 Inc.
0.018 0.016 0.000
63 SDLs in RK.NT,VK-7,GDK-8A,JK-5,PVK-5,21 Inc.,PK-1,GDK-5A,SMG-1, KK-5, KK-1,GDK-6 & GDK-6B Inc.
1.058 0.774 0.939 1.000 0.770 0.490 0.580
64 LHDs in GDK-8,GDK-6A & GDK-11A Inc.
0.555 0.466 0.202 0.180 0.378 0.000
65 Continuous Miner at PVK-5 Inc. 66 Continuous Miner at GDK-8 Inc. 67 Continuous Miner at GDK-10 Inc. 68 Manriding systems at SRP 3&3A 69 Introduction of manriding system at KTK 2&2A 70 Sinking of intake airshaft at GDK 11A 71 Manriding systems in GDK 6B inclilne 72 Introduction of SDLs in SK and RK 1A 0.023 0.043 73 KTK-3. 0.161 0.120 74 SDLs in RK-6& KTK-1&1A Inc. 0.142 0.382 0.440 0.450 0.760 0.480 75 JVR OC-I (SATHUPALLI) 1.282 1.917 76 CHINNUR-2. 0.14 0.001 77 RG OC-I EXP 1.625 2.203 2.500 2.752 2.500 3.000 78 SRP-1 OCP 0.810 1.019 0.600 1.187 0.600 0.600 79 BPA. OC - II, EXTN. 0.206 0.777 0.740 0.400 0.345 0.400 0.400 80 JVR OC-I EXP 2.680 2.000 2.913 2.200 2.500 SUB-TOAL (B): 34.529 37.139 35.382 30.382 32.426 31.940 30.825
C ON-GOING PROJECTS: 1 Drivage of interseam tunnels and sinking of return airshaft in GDK-10 & 10A incline 2 Kunavaram OCP 3 KTK-6. (HS& SDL) 0.115 0.129 0.155 0.180 0.139 0.280 0.245 4 KTK-7. 5 KTK-8 & 8A. SDLs (KLP) 0.003 0.068 0.148 0.250 0.194 0.320 0.280 6 KTK-9& 9A. 7 KASIPET - OCP 8 KHAIRAGURA OCP RFR 1.118 1.402 1.852 2.500 2.149 2.500 2.500 9 VK - 7 CONTINUOUS MINER 0.056 0.400 0.132 0.300 0.400

123
ANNUAL PLAN 2010-11 - MoC - COMPANYWISE/SCHEMEWISE PRODUCTION PLAN Company: SCCL (Million Tonnes)
Sl. Project/Mine 2006-07 2007-08 2008-09 2009-10 2009-10 2010-11 2011-12 No. Actual Actual Actual BE RE Prop. Proj. 10 DORLI SECTOR-I OCP 0.003 0.778 0.700 1.240 0.700 0.700 11 DORLI OC-II 0.700 0.000 0.350 0.700 12 KOYAGUDEM OCP.II 0.918 2.000 2.813 2.300 2.000 13 Continuous Miner at GDK-11A Inc. 0.031 0.400 0.187 0.300 0.400 14 SRP-OC-II 1.000 0.288 1.000 1.000 15 ABBAPUR OCP 0.300 16 Sravanapalli OCP 17 Semi mechanisation with Diesel operated LHDs at GDK 5 0.050 0.000 18 Indaram OCP 19 Medapalli OCP EXP 3.089 3.000 2.850 3.000 3.000 20 MNG OC II EXT 21 ADRIYALA SHAFT PROJECT (RG SHAFT BLOCK-II &
III - MINE-2) (RH/BM) 0.016 0.115 0.000 0.250 1.400
ADRIYALA SHAFT PROJECT (SDL) 0.080 22 SHANTIKHANI LW-1 UNIT. 0.050 23 Jallaram Shaft project 24 RG OC-I EXP Phase II 25 RG OC-III EXT 26 Manuguru Opencast Project 27 KTK OC SECTOR 1 1.000 0.680 0.800 1.000 28 VAKILAPALLI BG (GDK9) 0.150 0.300 29 KONDAPURAM UG (NARGUNDKAR KHANI) SDL 0.030 0.000 0.120 0.200 30 KTK LONGWALL (KTK-8LW) LW &RH) 0.000 0.000 0.290 31 RG OC3 DIP SIDE EXTN SUB-TOTAL (C): 1.292 1.602 6.987 12.325 10.672 12.450 14.765
D NEW PROJECTS - IX PLAN, X & XI PLAN PROJECTS. i) Formulated awaiting approval. 1 SHAFT BLOCK-I MNG. 2 JVR OC II 3 PEDDAMPET SHAFT PROJECT (GDK-6B BG-II). 4 Shortwall mining at RKNT 5 MNG OC IV EXT 6 KKOC 7 RG OC II EXT 8 KISTARAM OC 9 JK 5 OCP TOTAL (D-i): 0.000 0.000 0.000 0.000 0.000 0.000 0.000 ii) Yet to be formulated Projects. 1 RG. OC-II LEP (RG SHAFT BLOCK-II & III - MINE-1) 2 SHAFT BLOCK-II MNG. 3 RKP SHAFT BLOCK-I 4 CHINNUR-SOUTH BLOCK-II 5 VENKATAPUR BLOCK-II 6 CHINNUR-SOUTH BLOCK-III 7 5B EXTN. 8 GDK-10A 2 SEAM LW 9 LUXMIDEVIPETA. 10 KHAIRAGURA UG. 11 KK6 12 KK7 13 KASIPET UG 14 RKOCP TOTAL (D-ii) 0.000 0.000 0.000 0.000 0.000 0.000 0.000 SUB-TOTAL (D): 0.000 0.000 0.000 0.000 0.000 0.000 0.000
TOTAL SCCL MINING (A+B+C+D) 37.707 40.604 44.542 44.500 45.000 46.000 47.000

124
Schemewise Expenditure/ Investment Eastern Coalfields Ltd
Group Name of the Mine Sanc. Sanc. Sanc. Ant./ Ant../ 2009-10 2009-10 2010-11 No. Project/Mine Type Date Act. Act. Act. (BE) (ANT./RE) (BE)
UG/OC Capacity Cost Compl. Cost
Compl. 08-09
(Mt) (Rs.Crs) (Rs.Crs) Date MINING
A & B EXISTING MINE AND COMPLETED PROJECTS Sub Total (A+B) 160.08 148.25 156.19 247.76
C ON GOING PROJECTS (PRIOR TO X PLAN) 1 J K NAGAR UG 0.435 54.15 2/91 0.80 0.00 0.00 0.00 2 SARPI AUGMENTATION UG 0.46 147.86 9/03 0.00 6.50 36.00 60.00 3 SIDHULI UG 0.3 54.99 12/06 0.00 0.12 0.05 2.00 4 NABA KAJORA UG 0.3 56.14 12/06 0.00 0.13 0.05 2.00 5 JHANJRA - CM UG 0.4375 93.598 12/06 21.33 0.63 6.85 1.23 6 PARASEA (DOBRANA) UG 0.16 11.89 11/02 0.12 0.12 0.12 0.50 7 BANKOLA (R VI) UG 0.24 19.14 3/3 0.22 0.35 0.76 0.87 8 KUMARDIHI B UG 0.42 79.23 07/06 0.13 2.02 2.00 4.56 9 KHANDRA (NKJ ) UG 0.285 18.81 7/03 1.25 0.45 2.65 1.43 10 SHANKARPUR UG 0.24 8.13 6/2002 8.13 0.14 0.29 0.44 0.00 11 JHANJRA L/W R-VI UG 1.7 287.18 11/06 0.44 1.65 1.00 5.00 12 BELBAID-DHASAL UG 0.36 69.11 0.10 0.10 5.00 13 NARAINKURI UG 0.54 149.06 0.35 0.10 2.00 14 JHANJRA CM (2ND SET) UG 0.51 122.35 1.15 0.60 5.00 15 KHOTTADIH AUGMENTATION OC 1 23.01 12/06 1.24 2.00 0.50 16 RAJMAHAL EXPASION OC OC 17.00 153.82 09/09 5.13 3.13 12.00 17 NAKRAKONDA B OC 1.5 4.22 0.13 0.00 0.00 0.00 18 CHITRA EAST OCP 1.30 (INCM) 112.69 0.84 3.84 3.00 5.00 19 SONEPUR BAZARI (HANSDIHA) OC 1.00 2.733 0.64 0.64 0.00 20 MOHANPUR OC 1.00 14.23 0.78 0.79 2.00 TOTAL ON GOING PROJECTS (C) 25.40 25.49 60.28 109.09 D FUTURE PROJECTS 2 RANGAMATI A UG 0.36 0.00 0.00 0.00 3 RANGAMATI B UG 0.36 132.21 0.00 0.00 0.00 4 TILABONI UG 2.00 0.00 0.00 0.00 5 SARPI/SHYAMSUNDARPUR UG 1.2 0.00 6 KUNUSTORIA - DOBRANA UG 0.54 144.8 0.11 0.00 0.15

125
Schemewise Expenditure/ Investment Eastern Coalfields Ltd Group Name of the Mine Sanc. Sanc. Sanc. Ant./ Ant../ 2009-10 2009-10 2010-11
No. Project/Mine Type Date Act. Act. Act. (BE) (ANT./RE) (BE) UG/OC Capacity Cost Compl.
Cost Compl. 08-09
(Mt) (Rs.Crs) (Rs.Crs) Date 7 BANSRA CM UG 0.43 0.00 0.00 0.00 8 HARIPUR CM UG 0.43 0.00 0.00 0.00 9 KHOTTADIH CM UG 0.43 0.00 0.00 1.00 10 HIGHWALL MINING UG 1.20 0.00 0.00 0.00 11 SONEPUR COMBINED OC OC 8.00 495.09 0.75 0.10 2.00 12 CHUPERBHITA OC OC 4.00 232.05 7.40 4.00 6.00 13 HURA - C OC OC 3.00 144.05 7.23 8.00 10.00 D SUB-TOTAL (FUTURE PROJECTS) 0.00 15.49 12.10 19.15 TOTAL MINING 185.48 189.23 228.57 376.00
NON MINING F WASHERIES G OTHER NON - MINING ACTIVITIES WORKSHOP & STORES WATER SUPPLY RAILWAY SIDING MINES RESCUE STATION SAND GATHERING HOSPITAL & CIVIL WORKS TRAINING POWER ENVIRONMENTAL MEASURES CMD'S OFFICE & OTHER CIVIL
WORKS
FIRE PROJECTS OTHER 2.25 5.77 6.43 9.00 H EXPLORATION & P&D ACTIVITIES 4.15 15.00 15.00 15.00 TOTAL NON MINING 6.40 20.77 21.43 24.00 GRAND TOTAL 191.88 210.00 250.00 400.00

126
SCHEMEWISE EXPENDITURE AND INVESTMENT PLAN
COMPANY: BHARAT COKING COAL LIMITED Gr. Name of the Type of Project Likely/Sanct. Likely/Sanct. Sanction Antic./Act Actual 09-10 09-10 10-11 No. Project/Mine Mine Status Capacity Cost Date Comple 2008-09
UG/OC PR/RPR/RCE (Mt) (Rs.Crs) date BE RE BE A+B Existing Mines & Completed Projects 192.56 183.80 227.60 232.95
C ONGOING PROJECTS (As on 1.8.2006) 1 Bagdigi Augmentation UG RPR 0.27 11.54 8/94 3/2005 0.05 0.10 0.00 2 Bararee IX & X seam RPR UG RPR 0.24 7.88 7/94 3/2005 0.05 0.10 0.00 3 Block-III OCP (Coking) OC PR 0.45 45.97 8/91 Kept in abeyance 4 Chaptoria OC OC PR 0.55 7.12 8/03 0.50 0.00 0.00 5 Dahibari/Basantimata Recast OCP OC PR 1.30 81.25 10/03 6.52 6.40 9.20 5.00 6 Damoda BJ Sec OCP OC PR 0.60 7.78 8/03 0.20 0.20 0.30 7 Goluckdih (NC) OCP OC PR 1.20 12.27 8/03 0.30 2.50 2.80 8 Kuya Phase-I UG PR 0.29 16.02 Project sanctioned in Sept 2002 0.00 0.00 0.00 9 Pootkee Balihari RPR UG RPR 0.68 182.60 4/03 3/2007 3.95 1.00 1.50 0.60
10 Vishwakarma OCP OC PR 0.70 44.74 8/97 Kept in abeyance 0.50 3.00 2.60 Sub Total 6.28 417.17 10.47 9.00 16.60 11.30
D. NEW PROJECTS (To be taken-up in XI Plan) D1 Awaiting approval/Under formulation 1 Block-III OCP including SOCP & MOCP OC 6.00 120.00 0.00 2 Block-IV OCP OC 5.00 120.00 0.00 3 Exploitation of sean I/II by continuous Miner
Tech. at Block II Area
At CIL board0.45 113.00 1.50 0.00 1.50
4 Exploitation of seam IV by continuous Miner Technology at Dhansar/Kusunda UG
UG 0.42 70.00 0.50 0.00 3.20
5 Basudeopur Prodn Aug UG 0.00 6 Opencast Block II OCP Aug.(C/NC) OC 5.00 NA 0.00 0.00 7 South Tisra/North Tisra Aug. NC OC OC 6.00 1004.00 0.50 0.70 2.00 Sub Total 2.50 0.70 6.70
D2 To be formulated 1 Amalgamated Kharkharee Dharmaband Exten.
Block UG 0.27 NA 0.00
2 PR For Moonidih XV Seam Turn key UG NIT floated 1.50 210.00 0.00 3 PR for Kapuria Turn key UG UG NIT floated 2.00 900.00 0.00 4 Madhuband Turn-key UG Project NIT floated 1.00 NA 0.50 5 PB tun-key UG Project UG NIT floated 0.50 6 Amlabad turn key Proj UG NIT under prep 0.50 0.00 7 Rajapur Prodn Aug Proj UG NA 0.50 0.00 8 Ena OC Expn OC NA 0.00 9 Ena UG UG NA 0.00
10 Simlabahal Prodn Aug UG NA 0.00 11 Lodna prodn Aug proj UG NA 1.00 0.00

127
SCHEMEWISE EXPENDITURE AND INVESTMENT PLAN COMPANY: BHARAT COKING COAL LIMITED
Gr. Name of the Type of Project Likely/Sanct. Likely/Sanct. Sanction Antic./Act Actual 09-10 09-10 10-11 No. Project/Mine Mine Status Capacity Cost Date Comple 2008-09
UG/OC PR/RPR/RCE (Mt) (Rs.Crs) date BE RE BE 12 Sudamdih Incline Aug proj UG NA 0.50 0.00 13 Sudamdih Shaft Aug proj UG NA 0.50 0.00 14 Muraidih-Shatabdi Turn key Project UG NIT under prep 2.00 0.00 15 Goluckdih UG Project UG NA 0.00 Sub Total 0.00 0.00 0.00 1.00 E Advance Action (AA) Total Mining (A to E) 203.03 195.30 244.90 251.95 NON MINING F WASHERIES 1 Existing and Completed Project 14.95 15.50 19.25 51.35 2 New Washerires BOM basis 0.00 3 ALTEKAR Committee Recmdn. 0.00 0.00 Sub Total 0.31 15.50 19.25 51.35 G OTHER NON MINING ACTIVITIES (Give break up of all Major activities. Small activities to be clubbed). 1 Constn. T/ship Nichit/Tetulmari 0.00 0.00 2 Constn. Township Amtal 1750 house 4/87 0.40 0.50 0.50 3 Constn. Township Bhimkanali 1750 house 4/87 0.40 0.50 0.50 4 Constn. Township Bhuli B 0.60 0.20 0.80 5 Constn. Township Bhuli for Rehab 6 Constn. Township Karmatand 1808 house 5/89 2.20 2.00 3.50 7 Constn. Township Noonidih 734 house 5/89 0.15 0.50 0.20 8 Direct Power Supply from DVC 9 Mines Rescue Services
10 Rehabitn. Of Populn.Fire Proje 0.00 4.70 11 Water treatment plant different Area 1.75 1.40 1.50 Sub Total 0.00 5.50 5.10 11.70 H EXPLORATION & others 17.59 13.70 30.75 35.00 P & D Activities--CMPDIL I Others 0.22 TOTAL NON MINING (F+G+H+I) 18.13 34.70 55.10 98.05 Grand Total 221.16 230.00 300.00 350.00

128
SCHEME- WISE- EXPENDITURE Fin 2
Subsidiary: Central Coalfields Ltd Rs CrsActual BE RE BE Sl No Name of the Project / Mine Sanction
Date Rated
capacity (MTY)
Sanct. Capital
(RS CRS)2008-09 2009-10 2009-10 2010-11
Total Existing & Completed Projects 144.96 249.68 132.50 59.00 Ongoing Projects 1 Amlo OC Mar-09 2.50 56.32 4.45 4.48 8.45 2.000 2 Ara RO OC Jan-90 0.76 19.86 3.60 1.100 17.50 1.000 3 Ashok Expn. OC Dec-07 10.00 Inc 317.41 5.44 4.200 5.00 2.200 4 Bokaro (Bermo Seam) OC Jul-95 0.80 46.78 0.63 3.300 2.50 0.300 5 Chainpur OC Mar-90 0.50 17.27 1.800 0.20 0.200 6 Karma OC Jun-09 1.00 162.46 0.77 2.25 2.50 3.000 7 Karo OC Aug-06 3.50 74.53 2.18 24.000 20.00 2.200 8 Konar OC Aug-06 3.50 96.53 29.003 21.00 1.200 9 Magadh OC Aug-08 20.00 706.40 7.46 8.000 2.20 3.700 10 N Urimari OC Dec-07 3.00 179.87 0.36 4.000 19.39 2.200 11 Piparwar OC Sept'06 10.00 Inc 58.48 18.36 21.260 15.40 24.000 12 Purnadih OC May-08 3.00 210.98 2.49 3.497 1.10 30.000 13 Rohini OC Sep-08 2.00 105.67 2.97 8.99 5.45 22.000 14 Tapin OC Aug-08 2.50 264.68 18.36 4.00 7.50 37.000 15 Tetariakhar OC Jul-93 2.00 78.60 0.49 2.050 6.10 2.000 16 Tarmi OC Mar-09 1.00 35.54 0.10 1.00 17 Topa OC RO Mar-02 1.20 65.25 3.06 4.61 7.50 1.00 18 Urimari Expn OC Jan-09 2.00 143.57 15.19 7.76 4.61 21.000 19 Amrapali OC AA Sep-01 12.00 8.89 48.75 1.00 0.50 20 Central Saunda UG Sep-87 0.48 19.43 0.96 0.300 0.75 0.2000 21 Churi-Benti UG Aug'07 0.81 Inc 145.44 0.20 7.000 15.00 74.000 22 Kargali (Bermo Seam) UG Dec-90 0.15 4.64 0.250 0.15 0.6000 23 Kuju SDL Jan-95 0.36 16.29 0.03 0.550 0.80 0.4000 24 Laiyo UG 0.38 9.68 0.03 0.000 24 Pindra SDL Mar-96 0.30 15.05 0.36 0.500 0.35 0.3500 25 Parej East UG May-08 0.51 142.67 3.000 0.10 1.0000 26 Urimari UG Jun-90 0.36 16.33 0.04 0.400 0.85 0.4500 Total Ongoing Projects 136.18 123.82 165.00 233.00
Future Projects (A) Xth Plan Projects - Under Approval
1 Amrapali 1.000 1.750 1.000 (B) XI th Plan Projects- To be formulated / under formulation
1 Ashok Expn(West) OCP 0.250 0.100 2 Chano-Rikba OC 3 Godo OC 4 Kedla EPR OC 0.500 0.400 5 Koed / Manatu OC 0.100 6 Pachra Integrated OC 0.100 7 Parej West OC 0.500 0.100 8 Pichri / Pichri Extn OC 9 Ramgarh - II West OC 10 Govindpur Ph - II OC 0.500 1.000 1.000 11 Piparwar Mangardaha UG 0.250 0.250 0.200 Sub Total B 0.00 2.00 1.25 2.00 Total Future Projects 0.00 3.00 3.00 3.00 TOTAL MINING PROJECTS 281.14 376.50 300.50 295.00 WASHERIES 2.23 6.50 5.00 20.00 NON MINING PROJECTS 19.18 10.50 18.00 10.00 EXPLORATION,CMPDI 32.29 26.50 26.50 25.00 TOTAL CCL 334.84 420.00 350.00 350.00

129
ANNUAL PLAN 2010-11 - NORTHERN COALFIELDS LIMITED
Scheme wise Expenditure & Investment Fin - 2 Rs.Crores
Sl. Name of the Project/ Type of Project Likely Likely Sanction Projection Coal- No. Mine Mine Status Sanct. Sanct. Date Actual Target RE 10-11 field
UG/OC PR/RPR/ Capacity Cost PR/RPR 08-09 09-10 09-10 BE RCE (Mty) (Rs.crs) RCE Total Existing & Completed Projects 73.18 241.44 250.67 150.02
C. ONGOING PROJECTS 1 Amlohri Expn. OC EPR 10.00 1896.96 19/5/06 13.39 155.89 21.73 309.04 SGR 2 Bina Extn. OC EPR 6.00 535.96 22/11/06 15.41 22.76 70.24 17.51 SGR 3 Block-B OC PR 3.50 746.04 7/7/06 35.50 36.25 9.25 33.70 SGR 4 Dudhichua Expn. OC RCE 15.00 1281.39 26/3/01 25.86 71.91 80.29 51.11 SGR 5 Krishnasila OC PR 4.00 789.88 19/5/06 28.40 47.26 8.79 40.60 SGR 6 Nigahi Expn. OC EPR 15.00 2105.89 8/10/07 58.56 98.00 105.45 136.27 SGR
Sub Total (C) 177.11 431.78 295.74 588.23 D. FUTURE PROJECTS
1 Khadia Expn. OC EPR 6.00 0.00 0.00 0.00 0.00 SGR 2 Jayant Expn. OC EPR 5.00 0.00 SGR 3 Kakri Extn. OC PR 3.00 SGR 4 1000MW Power Plant (NLC+NCL JV) 0.00 0.00 0.00 SGR 5 1000MW Power Plant (UPRVUNL+NCL JV) 0.00 0.00 0.00 SGR
Sub Total (D) 0.00 0.00 0.00 0.00 Total Mining 250.29 673.22 546.41 738.25 Total Non-Mining 16.23 56.78 53.59 61.75 GRAND TOTAL 266.52 730.00 600.00 800.00

130
SCHEMEWISE EXPENDITURE & INVESTMENT
Company: WESTERN COALFIELDS LIMITED Fin-2 Rs Crores
Gr. Name of the Type of Project Likely/Sanc. Sanct./Proj. Sanction B.E. 2009-10 R.E. 2009-10 B.E. 2010-11 No. Project/Mine Mine Status Capacity Cost Date ACTUAL
UG/OC PR/RPR/RCE (Mt) (Rs.Crs) PR & RPR 2008-09 1 2 3 4 5 6 7 8 9 10 11
A+B TOTAL EXISTING + COMPLETED PROJECTS 37.28 2538.18 185.20 114.00 152.16 172.50 C ONGOING PROJECTS AS ON 31/08/2009: 1 Durgarpur Ryt. 6,7,& 8 Inclines UG PR 0.32 13.64 04/01 1.08 1.04 2.49 2.73 2 Kumberkhani C.M. Scheme UG PR 0.18 10.87 04/06 3 Sarni Sch. (For working propoerty beyond D2
Dyke) UG RCE 0.14 8.35 10/05
4 Tawa - II UG PR 0.39 36.43 03/04 1.36 0.69 4.38 3.47 5 Waghoda UG PR 0.39 71.73 04/08 1.50 1.39 3.69 Ongoing Mines Dropped/Closed 31.31 SUB TOTAL UG 1.41 172.34 2.44 3.22 8.26 9.89 6 Bhanegaon OC PR 0.60 30.44 11/03 1.10 1.26 1.33 2.84 7 Bhatadih Expn. OC PR 0.65 99.68 05/07 4.03 17.12 22.71 16.64 8 Durgapur Expn. Deep OC PR 2.00 42.98 05/07 11.49 1.46 22.29 4.28 9 Gauri Deep OC PR 0.40 86.21 11/01 0.50 1.60 3.14 10 Gauri I & II Expn. Scheme OC SCH 1.80 13.00 04/07 2.96 6.82 5.65 11 Ghonsa RPR OC RPR 0.45 44.66 10/01 3.85 1.95 2.02 3.99 12 Ghugus Deep Scheme OC SCH 1.50 10.15 01/07 9.68 11.56 3.10 13 Gokul OC PR 1.00 79.83 06/06 0.09 0.85 0.10 2.40 14 Gondegaon Expn. OC PR 0.75 27.54 09/04 25.41 1.90 9.67 16.58 15 Inder UG to OC OC PR 0.60 38.23 12/04 0.12 0.48 0.37 0.70 16 Junad Extn. OC PR 0.60 38.76 11/07 10.88 15.59 5.82 17 Junakunada OC PR 0.60 23.76 03/03 0.43 1.31 18 Kolar pimpri Extn. OC PR 1.50 72.90 06/06 1.95 7.17 5.57 19 Kolgaon OC RPR 0.50 49.59 11/01 2.27 0.47 1.06 2.21 20 Makardhokra I OC PR 1.00 39.98 04/05 0.10 2.40 0.91 4.74 21 Pauni-II OC PR 0.60 28.11 11/03 0.55 0.05 0.12 22 Penganga (Mugoli Extn.) OC PR 3.00 339.77 10/08 0.30 0.90 23 Scheme for Ballarpur OC OC SCH 0.54 4.67 06/08 0.45 0.96 24 Scheme for Bellora / Naigaon Deep OC SCH 1.00 3.04 12/08 2.33 0.02 6.70 25 Scheme for Telwasa Expn. OC OC SCH 0.70 5.12 10/08 5.00 0.48 26 Scheme for Dhurwasa Expn. OC OC SCH 0.90 6.89 06/08 0.17 0.55 27 Scheme for Deepening Niljai OC OC SCH 2.10 4.83 04/09 28 Sasti Expn. OC SCH 1.40 16.80 11/04 4.00 0.66 3.96 29 Singori OC PR 0.80 48.72 03/04 0.17 2.05 1.12 1.39 30 Urdhan OC PR 0.50 43.50 07/02 1.37 7.23 2.93 31 Yekona -I OC PR 0.40 46.07 12/04 1.02 0.50 0.45

131
SCHEMEWISE EXPENDITURE & INVESTMENT Company: WESTERN COALFIELDS LIMITED Fin-2
Rs Crores Gr. Name of the Type of Project Likely/Sanc. Sanct./Proj. Sanction B.E. 2009-10 R.E. 2009-10 B.E. 2010-11 No. Project/Mine Mine Status Capacity Cost Date ACTUAL
UG/OC PR/RPR/RCE (Mt) (Rs.Crs) PR & RPR 2008-09 1 2 3 4 5 6 7 8 9 10 11 32 Yekona -II OC PR 0.60 48.06 08/03 1.60 0.50 1.35 SUB TOTAL OC 26.49 1293.28 48.63 67.20 119.18 98.73 TOTAL ONGOING (UG+OC): - TOTAL 27.90 1465.62 51.07 70.42 127.44 108.62 D FUTURE PROJECTS
D1. AWAITING APPROVAL: 1 Bhakra UG 0.27 55.28 0.05 1.50 2 Dhankasa UG 1.00 152.86 0.80 0.10 2.40 3 Dhau North UG 0.36 41.70 4 Harradol UG 0.14 16.36 2.05 1.28 5 Jamuniya UG 0.72 127.52 0.10 1.60 6 Maori Block with C.M. Package UG 0.90 67.50 0.65 7 Saonr Mine-I Expn. UG 0.75 68.17 1.20 8 Sharda UG 0.32 50.95 0.10 0.96 1.10 SUB TOTAL UG 4.45 580.35 2.75 3.26 7.88 9 Bellora / Naigaon Deep OC 1.00 114.41 10 Chincholi OC 0.30 24.64 11 Dhuptala ( Sasti UG to OC) OC 1.70 194.11 0.75 12 Dinesh (Makardhokra - III) OC 3.00 496.40 0.25 0.30 13 Motagaht OC 1.25 144.29 14 New Majri UG to OC OC 0.80 72.57 0.80 0.15 0.35 15 Pauni-III (Sakhari - Irawati) OC 1.25 173.57 0.50 1.87 16 Ukni Deep OC 2.00 311.61 0.55 17 Yekona - I Extn. OC 0.50 225.70 SUB TOTAL oc 11.80 1757.30 2.10 0.90 2.52 TOTAL AWAITING APPROVAL 16.25 2337.64 4.85 4.16 10.40
D2. TO BE FORMULATED: 1 Antargaon UG 0.50 120.00 2 Borda UG 4.00 600.00 0.80 3 Chatarpur - III / Umri UG 0.29 3.58 4 Dhanwa UG 0.50 150.00 5 Gandhigram UG 1.17 593.04 6 Mathra Incl. Extn. UG 0.40 60.00 7 Murpar Expn.(Including Bhansuli&Surmanjari
UG) UG 3.00 400.00
8 Nand UG 0.70 135.89 9 Nokoda South UG UG 0.60 90.00 10 Pauni Deep Expn. UG 0.50 90.00 11 Pisgaon UG 0.24 105.00

132
SCHEMEWISE EXPENDITURE & INVESTMENT Company: WESTERN COALFIELDS LIMITED Fin-2
Rs Crores Gr. Name of the Type of Project Likely/Sanc. Sanct./Proj. Sanction B.E. 2009-10 R.E. 2009-10 B.E. 2010-11 No. Project/Mine Mine Status Capacity Cost Date ACTUAL
UG/OC PR/RPR/RCE (Mt) (Rs.Crs) PR & RPR 2008-09 1 2 3 4 5 6 7 8 9 10 11 12 Shakithgarh UG 2.00 150.00 13 Thesgora - C UG 0.30 60.00 SUB TOTAL UG 14.20 2557.51 0.80
14 Antargaon OC 1.60 100.00 15 Bhatadi North - West OC 0.70 400.00 16 Chikalgaon / Chinchala OC 4.50 1357.30 17 Ghonsa Extn. (Including Parsoda UG) OC 0.60 50.00 18 Junakunda Deep OC 0.60 50.00 19 Kamptee Deep OC 1.50 375.36 20 Kolgaon Deep OC 0.40 50.00 21 Mugoli / Nirguda Deep OC 1.50 150.00 22 New Majri Sector A Extn. OC 1.50 100.00 23 Niljai Deep OC 2.50 400.00 24 Nokoda UG to OC OC 0.50 50.00 25 Padmapur Deep OC 2.00 501.16 26 Pauni-II Deep OC 0.60 50.00 27 Pauni Deep OC 2.00 500.00 28 Yekona - II Extn. OC 1.00 400.00 SUB TOTAL OC 21.50 4533.82 TOTAL TO BE FORMULATED: UG + OC 35.70 7091.33 0.80 FUTURE PROJECTS UG 18.65 3137.86 3.55 3.26 7.88 OC 33.30 6291.12 2.10 0.90 2.52 TOTAL 51.95 9428.97 5.65 4.16 10.40 ADVANCE ACTION PROJECTS ONGOING A.A. FUTURE A.A. TOTAL MINING: - TOTAL 117.13 13432.77 236.27 190.07 283.75 291.52 E NON-MINING WASHERIES: 1 Nandan Washery 30.85 0.36 0.18 1.40 0.15 2 Scheme for Spiral concentrator 3.00 TOTAL WASHERIES 30.85 0.36 0.18 1.40 3.15 OTEHR NON-MINING ACTIVITIES: 6.54 14.76 27.85 18.34
F. EXPLORATION + P & D 34.75 25.00 37.00 37.00 TOTAL NON-MINING (G + H): 131.81 41.65 39.94 66.25 58.49 GRAND TOTAL 117.13 13595.43 277.92 230.00 350.00 350.00

133
COMPANY: SOUTH EASTERN COALFIELDS LIMITED
Figures in Rs Crs NAME OF THE
PROJECT / MINE Type
of Mines
DATE OF SANC.
Total approved
cost (Rs Crs)
AREA NAME OF STATE
ACTUAL 08-09
BE 09-10
RE 09-10
BE 10-11
Proj. 11-12
A EXISTING MINES UG 6.02 3.05 3.05 1.66 1.45 OC 0.00 0.00 0.00 0.00 0.00 TOTAL (A) EXISTING 6.02 3.05 3.05 1.66 1.45 B COMPLETED PROJECTS
UG 40.07 12.11 12.11 11.09 11.55 OC 121.23 24.76 24.76 27.45 23.50 TOTAL (B) COMPLETED 161.30 36.87 36.87 38.54 35.05 C ONGOING MINING PROJECTS 1 NAWAPARA UG UG 23-Oct-00 42.55 CIC-BHAT CG 4.15 4.00 4.00 5.000 1.50 2 MAHAN OC OC 4-Jun-98 41.95 CIC-BHAT CG 6.79 1.00 1.00 3.000 3.00 3 GAYATRI UG UG 8-Apr-99 21.91 CIC-BIS CG 0.15 3.00 3.00 3.000 3.00 5 NCPH SEAM V / R6 UG UG 21-Dec-02 49.29 CG 0.00 0.00 0.000 6 RANI ATARI UG 21-Jul-99 48.54 CIC-CHR CG 1.29 2.00 2.00 5.000 5.00 7 KURJA
UG/SHEETALDHARA UG UG 23-May-00 98.98 CIC-HSD MP 7.16 19.00 19.00 4.000 5.00
8 JHIRIA UG UG 23-Oct-00 32.06 CIC-HSD MP 22.37 0.00 0.00 0.000 9 BARTARAI UG/
AMADAND UG UG 21-Jul-99 45.26 CIC-J&K MP 1.72 1.11 1.11 1.000 0.50
10 PINOURA AUG PR UG 27-Mar-98 49.92 CIC-JHL MP 0.04 2.00 2.00 3.000 2.00 11 VINDHYA UG AUG RPR UG 27-Mar-98 49.90 CIC-JHL MP 0.24 3.00 3.00 2.000 2.00 12 KANCHAN OC OC 29-May-03 23.91 CIC-JHL MP 0.45 1.00 1.00 0.500 0.50 13 DAMINI UG UG 5-Apr-00 39.32 CIC-SGP MP 2.94 3.00 3.00 6.000 7.00 14 AMERA OC OC 25-Jul-02 41.69 CG 1.85 4.00 4.00 3.000 4.00 15 GEVRA EXPN. OC (25.00
MTY) OC 12-Jul-05 1667.55 K-G CG 317.20 91.16 103.61 70.000 76.50
16 DIPKA EXPN. OC (20.00 MTY)
OC 12-Jul-05 1268.53 K-G CG 107.33 128.53 128.53 92.000 70.00
17 MAHAN II OC 17.00 17.00 5.000 5.00 18 AMADAND OC OC 25-Sep-03 83.39 CIC-J&K MP 0.01 1.00 1.00 1.000 1.00 19 KIUSMUNDA EXPN. OC
10.00 MTY 108.13 115.00 115.00 75.000 50.00
20 SARAIPALLI OC OC 22-Feb-03 22.82 K CG 0.01 4.00 4.00 2.000 5.00 21 CHAAL OC OC 29-May-03 19.99 CG 12.70 6.00 6.00 2.000 1.00 22 BAROUD EXPN. OC OC 29-May-03 28.02 K-RAI CG 1.16 5.00 5.00 2.000 4.00 23 AMGOAN OC OC 24-Jun-04 39.28 CIC-BIS CG 10.00 2.50 6.000 10.00 24 KHAIRAHA UG UG 25-Sep-03 88.33 CIC-SGP MP 10.00 2.50 4.000 6.00 25 KETKI UG UG 14-Nov-03 46.24 CIC-BIS CG 10.00 2.50 8.000 9.00 26 BINCARA UG UG 24-Jan-04 41.98 CIC-BIS CG 5.00 2.50 12.000 10.00 27 VIJAY WEST UG UG 8-Apr-04 63.56 CIC-CHR CG 0.99 7.30 2.30 10.000 6.00 28 HALDIBARI UG UG 15-Oct-03 47.92 K CG 1.36 4.00 4.00 10.000 4.00 29 JAMPALI OC 3.00 1.00 3.000 10.00 30 AMBICA OC 2.00 0.50 3.000 10.00 31 BIJARI OC 1.00 0.50 2.000 5.00 32 KARTALI EAST OC 1.00 1.00 3.000 5.00 33 BATURA OC 0.00 0.500 3.00 34 JAGANNATHPUR OC 0.00 0.500 3.00 35 PELMA OC 5.00 1.00 5.000 10.00 UG 44.17 74.66 56.16 77.00 73.00 OC 579.98 448.10 524.37 401.39 392.50 TOTAL (C) ONGOING 624.14 522.76 580.53 478.39 465.50 UG 35.84 42.11 42.11 30.00 26.50 OC 0.46 2.00 2.00 1.50 1.50 TOTAL © MP 36.30 44.11 44.11 31.50 28.00 UG 8.33 32.55 14.05 47.00 46.50 OC 579.51 446.10 522.37 399.89 391.00 TOTAL © CG 587.84 478.65 536.42 446.89 437.50 D FUTURE PROJECTS XI-th PLAN PROJECTS 0.000
36 PATHAKPUR UG 0.000 5.00 37 JAMDAI UG 0.000 2.00 38 GUMGARA UG 0.000 2.00 39 VIJAY EAST UG 0.000 2.00 40 BAKULMUNI UG 0.500 3.00

134
COMPANY: SOUTH EASTERN COALFIELDS LIMITED Figures in Rs Crs
NAME OF THE PROJECT / MINE
Type of
Mines
DATE OF SANC.
Total approved
cost (Rs Crs)
AREA NAME OF STATE
ACTUAL 08-09
BE 09-10
RE 09-10
BE 10-11
Proj. 11-12
41 RAI EAST OC 0.000 42 PORDA OC 0.000 43 CHIMTAPANI OC 0.500 5.00 44 DURGAPUR OC 1.000 5.00 45 BORI / BODRI NORTH UG 0.000 2.00 46 AMRITDHARA UG 0.500 2.00 47 AMBA UG 1.00 UG 0.00 0.00 1.00 19.00 OC 109.32 0.00 1.50 13.00 TOTAL (D) 109.32 0.00 2.50 32.00 UG 0.00 0.00 1.00 7.00 OC 0.00 0.00 0.00 3.00 TOTAL MP 0.00 0.00 1.00 10.00 UG 0.00 0.00 0.00 12.00 OC 109.32 0.00 1.50 13.00 TOTAL CG 109.32 0.00 1.50 25.00 E ADVANCE ACTION PROJECTS 48 BADAULI EXTN UG 1.00 TOTAL UG 90.25 89.82 71.32 90.75 106.00 TOTAL OC 701.21 582.18 549.13 430.34 429.00 TOTAL (A+B+C+D) 791.46 672.00 620.45 521.09 535.00 UG 39.88 42.72 24.22 55.62 68.15 OC 664.00 568.18 535.13 418.44 418.00 TOTAL CG 703.89 610.90 559.35 474.06 486.15 UG 50.37 47.10 47.10 35.13 37.85 OC 37.21 14.00 14.00 11.90 11.00 TOTAL MP 87.57 61.10 61.10 47.03 48.85 TOTAL SECL 791.46 672.00 620.45 521.09 535.00 NON-MINING
PROJECTS
1 AREA Hqs 5.23 7.62 7.62 7.500 8.00 2 HOSPITALS 0.78 2.50 2.50 0.500 0.50 3 REGIONAL STORES 0.44 0.50 0.50 0.200 0.20 4 REGIONAL WORKSHOPS 0.27 0.50 0.50 0.200 0.20 5 OTHERS 0.50 0.50 0.200 0.20 NON MINING EXIST/COMPLETED PROJECTS 6.72 11.62 11.62 8.600 9.10 NON-MINING ONGOING
1 AREA HQS BHATGOAN CIC-BHAT CG 1.96 0.00 0.00 0.500 0.50 2 COMM ALL AREAS SECL
HQS HQ HQ 0.00 0.00 0.000
3 GM COMPLEX RAIGARH AREA
CIC-RAI CG 0.00 0.00 0.000
4 HOSPITAL MULTI SPS. BSP
HQ CG 0.00 0.00 0.000
5 RESCUE SERVICES HQ 0.01 0.00 0.00 0.200 0.20 6 SAFETY,HQ HQ HQ 2.25 5.00 5.00 5.000 5.00 7 SHAFT RAJ. WINDER &
VENT RO CIC-HSD MP 0.00 0.00 0.000
8 SHAFT VENT CHURCHA (W)
CIC-BKP CG 0.00 0.00 0.000
9 CENT. W/S & STORES HQ 0.50 0.50 2.000 1.50 10 R & D & OTHERS HQ 0.50 0.50 0.500 0.70 NON-MINING ONGOING 4.22 6.00 6.00 8.200 7.90 NON MINING
FORMULATED 0.00 0.00 0.000
AWAITING APPROVAL 0.00 0.00 0.000 NON MINING YET TO BE FORM 0.00 0.00 0.000 * NON MINING
EXPLORATION HQ 53.58 40.38 61.93 62.110 48.00
GRAND TOTAL TOTAL NON MINING 64.52 58.00 79.55 78.91 65.00 TOTAL MINING 791.46 672.00 620.45 521.09 535.00 TOTAL SECL 855.98 730.00 700.00 600.00 600.00

135
Schemewise Expenditure & Investment
Company :Mahanadi Coalfields Limited Fin 2 Rs.CroresGr. Name of the Type
of Project Likely /
SanctionLikely / Sanction
Sanction
No. Project/Mine Mine Status Capacity Cost Date Actual Actual (BE) (RE) (BE) UG/OC PR/RPR/RCE (Mt) (Rs.Crs) 07-08 08-09 09-10 09-10 10-11
MINING A+B Existing & Completed Projects 121.41 85.95 187.01 226.60C. ONGOING PROJECTS
1 Ananta Expn. Ph-III OC 3.00 207.28 Aug-08 1.00 5.98 2 Balram OC Extn. OC 0.00 172.08 Dec-07 78.76 66.79 8.00 26.74 2.33 3 Basundhara (West) Expn. OC 4.60 46.52 Mar-09 5.97 4 Bharatpur Expn. Ph-II OC 6.00 95.87 Jul-03 5 Bharatpur OC Expn. Ph-III OC 9.00 131.39 Feb-07 10.81 1.80 45.83 37.856 Bhubaneswari OC 20.00 449.10 Dec-07 6.21 16.84 13.50 5.69 10.727 Gopalprasad OC 15.00 395.87 Feb-08 1.10 2.13 3.90 8 HBI Augmentation UG 0.42 27.86 Apr-07 3.00 11.00 5.50 5.50 9 Hingula Expn. Ph-III OC 7.00 479.53 Nov-08 10.05
10 Jagannath UG 0.67 80.75 Mar-02 0.03 0.20 0.10 2.50 11 Kaniha OC 10.00 457.77 Dec-07 16.34 13.40 9.80 12.87 14.4312 Kulda OC 10.00 302.96 Jan-05 0.12 1.89 7.75 10.36 14.5813 Lajkura OC Expn. OC 1.50 43.27 Jun-09 5.36 14 Lakhanpur Expansion OC 5.00 98.74 Feb-04 9.17 1.60 15 Lakhanpur OC Expn.Ph-II OC 5.00 116.54 Sep-08 16.24 20.5016 Natraj UG 0.64 92.11 Jan-01 13.34 0.03 0.20 2.18 3.09 17 Talabira OC 20.00 447.72 Mar-08 1.20 1.10 6.06 18 Talcher (West) UG 0.52 85.08 Feb-03 0.20 3.66 3.51
Others 1 Hingula-II Expn. Ph-I OC 0.00 2 Hingula-II Expn. Ph-II OC 4.70 3 Samleswari Expn. Ph-III OC 13.50
Total Others 18.20 UG 2.25 285.80 13.34 3.06 11.60 11.44 14.60 OC 116.10 3444.64 101.43 118.90 63.95 120.96 137.73 Sub-Total (C) 118.35 3730.44 114.77 121.96 75.55 132.40 152.33 D. FUTURE PROJECTS D-1 Awaiting approval
1 Garjanbahal OC 10.00 291.95 0.90 2 Kaniha-II OC 10.00 732.13 0.10
D-2 To be formulated 1 Kaniha OC Expn. OC 10.00 2 Madhupur OC 2.00 3 Siarmal OC 15.00 4 Siarmal (West) Extn. OC 15.00
Others 1 Basundhara (West) Expn. OC 2 Hingula-II Expn Ph-III. OC 0.20 3 Lakhanpur OC Expn.Ph-II OC 0.40
Total Others 0.60 UG OC 62.00 1024.08 0.00 0.00 1.60 0.00 0.00 Sub-Total (D) 62.00 1024.08 0.00 0.00 1.60 0.00 0.00 E. ADVANCE ACTION PROPOSAL/PROJECTS
(A) ON GOING AA
(B) FUTURE AA 1 Balabhadra OC 6.00 2 Balram OC Expn. OC 4.00 3 Chhendipada OC Expn. OC 5.00 UG

136
Schemewise Expenditure & Investment Company :Mahanadi Coalfields Limited Fin 2 Rs.CroresGr. Name of the Type
of Project Likely /
SanctionLikely / Sanction
Sanction
No. Project/Mine Mine Status Capacity Cost Date Actual Actual (BE) (RE) (BE) UG/OC PR/RPR/RCE (Mt) (Rs.Crs) 07-08 08-09 09-10 09-10 10-11
OC 15.00 0.00 0.00 0.00 0.00 0.00 0.00 0.00 Sub Total (E) 15.00 0.00 0.00 0.00 0.00 0.00 0.00 0.00 TOTAL MINING (A+B+C+D+E) 269.67 7046.30 204.77 243.37 163.10 319.41 378.93(F) WASHERIES A. Existing and completed project B. On Going Projects Basundhara Washery 20.00C Future Projects Jagannath Washery Hingula Washery Ib valley Washery TOTAL WASHERIES
(A+B+C) 20.00
(G) OTHER NON-MINING ACTIVITIES 1 Jahrsuguda-Barpali Railway
Line 5.00 80.00
2 Doubling of Jahrsuguda-Barpali Railway Line
0.00
3 Kilinga-Angul Link 6.00 1.00 4 Re-organisation of Ananta
RS 5.00
5 Railway Line to Bhubanewsari SILO
0.00
6 Railway Line to Hingula SILO
0.00
7 SILO loading arrangement at Ananta
50.00
8 SILO loading arrangement at Lingaraj
40.00
9 SILO loading arrangement at Lakhanpur
0.00
10 SILO loading arrangement at Kulda
0.00
11 Concrete Road Network at Talcher CF
30.00
12 Concrete Road Network at Ib Valley CF
0.00
13 Other Non-Mining Projects 67.59 57.89 16.90 39.59 10.00 Sub Total 67.59 57.89 16.90 50.59 216.00(H) EXPLORATION+CMPDI & P&D EXPENDITURE 3.80 20.00 20.00 30.00 35.07 TOTAL NON-MINING 71.39 77.89 36.90 80.59 271.07 MINING 269.67 7046.30 204.77 243.37 163.10 319.41 378.93 WASHERIES 0.00 0.00 0.00 0.00 0.00 0.00 20.00 NON MINING 0.00 0.00 71.39 77.89 36.90 80.59 251.07 TOTAL 269.67 7046.30 276.16 321.26 200.00 400.00 650.00

137
ANNUAL PLAN 2010-11 - MoC COMPANY-WISE, SCHEME-WISE EXPENDITURE AND INVESTMENT
Company: SCCL (RS. CRS.) TOTAL COST DATE OF COMPLETION. X Plan (2002-07) 2006-07 2007-08 2008-09 2009-10 2010-11 CAP Org. Latest NOW Cumulative Cumulative (ACT.) (ACT.) (ACT.) Apprvd. Ant. Proposed
SL. NAME OF THE (mtpa) SANC. ANT. Approved Rev. ANT. Exp. Exp. EXP. EXP. EXP. Outlay Expdr Outlay NO. PROJECT/MINE. during upto B.E. R.E. B.E.
X Plan X Plan 2002-2007 31.03.2007 I. MINING:
A. EXISTING PROJECTS (AMRs) a) AMRs Sanctioned by Competent Authority. i) Additions. - Nil ii) Modifications. - Nil iii) Replacements. 126.80 521.75 25.62 21.66 4.37 11.00 3.40 3.38 b) AMRs yet to be Sanctioned by Competent
Authority. 0.00 0.00
i) Additions. - Nil 0.00 0.00 ii) Modifications. - Nil 0.00 0.00 iii) Replacements. -Nil 0.00 0.00 SUB-TOTAL - A 126.80 521.75 25.62 21.66 4.37 11.00 3.40 3.38 B COMPLETED PROJECTS (AMRs) 0.00 0.00 a) AMRs Sanctioned by Competent Authority. 0.00 0.00 i) Additions. - Nil 0.00 0.00 ii) Modifications. - Nil 0.00 0.00 iii) Replacements. 690.44 4293.71 197.75 360.67 245.17 80.60 133.80 105.37 b) AMRs yet to be Sanctioned by Competent
Authority. 0.00 0.00
i) Additions. - Nil 0.00 0.00 ii) Modifications. - Nil 0.00 0.00 iii) Replacements.-Nil 0.00 0.00 SUB-TOTAL - B 690.44 4293.71 197.75 360.67 245.17 80.60 133.80 105.37 C ON GOING PROJECTS 0.00 0.00 i) Projects sanc. before & during VII Plan. 0.00 0.00 a) As per Sanctioned Capital (Initial Capital only) 12.35 28.26 2.95 4.93 4.81 9.00 3.00 2.80 b) AMRs 0.00 0.00 1 AMRs sanctioned by Competent authority. - Nil 0.00 0.00 2 AMRs yet to be sanctioned by Competent authority. - Nil -130.83 -130.83 TOTAL - C(i): -118.48 -102.57 2.95 4.93 4.81 9.00 3.00 2.80
ii) Projects sanc. during VIII Plan 0.00 0.00 a) As per Sanctioned Capital (Initial Capital only) 38.24 48.96 6.14 0.05 0.00 0.00 0.00 0.00 b) AMRs 0.00 0.00 1 AMRs sanctioned by Competent authority. - Nil 0.00 0.00 2 AMRs yet to be sanctioned by Competent authority. - Nil 0.00 0.00 TOTAL - C(ii): 38.24 48.96 6.14 0.05 0.00 0.00 0.00 0.00
iii) Projects sanctioned during IX Plan. 0.00 0.00

138
ANNUAL PLAN 2010-11 - MoC COMPANY-WISE, SCHEME-WISE EXPENDITURE AND INVESTMENT Company: SCCL (RS. CRS.)
TOTAL COST DATE OF COMPLETION. X Plan (2002-07) 2006-07 2007-08 2008-09 2009-10 2010-11 CAP Org. Latest NOW Cumulative Cumulative (ACT.) (ACT.) (ACT.) Apprvd. Ant. Proposed
SL. NAME OF THE (mtpa) SANC. ANT. Approved Rev. ANT. Exp. Exp. EXP. EXP. EXP. Outlay Expdr Outlay NO. PROJECT/MINE. during upto B.E. R.E. B.E.
X Plan X Plan 2002-2007 31.03.2007
a) As per Sanctioned Capital (Initial Capital only) 141.71 145.33 63.00 26.96 28.76 20.00 35.79 5.00 b) AMRs 0.00 0.00 1 AMRs sanctioned by Competent authority. - Nil 0.00 0.00 2 AMRs yet to be sanctioned by Competent authority. - Nil 0.00 0.00 TOTAL - C(iii): 141.71 145.33 63.00 26.96 28.76 20.00 35.79 5.00
iv) Projects sanctioned during X Plan upto the period. 0.00 0.00 a) As per Sanctioned Capital (Initial Capital only) 152.91 152.95 25.94 57.00 216.86 354.60 291.14 384.38 b) AMRs 0.00 0.00 1 AMRs sanctioned by Competent authority. - Nil 0.00 0.00 2 AMRs yet to be sanctioned by Competent authority. - Nil 0.00 0.00 TOTAL - C (iv): 152.91 152.95 25.94 57.00 216.86 354.60 291.14 384.38 SUB-TOTAL - C 345.21 375.51 98.02 88.94 250.43 383.60 329.93 392.18 D NEW PROJECTS. - X PLAN PROJECTS. 0.00 0.00 i) Formulated Awaiting Approval. 3.86 4.55 2.60 0.00 1.85 0.00 90.00 135.00 ii) Yet to be Formulated Projects. 0.00 0.03 0.75 0.00 0.00 0.00 SUB-TOTAL-D: 3.86 4.58 2.60 0.00 2.60 0.00 90.00 135.00 TOTAL MINING (A+B+C+D) 1166.31 5195.55 324.00 471.27 502.57 475.20 557.13 635.93 E Advance Action Plans Sanctioned for New Projects. - Nil 0.00 0.00 II. WASHERIES - NOT APPLICABLE 0.00 0.00 III. NON-MINING. 0.00 0.00
A&B EXISTING & COMPLETED PROJECTS. (AMRs) 84.30 201.74 30.79 33.51 124.89 15.00 42.91 71.00 SUB-TOTAL - A&B 84.30 201.74 30.79 33.51 124.89 15.00 42.91 71.00
C ON-GOING PROJECTS. 0.00 0.00 a) As per Sanc. Capital. 194.98 338.44 90.26 66.55 19.30 81.87 7.35 85.00 b) AMR. 0.00 0.00 SUB-TOTAL - C 194.98 338.44 90.26 66.55 19.30 81.87 7.35 85.00
D NEW PROJECTS (X Plan). 0.00 0.00 i) Formulated awaiting approval. 0.00 5.69 0.00 2.10 2.18 5.50 24.05 540.00 ii) Yet to be formulated. 0.00 0.00 SUB-TOTAL-D: 0.00 5.69 0.00 2.10 2.18 5.50 24.05 540.00
E EXPLORATION. 5.00 116.48 3.58 0.54 1.50 3.00 2.50 3.00 TOTAL NON-MINING (A+B+C+D+E): 284.28 662.35 124.63 102.70 147.87 105.37 76.81 699.00 GRAND TOTAL:(I+II+III) 1450.59 5857.90 448.63 573.97 650.44 580.57 633.94 1334.93 I. MINING: 0.00 0.00 A EXISTING PROJECTS (AMRs) 0.00 0.00 a) AMRs Sanctioned by Competent Authority. 0.00 0.00 i) Additions. - Nil 0.00 0.00 ii) Modifications. - Nil 0.00 0.00

139
ANNUAL PLAN 2010-11 - MoC COMPANY-WISE, SCHEME-WISE EXPENDITURE AND INVESTMENT Company: SCCL (RS. CRS.)
TOTAL COST DATE OF COMPLETION. X Plan (2002-07) 2006-07 2007-08 2008-09 2009-10 2010-11 CAP Org. Latest NOW Cumulative Cumulative (ACT.) (ACT.) (ACT.) Apprvd. Ant. Proposed
SL. NAME OF THE (mtpa) SANC. ANT. Approved Rev. ANT. Exp. Exp. EXP. EXP. EXP. Outlay Expdr Outlay NO. PROJECT/MINE. during upto B.E. R.E. B.E.
X Plan X Plan 2002-2007 31.03.2007
iii) Replacements. 126.80 521.75 25.62 21.66 4.37 11.00 3.40 3.38 b) AMRs yet to be Sanctioned by Competent Authority. 0.00 0.00 i) Additions. - Nil 0.00 0.00 ii) Modifications. - Nil 0.00 0.00 iii) Replacements.-Nil 0.00 0.00 SUB-TOTAL - A: 126.80 521.75 25.62 21.66 4.37 11.00 3.40 3.38
B Completed Projects. 0.00 0.00 a) AMRs Sanctioned by Competent Authority. 0.00 0.00 i) Additions. - Nil 0.00 0.00 ii) Modifications. - Nil 0.00 0.00 iii) Replacements. 0.00 0.00 1 K.T.K.-1&1A. 0.300 44.19 44.19 3/94 3/97 3/97 16.80 53.21 3.01 4.59 7.79 1.00 1.10 1.00 2 I.K.-1 & 1A. 0.500 46.11 46.11 3/89 3/97 3/98 5.73 46.13 0.17 1.34 1.00 1.00 0.30 3 KTK-5. 0.410 40.19 40.19 3/95 3/2004 3/2004 14.89 40.63 2.30 3.76 2.09 1.00 2.49 0.87 4 KTK-2&2A. 0.416 35.35 33.27 3/95 3/2005 Sep.04 24.11 51.31 5.43 6.95 3.19 1.00 4.30 0.50 5 SDLs in RK-6 and KTK-1 &1A Incs. 0.320 5.05 5.05 2007-08 2007-08 0.62 0.62 6 KTK-3. 0.572 47.33 47.33 3/2003 3/2007 3/2007 26.33 36.74 1.79 7 GOLETI -2 INCLINE. 0.070 5.60 4.31 3/87 3/87 0.00 7.79 8 BPA. OC.I 11.27 10.25 3/87 3/87 0.00 16.03 9 BPA.OC-II. 0.400 19.00 25.83 3/91 3/93 2.20 33.47
10 Goleti-1 Extn. 11 GOLETI-1A 0.240 18.05 18.05 3/2005 3/2006 21.93 21.93 1.72 9.99 0.46 1.00 2.20 0.60 12 GOLETI-1 INCLINE. 0.161 2.04 3.16 3/83 3/87 4.04 14.09 1.00 1.63 2.00 13 BPA OC-II EXTN. 0.400 35.51 35.51 2007-08 2007-08 2.56 2.56 2.25 10.20 3.96 10.00 7.10 1.00 14 V.K.-7 LONGWALL. 0.385 15.90 13.94 3/87 3/87 0.00 15.17 15 HEMACHANDRAPURAM (RCE WITH DERATION ) 0.140 12.80 12.80 3/94 3/94 3/94 3.84 16.17 3.84 16 VK-7 RECONSTN. MINI LONGWALL. 0.250 13.20 13.20 3/96 3/96 0.00 12.69 17 PADMAVATIKHANI. 1.200 196.17 181.88 3/2000 3/97 8.89 193.84 0.33 9.58 1.00 14.00 18 VK-7 INC. 0.250 40.21 40.21 3/98 3/98 1.33 35.62 6.60 7.74 19 G.K. OCP. 2.000 415.93 159.74 3/2002 3/2002 24.10 142.41 4.17 27.82 8.23 5.00 13.00 7.00 20 Continuous Miner at PVK-5 Inc. 0.400 48.30 48.30 2007-08 2007-08 0.00 0.00 21 JVR OC-I (SATHUPALLI) 1.100 91.24 91.24 3/2008 3/2008 3/2008 49.18 49.18 10.67 26.90 23.98 10 JVR OC1 EXPANSION 0.17 0.17 0.17 0.00 10.00 5.06 6.25 22 MVK-1 INCLINE. 0.138 2.01 2.59 3/80 3/82 0.01 5.74 23 MVK-2 INCLINE. 0.075 2.03 1.16 3/80 3/85 0.00 2.18 24 MVK-3 INCLINE. 0.075 2.05 1.02 3/82 3/85 0.00 2.95 25 MVK-5 INCLINE. 0.075 1.98 0.99 3/82 3/82 0.00 4.92 26 MVK-6 INCLINE. 0.057 0.83 0.84 3/83 3/85 0.00 3.31

140
ANNUAL PLAN 2010-11 - MoC COMPANY-WISE, SCHEME-WISE EXPENDITURE AND INVESTMENT Company: SCCL (RS. CRS.)
TOTAL COST DATE OF COMPLETION. X Plan (2002-07) 2006-07 2007-08 2008-09 2009-10 2010-11 CAP Org. Latest NOW Cumulative Cumulative (ACT.) (ACT.) (ACT.) Apprvd. Ant. Proposed
SL. NAME OF THE (mtpa) SANC. ANT. Approved Rev. ANT. Exp. Exp. EXP. EXP. EXP. Outlay Expdr Outlay NO. PROJECT/MINE. during upto B.E. R.E. B.E.
X Plan X Plan 2002-2007 31.03.2007
27 K.K.-2A 14.80 3.25 3/93 3/93 0.00 2.99 28 KASIPET. 0.180 10.41 10.41 3/98 3/2000 5.98 17.72 1.99 1.38 0.80 0.72 0.40 29 SHANTI KHANI EXTN. PHASE-I. 0.190 18.32 20.50 3/97 Sep.04 7.95 22.39 0.70 3.63 1.42 0.70 6.00 30 MNG.OC-I. 0.800 18.84 18.50 3/85 3/85 3/83 0.00 60.35 31 P.K.-1 INCLINE. 0.188 4.69 5.97 3/81 3/85 6.02 20.59 0.69 35.14 0.16 0.09 1.00 32 P.K.-2 INCLINE. 0.116 4.91 4.25 3/81 3/87 1.80 10.53 0.10 0.00 33 P.K.-3 3/85 3/87 0.00 6.89 24 MNG.OC-II.1 2.750 199.95 196.93 3/90 3/92 3/92 56.19 294.18 11.15 65.30 15.35 7.00 9.00 25 CENT. OC MNG.2 0.600 19.84 20.13 3/93 3/92 2.05 39.29 0.00 26 MNG. OC-III.3 0.500 25.10 25.10 2007-08 2007-08 12.67 12.72 3.85 0.89 0.70 26 MNG. OC-IV.4 1.250 21.95 21.95 3/2005 3/2003 5.24 7.00 1.29 31.96 4.00 27 GDK-7/9 LW 3/86 3/85 0.00 10.48 28 GDK-7 LIFE EXTN. 0.180 10.14 10.14 3/97 3/96 4.04 16.14 1.28 1.74 0.76 1.00 4.03 1.00 29 MEDAPALLI OCP. 1.250 219.82 99.58 3/2001 3/2001 27.54 72.61 3.34 12.72 6.18 1.00 30 GDK-5 LHDS. 0.180 7.53 7.53 3/2000 3/2002 0.10 3.74 31 GDK-5 0.180 7.53 7.53 3/2000 3/2002 0.10 3.74 5.17 1.00 0.90 32 GDK-5,GDK-6B,GDK-9 SDLs. 0.243 5.72 3.66 3/2004 3/2004 4.83 4.83 33 GDK-6B BG-I 0.330 36.91 36.91 3/2003 3/2003 15.14 28.87 34 RG.OC-I. 2.4 81.78 82.94 3/85 3/86 3/88 18.95 268.71 1.87 9.97 35 RG.OC-I EXP. 1.500 49.18 88.10 3/2008 3/2008 42.50 42.50 14.45 25.62 14.34 10.00 6.25 6.25 35 G.D.K.-9&9A INCS. 0.625 8.71 8.16 3/80 3/82 3/82 14.82 42.28 5.39 1.78 0.00 4.00 0.00 2.00 36 G.D.K.-8 & 8 A INCS. 0.613 6.47 9.62 3/82 3/86 19.43 51.96 4.54 2.41 0.92 37 GDK-9 AUG. 0.00 3.42 38 GDK-8 MECH. 3/92 3/93 0.00 1.04 39 GDK-10 BG METHOD AND LHD 0.250 39.20 39.20 3/95 3/94 5.26 43.89 0.00 0.75 6.00 40 RG.OC-III. 2.750 535.03 534.17 3/95 3/95 3/95 100.44 559.72 30.56 8.87 35.06 8.75 9.00 41 G.D.K.-10A. SDL & LW 0.770 116.53 118.24 3/92 3/95 3/95 19.01 149.02 3.97 22.50 38.62 1.00 14.32 2.00 42 VAKILPALLI BLOCK-A. 0.510 88.80 88.80 3/95 3/96 3/96 1.50 70.42 0.00 1.12 43 GDK-8 BG METHOD FOR DEVELOPED PILLARS. 0.200 36.47 36.47 3/96 3/96 0.40 39.12 44 GDK-8 BG-II 0.300 44.33 44.33 3/2001 3/2001 5.73 29.33 0.16
1.91
0.75 3.00
45 DRIVAGE OF TUNNELS GDK.9 INC. 5.58 5.58 3/97 3/2001 0.00 13.91 46 Continuous Miner at GDK-8 Inc. 0.240 20.78 20.78 2007-08 2007-08 0.00 0.00 47 Continuous Miner at GDK-10 Inc. 0.240 20.78 20.78 2007-08 2007-08 0.00 0.00 48 SINKING OF INTAKE AIR SHAFT AT GDK-11A INC. 290 M 7.25 2008-09 2008-09 0.00 0.00 49 G.D.K.-10 INCLINE. 0.175 4.84 6.19 3/84 3/87 5.26 24.22 0.63 3.61 2.41 2.00 50 THICK SEAM MINING BY BG AT GDK-10 INC. 0.275 18.56 22.15 3/91 3/90 5.91 43.45 1.67 51 GDK-11A INC.BG 1.400 156.00 167.44 3/89 3/93 3/93 36.76 211.49 10.33 3.18 1.97 2.00 5.00 7.50 52 RG.OC-II. 2.000 807.85 800.87 3/92 3/95 3/96 20.55 837.48 3.41 3.99 33.65 5.00 5.25

141
ANNUAL PLAN 2010-11 - MoC COMPANY-WISE, SCHEME-WISE EXPENDITURE AND INVESTMENT Company: SCCL (RS. CRS.)
TOTAL COST DATE OF COMPLETION. X Plan (2002-07) 2006-07 2007-08 2008-09 2009-10 2010-11 CAP Org. Latest NOW Cumulative Cumulative (ACT.) (ACT.) (ACT.) Apprvd. Ant. Proposed
SL. NAME OF THE (mtpa) SANC. ANT. Approved Rev. ANT. Exp. Exp. EXP. EXP. EXP. Outlay Expdr Outlay NO. PROJECT/MINE. during upto B.E. R.E. B.E.
X Plan X Plan 2002-2007 31.03.2007
53 R.K.-5 INCLINE. 0.189 2.70 3.16 3/81 3/86 12.11 33.46 2.99 1.09 1.74 1.00 1.00 0.35 54 R.K.-6 INCLINE. 0.291 3.37 4.22 3/84 3/87 10.71 26.33 3.09 1.67 2.22 0.50 0.20 1.20 55 R.K.-7 INCLINE. 0.422 7.33 6.00 3/84 3/86 3/86 19.49 38.44 3.37 6.25 2.87 1.00 2.00 1.00 56 SRP-1 INCLINE. 0.190 1.96 3.13 3/82 3/86 6.59 17.05 0.77 1.16 0.37 0.80 0.50 0.50 57 SRP-2 INCLINE. 0.250 6.04 8.59 3/87 3/90 2.15 18.33 58 SRP-2A INCLINE. 0.212 6.04 7.94 3/86 3/90 1.51 16.01 59 R.K.-8 INCLINE. 0.250 9.08 10.37 3/87 3/91 3.15 18.17 0.06 0.43 0.36 0.90 0.30 0.40 60 R.K.-1A INCLINE. 0.180 29.78 19.58 3/91 3/92 6.83 29.73 3.52 1.34 0.16 0.50 0.06 0.40 61 SRP-3 & 3A INCLINES. 0.300 10.46 15.36 3/91 3/93 9.96 35.94 3.26 4.19 2.07 2.00 0.20 1.00 62 R.K.-5 MARGINAL SCHEME. 0.125 2.98 2.98 3/96 3/2000 0.00 2.46 62 R.K. NEW TECH. 0.640 33.82 33.82 3/2003 3/2003 3/2003 13.67 32.20 3.00 2.89 1.00 63 CHINNUR-1 & 1A. 0.416 34.94 27.93 3/95 3/2005 Sep.04 5.37 32.47 0.00 64 CHINNUR-2. 0.312 28.33 10.47 3/94 3/2006 Sep.04 8.47 20.68 1.04 36 SRP-1 OCP 0.600 48.93 48.93 2007-08 2007-08 16.40 16.40 16.16 17.05 4.40 10.00 6.00 5.00 64 J.K.-5 INC. 0.669 54.64 54.64 3/87 3/91 3/91 2.43 73.88 0.04 65 YC. OC BLOCK-A 16.00 12.37 3/87 3/87 0.00 15.83 66 YC. OC BLOCK-B 19.28 19.75 3/90 3/90 0.00 18.38 67 J.K.-3 OC BLOCK-C. 0.500 19.24 19.45 3/94 3/93 0.11 15.38 0.90 68 YC.OC-II. 0.500 19.43 19.43 3/94 3/96 0.37 24.79 69 YD. OC BLOCK-D. 0.500 28.18 28.18 3/2000 3/2000 0.09 9.33 70 KOYAGUDEM OCP -I. (PHASE-I). 0.700 25.84 7.81 3/2004 3/2004 12.82 18.15 0.32 1.69 0.15 2.00 71 YLD OCP BLOCK-E 0.450 12.17 5.10 3/2002 3/2004 1.67 6.50 0.12 0.15 0.13 1.50 1.37 2.50 72 NO.21 INC. BG. 0.285 27.05 27.05 3/2004 3/2006 24.73 27.75 1.29 0.00 0.75 73 (INCL. MARGINAL SCH) 19.67 23.24 3/94 3/94 0.00 0.00 74 MARGL. SCHEME 7.47 7.47 3/99 Foreclosed 75 MAN-RIDING SYSTEM AT GDK-8,9,10 & 10A INCS. 4.32 4.32 3/98 3/2001 0.00 3.61 76 MAN RIDING SYSTEM AT KK-1, RK-7, RK.NT & GDK.5,GDK-6B. -
PHASE-I. 11.61 11.95 3/2004 3/2004 0.30 0.30 0.01
77 SINKING OF AIR SHAFT AT GDK-11A INC. 3.55 2.26 3/2004 3/2004 2.45 2.45 78 MAN WINDING SHAFT AT GDK-10-10A INC. 12.50 12.50 3/2004 3/2006 10.33 10.33 78 Semi-mechanisation by LHDs in GDK-8, GDK-9
& GDK-10 Incs. Of RG-II area and PVK-5 Inc. of Kgm. Area.
0.614 21.85 21.85 2004-05 2005-06 2.39 2.39 0.00 2.70 2.00
79 Manriding systems KTK-1&1A - 11.76 11.76 2004-05 2005-06 4.85 4.85 0.20 4.00 Manriding systems IK-1&1A 8.00
80 Conversion of RH into CM extraction at GDK-5 Inc.
0.180 9.67 9.67 2005-06 2005-06 0.00 0.00
81 Sinking of Air Shafts at PVK-5 & GDK-1 Inc. 9.16 9.16 2005-06 2005-06 5.48 5.48 2.00 82 Manriding systems in GDK-5, GDK-6A, KTK-5&5A,21 Inc.,RK- 24.27 24.27 2005-06 2005-06 28.52 28.52 8.32

142
ANNUAL PLAN 2010-11 - MoC COMPANY-WISE, SCHEME-WISE EXPENDITURE AND INVESTMENT Company: SCCL (RS. CRS.)
TOTAL COST DATE OF COMPLETION. X Plan (2002-07) 2006-07 2007-08 2008-09 2009-10 2010-11 CAP Org. Latest NOW Cumulative Cumulative (ACT.) (ACT.) (ACT.) Apprvd. Ant. Proposed
SL. NAME OF THE (mtpa) SANC. ANT. Approved Rev. ANT. Exp. Exp. EXP. EXP. EXP. Outlay Expdr Outlay NO. PROJECT/MINE. during upto B.E. R.E. B.E.
X Plan X Plan 2002-2007 31.03.2007
5,RK-6,MK-4,KK-5, KK-2 and Goleti-1 Inc.(Phase-III) 83 Manriding systems at GDK-2, GDK-2A, GDK-11A, Goleti-1A, RK-1A & RK
NT. (Phase-IV) 15.02 15.02 2005-06 2005-06 14.20 14.20 10.18
84 SDLs in RK.NT, VK-7, GDK-8A, JK-5, PVK-5, 21 Inc., PK-1, GDK-5A, Smg-1, KK-5, KK-1, GDK-6 & GDK-6B Inc.
1.927 29.84 29.84 2005-06 2005-06 9.34 9.34 0.00 5.00 1.45
85 LHDs in GDK-8, GDK-6A & GDK-11A Inc. 0.741 22.68 22.68 2005-06 2005-06 3.19 3.19 86 Manriding system in SRP-3 & 3A Incs. - 4.45 4.45 2007-08 2007-08 1.58 1.58 1.58 87 Manriding system at KTK-2&2A Incs. NA 3.50 2006-07 2007-08 0.00 0.00 88 Manriding system at GDK-6B Inc. NA 3.30 2006-07 2007-08 0.00 0.00 89 SDLs at SK & RK-1A 0.220 3.03 2007-08 2007-08 0.00 0.00 b) AMRs yet to be Sanctioned by Competent
Authority. 0.00 0.00
SUB-TOTAL-B: 690.44 4293.71 197.75 360.67 245.17 80.60 133.80 105.37 C On-going projects. 0.00 0.00 i) Projects sanc. before & during VII Plan. 0.00 0.00 a) As per Sanctioned Capital (Initial Capital only) 0.00 0.00 1 KTK-6. 0.312 29.90 29.90 3/97 3/2005 3/2006 11.60 27.45 2.90 4.93 4.81 9.00 3.00 2.80 2 KTK-7. 0.312 33.12 33.12 3/97 3/2008 3/2008 0.74 0.81 0.04 b) AMRs 0.00 0.00 1 AMRs sanctioned by Competent authority. - Nil 0.00 0.00 2 AMRs yet to be sanctioned by Competent authority. - Nil 0.00 0.00 TOTAL-C (i): 12.35 28.26 2.95 4.93 4.81 9.00 3.00 2.80
ii) Projects sanc. during VIII Plan 0.00 0.00 a) As per Sanctioned Capital (Initial Capital only) 0.00 0.00 1 KTK-8 & 8A. 0.416 41.54 41.54 3/2002 3/2008 3/2008 13.69 13.83 6.14 2 KTK-9&9A . 0.468 47.13 47.13 3/2005 3/2010 3/2010 0.00 0.18 0.05 b) AMRs 0.00 0.00 1 AMRs sanctioned by Competent authority. - Nil 0.00 0.00 2 AMRs yet to be sanctioned by Competent authority. - Nil 0.00 0.00 TOTAL-C (ii): 38.24 48.96 6.14 0.05 0.00 0.00 0.00 0.00
iii) Projects sanctioned during IX Plan. 0.00 0.00 a) As per Sanctioned Capital (Initial Capital only) 0.00 0.00 1 V.K.-7 Continuous Miner. 0.400 74.73 74.73 3/2004 3/2008 3/2008 59.99 59.99 50.80 2.52 11.69 5.00 6.79 1.00 2 KHAIRAGURA OCP. 0.720 47.46 47.46 3/2005 3/2006 26.46 27.06 12.20 24.44 17.07 10.00 29.00 4.00 3 KASIPET OCP 0.600 47.29 47.29 3/2005 3/2006 0.00 0.00 5.00 b) AMRs 0.00 0.00 1 AMRs sanctioned by Competent authority. - Nil 0.00 0.00 2 AMRs yet to be sanctioned by Competent authority. - Nil 0.00 0.00 TOTAL-C(iii): 141.71 145.33 63.00 26.96 28.76 20.00 35.79 5.00

143
ANNUAL PLAN 2010-11 - MoC COMPANY-WISE, SCHEME-WISE EXPENDITURE AND INVESTMENT Company: SCCL (RS. CRS.)
TOTAL COST DATE OF COMPLETION. X Plan (2002-07) 2006-07 2007-08 2008-09 2009-10 2010-11 CAP Org. Latest NOW Cumulative Cumulative (ACT.) (ACT.) (ACT.) Apprvd. Ant. Proposed
SL. NAME OF THE (mtpa) SANC. ANT. Approved Rev. ANT. Exp. Exp. EXP. EXP. EXP. Outlay Expdr Outlay NO. PROJECT/MINE. during upto B.E. R.E. B.E.
X Plan X Plan 2002-2007 31.03.2007
iv) Projects sanctioned during X Plan upto the period. 0.00 0.00 a) As per Sanctioned Capital (Initial Capital only) 0.00 0.00 1 Drivage of Inter-seam tunnels & Sinking of return Air shaft in GDK-10 & 10A. 8.09 8.09 2005-06 2005-06 4.05 4.05 2.56 1.05 0.00 3.00 3.00 3.00 2 DORLI SECTOR-I OCP 0.700 48.68 48.68 2007-08 2007-08 0.86 0.86 0.21 34.38 14.72 15.00 10.00 1.75 3 DORLI OC-II 0.700 47.67 47.67 2007-08 2007-08 0.00 0.00 1.78 1.69 10.00 10.00 15.00 4 KOYAGUDEM OCP-II. 2.000 63.43 63.43 2010-11 2010-11 20.51 20.51 20.51 0.49 20.22 5.00 4.51 2.25 5 Continuous Miner at GDK-11A Inc. 0.400 70.80 70.80 2008-09 2008-09 0.00 0.00 56.51 20.00 3.99 3.98 6 SRP-OC-II 1.500 49.08 49.08 2008-09 2008-09 0.00 0.00 5.45 14.00 10.00 10.00 7 ABBAPUR OCP. 0.600 39.48 39.48 2008-09 2008-09 0.95 0.95 0.23 0.00 0.05 10.00 5.00 5.00 8 ADRIYALA SHAFT PROJECT (RG SHAFT BLOCK-II & III -
MINE-2) 2.144 435.14 1.43 1.43 1.12 6.92 9.72 80.00 40.00 30.00
9 SHANTHIKHANI LW-1 UNIT. 1.167 299.52 0.00 0.00 34.53 40.00 4.00 30.00 10 JALLARAM SHAFT PROJECT (VAKILPALLI
BLOCK-A BG). 2.285 525.42 0.00 0.00 0.00 25.00 15.00 10.00
11 SRAVANAPALLI. 25.94 0.00 0.00 4.00 2.00 12 KUNAVARAM OCP. 0.00 0.00 0.00 0.02 3.00 1.00 2.50 13 Medapalli OCP Expansion 3.000 83.30 2007-08 2007-08 0.00 0.00 0.00 5.00 10.60 6.72 14 MNG OC-II Extn 4.000 44.21 2008-09 2008-09 0.00 0.00 0.36 0.00 45.00 40.00 45.00 15 Semi Mechanisation with diesel operated LHDs in GDK-5 0.454 24.66 2008-09 2008-09 0.00 0.00 15.00 16 JK 5 OCP 2.000 76.15 2009-10 2009-10 0.00 0.00 0.03 0.18 5.00 6.27 2.00 17 RG OC III EXPANSION 0.66 0.66 0.66 0.00 12.60 47.98 105.00 18 RG OC I EXPANSION (PHASE-II) 0.00 0.00 0.00 3.00 31.00 35.00 19 KTK OC 0.00 0.00 65.57 8.00 2.00 2.00 20 MNG. OCP. 0.18 3.00 22.00 2.00 21 IK OC 0.63 0.63 0.63 0.29 5.00 6.49 10.00 22 VAKILPALLI BG 0.00 9.00 15.00 23 NARGUNDKAR KHANI. (KONDAPURAM) 0.190 28.50 0.00 0.05 0.25 0.47 6.18 24 KTK LONG WALL 2.150 398.58 11.98 7.48 24.00 8.83 40.00 b) AMRs 0.00 0.00 1 AMRs sanctioned by Competent authority. - Nil 0.00 0.00 2 AMRs yet to be sanctioned by Competent authority. - Nil 0.00 0.00 TOTAL-C(iv): 152.91 152.95 25.94 57.00 216.86 354.60 291.14 384.38 SUB-TOTAL-C: 345.21 375.51 98.02 88.94 250.43 383.60 329.93 392.18
D NEW PROJECTS - X PLAN & XI PROJECTS. 0.00 0.00 i) Formulating Awaiting Approval. 0.00 0.00 1 SHAFT BLOCK-I MNG. 1.800 582.40 0.00 0.59 2 KHAIRAGURA UG. 0.900 180.00 0.00 0.05 3 JVR OC-II (SATHUPALLI) 4.000 493.48 0.06 0.06 0.06 0.87 10.00 50.00 4 PEDDAMPET SHAFT PROJECT (GDK-6B BG-II). 1.483 359.11 1.26 1.26

144
ANNUAL PLAN 2010-11 - MoC COMPANY-WISE, SCHEME-WISE EXPENDITURE AND INVESTMENT Company: SCCL (RS. CRS.)
TOTAL COST DATE OF COMPLETION. X Plan (2002-07) 2006-07 2007-08 2008-09 2009-10 2010-11 CAP Org. Latest NOW Cumulative Cumulative (ACT.) (ACT.) (ACT.) Apprvd. Ant. Proposed
SL. NAME OF THE (mtpa) SANC. ANT. Approved Rev. ANT. Exp. Exp. EXP. EXP. EXP. Outlay Expdr Outlay NO. PROJECT/MINE. during upto B.E. R.E. B.E.
X Plan X Plan 2002-2007 31.03.2007 5 VAKILPALLI-A 2SEAM LONGWALL 0.92 0.00 6 RG. OC-II LEP (RG SHAFT BLOCK-II & III - MINE-1) 2.54 2.54 2.54 0.00 80.00 85.00 7 RKP OC-1 AND OC-II 0.06 TOTAL-D (i): 3.86 4.55 2.60 0.00 1.85 0.00 90.00 135.00 ii) Yet to be formulated Projects. 0.00 0.00 8 SHAFT BLOCK-II MNG. 360.00 0.00 0.03 9 R.K.P. SHAFT BLOCK-I. 360.00 0.00 0.00
10 CHINNUR SOUTH BLOCK-II. 28.52 0.00 0.00 11 VENKATAPUR BLOCK-II. 45.00 0.00 0.00 12 CHINNUR SOUTH BLOCK-III. 45.00 0.00 0.00 13 LUXMIDEVIPETA. 0.00 0.00 14 10A 2SEAM LONGWALL 0.75 TOTAL-D (ii): 0.00 0.03 0.00 0.00 0.75 0.00 0.00 0.00 SUB-TOTAL-D (i+ii) 3.86 4.58 2.60 0.00 2.60 0.00 90.00 135.00 TOTAL MINING (A+B+C+D): 1166.31 5195.55 324.00 471.27 502.57 475.20 557.13 635.93 E Advance Action Plans Sanctioned for New Projects. - Nil II WASHERIES. A EXISTING PROJECTS (AMRs) Sub-total-A B COMPLETED PROJECTS (AMRs) Sub-total-B C Ongoing projects a As per Sanc.Capital (ExistingCapital Only) b AMRs. 1 AMRs Sanctioned by Competent authority 2 AMRs yet to be Sanctioned by Competent authority Sub-total-C D NEW PROJECTS - X PLAN PROJ. i)Formulated awaiting approval. Sub-total(i) ii) Yetto be formulated. Sub-total(ii) Sub-total D(i)+(ii) Total Washeries A+B+C+D: E Advance Action Plans sanctioned for new Projects.
III NON-MINING: A&B EXISTING & COMPLETED PROJECTS. (AMRs) 84.30 201.74 30.79 33.51 124.89 15.00 42.91 71.00
SUB-TOTAL-A&B: 84.30 201.74 30.79 33.51 124.89 15.00 42.91 71.00

145
ANNUAL PLAN 2010-11 - MoC COMPANY-WISE, SCHEME-WISE EXPENDITURE AND INVESTMENT Company: SCCL (RS. CRS.)
TOTAL COST DATE OF COMPLETION. X Plan (2002-07) 2006-07 2007-08 2008-09 2009-10 2010-11 CAP Org. Latest NOW Cumulative Cumulative (ACT.) (ACT.) (ACT.) Apprvd. Ant. Proposed
SL. NAME OF THE (mtpa) SANC. ANT. Approved Rev. ANT. Exp. Exp. EXP. EXP. EXP. Outlay Expdr Outlay NO. PROJECT/MINE. during upto B.E. R.E. B.E.
X Plan X Plan 2002-2007 31.03.2007
C ON-GOING PROJECTS. 0.00 0.00 a) As per Sabc. Capital. 0.00 0.00 1 EXPANSION OF K.CHP MNG. 30.04 30.04 8.47 34.10 6.25 1.48 6.99 2 CISF. 11.69 11.69 0.10 13.53 0.01 0.02 3 MODERNISATION OF KGM,PH. 2.00 3.18 0.00 2.93 4 ESPS FOR 18 MW POWER HOUSE. 3.00 4.99 0.00 2.37 1.20 5 Housing at RGM(2110 Nos.), MNG (500 Nos.) 2610
Nos. 75.00 75.00 101.88 101.88 38.87 11.32 0.88 1.09
6 132 KV SUB-STATION. 0.12 11.14 0.09 1.14 0.40 7 CONSTN. OF HOUSES TO IMPROVE
HOUSING. 18.00 18.00 24.82 38.59 17.70 12.54
8 PROTECTED WATER SUPPLY, MNG. 4.40 4.40 0.00 2.22 9 PROTECTED WATER SUPPLY TO CENT. OCP
AND SECT. IV,RG. 5.00 5.00 0.00 3.90
10 REGIONAL WORKSHOP,MNG. 9.63 9.63 0.00 2.50 0.18 11 UPGRADATION OF RLY.TRACK 4.80 4.80 0.00 5.83 12 MODERNISATION OF 18 MW PH 5.00 6.48 0.66 5.16 1.00 13 CENTRAL WORKSHOP OC,RGM. 19.39 19.39 0.00 1.04 14 CONSTN. OF 4600 NOS. FABRICATED
HOUSES. 32.15 32.15 0.00 12.99
15 MINES RESCUE SERVICES. 5.65 5.65 3/97 3/97 9.99 15.91 2.15 0.18 1.00 16 GODAVARI WATER SUPPLY SCHEME,
BPA.,REGION. 12.25 13.85 3/96 3/97 0.00 12.13
17 PAYMENT TO NAC,KGM. FOR WATER SUPPLY.
2.00 2.00 0.00 1.50
18 RG.OC-I SCHEME FOR CONSERVATION OF DIESEL OIL.
11.00 12.65 3/95 3/97 0.00 11.77
19 COAL MUSEUM. 1.25 0.38 0.51 20 600 mm Pipe line at Mng(2 Range). 0.69 0.69 21 Singareni Advanced Mechanisation Training
Institute (SAMTI)/UMTI, RGM. 0.00 0.00
22 Corporate Housing (NB-18,NC-84,C2-154,T2-154).
26.50 19.01 19.01 12.82 6.97 1.00
23 SPECIAL WELFARE AMENITIES. 16.40 26.27 8.25 0.00 5.00 1.45 24 Modification of GDK-1 CHP. 5.20 2005-06 3.81 3.81 3.81 3.03 0.57 1.00 5.00 0.00 25 Modification of SRP CHP. 8.40 0.00 0.00 6.62 1.50 1.00 0.90 0.00 26 Modification of RKP CHP. 8.00 2007-08 3.06 3.06 3.06 5.04 0.40 1.00 0.00 0.00 27 Modernisation of CHPs (EOL) 5.60 5.60 5.60 2.00 28 20 MW Captive Power Plant 90.00 92.10 2009-10 2009-10 0.00 0.00 0.00 60.00 0.00 85.00

146
ANNUAL PLAN 2010-11 - MoC COMPANY-WISE, SCHEME-WISE EXPENDITURE AND INVESTMENT Company: SCCL (RS. CRS.)
TOTAL COST DATE OF COMPLETION. X Plan (2002-07) 2006-07 2007-08 2008-09 2009-10 2010-11 CAP Org. Latest NOW Cumulative Cumulative (ACT.) (ACT.) (ACT.) Apprvd. Ant. Proposed
SL. NAME OF THE (mtpa) SANC. ANT. Approved Rev. ANT. Exp. Exp. EXP. EXP. EXP. Outlay Expdr Outlay NO. PROJECT/MINE. during upto B.E. R.E. B.E.
X Plan X Plan 2002-2007 31.03.2007
29 ERP 0.00 0.00 11.00 7.82 6.00 0.00 0.00 TOTAL (a) 0.00 0.00 66.55 19.30 81.87 7.35 85.00
b) AMR - Nil 0.00 0.00 SUB-TOTAL-C: 194.98 338.44 90.26 66.55 19.30 81.87 7.35 85.00
D NEW SCHEMES (X PLAN PROJECTS): 0.00 0.00 i) Formulated awaiting approval. 0.00 0.00 Proposed Scattered renewals of track in - 0.00 0.00 1 ELECT. OF RLY. SIDINGS 0.00 0.12 SK CHP SIDING 0.00 2.04 1.00 RKP-I CHP SIDING 0.00 1.39 1.00 RKP-II CHP SIDING 0.00 0.00 MNGR. CHP SIDING. 0.00 0.00 0.11 0.00 0.00 2 CTR WORKS FOR EMPTIES 0.00 0.00 PLACEMENT YARD FROM CH. 0.00 0.00 13/5 TO 14/3 KMS. AT 0.00 0.00 RG.I AREA (PHASE-II) 0.00 0.00 3 RENEWAL WORKS FOR 0.00 0.00 MAIN LINE FROM CH.9/1 0.00 0.00 TO 14/3, AT RG.I. 0.00 0.00 4 MNGR. CHP SIDING. 0.00 0.00 5 RENEWAL WORKS AT GDK-1 SIDING. 0.00 2.14 1.41 1.00 RENEWAL WORKS AT STRUTPIT SIDING. 0.00 0.00 RENEWAL WORKS AT K.K.-1 SIDING. 0.00 0.00 RENEWAL WORKS MM SIDING. 0.00 0.00 0.69 0.37 6 CTR WORKS FOR TRACK NO.1 0.00 0.00 & 2 AND EXTENSION OF 0.00 0.00 TRACK NO. 1 & 2 FOR 0.00 0.00 ACCOMMODATION FULL RAKE 0.00 0.00 AT I CHP. 0.00 0.00 7 ENERGY CONSERVATION SCHEME. 0.00 0.00 2.50 8 600 MW POWER HOUSE 1.70 24.05 540.00 SUB-TOTAL-D:(i) 0.00 5.69 0.00 2.10 2.18 5.50 24.05 540.00
ii) Yet to be formulated Projects. - Nil 0.00 0.00 SUB-TOTAL-D:(i) & (ii) 0.00 5.69 0.00 2.10 2.18 5.50 24.05 540.00
E EXPLORATION. 5.00 116.48 3.58 0.54 1.50 3.00 2.50 3.00 TOTAL NON-MINING (A+B+C+D+E): 284.28 662.35 124.63 102.70 147.87 105.37 76.81 699.00 GRAND TOTAL:(I+II+III) 1450.59 5857.90 448.63 573.97 650.44 580.57 633.94 1334.93

147
NEYVELI LIGNITE CORPORATION LIMITED
ANNUAL PLAN 2010-11
1. INTRODUCTION:
Neyveli Lignite Corporation Limited is an integrated Complex comprising of three opencast mines with a total Lignite Production Capacity of 24 Million Ton (MT) per annum linked to Pit Head Thermal Power Stations with a total installed Capacity of 2490 Mega Watt (MW). The capacity of the various units is as under:
o Mine-I - 10.5 MT/ annum. o Mine-IA - 3.0 MT / annum o Mine-II - 10.5 MT/ annum. Thermal Power Station-I (linked to Mine-I) - 600 MW Thermal Power Station-I Expansion (linked to Mine-I) - 420 MW Thermal Power Station-II (linked to Mine-II) - 1470 MW
In addition to the above following projects are under implementation
Mine II expansion 4.5 MT/ annum liked to Thermal II expansion 500 MW. Barsingsar Mine 2.1 MT/annum liked to Barsingsar TPS 250 MW. Coal based Power Station of 1000MW capacity at Tuticorin.
2.0 PRODUCTION PROGRAMME
The Production programme proposed for BE 2009-10, RE 2009-10 and BE 2010-11 are given in the following table.
PARTICULARS BE 2009-10
RE 2009-10
BE 2010-11
OVERBURDEN LM3 1526.00 1396.00 1581.00
LIGNITE (LAKH TONNES) 217.50 217.50 241.40
POWER – GROSS (MILLION UNITS) 16600.00 16784.00 18758.00
Unit wise Overburden Removal, Lignite Production, Power Generation (Gross) and other details such as capacity utilisation etc. for BE 2009-10, RE 2009-10 and BE 2010-11 are furnished in Annexure I

148
3.0 PLAN OUTLAY
The Plan Outlay proposed for BE 2009-10, RE 2009-10 and BE 2010-11 are indicated below:
(Rs. Crores)
Sector BE 2009-10 RE 2009-10 BE 2010-11
Coal Sector 524.09 386.40 313.94
Power Sector 1369.75 844.94 1669.52
Total 1893.84 1231.34 1983.46 3.1 FUNDING PATTERN
The Funding Pattern proposed for BE 2009-10, RE 2009-10 and BE 2010-11 are furnished below. The Company has sought no Budgetary Support from Government for funding.
(Rs. Crores)
Particulars BE 2009-10 RE 2009-10 BE 2010-11
Internal Resources 673.46 397.08 662.03Rupee Loans/ Bonds 720.38 834.26 1321.43Foreign Currency Loan 500.00 - -Total 1893.84 1231.34 1983.46
Detailed sector wise Outlay and Funding are furnished in Annexure II-A & II-B.

149
4.0 FINANCIAL PROGRAMME:
Financial forecast such as Total Income, Operating Cost, Profit after Tax (PAT), dividend payout proposed for BE 2009-10, RE 2009-10 and BE 2010-11 are furnished below:
(Rs. Crores)
Particulars BE 2009-10 RE 2009-10 BE 2010-11
Total-Income 3624.68 3656.31 4386.42
Operating Cost
Employee Remuneration 945.17 1103.24 1181.29
Maintenance Cost 708.82 616.65 689.01
Other Cost 470.69 457.52 463.33
Total-Operating Cost 2124.68 2177.41 2333.62
Depreciation and Amortisation 505.47 458.12 630.40
Interest on Borrowings 174.31 51.82 314.31
Profit Before Tax (PBT) 820.22 968.96 1108.08
Provision for Tax 236.85 312.21 365.46
Profit after Tax (PAT) 583.37 656.75 742.62
Dividend & Dividend Tax 392.56 392.56 392.56
Retained Earnings 190.81 264.19 350.06

150
4.1 INTERNAL RESOURCES
The details of Gross and Net Internal Resources estimated to be generated during BE 2009-10, RE 2009-10 and BE 2010-11 are as under:
(Rs. Crores) Particulars BE 2009-10 RE 2009-10 BE 2010-11
1. Gross Generation (IR)
Profit after Tax and Dividend 190.81 264.19 350.06
Add : Depreciation& Amortisation 505.47 458.12 630.40
Total 696.28 722.31 980.46
2. Utilisation (IR)
Repayment of Loans (KFW) 21.71 22.31 22.68
Balancing Equipments / Replacement 300.00 300.00 300.00
Increase/Decrease in Working Capital 150.00 150.00 150.00
Equity from subsidiaries 0.00 71.92 193.31
Investments -103.20 -103.20 -103.20
Total 368.51 441.03 562.79
Net I.R. for the Year 327.77 281.28 417.67
I.R. Carry forward from Previous Year 4569.84 5452.20 5336.40
Carry Forward Surplus to Next Year 4224.15 5336.40 5092.04Total Internal Resources-Utilisation for Plan Expenditure
673.46 397.08 662.03
Foreign Commercial Borrowings 500.00 0.00 0.00
Rupee Loan/Bonds 720.38 834.26 1321.43Total-Internal and Extra Budgetary Resources (IEBR)
1893.84 1231.34 1983.46
Plan Outlay 1893.84 1231.34 1983.46 4.2 DIVIDEND
The estimated dividend payout for BE 2009-10, RE 2009-10 and BE 2010-11 is as per the details below:

151
(Rs. Crores)
Dividend Details (Cash Basis)
BE 2009-10
RE 2009-10
BE 2010-11
Dividend (%) 20% 20% 20%
Dividend Payment 335.54 335.54 335.54
Dividend Tax 57.02 57.02 57.02
Total-Dividend 392.56 392.56 392.56
5.0 STATUS OF THE PROJECTS: 5.1 ON-GOING PROJECTS:
The following are the on-going projects for NLC:
Mine II Expansion Thermal II Expansion Rajasthan Mines Rajasthan Thermal Tuticorin Power Project
The projects Mine II Expansion and Thermal II Expansion were sanctioned in
Oct.2004 and the projects Rajasthan Mines and Thermal were sanctioned in
Dec.2004. The Tuticorin project was sanctioned on 12.5.2008.
Revised Cost Estimate for Mine II Expansion and Thermal II Expansion was
approved by GOI and RCE for Rajasthan Mines and Thermal projects have been sent
to GOI for approval.
The following Budget provisions are proposed to meet the expenditure in connection
with commissioning activities for the Mine II Expansion, TPS II Expansion,
Rajasthan Mines & Thermal projects.

152
Rs. Crores
Name of Project Capacity Sanctioned
Cost Anticipated
Cost
ActualsUpto
March 09
Comm. Date
BE 2009-
10
RE 2009-
10
BE 2010-
11
Mine II-Expn
4.5 MTPA 2161.28 2295.93 1510.54 Feb 2010 320.00 323.57 224.11
TPS-II Expan 500 MW 2030.78 2453.57 1662.47
Unit I: May .2010
Unit II: Nov.2010
389.00 301.81 327.63
Rajasthan Mines
2.1 MTPA 254.07 254.60 193.88 Oct. 2009 50.00 27.71 37.73
TPS at Rajasthan 250 MW 1114.18 1626.09 1156.96
Unit I: Nov. 09 Unit II:
Jan. 2010
216.85 231.36 147.16
Tuticorin Thermal
1000 MW 4909.54 4909.54 230.70
Unit I: April. 12 Unit II
Nove. 12
730.00 307.35 826.13
Total 10469.85 11539.73 4754.55 1705.85 1191.80 1562.76
Mine II Expansion is almost in completion stage and expected to be commissioned in
February 2010. All the major equipments have been commissioned. Provision made in
RE2009-10 is mainly for final payments, initial spares, land, CME, GWC equipments, Mine
Development Expenditure, Fabrication and erection of C1 Conveyor and SW pumping and
IDC. And for BE2010-11 major share of the provision is for modification of conveyors, land,
CME, GWC equipments, Mine Development Expenditure, Fabrication and erection of C1
Conveyor and SW pumping.
Thermal II Expansion is also in completion stage and the provision in RE is for supply and
erection work in Main Plant Package and erection works in LHS, AHS. In BE 2010-11

153
provision is sought for balance work in Main Plant Package, LHS, Water Treatment Plant,
Cooling Towers, chimney, Erection of Turbine and Generator including Electrical works of
Unit I & II. Boiler etc.
For Rajasthan Mines, and Thermal commissioning of main plant equipments and major
electrical equipments are going on. Major requirement in the Mines’s provision is mainly for
electrical equipments. In thermal it is for payment against erection activities in the main
plant package and LHS.
As regards Tuticorin project, tendering activities for SG & TG packages, Coal Handling
System, Power Transofrmers are completed. For Ash handling system, CWS package, DM
Plant package, Chimeney, Cooling Tower etc. are in progress. Provision made is mainly for
supply and erection activities relating to SG, TG and CHS etc.
5.2 SPILLOVER PAYMENTS FOR LAND & FOR OTHER COMPLETED
PROJECTS: A provision of Rs. 23.39 Crores in RE 2009-10 and Rs. 36.57 crores in BE 2010-11
are made mainly for additional compensation payable for land acquisition for various
ongoing, completed and new projects. There are certain pending payments on account
of legal and other issues in respect of Thermal I Expansion, which is in Revenue
operation since 2003. A provision of Rs 0.10 crores is provided for the same during
RE 2009-10 & BE 2010-11.
5.3 NEW PROJECTS The following new projects are envisaged during 2010-11. In order to meet certain
preliminary expenses such as preparation of Feasibility report, obtaining clearances
from authorities, etc., provision has been made in the Annual Plan 2010-11.
Rs. Crores
Sl.No Paticulars BE 2009-10
RE 2009-10
BE 2010-11
COAL PROJECTS 1 Mine III AAP 0.05 0.01 0.022 Jayamkondam Mine AAP 83.90 0.47 0.233 Bithnok Mines Project AAP 0.50 0.05 0.18

154
Sl.No Paticulars BE 2009-10
RE 2009-10
BE 2010-11
COAL PROJECTS 4 Hadla Mines Project AAP 0.24 0.16 0.185 Palana Lignite Mine 0.51 1.375 Gujarat Mines AAP 0.35 0.02 0.03
6 Expansion for existing Mine I & IA for 1000 MW TPS- AAP 8.10 0.01 0.37
7 Talabira II & III AAP 1.00 3.63 5.508 Riri Mine 1.35 0.00 0.00
TOTAL 95.49 4.86 7.88 POWER PROJECTS
1 Orissa TPS - AAP 1.00 0.10 1.002 TPS III – AAP 0.40 0.05 0.403 Jayamkondam TPS- AAP 12.50 0.45 12.354 Bithnok Power Project- AAP 5.10 0.70 5.605 Hadla Power Project- AAP 1.30 0.40 1.856 Uttarpradesh TPS- AAP 5.00 1.00 12.537 Gujarat TPS- AAP 1.50 0.15 1.308 Riri TPS 0.00 0.00 0.109 TPS at Existing NLC TPS I site -AAP 3.00 0.65 2.6510 Madhya Pradesh TPS 2.00 0.10 1.7011 Jarkand TPS 1.00 0.10 1.0012 Chattisgarh Power project 1.00 0.10 1.0013 Wind energy Project 0.25 325.0014 Misc.New schemes 0.27 2.02 Total 33.80 4.32 368.50
TOTAL 129.29 9.18 376.38
6.0 PROVISIONS FOR GEOLOGICAL INVESTIGATION
Extensive exploration programme was drawn up by NLC to cover the entire Neyveli,
Jayamkondam fields as well as Rajasthan, Gujarat, Orissa, Madhya Pradesh,
Jharkhand, Chattisgarh, Uttar Pradesh areas for the purpose of firming up total lignite
reserves in these regions. For carrying out the above works, Rs. 5.95 crores has been
provided in RE 2009-10 and Rs.4.80 crores during BE 2010-11.

155
7.0 PROVISIONS FOR SCIENCE AND TECHNOLOGY SCHEMES
NLC has a Center for Applied Research and Development (CARD), which carry out various
studies relating to the utilisation of Lignite and other chemical products of the company. In
order to carry out the R&D projects, a sum of Rs. 0.72 crores have been provided for in RE
2009-10 and Rs. 2.85 crores in BE 2010-11 respectively. The details of the Project are in
Annexure III – A.
8.0 IN FINE THE ANNUAL PLAN 2010-11 PROPOSALS ARE: Rs.Crores
Particulars BE 2009-10
R.E. 2009-10
BE 2010-11
a. Provision for Projects under implementation
Para 5.1 1705.85 1192.05 1887.76
c. Provision for payment for Land & for completed projects (Spill Over)
Para 5.2. 51.89 16.62 36.67
b. Provision for New Projects under formulation
Para 5.3 129.29 15.80 51.38
d. Provision for Geological Investigation
Para 6 3.81 6.15 4.80
e. Provision for Science & Technology
Para 7 3.00 0.72 2.85
Total 1893.84 1231.34 1983.46
*****

156
ANNEXURE I PRODUCTION PLAN
ANNUAL PLAN 2010-11
Actual BE RE BE Production Capacity2008-09 2009-10 2009-10 2010-11
OVERBURDEN (LM3) Mine I 501.54 490.00 490.00 540.00Mine 1A 200.11 195.00 195.00 200.00Mine II including expansion 659.65 750.00 620.00 750.00Barsingsar Mines 0.00 91.00 91.00 91.00Total 1,361.30 1,526.00 1,396.00 1,581.00Lignite (LTs) Mine I 105 90.40 90.00 90.00 88.00Mine 1A 30 30.56 25.50 25.50 25.50Mine II including expansion 150 91.09 97.00 97.00 110.00Barsingsar Mines 21 1.02 5.00 5.00 17.90Total 306 213.07 217.50 217.50 241.40Capacity Utilization % (All Mines) 88.84 83.33 83.33 78.89Power (G)-MU TPS I 5256 3577.49 3,707.00 3,707.00 3784.00TPS II 12877.20 9060.44 9,658.00 9,658.00 9658.00TPS I E 3679.20 3126.05 2,760.00 2944.00 2944.00TPS II E 4380 0.00 - - 948.00Barsingsar TPS 2190 0.00 475.00 475.00 1424.00Total 15767.98 16,600.00 16,784.00 18,758.00PLF – All Power Stations 72.29 73.93* 74.87* 66.09TPS I 71 71 TPS II 75 75 TPS I EXPN 75 75 TPS II E - - BARSING TPS 22 22 Power (N)-MU TPS I 3,141.03 3,262.00 3,262.00 3,330.00TPS II 8,172.14 8,692.00 8,692.00 8,692.20TPS I E 2,858.42 2,498.00 2,664.32 2,664.32TPS II E - - - 844.00Barsingsar TPS - 418.00 418.00 1,260.24Total 14,171.59 14,870.00 15,036.68 16,790.40* Barsingsar TPS not included for PLF Calculation.

157
ANNEXURE II-A
ANNUAL PLAN 2010-11 – PLAN OUTLAY Rs. crores
BE RE BE Sl.No PARTICULARS
Actual 2008-
09 2009-10 2009-10 2010-11
COAL SECTOR Projects under Implementation 1 Mine II Expansion (RCE) 320.77 320.00 323.57 224.11 2 Barsingsar Mine (RCE) 53.21 50.00 27.71 37.73
Projects under Formulation 3 Mine III AAP 0.00 0.05 0.01 0.02 4 Jayamkondam Mine AAP 1.24 83.90 0.47 0.23 5 Bithnok Mines Project AAP 2.08 0.50 0.05 0.18 6 Hadla Mines Project AAP 0.91 0.24 0.16 0.18 Palana Lignite Mine 0.51 1.37 7 Gujarat (Valia) Mines AAP 0.04 0.35 0.02 0.03 8 Expansion for existing Mine I & IA- AAP 0.00 8.10 0.01 0.37 9 Talabira II & III AAP 0.12 1.00 3.63 5.50 10 Riri Mine 0.00 1.35 0.00 0.00 11 Science & Technology (S&T) 0.71 3.00 0.72 2.85 12 Geological Investigation 9.15 3.81 6.15 4.80 13 Other Completed projects 11.82 51.79 23.39 36.57 Total - Coal Sector 400.05 524.09 386.40 313.94 POWER SECTOR
Projects under Implementation 1 Thermal II Expansion 507.52 389.00 301.81 327.632 Barsingsar Thermal Power Station 428.31 216.85 231.36 147.16 3 Tuticorin Thermal Power Station 222.42 730.00 307.35 826.13
Projects under Formulation 4 Orissa Thermal - AAP 1.00 0.10 1.00 5 Thermal station III - AAP 0.40 0.05 0.40 6 Jayamkondam Thermal - AAP 0.10 12.50 0.45 12.35 7 Bithnok Power Project- AAP 0.08 5.10 0.70 5.608 Hadla Power Project- AAP 1.30 0.40 1.85 9 Uttarpradesh Thermal - AAP 5.00 1.00 12.53 10 Gujarat Thermal - AAP 1.50 0.15 1.30 11 Riri Thermal 0.00 0.00 0.10 12 Thermal at Existing NLC TPS I site -AAP 3.00 0.65 2.65 13 Madhya Pradesh Thermal Power station 2.00 0.10 1.70 14 Jarkand Thermal Power Station with SECL 1.00 0.10 1.00 15 Chattisgarh Power project with CCL 1.00 0.10 1.00 16 Wind Energy Project 0.00 0.25 325.00 17 Other. New Schemes 0.27 2.02 16 Completed Projects 0.67 0.10 0.10 0.10 Total - Power Sector 1159.10 1369.75 844.94 1669.52 TOTAL – COAL & POWER SECTOR 1559.15 1893.84 1231.34 1983.46

158
ANNEXURE-II-B
SECTOR WISE FUNDING PATTERN (Rs. Crores)
Actual BE RE BE
Sl.No Paticulars 2008-09 2009-10 2009-10 2010-11
I COAL SECTOR
1 Internal resources 146.05 238.80 140.50 130.65
2 Rupee Term Loans/Bonds 254.00 185.29 245.90 183.29
3 External commercial Borrowings - - - -
4 Budgetary Support - - - -
Total 400.05 524.09 386.40 313.94
II POWER SECTOR
1 Internal resources 763.10 434.66 256.58 531.38
2 Rupee Term Loans/Bonds 396.00 535.09 588.36 1138.14
3 External commercial Borrowings - 400.00 - -
4 Budgetary Support - - - -
Total 1159.10 1369.75 844.94 1669.52
III COAL & POWER SECTOR
1 Internal resources 909.15 673.46 397.08 662.03
2 Rupee Term Loans/Bonds 650.00 720.38 834.26 1321.43
4 External commercial Borrowings - 500.00 - -
5 Budgetary Support - - - -
Total 1559.15 1893.84 1231.34 1983.46

159
Annual Plan 2010-11. FORMAT 2
LIGNITE PRODUCTION (IN Mill Ton)
2009-10 S.No Project 2006-07
(Actual) 2007-08 (Actual)
2008-09 (Actual) BE RE
2010-11 (Proposed)
2011-12 (Target)
1 Mine I (Incl. Mine I Expansion) 10.55 8.78 9.04 9.00 9.00 8.80 8.93
2 Mine II (Incl. Expansion) 6.66 9.44 9.11 9.70 9.70 11.00 12.75
3 Mine-IA 3.80 3.33 3.06 2.55 2.55 2.55 2.55
4 Barsingsar Mine 0.00 0.04 0.10 0.50 0.50 1.79 1.79
5 Bithnok Mine 0.00 0.00 0.00 0.00 0.00 0.00 1.03
TOTAL 21.01 21.59 21.31 21.75 21.75 24.14 27.05

160
Annual Plan 2010-11. FORMAT 3
LIGNITE DEMAND SUPPLY PLAN - Sourcewise Break-up (in Mill Tonne)
2009-10 S.No Project 2006-07 (Actual)
2007-08 (Actual)
2008-09 (Actual) BE RE
2010-11 (Proposed)
2011-12 (Target)
1 POWER STATION I (600 MW) 5.76 5.30 5.12 5.35 5.35 5.47 5.69
2 TPS I EXPANSION (420 MW) 3.31 3.31 3.18 2.82 3.00 3.00 2.81
3 POWER STATION II (1470 MW) 9.31 11.40 10.16 10.59 10.59 10.59 10.59
4 TPS II EXPANSION (500 MW) 0.00 0.00 0.00 0.00 0.00 1.00 3.36
5 BARSINGSAR TPS (250 MW) 0.00 0.00 0.00 0.51 0.51 1.53 1.75
6 BITHNOK TPS (250 MW) 0.00 0.00 0.00 0.00 0.00 0.00 1.03
7 SALE TO ST-CMS ( IPP - 250 MW) 1.77 1.87 1.83 1.74 1.90 1.90 1.76
8 OUTSIDE SALES 0.29 0.43 0.36 1.25 0.30 0.30 0.30
TOTAL 20.44 22.31 20.65 22.25 21.65 23.79 27.29

161
Annual Plan 2010-11. LINKAGE PLAN - NLC FORMAT-16 NEYVELI LIGNITE CORPORATION LTD., NEYVELI (Million Tonnes) SL NAME OF THE PROJECT SPECIFIC 2006-07 2007-08 2008-09 No. SCHEME CONSUMPTION ACTUALS ACTUAL ACTUAL
AP 2009-10
NORMS Target Antici
AP 2010-11
BE
2011-12 Proposed
1 2 3 4 5 6 7 8 9 i) Opening Stock: 0.51 1.09 0.33 1.24 0.98 1.08 1.43 2 LIGNITE PRODUCTION ii) MINE I (Incl. Mine I Expansion) 10.55 8.78 9.04 9.00 9.00 8.80 8.93 iii) MINE II (Incl.Mine II Expansion) 6.66 9.44 9.11 9.70 9.70 11.00 12.75 iv) Mine-IA 3.80 3.33 3.06 2.55 2.55 2.55 2.55 V) BARSINGSAR MINE 0.00 0.04 0.10 0.50 0.50 1.79 1.79 vi) BITHNOK MINE 0.00 0.00 0.00 0.00 0.00 0.00 1.03 TOTAL 21.01 21.59 21.31 21.75 21.75 24.14 27.05
3CONSUMPTION (Down stream units ) i) POWER STATION I (600 MW) 1.641 KG/KWH (N) 5.76 5.30 5.12 5.35 5.35 5.46 5.69 ii) TPS I EXPANSION (420 MW) 1.127 KG/KWH (N) 3.31 3.31 3.18 2.82 3.00 3.00 2.81 iii) POWER STATION II (1470 MW) 1.218 KG/KWH (N) 9.31 11.40 10.16 10.59 10.59 10.59 10.59 iv) TPS II EXPANSION 1.189 KG/KWH (N) 0.00 0.00 0.00 0.00 0.00 1.00 3.36 v) BARSINGSAR POWER 1.213 KG/KWH (N) 0.00 0.00 0.00 0.51 0.51 1.53 1.75 VI) BITHNOK POWER 1.213 KG/KWH (N) 0.00 0.00 0.00 0.00 0.00 0.00 1.03 Total Lignite Consumed for TPS 18.37 20.01 18.46 19.26 19.45 21.59 25.23 vi) SALE TO ST-CMS (IPP) 1.77 1.87 1.83 1.74 1.90 1.90 1.76 SURPLUS AVIALBLE FOR
MARKET SALE
vii) OUTSIDE SALES 0.29 0.43 0.36 1.25 0.30 0.30 0.30 Grand Total 20.44 22.31 20.65 22.25 21.65 23.79 27.29
4Closing Stock (1+2-3) 1.09 0.37 0.98 0.74 1.08 1.43 1.19

162
Annual Plan 2010-11. OUTPUT PER MAN SHIFT Format -17
(in tonnes)
2006-07 2007-08 2008-09 AP2009-10 2010-11 XI Plan Sl. No. Company
Actuals Actual Actual Target Antici BE 2011-12
0 1 4 5 6 7 8 9
NLC Limited
1 Mine I
(OB+Lignite ) 106.8 109.01 116.36 91.91 91.91 112.04 91.25
Lignite 10.56 9.05 9.62 7.73 7.73 8.44 8.07
2 Mine II
(OB+Lignite ) 122.65 123.11 120.06 112.99 147.86 139.21 124.52
Lignite 7.5 9.96 9.68 9.01 8.87 10.21 8.43
3 Mine IA
(OB+Lignite ) 284.87 235.22 208.83 186.19 186.19 182.26 185.00
Lignite 21.16 16.74 14.81 11.43 11.43 10.92 11.35
Total-Mines
(OB+Lignite ) 129.10 127.17 127.17 109.66 117.72 131.46 115.79
Lignite 10.16 10.18 10.16 8.62 9.06 8.38 8.52
All Mines in NLC are Opencast Mines

163
Annual Plan 2010-11. HEMM PRODUCTIVITY % OF AVAILABILITY & % UTILISATION FORMAT 18
2009-10 S.No Project Norm 2006-07 (Actual)
2007-08 (Actual)
2008-09 (Actual) BE RE
2010-11 (Proposed)
2011-12 (Target)
Availiability - - - - - - - - 1 Mine I
Utilisation 85.00 100.46 83.63 86.10 85.00 85.00 85.00 85.00
Availiability - - - - - - - - 2 Mine II ( Incl. Expansion )
Utilisation 85.00 63.45 89.88 86.75 85.00 85.00 85.00 85.00
Availiability - - - - - - - - 3 Mine-IA
Utilisation 85.00 126.80 110.90 101.87 85.00 85.00 85.00 85.00
Availiability - - - - - - - - 4 Barsingsar Mine
Utilisation - - - - - 85.00 85.00 85.00
Availiability - - - - - - - - 5 Bithnok Mine
Utilisation - - - - - - - 85.00
TOTAL 87.56 89.77 88.36 85.00 85.00 85.00 85.00

164
Annual Plan 2010-11. OC & UG CAPACITY UTILISATION
NAME OF THE PSU - NEYVELI LIGNITE CORPORATION LIMITED FORMAT-19 SL 2006-07 (Actual) 2007-08 (Actual) 2008-09(Actual) 2009-10(BE) 2009-10(RE) 2010-11(BE) 2011-2012 (Proj) No. Company Cap. Prod. Util. Cap. Prod. Util. Cap. Prod. Util. Cap. Prod. Util. Cap. Prod. Util. Cap. Prod. Util. Cap. Prod. Util.
Mtpa Mtpa % Mtpa Mtpa % Mtpa Mtpa % Mtpa Mtpa % Mtpa Mtpa % Mtpa Mtpa % Mtpa Mtpa % I Mines: 1 Lignite (Mines-I Incl
Expn) 10.50 10.55 100.46 10.50 8.78 84 10.50 9.04 86 10.50 9.00 86 10.50 9.00 86 10.50 8.80 84 10.50 8.93 85.00
2 Lignite (Mines-II) & Expn.
10.50 6.66 63.45 10.50 9.44 90 10.50 9.11 87 10.50 9.70 92 10.50 9.70 92 10.50 11.00 105 15.00 12.75 85
3 Lignite (Mine-IA) 3.00 3.80 126.80 3.00 3.33 111 3.00 3.06 102 3.00 2.55 85 3.00 2.55 85 3.00 2.55 85 3.00 2.55 85 4 Lignite (Barsingsar) 0.04 0.10 2.10 0.50 36 2.10 0.50 71 2.10 1.79 85 2.10 1.79 85 5 Lignite (Bithnok) 2.25 1.03 46 Total 24.00 21.01 87.56 24.00 21.59 90 24.00 21.31 89 26.10 21.75 83 26.10 21.75 83 26.10 24.14 92 32.85 26.02 79
II Power: 5 Thermal Power
Station -I 600 MW 3,982 76 600 MW 3,672 70 600 MW 3,577 68 600 MW 3,707 71 600 MW 3,707 71 600 MW 3,784 72 600 MW 3942 75
6 Thermal Power Station -II
1470 MW 8,540 66 1470 MW 10,518 82 1470 MW 9,064 70 1470 MW 9,658 75 1470 MW 9,658 75 1470 MW 9,658 75 1470 MW 9658 75
7 Thermal Station-I Expn
420 MW 3,265 88 420 MW 3,268 89 420 MW 3,126 85 420 MW 2,760 75 420 MW 2,944 80 420 MW 2,944 80 420 MW 2759 75
8 Thermal Station-II Expansion
- - - - - 500MW 948 22 500MW 3285 75
9 Barsingsar Thermal - 250MW 475 22 250MW 475 22 250MW 1,424 65 250MW 1643 75 10 Tuticorin TPS 1000MW 3833 44 11 Bithnok Thermal 250MW 958 44
Total 2490MW 15787 72 2490MW 17457 80 2490MW 15768 72 3240MW 16600 58 2740MW 16784 70 3240MW 18758 66 4490MW 26077 66

165
Annual Plan 2010-11. Name of the PSU: NLC Limited FORMAT-20
Agency 2006-07 2007-08 2008-09 2009-10 2009-10 2011-12 Actual
X Plan Actual Actual Proposed Anticipated Proj
1 Approved Target
Cumulative Achivement
1.DEPARTMENTAL DRILLING (mts) CIL SCCL NLC 38723.00 47378.00 34596.70 16610.90 8000.00 5700.00 5000.00 Sub-total I : II. CONTRACTUAL DRILLING (mts) Agency wise CIL SCCL NLC Sub-total II: GRAND TOTAL: III. NON-CIL BLOCKS Agency wise Sub total III: GRAND TOTAL: II. FINANCIAL (Rs.Cr) A.Depat & Contractual CIL SCCL NLC 5.08 7.04 6.71 5.92 3.81 5.95 3.00 Sub-total Departmental & contractual: B.Non-CIL through Budget GRAND TOTAL A+B: 5.08 7.04 6.71 5.92 3.81 5.95 3.00

166
FORMAT- 21 Annual Plan 2010-11. PROMOTIONAL EXPLORATION PROGRAMME Name of the PSU: NLC Limited (in metres)
Agency 2007-08 2008-09 2009-10 2009-10 2010-11 XI Plan Actuals Actual BE RE Proposed 2011-2012 1 5
1.DRILLING (mts) GSI CIL SCCL NLC 7,487 7,963 12,100 8,050 8,650 - Sub-total GSI 7,487 7,963 12,100 8,050 8,650 MECL * CIL SCCL NLC 37,863 54,454 65,000 69,050 71,700 90,000 Sub-total MECL 37,863 54,454 65,000 69,050 71,700 90,000 CMPDIL CIL: Sub-total CMPDIL GRAND TOTAL 45,350 62,417 77,100 77,100 80,350 90,000 II. FINANCIAL (Rs.Cr) Financial Details are available with CMPDIL as they are payment authority.

167
Annual Plan 2010-11.:YEARWISE UPGRADATION OF LIGNITE RESOURCE INVENTORY FORMAT-24
Name of the PSU : NLC Limited
SL.NO Reserves Proved Indicated Inferred Total Recoverable Geoligical Reports(GR's) Feasibility Reports(FR's)
as on M.T M.T M.T M.T M.T. No.of GR's Recoverable No.of FR's Mineable
Resources M.T. # Reserves M.T./pa
0 1 2 3 4 5 7 8 9 10
1 1.1.2006 (Actual) 4177 20259 13838 38274
2 1.1.2007 (Actual) 4177 26694 7885 38756
3 1.1.2008 (Actual) 4824 26073 8032 38929
4 1.1.2009 (Actual) 5363 25535 8176 39074
5 1.1.2010 (Target) 4830 27000 8000 39830
6 1.1.2011 (Target)
Note
# Recoverable reserves are not assessed.
** Lignite exploration in different parts of country is being carried out by different State and Central agencies; Hence reserve target has not been arrived for 2011-12.

168
Annual Plan 2010-11. FORMAT - 25
UG, OC, Overall and Average Realisation COST OF PROUDCTION
Name of the PSU: NLC Limited Rs.Crores
2006-07 2007-08 2008-09 2009-10 2010-11 Sl No Company
Actual Actual Actual BE RE BE
1 Cost of Production
OC 1485.09 1645.41 2337.51 1828.47 1911.97 2306.28
UG --- -
Overall 1485.09 1645.41 2337.51 1828.47 1911.97 2306.28
2 Overall Realisation :
NLC 1655.14 2284.00 2704.84 2262.40 2211.53 2414.67

169
Annual Plan 2010-11. GROUPWISE INVESTMENT Name of the PSU: NLC Limited FORMAT - 26 Existing & Ongoing Projects Total Sl Company Completed Major Board Level Total New Projects Total Mining Washery Exploration Non-Mining Non-Mining Total No Proposal Proposal Proposal Proposal Proposal Proposal Proposal Proposal Proposal Proposal Outlay
(3+4) (5+6) (8+9+10) (7+11) 0 1 2 3 4 5 6 7 8 9 10 11 12 1 NLC (Mines) 2007-08 (Actual) 3.11 561.07 - 561.07 0.79 564.97 - - 6.57 6.57 571.54 2008-09 (Actual) 10.88 373.97 - 373.97 4.39 389.24 - - 0.94 0.94 390.18 BE 2009-10 - 370.00 - 370.00 95.49 465.49 - - 51.79 51.79 517.28 RE 2009-10 - 351.28 - 351.28 4.86 356.14 - - 23.39 23.39 379.53 BE 2010-11 - 261.84 - 261.84 7.88 269.72 - - 36.57 36.57 306.29 2 NLC (S&T) 2007-08 (Actual) - - - - - - - - 0.29 - 0.29 2008-09 (Actual) - - - - - - - - 0.71 - 0.71 BE 2009-10 - - - - - - - - 3.00 - 3.00 RE 2009-10 - - - - - - - - 0.72 - 0.72 BE 2010-11 - - - - - - - - 2.85 - 2.85 3 NLC (Exploration) - - - - - - - - - - - 2007-08 (Actual) - - - - - - - 6.71 - - 6.71 2008-09 (Actual) - - - - - - - 9.15 - - 9.15 BE 2009-10 - - - - - - - 3.81 - - 3.81 RE 2009-10 - - - - - - - 6.15 - - 6.15 BE 2010-11 - - - - - - - 4.80 - - 4.80 NLC(coal & Lignite) 2007-08 (Actual) 3.11 561.07 - 561.07 0.79 564.97 - 6.71 6.86 6.57 578.54 2008-09 (Actual) 10.88 373.97 - 373.97 4.39 389.24 - 9.15 1.65 0.94 400.05 BE 2009-10 - 370.00 - 370.00 95.49 465.49 - 3.81 54.79 51.79 524.09 RE 2009-10 - 351.28 - 351.28 4.86 356.14 - 6.15 24.11 23.39 386.40 BE 2010-11 - 261.84 - 261.84 7.88 269.72 - 4.80 39.42 36.57 313.94 2 NLC(Power) 2007-08 (Actual) 4.91 1,183.12 - 1,183.12 0.14 1,188.17 - - - - 1,188.17 2008-09 (Actual) 0.67 1,158.25 - 1,158.25 0.18 1,159.10 - - - - 1,159.10 BE 2009-10 0.10 1,335.85 - 1,335.85 33.80 1,369.75 - - - - 1,369.75 RE 2009-10 0.10 840.52 - 840.52 4.32 844.94 - - - - 844.94 BE 2010-11 0.10 1,300.92 - 1,300.92 368.50 1,669.52 - - - - 1,669.52 3 TOTAL : (Power &
Lignite)
2007-08 (Actual) 8.02 1,744.19 - 1,744.19 0.93 1,753.14 - 6.71 6.86 6.57 1,766.71 2008-09 (Actual) 11.55 1,532.22 - 1,532.22 4.57 1,548.34 - 9.15 1.65 0.94 1,559.15
BE 2009-10 0.10 1,705.85 - 1,705.85 129.29 1,835.24 - 3.81 54.79 51.79 1,893.84 RE 2009-10 0.10 1,191.80 - 1,191.80 9.18 1,201.08 - 6.15 24.11 23.39 1,231.34 BE 2010-11 0.10 1,562.76 - 1,562.76 376.38 1,939.24 - 4.80 39.42 36.57 1,983.46

170
Annual Plan 2010-11. FINANCING PATTERN Format-27Name of the PSU : NLC Limited ( Rs.Crore)
SL. No
YEAR IR BONDS/ Rupee Loan
SUPPLIER`S CREDIT
F.E. LOANS
OTHERS (Diversn. From
CPA)
TOTAL IEBR
EAP DBS GBS TOTAL
0 1 2 3 4 5 6 7 8 9 10 11 AP 2007-08 (Actual) 1. MINES 153.14 355.00 - 70.40 - 578.54 - - - 578.54 2. POWER 337.53 835.00 - 15.64 - 1,188.17 - - - 1,188.17 TOTAL 490.67 1,190.00 - 86.04 - 1,766.71 - - - 1,766.71 AP 2008-09 (Actual) 1. MINES 146.05 254.00 - - - 400.05 - - - 400.05 2. POWER 763.10 396.00 - - - 1,159.10 - - - 1,159.10 TOTAL 909.15 650.00 - - - 1,559.15 - - - 1,559.15 AP 2009-10 (BE) 1. MINES 238.80 185.29 - 100.00 - 524.09 - - - 524.09 2. POWER 434.66 535.09 - 400.00 - 1,369.75 - - - 1,369.75 TOTAL 673.46 720.38 - 500.00 - 1,893.84 - - - 1,893.84 AP 2009-10 (RE) 1. MINES 140.50 245.90 - - - 386.40 - - - 386.40 2. POWER 256.58 588.36 - - - 844.94 - - - 844.94 TOTAL 397.08 834.26 - - - 1,231.34 - - - 1,231.34 AP 2010-11 (BE) 1. MINES 130.65 183.29 - - - 313.94 - - - 313.94 2. POWER 531.38 1,138.14 - - - 1,669.52 - - - 1,669.52 TOTAL 662.03 1,321.43 - - - 1,983.46 - - - 1,983.46 2011-12- Target 1. MINES 91.54 180.03 - - - 271.57 - - - 271.57 2. POWER 687.30 1,583.94 - 19.76 - 2,291.00 - - - 2,291.00 TOTAL 778.84 1,763.97 - 19.76 - 2,562.57 - - - 2,562.57

171
Annual Plan 2010-11. Format-28 ESTIMATES OF NLC INTERNAL AND EXTRA BUDGETARY SOURCES Department/ Ministry: Ministry of Coal Name of Undertaking: Neyveli Lignite Corporation Limited PART-I (GENERATED INTERNAL & EXTRA BUDGETARY RESOURCES FOR PLAN SCHEME) (Rs.Crores)
S.No. DESCRIPTION X plan 2007-08 2008-09 2009-10 2010-11 2011-12 Actuals Actuals Actuals BE RE BE Target
1 RECEIPTS (i) Gross Sales / Operating Income 12800.48 2981.65 3354.91 3100.00 2987.86 3591.91 4575.39 (ii) Other Income 2890.52 653.76 657.27 561.43 675.79 772.76 163.46 (iii) Total (1) 15691.00 3635.41 4012.18 3661.43 3663.65 4364.67 4738.84 2 OPERATING COST (i) Salaries & Wages 2285.68 789.61 1224.39 905.78 1067.34 1116.85 1192.10 (ii) Bonus 195.36 60.54 34.86 39.39 35.90 64.44 47.38 (iii) Maintenance Cost 2431.45 554.45 583.75 708.82 616.65 689.01 647.57 (iv) Other Cost 1891.09 301.25 746.33 470.69 457.52 463.33 510.90 (v) Total (2) 6803.58 1705.85 2589.33 2124.68 2177.41 2333.62 2397.95 3 DEPRECIATION AND AMORTISATION (i) Depreciation (incl.Mine Closure) 1944.58 426.80 395.33 476.45 429.08 589.83 692.68 (ii)Amortisation/Write-Off 128.14 27.69 29.17 29.02 29.04 40.56 43.42 (iii) Total (3) 2072.72 454.49 424.50 505.47 458.12 630.40 736.10 4 Acreation (+) or Decreation (-) of Stocks of finished
Products & Other adj. 141.52 -44.97 55.81 -36.75 -7.34 21.75 -11.43
5 GROSS PROFIT / LOSS 6956.22 1430.10 1054.16 994.53 1020.78 1422.40 1593.36 6 INTEREST PAYMENTS TO (i) Central Government 0.00 (ii) Others 236.58 8.80 8.15 174.31 51.82 314.31 366.61 TOTAL (6) 236.58 8.80 8.15 174.31 51.82 314.31 366.61 7 Provision for Income Tax 1943.60 319.73 224.92 236.85 312.21 365.46 375.86 PROFIT AFTER TAX 4776.03 1101.57 821.09 583.37 656.75 742.62 850.89 8 (a) Dividend Payment to Central Govt. 1373.44 345.33 156.97 313.93 313.93 313.93 313.93 (b) Dividend Payment to Others 195.22 23.77 10.80 21.61 21.61 21.61 21.61 (c) Tax on DividenD 188.16 62.73 28.51 57.02 57.02 57.02 47.06 9 Investments in Securities if Obligatory due to Statutory or
other requirement
10 Retained Profit/Surplus carried over to Part II (Item No.1-2 to 9)
3019.21 669.74 624.81 190.81 264.19 350.06 468.29

172
Annual Plan 2010-11. Format-28 Contd..
PART-II (GENERATED INTERNAL & EXTRA BUDGETARY RESOURCES FOR PLAN SCHEME ) (Rs.Crores)
SL X Plan 2007-08 2008-09 2009-10 2010-11 2011-12
No.
DESCRIPTION
Actuals Actual Actual BE RE BE Target
Total
0 1 2 3 9 12 12
1 Retained surplus from PART-I 3019.21 669.74 624.81 190.81 264.19 350.06 468.29 2377.102 Add: Depreciation and Amortisation 2072.72 454.49 424.41 505.47 458.12 630.40 736.10 2703.52 Gross Internal Resources 5091.93 1124.23 1049.22 696.28 722.32 980.46 1204.39 5080.613 Deduct i ) Total Loan Repayment 577.75 69.65 22.02 21.71 22.31 22.68 393.90 1093.06 - Of Which to KFW 577.75 69.65 22.02 21.71 22.31 22.68 18.90 155.56 - Of Which tobanks &Institutions 187.5 375.00 375.00 937.50 ii) Net Increase/Or Decrease in Working
Capital -2727.02 -4.04 -103.20 150.00 62.50 -125.00 82.25 -87.49
iii ) Non Plan Capital Requirement 510.74 174.66 79.15 300.00 200.00 200.00 250.00 903.81 iv ) Others(Equity) -1540.37 0.00 78.00 71.92 193.31 0.00 343.23 v ) Repayment of Bond 400.00 0.00 0.00 0.00 0.00 vi ) Investments 2,590.77 -103.20 78.00 -103.20 -103.20 -103.20 -259.08 -490.68 Total ( 3 ) -188.12 137.07 153.97 368.51 441.03 562.79 467.07 1761.944 Adjusted Internal Resources available for
Plan Schemes ( 1 + 2 - 3 ) 5280.05 987.16 895.25 327.77 281.28 417.67 737.32 3318.68
5a Carry forward surplus available from previous year
373.69 4253.06 5452.20 4569.84 5452.20 5336.40 5092.04 4253.06
5b Carry forward surplus for next year 4,253.06 4749.56 5452.20 4224.15 5336.40 5092.04 5065.52 5065.526 Total Internal Resources ( 4 +5 ) 1400.68 490.66 895.25 673.46 397.08 662.03 763.84 2506.227 Extra Budgetary Resources other than
from GOI
i) Gross Assistance from Domestic Financial Institutes for Plan Project
659.99 1190.00 802.65 720.38 834.26 1321.43 0.00 4148.34
ii ) Foreign Commercial Borrowings 254.55 86.05 0 500.00 0.00 0.00 0.00 86.05 iii ) Bonds / Debentures - issued during
the year 600 0.00 0.00 1763.97 2363.97
iv ) ECB to be tied up 0.00 0.00 19.76 19.76 v ) Receipts from Other funds -
(OIDB,SDF&Others) 0.00 0.00 0.00 0.00
vi ) Issue of Equity to Public 0.00 0.00 0.00 0.00 vii )Other Sources of EBR ( Diversion of
CPA) 0.00 0.00 0.00 0.00
Total 914.54 1276.05 1402.65 1220.38 834.26 1321.43 1783.73 6618.128 Total Internal and Extra Budgetary
Resources available for financing the plan expenditure on the projects renewals and replacement etc., ( 6 + 7 )
2315.22 1766.71 2297.90 1893.84 1231.34 1983.46 2547.57 9124.34
9 Plan Outlay 2315.22 1766.71 2297.90 1893.84 1231.34 1983.46 2547.57 9124.34 Ongoing Projects New Projects Additions/Modifications & Replacements
(AMR)
Resource Cap (9-8) 10 i ) Budgetary support from Govt. for Plan
Schemes 0.00 0.00 0.00 0.00 0.00 0.00 0.00 0.00
ii ) External Assistance through Budget 0.00 0.00 0.00 0.00 0.00 0.00 0.00 0.00 iii) External Assistance Direct 0.00 0.00 0.00 0.00 0.00 0.00 0.00 0.00 iv) Net Budgetary Support ( i - ii ) 0.00 0.00 0.00 0.00 0.00 0.00 0.00 0.00
11 Carry forward of surplus for next year 4253.06 4749.56 5452.20 4224.15 5336.40 5092.04 5065.52 5065.52

173
Annual Plan 2010-11. COMPANYWISE/SCHEMEWISE EXPENDITURE & INVESTMENT - NLC FORMAT 29
TOTAL COST DATE OF COMPLETION Cumulative 2007-08 2008-09 2009-10 2009-10 2010-11 Sl NAME OF THE PROJECT Capacity Sanct. Ant. Originally Latest Now Expenditure Actuals Actual Approved No (M.T) Cost Cost Approved Revised Ant. Upto X Plan Outlay (Original) (31.03.07) BE
RE BE
1 2 4 5 6 7 8 14 I A. COMPLETED PROJECTS 1. MINE I EXPANSION 4.00 1336.93 1667.76 From LOI 24.03.2003 180.58 1.27 4.81 - - - 2. MINE IA 3.00 1032.81 1015.74 2002-03 30.03.2003 261.52 1.84 6.07 - - - 3. Spill over payments 55 Mths 9.03 6.57 0.95 51.79 23.39 36.57 TOTAL ( A ) 451.13 9.68 11.83 51.79 23.39 36.57 B. ONGOING PROJECTS 1. MINE II EXPANSION 4.5 mtpa 2161.28 2295.93 June 09 Feb 10 Feb 10 626.87 497.20 320.76 320.00 323.57 224.11 2. MINE AT RAJASTHAN 2.1 mtpa 254.07 254.60 June 09 Nov 09 Nov 09 65.59 63.87 53.21 50.00 27.71 37.73 3. GEO. INVESTGON. NEYVELI 7.70 6.71 9.15 3.81 6.15 4.80 4. SCIENCE & TECHNOLOGY 2.61 0.29 0.71 3.00 0.72 2.85
TOTAL (B) 702.77 568.07 383.83 376.81 358.15 269.49 C. (i) NEW PROJECTS - IX PLAN
PROJECTS - - - - - -
TOTAL ( C ) - - - - - - D. YET TO BE FORMULATED:- 1. MINE III 8 mtpa 5500.00 0.12 0.12 - 0.05 0.01 0.02 2. MINE AT JAYAMKONDAM 9 mtpa - - 1.24 83.90 0.47 0.23 3. RIRI MINE 4.2 mtpa - - - 1.35 - - 4. BARSINGSAR EXTN. MINES 2.1 mtpa 0.34 0.57 2.08 0.50 0.05 0.18 5. HADLA MINE PROJECT - - 0.91 0.24 0.16 0.18 6. PALANA LIGNITE MINE - - - - 0.51 1.37 7. GUJARAT MINES (AAP) 8 mtpa 0.10 0.10 0.04 0.35 0.02 0.03 8. TALABIRA II & III - - 0.12 1.00 3.63 5.50 9. Extension of Existing Mine I& IA
for 1000 MW TPS - - - 8.10 0.01 0.37
TOTAL ( D ) 0.56 0.79 4.39 95.49 4.86 7.88 TOTAL- COAL SECTOR (A + B + C + D ) 1154.46 578.54 400.05 524.09 386.40 313.94

174
COMPANYWISE/SCHEMEWISE EXPENDITURE & INVESTMENT - (NON-MINING) Contd. Rs. Crs
TOTAL COST DATE OF COMPLETION 2007-08 2008-09 2009-10 2009-10 2010-11 Sl NAME OF THE PROJECT Capacity Sanct. Anticipated Originally Latest Now Cumulative Actuals Actuals No (M.T) Cost Cost Approved Revised Anticipated Expenditure (Original) Upto X Plan
BE RE BE
I Total Mining A+B+C+D 0 0.00 0.00 0.00 0.00 0.00 1154.46 578.54 400.05 524.09 386.40 313.94 E. AAP Sanctioned for new projects
II WASHERIES: Nil Nil Nil Nil Nil Nil Nil Nil Nil Nil Nil Nil III NON-MINING: A. EXISTING (AMRs) Sub-Total A - - - - - - B. COMPLETED PROJECTS: 1. MODERNISATION OF TPS-I (CEA) 40.06 53.39 - - - - - - 2.MODERNISATION OF TPS-I (NLC) 12.30 33.52 - - - - - - 3.400 KV -STAGE-I I (Transferred to PGCL) - - - - - - 5.LIFE EXTENSION PROGRAM TS-I 315.23 258.32 3/99 - - - - - - 6.THERMAL II STAGE-I 213.98 548.42 4/83 1/88 - - - - - - 7.THERMAL II STAGE-II 638.95 1279.76 6/89 6/93 - - - - - - 8.TPS-I EXPANSION 1590.58 1423.47 Feb-01 Unit II Sept-03 355.54 4.91 0.67 0.10 0.10 0.10 TOTAL- (B ) 0.00 0.00 0.00 355.54 4.91 0.67 0.10 0.10 0.10 C. ONGOING PROJECTS: 1. TPS-II EXPANSION 500 mw 2030.78 2453.57 Unit-I Feb '09
Unit-II June '09 Unit-I May '10 Unit-II Nov '10
Unit-I May '10 Unit-II Nov '10
419.61 734.89 507.52 389.00 301.81 327.63
2. TPS at Rajasthan 250 mw 1114.18 1626.09 Unit-I Dec '08 Unit-II June '09
Unit-I Dec '09 Unit-II Mar. '10
Unit-I Dec '09 Unit-II Mar. '10
287.60 440.56 428.31 216.85 231.36 147.16
3. Power Plant at Tuticorin (Coal Based) 1000 mw 4909.54 4909.54 Unit-I Mar. '12 Unit-II Aug '12
Unit-I Apl. '12 Unit-II Sept '12
Unit-I Apl. '12 Unit-II Sept '12
0.51 7.67 222.42 730.00 307.35 826.13
TOTAL- (C) 707.72 1183.12 1158.25 1335.85 840.52 1300.92 D.NEW PROJECTS - X PLAN PROJ i) Formulated awaiting approval: 0 0 0 0 0 0 - - - - - - Sub Total (i) 0 0 0 0 0 0 - - - - - - ii) Yet to be formulated - - - - - - 1. TPS-III 1000 mw - - - 0.40 0.05 0.40 2. TPS at Orissa (Coal Based) 2000 mw 0.02 0.03 - 1.00 0.10 1.00 3. Riri TPS 500 mw - - - - - 0.10 4. TPS at Jayankondam 1000 mw - 0.05 0.10 12.50 0.45 12.35 5. Bithnok Power Station 250 mw 0.03 - 0.08 5.10 0.70 5.60 6. Hadla Power Project 250mw - - - 1.30 0.40 1.85 7. Madhya Pradesh TPS 1000mw - - - 2.00 0.10 1.70 8. Gujarat TPS 1000 mw - 0.06 - 1.50 0.15 1.30 9. Jarkand TPS 1000 mw 0 0.00 0 0 0 - - - 1.00 0.10 1.00 10. Chattisgarh Project 2000mw - - - 1.00 0.10 1.00 11. Uttar Pradesh Power Project 2000mw - - - 5.00 1.00 12.53 12. TPS at Existing NLC TPS I site - AAP 1000 mw - - - 3.00 0.65 2.65 13. Wind Energy Project 50mw - - - - 0.25 325.00 14. Misc. New Schemes - - - - 0.27 2.02 TOTAL- (D) 0.05 0.14 0.18 33.80 4.32 368.50 TOTAL POWER SECTOR (A+B+C+D) 1063.31 1188.17 1159.10 1369.75 844.94 1669.52 GRAND TOTAL (COAL + POWER) 2217.77 1766.71 1559.15 1893.84 1231.34 1983.46

175
Annual Plan 2010-11. FORMAT - 33 STATEWISE EXPENDITURE Name of PSU : NLC Limited (Rs.in Crores)
Cumulative 2007-08 2008-09 2009-10 2010-11 Sl Name of the X Plan Actual Actual BE RE BE No State 2002-2007 Expd Expd 1 4 5 6 COAL SECTOR 1 Tamil Nadu 1,095.00 514.00 343.69 470.65 354.32 268.95 2 Rajasthan (Barsingsar, Bithnok and Riri) 66.16 64.44 56.20 52.09 28.43 39.46 3 Gujarat 0.10 0.10 0.04 0.35 0.02 0.03 4 Orissa (Talabira ) - - 0.12 1.00 3.63 5.50 Total -COAL SECTOR 1,161.16 578.54 400.05 524.09 386.40 313.94 POWER SECTOR 1 Tamil Nadu 1,261.25 747.52 730.71 1,135.00 610.93 1,496.28 2 Rajasthan (Barsingsar, Bithnok and Riri) 535.62 440.56 428.39 223.25 232.46 154.71 3 Orissa 0.09 0.03 - 1.00 0.10 1.00 4 Madhya Pradesh - - - 2.00 0.10 1.70 5 Gujarat 0.06 0.06 - 1.50 0.15 1.30 6 Jarkand - - - 1.00 0.10 1.00 7 Chattisgarh - - - 1.00 0.10 1.00 8 Uttarpradesh - - - 5.00 1.00 12.53 Total -POWER SECTOR 1,797.02 1,188.17 1,159.10 1,369.75 844.94 1,669.52 TOTAL COAL & POWER SECTOR 2,958.28 1,766.71 1,559.15 1,893.84 1,231.34 1,983.46

176
FORMAT - 34Annual Plan 2010-11. COMPANYWISE ENERGY CONSERVATION PROGRAMMES Name of the PSU : NLC Limited
Programme/ Cumulative 2008-09 2009-10 2010-11 Scheme Expenditure Actual Approved Anticipated Proposed
X Plan Expd Outlay Expenditure Outlay 2002-07 BE RE BE 1 2 3 4 5 6
Energy Conservation Measures are Part of Routine Activities in the production & Service Units
No Seperate Outlay is Proposed
Expenditure is met out of Revenue and Non -Plan as the Case may be

177
Annual Plan 2010-11. FORMAT - 37SAFETY & WELFARE MEASURES COMPANYWISE Name of PSU : NLC Limited
2009-10 2010-11 2011-12 Sl Company 2006-07 2007-08 2008-09 Target Anticipated Proposed Proposed No Actual Actual Actual 1 3 4 5 5 NLC Limited
1 Fatality Rate (per MT of Lignite produced)
0.286 0.046 0.14 0.00 0.00 0.00 0.00
2 Fatality Rate (per MU of Power Generated)
0.00063 0.000115 - 0.00 0.00 0.00 0.00
3 Number of houses 21825 21825 21825 21825 21825 21825 21825
Manpower 19115 18940 18688 18952 18952 18347 18347
Housing Satisfaction 100% 100% 100% 100% 100% 100% 100%
(Estimated %)
4 No. of Hospitals 1 1 1 1 1 1 1
No. of Beds 369 369 369 369 369 369 369
No. of Dispensaries 5 5 5 5 5 5 5
5 Water supply - Total 12 12 12 12 12 12 12
Population covered 160,000 160,000 200,000 200,000 200,000 200,000 200,000

178
COMPANY WISE MANPOWER REQUIREMENT
Annual Plan 2010-11.
Name of the PSU: NLC Limited FORMAT 38
Sl COMPANY 2007-08 2008-09 2009-10 2010-11 2011-12 No. Actual Actual Target Antici. Proposed Proposed
1 3 4 5 6 7 8
1 MINES 8229 8019 7978 7978 7873 7873
2 POWER 4243 4116 4095 4095 4041 4041
3 OTHERS 6468 6553 6519 6519 6433 6433
TOTAL NLC 18940 18688 18592 18592 18347 18347

179
FORMAT - 39
STATUS OF SEB WISE OUTSTANDING DUES & SECURITISATION
Name of the PSU: NLC Limited (Rs.in.Crs)
Outstanding Dues Outstanding Dues Outstanding Dues
SEBs Mar-08 Mar-09 Mar-10
Actual Actual Anticipated
1 2 1 2
a. APTRANSCO 48.16 51.73 51.73
b. TNEB 588.43 646.25 646.25
c. KPTCL 163.19 235.87 235.87
d. KSEB 59.70 78.23 78.23
d. PED 8.55 2.36 2.36
Total 868.03 1,014.44 1,014.44

180
FORMAT - 40
STATEWISE ROYALTY/ CESS PAYMENT MADE BY COAL COMPANIES
Name of the PSU: NLC Limited (Rs. Crore)
2006-07
Cumulative X Plan 2002-07
2007-08 2008-09 2009-10 2010-11 Company State
Actuals Actual Actual BE RE Proposed 0 1 3 4 4 5 6 7
Tamil nadu 105.13 507.92 126.59 137.37 137.81 137.24 144.22 NLC
Rajasthan 0.00 0.00 0.00 0.11 3.29 2.89 8.71