annuity margins in the uk - oecd.org - oecd · · 2016-03-29july, 2000 abstract: ... ratio of the...
TRANSCRIPT

1
Annuity Margins in the UK
Mamta Murthi1, J. Michael Orszag2 and Peter R. Orszag3
July, 2000
Abstract: The UK requires individuals with private
pensions to annuitize by the age of 75. Using data on annuity
rates over time, we calculate the financial cost of annuitization
in terms of reduction in yield relative to alternative sources of
wealth holding. We find that for a typical 65-year old male,
annuitization typically involves a reduction in yield of the order
of 1 percent. Selection effects, related to the lower mortality
probabilities of those who annuitize, explain a large portion of
this cost. Costs are raised by delaying annuitization, and by
opting for real over nominal annuities.
Keywords: annuities, implicit yield, reduction in yield,
annuity margin, adverse selection
JEL Classification Nos.: H55, G2, G22
The authors wish to thank (without implicating) numerous reviewers and others who haveprovided us with information and comments. We also would like to specially thank PiersCurrie (Aberdeen Asset Management).
1 Clare Hall, Cambridge CB3 9AL, UK. Email: [email protected] Centre for Pensions and Social Insurance, Birkbeck College, London W1P 2LL. Email:[email protected]
3 Sebago Associates, 951 Old County Rd., Suite 194, Belmont, California 94002. Email:[email protected]

2
I. Introduction
Annuitization is often perceived to be among the more difficult areas of social
security privatisation and reform. For example, an issue brief in the World Bank’s
(1994) Averting the Old Age Crisis identified several core problems associated with
private annuities markets, including adverse selection, mortality risk, and high
commissions. In addition to these core problems, other potential concerns include
the yields on private annuities and the lack of consumer education. In the UK,
which requires individuals with pension accounts to annuitize them by 75, annuity
yields have been falling in tandem with interest rates for nearly a decade. This
decline has resulted in demands for greater flexibility with respect to annuitization
while also drawing attention to potential markups on annuities (particularly in the
wake of the UK personal pension ‘misselling’ episode, which has resulted in large
amounts of compensation for individuals who were poorly advised to take out high
cost personal pensions).
The UK has a long history of mandatory annuitization of pension funds,
dating back to the Finance Act of 1921. The UK’s experience with compulsory
annuitization, along with the existence of inflation-indexed annuities that are less
common or non-existent in many other countries, provides a unique setting in which
to investigate the operations of private annuities markets and derive possible policy
lessons. Lessons from the UK are particularly relevant for other European countries
that are expanding their private pension systems to cope with demographic change.
Many of the issues that the UK now encounters will be relevant for these countries in
the future.
This paper assesses the overall financial cost to the UK consumer of
annuitizing his or her pension fund at retirement.4 It examines costs for two main
types of annuity products on the market: level and indexed, and considers how costs
vary by age at annuitization and by policy size. It then explores changes in annuity
costs over the past decade. Finally, it draws conclusions based on the empirical
findings.

3
An annuity provides a stream of income until one’s death in return for an
initial premium. The implicit ex ante yield on an annuity is the return on the
purchase price of the annuity, taking account of the individual’s expected longevity.
This yield can be compared with the yield on alternative forms of wealth holding,
such as risk-free government bonds. The cost of the annuity, or the annuity margin,
can then be examined through the reduction in yield (e.g., in basis points per year)
associated with investing in an annuity relative to alternative investments.
An alternative way to examine annuity costs is to compare the purchase price
of the annuity with the present discounted value of the future income stream. The
ratio of the two is known as the money’s worth of an annuity (for examples see
Mitchell, Poterba, Warshawsky and Brown, 1999 on the United States; and Brown,
Mitchell and Poterba, 1999, Finkelstein and Poterba, 1999, and Murthi, Orszag,
Orszag, 1999b on the UK; James and Vittas, 1999 provide international comparisons).
In this paper, we employ the reduction in yield approach. This approach has the
advantage of highlighting costs in an easily understandable fashion: as differences in
rates of return. This transparency, in turn, facilitates cost comparisons across age
groups and countries, and provides an intuitive basis for comparison with other
financial services (in terms of annual costs relative to assets under management). In
addition, treating costs as occurring on a continual basis (i.e., as a continual reduction
in yield relative to alternative sources of wealth holding) is attractive because many
of the possible sources of costs arise continually throughout the life of the contract
(Friedman and Warshawsky, 1990).
The sources of annuity costs may be grouped under two categories:
administrative charges and selection effects (Friedman and Warshawsky, 1990;
Mitchell, Poterba, Warshawsky and Brown, 1999). Administrative costs reflect all the
costs that the annuity provider bears, such as marketing the annuity, providing
commissions to agents, investing the proceeds, covering company overheads and
capital requirements, and generating profits. These administrative costs, it is often
surmised, can add up to significant sums, particularly in private markets in the
absence of regulation.
4 In a related paper -- Murthi, Orszag and Orszag (1999a) -- we examine the financial costsduring the accumulation stage of personal pensions.

4
Selection costs, on the other hand, are more subtle. Selection occurs in the
annuities market because people with longer-than-average life expectancies are more
likely to purchase annuities, and more likely to purchase larger annuities, than
people with shorter-than-average life expectancies. (Given the mandatory
annuitization rules in the UK, selection may occur both because of selection in who
holds individual accounts during the accumulation phase and the timing of
annuitization.) The insurance companies that sell annuity policies consequently
price them based on the longer life expectancies of the annuitants. A typical person
with average life expectancy must therefore pay a higher price for an annuity than
would be justified on the basis of average life expectancy.
It is worth making two additional points about selection in annuities
markets. First, selection may arise both from socio-economic differentials in
mortality as well as asymmetric information. To the extent that insurers in the UK
rarely use socio-economic factors in pricing, the observed socio-economic
differentials could well be due to asymmetric information arising from the costs of
verifying asset or income data accurately. Therefore, it is debatable how much of the
selection effects are due to adverse selection and how much are due to objective un-
priced mortality differentials among risk classes. Second, selection costs are a
financial loss only relative to the actuarially fair annuity for that typical individual.
They do not necessarily show that the annuitant fails to gain in utility terms from the
purchase of an annuity. Nor do the lower rates of return necessarily suggest that
annuities are ‘dominated’ by other forms of wealth-holding, since other assets do not
provide insurance against longevity. 5
5 For further discussion of the expected utility of purchasing an annuity see Mitchell et. al.(1999).

5
The main findings of the paper are:
• First, for 65-year males, the annuity margin is roughly 1 percent per year.6 In
other words, the typical 65-year old can expect a yield over his lifetime that is
roughly 1 percent less than that implied by anticipated population mortality and
the current yield structure on riskless government bonds.
• Second, the pure administrative cost loading on annuities is relatively low. The
main source of reduction in yield or cost is therefore due to selection effects.
These findings are consistent with research on annuities markets elsewhere (e.g.
United States, see Poterba and Warshawsky, 1999).
• Third, annuity costs rise with age. Annuity margins are significantly higher
when annuitization takes place close to the mandatory upper limit (75 years) than
earlier.
• Fourth, real (inflation-indexed) annuities are considerably more expensive than
nominal annuities.
• Finally, although annuity margins have been roughly constant for the past five
years, they are higher than they were a decade ago.
These findings are discussed in more detail in the remainder of this paper. In
the next section, we discuss the framework used for computing the annuity margin
and describe our data. Section 3 presents our results. In the final section, we place
the results in a wider context and draw implications for policy.
II. Annuity Margins: Theoretical Framework and Data
An annuity provides a stream of income until one’s death in return for an
initial premium. A standard way of evaluating the value for money of such a
contract is to compare the expected present discounted value (EPDV) of the future
6 Results for similar for female life annuities and joint annuities.

6
income stream with the initial premium paid. The EPDV of a single life annuity can
be written as:
*
1 1(1 )
Tt t
tjt j
A SEPDV
i= =∏=
+∑ (2.1)
where At is the payout at time t, St is the probability that the annuitant survives until
time t, ij is the one-period rate of time preference at time j, and ∏ (1 + ij) is the
discount factor at time t.7 The ratio of the EPDV to the purchase price is known as
the money’s worth ratio (MWR). For an individual deciding on which type of
annuity to buy, an annuity with a higher money’s worth ratio provides greater value
for money. In general, the money’s worth ratio depends on the purchase price, the
size of the future income flow, the individual’s subjective assessment of mortality
risk, and his or her rate of time preference.
The MWR approach, while intuitive, does not easily lend itself to
comparisons of value for money across products for different ages, sexes, or
countries, because the effective duration of the products differ. In order to develop a
measure of value for money that is more amenable to such comparisons, we start
with Eq. (2.1) but make the interest rate, rather than the EPDV, the variable of
interest. Specifically, we wish to find an interest rate sequence ji which solves:
*
1 1(1 )
Tt t
tjt j
A SR
i= =∏=
+∑ (2.2)
where R is the annuity rate on the market. For example, if the term structure is flat,
ji i= , and solving for i gives the internal rate of return on an annuity.
Alternatively, if a zero-coupon term structure involves interest rates jr , we can let
j ji r m= + and solve for m , which then provides the interest rate margin implicit in
the underlying annuity rate. We thus refer to m as the annuity margin, since it
represents the reduction in yield relative to the returns on underlying investment
vehicles. For each set of interest rates jr , we can derive a different annuity margin.
7 It is fairly straightforward to extend this framework to other types of annuities, such as jointlife annuities or those with a minimum guarantee.

7
In this paper, we consider two alternative interest rates: the yield on UK
government bonds and the the yield on UK bonds issued by the European
Investment Bank (EIB). Like the high grade corporate bonds insurance companies
typically hold in their portfolio, the yield on EIB bonds is higher than that on UK
government gilts to compensate for the slightly higher levels of risk on the EIB
bonds. In general, given the need for insurance companies to generate a reasonable
profit and the administrative costs associated with annuity products, we expect m to
be positive (that is, we expect annuities to provide a return that is below the
opportunity cost of funds). The difference in the two yields is a measure of the cost
of the annuity contract.
Table 1 presents data on annuity payouts for male life annuities for the week
ending April 28, 2000. The data are from Ratetracker, a product of the Research
Department, which reports various annuity rates from the 15 to 20 major providers
in the market. Table 1 has data on both level annuities (on which the payout is fixed
in nominal terms) and indexed annuities (on which the payout is indexed to the retail
price index). Payouts are presented for three ages (65, 70, and 75 years), and two
policy sizes, one small (purchase price £10,000) and other large (purchase price
£100,000).8
The top panel shows that a 65-year old man purchasing a typical £10,000 level
annuity could expect to receive an annual payment of £872 for life. Not surprisingly,
annuity payouts increase with age (since there are fewer years over which the
payments are expected to be made). Thus a 70-year old man would receive an
annual payout of £1,032 a year, and a 75-year old man £1,250 a year. The initial
payout is lower for an indexed annuity. A 65-year old would expect to receive a
starting payment of £633 for an indexed annuity, compared to the £872 for a level
annuity. Payouts are also more generous for larger policies. For an initial premium
8 In addition to age, gender, type of annuity (level or indexed) and policy size, the precisepayout depends on payment frequency (monthly, semi-annually, or annually), whetherpayment is in advance or in arrears, and whether there is a guarantee period. Our dataassume that payments are made monthly, in advance, and that there is no guarantee. Pensionannuities may also be ‘open-market options’ or ‘compulsory purchase’. In this paper wefocus on the former. Murthi, Orszag and Orszag (1999b) show that there is little differencebetween these two segments of the compulsory market.

8
of £100,000, individuals receive a payout that is more than 10 times the payout from
a £10,000 policy, irrespective of age and policy type.9
Table 1 also gives an indication of the degree of dispersion at the upper end
of the market. In general, there is a small difference (typically less than 3 percent)
between the average (median) rate and the fifth best rate. Differences between the
average and the top rate are greater, on the order of 6-7 percent. The top half of the
market thus tends to be closely clustered, suggesting that the market is highly
competitive, at least for those who search for the best price.
As mentioned above, we consider mortality from two perspectives, the
average person and the average annuitant. For general population mortality, we use
the current projections of the Government Actuary's Department (GAD).10 For the
mortality experience of annuitants, we use reports from the Continuous Mortality
Investigation Bureau (CMIB), an industry body which collects information on
mortality and morbidity of individuals insured by life-insurance companies. The
CMIB also publishes mortality projection factors based on past mortality
improvements for use in actuarial valuations. We use tables and factors currently in
use, available from CMI Reports 16 and 17. 11
Table 2 gives an indication of mortality differences between the general
population and annuitants. The table presents expected mortality for the cohort of
men attaining the age of 65 in 2000. Annuitant mortality is presented in terms of
both ‘lives’ (individual death rates) and ‘amounts’ (deaths weighted by policy size).
We focus for the moment on the ‘lives’ column. The ‘amounts’ figures are discussed
further below. Looking at the ‘lives’ column, we see that annuitant mortality is
9 The only exception is the best quote in the market for indexed annuities. The issuingcompany, Standard Life, does not appear to offer significantly better rates to large policyholders who buy indexed annuities.10 The tables currently in use (ELT15) are based on the mortality experience of the UKpopulation during the period of the 1991 Census. Mortality improvements are assumed toapproach a rate of 0.5 percent per annum over a 40-year horizon. We are grateful to SteveSmallwood for making these data available to us.11 The tables (PML92 and PMA92) are based on the mortality experience of annuitants during1991-94. For the projections, mortality at each age is assumed to decrease exponentially overtime to a limiting value, with the speed of convergence depending on age. At t=∝ , thereduction in mortality varies between 45-70 percent. See Part 6, CMIR No. 17, available fromhttp://www.actuaries.org.uk.

9
considerably lighter than mortality among the general population. We expect
annuity rates to reflect the fact that insurers are pooling mortality experience among
a group that has higher survival chances than the population as a whole. In terms of
yields, we expect to find higher yields if we use annuitant mortality in place of
general mortality, since the payout period is longer based on annuitant mortality.
Correspondingly, we expect to find lower margins or costs (since the costs arising
from selection are not relevant). Indeed, the margin computed using annuitant
mortality provides an estimate of ‘pure’ administrative costs since it nets out the cost
component that may be ascribed to the greater longevity of the annuitant population.
It is not clear to what extent the difference in mortality experience is due to
private information on the part of the annuitants as opposed to their income and
wealth background. There are significant differentials in mortality by socio-
economic class in the UK. Table 3 provides evidence on mortality by socio-economic
class from the latest survey of health inequalities in the UK.12 For example, during
1987-91, men aged 60-64 in classes I-II were nearly 40 percent less likely to die before
reaching the age of 65 than men in classes IV-V. Some of this difference may be
reflected in lower-than-average annuitant mortality since most self-employed, part-
time workers, and others at the lower end of the income scale are not covered by
occupational pension schemes that comprise the bulk of annuitants. On the other
hand, occupational schemes do cover those in heavy manual occupations, who often
have higher-than-average mortality.
In addition to mortality differences by class, there are other features of the
annuities markets in the UK that encourage higher mortality individuals to opt into
separate risk categories. Insurers offer “enhanced life” annuities with better payouts
for those with lower-than-normal life expectancy. As more people take these
annuities, the average life expectancy of the remaining pool rises.
12 See Health Inequalities Decennial Supplement, Office for National Statistics, September1997. The data are for England and Wales and cover the period 1987-91. Social class isassigned on the basis of occupational status (employee, self-employed, unemployed) and jobsector. For further discussion of class differentials in mortality among the British population,see Coleman and Salt, 1992. The seminal Whitehall studies on income and mortalityexperiences within the British Civil Service are discussed in Michael Marmot et. al., 1991,pages 1387-93.

10
Individuals may also act on private information on their mortality prospects.
Although annuitization is mandatory, it may be delayed up to the age of 75.13
Private information on mortality may encourage individuals to opt for withdrawals
from their pension fund (subject to the legal maximum) until the age at which they
can no longer put off annuitization, since this strategy would allow the possibility of
bequest of one’s pension savings. Short-lived individuals may thus drop out of the
pool of annuitants.
Selection effects may also be evident in the size of the policy. Those who buy
larger policies tend to live longer. This effect can be seen from the ‘amounts’ column
in Table 2, which presents expected mortality weighted by policy size (rather than
numbers of people). As before, the role of socio-economic background versus
individual behaviour is unclear. Richer people have higher pension savings and live
longer. Equally, a small policy could be indicative of someone who has chosen to
draw down his or her pension saving (up to legal maximum) in anticipation of an
early death.
Finally, to compute annuity margins, we use two sets of interest rates: the
yields on UK government bonds and the yields on European Investment Bank UK
pound bonds. These data are available for maturities ranging from 1 to 30 years,
with gaps. We fill in the term structure by assuming that yields for missing
maturities are identical to immediately adjacent periods. So, for example, for UK
government bonds where yields are available for maturities from 2 to 30 years, the 1-
year yield is assumed to be the same the 2-year yield, and yields beyond 25 years the
same as the 25-year yield. For discounting nominal cash flows, we use nominal
yields. For indexed annuities, we treat the real payout as fixed and discount using
real interest rates.
13 For a fuller discussion of the rules governing annuitization in the UK, see Appendix.

11
III. Annuity Margins in the UK
Our main findings are presented in Tables 4 through 6 and Figures 1 and 2.
Computations are for male life annuities and use the average (median) market rate.14
Mortality tables and interest rates are the ones discussed previously. Table 4
presents the yield equivalent for level annuities on April 28, 2000, while Tables 5a
and 5b present annuity margins assuming alternative interest rates. In Table 6, we
examine indexed annuities, while in Figures 1 and 2 we turn to trends over time.
Table 4 shows the yield equivalent on level annuities purchased at three
different ages. For the average individual, who expects his mortality to be in line
with the general population, the expected yield on an annuity is on the order of 2 to 4
percent, depending on age. For the individual who expects to live longer, the return
is higher since the payout period is longer. For the average annuitant, the expected
return is of the order of 4 to 5 percent. Although we do not show the calculations
here, these yields are close to the best that can be attained by searching within the top
end of the market (see Table 1 for information on dispersion in annuity rates).
However, they are frequently below the contemporary yields on risk-free fixed-
income instruments such as government bonds. This difference allows us to
compute the annuity margin, to which we will turn to below.
Table 4 also highlights the fact that annuity returns fall with age. Thus a
typical 65-year who annuitizes on reaching the statutory retirement age can buy an
annuity which yields significantly more over his (expected) life-time than an
individual who postpones annuitization till the age of 75. The higher yield on age 65
annuities is related to two factors. First, the majority of individuals annuitize at the
statutory retirement age and competition in this segment of the market is intense.
Firms may offer relatively high payouts to 65-year olds in order to acquire market
share and achieve economies of scale. Second, there may be an element of selection
in the decision of when to annuitize. Late annuitization is often the preferred option
of the relatively well-off who have other sources of income to sustain them in
14 Results for female life annuities and joint and survivor annuities are very similar to that formale life annuities. For a detailed examination of these types of annuities, see Murthi, Orszagand Orszag, 1999b.

12
retirement. This adverse selection will lead to underwriting losses if insurers
continue to provide payouts that are actuarially fair to annuitants as a whole.
Table 4 also points to higher yields for those with larger policies. Since there
are fixed costs in writing an annuity contract, the lower yield on small contracts may
be a reflection of the fact that fixed costs are a larger proportion of a small contract
than a large one. However, those purchasing large contracts are also likely to be
richer and longer-lived. From the yield estimates, it appears that savings in
administrative or other costs in the case of large policies more than compensate
insurers for the likely longer duration of payment.
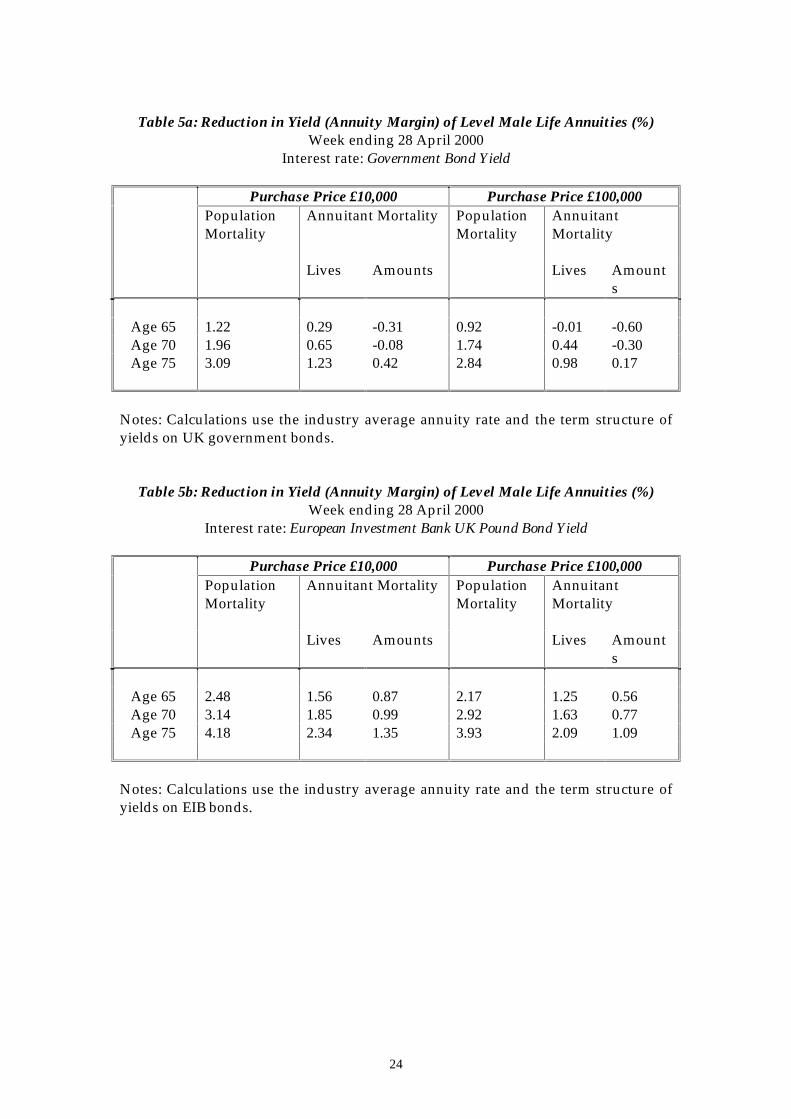
Tables 5a and 5b provide estimates of the annuity margin. From the
viewpoint of the average individual whose alternative investment is government
bonds (5a), the ‘cost’ of buying a £10,000 policy is a reduction in yield of 122 basis
points if he is a 65, rising to 309 basis points if he delays till 75. Individuals expecting
higher longevity would perceive the costs as lower. Thus a 65-year average
annuitant would perceive a reduction in yield of 29 basis points, while a 75-year old
would perceive a reduction of 123 basis points. These figures also provide an
estimate of the ‘pure’ administrative charge loading on annuities. The difference in
yields by policy size discussed in the previous paragraph is reflected in Table 5a in
terms of lower margins on large policies. A 65-year average annuitant purchasing a
£100,000 policy would perceive a marginal improvement (1 basis point) over
government bond yields (as opposed to a loss), while a 75-year old would perceive a
loss of 98 basis points (relative to 123 basis points).
A comparison of costs using the different annuitant mortality tables (lives
versus amounts) is also instructive. The lives table is more relevant from the
individual’s point of view as the individual is concerned with expected yield over his
lifetime. The insurer, on the other hand, is more concerned with likely payout per £
of premium collected. For the insurer, the amounts table is the more relevant.
When we compare the two columns for a £10,000 annuity, we see that what appears
as a reduction in yield relative to government bonds to the 65-year old individual is a
loss to the insurer. In other words, when mortality is weighted by the premiums
collected, the insurance company appears to expect to pay out more on the annuity

13
contract than it can earn via investment in gilts. The same is true for annuities for 70-
year olds. Only given the higher margins charged on annuities for 75-year olds does
the insurance company move into profits, expecting to earn 42 basis points above
gilts.
Annuities may be written at rates that are higher than yields on gilts because
insurance companies invest in riskier but more rewarding assets such as EIB bonds.
Table 5b utilises the EIB bond rate to compute the annuity margin. From the
viewpoint of the average insurance company that is likely to invest in corporate
bonds, the margin on a £10,000 policy is 87 basis points for a policy sold to a 65-year
old, rising to 135 basis points for a 75-year old. Margins are lower on larger policies,
56 basis points and 209 basis points respectively, for a £100,000 policy. The average
annuitant who may access the higher returns afforded by the corporate bond market
faces a greater reduction in yield than previously: 156 basis points if the £10,000
annuity is purchased when he is 65 rising to 234 basis points if it is purchased when
he is 75. As before, the larger the policy the lower is the likely cost in terms of
forgone yield.
Table 6 draws attention to differences in yields between level and indexed
annuities. Yields are significantly lower for indexed annuities and margins higher.
An average 65-year old purchasing an indexed annuity for £100,000 can expect a
return of 0.45 percent over his lifetime. At 70 years and above, the expected return is
negligible. Correspondingly, annuity margins are high: 162 basis points at 65 rising
to 340 at 75. Returns look a little more promising for the average annuitant, but
margins remain high relative to level annuities. The high cost of inflation insurance
may help to explain why indexed annuities have proved to be relatively unpopular
in the UK.15 It would be hard to ascribe the higher cost to the cost of bearing inflation
risk, since insurers can avoid some if not all of this risk through inflation-indexed
bonds. A part of the explanation may lie in selection effects since indexed annuities,
15 The annuity broker Annuity Bureau reports 83.5 percent of its customers buy levelannuities and only 5.3 percent opt for any type of escalating annuity (see Peter Quinton,“Good News for Innovators”, Pensions Management, June 1999, p. 82). The proportion of thepopulation purchasing level annuities may be even higher than these figures suggest becauseof the composition of the consumer base of the Annuity Bureau.

14
which provide greater value in the later years of life, are likely to be favoured by
those who expect to live long.
We now look at trends in yields and annuity margins over the 1990s. Figures
1 and 2 provide insight into whether the findings discussed above for April 2000 are
typical. For simplicity, we focus on one type of annuity (level) for one age group (65-
year olds).16 Income streams are discounted using the term structure of yields on UK
government bonds prevalent at the time the annuity was written. Likewise,
mortality assumptions are contemporary. We present calculations using one set of
mortality tables: annuitant (amounts).17 The choice of example is not significant.
Our findings are similar for other annuity types using alternative assumptions
regarding interest rates and mortality.
Figure 1
Y ie ld e q u iv a le n t fo r 6 5 y e a r m a le a n n u i ty
0
5
1 0
1 5
O c t- 8 9 O c t- 9 1 O c t- 9 3 O c t- 9 5 O c t- 9 7 A p r - 9 9
Yie ld e q u iv
Figure 1 draws attention to the decline in annuity yields since the early 1990s.
This decline is clearly related to the fall in market interest rates. Yields have fallen
from 10-12 percent in the early 1990s to half that level (5-6 percent) more recently.
This decline underlies much of the disquiet in the UK with mandatory annuitization.
16 The data are for level annuities, payable in advance, with a five year guarantee.17 For 1989-1998 we use PMA80, the base (period) tables that were in use at the time and allowfor improvements in mortality probabilities of 4 percent per year at all ages (see MacDonald,1996 on trends in annuitant mortality in the 1960s and 1970s). For 1999-2000, we use PMA92,
15
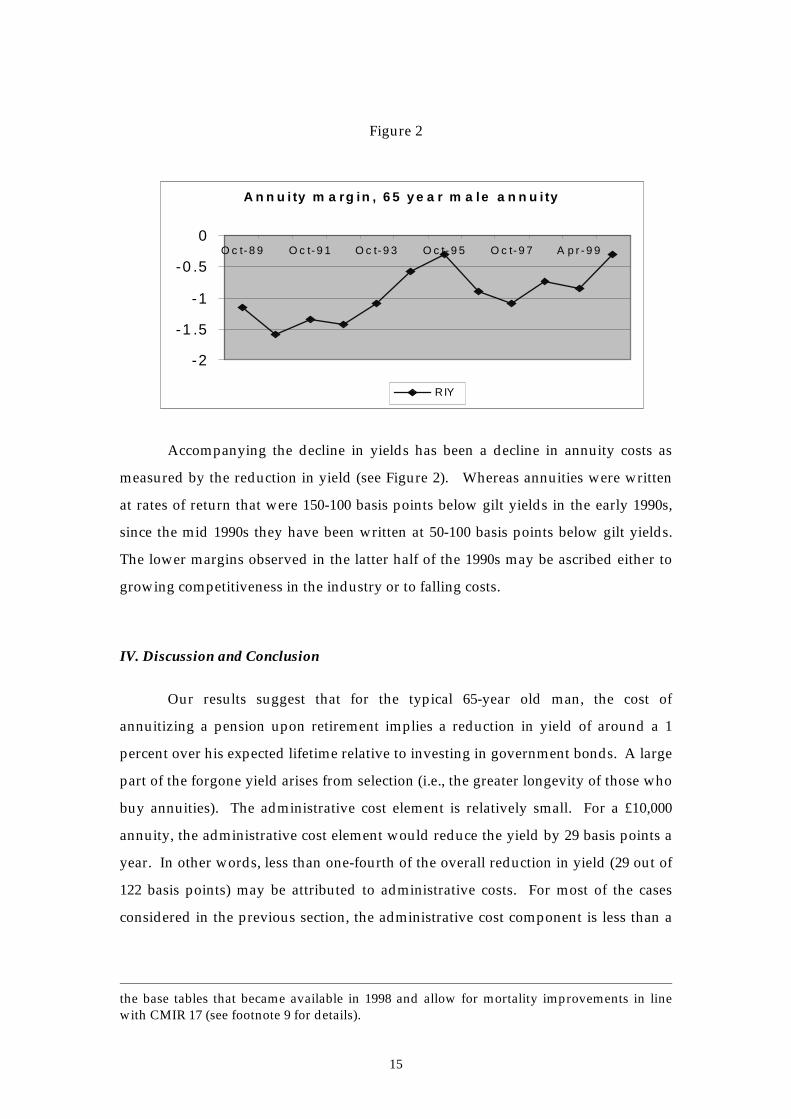
Figure 2
Accompanying the decline in yields has been a decline in annuity costs as
measured by the reduction in yield (see Figure 2). Whereas annuities were written
at rates of return that were 150-100 basis points below gilt yields in the early 1990s,
since the mid 1990s they have been written at 50-100 basis points below gilt yields.
The lower margins observed in the latter half of the 1990s may be ascribed either to
growing competitiveness in the industry or to falling costs.
IV. Discussion and Conclusion
Our results suggest that for the typical 65-year old man, the cost of
annuitizing a pension upon retirement implies a reduction in yield of around a 1
percent over his expected lifetime relative to investing in government bonds. A large
part of the forgone yield arises from selection (i.e., the greater longevity of those who
buy annuities). The administrative cost element is relatively small. For a £10,000
annuity, the administrative cost element would reduce the yield by 29 basis points a
year. In other words, less than one-fourth of the overall reduction in yield (29 out of
122 basis points) may be attributed to administrative costs. For most of the cases
considered in the previous section, the administrative cost component is less than a
the base tables that became available in 1998 and allow for mortality improvements in linewith CMIR 17 (see footnote 9 for details).
A n n u i ty m a rg in , 6 5 y e a r m a le a n n u i ty
-2
-1 .5
-1
-0 .5
0O c t- 8 9 O c t- 9 1 O c t- 9 3 O c t- 9 5 O c t- 9 7 A p r - 9 9
RIY

16
half of the overall cost. The one exception is indexed annuities, which are discussed
further below.
How do costs of this magnitude compare with costs incurred at the earlier
stage when the consumer is accumulating pension savings? Even if we include the
costs of selection, annuitization costs are relatively low in the UK compared to the
costs of accumulation. A simple way to compare costs at the two stages is in terms of
the impact on accumulated pension saving. In a no charge scenario, an individual
would be able to annuitize his pension savings at actuarially ‘fair’ rates that reflect
his mortality probability. Although he would have to pay some intermediation costs
for the services provided by the insurance company, there would be no costs
associated with factors such as monopoly profits earned by the insurer in imperfectly
competitive markets. The ‘loss’ to the consumer from market imperfections
(including selection) can be estimated as the ratio of annuity yields in the two
scenarios, one without charges and one with charges. Table 5a provides some
guidance on the size of this financial ‘loss’. For the average 65-year old buying
£10,000 annuity, if prices were in line with general population mortality, the
expected lifetime yield would be 4.56 percent. With selection, it is reduced to 3.65
percent, or by around 20 percent. For larger annuities, the ‘loss’ is lower e.g. it is 18
percent for £100,000 annuity. Some of this reduction in value is owed to normal
intermediation costs, including the normal profits of the annuity provider. Thus a
smaller figure, say 10 or 15 percent, would be a reasonably conservative estimate of
the financial losses associated with annuitization. In Murthi, Orszag and Orszag
(1999a), we found that the historical level charges during the accumulation stage of a
personal pension amount to 36 percent of the accumulated balance on average.18
These figures suggest that the annuitization phase is thus significantly less costly
than the accumulation phase in the UK, although that at least partly reflects the high
level of accumulation charges.
18 The figure takes account both of charges imposed on personal pension individual accountsand the effect of low persistency. See Murthi, Orszag, and Orszag (1999a) for full details. Withthe advent of Stakeholder Pensions and a 1% cap on total charges, there has been adramatical fall in both the level and degree of frontloading of charges in 1999 and 2000.

17
Our finding that annuitization costs are low relative to accumulation costs is
consistent with other features of the annuities market in the UK. Although IFAs who
advise on annuities are typically paid through commission, commissions tend to be
low relative to other financial products. Moreover, once sold, annuities are relatively
easy to administer. This would tend to keep administrative costs low. Unlike
personal pensions, pension annuities are irreversible, so providers do not bear any
lapse risk. Annuities are also a useful balance against life insurance liabilities, so
providers may be willing to sell them at quite competitive prices. It may also be the
case that consumers benefit from economies of scale in the annuities market. While
there are no publicly available quantity data by company in the UK, we were able to
piece together market share data using the regulatory returns of the insurance
companies.19 In 1997, the top 4 annuity companies had 63 percent of the market. By
comparison in 1997, the market share of the top 4 insurance companies in terms of
new premia for pension business was 34 percent and for overall life insurance
business was 20 percent. On the consumer demand side, two further factors may
contribute to relatively competitive pricing. First, annuities are ‘commoditised’, so it
is easy for consumers or advisers to compare rates across products. Second,
purchases are for relatively large amounts, so customers have an incentive to search
extensively.
While annuity costs are low relative to accumulation costs, we find evidence
of relatively high costs for some products, notably indexed annuities. This is an area
that requires further investigation. We believe the high costs are due to a
combination of greater selection effects and the greater difficulty of matching real
liabilities with real assets. The high cost of indexed annuities quite likely acts as a
deterrent to investing in a product that provides a fixed income in real terms. This
has important implications for public policy. The fact that the bulk of annuitants buy
level products means that most annuitants will see their real pensions erode over
time, with implications for poverty rates among the elderly and the call on state
benefits. The fact that indexed annuities are more expensive also carries implications
for financial planning under private defined contribution schemes, especially in
19 We used Form 47, Col. 3, Line 10 (Non-linked, non-profit single premium pension policies)for non-linked annuity policies. Analysis of many of the 1997 raw DTI returns of topcompanies suggested that this was a reasonable estimate.

18
comparison to public pay as you go (PAYG) pension systems. Most PAYG social
security arrangements provide price-indexed benefits in retirement. Given the
greater costs of indexed annuities, savings in private defined contribution plans will
need to be higher if the purpose is to replicate the indexed aspect of state
arrangements.
We also observe that annuity costs rise with age, so the highest costs are paid
by those who annuitize at the statutory upper limit. Postponing annuitization can
thus have a significant independent cost on retirement income. This fact needs to be
brought to bear in modelling the annuitization decision. 20
Finally, we need to point out that out that our results have a number of
important caveats. Perhaps the most important is that our focus is on means, not
distributions. Although we find the annuities market to have low costs relative to
the accumulation phase for the typical worker, a large fraction of individuals may
not be getting good yields on their annuity purchases. The paradox arises because
relatively unsophisticated investors with small pension funds often do not exercise
their option to buy an annuity from the most competitive provider in the market.
A further caveat relates to mortality assumptions. As indicated, mortality
improvements in the UK have been far greater than previously anticipated. An
analysis of yields and margins that takes full account of mortality risk may well yield
higher yields and lower costs than our risk-neutral calculations would suggest.
20 For further discussion of the individual’s annuitization decision see Khorasanee, 1996,Milevsky, 1998, Kapur and Orszag, 1999.

19
Bibliography
Brown, Jeff, O. Mitchell, and J. Poterba (1999), “The Role of Indexed Bonds and Real
Annuities in an Individual Accounts Retirement Program”, NBER Working Paper
7005, March 1999.
David Coleman and John Salt (1992), The British Population: Patterns, Trends and
Processes, Oxford University Press.
Amy Finkelstein and James Poterba (1999), “Selection Effects in the Market for
Individual Annuities: Evidence from the United Kingdom”, NBER Working Paper,
May 1999.
Benjamin Friedman and M. Warshawsky (1990), “The Cost of Annuities: Implications
for Savings Behaviour and Bequests”, Quarterly Journal of Economics, 105, 135-54.
Estelle James and Dmitri Vittas (1999), Evidence on How Annuities Markets World
Around the World, Presented at World Bank Conference New Ideas About Old Age
Security, Sept. 1999.
Sandeep Kapur and J. Michael Orszag (1999), "A Portfolio Approach to Investment and
Annuitization During Retirement", May 1999, available at http://www.pensions-
research.org/papers
M. Zaki Khorasanee (1996), "Annuity Choices for Pensioners", Journal of Actuarial
Practice, 4(2), pp.229-255.
Angus S MacDonald (1996), “United Kingdom”, in The Second Actuarial Study of
Mortality in Europe, ed. by A. MacDonald. Groupe Consultatif des Associations
D’Actuaires des Pays des Communautes Europeennes.
Oonagh McDonald (1999), “Income in Retirement: Are Annuities the Answer?”,
Association of Unit Trusts and Investment Funds, 1999.

20
Michael Marmot, George Davey Smith, Stephen Stansfield, Chandra Patel, Fiona
North, J. Head, Ian White, Eric Brunner, and Amanda Feeny (1991), “Health
Inequalities among British Civil Servants: The Whitehall II study”, Lancet, June 8,
pages 1387-93.
Moshe Milevsky (1998), “Optimal Asset Allocation Towards the End of the Life
Cycle: To Annuitize or Not To Annuitize?”, Journal of Risk and Insurance, 65, 3, 401-
426.
Mitchell, O., J. Poterba, M. Warshawsky and J. Brown (1999), “New Evidence on the
Money's Worth of Individual Annuities”, NBER Working Paper, August 1997.
Forthcoming in American Economic Review..
Mamta Murthi, J. Michael Orszag, and Peter R. Orszag (1999), “The Charge Ratio on
Individual Accounts: Lessons from the UK Experience”, Birkbeck College Working
Paper 99-2, March 1999 (University of London), available at
http://www.econ.bbk.ac.uk/ukcosts.
Mamta Murthi, J. Michael Orszag, and Peter R. Orszag (1999b), “The Value for
Money of Annuities in the UK: Theory, Evidence and Policy”, Birkbeck College
Working Paper 99-19, 1999 (University of London), available at
http://www.pensions-research.org/annuities.
James Poterba and Mark Warshawsky (1999), “The Costs of Annuitizing Retirement
Payments from Individual Accounts”, NBER Working Paper 6918, January 1999.

21
Table 1: Annuity Payouts (£s) Per Year for MalesWeek ending 28 April 2000
Payouts based on a purchase price of £10,000 or £100,000 (in parentheses)
Age 65 Age 70 Age 75
Industry Average Level 872
(8,942)1,032
(10,481)1,250
(12,694) Indexed 633
(6,533)777
(8,177)978
(10,187)
Fifth Best Level 906
(9,081)1,041
(10,563)1,285
(13,020) Indexed 633
(6,611)791
(8,183)1,016.
(10,214)
Top Rate Level 941
(9,634)1,114
(11,367)1,378
(14,003) Indexed 703
(7,032)865
(8,652)1,093
(10,932)
Notes: Each entry indicates the yearly income in pounds accruing from an open-market option annuity policy with no guarantee period, payable monthly in advance.
Source: Ratetracker (The Research Department)

22
Table 2: General Population and Annuitant Mortality Projections (x 100) for MenAttaining 65 in 1999-2000
Population AnnuitantsLives (PML) Amounts (PMA)
Age:
65 2.1 1.4 1.070 2.9 2.4 1.875 4.9 4.0 3.280 7.7 6.4 5.685 11.8 10.1 9.390 16.9 15.1 14.495 23.4 21.5 21.1100 31.3 29.1 28.8105 45.3 37.4 36.7110 66.7 45.8 44.4
Notes: Each cell gives the probability (x 100) that a person aged x dies beforereaching age x+1.
Source: Government Actuary’s Department (population mortality) and ContinuousMortality Investigation Reports Nos. 16 and 17 (annuitant mortality).
Table 3: Abridged Life Tables by Socio-Economic Class,England and Wales, 1987-91
I-II III M IIIN IV-V AllAge:
60 - 64 0.08 0.10 0.08 0.13 0.1065 - 69 0.13 0.16 0.15 0.19 0.1670 - 74 0.20 0.25 0.23 0.29 0.2575 -79 0.29 0.36 0.33 0.38 0.3580 - 84 0.41 0.48 0.45 0.52 0.4785 - 89 0.64 0.62 0.56 0.62 0.61
90+ 1.00 1.00 1.00 1.00 1.00
Notes: Each cell indicates the probability of a person in the relevant age group dyingbefore reaching the next age group. Socio-economic classes range from I (highest) toV (lowest). Class III is divided into Manual (M) and Non-Manual (N) occupations.
Source: Health Inequalities Decennial Supplement, Office for National Statistics,September 1997.

23
Table 4: Yield Equivalent of Level Male Life Annuities (%)Week ending 28 April 2000
Purchase Price £10,000 Purchase Price £100,000PopulationMortality
AnnuitantMortality
PopulationMortality
AnnuitantMortality
Lives Amounts Lives Amounts
Age 65 3.65 4.56 5.16 3.97 4.87 5.47 Age 70 3.06 4.35 5.08 3.29 4.57 5.31 Age 75 2.10 3.93 4.75 2.35 4.19 5.00
Notes: Calculations use the industry average annuity rate.
24
Table 5a: Reduction in Yield (Annuity Margin) of Level Male Life Annuities (%)Week ending 28 April 2000
Interest rate: Government Bond Yield
Purchase Price £10,000 Purchase Price £100,000PopulationMortality
Annuitant Mortality PopulationMortality
AnnuitantMortality
Lives Amounts Lives Amounts
Age 65 1.22 0.29 -0.31 0.92 -0.01 -0.60 Age 70 1.96 0.65 -0.08 1.74 0.44 -0.30 Age 75 3.09 1.23 0.42 2.84 0.98 0.17
Notes: Calculations use the industry average annuity rate and the term structure ofyields on UK government bonds.
Table 5b: Reduction in Yield (Annuity Margin) of Level Male Life Annuities (%)Week ending 28 April 2000
Interest rate: European Investment Bank UK Pound Bond Yield
Purchase Price £10,000 Purchase Price £100,000PopulationMortality
Annuitant Mortality PopulationMortality
AnnuitantMortality
Lives Amounts Lives Amounts
Age 65 2.48 1.56 0.87 2.17 1.25 0.56 Age 70 3.14 1.85 0.99 2.92 1.63 0.77 Age 75 4.18 2.34 1.35 3.93 2.09 1.09
Notes: Calculations use the industry average annuity rate and the term structure ofyields on EIB bonds.

25
Table 6: Yield Equivalent and Reduction in Yields of Indexed Male Life Annuities (%)Week ending 28 April 2000
Interest rate: Government Bond Yield, Purchase price: £100,000
Yield Equivalent Reduction in YieldPopulationMortality
Annuitant Mortality PopulationMortality
AnnuitantMortality
Lives Amounts Lives Amounts
Age 65 0.45 1.39 2.07 1.62 0.68 0.01 Age 70 0.00 1.30 2.14 2.18 0.86 0.02 Age 75 0.00 0.73 1.69 3.40 1.55 0.59
Notes: Calculations use the industry average annuity rate and the term structure ofyields on UK government bonds.

26
Appendix : Annuitization Requirements in the UK21
The Finance Act of 1956 introduced the current requirement of annuitization
before age 75, which it applied to individual pension accounts for the self-employed
(the annuities were known as Section 226 Retirement Annuities). In 1988, when a
broader form of individual accounts known as personal pensions were introduced,
the system became somewhat more complicated:
• The portion of an individual account funded by National Insurance Contribution
(NIC) rebates must be fully annuitized, and the annuity must be purchased at
some point between age 60 and age 75. The annuity payments must be the same
for men and women for a given age of annuitization: providers cannot provide
lower annual payments to women to reflect their longer life expectancies. 22
• The portion of an individual account funded by additional contributions does not
have to be entirely annuitized. In particular, up to 25 percent of the accumulated
balance from this component of the individual account can be withdrawn tax-free
in a lump sum. If the account holder retires before the age of 75,23 the rest of the
account can be distributed in one of three ways: (1) an annuity purchased from a
life insurance company, (2) an annuity purchased from the life insurance
company providing the individual account,24 or (3) an income drawdown facility,
under which the retiree withdraws specific amounts of money while most of the
balance continues to earn market returns. At 75, regardless of which option is
initially chosen, the balance of the account must be converted into an annuity.25
21 For a complete overview of mandatory annuitization in the UK, see Oonagh McDonald,1999.22 These ‘protected rights’ annuities must now also be (RPI) index-linked up to a maximum of5 percent and be underwritten on a joint life basis, even if the individual is not married.23 Individuals designate a retirement age, normally required to be between 50 and 75, fortheir individual accounts.24 In practice in the UK, the vast majority of personal pensions are underwritten through lifeinsurance companies or vehicles, from whom individuals also obtain their retirementannuity.25 There are a wide variety of annuity types, including level annuities, which pay the sameamount in pounds for the term of the annuity; unit-linked annuities, which pay an amountlinked to stock prices for the term of the annuity; index-linked annuities, which pay anamount linked to the retail price index for the term of the annuity; and with-profits annuities,which pay an amount linked to the profits of the provider. Other choices include whether theannuity is single life or joint; minimum guarantee or not; and the frequency of payment(monthly, quarterly, annual, etc.). A recent product introduced by Canada Life allowsindividuals to successively purchase five year temporary annuities, delaying lifetime

27
• All pension annuity income is taxed as ordinary income. The tax-free lump sum
may be used to purchase an immediate (or ‘purchased life’ or ‘voluntary’) annuity,
under which annuity payments are split up into returns on capital and income
for taxation purposes. Since capital is taxed at lower rates, particularly for those
on lower income, voluntary annuities have particular tax advantages. 26
Workers do not have to begin receiving the two components of the individual
account -- the part funded by NIC rebates, and the other part funded by additional
contributions -- at the same time. If workers die before annuitizing their account, the
balance of the account enters their estate. Individuals are not required to annuitize
their account with the financial provider from the accumulation stage: under the so-
called open-market option, individuals are allowed to annuitize their account with
any life insurance company. In summary, although the system is complicated, it still
involves (in most cases) a requirement to annuitize before age 75.
annuitisation until up to age 85. The annuities market thus presents a wide variety -- perhapsa bewildering variety -- of choices for retirees.26 One anomaly is that impaired life annuities involve less proportional tax relief becausecapital amounts are the same as ordinary voluntary annuities but income is greater.