anomalous and anisotropic nanoscale diffusion of hydration...
TRANSCRIPT
This journal is©The Royal Society of Chemistry 2015 Soft Matter
Cite this:DOI: 10.1039/c5sm01713k
Anomalous and anisotropic nanoscale diffusion ofhydration water molecules in fluid lipid membranes†
Laura Toppozini,a Felix Roosen-Runge,b Robert I. Bewley,c Robert M. Dalgliesh,c
Toby Perring,c Tilo Seydel,b Henry R. Glyde,d Victoria Garcıa Sakaic andMaikel C. Rheinstadter*a
We have studied nanoscale diffusion of membrane hydration water in fluid-phase lipid bilayers made of
1,2-dimyristoyl-3-phosphocholine (DMPC) using incoherent quasi-elastic neutron scattering. Dynamics
were fit directly in the energy domain using the Fourier transform of a stretched exponential. By using
large, 2-dimensional detectors, lateral motions of water molecules and motions perpendicular to the
membranes could be studied simultaneously, resulting in 2-dimensional maps of relaxation time, t, and
stretching exponent, b. We present experimental evidence for anomalous (sub-diffusive) and anisotropic
diffusion of membrane hydration water molecules over nanometer distances. By combining molecular
dynamics and Brownian dynamics simulations, the potential microscopic origins for the anomaly and
anisotropy of hydration water were investigated. Bulk water was found to show intrinsic sub-diffusive
motion at time scales of several picoseconds, likely related to caging effects. In membrane hydration
water, however, the anisotropy of confinement and local dynamical environments leads to an anisotropy
of relaxation times and stretched exponents, indicative of anomalous dynamics.
1 Introduction
Diffusion is the fundamental mechanism of motion for lipids,proteins and water molecules throughout a membrane. Whilediffusion describes a stochastic, intrinsically non-directedmotion, many biological processes are related to highly directedmotions. The incoherent interaction between active processesin the cytoplasm was recently shown to lead to random fluctua-tion forces,1 which in return may change the character of adirected motion into a thermally-induced diffusion process.
In biology, diffusion often occurs in crowded media, whichfor instance, have been found to lead to anomalous diffusionof proteins.2–4 The dynamics of the atoms in protein or lipidmolecules are more complex than those in ordinary liquids.In a simple liquid, atoms move ballistically at short times,followed by a crossover to Brownian diffusion. In dense fluids a‘‘caging’’ effect is observed, where the atoms can be trappedmomentarily by their neighbours. The motions of protein andlipid atoms are further complicated by their polymeric struc-ture, characterized by connectivity and flexibility.
Sub-diffusion of lipid molecules in membranes has beenobserved in computer simulations.8–10 The experimental obser-vation of sub-diffusive lipid or hydration water motion, however,has turned out to be more difficult and a conclusive observationhas yet to be reported.11,12
While numerous studies addressed nanoscale lipid dynamics,see, e.g.,5–7,13–21 significantly less work has been done to studydynamics of membrane hydration water, most likely due to thecorresponding computational and in particular experimentalchallenges. However, hydration water was shown to have distinctproperties as compared to bulk water, such as a slower diffusion,22
reduced freezing temperature23,24 and glassy dynamics.25
Properties of hydration water play an important role for thedynamics of biological systems up to the point that theircorresponding dynamics have been suggested to be ‘‘slaved’’by the solvent’s fluctuations.26 Protein dynamics and foldingwere reported to strongly depend to hydration water dynamics.27–29
Lipid structural dynamics have a complex relationship with hydra-tion water30 and coupling of membrane and hydration waterdynamics has been reported.24,31
From computer simulations of lipid bilayers, sub-diffusiveand ballistic regimes of hydration water motions have been pre-dicted on short time scales and correspondingly small distances.32,33
Water molecules are expected to move anisotropically whendiffusing along the membranes or approaching and penetrat-ing the bilayers, as reported from nuclear magnetic resonanceimaging34 and are shown to slow further from the introduction
a Department of Physics and Astronomy, McMaster University, Hamilton, Ontario,
Canada. E-mail: [email protected] Institut Laue-Langevin, Grenoble, Francec ISIS, Rutherford Appleton Laboratory, Didcot, UKd Department of Physics and Astronomy, University of Delaware, Newark, Delaware,
USA
† 87.16.D-, 87.15.Vv, 83.85.Hf, 87.15.A-
Received 11th July 2015,Accepted 18th August 2015
DOI: 10.1039/c5sm01713k
www.rsc.org/softmatter
Soft Matter
PAPER
Publ
ishe
d on
19
Aug
ust 2
015.
Dow
nloa
ded
by J
OIN
T I
LL
- E
SRF
LIB
RA
RY
on
17/0
9/20
15 1
5:15
:42.
View Article OnlineView Journal

Soft Matter This journal is©The Royal Society of Chemistry 2015
of proteins by sum frequency generation spectroscopy.35
Time-resolved vibrational spectroscopy has shown that waterin DOPC membranes is distributed anisotropically and formsnano-clusters36 for a range of hydration levels, supported bymolecular dynamics simulations.37
While water molecules can penetrate lipid bilayers,38 theperpendicular diffusion, D>, is typically at least an order ofmagnitude lower than lateral diffusion along the bilayers. Watermotion through a bilayer is not a simple diffusion process asfree energy and diffusion rate strongly depend on the positionin the bilayer.39
In this work we combined neutron diffraction, incoherentquasi-elastic neutron scattering and computer modelling tostudy nanoscale diffusion of hydration water molecules through-out lipid bilayers on length scales of B3–100 Å. By preparingoriented membranes, the experimental results give unambiguousaccess to the anisotropic local molecular confinement geo-metry to which the diffusive processes are restricted. Large,2-dimensional detector arrays further enabled us to differenti-ate between motions of water molecules along and across themembranes separately.
Hydration water diffusion was also modelled using Browniandynamics in a coarse-grained simulation of the trajectory ofwater molecules represented by center of mass coordinatefor 10 ms (in time steps of 0.1 ps). Diffusion constants andpotentials for water molecules are specific to the region, such ashydrophobic core and hydration water layer, with frictionincluded as an effective term. From the computer model, wefind that the anisotropy of confinement and local dynamicalenvironments of membrane hydration water lead to an aniso-tropy of relaxation times and stretched exponents, indicative ofanomalous diffusion.
2 Materials & methods2.1 Experimental sample preparation
2.1.1 Bulk water sample. The bulk water sample consistedof a cylindrical aluminum annulus filled with ultra pure H2Owith a resistivity of 18.2 MO cm. The walls of the annulus wereseparated by 0.1 mm and the can was held at room temperature
(T = 21 1C = 294 K) during the measurement. Vanadium foil wasbent to the same shape as the annulus and used to measure theenergy resolution at the different incident neutron energies.
2.1.2 Membrane samples. Highly oriented, multi-lamellarstacks of 1,2-dimyristoyl-3-phosphocholine (DMPC) and chaindeuterated DMPC (DMPC-d54) were prepared on 200 single-side polished Si wafers of thickness 300 mm. A solution of16.7 mg mL�1 DMPC in 1 : 1 chloroform and 2,2,2-trifluoroethanol(TFE) was prepared. The Si wafers were cleaned by alternate12 minute sonications in ultra pure water and methanol at40 1C (313 K). This process was repeated twice. The cleanedwafers were placed on a heated sample preparation surface,which was kept at 35 1C (308 K). This temperature is well abovethe main phase transition for DMPC that occurs at 23.4 1C(296.4 K), thus the heated substrates ensured that the lipidswere in the fluid phase during deposition and the self-assemblyof the lipids. An aliquot of 1.2 mL of the lipid solution wasdeposited on each Si wafer and allowed to dry. The wafers werekept under vacuum overnight to remove all traces of solvent.Following this protocol, B3000 highly-oriented, stacked mem-branes were supported on each wafer with a total thicknessof B10 mm.
Deuterated lipids, DMPC-d54, hydrated with H2O, were usedfor the incoherent experiment to emphasize the incoherentscattering of the hydration water molecules. In order to studywater dynamics from the quasi-elastic neutron scattering experi-ments, eighteen Si wafers were stacked with two 0.3 mm aluminumspacers placed in between each wafer to allow for the membranesto be properly hydrated. Wafers and spacers were stacked into analuminum sample can, as shown in Fig. 1(a)–(c). Aluminum foilbetween the wafers and sample can lid provided tension tokeep the wafers in place. Samples were then hydrated with ultrapure H2O and incubated at 30 1C (303 K) for 24 hours before themeasurements. Energy resolution was determined by cooling asample with a large incoherent scattering contribution consist-ing of protonated lipids hydrated with H2O down to 15 K tofreeze all molecular dynamics, such that the observed scatter-ing was considered to be purely elastic.
In this experiment, the bilayers were hydrated from watervapor to avoid high absorption and background signals frombulk solvent hydration.40 Solvent-saturated filter paper was
Fig. 1 Sample cans used for the neutron scattering experiments. (a) A cylindrical sample can was used for the incoherent neutron scatteringexperiments. (b) 18 200, 300 mm thick Si wafers were loaded into the aluminium cans. (c) Wafers were separated by 0.3 mm thick aluminum spacersto allow for hydration and the remaining space was filled with aluminum foil. (d) Sample can used for the neutron reflectivity where a single 200 waferwas mounted.
Paper Soft Matter
Publ
ishe
d on
19
Aug
ust 2
015.
Dow
nloa
ded
by J
OIN
T I
LL
- E
SRF
LIB
RA
RY
on
17/0
9/20
15 1
5:15
:42.
View Article Online

This journal is©The Royal Society of Chemistry 2015 Soft Matter
placed above loosely packed balls of aluminum foil andcadmium shields were mounted carefully to avoid scatteringof the filter paper and bulk water. The can was mounted insideof a temperature controlled cryostat with a temperature stabi-lity of �0.01 K. Data were taken while the membranes werefully hydrated and in their fluid phase, at a temperature ofT = 30 1C (303 K). Due to the typically low scattering of thesample (B10%), we did not observe evidence of multiplescattering events.
The membrane structure was determined via neutron dif-fraction in which a single Si wafer was mounted in an aluminumcan, as shown in Fig. 1(d) and aligned in a temperature con-trolled chamber on a neutron reflectometer. Temperature wasset to T = 30 1C (303 K) and controlled by a circulating water bathto better than �0.1 K. Samples were hydrated with ultra pureH2O or heavy water (D2O), and incubated at 30 1C (303 K) for24 hours before the measurements.
2.2 Elastic and quasi-elastic neutron scattering
2.2.1 Neutron diffraction on OFFSPEC. The structure ofthe bilayers was studied through neutron reflectivity at theOFFSPEC reflectometer at ISIS, the pulsed neutron and muonsource at the Rutherford Appleton Laboratory in Oxfordshire,UK.41,42 OFFSPEC is a vertical, flexible, low background, reflecto-meter and was used in its unpolarized mode.
We used OFFSPEC to probe the structure of the lamellarbilayers perpendicular to the plane of the bilayers. The thicknessof the hydration water layer and water distribution throughoutthe bilayers, bilayer head group and tail region thickness weredetermined from these measurements. Neutron scattering hasthe advantage of scattering differently from hydrogen anddeuterium atoms due to their vastly different scattering crosssections. This difference allows measurements to highlight thestructure of particular atoms and functional groups throughdeuterium labelling. The corresponding reflectivity profiles areshown in Fig. 2: (red) chain-deuterated DMPC hydrated withH2O to emphasise the scattering contribution of the hydro-phobic membrane core, (blue) DMPC hydrated with heavywater (D2O) to highlight contribution of the hydration water,and (green) DMPC and H2O to emphasise the head group in thebilayers.
The equally spaced Bragg peaks are indicative of a wellorganized lamellar membrane structure. While up to 12 diffrac-tion orders can be observed in partially-hydrated DMPC mem-branes,43–46 thermal fluctuations in fully hydrated fluid lipidmembranes usually strongly suppress higher diffraction orders.47
Four to five diffraction orders were observed in each diffractro-gram in Fig. 2 and used for Fourier synthesis of the scatteringlength density.
The OFFSPEC measurements covered a qz range from 0.04 to1.10 �1, however Bragg peaks could be observed only to amaximum of qz B 0.50 �1. The out-of-plane and in-planecomponent of the total scattering vector, Q, are denoted qz andqxy, respectively, in what follows. Fitting of Lorentzian peakprofiles was used to determine the location of each reflection.The peak areas were integrated by manual determination of the
corresponding peak bounds. An example of such an area ismarked in Fig. 2 in the third reflection of the DMPC-d54/H2Osample (red).
The neutron scattering length density (NSLD), r(z), can beapproximated by a 1-dimensional Fourier analysis, where thedifferent Fourier components are observed in the experiment asthe integrated intensities of the reflectivity Bragg peaks:
rðzÞ ¼ 2
dz
XNn¼1
F qnð Þnn cos qnzð Þ
¼ 2
dz
XNn¼1
ffiffiffiffiffiffiffiffiffiInqn
pnn cos
2pnzdz
� �;
(1)
where N is the highest order of the Bragg peaks observed in theexperiment. This method is equivalent to determining electrondensities from X-ray scattering.24,45,48 The square root of theintegrated peak intensities In, multiplied by qn give the formfactors, F(qz,n).49,50 The bilayer component form factor F(qz),which is in general a complex quantity, is real-valued in thecase of centro-symmetry. The phase problem of crystallography,therefore, simplifies to the sign problem F(qz,n) = nn|F(qz,n)|,where the phases, nn, can only take values �1. These phases areused to reconstruct the neutron scattering length density profilesfrom the diffraction pattern following eqn (1).
When the form factor F(qz) is measured at several qz values,T(qz), which is proportional to F(qz), can be fit:
T qzð Þ ¼Xn
ffiffiffiffiffiffiffiffiffiInqn
psin c
1
2dzqz � pn
� �: (2)
In order to determine the phases quantitatively, the form factorhas to be observed at different qz-values by measuring at differentcontrast conditions or using the so-called swelling technique.46
Fig. 2 Neutron diffraction data collected at the OFFSPEC reflectometerare shown for three hydrated lipid bilayer samples: (red) deuterated DMPChydrated by H2O, (blue) DMPC hydrated by D2O, and (green) DMPChydrated by H2O. The neutron scattering length profiles in Fig. 5 werecalculated from these data by using the location and areas (as shown bythe shading under the peak) under each peak. All measurements weretaken at T = 30 1C (303 K).
Soft Matter Paper
Publ
ishe
d on
19
Aug
ust 2
015.
Dow
nloa
ded
by J
OIN
T I
LL
- E
SRF
LIB
RA
RY
on
17/0
9/20
15 1
5:15
:42.
View Article Online

Soft Matter This journal is©The Royal Society of Chemistry 2015
Here, fitting the experimental peak intensities and comparingthem to the analytical expression for T(qz) in eqn (2) allowed usto assess the phases, nn. Up to 5 evenly spaced diffraction peakswere observed for these curves and were used to determine theneutron scattering length density profiles for each sample.Each peak in the diffraction pattern has a correspondingphase of �1. Phase arrays for each sample were as follows:DMPC-d54/H2O, [�1 1 1 �1]; DMPC/D2O, [1 �1 1 1 �1]; DMPC/H2O, [�1 �1 �1 1 �1].
The lamellar spacings, dz, were determined from the peakspacing in Fig. 2 to be: DMPC-d54 hydrated with H2O: dz = 69.22 Å,DMPC hydrated with D2O: dz = 70.92 Å, and DMPC hydratedwith H2O: dz = 68.98 Å. As the lamellar spacing includes thethickness of the bilayer plus the thickness of the water layerbetween the stacked bilayer, it is an established measure ofthe level of hydration reached. Values of dz as a function ofhydration are well documented for DMPC by the Nagle groupand dz for DMPC was reported to show a power-law dependenceon membrane hydration.51 dz values in excess of 63 Å denote asignificant increase in the thickness of the water layer. Thedifferent membranes prepared for this study can, therefore,be considered to be fully hydrated with more than 25 watermolecules per lipid molecule such that the results of eachsystem can directly be compared.
2.2.2 Incoherent quasi-elastic neutron scattering on Let.The incoherent quasi-elastic neutron scattering experimentswere carried out at the Low-energy-transfer (Let) spectrometer52,53
at ISIS, the pulsed neutron and muon source at the RutherfordAppleton Laboratory in Oxfordshire, UK.
In order to cover as large a range of momentum transfer, Q,and dynamical range as possible different incident neutronenergies, Ei, were combined: 0.64, 0.96, 1.62, 3.28, and 9.8 meVcorresponding to neutron wavelengths of l = 11.3, 9.23, 7.11,4.99 and 2.89 Å, respectively. Position- and time-sensitive 3Hedetectors collected scattered neutrons with an angular rangeof �101 to 701 (up to 1401 for bulk water) horizontally and�301 vertically.
A 3-dimensional spectrum (E, Q, S(Q, E)) for each incidentenergy was acquired in .nxspe (Nexus event-mode) format. AMatlab (Mathworks Inc.) script tailored to stacked membranesused a cylindrical geometry where the components of scatteringvector, Q, are the membrane plane, qxy, and the cylindrical axis, qz.
Bulk water data were sliced using a powder geometry inDAVE (Data Analysis and Visualization Environment) softwarefrom NIST Center for Neutron Research.54 All data were cut intoten equal slices in qz and up to 22 equal slices in qxy to make agrid of 220 squares in reciprocal space. For Eis of 0.64, 0.96,1.62, 3.28, 9.80 meV the widths in qz and qxy were 0.027, 0.033,0.043, 0.062, and 0.106 Å, respectively.
Each square results in a spectrum of S(q(xy,z), E) vs. E and wasfit with functions that will be described in detail in the nextsection (Section 2.2.3). Only data from detector positions ofgreater than B101 (the sixth slice and greater) in the lateraldirection were used in the analysis due to contributions of thesuper mirror guides. The super mirror guides cause a beamdivergence, which in turn affects the lower scattering angles.
As the membranes were disordered in the plane of the
bilayers (lateral average), the lateral Q-range was scaled byffiffiffi2p
to convert the lateral scale from qxy ¼ffiffiffiffiffiffiffiffiffiffiffiffiffiffiffiffiffiffiffiqx2 þ qy2
p¼
ffiffiffi2p
qx to qx.The qx-range for each of the incident energies was as follows:0.10–0.34 Å�1 (0.64 meV), 0.12–0.42 Å�1 (0.96 meV), 0.15–0.54 Å�1
(1.62 meV), 0.22–0.79 Å�1 (3.28 meV), and 0.37–1.35 Å�1 (9.80 meV).The qz-ranges for each of the incident energies were: 0–0.27 Å�1
(0.64 meV), 0–0.33 Å�1 (0.96 meV), 0–0.43 Å�1 (1.62 meV),0–0.62 Å�1 (3.28 meV), and 0–1.06 Å�1 (9.80 meV).
Resolution measurements for the membrane system weretaken using a B15 K DMPC/H2O sample and bulk H2O resolu-tion measurements using a vanadium sample. Resolutionsand quasi-elastic spectra were cut to the same dimensions inreciprocal space. The fits are based on the Matlab nonlinearleast-squares minimization algorithm ‘‘lsqnonlin’’. Fits were anumerical convolution of the resolution (Gaussian function(s))with the d-shaped function and the model for the QENS, withthe addition of a background. The resolution function of Letdepends on the incident energy and scattering angle and maydeviate from a simple Gaussian function. Therefore, the resolu-tion spectra were fit with one Gaussian function (Ei = 0.64, 0.96,1.62 meV) or two Gaussian functions (Ei = 3.28, 9.80 meV). AToeplitz matrix was constructed from each resolution spectrum,forming a square matrix dependent on the size of the scatteringfunction spectrum. Convolution was carried out by multiplica-tion of the Toeplitz matrix with the sum of the d-shaped functionand broadening model.
2.2.3 Diffusion models. There are different models usedto describe diffusive motions.55 For a particle diffusing viathermally-induced Brownian motion, the 1-dimensional meansquared displacement (MSD) of the particle is a function linearin time,
h[dr(t)]2i = 2Dt, (3)
where D is the translational diffusion coefficient. With thischaracteristic length scale, one can define a self time-dependentpair-correlation function for incoherent scattering,
Fdðr; tÞ ¼ ð4pDtÞ�12 exp
�r24Dt
� �; (4)
which is a solution of Fick’s law,
@Fdðr; tÞ@t
¼ Dr2Fdðr; tÞ: (5)
The corresponding intermediate scattering function decaysexponentially,
Id(Q, t) = exp(�Q2Dt), (6)
and can be Fourier transformed to give a Lorentzian-shapedincoherent scattering function
SdðQ;EÞ ¼1
p�h
Q2D
Q2Dð Þ2þ E=�hð Þ2
!: (7)
Thus, quasi-elastic scattering, which exhibits itself as Lorentzianbroadening with a full-width at half-maximum (FWHM) that
Paper Soft Matter
Publ
ishe
d on
19
Aug
ust 2
015.
Dow
nloa
ded
by J
OIN
T I
LL
- E
SRF
LIB
RA
RY
on
17/0
9/20
15 1
5:15
:42.
View Article Online
This journal is©The Royal Society of Chemistry 2015 Soft Matter
has a Q2 dependence, is indicative of a continuous diffusionprocess with EFWHM = 2�hDQ2.
Water dynamics are more complex than that of ordinaryliquids. In a simple liquid56 atoms move ballistically at shorttimes. The ballistic MSD h[dr(t)]2i p h(vt)2i p t2 of the singlemolecule is eventually followed by a crossover to Browniandiffusion, characterized by h[dr(t)]2i p t, for long times. Indense or strongly interacting fluids, the caging effect leads to aplateau in h[dr(t)]2i. The motion in this regime is sub-diffusivewith h[dr(t)]2i p tb with an exponent b o 1. This anomalousregime of hydration water dynamics was observed in computersimulations of lipid bilayers.32,33
The models used to fit the incoherent neutron data incorporatea constant background, a resolution function, R(t) (in the timedomain) or R(E � E0) (in energy domain), which is numericallyconvolved with the sum of a d-like function and a function thatdescribes the quasi-elastic broadening.
In the first model, motion of the water molecules is modelledby a single relaxation time, t:
SRðQ;EÞ ¼1
2p�h
ðdteiEt=�h I1ðQÞ þ AðQÞe�t=t
h iRðtÞ: (8)
E = �ho, A(Q) = (1 � IN(Q)), and IN(Q) is the so-called elasticincoherent structure factor, that represents effects of confine-ment, i.e., correlations in the long-time limit57,58 and SR(Q, E) isthe resolution-broadened incoherent scattering function. Eqn (8)describes a single Brownian diffusion process of the watermolecules with a Lorentzian quasi-elastic broadening:
SRðQ;EÞ ¼ Cbkgnd þ R E � E0ð Þ
� Bd E � E0ð Þ þ A1
p
1
2G
� �
E0ð Þ2þ 1
2G
� �2
8>>><>>>:
9>>>=>>>;;
(9)
where B is the amplitude of the d-like function and is equal toIN(Q). A and Cbkgnd are constants and G is the FWHM of theLorentzian function.
In the second model, the observed dynamics are describedby two Brownian diffusion processes,
SRðQ;EÞ ¼1
2p�h
ðdteiEt=�h I1ðQÞ þ A1ðQÞe�t=t1 þ A2ðQÞe�t=t2
� �RðtÞ;
(10)
resulting in two Lorentzian functions:
SRðQ;EÞ ¼ Cbkgnd þ R Q;E � E0ð Þ
� Bd E � E0ð Þ þ A11
p
1
2G1
� �
E0ð Þ2þ 1
2G1
� �2
8>>><>>>:
þA21
p
1
2G2
� �
E0ð Þ2þ 1
2G2
� �2
9>>>=>>>;:
(11)
Here, A1 and A2 are constants. These functions typicallydescribe a slow motion (narrow width, G1) and a fast processof the molecules (broad width, G2).
In the third model, we used the Kohlrausch–Williams–Watts(KWW) function to describe motion of the water molecules.59
This function describes a distribution of relaxation processescharacterized by relaxation time t and stretching exponent b.Values of b less than unity signify a sub-diffusive regime,where a stretching exponent of unity is indicative of Browniandiffusion.
Using this model one obtains
SRðQ;EÞ ¼1
2p�h
ðdteiEt=�h I1ðQÞ þ AðQÞe� t=tð Þb
h iRðtÞ; (12)
resulting in
SRðQ;EÞ ¼ Cbkgnd þ R Q;E � E0ð Þ
� Bd E � E0ð Þ þ FFT Ae� t=tð Þbh in o
:(13)
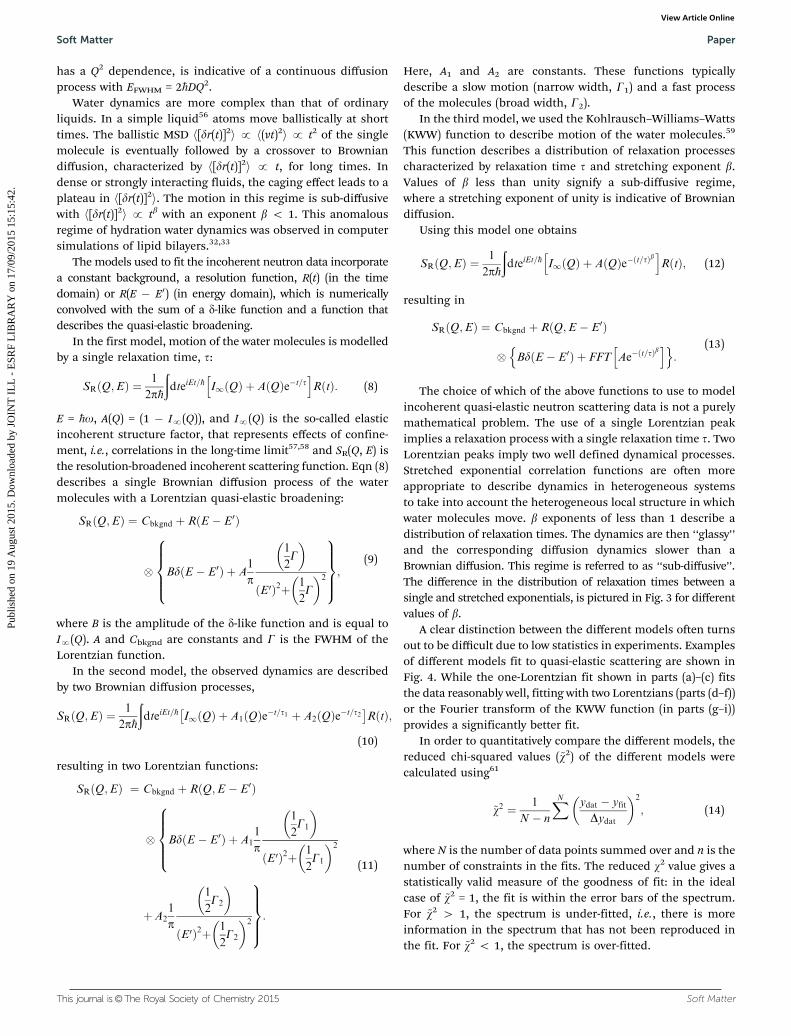
The choice of which of the above functions to use to modelincoherent quasi-elastic neutron scattering data is not a purelymathematical problem. The use of a single Lorentzian peakimplies a relaxation process with a single relaxation time t. TwoLorentzian peaks imply two well defined dynamical processes.Stretched exponential correlation functions are often moreappropriate to describe dynamics in heterogeneous systemsto take into account the heterogeneous local structure in whichwater molecules move. b exponents of less than 1 describe adistribution of relaxation times. The dynamics are then ‘‘glassy’’and the corresponding diffusion dynamics slower than aBrownian diffusion. This regime is referred to as ‘‘sub-diffusive’’.The difference in the distribution of relaxation times between asingle and stretched exponentials, is pictured in Fig. 3 for differentvalues of b.
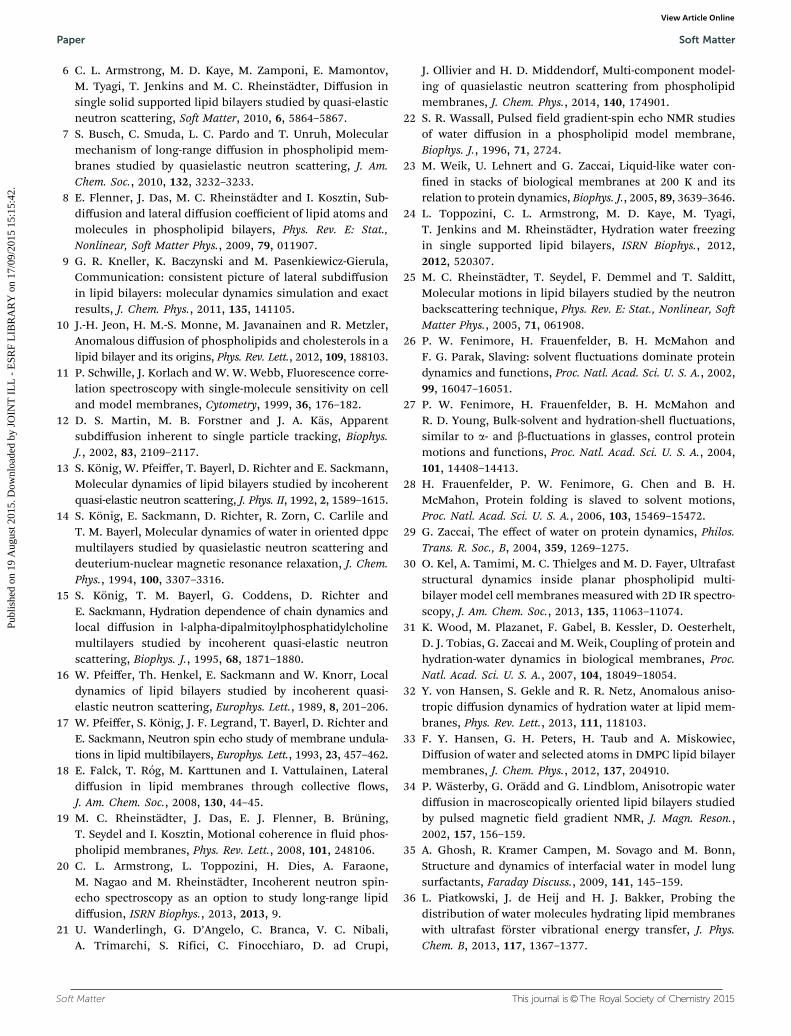
A clear distinction between the different models often turnsout to be difficult due to low statistics in experiments. Examplesof different models fit to quasi-elastic scattering are shown inFig. 4. While the one-Lorentzian fit shown in parts (a)–(c) fitsthe data reasonably well, fitting with two Lorentzians (parts (d–f))or the Fourier transform of the KWW function (in parts (g–i))provides a significantly better fit.
In order to quantitatively compare the different models, thereduced chi-squared values (~w2) of the different models werecalculated using61
~w2 ¼ 1
N � n
XN ydat � yfit
Dydat
� �2
; (14)
where N is the number of data points summed over and n is thenumber of constraints in the fits. The reduced w2 value gives astatistically valid measure of the goodness of fit: in the idealcase of ~w2 = 1, the fit is within the error bars of the spectrum.For ~w2 4 1, the spectrum is under-fitted, i.e., there is moreinformation in the spectrum that has not been reproduced inthe fit. For ~w2 o 1, the spectrum is over-fitted.
Soft Matter Paper
Publ
ishe
d on
19
Aug
ust 2
015.
Dow
nloa
ded
by J
OIN
T I
LL
- E
SRF
LIB
RA
RY
on
17/0
9/20
15 1
5:15
:42.
View Article Online

Soft Matter This journal is©The Royal Society of Chemistry 2015
Each spectrum was fit with all three models and the corres-ponding reduced w2 calculated. The results are listed in Table 1.A detailed list is given for the qx-averaged ~w2 for an incidentenergy of 3.28 meV to show that the fit quality also dependson qz. Mean ~w2s were calculated and are given for all energies.It is observed that the fit of a single Lorentzian provides asignificantly poorer fit while two Lorentzian peaks and a KWWfunction seem to adequately describe the quasi-elastic datawith almost identical ~w2s.
We note that this problem is not unique to incoherent quasi-elastic neutron scattering experiments. Lipid motion determinedby fluorescence correlation spectroscopy (FCS), for instance, wasreported to be equally well described by anomalous diffusion ortwo Brownian diffusion processes.11
Following eqn (9), (11) and (13), the corresponding fittingfunctions involve 2, 4 and 3 free parameters. While a largernumber of free parameters typically leads to a better fit, thefundamental question is if motion of molecules in anisotropicand heterogeneous environments is more reasonably describedby a series of Brownian diffusion processes or rather by a distri-bution of relaxation times, as described by the KWW function.We will present evidence that the KWW provides the correctdescription of hydration water dynamics based on results fromthe neutron experiment and computer simulations furtherbelow. In the remaining sections, the quasi-elastic broadeningis characterized by the Fourier transform of a KWW functionto describe anomalous dynamics, and t and b parameters aredetermined.
2.2.4 The effect of instrumental resolution. If there isan instrumental energy resolution, R(E), then the resolutionbroadened dynamical structure factor, SR(Q, E) is given by
SRðQ;EÞ ¼ðþ1�1
dE0S Q;E0ð ÞR E � E0ð Þ: (15)
By introducing the Fourier transform, R(t) of R(E),62
RðEÞ ¼ 1
2p�h
ðþ1�1
dt eiEt=�hRðtÞ; (16)
SR(Q, E) can be written as,
SRðQ;EÞ ¼1
2p�h
ðþ1�1
dt eiEt=�hIðQ; tÞRðtÞ: (17)
When assuming a Gaussian resolution function, common inquasi-elastic incoherent neutron scattering experiments, R(E)can be written as
RðEÞ ¼ 2ps2� ��1
2 e�E2
2s2 ; (18)
where s is the Gaussian width of the energy resolution. Thisresolution has the Fourier transform
RðtÞ ¼ e�12s2t2=�h2 ¼ e�
12t2�tR2
: (19)
When R(t) is substituted into R(E), the integral in eqn (17) is cutoff after a time tR. For a Gaussian R(t), the ‘‘cut-off’’ time (theexperimental observation time tR) is related to the FWHM of R(E) by
tR ¼�h
s¼ �h
2ffiffiffiffiffiffiffiffiffiffiffi2 ln 2p
EFWHM: (20)
where s and EFWHM are in energy units.Experimental observation time windows, tR, for the bulk
water sample were calculated from the average s of the resolu-tion peaks of 4.3, 6.8, 12.7, 20.0, 96.4 meV to be 154.2, 97.2, 51.7,23.5, 6.6 ps, respectively. The membrane samples have averages resolution peaks of 4.3, 6.8, 12.6, 25.8, 96.0 meV corres-ponding to observation time windows of 151.6, 97.4, 52.3,25.5, 6.9 ps, respectively. The slight difference in the experi-mental resolution and observation time for the two samples is apurely geometrical effect as the experimental resolution dependson the size (mainly the diameter) of the sample used.
Molecular motions slower than the experimental observationtime can still be accessed in experiments, however potentialadditional statistical noise in a spectrum can lead to a systematicerror, which tends to overestimate the actual relaxation time, t,as will be discussed below.
2.3 Simulations
2.3.1 Atomic-detail molecular dynamics simulations ofbulk water diffusion. In order to study the intrinsic characterof water diffusion, the motion of water in bulk was studiedusing molecular dynamics at full atomic detail. We employedGROMACS to simulate 895 water molecules (SPCE model) ina NPT ensemble with the built-in Nose–Hoover thermostat(T = 300 K, t = 1 ps) and the built-in Parrinello–Rahmanbarostat ( p = 1 bar, compressibility 4.5 � 10�5/bar, t = 1 ps).
Fig. 3 Plot of the relaxation time probability density function (pdf) as afunction of t/tKWW where tKWW is the relaxation time introduced in eqn (12)and (13).60 b values range from 0.1 to B1 to illustrate the range of relaxationdistributions for sub-diffusive systems as opposed to the d-like distributionfor Brownian diffusion (approximated by b = 0.9999).
Paper Soft Matter
Publ
ishe
d on
19
Aug
ust 2
015.
Dow
nloa
ded
by J
OIN
T I
LL
- E
SRF
LIB
RA
RY
on
17/0
9/20
15 1
5:15
:42.
View Article Online

This journal is©The Royal Society of Chemistry 2015 Soft Matter
We used a time step of 1 fs and simulated for 50 ns. To ensureproper equilibration, only the trajectory beyond 1 ns was furtheranalyzed. The start configuration is constructed with standardGROMACS routines for SPC water.
2.3.2 Coarse-grained Brownian dynamics simulations ofwater diffusion in a membrane system. In order to focus onthe dynamical features introduced by the membrane due todifferent local dynamical environments and geometrical con-finement, profiles for diffusivity D(z) and free energy V(z) werechosen to mimic those obtained in atomic-detail moleculardynamics simulations32 and neutron reflectivity.
In particular, we choose:
DðzÞ ¼ Din þ Dbulk �Dinð Þ 1þ cosh½b�cosh½b� þ cosh½az� (21)
and
V(z) = cz2.75, (22)
with the bulk diffusion coefficient Dbulk = 2.7 nm2 ns�1, theinner-membrane diffusion coefficient Din = 0.12 nm2 ns�1, and
the parameters a = 4/nm, b = 3.6, c = 0.43/nm2.75. V(z) is given inunits of kBT. The potential V(z) is shown in Fig. 5(b) and wasmodelled based on the experimentally determined distribution ofwater molecules in the bilayers. Note that since on sub-nanosecondtime scales the crossing of water through membranes is negligible,these profiles describing only one water layer between twomembranes is appropriate.
The displacement Dr of the center-of-mass of one watermolecule within a time step Dt is calculated via
Dr ¼ �DðzÞrVðzÞDtþrDðzÞDtþffiffiffiffiffiffiffiffiffiffiffiffiffiffiffiffiffi2DðzÞDt
pDW ; (23)
where the Wiener increment DW is drawn from a normaldistribution with hDWi = 0 and hDW2i = 1. Note that the secondsummand is the apparent drift term from the Ito interpretationof the Langevin equation63 which ensures relaxation to equili-brium at long times.
The trajectory for one water molecule is simulated withDt = 0.1 ps for a time of 10 ms. As starting condition we choosethe center of the water layer, in agreement with the experi-mental data in Fig. 5.
Fig. 4 Comparison between a one-Lorentzian peak fit, two-Lorentzian peak fit and Fourier transform of KWW fit of quasi-elastic broadening spectra ofwater diffusing in a lipid membrane. Values for qx and qz are indicated in each plot.
Soft Matter Paper
Publ
ishe
d on
19
Aug
ust 2
015.
Dow
nloa
ded
by J
OIN
T I
LL
- E
SRF
LIB
RA
RY
on
17/0
9/20
15 1
5:15
:42.
View Article Online

Soft Matter This journal is©The Royal Society of Chemistry 2015
2.3.3 Intermediate scattering function and fitting procedure.From the simulation trajectories, the intermediate scattering func-tion I(Q, t) was calculated directly for each combination of qx and qz,respectively. For the case of bulk water, I(qx, qz, t) was calculated forthe center-of-mass of each molecule for an exponential time rangefrom 0.05 ps to 30 ns, respectively, as shown in Fig. 6, and thenaveraged over all molecules. For the case of membrane water, anexponential time range from 0.1 ps to 300 ns was used.
The intermediate scattering functions were fitted with astretched exponential plus a constant (non-zero only for qx = 0),consistent with the experimental analysis as laid out in eqn (13).To render the fitting more robust, we employed the following fitprocedure: first, for the case of hydration water and qx = 0,IN(qx, qz) is fixed to the mean of the last 3 points of the correlationfunction. For all other cases, IN(qx, qz) is set to zero. Second, we fita stretched exponential to the re-scaled data.
In order to investigate conditions closer to the experiment,we include a hypothetical Gaussian experimental resolution viafitting weights R(t) = exp(�1
2t2/tR2) with t = 500 ps. Fig. 6 shows
a set of I(Q, t) profiles with corresponding fits and artificialresolution function. Except for very small correlation times, themodel of a stretched exponential provides good fits over severaldecades in times.
2.3.4 Mean-squared displacement and time-dependent stretchexponent. The MSDs parallel, hdx2i + hdy2i, and perpendicular,hdz2i, to the membrane were calculated from the center-of-masscoordinate separately. In the case of bulk water, the MSDs areaveraged over all molecules. According to the MSD for ananomalous diffusion, hdr2i = 2(Dt)b(t), we calculate the time-dependent stretch exponent
bðtÞ ¼d log dr2
� � �d log½t� (24)
as an alternative measure of motional anomaly.
3 Results & discussion3.1 Membrane structure
In order to confirm fully hydrated bilayers neutron reflectivitymeasurements were done to determine the bilayer structure.Fig. 5 shows the scattering length density profiles, as determinedfrom the reflectivity curves in Fig. 2.
The DMPC/H2O sample allowed us to determine the extent ofthe head group, the water layer and lipid tail regions. A combi-nation of X-ray scattering, neutron scattering and simulationshave been used to determine bilayer structures of a variety ofphospholipids (PC).64–66 Since these lipids have the same PChead group, these publications were instructive in finding theextent of our head group region. We define the extent of the head
Table 1 Listing of ~w2 values (mean ~wx2). All qz values are listed for an
incident neutron energy of 3.28 meV; averages are shown for otherenergies, only. Mean ~w2s are calculated from fits to one Lorentzian(eqn (9)), two Lorentzians (eqn (11)) and the KWW function (eqn (13)) ofeach spectrum. Exemplary fits are shown in Fig. 4
Energy (meV) qz (�1)
Mean ~w2
1 Lorentzian 2 Lorentzians KWW
0.64 1.21 1.07 1.150.96 2.14 2.06 2.031.62 5.58 5.03 5.153.28 0.0310 16.5 9.73 10.6
0.0930 15.6 8.56 8.850.155 14.6 7.41 7.730.217 15.2 8.13 8.250.279 13.6 6.49 6.580.341 12.2 5.34 5.370.403 12.7 5.93 5.860.465 11.5 5.67 5.470.527 12.5 7.48 7.300.589 13.7 7.99 8.17
Mean ~w2 13.7 7.27 7.419.80 71.0 30.7 41.7Total ~w2 18.7 9.21 11.5
Fig. 5 (a) Scattering length density profiles as synthesized through Fouriertransformation of the reflectivity curves in Fig. 2. Selective labelling ofhydration water and lipid tails highlights the hydration water layer and thehydrophobic membrane core. Fully protonated membranes enable thedetermination of the lipid head groups as phosphate and carbonyl groupshave larger coherent neutron scattering cross section. (b) The shape of thewater segment of the D2O/DMPC sample was used to model the shape ofthe potential, V(z), in the simulations.
Paper Soft Matter
Publ
ishe
d on
19
Aug
ust 2
015.
Dow
nloa
ded
by J
OIN
T I
LL
- E
SRF
LIB
RA
RY
on
17/0
9/20
15 1
5:15
:42.
View Article Online

This journal is©The Royal Society of Chemistry 2015 Soft Matter
group to be the center of the distributions of its most interior/exterior molecules: carbonyl/choline groups.
The probability distributions for the head group components65,66
show the head group/water boundary at approximately the centre ofthe choline distributions. The head group/water boundary shouldbe approximately at the inflection point of the head group peakbordering the water at z = 24 Å, as shown in Fig. 5.
We assumed the maximum of our NSLD peak is centeredbetween the phosphate and carbonyl groups. As the distribu-tion of the carbonyl64–66 has a half-width at half-maximum ofB3 Å, we approximate the head group/tail boundary at 15.5 Å.Half the average lamellar repeat distance minus the headgroup/water boundary (34.9–24.0 Å) results in half a water layerof 10.9 Å. Based on this analysis, the membrane core was foundto have a thickness of 31 Å (15.5 Å per leaflet), the head groupregion was 8.5 Å thick and the hydration water layer had a totalthickness of 21.8 Å (10.9 Å on each side of the density profile).These values were used in the simulations and confirm thatthe phospholipid bilayers were in their fully hydrated fluidphase. We note that the values for the bilayer dimensions are inexcellent agreement with reference values for DMPC by theNagle group51 of DHH = 35.3 Å, DW = 19.2 Å and 9 Å for the headgroup thickness.
The raw NSLDs for each sample were scaled in the followingway: the profile edges were scaled to the density of bulk water(rH2O = �5.6 � 10�7 �2 or rD2O = +6.39 � 10�6 �2) and bilayercenters were scaled to a CH3 (or CD3) group (rCH3
= �1.83 �10�6 �2) or (rCD3
= +8.89 � 10�6 �2) plus the NSLD of
0.10 water molecule. The center of the bilayer in the NSLDprofiles are typically scaled to a CH3 group, however, differ-ences between tail regions of DMPC/H2O and DMPC/D2Oprofiles point to non-zero water content at the center of thehydrophobic core.
We determine the water content at the center of the hydro-phobic core to be 0.10 solvent molecules (H2O or D2O) per lipidsuch that the NSLD profiles of the two DMPC samples overlapfrom B6 Å to 10 Å.
Though this technique cannot determine the absolute numberof water molecules in the entire tail group region, our experimentsprovide evidence for B1 water molecule for every 10 lipids. Thepresence of water in the center of lipid bilayers is supported by IRspectroscopy experiments,36 as well as simulations.37,39 While thedensity of water molecules in the hydrophobic core is lowcompared to the hydration water layer, the center of the bilayeris a region of low lipid density, with a larger free volume fraction39
and consequently lower free energy and higher probability forwater molecules to be present.
The NSLD profiles in Fig. 5 are in very good agreement withresults from recent computer simulations in the same systemby Hansen et al.33 and Yang, Calero and Marti.67 Both ourexperiment and simulations agree that water molecules pene-trate the bilayer into head group and tail region, however thesimulations do not provide evidence for an increased waterdensity in the center of the bilayers. We note that the simula-tions used a potential to implicitly model the membrane wherewater was not explicitly accounted for within the membrane core.
3.2 Water dynamics from experiments
3.2.1 Bulk water. The diffusion of water molecules in twosystems are discussed in this section: (1) the isotropic diffusionof bulk water (H2O) contained in a cylindrical annulus at roomtemperature, and (2) the anisotropic diffusion of hydrationwater (H2O) in fluid, oriented, deuterated lipid bilayers atT = 30 1C (303 K). In order to describe motion of water moleculesin crowded or strongly interacting environments, which mayinduce a distribution of relaxation times, the dynamics were fitdirectly in the energy domain using the Fourier transform of aKWW function, where b is the exponent of the stretched expo-nential and t the corresponding relaxation time.
Fig. 7(a) and (b) show the results for bulk water. A sketch ofthe scattering geometry is shown in Fig. 7(c). Stretching expo-nent (Fig. 7(a)) and relaxation time (part (b)) are displayed in2-dimensional maps as a function of parallel and perpendicularmomentum transfer, qx and qz. t is plotted in units of picosecondsand on a logarithm scale due to its multiple orders of magnituderange. The map covers motions of water molecules from B3 Åto B100 Å in the x-direction and from B6 Å to B60 Å in thez-direction.
Motions over longer distances (small qx,z-values) are slowerand require longer observation times (higher energy resolutionor longer neutron wavelength, l) as compared to short-rangemotions at larger qx,z-values. Following Bragg’s equation (q =4p sin(y)/l or 2d sin(y) = l with d = 2p/q), the accessible qx andqz-range strongly depends on the incident neutron wavelength.
Fig. 6 Intermediate scattering function for bulk water at qx = 0 and qz =0.025, 0.075, 0.125, 0.25, 0.375, 0.6, 1.0, 1.5 Å�1 in lin–log (a) and log–log(b) representation. These data (blue dots) are fitted corresponding to eqn (12)with a stretched exponential plus constant (red dashed line). The linearscaling over decades in time in the log–log representation supports theapplicability of a stretched exponential as fit function, although deviations areobserved at low times. The artificial resolution function is plotted as a blackdashed line.
Soft Matter Paper
Publ
ishe
d on
19
Aug
ust 2
015.
Dow
nloa
ded
by J
OIN
T I
LL
- E
SRF
LIB
RA
RY
on
17/0
9/20
15 1
5:15
:42.
View Article Online

Soft Matter This journal is©The Royal Society of Chemistry 2015
The larger l, the larger the observation time and the higher theenergy resolution, however, the smaller the qx,z-range covered.In order to cover the largest range of length and time scales,results from different energy resolutions must, therefore, becombined, as has been done in Fig. 7. The pattern of concentricrings of relaxation times in Fig. 7(b) is indicative of an isotropicmotion of water molecules with longer relaxation times atlonger length scales.
The values for b in Fig. 7(a) between 0.85 and 1 indicate thatthe corresponding nanoscale dynamics of water molecules isslightly sub-diffusive. Sub-diffusive dynamics is often found insupercooled water. Simulations of supercooled bulk water68–70
show sub-diffusive behaviour with exponents in the range ofb = 0.85–1 for our parameter ranges. Chen et al.69,70 found thatb stayed close to 1 for low Q values and low temperatures T o225 K, however Sciortino et al.68 reported that supercooled bulkwater at 285 K at Q B 1.5 Å�1 reached b = 0.85. Experimentsusing light scattering71 and neutron scattering71,72 observed1 Z bZ 0.6 for bulk water in our temperature range (293–313 K72)for Q B 0.25–1.5 Å�1.
The bulk water measurements prove that diffusion can bestudied by analyzing different areas on the large 2-dimensionaldetector array. We note that it is not trivial to determinea diffusion constant in the sub-diffusive regime as thestandard approach is to use eqn (7) and plot the quasi-elasticbroadening as a function square of the scattering vector, Q2;
this approach fails in the case of sub-diffusion and non-Lorentzian fit functions.
3.2.2 Membrane hydration water. Fig. 8(a) and (b) depict band t-values for the membrane hydration water as a function ofqx and qz. The membranes were aligned horizontally in thespectrometer, such that qx denotes the scattering vector of thelateral motions and qz denotes motions transverse to the bilayers,as shown in Fig. 8(c). As for bulk water, five measurements withdifferent energy resolution were combined to maximize the acces-sible qx,z-range. While concentric circles were observed for bulkwater, the pattern of bs and ts is clearly anisotropic for hydrationwater in the lateral and transverse direction. b-values of B0.5 wereobserved at high qx and qz-values in part (a) corresponding to smalldistances, indicative of a sub-diffusive dynamics. b continuouslyincreases towards longer lengths (smaller qx,z values) untilBrownian diffusion with b = 1 is observed.
The relaxation times in Fig. 8(b) show fast hydration waterdynamics at large qx, which continuously slows down towardslonger length scales (smaller q-values). In contrast to the bulkwater results in Fig. 7, the relaxation times along qx and qz areanisotropic with clear deviations from the circular pattern. Themost striking feature is a localized region with slow relaxationtimes at qx B 0.15 Å�1 (equivalent to a length scale of 40 Å). Thefeature is also seen in the b data in part (a) and exhibits smallvalues of b of less than 0.40. Shape and position of this featureagrees well with the feature observed in the computer model of
Fig. 7 Values of (a) b and (b) log10(t) (t in ps), fit from each bulk water spectrum, are plotted as a function of qz and qx. Measurements were made withfive different energy resolutions. The isotropic nature of the bulk water dynamics can be seen in the concentric rings in (b). (c) Sketch of the scatteringgeometry. We note that the 17th slice in each measurement was taken out because the detector array at this scattering angle was, unfortunately,malfunctioning during the experiment.
Paper Soft Matter
Publ
ishe
d on
19
Aug
ust 2
015.
Dow
nloa
ded
by J
OIN
T I
LL
- E
SRF
LIB
RA
RY
on
17/0
9/20
15 1
5:15
:42.
View Article Online

This journal is©The Royal Society of Chemistry 2015 Soft Matter
the stacked bilayers and is a result of confinement, as will bediscussed below.
Fig. 8(d) shows qx-slices at different qz-values, which allowaccess to different water molecules. Based on the structuralresults in Fig. 5, the highest density of water molecules in thehydrated bilayer stack is found in the center of the hydrationwater layer. Different values of the transverse momentumtransfer, qz, then correspond to the spread of z-values that themolecules explore when diffusing. qz = 0.586 Å�1 correspondsto a vertical distance of dz = 2p/0.586 = 10.7 Å, within thehydration water layer. The slice centered at qz = 0.272 Å�1
contains water molecules that penetrate the head group regionof the bilayers; qz = 0.15 Å�1 molecules, which migrate to thelipid acyl chains. Based on Fig. 8(d), water molecules, whichdiffuse laterally in the hydration water layer show a sub-diffusivebehaviour with a b exponent of B0.50. This b-value is signifi-cantly lower than the value that we measured for bulk water,indicative that hydration water motion is significantly anomalous.Water molecules in contact with lipid head groups and hydro-phobic core show a sub-diffusive regime at small distances with atransition to Brownian motion at larger distances of B14 Å. Wenote that ballistic motion of water molecules with b-values of 2 is
expected to occur at larger qx-values, outside of the experimentallyaccessible range in this experiment.
The results are in qualitative agreement with a recent com-puter simulation study by von Hansen, Gekle and Netz,32 whichreports a sub-diffusive regime for hydration water dynamics,however in the time domain, as shown in Fig. 8(e) (dataadapted from ref. 32). The simulation data were evaluated forwater molecules at different distances from the bilayer center,z0 = 15 Å being located in the lipid head group region andz0 = 35 Å, at the farthest distance from the bilayer. We note thatsimulations were conducted in a single hydrated bilayer, wherewater dynamics away from the bilayer are more likely Brownian,as compared to the confined water layer in our experiment.Water molecules diffusing along the head group region orwithin the lipid tails show a distinct sub-diffusive regime, withb values of 0.50, in good agreement with the experimentalresults in Fig. 8(d).
Corresponding cuts of the relaxation time, t, at qz-values of0.15 Å�1 and 0.586 Å�1 (corresponding to z motions over 10.7 Åand 41.9 Å, respectively) are shown in Fig. 9. Again, slices werecentered in the hydration water layer and qz-values are a measure ofthe corresponding slice width. The relaxation time for hydration
Fig. 8 Plots of the (a) stretching exponent, b, and (b) the logarithm of the relaxation time log10(t), t in ps, from fits of hydration water spectra that havebeen integrated over qz and qx. The smallest map corresponds to the highest resolution measurement (Ei = 0.64 meV) while the largest map correspondsto the lowest resolution measurement (Ei = 9.80 meV). The experimental error on determining the b- and t-values depends on the actual Q-value andthe resolution of the spectrometer. Relative standard error values for b and t were between 5% to 10%. (c) A schematic of the membrane system in the Letspectrometer. (d) b values for slices in qz of 0.15, 0.272, and 0.586 �1 for water motion varying in qx. (e) b values adapted from simulations done byvon Hansen et al.32 plotted as a function of time.
Soft Matter Paper
Publ
ishe
d on
19
Aug
ust 2
015.
Dow
nloa
ded
by J
OIN
T I
LL
- E
SRF
LIB
RA
RY
on
17/0
9/20
15 1
5:15
:42.
View Article Online

Soft Matter This journal is©The Royal Society of Chemistry 2015
water molecules diffusing laterally with small z motions (largeqz), inside the water layer, was found to be almost qx indepen-dent. A slight slowing down of the water molecules at a qx-valueof B0.70 Å�1 is likely related to the presence of the bilayerinterface as a disturbance caused by the lipid head groups.This feature corresponds to the slight decrease in b-values inFig. 8(e) in the computer simulations by von Hansen, Gekle andNetz32 at z0 = 35 Å.
A hydration water molecule that moves about a range ofz = 40 Å while diffusing laterally penetrates the bilayer to thelipid acyl chains. Its motion appears to slow down at a qx valuecorresponding to the distance between two lipid head groupsindicated by the peak in the relaxation time. The relaxationtimes then increase significantly towards larger length scales.
3.2.3 Effect of experimental resolution. A resolution effectis observed in Fig. 8(b): while the general trend is that motionsbecome faster over smaller distances (larger Q-values), t valuesbetween the different resolution frames do not seem to fitseamlessly. When switching from a higher to a lower resolution(moving from a smaller into a larger rectangle in Fig. 8(b)), therelaxation time becomes slower again. Thus, it seems that differ-ent relaxation times can be obtained when the same length scale
is measured at two different energy resolutions equivalent todifferent experimental observation times.
Fig. 10 illustrates the effect: Fig. 10 (a) shows t distributions ofthe fit function to data measured at the same (qx, qz) position inreciprocal space from the data in Fig. 8 (which should have thesame relaxation time), however, measured at different experi-mental resolution times, tR. tR-values are given in the figure andmarked by the shaded areas. For some resolutions, the peak in thetime distribution is outside of the experimentally covered windowand the corresponding relaxation time was extrapolated by the fit.As a consequence, when the quasi-elastic broadening was toosmall to be properly resolved by the instrumental resolution, therelaxation time was found to be systematically over-estimated.
Though counterintuitive, this behaviour is a systematic effectthat can be modelled. If there is little or no noise or error, fitfunctions can typically be determined correctly even when thefunction is not fully covered by the experimentally accessiblerange of data. This is the case when the relaxation time is outsidethe experimental resolution window, as defined in eqn (20). Thecombination of experimental noise and partial coverage, however,may cause a systematic error in the determination of relaxationtimes in quasi-elastic incoherent neutron scattering experiments.In Fig. 10(b), the t-distribution from part (a) was generated and awindow equivalent to the experimentally accessible time windowwas selected. Statistical noise was added to the generated data tomimic experimental conditions. The resulting data were thenfitted again with the original distribution that was used to createthe distribution (and should reproduce the original data). Theresults are shown as solid lines in part (b) and well reproducethe systematic deviation: the relaxation time tends to be over-estimated when the distribution is outside of the experimentalwindow and experimental noise is present.
3.3 Water dynamics from computer modelling
In order to consolidate the picture of anisotropy and anomaly ofwater dynamics obtained by the neutron scattering experiments,
Fig. 9 Lateral diffusion of membrane water molecules as shown byrelaxation time t (t in ps). Slices along qx are shown for two values of qz.The lower curve occurs at qz = 0.15 Å�1 corresponding to length scale ofB40 Å. The lateral motion of a water molecule is slowed significantly for alateral length scale of B10 Å denoted by an increase in t at qx = 0.6 Å�1;most likely due to the water’s interaction with the head group, wherehydrogen bonding occurs. The upper curve occurs at qz = 0.586 Å�1
corresponding to B10 Å. This signal is most likely dominated by watermolecules diffusing in the hydration water layer. Dashed lines correspondto maximum viable t; lines and symbols have corresponding colors.
Fig. 10 (a) Plot of relaxation time probability density functions using b andtKWW values obtained from fits of QENS data for an area of reciprocal spacebounded by Dqz = 0.2–0.1 Å�1 and Dqx = 0.4–0.3 Å�1 for each resolutionprobed. (b) Plot of fits to relaxation time pdfs with b = 0.8 with noise.Values of tKWW and amplitude were obtained for fits to the noisy pdf withineach resolution range. Blocks of color represent the observation time windowfor that particular resolution setup. Observation times (tR) are given.
Paper Soft Matter
Publ
ishe
d on
19
Aug
ust 2
015.
Dow
nloa
ded
by J
OIN
T I
LL
- E
SRF
LIB
RA
RY
on
17/0
9/20
15 1
5:15
:42.
View Article Online

This journal is©The Royal Society of Chemistry 2015 Soft Matter
we employed two sets of computer modelling. First, using full-atomic detail molecular dynamics, we studied the intrinsicallyanomalous character of isotropic, bulk water diffusion atpicosecond time scales.
For hydration water dynamics, we used a coarse-grainedBrownian dynamics simulation to investigate the effects ofgeometrical confinement and locally varying dynamical environ-ments of water molecules interacting with lipid bilayers. Thecorresponding systems are inherently larger in size and thenumber of molecules involved, therefore, making full atomisticsimulations challenging.
3.3.1 Bulk water. Fig. 11 summarizes the results for theatomistic bulk water simulations. b-values are shown in part (a)and the corresponding relaxation times in part (b). As expected forbulk water in isotropic and unconfined conditions, no angulardependence is observed in the relaxation time t and the stretchexponent b. Patterns of concentric circles are observed, in agree-ment with the experimental data. t increases monotonically withdecreasing qx or qz, i.e., increasing length scale. In agreement withthe experimental results bulk water dynamics on picosecondtime scales and over Ångstrom distances (large qx,z-values) issub-diffusive, with b exponents of B0.75. The diffusive naturechanges to Brownian at low qx,z.
The MSD and the derived time-dependent stretch exponentb are shown in Fig. 11(c) and (d). The displacements alongdifferent directions (hdx2i, hdy2i and hdz2i) coincide, indicative ofan isotropic motion. After a ballistic regime at sub-picosecondtime scales, a sub-diffusive regime at time scales of severalpicoseconds follows, and, finally, normal diffusion is reached atnanosecond time scales, in agreement with computer simulationsby von Hansen et al.32 Thus, both experiments and simulationsconsistently indicate that water diffusion has an intrinsically sub-diffusive character on picosecond time scales, also under ambientconditions.
3.3.2 Membrane hydration water. Fig. 12 shows theresults for the simulations of water in proximity to membranes.
Before discussing the 2-dimensional maps, we stress that thecomputational framework used here involved Brownian dynamics,and can, therefore, not account for the intrinsic sub-diffusivecharacter of water diffusion in the bulk. Consistently, the mean-squared displacement and the time-dependent stretch exponent bshould indicate normal diffusion at small times (with b = 1).
However, the stretch exponent b in Fig. 12(a) shows sub-diffusive behaviour at all qx values, with a trend of strongersub-diffusive motion at higher qx. Pronounced anisotropicbehaviour is observed at low qx. The constant IN(Q) is zeroexcept for qx = 0 Å�1 and qz t 0.2 Å�1, indicating geometricalconfinement due to the membrane on a length scale of B30 Å.The relaxation time t (plotted in units of 1 ps in Fig. 12(b))shows anisotropic behaviour at low qx. Water motion is overallslower than in bulk water in Fig. 11(b).
The significantly longer t results from the slowing down ofdynamics close to the membrane, and a longer average relaxa-tion time. The value of b indicates a distribution of localdynamical environments, and thus a distribution of relaxationtimes. This finding is consistent with the observed trend of bapproaching 1 with lowering qx,z, since the molecule explores alarger space and thus performs a temporal average of dynamicalenvironments, finally reaching normal diffusion with the aver-age diffusion coefficient.
With increasing correlation time, the molecules experienceconfinement due to the membrane, which induces an apparentsub-diffusive character for the diffusion displacement. We notethat this factor is only caused by the z coordinate, as shown inthe MSD in Fig. 12(c), while diffusion along x and y is normaldiffusion, as expected from the simulation framework.
At low qx,z, distinct anisotropic features appear in t, b and IN,mirroring the features observed in experiments. In particular,when cutting along the qx axis for small qz, a non-monotonousbehaviour is observed for b and t. The evolution of b as afunction of time is plotted in Fig. 12(d). This non-monotonicityseems to be directly related to confinement effects, since its
Fig. 11 Results from full atomistic molecular dynamics simulations of bulk water using the SPCE model: (a) intrinsic anomaly of water diffusion: thestretch exponent b indicates a transition from normal diffusion at low qx-value to predominantly sub-diffusive behaviour at larger qx. (b) The relaxationtime t (plotted in units of 1 ps) shows no anisotropic behaviour, as expected for bulk water. (c) and (d) The time-dependent stretch exponent as extractedfrom the MSD hdr2i via eqn (24) changes from a super-diffusive, ballistic regime at times below 0.5 ps to a sub-diffusive regime for several ps beforeapproaching the normal diffusive regime for longer time scales.
Soft Matter Paper
Publ
ishe
d on
19
Aug
ust 2
015.
Dow
nloa
ded
by J
OIN
T I
LL
- E
SRF
LIB
RA
RY
on
17/0
9/20
15 1
5:15
:42.
View Article Online

Soft Matter This journal is©The Royal Society of Chemistry 2015
appearance coincides with a non-zero IN, i.e., a non-vanishingcorrelation at long times.
This relation of geometrical confinement and dynamicaleffects can be understood when considering the role of Q inthe calculation of the intermediate scattering function if onecoordinate is confined:
I(Q, t) = hexp[�i-
Q�(-r(t) � -r(0))]i
B exp[�qx2hdx2i � qy
2hdy2i � qz2hdz2i] +. . ., (25)
where the second line is the first term of the so-called cumulantexpansion, the so-called Gaussian approximation. For a fluc-tuation with wave vector Q to relax, the MSD has to increasesufficiently. For the case of the membrane system, the z motionis confined on the experimental time scales, i.e. hdz2i settlesat Llayer B 40 Å for long times, in perfect agreement with theexperiments. Consequently, for qx = qy = 0, correlation remainsfor long times, which is represented by IN(Q) from eqn (8). Atlarge qx, the remaining long-time correlations are relaxed onlythrough the x motion, i.e., diffusion in z and x direction play afundamentally different role. Small qz corresponds to a largerremaining correlation in the z direction, which in turn means that alonger time is needed to relax the fluctuation via the other coordi-nates. We note that the argument is not dependent on the Gaussianapproximation, but similarly holds for higher cumulants, since allz cumulants are constant and confined in the long time limit.
3.4 Motion of water molecules
Lipid diffusion has been studied for decades and it is com-monly accepted that the Brownian motion of lipid moleculesover long, micrometer length scales is characterized by a con-tinuous diffusion process.13–17,21 Although this is a well studiedfundamental process, our understanding of nanoscale diffu-sion in membranes is still being challenged by new results fromexperiments and simulations.
Experimental evidence that lipids move coherently in looselybound clusters, rather than as independent molecules waspresented.7,18–20 A ‘‘hopping’’ diffusion of lipids into nearestneighbour sites was observed in single supported bilayers.6
Ballistic lipid motion in fluid membranes was recently reported.5
It has also been suggested that there is a flow-like component tothe motion of the lipid molecules over long length scales.7
Significantly less work has been done to study dynamics ofhydration water molecules, most likely due to the experimentaland computational challenges. We find that lateral water diffu-sion is affected at all distances from the bilayers and motions ofhydration water molecules differs significantly from the isotropicdiffusion of bulk water.
3.4.1 Anomalous dynamics of hydration water. By labellingwater molecules, lipid head groups, and lipid tails throughselective deuteration, dimensions of hydration water layer, bilayerhead group and tail region were determined by neutron reflectivity.While the highest water density is found in the center of thehydration water layer, the NSLDs give evidence for water moleculesthat are able to penetrate the hydrophobic membrane core;B1 water molecule per 10 lipid molecules were found in thecenter of the fully hydrated membranes.
From the quasi-elastic neutron scattering experiments andcomputer simulations, we obtain a consistent picture of thephenomenology of water diffusion in membrane systems, as well asdifferent origins of anomaly and anisotropy. As a first origin ofanomaly, water shows an intrinsic anomalous diffusion on pico-second time scales, as also observable in bulk water. The secondorigin of anomalous diffusion is related to the distribution of localdynamical environments of hydration water molecules, which leadsto a distribution of relaxation times and sub-diffusive behaviour. Theanisotropic effects of confinement and local dynamical environ-ments on the motions in different directions give rise to direction-dependent relaxation times and stretch exponents due to the varyingsampling time of the system along the unconfined coordinates.
Fig. 12 Results from coarse-grained Brownian dynamics simulation for water confined in a membrane system: (a) anomaly of water diffusion due todynamical heterogeneity and confinement: the stretch exponent b shows sub-diffusive behaviour at all visible qx values, with a trend of stronger sub-diffusive motion at higher qx. Anisotropic behaviour is observed at low qx due to geometrical confinement of the membranes. (b) The relaxation time t(plotted in units of 1 ps) shows a slight anisotropic behaviour at low qx. Water diffusion is overall slower than in bulk (see Fig. 11(a)). (c) and (d) Mean-squared displacements hdr2i and time-dependent stretch exponents b(t) (see eqn (24)) for different coordinate directions evidence a confined motion inz-direction (blue dashed), while the MSD in xy-direction (red dash-dotted) resembles that of normal diffusion. The resulting overall MSD (black solid) hasan apparent sub-diffusive character emerging solely from the confinement of hydration water molecules.
Paper Soft Matter
Publ
ishe
d on
19
Aug
ust 2
015.
Dow
nloa
ded
by J
OIN
T I
LL
- E
SRF
LIB
RA
RY
on
17/0
9/20
15 1
5:15
:42.
View Article Online

This journal is©The Royal Society of Chemistry 2015 Soft Matter
3.4.2 Anomalous diffusion models. Different models aretypically used in the literature to describe membrane andhydration water dynamics in quasi-elastic neutron scatteringexperiments. Through a comparison between a single Lorentzian,two Lorentzians and the KWW function to fit the quasi-elasticbroadening, the single Lorentzian was found to give the poorestagreement, while two Lorentzians and the KWW function bothprovided a satisfying fit. The fundamental difference between thetwo models is the description of relaxation times in the timedomain. The two Lorentzian peaks typically correspond to a slowand a fast process, each with a single relaxation time. While theslow process is well captured, the observed fast process typicallypartially lies outside of the instrumentally accessible energywindow and basically leads to a broad, curved background. Thisprocedure is often used in the literature. While the KWWfunction fits 3 parameters, the model using two Lorentzianfunctions has 4 free parameters. Fitting more free parameterstypically provides better fits with smaller w2-values.
A clear distinction of which model to use is often difficult inQENS data because of the limited statistics in the data, suchthat different models fit the data equally well. We note that FCSsuffers from the same issue and cannot unambiguously deter-mine the basic character of lipid dynamics in membranes.11
However, we argue that motion of water molecules in anisotropicand heterogeneous environments is physically better described bya distribution of relaxation times (a KWW function) rather than asum of individual Brownian processes (several Lorentzian func-tions). This interpretation is supported by the computer simula-tions, i.e., by the linear scaling of intermediate scattering functionin the log–log representation over several decades which isindicative of a single stretched exponential.
We further tested the hypothesis of Lorentzian vs. KWWfunction in the experiment by using different instrumentalresolutions. If the processes fitted by the 2 Lorentzian peakbroadenings were actual physical processes, their correspondingwidth should be constant and they should be independent of theinstrumentally available energy window. However, each energyresolution was well fit by a narrow and a broad Lorentzian peak,with no correlation between the broad peaks at different resolu-tions. This is strong evidence that the broad Lorentzian is likely afitting artefact in the case of hydration water. We can, of course,not make a statement about lipid dynamics as this was not partof the current study.
Measurements at different hydrations could possibly be usedto distinguish between Lorentzian and KWW models in QENSexperiments in the future. One may expect that de-hydrationleads to a more heterogeneous environment of water moleculesand correspondingly smaller values of b, possibly up to the pointwhere Lorentzians no longer describe the data.
4 Conclusion
Diffusion of hydration water molecules in hydrated phospholipidbilayers was studied using 2-dimensional incoherent quasi-elastic neutron scattering combined with computer modelling.
By aligning the membranes horizontally in the spectrometer,lateral and transverse molecular motions can be studied sepa-rately, but simultaneously, by analyzing different positions onthe 2-dimensional detector array. The dynamics were describedin the energy domain by KWW functions, corresponding tostretched exponentials in the time domain.
The nanoscale dynamics of hydration water molecules isanisotropic, and shows a sub-diffusive behaviour on nanometerlength scales. As a first origin of the anomalous character ofhydration water we have identified the intrinsic sub-diffusion ofwater at picosecond time scales, as also observed in bulk water.Secondly, a dynamically heterogeneous environment causes adistribution of relaxation times that finally appear as a sub-diffusive motion. These 2-dimensional data show a distinctregime of very slow dynamics at small Q-values, related to thegeometry of the stacked bilayers used for the experiment.
Diffusion experiments using 2-dimensional detectors will inthe future be used to precisely measure penetration and perme-ability of water molecules across bilayers as a function of bilayercomposition,40,73 and to study the interaction of water withmembrane inclusions, such as proteins and peptides.
Acknowledgements
Experiments were funded by the Natural Sciences and Engi-neering Research Council (NSERC) of Canada, the NationalResearch Council (NRC), the Canada Foundation for Innovation(CFI), and the Ontario Ministry of Economic Development andInnovation. L.T. is the recipient of an NSERC Canada GraduateScholarship, M.C.R. is the recipient of an Early ResearcherAward from the Province of Ontario. H.R.G. was supported bythe United States DOE, Office of Basic Energy Sciences underContract No. 46680. We profited from discussions with Jean-Louis Barrat (Grenoble) on the general interpretation.
References
1 M. Guo, A. J. Ehrlicher, M. H. Jensen, M. Renz, J. R. Moore,R. D. Goldman, J. Lippincott-Schwartz, F. C. Mackintoshand D. A. Weitz, Probing the stochastic, motor-drivenproperties of the cytoplasm using force spectrum micro-scopy, Cell, 2014, 158, 822–832.
2 F. Hofling and T. Franosch, Anomalous transport in thecrowded world of biological cells, Rep. Prog. Phys., 2013,76, 046602.
3 D. S. Banks and C. Fradin, Anomalous diffusion of proteinsdue to molecular crowding, Biophys. J., 2005, 89, 2960–2971.
4 F. Roosen-Runge, M. Hennig, F. Zhang, R. M. J. Jacobs,M. Sztucki, H. Schober, T. Seydel and F. Schreiber, Proteinself-diffusion in crowded solutions, Proc. Natl. Acad. Sci.U. S. A., 2011, 108, 11815.
5 C. L. Armstrong, M. Trapp, J. Peters, T. Seydel and M. C.Rheinstadter, Short range ballistic motion in fluid lipidbilayers studied by quasi-elastic neutron scattering, SoftMatter, 2011, 7, 8358–8362.
Soft Matter Paper
Publ
ishe
d on
19
Aug
ust 2
015.
Dow
nloa
ded
by J
OIN
T I
LL
- E
SRF
LIB
RA
RY
on
17/0
9/20
15 1
5:15
:42.
View Article Online
Soft Matter This journal is©The Royal Society of Chemistry 2015
6 C. L. Armstrong, M. D. Kaye, M. Zamponi, E. Mamontov,M. Tyagi, T. Jenkins and M. C. Rheinstadter, Diffusion insingle solid supported lipid bilayers studied by quasi-elasticneutron scattering, Soft Matter, 2010, 6, 5864–5867.
7 S. Busch, C. Smuda, L. C. Pardo and T. Unruh, Molecularmechanism of long-range diffusion in phospholipid mem-branes studied by quasielastic neutron scattering, J. Am.Chem. Soc., 2010, 132, 3232–3233.
8 E. Flenner, J. Das, M. C. Rheinstadter and I. Kosztin, Sub-diffusion and lateral diffusion coefficient of lipid atoms andmolecules in phospholipid bilayers, Phys. Rev. E: Stat.,Nonlinear, Soft Matter Phys., 2009, 79, 011907.
9 G. R. Kneller, K. Baczynski and M. Pasenkiewicz-Gierula,Communication: consistent picture of lateral subdiffusionin lipid bilayers: molecular dynamics simulation and exactresults, J. Chem. Phys., 2011, 135, 141105.
10 J.-H. Jeon, H. M.-S. Monne, M. Javanainen and R. Metzler,Anomalous diffusion of phospholipids and cholesterols in alipid bilayer and its origins, Phys. Rev. Lett., 2012, 109, 188103.
11 P. Schwille, J. Korlach and W. W. Webb, Fluorescence corre-lation spectroscopy with single-molecule sensitivity on celland model membranes, Cytometry, 1999, 36, 176–182.
12 D. S. Martin, M. B. Forstner and J. A. Kas, Apparentsubdiffusion inherent to single particle tracking, Biophys.J., 2002, 83, 2109–2117.
13 S. Konig, W. Pfeiffer, T. Bayerl, D. Richter and E. Sackmann,Molecular dynamics of lipid bilayers studied by incoherentquasi-elastic neutron scattering, J. Phys. II, 1992, 2, 1589–1615.
14 S. Konig, E. Sackmann, D. Richter, R. Zorn, C. Carlile andT. M. Bayerl, Molecular dynamics of water in oriented dppcmultilayers studied by quasielastic neutron scattering anddeuterium-nuclear magnetic resonance relaxation, J. Chem.Phys., 1994, 100, 3307–3316.
15 S. Konig, T. M. Bayerl, G. Coddens, D. Richter andE. Sackmann, Hydration dependence of chain dynamics andlocal diffusion in l-alpha-dipalmitoylphosphatidylcholinemultilayers studied by incoherent quasi-elastic neutronscattering, Biophys. J., 1995, 68, 1871–1880.
16 W. Pfeiffer, Th. Henkel, E. Sackmann and W. Knorr, Localdynamics of lipid bilayers studied by incoherent quasi-elastic neutron scattering, Europhys. Lett., 1989, 8, 201–206.
17 W. Pfeiffer, S. Konig, J. F. Legrand, T. Bayerl, D. Richter andE. Sackmann, Neutron spin echo study of membrane undula-tions in lipid multibilayers, Europhys. Lett., 1993, 23, 457–462.
18 E. Falck, T. Rog, M. Karttunen and I. Vattulainen, Lateraldiffusion in lipid membranes through collective flows,J. Am. Chem. Soc., 2008, 130, 44–45.
19 M. C. Rheinstadter, J. Das, E. J. Flenner, B. Bruning,T. Seydel and I. Kosztin, Motional coherence in fluid phos-pholipid membranes, Phys. Rev. Lett., 2008, 101, 248106.
20 C. L. Armstrong, L. Toppozini, H. Dies, A. Faraone,M. Nagao and M. Rheinstadter, Incoherent neutron spin-echo spectroscopy as an option to study long-range lipiddiffusion, ISRN Biophys., 2013, 2013, 9.
21 U. Wanderlingh, G. D’Angelo, C. Branca, V. C. Nibali,A. Trimarchi, S. Rifici, C. Finocchiaro, D. ad Crupi,
J. Ollivier and H. D. Middendorf, Multi-component model-ing of quasielastic neutron scattering from phospholipidmembranes, J. Chem. Phys., 2014, 140, 174901.
22 S. R. Wassall, Pulsed field gradient-spin echo NMR studiesof water diffusion in a phospholipid model membrane,Biophys. J., 1996, 71, 2724.
23 M. Weik, U. Lehnert and G. Zaccai, Liquid-like water con-fined in stacks of biological membranes at 200 K and itsrelation to protein dynamics, Biophys. J., 2005, 89, 3639–3646.
24 L. Toppozini, C. L. Armstrong, M. D. Kaye, M. Tyagi,T. Jenkins and M. Rheinstadter, Hydration water freezingin single supported lipid bilayers, ISRN Biophys., 2012,2012, 520307.
25 M. C. Rheinstadter, T. Seydel, F. Demmel and T. Salditt,Molecular motions in lipid bilayers studied by the neutronbackscattering technique, Phys. Rev. E: Stat., Nonlinear, SoftMatter Phys., 2005, 71, 061908.
26 P. W. Fenimore, H. Frauenfelder, B. H. McMahon andF. G. Parak, Slaving: solvent fluctuations dominate proteindynamics and functions, Proc. Natl. Acad. Sci. U. S. A., 2002,99, 16047–16051.
27 P. W. Fenimore, H. Frauenfelder, B. H. McMahon andR. D. Young, Bulk-solvent and hydration-shell fluctuations,similar to a- and b-fluctuations in glasses, control proteinmotions and functions, Proc. Natl. Acad. Sci. U. S. A., 2004,101, 14408–14413.
28 H. Frauenfelder, P. W. Fenimore, G. Chen and B. H.McMahon, Protein folding is slaved to solvent motions,Proc. Natl. Acad. Sci. U. S. A., 2006, 103, 15469–15472.
29 G. Zaccai, The effect of water on protein dynamics, Philos.Trans. R. Soc., B, 2004, 359, 1269–1275.
30 O. Kel, A. Tamimi, M. C. Thielges and M. D. Fayer, Ultrafaststructural dynamics inside planar phospholipid multi-bilayer model cell membranes measured with 2D IR spectro-scopy, J. Am. Chem. Soc., 2013, 135, 11063–11074.
31 K. Wood, M. Plazanet, F. Gabel, B. Kessler, D. Oesterhelt,D. J. Tobias, G. Zaccai and M. Weik, Coupling of protein andhydration-water dynamics in biological membranes, Proc.Natl. Acad. Sci. U. S. A., 2007, 104, 18049–18054.
32 Y. von Hansen, S. Gekle and R. R. Netz, Anomalous aniso-tropic diffusion dynamics of hydration water at lipid mem-branes, Phys. Rev. Lett., 2013, 111, 118103.
33 F. Y. Hansen, G. H. Peters, H. Taub and A. Miskowiec,Diffusion of water and selected atoms in DMPC lipid bilayermembranes, J. Chem. Phys., 2012, 137, 204910.
34 P. Wasterby, G. Oradd and G. Lindblom, Anisotropic waterdiffusion in macroscopically oriented lipid bilayers studiedby pulsed magnetic field gradient NMR, J. Magn. Reson.,2002, 157, 156–159.
35 A. Ghosh, R. Kramer Campen, M. Sovago and M. Bonn,Structure and dynamics of interfacial water in model lungsurfactants, Faraday Discuss., 2009, 141, 145–159.
36 L. Piatkowski, J. de Heij and H. J. Bakker, Probing thedistribution of water molecules hydrating lipid membraneswith ultrafast forster vibrational energy transfer, J. Phys.Chem. B, 2013, 117, 1367–1377.
Paper Soft Matter
Publ
ishe
d on
19
Aug
ust 2
015.
Dow
nloa
ded
by J
OIN
T I
LL
- E
SRF
LIB
RA
RY
on
17/0
9/20
15 1
5:15
:42.
View Article Online

This journal is©The Royal Society of Chemistry 2015 Soft Matter
37 S. M. Gruenbaum and J. L. Skinner, Vibrational spectro-scopy of water in hydrated lipid multi-bilayers. iii. waterclustering and vibrational energy transfer, J. Chem. Phys.,2013, 139, 175103.
38 J. Andrasko and S. Forsen, NMR study of rapid waterdiffusion across lipid bilayers in dipalmitoyl lecithin vesi-cles, Biochem. Biophys. Res. Commun., 1974, 60, 813–819.
39 S.-J. Marrink and H. J. C. Berendsen, Simulation of watertransport through a lipid membrane, J. Phys. Chem., 1994,98, 4155–4168.
40 M. D. Kaye, K. Schmalzl, V. C. Nibali, M. Tarek andM. C. Rheinstadter, Ethanol enhances collective dynamicsof lipid membranes, Phys. Rev. E: Stat., Nonlinear, SoftMatter Phys., 2011, 83, 050907.
41 J. R. P. Webster, S. Langridge, R. M. Dalgliesh and T. R.Charlton, Reflectometry techniques on the second targetstation at ISIS: methods and science, Eur. Phys. J. Plus, 2011,126, 1–5.
42 R. Dalgliesh, S. Langridge, J. Plomp, V. O. de Haan andA. A. van Well, Offspec, the ISIS spin-echo reflectometer,Phys. B, 2011, 406, 2346–2349.
43 M. A. Barrett, S. Zheng, G. Roshankar, R. J. Alsop, R. K. R.Belanger, C. Huynh, N. Kucerka and M. C. Rheinstadter,Interaction of aspirin (acetylsalicylic acid) with lipid mem-branes, PLoS One, 2012, 7, e34357.
44 M. A. Barrett, S. Zheng, L. A. Toppozini, R. J. Alsop, H. Dies,A. Wang, N. Jago, M. Moore and M. C. Rheinstadter, Solu-bility of cholesterol in lipid membranes and the formationof immiscible cholesterol plaques at high cholesterol con-centrations, Soft Matter, 2013, 9, 9342–9351.
45 R. J. Alsop, M. A. Barrett, S. Zheng, H. Dies and M. C.Rheinstadter, Acetylsalicylic acid (ASA) increases the solu-bility of cholesterol when incorporated in lipid membranes,Soft Matter, 2014, 10, 4275–4286.
46 R. J. Alsop, C. Armstrong, A. Maqbool, L. Toppozini, H. Diesand M. C. Rheinstadter, Cholesterol expels ibuprofen fromthe hydrophobic membrane core and stabilizes lamellarphases in lipid membranes containing ibuprofen, SoftMatter, 2015, 11, 4756–4767.
47 K. Hristova and S. H. White, Determination of the hydro-carbon core structure of fluid dioleoylphosphocholine(dopc) bilayers by x-ray diffraction using specific bromina-tion of the double-bonds: effect of hydration, Biophys. J.,1998, 74, 2419–2433.
48 S. Tristram-Nagle, Y. Liu, J. Legleiter and J. F. Nagle, Struc-ture of gel phase DMPC determined by X-ray diffraction,Biophys. J., 2002, 83, 3324–3335.
49 J. F. Nagle and M. C. Wiener, Relations for lipid bilayers,Biophys. J., 1989, 55, 309–313.
50 J. F. Nagle, R. Zhang, S. Tristram-Nagle, W. Sun, H. I.Petrache and R. M. Suter, X-ray structure determination offully hydrated la phase dipalmitoylphosphatidylcholinebilayers, Biophys. J., 1996, 70, 1419–1431.
51 N. Kucerka, Y. Liu, N. Chu, H. I. Petrache, S. Tristram-Nagleand J. F. Nagle, Structure of fully hydrated fluid phaseDMPC and DLPC lipid bilayers using X-ray scattering from
oriented multilamellar arrays and from unilamellar vesicles,Biophys. J., 2005, 88, 2626–2637.
52 R. I. Bewley, J. W. Taylor and S. M. Bennington, Let,a cold neutron multi-disk chopper spectrometer at ISIS,Nucl. Instrum. Methods Phys. Res., Sect. A, 2011, 637,128–134.
53 R. I. Bewley, J. W. Taylor and S. M. Bennington, Let: a lowenergy multiple chopper spectrometer at ISIS, NotiziarioNeutroni e Luce di Sincrotrone, 2011, 16, 4–13.
54 R. T. Azuah, L. R. Kneller, Y. Qiu, P. L. W. Tregenna-Piggott,C. M. Brown, J. R. D. Copley and R. M. Dimeo, Dave: acomprehensive software suite for the reduction, visualiza-tion, and analysis of low energy neutron spectroscopic data,J. Res. Natl. Inst. Stand. Technol., 2009, 114, 341–358.
55 M. Bee, Quasielastic Neutron Scattering: Principles and Appli-cations in Solid State Chemistry, Biology and MaterialsScience, Taylor & Francis, 1988.
56 J. Hansen and I. McDonald, Theory of Simple Liquids, Elsevier,Oxford, 2006.
57 D. Vural and H. R. Glyde, Intrinsic mean-square displace-ments in proteins, Phys. Rev. E: Stat., Nonlinear, Soft MatterPhys., 2012, 86, 011926.
58 D. Vural, L. Hong, J. C. Smith and H. R. Glyde, Long-timemean-square displacements in proteins, Phys. Rev. E: Stat.,Nonlinear, Soft Matter Phys., 2013, 88, 052706.
59 G. Williams and D. C. Watts, Non-symmetrical dielectricrelaxation behaviour arising from a simple empirical decayfunction, Trans. Faraday Soc., 1970, 66, 80–85.
60 C. P. Lindsey and G. D. Patterson, Detailed comparison ofthe Williams–Watts and Cole–Davidson functions, J. Chem.Phys., 1980, 73, 3348.
61 J. R. Taylor, A Introduction to Error Analysis: the study ofuncertainties in physical measurements, University ScienceBooks, 1997.
62 D. Vural, L. Hong, J. C. Smith and H. R. Glyde, Motionaldisplacements in proteins: the origin of wave-vector-dependent values, Phys. Rev. E: Stat., Nonlinear, Soft MatterPhys., 2015, 91, 052705.
63 J. M. Sancho, Brownian colloidal particles: ITO, stratono-vich, or a different stochastic interpretation, Phys. Rev. E:Stat., Nonlinear, Soft Matter Phys., 2011, 84, 062102.
64 N. Kucerka, J. F. Nagle, J. N. Sachs, S. E. Feller, J. Pencer,A. Jackson and J. Katsaras, Lipid bilayer structure deter-mined by the simultaneous analysis of neutron and X-rayscattering data, Biophys. J., 2008, 95, 2356–2367.
65 H. Petrache, S. Feller and J. Nagle, Determination of com-ponent volumes of lipid bilayers from simulations, Biophys.J., 1997, 70, 2237–2242.
66 J. F. Nagle and S. Tristram-Nagle, Structure of lipid bilayers,Biochim. Biophys. Acta, 1469, 2000, 159–195.
67 J. Yang, C. Calero and J. Marti, Diffusion and spectroscopyof water and lipids in fully hydrated dimyristoylphosphati-dylcholine bilayer membranes, J. Chem. Phys., 2014, 140,104901.
68 F. Sciortino, P. Gallo, P. Tartaglia and S.-H. Chen,Supercooled water and the kinetic glass transition,
Soft Matter Paper
Publ
ishe
d on
19
Aug
ust 2
015.
Dow
nloa
ded
by J
OIN
T I
LL
- E
SRF
LIB
RA
RY
on
17/0
9/20
15 1
5:15
:42.
View Article Online

Soft Matter This journal is©The Royal Society of Chemistry 2015
Phys. Rev. E: Stat. Phys., Plasmas, Fluids, Relat. Interdiscip.Top., 1996, 54, 6331–6343.
69 F. Y. Chen, W. C. Hung and H. W. Huang, Critical swelling ofphospholipid bilayers, Phys. Rev. Lett., 1997, 79, 4026–4029.
70 S.-H. Chen, C. Liao, F. Sciortino, P. Gallo and P. Tartaglia,Model for single-particle dynamics in supercooled water,Phys. Rev. E: Stat. Phys., Plasmas, Fluids, Relat. Interdiscip.Top., 1999, 59, 6708–6714.
71 V. Crupi, D. Majolino, P. Migliardo and V. Venuti, Diffusiverelaxations and vibrational properties of water andh-bonded systems in confined state by neutrons and light
scattering: state of the art, J. Phys. Chem. A, 2000, 104,11000–11012.
72 V. Crupi, D. Majonlino, P. Migliardo and V. Venuti, Neutronscattering study and dynamic properties of hydrogen-bondliquids in mesoscopic confinement. 1. The water case,J. Phys. Chem. B, 2002, 106, 10884–10894.
73 L. Toppozini, C. L. Armstrong, M. A. Barrett, S. Zheng,L. Luo, H. Nanda, V. Garcia Sakai and M. Rheinstadter,Partitioning of ethanol into lipid membranes and its effecton fluidity and permeability as seen by X-ray and neutronscattering, Soft Matter, 2012, 8, 11839–11849.
Paper Soft Matter
Publ
ishe
d on
19
Aug
ust 2
015.
Dow
nloa
ded
by J
OIN
T I
LL
- E
SRF
LIB
RA
RY
on
17/0
9/20
15 1
5:15
:42.
View Article Online