anomalous propagation of long-period ground motions recorded … · · 2016-09-14from the 1964...
TRANSCRIPT
863
Bulletin of the Seismological Society of America, Vol. 97, No. 3, pp. 863–880, June 2007, doi: 10.1785/0120060166
E
Anomalous Propagation of Long-Period Ground Motions Recorded
in Tokyo during the 23 October 2004 Mw 6.6 Niigata-ken Chuetsu,
Japan, Earthquake
by Takashi Furumura and Toshihiko Hayakawa
Abstract Unusually large (�5 cm) and prolonged shaking associated with long-period ground motions at periods of about 7 sec were observed in central Tokyoduring the Mw 6.6 Niigata-ken Chuetsu earthquake of 23 October 2004. The long-period ground motions caused significant resonance in high-rise buildings of about70 floors in height. Thus, it is an urgent matter to understand the development andamplification properties of long-period ground motions in Tokyo associated withlarge earthquakes.
In this study, we use numerous waveform records from 585 stations in a nationwideaccelerometer network (K-NET, KiK-net) and 495 intensity meters in the area aroundTokyo. The data reveal that the long-period ground motion is characterized in mostpart by a surface, Rayleigh wave generated at the northern edge of Kanto basin, andthe surface wave is developed as propagating through a thick cover of sediments(�3000–4000 m) that overlies rigid bedrock.
To complement the observational data, we conducted a large-scale computer simu-lation of seismic-wave propagation by employing the Earth Simulator supercomputerwith a detailed source-slip model and a high-resolution 3D sedimentary structuralmodel of central Japan. The results of the computer simulation demonstrate that theanomalously prolonged ground shaking of the long-period signal recorded in thecenter of Tokyo occurred because of the stagnation of seismic energy resulting fromthe multipathing and focusing of Rayleigh waves toward the bottom of the Kantobasin from surrounding mountain regions with interaction to the 3D basin structure.
Online material: Animations of long-period ground motions in Tokyo.
Introduction
A large (Mw 6.6) inland earthquake occurred at Chuetsu,Niigata, Japan, on 23 October 2004, causing significant dam-age along with 31 deaths and more than 2000 injured personsnear the hypocentral region. The shallow (h � 9 km) andlarge (�2 m) slip on the earthquake fault plane produced asignificant ground acceleration of more 1700 cm/sec/sec atOjiya City immediately above the hypocenter, and a shakingintensity of 7 (the maximum on the scale of the JapaneseMeteorological Agency [JMA]) was recorded in the area.This earthquake was the most damaging in Japanese modernhistory since the destructive Kobe (Mw 6.9) earthquake of1995.
The largest population center of Tokyo within Kantobasin is located more than 150–200 km from the earthquakeepicenter, and the maximum intensity was less than 3 in thisarea, but Tokyo was subjected to more than 5 min of intense(�5 cm) ground shaking, with a relatively long dominant
period of about 7 sec. Such large, lengthy, and long-periodshaking caused significant resonance within high-rise build-ings of approximately 70 floors in height, thus warning ofthe high risk to modern constructions posed by nearby largeearthquakes.
The prolonged duration of the long-period ground mo-tions brings to mind the severe damage and accompanyingfire in large oil storage tanks that resulted from resonanceassociated with long-period ground motions such as thosefrom the 1964 Niigata earthquake (M 7.5) and the 1983 Cen-tral Japan Sea earthquake (M 7.7) (e.g., Kudo and Sakaue,1984). The 1985 Michoacan (Mw 8.1) earthquake in Mexicoresulted in more than 20,000 fatalities in Mexico City,400 km from the epicenter, because of the effects of rela-tively long-period motions of 2–3 sec and an extremely pro-longed duration of more than 10 min (e.g., Anderson et al.,1986). A similar disaster occurred for oil storage tanks lo-

864 T. Furumura and T. Hayakawa
Figure 1. Distribution maps of the network of strong-motion instruments of K-NETand KiK-net (a) and intensity meters in the Kanto area (SK-net) (b). The hypocenterof the Chuetsu earthquake is shown by a star.
cated at Tomakomai during the 2003 Tokachi-oki Mw 8.0earthquake, even though the tanks were located more than250 km from the epicenter (Hatayama et al., 2004; Koketsuet al., 2005). These examples highlight the danger of long-period motions related to large distant earthquakes.
It is therefore an urgent matter to explore the generationand development processes of long-period ground motionswithin Kanto basin and the propagation properties towardcentral Tokyo to mitigate potential disasters associated withfuture large earthquakes.
Ground motions associated with the Chuetsu earthquakewere well characterized by recordings from a dense, nation-wide strong-motion network (K-NET and KiK-net) that isinstalled almost uniformly across Japan at intervals of about20–25 km (Fig. 1). In addition to the strong-motion network,we are also able to use data from intensity meters located atcity government offices and fire stations, among other sites,around Tokyo. The integrated seismic network of strong-motion instruments and intensity meters (SK-net) providesus with a detailed understanding of the nature of long-periodground motions that result from the interaction of seismicwaves with the 3D subsurface structure of the Kanto basin.
To complement these observational data and gain in-sight into the complex seismic behavior recorded beneath
Tokyo, we used the Earth Simulator supercomputer with ahigh-resolution subsurface structure model of central Japanand the Kanto Basin and an appropriate source-slip modelfor the earthquake. The results of the computer simulationof seismic-wave propagation for the Chuetsu earthquakeclearly demonstrate complicated seismic behavior within theheterogeneous 3D basin structure and the process of devel-opment of the large and prolonged long-period ground mo-tions recorded in central Tokyo. The computer simulationalso offers important insights into the excitation propertiesof long-period ground motions in Tokyo arising from otherearthquake scenarios with varying earthquake size.
Observed Ground Motions Associated with the 2004Chuetsu Earthquake
Figure 2 shows ground motions resulting from theChuetsu earthquake, as recorded by the nationwide K-NETand KiK-net strong-motion networks following the visuali-zation procedure of the seismic waves (Furumura et al.,2003; Furumura and Chen, 2004). The dense and uniformrecording at intervals of about 20–25 km reveals the spatialand temporal distribution of ground motions following theearthquake, including significant resonance of long-period

Anomalous Propagation of Long-Period Ground Motions Recorded in Tokyo, 23 October 2004 865
Figure 2. Distribution of ground motions following the Niigata-ken Chuetsu earth-quake, Japan. The amplitude of the ground-velocity motions are shown for times ofT � 20, 60, 120, and 180 sec after the earthquake rupture. ( E See supplementalmaterial in the online edition of BSSA.)
seismic waves within the thick cover of low-wavespeed sed-iments in locations such as Tokyo, Nagoya, and Sendai.Each of the four snapshots shown in Figure 2 is derived fromthe interpolation of 585 seismic records after the applicationof a low-pass filter (f � 0.5 Hz) to reduce the spatial aliasingeffect; acceleration is integrated into the ground-velocitymotions to enhance the long-period ground motions greaterthan 1 Hz.
In the T � 20 sec snapshot in Figure 2, a large groundmotion resulting from the radiation of S waves from thereverse-fault source of the Chuetsu earthquake shows an al-most isotropic rampart above the hypocenter. As the wavesspread from the source region, the effect of near-surface het-erogeneity becomes apparent (60 sec), and significant am-plification of ground motions within sedimentary basins isclearly captured in the following frames at 120 and 180 sec.The reinforced long-period ground-velocity motions withinthick sediments beneath central Tokyo are at least 10 timesgreater than those measured in surrounding areas.
In the last frame (180 sec), intense and prolonged
ground motions within the basin continued for several min-utes in Kanto basin, providing a clear outline of the basinmargins. Similar phenomena of amplification and prolongedground shaking within basins are also found in other popu-lation centers such as Akita, Sendai, and Nagoya, but theeffect is most pronounced within the Kanto basin.
Peak Ground Displacement and Intensity
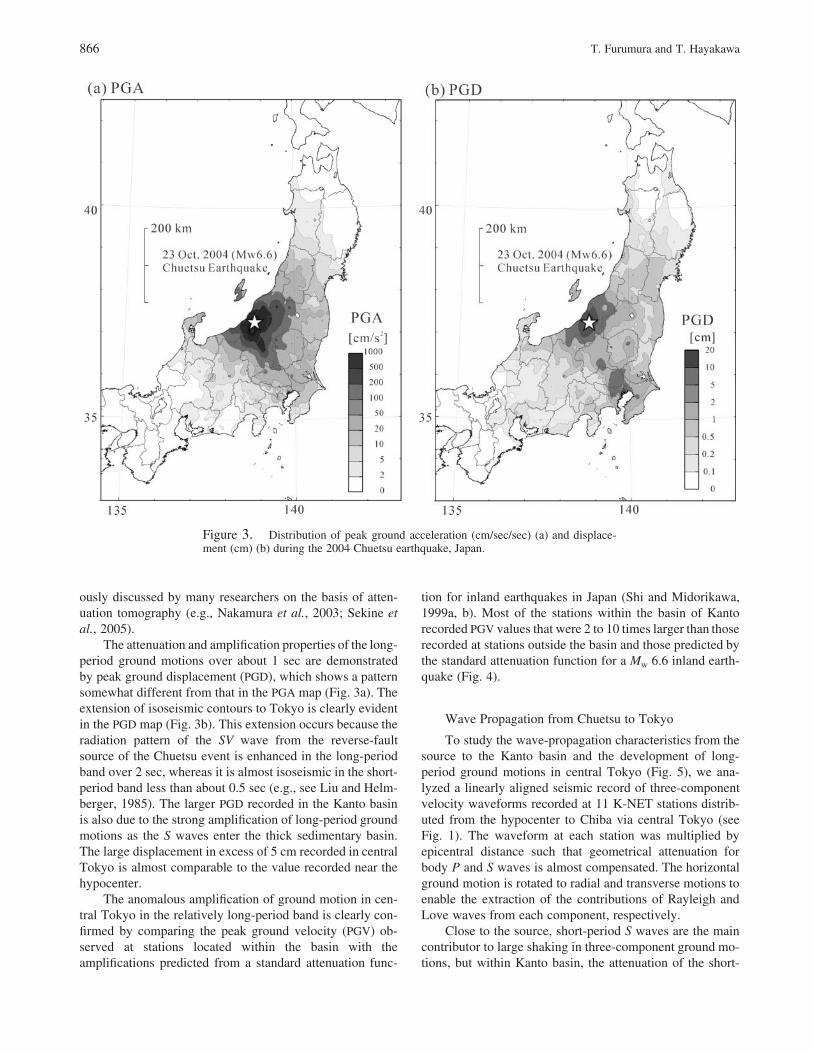
Figure 3a shows the distribution of peak ground accel-eration (PGA), and Figure 3b shows the peak ground dis-placement produced by the earthquake. A large ground ac-celeration in excess of 1000 cm/sec/sec is found above thesource region, and the area in excess of 200 cm/sec/sec ex-tends over a wide area of about 50 km from the hypocenter.
The PGA pattern shows an almost circular distributionabove the hypocenter, with some elongation of PGA contoursto the southeast (to Tokyo) and relatively large attenuationto the southwest. This pattern indicates a greater intrinsicattenuation (low Q) in the crust of central Japan, as previ-
866 T. Furumura and T. Hayakawa
Figure 3. Distribution of peak ground acceleration (cm/sec/sec) (a) and displace-ment (cm) (b) during the 2004 Chuetsu earthquake, Japan.
ously discussed by many researchers on the basis of atten-uation tomography (e.g., Nakamura et al., 2003; Sekine etal., 2005).
The attenuation and amplification properties of the long-period ground motions over about 1 sec are demonstratedby peak ground displacement (PGD), which shows a patternsomewhat different from that in the PGA map (Fig. 3a). Theextension of isoseismic contours to Tokyo is clearly evidentin the PGD map (Fig. 3b). This extension occurs because theradiation pattern of the SV wave from the reverse-faultsource of the Chuetsu event is enhanced in the long-periodband over 2 sec, whereas it is almost isoseismic in the short-period band less than about 0.5 sec (e.g., see Liu and Helm-berger, 1985). The larger PGD recorded in the Kanto basinis also due to the strong amplification of long-period groundmotions as the S waves enter the thick sedimentary basin.The large displacement in excess of 5 cm recorded in centralTokyo is almost comparable to the value recorded near thehypocenter.
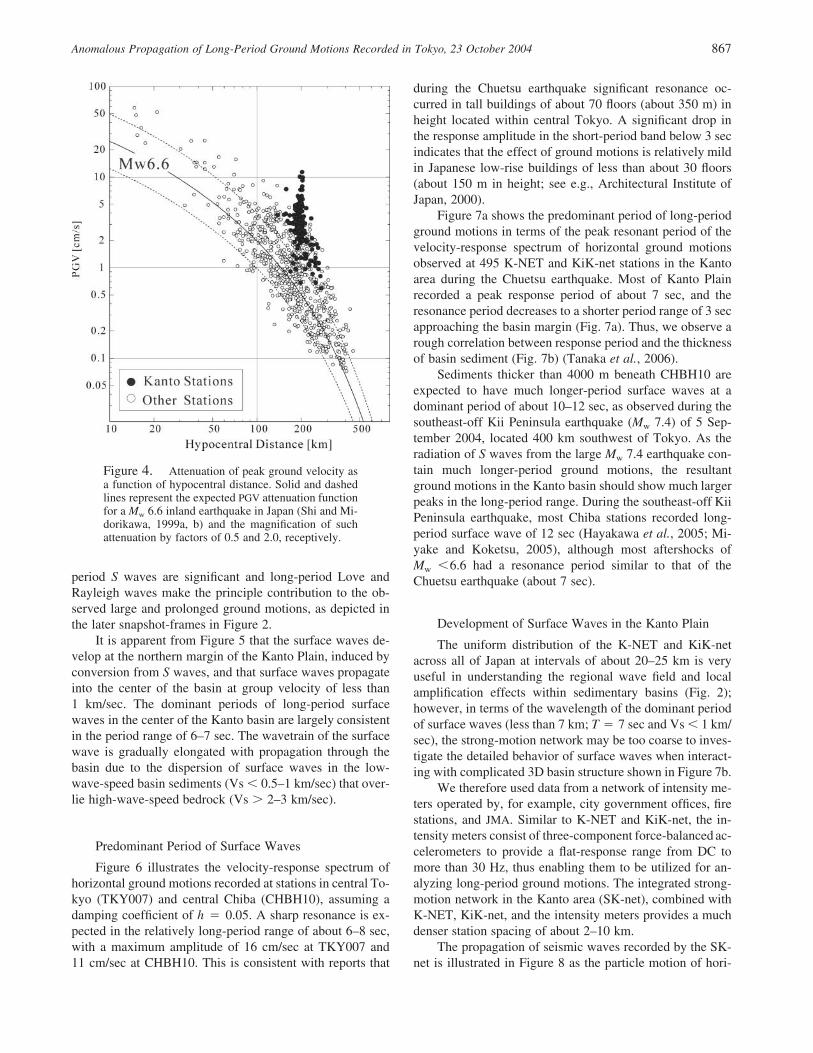
The anomalous amplification of ground motion in cen-tral Tokyo in the relatively long-period band is clearly con-firmed by comparing the peak ground velocity (PGV) ob-served at stations located within the basin with theamplifications predicted from a standard attenuation func-
tion for inland earthquakes in Japan (Shi and Midorikawa,1999a, b). Most of the stations within the basin of Kantorecorded PGV values that were 2 to 10 times larger than thoserecorded at stations outside the basin and those predicted bythe standard attenuation function for a Mw 6.6 inland earth-quake (Fig. 4).
Wave Propagation from Chuetsu to Tokyo
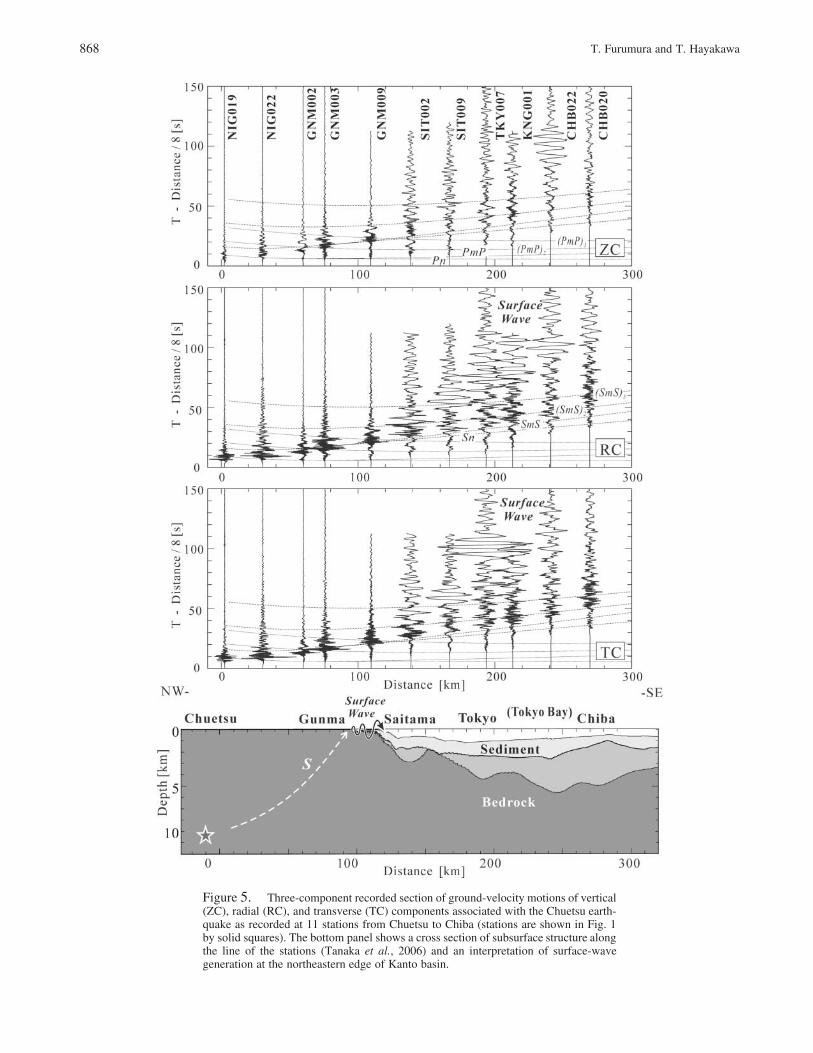
To study the wave-propagation characteristics from thesource to the Kanto basin and the development of long-period ground motions in central Tokyo (Fig. 5), we ana-lyzed a linearly aligned seismic record of three-componentvelocity waveforms recorded at 11 K-NET stations distrib-uted from the hypocenter to Chiba via central Tokyo (seeFig. 1). The waveform at each station was multiplied byepicentral distance such that geometrical attenuation forbody P and S waves is almost compensated. The horizontalground motion is rotated to radial and transverse motions toenable the extraction of the contributions of Rayleigh andLove waves from each component, respectively.
Close to the source, short-period S waves are the maincontributor to large shaking in three-component ground mo-tions, but within Kanto basin, the attenuation of the short-
Anomalous Propagation of Long-Period Ground Motions Recorded in Tokyo, 23 October 2004 867
Figure 4. Attenuation of peak ground velocity asa function of hypocentral distance. Solid and dashedlines represent the expected PGV attenuation functionfor a Mw 6.6 inland earthquake in Japan (Shi and Mi-dorikawa, 1999a, b) and the magnification of suchattenuation by factors of 0.5 and 2.0, receptively.
period S waves are significant and long-period Love andRayleigh waves make the principle contribution to the ob-served large and prolonged ground motions, as depicted inthe later snapshot-frames in Figure 2.
It is apparent from Figure 5 that the surface waves de-velop at the northern margin of the Kanto Plain, induced byconversion from S waves, and that surface waves propagateinto the center of the basin at group velocity of less than1 km/sec. The dominant periods of long-period surfacewaves in the center of the Kanto basin are largely consistentin the period range of 6–7 sec. The wavetrain of the surfacewave is gradually elongated with propagation through thebasin due to the dispersion of surface waves in the low-wave-speed basin sediments (Vs � 0.5–1 km/sec) that over-lie high-wave-speed bedrock (Vs � 2–3 km/sec).
Predominant Period of Surface Waves
Figure 6 illustrates the velocity-response spectrum ofhorizontal ground motions recorded at stations in central To-kyo (TKY007) and central Chiba (CHBH10), assuming adamping coefficient of h � 0.05. A sharp resonance is ex-pected in the relatively long-period range of about 6–8 sec,with a maximum amplitude of 16 cm/sec at TKY007 and11 cm/sec at CHBH10. This is consistent with reports that
during the Chuetsu earthquake significant resonance oc-curred in tall buildings of about 70 floors (about 350 m) inheight located within central Tokyo. A significant drop inthe response amplitude in the short-period band below 3 secindicates that the effect of ground motions is relatively mildin Japanese low-rise buildings of less than about 30 floors(about 150 m in height; see e.g., Architectural Institute ofJapan, 2000).
Figure 7a shows the predominant period of long-periodground motions in terms of the peak resonant period of thevelocity-response spectrum of horizontal ground motionsobserved at 495 K-NET and KiK-net stations in the Kantoarea during the Chuetsu earthquake. Most of Kanto Plainrecorded a peak response period of about 7 sec, and theresonance period decreases to a shorter period range of 3 secapproaching the basin margin (Fig. 7a). Thus, we observe arough correlation between response period and the thicknessof basin sediment (Fig. 7b) (Tanaka et al., 2006).
Sediments thicker than 4000 m beneath CHBH10 areexpected to have much longer-period surface waves at adominant period of about 10–12 sec, as observed during thesoutheast-off Kii Peninsula earthquake (Mw 7.4) of 5 Sep-tember 2004, located 400 km southwest of Tokyo. As theradiation of S waves from the large Mw 7.4 earthquake con-tain much longer-period ground motions, the resultantground motions in the Kanto basin should show much largerpeaks in the long-period range. During the southeast-off KiiPeninsula earthquake, most Chiba stations recorded long-period surface wave of 12 sec (Hayakawa et al., 2005; Mi-yake and Koketsu, 2005), although most aftershocks ofMw �6.6 had a resonance period similar to that of theChuetsu earthquake (about 7 sec).
Development of Surface Waves in the Kanto Plain
The uniform distribution of the K-NET and KiK-netacross all of Japan at intervals of about 20–25 km is veryuseful in understanding the regional wave field and localamplification effects within sedimentary basins (Fig. 2);however, in terms of the wavelength of the dominant periodof surface waves (less than 7 km; T � 7 sec and Vs � 1 km/sec), the strong-motion network may be too coarse to inves-tigate the detailed behavior of surface waves when interact-ing with complicated 3D basin structure shown in Figure 7b.
We therefore used data from a network of intensity me-ters operated by, for example, city government offices, firestations, and JMA. Similar to K-NET and KiK-net, the in-tensity meters consist of three-component force-balanced ac-celerometers to provide a flat-response range from DC tomore than 30 Hz, thus enabling them to be utilized for an-alyzing long-period ground motions. The integrated strong-motion network in the Kanto area (SK-net), combined withK-NET, KiK-net, and the intensity meters provides a muchdenser station spacing of about 2–10 km.
The propagation of seismic waves recorded by the SK-net is illustrated in Figure 8 as the particle motion of hori-
868 T. Furumura and T. Hayakawa
Figure 5. Three-component recorded section of ground-velocity motions of vertical(ZC), radial (RC), and transverse (TC) components associated with the Chuetsu earth-quake as recorded at 11 stations from Chuetsu to Chiba (stations are shown in Fig. 1by solid squares). The bottom panel shows a cross section of subsurface structure alongthe line of the stations (Tanaka et al., 2006) and an interpretation of surface-wavegeneration at the northeastern edge of Kanto basin.

Anomalous Propagation of Long-Period Ground Motions Recorded in Tokyo, 23 October 2004 869
Figure 6. Velocity-response spectrum of horizon-tal ground motions recorded in central Tokyo(TKY007) and Chiba (CHBH10) during the Chuetsuearthquake.
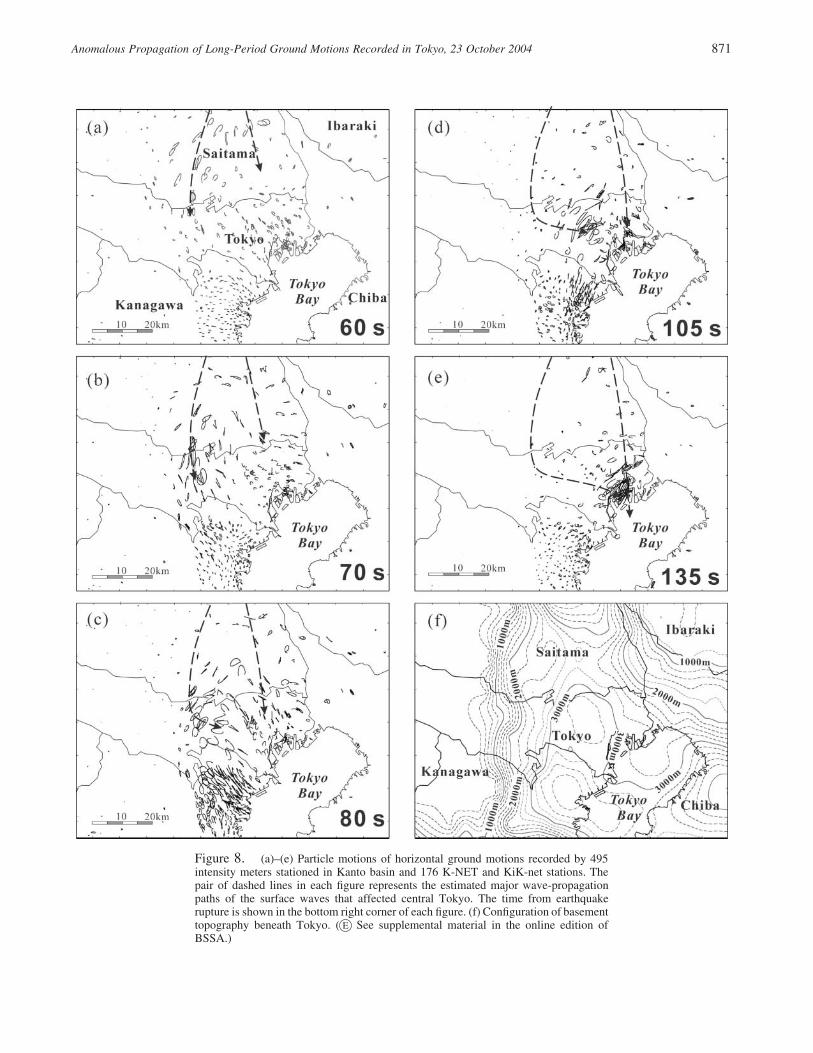
zontal velocity ground motions. A bandpass filter with a cut-off period between 3.5 and 14 sec was applied to eachseismogram trace to enhance the surface wave at 7 sec. Thetrajectory of particle motion at each time frame is illustratedin a 7-sec time window, which also enhances the polarizationand propagation characteristics of the long-period surfacewaves. The configuration of basement topography is illus-trated in Figure 8f, and is compared with the propagationand amplification characteristics of the surface waves in Fig-ure 8a–e.
The particle motions in the first frame (Fig. 8a; 60 sec)show the development of surface waves at the boundary ofthe Gunma and Saitama prefectures and propagation into thecenter of Tokyo at a wave speed of about 1 km/sec. Particlemotion is almost polarized along the wave propagation (i.e.,radial) direction, confirming that Rayleigh waves are thedominant component of the large ground motion recordedin the Kanto basin during the Chuetsu earthquake. Ampli-fication and elongation of ground motion as the surfacewaves approach central Tokyo is clearly seen in the 70-secframe.
In the middle frame (Fig. 8b; 70 sec), a family of largesurface waves is seen to be propagating along the westernmargin of the Kanto basin in the direction of Kanagawaalong a steep basin wall. The waves suddenly change direc-tion to head toward central Tokyo as they drop from thesteep slope of the bedrock interface to the deep basin bottom(Fig. 8d, 105 sec).
Thick (�3000 m) and low-wave-speed (Vs � 0.5–1.7 km/sec) sediments beneath Tokyo attract surface waves
from outer high-wave-speed (Vs � 2.4 km/sec) regions, asthe propagation speed of the 7-sec surface wave is primarilycontrolled by the superficial layer of depths of 2000–7000 m.
In the last frame (Fig. 8e; 135 sec), the two sets of sur-face waves, one propagating directly from the north and theother rerouting from the area to the west of Tokyo, convergein central Tokyo. The merging of the two surface wavesresults in intense and prolonged ground shaking in the centerof Tokyo, as observed in Figures 2 and 5. It is also apparentthat the large later signals depicted in the transverse motionof TKY007 (Fig. 5) are not Love waves but are in fact Ray-leigh waves, as the signal oscillates in a radial direction whenpassing the stations from east to west.
Such rerouting of the surface waves, first propagatingalong the western margin of the Kanto basin and then to thecenter of Tokyo, has previously been documented followingshallow earthquakes that occurred near Izu Peninsula, south-west of Tokyo (e.g., Kinoshita et al., 1992; Koketsu andKikuchi, 2000; Miura and Midorikawa, 2001; Yamada andYamanaka, 2003). The reported observations associatedwith the Chuetsu earthquake northwest of Tokyo indicatethat such an anomalous propagation of surface waves andsignificant elongation and amplification of ground motionsin central Tokyo are likely to be common characteristics ofall shallow earthquakes that occur in the area southwest ofTokyo.
Computer Simulation of the Chuetsu Earthquake
The dense seismic observations from the nationwidestrong-motion network and the network of intensity metersprovide clear visualization of the seismic wave field in theKanto area during the Chuetsu earthquake, with a interactionin 3D sedimentary structure within the Kanto basin. How-ever, seismic observations are restricted to land-based sta-tions, and no seismic instrumentation is located in TokyoBay or on mountainsides in the area. It therefore remainsdifficult to understand both the propagation properties of sur-face waves in Tokyo Bay as the waves pass through Tokyoto Chiba and the cause of prolonged shaking during groundmotions in the Tokyo Bay area.
To complement the observations described previouslyand gain further insight into the nature of surface waves inthe Tokyo Bay area, we used the Earth Simulator supercom-puter to simulate ground motions during the Chuetsu earth-quake with a high-resolution subsurface structure model ofcentral Japan (Tanaka et al., 2006) and a source-slip modelfor the earthquake (Hikima and Koketsu, 2005).
Subsurface Structural Model
The simulation model covers an area of 440 � 250 kmto a depth of 160 km, and is discretized by a small meshsize of 0.2 � 0.2 � 0.1 km for depths less than 10 km anda double-sized grid (0.4 � 0.4 � 0.2 km) for deeper areasof 10–160 km depth.

870 T. Furumura and T. Hayakawa
Figure 7. (a) Dominant period of surface waves in the Kanto region during theChuetsu earthquake, and (b) topography of basement within Kanto basin (Tanaka etal., 2006).
The 3D subsurface structural model of sedimentarystructure covering the area from Chuetsu to Tokyo was con-structed recently based on the results of several reflectionand refraction experiments, P- and S-wave speed loggingdata from a deep borehole, array measurements of microtre-mor data, and Bouguer anomaly data (Tanaka et al., 2006).
The 3D structure model of the sedimentary basin wasconstructed using three layers (Vs � 0.5, 1.0, and 1.4 km/sec) overlying a rigid bedrock of Vs � 2.9 km/sec. Thephysical parameters of each layer and basement bedrock areshown in Table 1, whereas the geometry of the dominantsedimentary structure is displayed in Figure 9.
Details of the deep structure of the crust and uppermostmantle in central Japan is based on the aki35 standard earthmodel (Kennett et al., 1995), with a spatially varying crust-mantle (Moho) boundary and midcrustal (Conrad) interfacefollowing the results of Ryoki (1999). Attenuation coeffi-cients for P and S waves (Qp and Qs) for each sedimentarylayer are based on the Qs model obtained by Yamanaka andYamada (2002), and we assumed that Qp � 2Qs.
Fault-Rupture Model
The fault-rupture model employed in the present simu-lation is derived from an inversion using KiK-net strong-motion records (Hikima and Koketsu, 2005). The faultmodel is represented by a 24 � 16 km area with fault seg-ments of 2 � 2 km. The inferred fault segment shows a
large slip of about 2 m around the area of the hypocenter at9 km depth, and the fault rupture runs bilaterally on the faultplane to the northeast and southwest at an average rupturespeed of Vr � 2.8 km/sec. To implement the source slipmodel in a fine simulation grid, the source model is resam-pled into 0.5 � 0.5 km subfaults using a linear interpolationfunction.
Although the source time function for each subfault de-rived by the inversion is represented by a set of triangularfunctions with a time width of 1 sec, the direct applicationof such a smooth source time function to each segment ofthe resampled fault plane may underestimate high-frequencysignals in excess of about 1 Hz. We therefore employed theappropriate pseudodynamic source time function of Naka-mura and Miyatake (2000), which is derived empiricallyfrom a dynamic fault-rupture simulation using the slip-weakening model.
The slip-velocity function of Nakamura and Miyatake(2000) can be constructed by following physical parametersthat control the dynamic properties of the fault rupture, suchas the static stress drop (Ds), maximum slip velocity (Vmax),rise time (Tr), and fault-rupture sustain time (Ts). The dis-tribution of Ds on the fault plane can be estimated from theslip distribution (D) of the source model derived by Hikimaand Koketsu (2005) with the use of the relationship of aconvolutional integral (e.g., see Guatteri et al., 2004), whileDs is obtained by multiplying wavenumbers and D in thewavenumber domain:
Anomalous Propagation of Long-Period Ground Motions Recorded in Tokyo, 23 October 2004 871
Figure 8. (a)–(e) Particle motions of horizontal ground motions recorded by 495intensity meters stationed in Kanto basin and 176 K-NET and KiK-net stations. Thepair of dashed lines in each figure represents the estimated major wave-propagationpaths of the surface waves that affected central Tokyo. The time from earthquakerupture is shown in the bottom right corner of each figure. (f) Configuration of basementtopography beneath Tokyo. ( E See supplemental material in the online edition ofBSSA.)

872 T. Furumura and T. Hayakawa
Table 1Physical Parameters of P- and S-Wave Velocity, Rock Density,
and Anelastic Attenuation Coefficients for Each LayerRepresented in the Simulation
Vp(km/sec)
Vs(km/sec)
q
(t/m3) Qp Qs
Sedimentary layerLayer 1 1.8 0.5 1.9 100 50Layer 2 2.5 1.0 2.1 200 100Layer 3 3.1 1.4 2.1 300 150
Basement 5.5 2.9 2.6 600 300Upper crust 5.8 3.3 2.7 700 350Lower crust 6.5 3.7 2.7 800 400Upper mantle 8.0 4.5 2.8 1000 500
D (k) � �K(k)*D(k),s
where K(k) represents the static stiffness function, whichfor crustal earthquakes can be approximated as K(k) ��0.5*l*k (Guatteri et al., 2004), and l is rigidity. Thus,the distribution of Ds within each subfault is calculated fromthe inferred slip model derived from the inversion via theFourier transform and subsequent inverse Fourier transformof Ds(k).
Following the study of Nakamura and Miyatake (2000),Vmax for each subfault can be approximated using Ds, max-imum frequency (fmax), width of the fault (w), and fault rup-ture speed (Vr) as:
V � D * (2*f *w* V )/l ,�max s max r
where we assumed fmax � 8 Hz. The slip rise time (Tr) isassumed empirically from the width of the fault and the faultrupture speed as:
T � 0.5* w/V ,r r
and the fault rupture sustain time is Ts � 1.5*Tr . The in-ferred pseudodynamic source model and examples of theslip-velocity function at each point on the fault are shownin Figure 10.
Parallel Finite-Difference Method (FDM) Simulation
Seismic-wave propagation was calculated by the par-allel finite-difference method (FDM) using a sixteenth-orderstaggered-grid scheme in horizontal directions and a fourth-order scheme in the vertical direction (Furumura and Chen,2005). The viscoelastic anelastic attenuation of frequency-independent Qp and Qs are incorporated in the FDM simu-lation using the memory variable algorithm based on Rob-ertson et al. (1994). The algorithm for the parallel computingis based on the domain-partitioning procedure where the 3Dmodel is partitioned vertically into several subregions thatare assigned to many processors, and the message-passing
interface (MPI) is used to exchange data between neighbor-ing processors.
As a minimum S-wave velocity of Vs � 0.5 km/sec isassigned to the uppermost sedimentary layer, the higher-order, staggered-grid FDM simulation can accurately repro-duce seismic-wave propagation for frequencies up to 1 Hz,with sampling of 2.5 and 5 grid points per shortest wave-length in the horizontal and vertical directions, respectively.Since the seismic source radiates higher-frequency seismicwaves to frequencies up to fmax � 8 Hz, a low-pass filterwas applied to the simulation results to remove high-frequency signals in excess of 1 Hz.
We used the Earth Simulator supercomputer for the par-allel FDM simulation; the present simulation took 3 hoursusing 80 nodes (640 processors).
Simulation Result
Though the seismic observation is restricted in land andno seismic instruments are available in the mountain regionand inside Tokyo Bay, the computer simulation enables vi-sualization of the seismic-wave field throughout the entireKanto region.
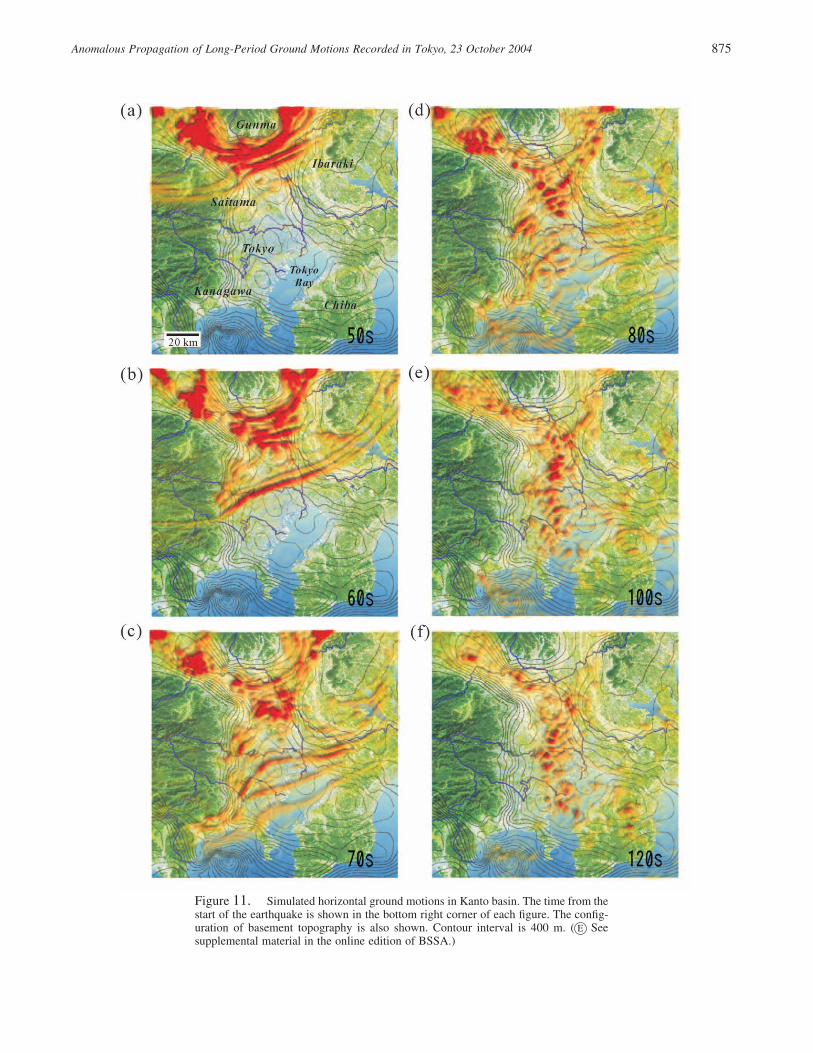
Figure 11 illustrates a series of six snapshots of hori-zontal ground-velocity motions in Kanto basin from theChuetsu earthquake. Each frame of the snapshot clearlydemonstrates the generation and complicated propagationcharacteristics of the long-period surface waves that interactin 3D basin structure of Kanto basin.
The simulation snapshot at 50 sec (Fig. 11a) shows thegeneration of surface waves at the northwestern edge ofKanto basin and significant amplification of ground motionswithin the thick cover of soft sediments. The simulation re-sults at 60 sec (Fig. 11b) show rerouting of surface wavesfrom bounding mountain side to the center of Tokyo alongthe western margin of the sedimentary basin and subsequentfocusing toward the center of Tokyo Bay (Fig. 11c,d; 70 sec,80 sec). The surface waves travel across Tokyo Bay to Chibavia the deepest part of the basement (Fig. 11e; 100 sec). Thelast snapshot (Fig. 11f; 120 sec) clearly demonstrates thestagnation of surface waves in the area around Tokyo withthick cover of deep basin sediments, like the stormy flow ofthe river.
The result of the computer simulation confirms that themortarlike shape of the sedimentary basin of Kanto basinand the thick cover of overlying sediments below Tokyo arethe main causes of the large and prolonged ground shakingin Tokyo associated with long-period surface waves pro-duced by the large earthquake. The anomalous large andlong-time shaking of ground motions in Tokyo and Chibaresult from the multiple reflections of seismic waves in thethick sedimentary basin associated by multipathing and fo-cusing of surface waves toward the bottom of the Kantobasin.
We now compare simulated waveforms of three-component ground-velocity motions with observations re-

Anomalous Propagation of Long-Period Ground Motions Recorded in Tokyo, 23 October 2004 873
Figure 9. Structural model of central Japan used in the 3D simulation of seismic-wave propagation, showing depth distribution of sedimentary layers of layer2 (Vs �1.0 km/sec)/layer3 (Vs � 1.4 km/sec) interface (a), depth distribution of basement(Vs � 2.9 km/sec) (b), crust/upper-mantle (Moho) interface (c), and 3D view of thesimulation model showing basement topography (d).

874 T. Furumura and T. Hayakawa
Figure 10. Pseudodynamic source model for the Chuetsu earthquake. (a) Source-slip model derived from the inversion described by Hikima and Koketsu (2005).(b) Estimated static stress drop. (c) Maximum slip velocity. (d) Examples of the pseudo-dynamic slip-velocity function defined at A, B, C, and D on the fault plane.
corded at stations GNM002, GNM009, SIT009, KNG001,and CHB022 within Kanto basin (Fig. 12). A low-pass filterwith a cutoff frequency of 1 Hz was applied to the simulatedand observed seismograms.
The simulation results demonstrate the major featuresof observed strong ground motions such as the dominantperiod of the surface waves and the shape of S and surfacewaves. The very large and prolonged shaking of long-periodground motions resulting from the Chuetsu earthquakeacross Kanto basin is well demonstrated in the simulation.Though the recordings of strong-motion instruments sud-denly stop when the ground acceleration level drops belowthe recording level, the simulated waveforms demonstratethe very long duration of long-period signals in Kanto basinresulting from the Chuetsu earthquake.
As the present simulation does not accommodate short-period signals of �1 sec, the simulation results underesti-mate short-period P- and S-wave signals of the earthquake,but long-period signals that develop subsequently withinKanto basin are almost comparable to the observational data.Thus, the current model of the subsurface structure of central
Japan and sedimentary basin structure of the Kanto basinand the FDM simulation technology are considered to besuitable for use in understanding the major characteristics oflong-period ground motions in Tokyo resulting from largeearthquakes.
Discussion
The dense-array observations and corresponding com-puter simulation make it clear that the long-period surfacewaves are generated at the basin interfaces and develop sig-nificantly with ongoing propagation through thick sedimentsbeneath Kanto basin. Consequently, we consider that thegeneration of long-period ground motions within Kantobasin is a common characteristic of all earthquakes that oc-cur in the Chuetsu area.
However, such long-period motions were not recordedfor aftershocks of the Chuetsu earthquake with magnitudesless than Mw 5.8 (Fig. 11). We next examine the excitationproperties of long-period surface waves in central Tokyo fordifferent earthquakes of varying magnitude.
Anomalous Propagation of Long-Period Ground Motions Recorded in Tokyo, 23 October 2004 875
Figure 11. Simulated horizontal ground motions in Kanto basin. The time from thestart of the earthquake is shown in the bottom right corner of each figure. The config-uration of basement topography is also shown. Contour interval is 400 m. ( E Seesupplemental material in the online edition of BSSA.)

876 T. Furumura and T. Hayakawa
Figure 12. Comparison of simulated waveforms (thick lines) and observed wave-forms (thin lines) of ground-velocity motions at five K-NET stations located close toTokyo, for radial- (a), transverse- (b), and vertical-component (c) ground-velocitymotions.
Figure 13 compares the velocity waveform recorded incentral Tokyo (TKY015) (see Fig. 7) and in Chiba(CHB014) for the mainshock (Mw 6.6) and three aftershocks(Mw 5.8, 5.6, 5.0) of the Chuetsu earthquake, all with a simi-lar source depth (h � 9–12 km). Because the strong-motioninstruments rely on an event trigger system, the ground mo-tions of two small aftershocks (Mw 5.6, 5.0) were not re-corded at CHB014.
Each seismogram in Figure 13 is normalized by the am-plitude of the S wave such that the relative excitationstrength of the long-period surface wave, as magnitudechange, can be compared. The velocity-response spectrumfor each seismogram is shown in Figure 13, showing a sig-nificant drop in response at 7 sec as the magnitude decreasesvery clearly. For small earthquake (Mw �5.6) record ofTKY015, the amplitude of the later surface wave is approx-imately one-half to one-fourth of the S wave, and the re-
sponse in the short-period band below 2 sec caused by thelarge S wave is more pronounced than that for the long-period surface wave in 7 sec. Larger response in the lower-period band below 1 sec for small earthquakes (Mw 5.0,h � 11 km) than large Mw 5.6 (h � 14 km) event may bedue to relatively larger excitation of short-period surfacewaves from the shallow (h � 11 km) source.
The aftershock record in CHB014 also shows no largesurface wave following a short-period S wave.
Similar observations were made during the Mw 7.4southeast-off Kii Peninsula earthquake from another centralChiba station (CHBH10) where very thick sediments(�4000 m) resulted in the development of much longer sur-face waves of about 12 sec (Hayakawa et al., 2005; Miyakeand Koketsu, 2005), but aftershocks of the southeast-off KiiPeninsula earthquake with magnitudes less than Mw 6.8 pro-duced much shorter-period (7 sec) surface waves (Hayakawa

Anomalous Propagation of Long-Period Ground Motions Recorded in Tokyo, 23 October 2004 877
Figure 13. Comparison of observed ground motions recorded at TKY015 (a) andCHB014 (b) of the transverse component velocity motion for the mainshock and theaftershocks of the Chuetsu earthquake. The right-hand figure shows the velocity-response spectra for the mainshock and three aftershock records. Each waveform traceis normalized by the amplitude of the S wave. The first resonant periods are markedby triangles.
878 T. Furumura and T. Hayakawa
Table 2Fault Parameters of Small and Large Earthquake Sources Synthesized from the Actual Source Model of the Chuetsu Earthquake
Source ModelFault SizeL*W (km) Mw
Maximum Slip(m)
Maximum Stress Drop(MPa)
Rise Time(sec)
Very small 5.6 * 4 5.4 0.42 12 0.7Small 11.5 * 8 6.0 0.85 12 1.4Large 46 * 32 7.2 3.44 12 5.52004 Chuetsu earthquake 23 * 16 6.6 1.72 12 2.8
et al., 2005), as apparent in Figure 6 for the Mw 6.6 Chuetsuearthquake.
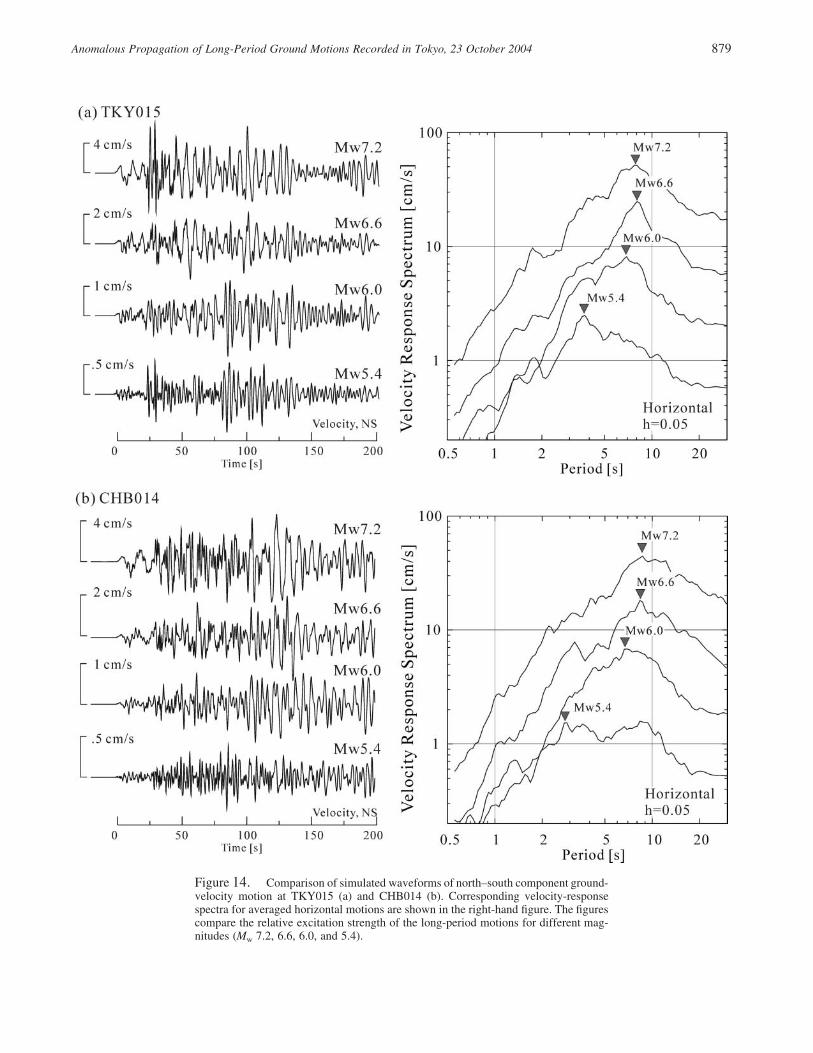
To demonstrate the relative excitation strength of thelong-period surface waves and changes in the dominant pe-riod of surface waves with varying magnitude, we conducteda set of computer simulations using enlarged (Mw 7.2) andshortened (Mw 6.0, 5.4) source models by stretching andshortening the fault size of the model of the Chuetsu earth-quake, respectively. We kept the existing pattern of slip dis-tribution, source depth, and static stress drop, but the dippingangle of the Mw 7.2 source is declined from 53 to 23 degreesto place the fault plane of the larger source below the surface.The source parameters for the large and small earthquakesare listed in Table 2.
Figure 14 shows a comparison of waveforms for centralTokyo (TKY015) and Chiba (CHB014) derived from sim-ulations using a very small (Mw 5.4), small (Mw 6.0), andlarge (Mw 7.2) earthquake source, compared with the cor-responding simulation for the Mw 6.6 Chuetsu earthquake.Excitation of the long-period surface wave is much greaterfor the large (Mw 7.2) earthquake, and the velocity responseat 8 sec is almost twice as large as that for the Mw 6.6 event.For the small earthquake (Mw 6.0), the drop in velocity re-sponse within the longer-period band over 7 sec is striking;large resonances occur in short-period band below 6 sec.
For the Chiba (CHB014) station located above muchthickness of sediments (�4000 m), the shift in the peak res-onant period from 6 to more than 10 sec with increasingmagnitude is more pronounced, and we observe a greaterresponse in the longer-period band of 8–12 sec during thelarge (Mw 7.2) earthquake, as observed for the 2004 south-east-off Kii Peninsula Mw 7.4 earthquake (Hayakawa et al.,2005; Miyake and Koketsu, 2005).
The simulation results indicate that to make realisticpredictions of long-period ground motions expected for fu-ture seismic events, we need good estimates of earthquakesize (magnitude) and therefore the radiation characteristicsof the long-period S wave from the earthquake fault.
Conclusions
Large and prolonged shaking associated with long-period ground motions at periods of T � 7 sec occurred incentral Tokyo during the Chuetsu earthquake in 2004. Suchlarge and shallow, inland earthquakes of more than Mw 6.6have not occurred around Tokyo since the Western Nagano
M 6.8, h � 2 km earthquake of 1984. Thus, the observationsof the destructive long-period ground motions developed bythe Chuetsu earthquake are the first to record strong impactson modern large-scale constructions in Tokyo; these obser-vations can therefore be used to understand the potentialdisasters that might result from future large-scale earth-quakes.
Dense-array observations from the nationwide strong-motion network (K-NET, KiK-net) combined with a net-work of intensity meters in the Kanto area clearly demon-strate the development of long-period ground motions viainteraction with the complex structure of Kanto basin. Acorresponding computer simulation using a detailed 3Dmodel of basin structure and a source-slip model for theChuetsu earthquake clearly demonstrates the rerouting andfocusing of surface waves from bounding mountains towardcentral Tokyo and the subsequent stagnation of seismic en-ergy in thick sedimentary basin cutting through centralTokyo from northwest to Tokyo Bay; this stagnation is themain cause of the prolonged and large ground shaking re-corded in central Tokyo.
In this article we studied anomalous propagation andamplification characteristics of the long-period ground mo-tions in thick sediments of Kanto basin during the Chuetsuearthquake, but the generation of the long-period groundmotions within Kanto basin should be a common character-istic of all large, shallow earthquakes that occur in southwestof Tokyo.
For the computer simulation of the 2004 Chuetsu earth-quake, we were able to achieve a good match with obser-vational data for most of the dominant features of the long-period surface waves that developed in the Kanto basin.Thus, we believe that the simulation model can be appliedto the understanding of the strong ground motions expectedfor future earthquake scenarios that might occur near Tokyo.
Acknowledgments
We acknowledge the National Council for Disaster, Cabinet Office,Japan, for providing the subsurface structural model, and the Earth Simu-lator Center for their support with computer resources. CPU time on theEarth Simulator was supported by the project Multi-Scale and Multi-Physics Integrated Simulation study (CREST) of the Japan Science andTechnology Agency. K-NET and KiK-net data were provided by the Na-tional Institute for Earth Science and Disaster Research, Japan. SK-net datawere provided by the Earthquake Research Institute, University of Tokyo.This study was also supported by the Special Project for Earthquake Di-
Anomalous Propagation of Long-Period Ground Motions Recorded in Tokyo, 23 October 2004 879
Figure 14. Comparison of simulated waveforms of north–south component ground-velocity motion at TKY015 (a) and CHB014 (b). Corresponding velocity-responsespectra for averaged horizontal motions are shown in the right-hand figure. The figurescompare the relative excitation strength of the long-period motions for different mag-nitudes (Mw 7.2, 6.6, 6.0, and 5.4).

880 T. Furumura and T. Hayakawa
saster Mitigation in Urban Areas from the Ministry of Education, Culture,Sports, and Science, Japan. We thank two anonymous reviewers for care-fully reading the manuscript. Constructive comments from the reviewerswere very valuable for revising manuscript.
E Supplementary material comprising MPEG movies for both ob-served wave propagation and numerical simulation (Figs. 2, 8, and 11) areavailable in the online edition of BSSA.
References
Anderson, J. G., P. Bodin, J. N. Brune, J. Prince, S. K. Singh, R. Quaas,and M. Onate (1986). Strong ground motion from the Michoacan,Mexico earthquake, Science 233, 1043–1049.
Architectural Institute of Japan (2000). Damping in Buildings, ArchitecturalInstitute of Japan, Tsukuba, 278 pp. (in Japanese).
Furumura, T., and L. Chen (2004). Large scale parallel simulation andvisualization of 3D seismic wavefield using the Earth Simulator, Com-put. Model. Eng. Sci. 6, 143–168.
Furumura, T., and L. Chen (2005). Parallel simulation of strong groundmotions during recent and histrical damaging earthquakes in Tokyo,Japan, Parallel Comput. 31, 149–165.
Furumura, T., B.L.N. Kennett, and K. Koketsu (2003). Visualization of 3Dwave propagation from the 2000 Tottori-ken Seibu, Japan, earth-quake: observation and numerical simulation, Bull. Seism. Soc. Am.93, 870–881.
Guatteri, M., M. Mai, P. Martin, and G. C. Beroza (2004). A pseudo-dynamic approximation to dynamic rupture models for strong groundmotion prediction, Bull. Seism. Soc. Am. 94, 2051–2063.
Hatayama, K., S. Zama, H. Nishi, M. Yamada, and Y. Hirokawa (2004).Long-period strong ground motion and damage to oil storage tanksdur to the 2003 Tokachi-oki earthquake, Zisin 57, 83–103 (in Japa-nese).
Hayakawa, T., T. Furumura, and Y. Yamanaka (2005). Simulation of strongground motions caused by the 2004 off the Kii Peninsula earthquakes,Earth Planets Space 57, 191–196.
Hikima, K., and K. Koketsu (2005). Rupture processes of the 2004 Chuetsu(mid-Niigata prefecture) earthquake, Japan: a series of events in acomplex fault system, Geophys. Res. Lett. 32, L18303, doi 10.1029/2005GL023588.
Kennett, B.L.N., E. R. Engdahl, and R. Buland (1995). Constraints on thevelocity structure in the Earth from travel times, Geophys. J. Int. 122,108–124.
Kinoshita, S., H. Fujiwara, T. Mikoshiba, and T. Hoshino (1992). Secon-dary Love waves observed by a strong-motion array in the Tokyolowlands, Japan, J. Phys. Earth 40, 99–116.
Koketsu, K., and M. Kikuchi (2000). Propagation of seismic ground motionin the Kanto basin, Japan, Science 288, no. 19, 1237–1239.
Koketsu, K., K. Hatayama, T. Furumura, Y. Ikegami, and S. Akiyama(2005). Damaging long-period ground motions from the 2003 Mw8.3 Tokachi-oki, Japan, earthquake, Seism. Res. Lett. 76, no. 1,67–73.
Kudo, K., and M. Sakaue (1989). Oil-sloshing in the huge tanks at Niigata
due to the Nihonkai-Chubu earthquake of 1983, Bull. Earthquake Res.Inst. Univ. Tokyo 59, 361–382 (in Japanese).
Liu, H. L., and D. Helmberger (1985). The 23:19 aftershocks of the 15 Oc-tober 1979 Imperial Valley earthquake: More evidence for an asper-ity, Bull. Seism. Soc. Am. 75, 689–708.
Miura, H., and S. Midorikawa (2001). Effects of 3-D deep undergroundstructure on characteristics of rather long-period ground motion: ex-amination in and around Yokohama City, Zisin 54, 381–395 (in Jap-anese).
Miyake, H., and K. Koketsu (2005). Long-period ground motions from alarge offshore earthquake: the case of the 2004 off the Kii peninsulaearthquake, Japan, Earth Planets Space 57, no. 3, 203–207.
Nakamura, H., and T. Miyatake (2000). An approximate expression of slipvelocity time function for simulation of near-field strong ground mo-tion, Zisin 53, 1–9 (in Japanese).
Nakamura, R., K. Satake, S. Toda, T. Uetake, and S. Kamiya (2003). 3-DQ structure in the Kanto distinct, in Program and Abstracts of theSeismological Society of Japan, 2003 Fall Meeting, 151 (in Japanese).
Robertson, O. A., J. O. Vlanch, and W. W. Symes (1994). Viscoelasticfinite-difference modeling, Geophysics 59, 1444–1456.
Ryoki, K. (1999). Three-dimensional depth structure of the crust and upper-most mantle beneath Southwestern Japan and its regional gravityanomalies, Zisin 52, 51–63 (in Japanese).
Sekine, S., M. Matsubara, K. Obara, and K. Kasahara (2005). Fine Q struc-ture of the Kanto region derived with NIED Hi-net amplitude data,in Program and Abstracts of the Seismological Society of Japan, 2005Fall Meeting, B009 (in Japanese).
Shi, H., and S. Midorikawa (1999a). New attenuation relationship for peakground acceleration and velocity considering effects of fault type andsite condition, J. Struct. Constr. Eng. AIJ 523, 63–70 (in Japanese).
Shi, H., and S. Midorikawa (1999b). Attenuation relationships of peakground acceleration and velocity considering effects of fault type andsite condition, in Proc. 12th World Conference on Earthquake En-gineering, 532.
Tanaka, Y., H. Miyake, K. Koketsu, T. Furumura, T. Hayakawa, T. Baba,H. Suzuki, and T. Masuda (2006). The DaiDaiToku integrated modelof the velocity structure beneath the Tokyo metropolitan area (2) (ab-stract), Japan Geoscience Union Meet. 2006, S116–P014 (in Japa-nese).
Yamada, N., and H. Yamanaka (2003). Comparison of performance of 3Dsubsurface strucutal model in southwestern part of the Kanto plainfor strong motion simulations, Zisin 53, 313–324 (in Japanese).
Yamanaka, H., and N. Yamada (2002). Estimation of 3D S-wave velocitymodel of deep sedimentary layers in Kanto plain, Japan, using mi-crotremor array measurements, Butsuri-tansa 55, 53–65 (in Japanese).
Earthquake Research InstituteUniversity of Tokyo1-1-1 Yayoi, Bunkyo-ku, 113-0032, [email protected]@eri.u-tokyo.ac.jp
Manuscript received 4 August 2006.