anovelclassificationandidentificationschemeofemitter...
TRANSCRIPT
Research ArticleA Novel Classification and Identification Scheme of EmitterSignals Based on Wardrsquos Clustering and Probabilistic NeuralNetworks with Correlation Analysis
Xiaofeng Liao1 Bo Li 12 and Bo Yang1
1College of Electronic and Information Engineering Southwest University 400715 Chongqing China2Department of Mathematics Army Logisticals University of PLA 401331 Chongqing China
Correspondence should be addressed to Bo Li 56050009qqcom
Received 9 June 2018 Revised 22 August 2018 Accepted 13 September 2018 Published 5 November 2018
Academic Editor Reinoud Maex
Copyright copy 2018 Xiaofeng Liao et alis is an open access article distributed under the Creative Commons Attribution Licensewhich permits unrestricted use distribution and reproduction in any medium provided the original work is properly cited
e rapid development of modern communication technology makes the identification of emitter signals more complicatedBased on Wardrsquos clustering and probabilistic neural networks method with correlation analysis an ensemble identificationalgorithm for mixed emitter signals is proposed in this paper e algorithm mainly consists of two parts one is the classificationof signals and the other is the identification of signals First self-adaptive filtering and Fourier transform are used to obtain thefrequency spectrum of the signals en the Ward clustering method and some clustering validity indexes are used to determinethe range of the optimal number of clusters In order to narrow this scope and find the optimal number of classificationsa sufficient number of samples are selected in the vicinity of each class center to train probabilistic neural networks whichcorrespond to different number of classifications en the classifier of the optimal probabilistic neural network is obtained bycalculating the maximum value of classification validity index Finally the identification accuracy of the classifier is improvedeffectively by using the method of Bivariable correlation analysis Simulation results also illustrate that the proposed algorithmscan accurately identify the pulse emitter signals
1 Introduction
Under the conditions of the rapid development of moderninformation technology various types of communicationequipment such as radar and radio navigation equipmentradio and television equipment and electronic computerand peripheral equipment have been used by military andlarge technology companies Its applications have beenextended from the ground air and sea to outer space Inorder to obtain important information promptly accuratelyand effectively the signal characteristics derived from thesame types of communication sources need to be extractedand analyzed e realization of identification from generalcommunication signals to individual signals has a signifi-cance to win the initiative erefore many researchers havedevoted to the study of the identification of emitter signalseir purpose is to further improve the accuracy of signalclassification and identification
e earliest research on the identification of emittersignals began in the 1970s and it was one of the key tech-nologies in Electronic Warfare systems At present theidentification of emitter is mainly based on two modelingtechniques syntactic pattern-based methods and parametricpattern-based methods In [1] Visnevski author had pro-posed a syntactic model to identify multifunction radar(MFR) signals In the process of modeling the MFRs wereconsidered as stochastic discrete event systems that com-municated information by use of radar word level modelingradar phrase level modeling and radar sentence level mod-eling e radar word was a fixed arrangement of finitenumber of pulses the radar phrase was a series of limitednumber of radar words and the radar sentence was a com-bination of limited number of radar phrases His simulationexperiments had shown that the designed principle was ef-fective for identifying MFRs Based on the syntactic model ofMFRs Alex Wang and Vikram Krishnamurthy had used the
HindawiComputational Intelligence and NeuroscienceVolume 2018 Article ID 1458962 15 pageshttpsdoiorg10115520181458962
stochastic context-free grammar to describe the behaviors ofthe MFR system and some good results were obtained Al-though the stochastic context-free grammar was a model forcapturing the essential features of the MFR dynamics [2] ithad some defects in estimating the parameters of stochasticcontext-free grammar erefore the expectation maximi-zation algorithm had been proposed by LP Dai et al to es-timate these parameters which can be used to further estimatethe characteristic parameters of MFR [3] From this point ofview the ultimate goal of the modeling technique based onsyntax was to find the feature parameters of emitters Ithighlighted the importance of identification technology basedon the parametric pattern e feature parameter matchingtechnique was a basic method of this pattern e maincharacteristic of this method was to identify the emittersignals by matching the measured signal characteristic pa-rameter vector with the corresponding characteristic pa-rameters in the known database (the libraries of radar types)is method depended on the feature parameter databaseand it can only be applied to emitter identification problemwith invariant characteristic parameters Moreover the li-braries of types had also an inherent uncertainty resultinginevitably from data collection methods erefore JanMatuszewski et al had proposed the knowledge-basedtechniques to identify emitters [4 5] ey think that theinformation of known radar platforms (knowledge) in-cluding position intent and recent operational history playsan important role in the identification of emitters eirapproaches had been successfully used to identify somespecific emitters In order to fully utilize this knowledge toidentify emitters Janusz Dudczyk had proposed an idea ofconstructing Emitter DataBase based on the entity-relationship modeling e entity-relationship diagram wasintroduced to realize this idea which had pointed out a newdirection for the construction of a complete and accurateElectronic Intelligence systems [6] Meanwhile artificial in-telligence techniques and some optimized feature selectionmethods were used to improve the identification accuracy ofemitter signals In [7] the authors had proposed a vectorneural network with a supervised learning algorithm whichworked for signal classification and emitter identificationis network took carrier frequency pulse width and pulserepetition interval as inputs to complete the identification In[8] the authors had proposed an identification method ofradar signals based on immune radial-basis function neuralnetwork which can improve the convergence speed andperformance of the algorithm In [9] a multichannel rec-ognition system with an independent distance which wasdefined on impartiality condition had been proposed toidentify the specific emitters By modifying the distance ineach special recognition channel radio frequency pulsewidth and pulse repetition interval of radar signals can beextracted and classified into an appropriate class Beyond thatsomemethods had been proposed to reduce the identificationerror rate In [10] wavelet features were used as inputs ofneural networks to identify emitters In [11ndash13] the supportvector machine was introduced to identify emitter signals In[14 15] the fuzzy c-means and probabilistic neural networks(PNN) were used to identify emitter signals However the
determination of the optimal number of clusters was a majorchallenge for these methods and they cannot effectivelyimprove the identification accuracy erefore Jawad et aldesigned a clustering validity function in the hidden-layeroutput space of PNN to find the optimal number of clusterseir methods were successfully applied to the classificationof land use [16] But the method of determining the range ofclustering number was subjective which may reduce theidentification accuracy of the algorithm To overcome thisdeficiency and further improve accuracy a classification andidentification scheme of emitter signals based on the Wardclusteringmethod (WCM) and PNNwith correlation analysiswas proposed in this paper Its advantages are presented inthree aspects
(1) e self-adaptive filtering Wardrsquos clustering andclustering validity indexes are skillfully used to de-termine the scope of the optimal number of clusters
(2) e classification validity index D is flexibly used tofind the optimal PNN classifier
(3) e probabilistic neural networks with Bivariablecorrelation analysis approach are proposed to im-prove the identification accuracy of emitter signals
e rest of this paper is organized as follows In Section2 the classification and identification schemes includingadaptive filtering frequency spectrum evaluation indexesWCM and PNN classifier are introduced e flowchart andthe pseudocodes of the classification algorithms are designedin Section 3 e flowchart and the pseudocodes of theidentification algorithm are given in Section 4 e identi-fication experiments are also carried out in this section ecomparison discussions of different schemes are proposed inSection 5 Some innovations and applicable conditions of theproposed method are summarized in Section 6
2 Classification Model of Emitter Signals
21 Self-Adaptive Filtering In the field of engineeringtechnology the signal x(n) received at time n usuallycontains two parts One is the useful signal s(n) which iswhat we need and it enables us to understand the propertiesof the object to be studied e other is the interferencesignal x1(n) which is what we do not need and it preventsus from understanding the properties of the object to bestudiede actual signal will be obtained once the two partsare combined together at is x(n) s(n) + x1(n)
Weakening the interference signal x1(n) and main-taining or enhancing the useful signal s(n) are an importantpurpose of signal processing e usual method is to usea frequency function H(f) to multiply the frequencyspectrum X(f) of the signal x(n) is process is calledfiltering Its essence is to weaken the interference signal andhighlight the useful signal Currently the most widely usedfilters include Kalman filtering Wiener filtering medianfiltering sequential statistical filtering wavelet transformself-adaptive filtering etc In terms of adaptability and fil-tering performance one of the best filtering methods is theself-adaptive filtering which is developed on the basis of
2 Computational Intelligence and Neuroscience
Kalman filtering Wiener filtering and linear filtering emost important feature of the self-adaptive filtering is that itcan track the time-varying characteristics of input signalsand eliminate the unknown interference contained in thesignals Self-adaptive filtering based on the least mean squarealgorithm is proposed by Widrow and Hoff and it has beenwidely used in many fields because of its simplicity ro-bustness and easy implementatione principle diagram ofself-adaptive filtering technology is shown in Figure 1
Figure 1 presents the schematic diagram of noiseelimination for self-adaptive filter e actual signal x(n)
contains interference signal x1(n) generated from signalchannel 1 In order to eliminate it the noise signal x0(n)
which is independent of s(n) but related to x1(n) must besampled from noise source through the signal channel 2emain function of the self-adaptive filter is to process x0(n) sothat the output y(n) approximates to x1(n) Under thecondition of convergence of filtering algorithm the outpute(n) of the system approximates to s(n) when y(n) ap-proaches x1(n) e iterative formulas of self-adaptive fil-tering algorithm based on the least mean square are definedas follows [17]
e(n) d(n)minusωT(n)X(n)
ω(n + 1) ω(n) + 2μe(n)X(n)(1)
where d(n) is the desired signal X(n) [x(n)
x(nminus 1) middot middot middot x(nminusM + 1)]T is the input signal vector attime n M is the length of filter and μ is the fixed step sizeand satisfies 0lt μlt 1MPin where Pin is the input power offilter ω(n) [w0(n) w1(n) middot middot middot wMminus1(n)]T is the weightvector ofM order adaptive filter at time nω(n) 0 at initialtime y(n) ωT(n)X(n) represents the actual output signalof filter In noise elimination applications x(n) is usuallyused as the desired signal d(n) and x0(n) is used as the inputsignal of the filter to eliminate x1(n) After many iterationsthe difference between d(n) and y(n) is the estimate ofsignal s(n) is algorithm has the advantages of smallamount of computation easy implementation and stableperformance but its convergence speed is relatively slowerefore the authors proposed a variable step adaptivefiltering algorithm based on bell-shaped function [18] evariable step size is given as follows
μ(n) μmax 1minus eminusa|e(n)|b
1113874 1113875 (2)
where μmax isin (0 1MPin) is the maximum step size that canmaintain the convergence of the adaptive filtering algorithmExperiments show that this algorithm can effectively im-prove the convergence speed and reduce the steady-stateerror when a 008 and b 4 In subsection 3 the methodis used to eliminate the interference signal of emitters
22e Spectrum of Signals In order to classify and identifysignals it is necessary to analyze the frequency spectrum andenergy spectrum of the signals From the electrical knowl-edge P V2R where V represents voltage and R representsresistance If the resistance R 1 and V is replaced by signalx(t) the instantaneous energy is x2(t) us the total
energy of the signals can be expressed as 1113938+infinminusinfin x2(t) dt
According to Parsevalrsquos theorem it can be obtained by thefollowing equation
1113946+infin
minusinfin|x(t)|
2dt 1113946
+infin
minusinfin|X(f)|
2df (3)
where
X(f) 1113946+infin
minusinfinx(t)eminus2πift
dt (4)
is the Fourier transform for signal x(t) and f represents thefrequency of signal x(t) |X(f)| is called the amplitudespectrum and argX(f) is called the phase spectrum of x(t)e frequency spectrum of x(t) consists of amplitudespectrum and phase spectrum |X(f)|2 is called energyspectrum density Equation (3) indicates that the energy ofx(t) is closely related to |X(f)|2 and it can be obtained bycalculating its integral on (minusinfin +infin) erefore we canobtain the frequency distribution and energy distributionof each signal by analyzing the spectrum of the signalenthe key amplitude and the frequency of energy distributioncan be further obtained which provide conditions fordirectly observing the similarities and differences of pairedsignals
23 e Ward Clustering Method As a hierarchical ag-glomerate cluster algorithm the WCM has a wide range ofapplications [19ndash21] First it is started by accepting eachnode as a separate cluster en the clusters with minimumdistance between themselves are combined in pairs at eachstage of the algorithm is smallest distance is called theWard distance and defined as follows
drs nr middot ns
nr + ns
xr minusxs
2 (5)
where r and s represent the two distinct clusters nr and ns
represent the number of data points of two clusters re-spectively xr and xs represent the center of the corre-sponding cluster and || middot || is Euclidean norm e centersand cardinal numbers of the new cluster are updatedaccording to the following equations
xrprime
nr middot xr + ns middot xs
nr + ns
(6)
nrprime nr + ns (7)
Wardrsquos clustering algorithm has the following steps
Step 1 Each sample point is treated as a cluster At thistime the sum of squares of deviations for each cluster isequal to 0Step 2 Two arbitrary clusters are merged and the sumof squares of deviations is calculated from Equations(5)ndash(7) If we assume that there are N clusters in total itmust be calculated N(Nminus 1)2 timesStep 3 e two clusters with the smallest squared sumof deviations are combined into one class e methodeventually aggregates all sample points into one classwhen the number of clusters is unknown
Computational Intelligence and Neuroscience 3
If the number of clusters is known the WCM can bedirectly used to classify the signal data after removing thenoise Otherwise it can be obtained by analyzing the den-drogram of clustering is is a rather subjective approachwhich is dicult to help us nding the true number ofclusters for a given data set In recent research the clusteringvalidity indexes such as Calinski-Harabasz (CH) index Gapindex Silhouette (Silh) index and DaviesndashBouldin (DB)index have been demonstrated to be the best validation toolsfor determining the optimal number of clusters [22ndash27]
231 Calinski-Harabasz Index For a given setY y1 y2 middot middot middot yN assume that the dimension of eachentity yi is v i 1 2 middot middot middot N K nonempty disjoint clustersets S S1 S2 middot middot middot SK around the centroid setC c1 c2 middot middot middot cK can be obtained by minimizing thewithin-cluster distance WK
WK sumK
k1sumyiisinSk
d yi ck( ) (8)
where d(yi ck) k 1 2 middot middot middot K represents the squared Eu-clidean distance between the entity yi and the centroid ckthat is
d yi ck( ) sumjisinv
yij minus ckj( )2 (9)
en the CH index is dened as follows [24]
CH(K) T1 minusWK( )(Kminus 1)WK(NminusK)
(10)
where WK is dened as in (8) and T1 can be calculated byT1 sum
Ni1sumjisinv(yij minusyj)
2e CH index can reect the compactness of the cluster
by means of the overall within-cluster variance e sepa-ration degree of the clusters can be reected by the overallbetween-cluster variance erefore a good clusteringscheme corresponds to a higher value of CH index
232 Silhouette Index For each entity yi its silhouette valuemeasures the similarity between the entity yi and the pointsin its own cluster when compared to the points in otherclustersis similarity is reected bymeasuring the distancebetween the entity yi and the points derived from dierentclusters e silhouette value of the entity yi is dened asfollows [24]
s yi( ) b yi( )minus a yi( )
max a yi( ) b yi( ) (11)
where a(yi) is the average distance from the entity yi isin Sk toall other points yj isin Sk b(yi) is the minimum distance fromthe entity yi to all other points yj which satisesyj isin Sl yi notin Sl lne k erefore minus1le s(yi)le 1 If s(yi) isclose to zero the entity yi could be assigned to anothercluster A negative value of s(yi) indicates that the corre-sponding assignment seriously damages cluster cohesionand the clustering result of yi is not advisable yi is wellmatched to its own cluster when s(yi) is close to 1 Finallythe validity of the whole clustering can be quantied by Silhindex and it is dened as follows
Silh(K) sumN
i1
s yi( )N
(12)
e Silh index can be used with any distance metricincluding the Manhattan distances and Euclidean distances
233 DaviesndashBouldin Index A good partition should havea larger intercluster separation degree and stronger within-cluster homogeneity and compactness e DB index isproposed based on this idea [26] More concretely it isconstructed by a ratio of within-cluster and between-clusterdistances e DB index is dened as follows
DB(K) sumK
k1maxknej
dk + dj( )dkj
K (13)
where
dk 1Sk∣∣∣∣∣∣∣∣sumSk| |
i1yi minus ck∣∣∣∣
∣∣∣∣q 1q
(14)
represents the average distance between each point yi incluster k and the centroid of clusterk |Sk| is the number ofpoints in cluster k If q 1 dk is the average Euclideandistance between the points in cluster k to the centroid ofcluster k If q 2 dk is the standard deviation of the distanceof points in cluster k to the center of cluster k When k in dkis replaced by j dj can be obtained In addition dkj can becalculated according to the following equation
dkj sumv
h1ckh minus cjh∣∣∣∣∣
∣∣∣∣∣p
1p
(15)
The actual signal x (n) = s (n) + x1 (n)
Self-adaptivefilter
Noise signalsampling x0 (n)
Output signaly (n)
Errorse (n)
Control filter coefficients
sumndash
Signal source
Noise source
+1
2
Figure 1 Flowchart of the self-adaptive ltering technology
4 Computational Intelligence and Neuroscience
It represents the distances between the centroids of thekth and the jth clusters ckh is the hth component of thecentroid of cluster k and dkj is the Minkowski metric of thecentroids which characterizes clusters k and j Specificallyp 1 dkj is the Manhattan distance between centroidsp 2 dkj is the Euclidean distance between centroids
e DB index can reflect the degree of within-clusterdispersion and between-cluster separation So the truenumber of clusters may be determined according to theminimum value of the DB index
234 Gap Index Robert Tibshirani et al proposed the gapstatistic method for estimating the number of clusters in a setof data [27] A graph of the within-cluster dispersion versusthe number of clusters k for a clustering procedure showsthat the within-cluster dispersion decreases monotonicallyas k increases but from some k onwards the decrease be-comes flatter obviously Such position is called lsquoelbowrsquo itoften implies the appropriate number of clusters e gapcriterion gives an approach to estimate the number ofclusters by locating this lsquoelbowrsquo erefore under this cri-terion the optimal number of clusters occurs at the largestgap value e Gap index is defined as follows
GapN(K) EN log UK( 11138571113864 1113865minus log UK( 1113857 (16)
where N represents the number of points K represents thenumber of clusters that are evaluated UK defined in (17)represents the within-cluster dispersion degree
UK 1113944K
k1
12Nk
Hk (17)
where Nk is the number of points in cluster k Hk is the sumof the distances of any two points in the kth cluster eexpected value EN log(UK)1113864 1113865 is determined by Monte Carlosampling from a reference distribution e Gap index canalso be used for any distance metric
e WCM belongs to unsupervised categorizationtechnique which can help us find the centroid of eachcluster However the classification accuracy of this methodis limited which makes the method not able to be useddirectly for signal recognition Comparatively PNN caneffectively improve the accuracy of classification and iden-tification [28 29]
24 Probabilistic Neural Network Classifier As a method ofnonparametric Parzen windows estimation PNN is firstproposed by Specht It is a nonlinear classification techniqueand essentially a parallel algorithm based on Bayesianminimum risk criterion [30] Given a sample to be identifiedx its posterior probability P(Sk|x) can be obtained by PNNclassifier However if the probability densities of the classesto be separated are unknown the training samples withknown identity need to be used to estimate them Finally thetrained PNN is used to determine the identity of x A typicalPNN classifier consists of an input layer a pattern layer(hidden layer) a summation layer and a output layer eflowchart of the PNN is shown in Figure 2
e input layer neurons are used to receive values fromtraining samples and send data to the neurons in the patternlayer which is fully connected to the input layer enumber of neurons in the input layer is equal to the length ofthe input vector e number of neurons in the pattern layeris the same as the number of training samples Here allneurons are collected into different groups and the ithneuron in group k corresponds to a Gaussian functionf
(k)i (x σ) i 1 2 middot middot middot mk where mk represents the number
of neurons in group k k 1 2 middot middot middot K Gaussian functionwhich is also called probability density function is defined asfollows
f(k)i (x σ)
1(2π)v2σv
exp minus1113944v
j1
x(k)ij minus xj1113872 1113873
2
2σ2⎡⎢⎢⎢⎢⎣ ⎤⎥⎥⎥⎥⎦ (18)
where v is the dimension of the input vectorx (x1 x2 middot middot middot xv) xj is the jth component of the inputvector x x
(k)ij is the jth component of the ith neuron in class
k e so-called smoothing parameter σ isin (0 1) determinedexperimentally by comparing their corresponding classifi-cation accuracy plays an important role in estimation errorof the PNN classifier e outputs of pattern layer areconnected to the summation units depending on the class ofpatterns ere is one neuron for each group and eachneuron in summation layer sums the outputs derived fromthe pattern layer neurons as follows
pk(x) 1
(2π)v2σvmk
1113944
mk
i1exp minus1113944
v
j1
x(k)ij minus xj1113872 1113873
2
2σ2⎡⎢⎢⎢⎢⎣ ⎤⎥⎥⎥⎥⎦ (19)
Finally the output layer neuron output a number 1 andmultiple numbers 0 e value of 1 corresponds to theclassifierrsquos decision result for input vectors More specifi-cally the input vector x belongs to class k if pk(x)gtpkprime(x)
for all kprime 1 2 middot middot middot K and kne kprimeHence the main purpose of training PNN is to find the
optimal estimate of probability density function according tothe training samples and their labels to ensure that theclassifier works at the condition of minimum error rate andrisk When the samples to be identified are sent to thepattern layer the output of each neuron is calculatedaccording to the trained density function Finally theidentified results are obtained through computations in thesummation layer and output layer Due to the followingadvantages it is a wise choice to use PNN as a furtherclassifier to classify signals [31]
(1) It has a simple structure and it is easy to train In thePNN based on probability density function esti-mation the weight of the neuron in pattern is di-rectly taken from the input sample value
(2) e training process of the network is simple andthere is no need to retrain for a long time whenadding or reducing the number of groups
(3) It is not easy to produce local optimal solution andits precision is higher than that of other classificationapproaches No matter how complex the classifica-tion problem is as long as there are enough training
Computational Intelligence and Neuroscience 5
samples the optimal solution under the Bayes cri-terion can be obtained
3 Classification Scheme and Experiments ofEmitter Signals
31 Flowchart and Algorithms of Classi cation Schemee owchart of the proposed classication algorithms isshown in Figure 3
Figure 3 indicates that the proposed scheme iscomposed of four modules that is data processingmodule preclassication module evaluation moduleand accurate classication module In the evaluationmodule the clustering validity indexes are used todetermine the range of K if it is unknown For eachK isin [KMin KMax] the classication validity index D iscalculated as follows [16]
D(K) KsumN1
j1max1lekleK pkj minusN1
N1(Kminus 1) (20)
where N1 is the number of input vectors pkj is the elementof the matrix Q of size K timesN1 in the output of PNNrsquospattern layer representing the membership of the jth inputvector to the cluster k When N1 1 pk1 is equal to pk(x)presented in (19) When N1 gt 1 matrix Q (pkj)KtimesN1
canbe obtained by PNN max1lekleK pkj is the largest element ofthe jth column in the matrix Q Equation (20) indicates thatD(K) is a nonlinear function related to K whenN1 nesum
N1j1max1le kleK pkj ereforeK corresponding to the
maximum value of D(K) is the optimal number of clustersKlowast
e pseudocodes are listed in Algorithm 1 if K isknown
If the classication number K is unknown WCM andclustering validity indexes are used to determine the range ofK e corresponding pseudocodes are listed in Algorithm 2
e algorithms show that the supervised learning PNN isused to classify samples erefore the training (teaching)samples must be selected rst By Ward clustering methodwe have obtained a preliminary classication of all samplesat is the identities of some samples have been determinedexcept for some boundary points which need to be furtherdetermined by the trained PNN erefore some labeledproximity points xkj(k 1 2 middot middot middot K j 1 2 middot middot middot Jk) aroundthe center ck can be selected to train PNN where Jk rep-resents the number of samples selected in class k and itshould be preset such as Jk lceila middot |Sk|rceil a isin [06 08]
32Classi cationExperiments A signal set Rs sampled fromsome pulse emitters is used to test the eectiveness of theproposed algorithms Each emitter emits continuous signalsin the pulse state After a period of time the receiver willreceive multiple signals from all emitters ese signals areconverted into digital signals by the analog-digital convertere sampling frequency is 101MHz Signal samples yi(i 1 2 middot middot middot 500) are randomly extracted from these digitalsignals e signal set Rs [y1 y2 middot middot middot y500]T and the di-mension of yi is 1024 Considering that each yi is disturbedby signals from other emitters the mean value of all signals isused as the noise signal Is [Is(1) Is(2) middot middot middot Is(1024)]where Is(n) sum500
i1yi(n)500 n 1 2 middot middot middot 1024 First theself-adaptive ltering is applied to process these signals Inthis algorithm the actual signal x(n) corresponds to yi(n)and the noise signal x0(n) corresponds to Is(n) enFourier transform is used to obtain the amplitude spectrumof all processed signals e amplitude spectrum of thethirteenth signal is shown in Figure 4
Figure 4(a) shows the sampling signal contains obviouswhite noise which makes the feature of the useful signalunclear However most of the noises are removed after usingthe self-adaptive ltering Moreover the characteristics ofthe signals are highlighted so that the amplitude spectrum of
Pattern layer
Input layer
Summation layer
Output layer Max
x1 x2 xv
x1 x2 xm1x1 x1 x2x2 xm2
xmK
Figure 2 Flowchart of the PNN
6 Computational Intelligence and Neuroscience
them can be analyzed correctly For these transformedsignals the clustering dendrogram can be obtained by usingthe WCM and it is shown in Figure 5
When the signals are divided into 3 4 5 and 6 classesthe intercluster distances are 755 575 27 and 14 re-spectively e increments of the distance between theclusters are 13 305 and 18 in turn If the number of ele-ments in each class is required relatively close the idealnumber of classications is 3 4 and 5 However thesenumbers need to be further determined by the clusteringvalidity indexes e number of clusters K corresponding todierent evaluation indexes is shown in Figure 6
Figure 6 shows that the optimal number of clusters is 3when the DB index and the Silh index are used and it is 2when the CH index is used However it becomes to 5 whenthe Gap index is used erefore the optimal number ofclassications should belong to the interval [2 5] In this casethe PNN needs to be used to obtain more accurate results
For each K in this interval seventy (a 07) samplepoints nearby each ck are selected to train PNN classiersen the optimal classier is obtained by calculating themaximum value of D(K) e results have shown thatD(5) 1 while the other values are less thanD (5)at is tosay the optimal number of classications is 5 Since the sizeof matrix Rs is 500times1024 three columns are randomlyselected as the X-axis the Y-axis and the Z-axis to plot theclassication results diagram Let
Ack
y1k(1) y1k(2) middot middot middot y1k(1024)y2k(1) y2k(2) middot middot middot y2k(1024)⋮ ⋮ ⋮
yMkk(1) yMkk
(2) middot middot middot yMkk(1024)
(21)
represents a matrix consisting of all signals in class k afterclassifying whereMk is the number of samples in class k yjk
Yes
Determining thescope of the K from the
CH Silh DB index[Kmin Kmax]
Kmin = Kmax
Training PNNfor each K
Probability matrixfor different K
Wardsclustering
Classificationnumber K
Train PNNfrom sampling
points
PNNclassification
Outputresults
No
Dmax
Optimal numberof cluster Klowast
Preclassificationmodule
Accurateclassification
module
Evaluationmodule
Spectrumanalysis
Adaptivefiltering
DataProcessing
module
Dendrogram
Classification validityindex for each K
Actualdigital signal
Figure 3 Flowchart of signal classication
Input e original signal vectors yi that need to be classiede classication number K
Output e classied label vector CyCompute si by using self-adaptive ltering for yiCompute frequency spectrum Gi of siCompute center ck of each class k by using WCMSelect training samples xkj around ck and record their labels LxkjCreate the PNN classier by using xkj and LxkjDetermine the class of the remaining samples
End Classication Algorithm 1
ALGORITHM 1 Classication Algorithm 1
Computational Intelligence and Neuroscience 7
is the jth sample in class k and j 1 2 middot middot middot Mk us Ac [Ac1 Ac2 middot middot middotAc5]T is a matrix of size 500times1024 If the dataon columns a1 a2 a3 of Ac are selected to form a matrix Acof size 500times 3 each row of Ac is a three-dimensional arraythat is a point in the coordinate system Whena 05 σ 1 scatter plots of these data are shown inFigure 7 e rst column of Ac corresponds to the X-axisthe second column of Ac corresponds to the Y-axis and thethird column corresponds to the Z-axis
e experimental results show that all signal samples aredivided into ve classes and each class contains 100 signalserefore all signals can be thought to come from veemitters and each emitter emits 100 signals Although onlythree distribution gures of all classied signals are pre-sented in Figure 7 in fact in our experiments we haveobtained more than 1000 scatter plots which are drawn byrandomly selecting three columns from matrix Ac In theseclassication results the distributions of sample sets are
Input e original signal vectors yi that need to be classiedOutput e classied label vector Cy
Compute si by using self-adaptive ltering for yiCompute frequency spectrum Gi of siCompute Wardrsquos clustering dendrogramCompute CH(K) Silh(K) DB(K) and Gap(K) Compute KminKmaxif Kmin Kmax then
Compute center ck of each class kSelect training samples xkj around ck and record their labels LxkjCreate the PNN classier by using xkj and LxkjDetermine the class of the remaining samplesOutput the classied label of yi
else for KKmin Kmaxfor k 1 K
Compute center ck of each class kSelect samples xkj around ck and record their labels LxkjCreate the PNN classier by using xkj and LxkjDetermine the class of the remaining samplesCompute matrix Q (pkj) and D(K) for each KCompute Dmax and the optimal number of classications KlowastOutput the classied label of yi
endend
End Classication Algorithm 2
ALGORITHM 2 Classication Algorithm 2
0 1 2 3 4 5 6 7 8 9 10
times105
0
1
2
3
4
5
6
7times104
Am
plitu
de
Frequency (Hz)
(a)
times105
0 1 2 3 4 5 6 7 8 9 100
2000
4000
6000
8000
10000
12000
Am
plitu
de
Frequency (Hz)
(b)
Figure 4 e double-sided amplitude spectrum of a sampling signal (a) Before ltering (b) after ltering
8 Computational Intelligence and Neuroscience
0
50
100
150
755
575
2714
Figure 5 e dendrogram of the signals after using the WCM
2 4 6 8
CH v
alue
s
200
250
300
350
400
450
500
550
K
(a)
2 4 6 8
DB
valu
es
12
13
14
15
16
17
18
19
K
(b)
2 4 6 8
Silh
val
ues
02
025
03
035
04
045
05
K
(c)
0 2 4 6 8 10
Gap
val
ues
02
04
06
08
1
12
14
K
(d)
Figure 6 e number of clusters K versus the dierent evaluation indexes (a) e number of clusters K versus CH values (b) e numberof clusters K versus DB values (c) e number of clusters K versus Silh values (d) e number of clusters K versus Gap values
ndash500
50100
020
4060
80ndash20
0
20
40
60
80
XY
Z
class1class2class3
class4class5
(a)
050
100
020
4060
80ndash20
0
20
40
60
80
XY
Z
class1class2class3
class4class5
(b)
050
100
ndash200
2040
600
20
40
60
80
XY
Z
class1class2class3
class4class5
(c)
Figure 7e scatter plots of classication results (a)e classied results when a1 245 a2 562 a3 720 (b)e classied results whena1 268 a2 369 a3 547 (c) e classied results when a1 139 a2 367 a3 741
Computational Intelligence and Neuroscience 9
similar and the separations of them are obvious ereforethe proposed methods can eectively distinguish signalsfrom dierent emitters
4 Identification Scheme and Experiments ofEmitter Signals
41 Flowchart and Algorithms of Identi cation SchemeBesides classication data identication is an importantfunction of PNN Since PNN is based on the maximumposterior probability it will give the optimal solution underthe Bayesian criterion whether or not the samples to beidentied Ixi belong to the ve determined classes that havebeen obtained in Section 3 So if a sample belongs to one ofthem it will accurately identify it However it may lose itsfunction when the sample do not belong to them At thistime the amplitude spectrum of all samples can be analyzedbefore so that they can be identied whether they belong tothe determined classes in advance Considering that it isdicult to comparatively analyze the amplitude spectrum ofthe signals to be identied and each signal in every class weadopt the curve tting method to nd the feature sequencesof each class and the signals to be identied Finally thecorrelation degree of these sequences is calculated to get thepreliminary identity information of the samples to beidentied is method is called Bivariable correlationanalysis and it is introduced as follows
Step 1 Simplifying amplitude spectrum Let Li represent thelength of the signal Ixi Fsi represent the Fourier transform ofIxi |Fsi| is the amplitude spectrum of Ixi |Fsi| [gi(1)gi(2) middot middot middotgi(Li)] e sequence Fi of length N2 is extractedfrom |Fsi| which takes ΔTi as the step size where ΔTi ordmLiN2
Oslash
For each training sample xkl in class k the corre-sponding sequence Fkl can be obtained according to the samemethod where k 1 2 middot middot middot Klowast l 1 2 middot middot middot L i 1 2 middot middot middot pand L represents the number of training samples in class kand p represents the number of samples to be identied
Step 2 Fitting curve e tting curve zi can be obtained bytting the sequence Fi and the tting curve ykl in class k canbe obtained by tting the sequence Fkl
Step 3 Constructing the feature sequence First for dierentk ykl(t) t 1 2 middot middot middot T can be calculated after giving the
upper bound T en the tth signal feature of the class k canbe obtained by the following equation
Yk(t) 1LsumL
l1ykl(t) (22)
Finally Cs(k) Yk(1) Yk(2) middot middot middot Yk(T) is the featuresequence of the class k Similarly the feature sequences Zi Zi(1) Zi(2) middot middot middot Zi(T) (i 1 2 middot middot middot p) of the samples tobe identied can be obtained
Step 4 Correlation analysis e correlation coecient be-tween theZi and theCs(k) can be calculated as the followingequation
rik T sumTt1Yk(t) middot Zi(t)( )minus sumTt1Yk(t)( ) middot sumTt1Zi(t)( )
T sumTt1Y
2k(t)( )minus sumTt1Yk(t)( )
2[ ] middot T sumTt1Z
2i (t)( )minus sumTt1Zi(t)( )
2[ ]
radic
(23)
where T(sumTt1Yk(t) middot Zi(t))minus (sumTt1Yk(t)) middot (sum
Tt1Zi(t))
represents the sample covariance of Cs(k) and Zi[T(sumTt1Y
2k(t))minus (sum
Tt1Yk(t))
2] and [T(sumTt1Z2i (t))minus
(sumTt1Zi(t))2] are the sample standard variation of Cs(k) and
Zi respectively e performance of the correlation testindicates that the sample to be identied belongs to thecorresponding class when rge 095 All samples that do notsatisfy this condition should be removed Finally theremaining samples can be eectively identied by thetrained PNN e owchart of the proposed identicationscheme is shown in Figure 8
Figure 8 shows that the owchart mainly includes twoblocks One is the preidentication module and the other isthe identication module e role of the previous module isto eliminate the sample with a small correlation to thedetermined classes When the correlations between thesamples to be identied and several dierent classes are highPNN will accurately identify it based on Bayesian criteriae pseudocodes are given in Algorithm 3 which is calledidentication algorithm
rough the methods proposed in Section 3 all signalsamples have been classied to ve classes at is to say theidentity of each sample has been determined us theidentication algorithm consists of two parts On the onehand some proximity points xkl around the center ck of classk are selected to train PNN k 1 2 middot middot middot Klowast l 1 2 middot middot middot Lxkl is the input vector of the network and its label is
Samples to beidentified Ixi
(i = 1 2 hellip p)
Amplitude spectrum
Fitting curves
Training samplexkl of Class k
(k = 1 2 hellip Klowast)
Amplitude spectrum
Fitting curves
Correlation testing
Passed PNN
No Dont belongto class k
Pre-identification module
Identification module
Feature sequence
Feature sequenceof the class k
Outputresults
Figure 8 Flowchart of signal identication
10 Computational Intelligence and Neuroscience
the output of the system On the other hand the trainedPNN classier is used to determine the identity of Ixii 1 2 middot middot middot p
If the dimension of Ixi is greater than xkl the method ofadding time window can be used to adjust their di-mensions Let Dx represent the dimension of xkl and DIxrepresent the dimension of Ixi e time window Ts ordmDIxDx
Oslash
is used to reduce the value of DIx us theadjusted samples to be identied Ixi [Ixi(1) Ixi(1) +Ts middot middot middot Ixi(1) + (Dx minus 1)Ts] When DIx ltDx the samemethod can be used to reduce the dimension of xkl andmake it consistent with DIx At this moment DIx and Dxneed to be exchanged
42 Identi cation Experiments By adjusting some param-eters of emitters such as pulse width and output powersignals that are dierent from yi(i 1 2 middot middot middot 500) can beobtained Suppose that sample Ixi(i 1 2 3 4) is randomlyselected from these signals for identication and the di-mension of Ixi is 10240 xkl represents the lth training
sample in class k Bxkl is the label matrix FirstIxi [Ixi(1) Ixi(1) + 10 middot middot middot Ixi(1) + 10230] can beobtained according to the method of adding time windowen the single-sided amplitude spectrum of center ck forclass k is shown in Figure 9 k 1 2 middot middot middot 5 e double-sidedamplitude spectrumof Ixi(i 1 2 3 4) is shown in Figure 10Finally the identity of Ixi(i 1 2 3 4) is preliminary de-termined by observing the similarity between these amplitudespectrum
It is observed that the amplitude spectrum of Ix1 issimilar to that of the signals in class 2 or class 3 and Ix2 islikely to belong to class 5 But the class of Ix3 and Ix4 isdicult to determine only by observation At this time it isnecessary to carry out correlation test for these samples etest results are shown in Table 1 when N2 300 andT 100
Table 1 shows that r12 09704 and r13 09945 whichare all greater than 095 So Ix1 might be the element of class2 or class 3 Ix2 should be classied into class 5ese resultsare consistent with the observations Ix3 and Ix4 should beremoved before formal classication erefore it is
0 2 4 60
50
100
150
200
250
300
350
400
Frequency (Hz)
Am
plitu
de
Class 1
times 105
(a)
times 105
0 2 4 60
50
100
150
200
250
300
Frequency (Hz)
Am
plitu
de
Class 2
(b)
times 105
0 2 4 60
10
20
30
40
50
60
70
80
Frequency (Hz)
Am
plitu
de
Class 3
(c)
times 105
0 2 4 60
20
40
60
80
100
120
140
Frequency (Hz)
Am
plitu
de
Class 4
(d)
times 105
0 2 4 60
50
100
150
200
250
300
350
Frequency (Hz)
Am
plitu
de
Class 5
(e)
Figure 9 e single-sided amplitude spectrum of class k k 1 2 middot middot middot 5 (a) k 1 (b) k 2 (c) k 3 (d) k 4 (e) k 5
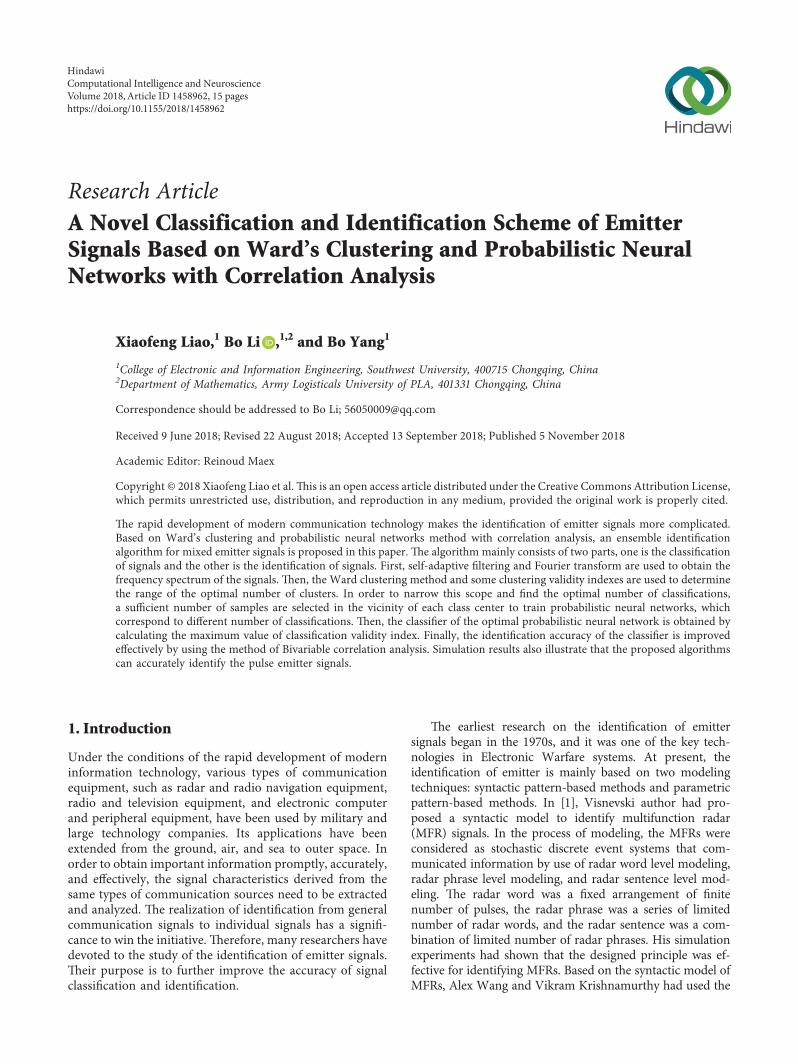
Input e training samples xkl label matrix BxklSamples to be identied Ixi
Output Ixi is the element of the class kNormalize xkl IxiCreate PNN model by using xkl and BxklAdjust the dimension of Ixi to make it consistent with the xklDetermining sequences Fi and FklCompute tting curves zi yklCreate feature sequences Cs(k) ZiCompute rik and if rik ge 095 then
Put the Ixi into the trained PNNelse
Ixi does not belong to any classEnd Identication algorithm
ALGORITHM 3 Identication algorithm
Computational Intelligence and Neuroscience 11
necessary to identify Ix1 and Ix2 by using PNN L points areselected as training samples in each class to train PNNL 70 Finallye trained PNN is used to judge the identityof Ix1 and Ix2 Since Ix1 corresponds to Ix1 Ix2 corre-sponds to Ix2 we can obtained the identity of Ix1 and Ix2 byidentifying Ix1 and Ix2 e identied results are shown inFigure 11 when σ 1
In order to obtain intuitive results the data on columns41 256 682 of Ix1 are selected to form a three-dimensionalarray [Ix1(41) Ix1(256) Ix1(682)] Data on the samecolumns of Ac are selected to form a matrix of size 500 times 3All data are drawn in Figure 11(a) Obviously Ix1 should bethe element in class 3 (black solid ball) and Ix2 should bethe element in class 5 (red solid ball) e same results canalso be obtained when the data on columns 35 709 and 929of Ix1 and Ac are selected e corresponding results aredrawn in Figure 11(b)
5 Comparative Experiments
e performance of the proposed algorithm can be reectedthrough comparative experiments erefore it is necessaryto compare it with some usual identication methods suchas support vector machine based schemes [32] particleswarm optimization and support vector machine basedschemes [12] articial neural networks and intelligent lterbased schemes [33] PNN and simplied fuzzy adaptiveresonance theory map neural networks based schemes [15]and fuzzy c-means based schemes [34] When the class label
of each signal is known the performance of the abovemethods can be compared by calculating the classicationaccuracy and the identication accuracy e comparisonresults are shown in Table 2 e samples that cannot becorrectly judged are shown in Figure 12
Table 2 shows that the classication accuracy obtainedfrom Liursquos and our methods is 100 e value of identi-cation accuracy obtained from the proposed method alsoreaches 100 Figure 12(a) shows that some algorithms failto give the correct classication results for some signals Interms of signal classication the number of samples withoutcorrect classication for each method is 9 0 18 11 27 and0 By comparison the identication accuracy derived fromZareirsquos and Cannonrsquos scheme is poor and they fail to identifythe sample 3 and 4 (Figure 12(b)) is is mainly becausearticial neural networks and fuzzy c-means algorithm cangive a judgment result for each signal whether or not thesignal belongs to the determined classes Although the PNNhas some similar problems they can be skillfully solved bythe method of Bivariable correlation analysis It makes theproposed method have unique advantages in signalidentication
6 Concluding Remarks
It is an indisputable fact that the probabilistic neural net-works can be used to classify and identify patterns It hasa wide range of application including the identication ofemitter signals In this paper a novel classication and
0 2 4times105
0
5
10
15
20
25
30
Frequency (Hz)
Am
plitu
deSample 1
(a)
times105
0 2 40
5
10
15
20
25
30
Frequency (Hz)
Am
plitu
de
Sample 2
(b)
times105
0 2 40
5
10
15
20
25
30
Frequency (Hz)
Am
plitu
de
Sample 3
(c)
times105
0 2 4
20
40
60
80
100
120
140
Frequency (Hz)
Am
plitu
de
Sample 4
(d)
Figure 10 e double-sided amplitude spectrum of Ixi(i 1 2 3 4) (a) i 1 (b) i 2 (c) i 3 (d) i 4
Table 1 Correlation test of the samples to be identied
rik Class 1 Class 2 Class 3 Class 4 Class 5Ix1 03687 09704 09945 05473 06910Ix2 07991 07447 06674 07882 09941Ix3 02364 08907 07982 05202 05583Ix4 07864 03572 03083 06887 06841
12 Computational Intelligence and Neuroscience
020
4060
80
ndash200
2040
60ndash20
0
20
40
60
XY
Z
class1class2class3class4
class5sample1sample2
(a)
ndash200
2040
60
ndash200
2040
60ndash20
0
20
40
60
XY
Z
class1class2class3class4
class5sample1sample2
(b)
Figure 11 e identied results of [Ixi(a1) Ixi(a2) Ixi(a3)] i 1 2 (a) a1 41 a2 256 a3 682 and i 1 (b) a1 35 a2 709a3 929 and i 2
Table 2 Accuracy comparison of dierent methods (K 5)
Literature Grylliasrsquos [32] Liursquos [12] Zareirsquos [33] Jaouherrsquos [15] Cannonrsquos [34] is workClassication accuracy () 9820 10000 9640 9780 9460 10000Identication accuracy () 7500 7500 5000 7500 5000 10000
1 2 3 4 5 6 70
50100150200250
300350400450500
Schemes
Sam
ple n
umbe
r
1-Gryllias3-Zarei
4-Jaouher5-Cannon
(a)
1 2 3 4 5 6 71
2
3
4
5
6
7
Schemes
Iden
tific
atio
n sa
mpl
e num
ber
1-Gryllias2-Liu3-Zarei
4-Jaouher5-Cannon
(b)
Figure 12 e samples that cannot be judged correctly by dierent schemes (a) e samples that cannot be correctly classied (b) esamples that cannot be correctly identied
Computational Intelligence and Neuroscience 13
identification scheme which is designed by the WCM andthe PNN with correlation analysis has been proposed foremitter signals e scheme starts with self-adaptive filteringprocessing and spectrum analysis then the WCM andclustering validity indexes including CH Silh DB and Gapare utilized to determine the range of the optimal number ofclusters For different classification number K 70 samplesnearby each center are selected as training samples to es-tablish PNN classifiers Finally the optimal PNN classifierwhich is used to identify signals is determined by themaximum of the classification validity index D(K) At thisstage the method of Bivariable correlation analysis iscleverly used to improve the identification accuracy of PNNclassifier Experiments show that the proposed method canobtain higher accuracy and it is more stable than otherschemes in identification problems
Finally it should be pointed out that the scheme pre-sented above is mainly used to classify the obtained signalswhich are derived from some pulse emitters e classifi-cation and identification of signals derived from somecontinuous wave emitters or the mixed emitters of these twotypes are the next topic to be studied In addition theproposed method can also be used to identify other signalssuch as biomedical signals and monitoring signals of digitalvirtual assets When the data set to be classified are notnumeric they can first be converted to binary string andthen converted to the required format
Data Availability
Data involve secrets and need to be kept confidential
Conflicts of Interest
e authors declare that there are no conflicts of interestsregarding the publication of this paper
Acknowledgments
is study was funded in part by the National Key Researchand Development Program of China under Grant2016YFB0800601 and in part by the National Natural ScienceFoundation of China under Grants 61472331 and 61772434
References
[1] N Visnevski Syntactic Modeling of Multi-Function RadarsPhDrsquos thesis McMaster University 2005
[2] A Wang and V Krishnamurthy ldquoreat estimation of multi-function radars modeling and statistical signal processing ofstochastic context free grammarsrdquo in Proceedings of IEEEInternational Conference on Acoustics Speech and SignalProcessing (ICASSP) pp 793ndash796 Honolulu HI USA 2007
[3] L Dai B Wang and B Cai ldquoA method for states estimationof multi-function radar based on stochastic context freegrammarrdquo Journal of Air Force Engineering University vol 15no 3 pp 31ndash39 2014
[4] M Jan and L Paradowski ldquoA knowledge based approach foremitter identificationrdquo in Proceedings of International Con-ference on Microwaves and Radar (MIKONrsquo98) vol 3pp 810ndash814 Krakow Poland 1998
[5] M Jan Specific Emitter Identification in Proceedings of In-ternational Radar Symposium pp 1ndash4 Krakow Poland 2008
[6] J Dudczyk ldquoe concept of ELINT DataBase based on ERDmodellingrdquo Elektronika vol 2018 pp 34ndash37 2018
[7] C S Shieh and C T Lin ldquoA vector network for emitteridentificationrdquo IEEE Transactions on Antennas and Propa-gation vol 50 no 8 pp 1120ndash1127 2002
[8] B Tang and H Guang rui ldquoRecognition of radar signal usingimmune RBF networkrdquo Journal of Data Acquisition andProcessing vol 17 no 4 pp 371ndash375 2002
[9] J Dudczyk ldquoA method of feature selection in the aspect ofspecific identification of radar signalsrdquo Bulletin of the PolishAcademy of Sciences Technical Sciences vol 65 no 1pp 113ndash119 2017
[10] G Zhang Y Zhou and W Jiang ldquoA method of Radiatoridentification based on Bayes theoryrdquo Signal Processingvol 20 no 4 pp 350ndash352 2004
[11] G X Zhang H N Rong and W D Jin ldquoApplication ofsupport vector machine to radar emitter signal recognitionrdquoJournal of Southwest Jiaotong University vol 41 no 1pp 25ndash30 2006
[12] Z Liu H Cao X Chen and Z He ldquoMulti-fault classificationbased on wavelet SVM with PSO algorithm to analyze vi-bration signals from rolling element bearingsrdquo Neuro-computing vol 99 no 1 pp 399ndash410 2013
[13] Q Liu ldquoA novel radar emitters scheme recognition algorithmusing support vector machinerdquo Information TechnologyJournal vol 13 no 4 pp 725ndash729 2014
[14] R Hussain ldquoSynthetic Aperture Radar (SAR) images featuresclustering using Fuzzy c-means (FCM) clustering algorithmrdquoComputational Ecology and Software vol 2 no 4 pp 220ndash225 2012
[15] J Ben Ali L Saidi and A Mouelhi ldquoLinear feature selectionand classification using PNN and SFAM neural networks fora nearly online diagnosis of bearing naturally progressingdegradationsrdquo Engineering Applications of Artificial In-telligence vol 42 pp 67ndash81 2015
[16] J Iounousse S Er-Raki and A E Motassadeq ldquoUsing anunsupervised approach of Probabilistic Neural Network(PNN) for land use classification from multitemporal satelliteimagesrdquo Applied Soft Computing vol 30 pp 1ndash13 2015
[17] Z Wu Advanced digital signal processing pp 133ndash135 ChinaMachine Press Beijing China 2009
[18] C Gou and L Yi ldquoA variable step size LMS algorithm basedon bell-shaped functionrdquo Marine Electric and ElectronicEngineering vol 35 no 11 pp 31ndash39 2015
[19] N Yorek I Ugulu andH Aydin ldquoUsing self-organizing neuralnetwork map combined with Wardrsquos clustering algorithm forvisualization of studentsrsquo cognitive structural models aboutaliveness conceptrdquo Computational Intelligence and Neurosci-ence vol 2016 Article ID 2476256 14 pages 2016
[20] B E Husic and V S Pande ldquoWard clustering improves cross-validated markov state models of protein foldingrdquo Journal ofChemicaleory and Computation vol 13 no 3 pp 963ndash9672017
[21] A J Gomez-Nuntildeez B Vargas-Quesada and F de Moya-Anegon ldquoUpdating the SCImago journal and country rankclassification a new approach using Wardrsquos clustering andalternative combination of citation measuresrdquo Journal of theAssociation for Information Science and Technology vol 67no 1 pp 178ndash190 2015
[22] O Arbelaitz I Gurrutxaga and J Muguerza ldquoAn extensivecomparative study of cluster validity indicesrdquo Pattern iden-tification vol 46 no 1 pp 243ndash256 2013
14 Computational Intelligence and Neuroscience
[23] S Łukasik and P A Kowalski ldquoClustering using flowerPollination algorithm and calinski-harabasz indexrdquo IEEECongress on Evolutionary Computation (CEC) pp 2724ndash27282016
[24] R Cordeiro de Amorim and C Hennig ldquoRecovering thenumber of clusters in data sets with noise features usingfeature rescaling factorsrdquo Information Sciences vol 324pp 126ndash145 2015
[25] P J Rousseeuw ldquoSilhouettes a graphical aid to the in-terpretation and validation of cluster analysisrdquo Journal ofComputational and Applied Mathematics vol 20 no 20pp 53ndash65 1987
[26] D L Davies and D W Bouldin ldquoA cluster separationmeasurerdquo IEEE Transactions on Pattern Analysis andMachineIntelligence PAMI-1 no 2 pp 224ndash227 1979
[27] R Tibshirani G Walther and T Hastie ldquoEstimating thenumber of clusters in a data set via the gap statisticrdquo Journal ofthe Royal Statistical Society vol 63 no 2 pp 411ndash423 2001
[28] S R Mohanty P K Ray N Kishor and B K PanigrahildquoClassification of disturbances in hybrid DG system usingmodular PNN and SVMrdquo International Journal of ElectricalPower and Energy Systems vol 44 no 1 pp 764ndash777 2013
[29] S Wang X Li S Zhang J Gui and D Huang ldquoTumorclassification by combining PNN classifier ensemble withneighborhood rough set based gene reductionrdquo Computers inBiology and Medicine vol 40 no 2 pp 179ndash189 2010
[30] J Iounousse S Er-Raki and A E Motassadeq ldquoUsing anunsupervised approach of Probabilistic Neural Network(PNN) for land use classification from multitemporal satelliteimagesrdquo Applied Soft Computing vol 30 pp 1ndash13 2015
[31] A T C Goh ldquoProbabilistic neural network for evaluatingseismic liquefaction potentialrdquo Canadian Geotechnical Jour-nal vol 39 no 1 pp 219ndash232 2002
[32] K C Gryllias and I A Antoniadis ldquoA Support VectorMachine approach based on physical model training forrolling element bearing fault detection in industrial envi-ronmentsrdquo Engineering Applications of Artificial Intelligencevol 25 no 2 pp 326ndash344 2012
[33] J Zarei M Amin Tajeddini and H Reza Karimi ldquoVibrationanalysis for bearing fault detection and classification using anintelligent filterrdquo Mechatronics vol 24 no 2 pp 151ndash1572014
[34] L Cannon Robert V Dave Jitendra J C Bezdek andM M Trivedi ldquoSegmentation of a thematic Mapper imageusing fuzzy c-means clustering algorithmrdquo IEEE Transactionson Geoscience and Remote Sensing vol GE-24 no 3pp 400ndash408 1986
Computational Intelligence and Neuroscience 15
Computer Games Technology
International Journal of
Hindawiwwwhindawicom Volume 2018
Hindawiwwwhindawicom
Journal ofEngineeringVolume 2018
Advances in
FuzzySystems
Hindawiwwwhindawicom
Volume 2018
International Journal of
ReconfigurableComputing
Hindawiwwwhindawicom Volume 2018
Hindawiwwwhindawicom Volume 2018
Applied Computational Intelligence and Soft Computing
thinspAdvancesthinspinthinsp
thinspArtificial Intelligence
Hindawiwwwhindawicom Volumethinsp2018
Hindawiwwwhindawicom Volume 2018
Civil EngineeringAdvances in
Hindawiwwwhindawicom Volume 2018
Electrical and Computer Engineering
Journal of
Journal of
Computer Networks and Communications
Hindawiwwwhindawicom Volume 2018
Hindawi
wwwhindawicom Volume 2018
Advances in
Multimedia
International Journal of
Biomedical Imaging
Hindawiwwwhindawicom Volume 2018
Hindawiwwwhindawicom Volume 2018
Engineering Mathematics
International Journal of
RoboticsJournal of
Hindawiwwwhindawicom Volume 2018
Hindawiwwwhindawicom Volume 2018
Computational Intelligence and Neuroscience
Hindawiwwwhindawicom Volume 2018
Mathematical Problems in Engineering
Modelling ampSimulationin EngineeringHindawiwwwhindawicom Volume 2018
Hindawi Publishing Corporation httpwwwhindawicom Volume 2013Hindawiwwwhindawicom
The Scientific World Journal
Volume 2018
Hindawiwwwhindawicom Volume 2018
Human-ComputerInteraction
Advances in
Hindawiwwwhindawicom Volume 2018
Scientic Programming
Submit your manuscripts atwwwhindawicom

stochastic context-free grammar to describe the behaviors ofthe MFR system and some good results were obtained Al-though the stochastic context-free grammar was a model forcapturing the essential features of the MFR dynamics [2] ithad some defects in estimating the parameters of stochasticcontext-free grammar erefore the expectation maximi-zation algorithm had been proposed by LP Dai et al to es-timate these parameters which can be used to further estimatethe characteristic parameters of MFR [3] From this point ofview the ultimate goal of the modeling technique based onsyntax was to find the feature parameters of emitters Ithighlighted the importance of identification technology basedon the parametric pattern e feature parameter matchingtechnique was a basic method of this pattern e maincharacteristic of this method was to identify the emittersignals by matching the measured signal characteristic pa-rameter vector with the corresponding characteristic pa-rameters in the known database (the libraries of radar types)is method depended on the feature parameter databaseand it can only be applied to emitter identification problemwith invariant characteristic parameters Moreover the li-braries of types had also an inherent uncertainty resultinginevitably from data collection methods erefore JanMatuszewski et al had proposed the knowledge-basedtechniques to identify emitters [4 5] ey think that theinformation of known radar platforms (knowledge) in-cluding position intent and recent operational history playsan important role in the identification of emitters eirapproaches had been successfully used to identify somespecific emitters In order to fully utilize this knowledge toidentify emitters Janusz Dudczyk had proposed an idea ofconstructing Emitter DataBase based on the entity-relationship modeling e entity-relationship diagram wasintroduced to realize this idea which had pointed out a newdirection for the construction of a complete and accurateElectronic Intelligence systems [6] Meanwhile artificial in-telligence techniques and some optimized feature selectionmethods were used to improve the identification accuracy ofemitter signals In [7] the authors had proposed a vectorneural network with a supervised learning algorithm whichworked for signal classification and emitter identificationis network took carrier frequency pulse width and pulserepetition interval as inputs to complete the identification In[8] the authors had proposed an identification method ofradar signals based on immune radial-basis function neuralnetwork which can improve the convergence speed andperformance of the algorithm In [9] a multichannel rec-ognition system with an independent distance which wasdefined on impartiality condition had been proposed toidentify the specific emitters By modifying the distance ineach special recognition channel radio frequency pulsewidth and pulse repetition interval of radar signals can beextracted and classified into an appropriate class Beyond thatsomemethods had been proposed to reduce the identificationerror rate In [10] wavelet features were used as inputs ofneural networks to identify emitters In [11ndash13] the supportvector machine was introduced to identify emitter signals In[14 15] the fuzzy c-means and probabilistic neural networks(PNN) were used to identify emitter signals However the
determination of the optimal number of clusters was a majorchallenge for these methods and they cannot effectivelyimprove the identification accuracy erefore Jawad et aldesigned a clustering validity function in the hidden-layeroutput space of PNN to find the optimal number of clusterseir methods were successfully applied to the classificationof land use [16] But the method of determining the range ofclustering number was subjective which may reduce theidentification accuracy of the algorithm To overcome thisdeficiency and further improve accuracy a classification andidentification scheme of emitter signals based on the Wardclusteringmethod (WCM) and PNNwith correlation analysiswas proposed in this paper Its advantages are presented inthree aspects
(1) e self-adaptive filtering Wardrsquos clustering andclustering validity indexes are skillfully used to de-termine the scope of the optimal number of clusters
(2) e classification validity index D is flexibly used tofind the optimal PNN classifier
(3) e probabilistic neural networks with Bivariablecorrelation analysis approach are proposed to im-prove the identification accuracy of emitter signals
e rest of this paper is organized as follows In Section2 the classification and identification schemes includingadaptive filtering frequency spectrum evaluation indexesWCM and PNN classifier are introduced e flowchart andthe pseudocodes of the classification algorithms are designedin Section 3 e flowchart and the pseudocodes of theidentification algorithm are given in Section 4 e identi-fication experiments are also carried out in this section ecomparison discussions of different schemes are proposed inSection 5 Some innovations and applicable conditions of theproposed method are summarized in Section 6
2 Classification Model of Emitter Signals
21 Self-Adaptive Filtering In the field of engineeringtechnology the signal x(n) received at time n usuallycontains two parts One is the useful signal s(n) which iswhat we need and it enables us to understand the propertiesof the object to be studied e other is the interferencesignal x1(n) which is what we do not need and it preventsus from understanding the properties of the object to bestudiede actual signal will be obtained once the two partsare combined together at is x(n) s(n) + x1(n)
Weakening the interference signal x1(n) and main-taining or enhancing the useful signal s(n) are an importantpurpose of signal processing e usual method is to usea frequency function H(f) to multiply the frequencyspectrum X(f) of the signal x(n) is process is calledfiltering Its essence is to weaken the interference signal andhighlight the useful signal Currently the most widely usedfilters include Kalman filtering Wiener filtering medianfiltering sequential statistical filtering wavelet transformself-adaptive filtering etc In terms of adaptability and fil-tering performance one of the best filtering methods is theself-adaptive filtering which is developed on the basis of
2 Computational Intelligence and Neuroscience
Kalman filtering Wiener filtering and linear filtering emost important feature of the self-adaptive filtering is that itcan track the time-varying characteristics of input signalsand eliminate the unknown interference contained in thesignals Self-adaptive filtering based on the least mean squarealgorithm is proposed by Widrow and Hoff and it has beenwidely used in many fields because of its simplicity ro-bustness and easy implementatione principle diagram ofself-adaptive filtering technology is shown in Figure 1
Figure 1 presents the schematic diagram of noiseelimination for self-adaptive filter e actual signal x(n)
contains interference signal x1(n) generated from signalchannel 1 In order to eliminate it the noise signal x0(n)
which is independent of s(n) but related to x1(n) must besampled from noise source through the signal channel 2emain function of the self-adaptive filter is to process x0(n) sothat the output y(n) approximates to x1(n) Under thecondition of convergence of filtering algorithm the outpute(n) of the system approximates to s(n) when y(n) ap-proaches x1(n) e iterative formulas of self-adaptive fil-tering algorithm based on the least mean square are definedas follows [17]
e(n) d(n)minusωT(n)X(n)
ω(n + 1) ω(n) + 2μe(n)X(n)(1)
where d(n) is the desired signal X(n) [x(n)
x(nminus 1) middot middot middot x(nminusM + 1)]T is the input signal vector attime n M is the length of filter and μ is the fixed step sizeand satisfies 0lt μlt 1MPin where Pin is the input power offilter ω(n) [w0(n) w1(n) middot middot middot wMminus1(n)]T is the weightvector ofM order adaptive filter at time nω(n) 0 at initialtime y(n) ωT(n)X(n) represents the actual output signalof filter In noise elimination applications x(n) is usuallyused as the desired signal d(n) and x0(n) is used as the inputsignal of the filter to eliminate x1(n) After many iterationsthe difference between d(n) and y(n) is the estimate ofsignal s(n) is algorithm has the advantages of smallamount of computation easy implementation and stableperformance but its convergence speed is relatively slowerefore the authors proposed a variable step adaptivefiltering algorithm based on bell-shaped function [18] evariable step size is given as follows
μ(n) μmax 1minus eminusa|e(n)|b
1113874 1113875 (2)
where μmax isin (0 1MPin) is the maximum step size that canmaintain the convergence of the adaptive filtering algorithmExperiments show that this algorithm can effectively im-prove the convergence speed and reduce the steady-stateerror when a 008 and b 4 In subsection 3 the methodis used to eliminate the interference signal of emitters
22e Spectrum of Signals In order to classify and identifysignals it is necessary to analyze the frequency spectrum andenergy spectrum of the signals From the electrical knowl-edge P V2R where V represents voltage and R representsresistance If the resistance R 1 and V is replaced by signalx(t) the instantaneous energy is x2(t) us the total
energy of the signals can be expressed as 1113938+infinminusinfin x2(t) dt
According to Parsevalrsquos theorem it can be obtained by thefollowing equation
1113946+infin
minusinfin|x(t)|
2dt 1113946
+infin
minusinfin|X(f)|
2df (3)
where
X(f) 1113946+infin
minusinfinx(t)eminus2πift
dt (4)
is the Fourier transform for signal x(t) and f represents thefrequency of signal x(t) |X(f)| is called the amplitudespectrum and argX(f) is called the phase spectrum of x(t)e frequency spectrum of x(t) consists of amplitudespectrum and phase spectrum |X(f)|2 is called energyspectrum density Equation (3) indicates that the energy ofx(t) is closely related to |X(f)|2 and it can be obtained bycalculating its integral on (minusinfin +infin) erefore we canobtain the frequency distribution and energy distributionof each signal by analyzing the spectrum of the signalenthe key amplitude and the frequency of energy distributioncan be further obtained which provide conditions fordirectly observing the similarities and differences of pairedsignals
23 e Ward Clustering Method As a hierarchical ag-glomerate cluster algorithm the WCM has a wide range ofapplications [19ndash21] First it is started by accepting eachnode as a separate cluster en the clusters with minimumdistance between themselves are combined in pairs at eachstage of the algorithm is smallest distance is called theWard distance and defined as follows
drs nr middot ns
nr + ns
xr minusxs
2 (5)
where r and s represent the two distinct clusters nr and ns
represent the number of data points of two clusters re-spectively xr and xs represent the center of the corre-sponding cluster and || middot || is Euclidean norm e centersand cardinal numbers of the new cluster are updatedaccording to the following equations
xrprime
nr middot xr + ns middot xs
nr + ns
(6)
nrprime nr + ns (7)
Wardrsquos clustering algorithm has the following steps
Step 1 Each sample point is treated as a cluster At thistime the sum of squares of deviations for each cluster isequal to 0Step 2 Two arbitrary clusters are merged and the sumof squares of deviations is calculated from Equations(5)ndash(7) If we assume that there are N clusters in total itmust be calculated N(Nminus 1)2 timesStep 3 e two clusters with the smallest squared sumof deviations are combined into one class e methodeventually aggregates all sample points into one classwhen the number of clusters is unknown
Computational Intelligence and Neuroscience 3
If the number of clusters is known the WCM can bedirectly used to classify the signal data after removing thenoise Otherwise it can be obtained by analyzing the den-drogram of clustering is is a rather subjective approachwhich is dicult to help us nding the true number ofclusters for a given data set In recent research the clusteringvalidity indexes such as Calinski-Harabasz (CH) index Gapindex Silhouette (Silh) index and DaviesndashBouldin (DB)index have been demonstrated to be the best validation toolsfor determining the optimal number of clusters [22ndash27]
231 Calinski-Harabasz Index For a given setY y1 y2 middot middot middot yN assume that the dimension of eachentity yi is v i 1 2 middot middot middot N K nonempty disjoint clustersets S S1 S2 middot middot middot SK around the centroid setC c1 c2 middot middot middot cK can be obtained by minimizing thewithin-cluster distance WK
WK sumK
k1sumyiisinSk
d yi ck( ) (8)
where d(yi ck) k 1 2 middot middot middot K represents the squared Eu-clidean distance between the entity yi and the centroid ckthat is
d yi ck( ) sumjisinv
yij minus ckj( )2 (9)
en the CH index is dened as follows [24]
CH(K) T1 minusWK( )(Kminus 1)WK(NminusK)
(10)
where WK is dened as in (8) and T1 can be calculated byT1 sum
Ni1sumjisinv(yij minusyj)
2e CH index can reect the compactness of the cluster
by means of the overall within-cluster variance e sepa-ration degree of the clusters can be reected by the overallbetween-cluster variance erefore a good clusteringscheme corresponds to a higher value of CH index
232 Silhouette Index For each entity yi its silhouette valuemeasures the similarity between the entity yi and the pointsin its own cluster when compared to the points in otherclustersis similarity is reected bymeasuring the distancebetween the entity yi and the points derived from dierentclusters e silhouette value of the entity yi is dened asfollows [24]
s yi( ) b yi( )minus a yi( )
max a yi( ) b yi( ) (11)
where a(yi) is the average distance from the entity yi isin Sk toall other points yj isin Sk b(yi) is the minimum distance fromthe entity yi to all other points yj which satisesyj isin Sl yi notin Sl lne k erefore minus1le s(yi)le 1 If s(yi) isclose to zero the entity yi could be assigned to anothercluster A negative value of s(yi) indicates that the corre-sponding assignment seriously damages cluster cohesionand the clustering result of yi is not advisable yi is wellmatched to its own cluster when s(yi) is close to 1 Finallythe validity of the whole clustering can be quantied by Silhindex and it is dened as follows
Silh(K) sumN
i1
s yi( )N
(12)
e Silh index can be used with any distance metricincluding the Manhattan distances and Euclidean distances
233 DaviesndashBouldin Index A good partition should havea larger intercluster separation degree and stronger within-cluster homogeneity and compactness e DB index isproposed based on this idea [26] More concretely it isconstructed by a ratio of within-cluster and between-clusterdistances e DB index is dened as follows
DB(K) sumK
k1maxknej
dk + dj( )dkj
K (13)
where
dk 1Sk∣∣∣∣∣∣∣∣sumSk| |
i1yi minus ck∣∣∣∣
∣∣∣∣q 1q
(14)
represents the average distance between each point yi incluster k and the centroid of clusterk |Sk| is the number ofpoints in cluster k If q 1 dk is the average Euclideandistance between the points in cluster k to the centroid ofcluster k If q 2 dk is the standard deviation of the distanceof points in cluster k to the center of cluster k When k in dkis replaced by j dj can be obtained In addition dkj can becalculated according to the following equation
dkj sumv
h1ckh minus cjh∣∣∣∣∣
∣∣∣∣∣p
1p
(15)
The actual signal x (n) = s (n) + x1 (n)
Self-adaptivefilter
Noise signalsampling x0 (n)
Output signaly (n)
Errorse (n)
Control filter coefficients
sumndash
Signal source
Noise source
+1
2
Figure 1 Flowchart of the self-adaptive ltering technology
4 Computational Intelligence and Neuroscience
It represents the distances between the centroids of thekth and the jth clusters ckh is the hth component of thecentroid of cluster k and dkj is the Minkowski metric of thecentroids which characterizes clusters k and j Specificallyp 1 dkj is the Manhattan distance between centroidsp 2 dkj is the Euclidean distance between centroids
e DB index can reflect the degree of within-clusterdispersion and between-cluster separation So the truenumber of clusters may be determined according to theminimum value of the DB index
234 Gap Index Robert Tibshirani et al proposed the gapstatistic method for estimating the number of clusters in a setof data [27] A graph of the within-cluster dispersion versusthe number of clusters k for a clustering procedure showsthat the within-cluster dispersion decreases monotonicallyas k increases but from some k onwards the decrease be-comes flatter obviously Such position is called lsquoelbowrsquo itoften implies the appropriate number of clusters e gapcriterion gives an approach to estimate the number ofclusters by locating this lsquoelbowrsquo erefore under this cri-terion the optimal number of clusters occurs at the largestgap value e Gap index is defined as follows
GapN(K) EN log UK( 11138571113864 1113865minus log UK( 1113857 (16)
where N represents the number of points K represents thenumber of clusters that are evaluated UK defined in (17)represents the within-cluster dispersion degree
UK 1113944K
k1
12Nk
Hk (17)
where Nk is the number of points in cluster k Hk is the sumof the distances of any two points in the kth cluster eexpected value EN log(UK)1113864 1113865 is determined by Monte Carlosampling from a reference distribution e Gap index canalso be used for any distance metric
e WCM belongs to unsupervised categorizationtechnique which can help us find the centroid of eachcluster However the classification accuracy of this methodis limited which makes the method not able to be useddirectly for signal recognition Comparatively PNN caneffectively improve the accuracy of classification and iden-tification [28 29]
24 Probabilistic Neural Network Classifier As a method ofnonparametric Parzen windows estimation PNN is firstproposed by Specht It is a nonlinear classification techniqueand essentially a parallel algorithm based on Bayesianminimum risk criterion [30] Given a sample to be identifiedx its posterior probability P(Sk|x) can be obtained by PNNclassifier However if the probability densities of the classesto be separated are unknown the training samples withknown identity need to be used to estimate them Finally thetrained PNN is used to determine the identity of x A typicalPNN classifier consists of an input layer a pattern layer(hidden layer) a summation layer and a output layer eflowchart of the PNN is shown in Figure 2
e input layer neurons are used to receive values fromtraining samples and send data to the neurons in the patternlayer which is fully connected to the input layer enumber of neurons in the input layer is equal to the length ofthe input vector e number of neurons in the pattern layeris the same as the number of training samples Here allneurons are collected into different groups and the ithneuron in group k corresponds to a Gaussian functionf
(k)i (x σ) i 1 2 middot middot middot mk where mk represents the number
of neurons in group k k 1 2 middot middot middot K Gaussian functionwhich is also called probability density function is defined asfollows
f(k)i (x σ)
1(2π)v2σv
exp minus1113944v
j1
x(k)ij minus xj1113872 1113873
2
2σ2⎡⎢⎢⎢⎢⎣ ⎤⎥⎥⎥⎥⎦ (18)
where v is the dimension of the input vectorx (x1 x2 middot middot middot xv) xj is the jth component of the inputvector x x
(k)ij is the jth component of the ith neuron in class
k e so-called smoothing parameter σ isin (0 1) determinedexperimentally by comparing their corresponding classifi-cation accuracy plays an important role in estimation errorof the PNN classifier e outputs of pattern layer areconnected to the summation units depending on the class ofpatterns ere is one neuron for each group and eachneuron in summation layer sums the outputs derived fromthe pattern layer neurons as follows
pk(x) 1
(2π)v2σvmk
1113944
mk
i1exp minus1113944
v
j1
x(k)ij minus xj1113872 1113873
2
2σ2⎡⎢⎢⎢⎢⎣ ⎤⎥⎥⎥⎥⎦ (19)
Finally the output layer neuron output a number 1 andmultiple numbers 0 e value of 1 corresponds to theclassifierrsquos decision result for input vectors More specifi-cally the input vector x belongs to class k if pk(x)gtpkprime(x)
for all kprime 1 2 middot middot middot K and kne kprimeHence the main purpose of training PNN is to find the
optimal estimate of probability density function according tothe training samples and their labels to ensure that theclassifier works at the condition of minimum error rate andrisk When the samples to be identified are sent to thepattern layer the output of each neuron is calculatedaccording to the trained density function Finally theidentified results are obtained through computations in thesummation layer and output layer Due to the followingadvantages it is a wise choice to use PNN as a furtherclassifier to classify signals [31]
(1) It has a simple structure and it is easy to train In thePNN based on probability density function esti-mation the weight of the neuron in pattern is di-rectly taken from the input sample value
(2) e training process of the network is simple andthere is no need to retrain for a long time whenadding or reducing the number of groups
(3) It is not easy to produce local optimal solution andits precision is higher than that of other classificationapproaches No matter how complex the classifica-tion problem is as long as there are enough training
Computational Intelligence and Neuroscience 5
samples the optimal solution under the Bayes cri-terion can be obtained
3 Classification Scheme and Experiments ofEmitter Signals
31 Flowchart and Algorithms of Classi cation Schemee owchart of the proposed classication algorithms isshown in Figure 3
Figure 3 indicates that the proposed scheme iscomposed of four modules that is data processingmodule preclassication module evaluation moduleand accurate classication module In the evaluationmodule the clustering validity indexes are used todetermine the range of K if it is unknown For eachK isin [KMin KMax] the classication validity index D iscalculated as follows [16]
D(K) KsumN1
j1max1lekleK pkj minusN1
N1(Kminus 1) (20)
where N1 is the number of input vectors pkj is the elementof the matrix Q of size K timesN1 in the output of PNNrsquospattern layer representing the membership of the jth inputvector to the cluster k When N1 1 pk1 is equal to pk(x)presented in (19) When N1 gt 1 matrix Q (pkj)KtimesN1
canbe obtained by PNN max1lekleK pkj is the largest element ofthe jth column in the matrix Q Equation (20) indicates thatD(K) is a nonlinear function related to K whenN1 nesum
N1j1max1le kleK pkj ereforeK corresponding to the
maximum value of D(K) is the optimal number of clustersKlowast
e pseudocodes are listed in Algorithm 1 if K isknown
If the classication number K is unknown WCM andclustering validity indexes are used to determine the range ofK e corresponding pseudocodes are listed in Algorithm 2
e algorithms show that the supervised learning PNN isused to classify samples erefore the training (teaching)samples must be selected rst By Ward clustering methodwe have obtained a preliminary classication of all samplesat is the identities of some samples have been determinedexcept for some boundary points which need to be furtherdetermined by the trained PNN erefore some labeledproximity points xkj(k 1 2 middot middot middot K j 1 2 middot middot middot Jk) aroundthe center ck can be selected to train PNN where Jk rep-resents the number of samples selected in class k and itshould be preset such as Jk lceila middot |Sk|rceil a isin [06 08]
32Classi cationExperiments A signal set Rs sampled fromsome pulse emitters is used to test the eectiveness of theproposed algorithms Each emitter emits continuous signalsin the pulse state After a period of time the receiver willreceive multiple signals from all emitters ese signals areconverted into digital signals by the analog-digital convertere sampling frequency is 101MHz Signal samples yi(i 1 2 middot middot middot 500) are randomly extracted from these digitalsignals e signal set Rs [y1 y2 middot middot middot y500]T and the di-mension of yi is 1024 Considering that each yi is disturbedby signals from other emitters the mean value of all signals isused as the noise signal Is [Is(1) Is(2) middot middot middot Is(1024)]where Is(n) sum500
i1yi(n)500 n 1 2 middot middot middot 1024 First theself-adaptive ltering is applied to process these signals Inthis algorithm the actual signal x(n) corresponds to yi(n)and the noise signal x0(n) corresponds to Is(n) enFourier transform is used to obtain the amplitude spectrumof all processed signals e amplitude spectrum of thethirteenth signal is shown in Figure 4
Figure 4(a) shows the sampling signal contains obviouswhite noise which makes the feature of the useful signalunclear However most of the noises are removed after usingthe self-adaptive ltering Moreover the characteristics ofthe signals are highlighted so that the amplitude spectrum of
Pattern layer
Input layer
Summation layer
Output layer Max
x1 x2 xv
x1 x2 xm1x1 x1 x2x2 xm2
xmK
Figure 2 Flowchart of the PNN
6 Computational Intelligence and Neuroscience
them can be analyzed correctly For these transformedsignals the clustering dendrogram can be obtained by usingthe WCM and it is shown in Figure 5
When the signals are divided into 3 4 5 and 6 classesthe intercluster distances are 755 575 27 and 14 re-spectively e increments of the distance between theclusters are 13 305 and 18 in turn If the number of ele-ments in each class is required relatively close the idealnumber of classications is 3 4 and 5 However thesenumbers need to be further determined by the clusteringvalidity indexes e number of clusters K corresponding todierent evaluation indexes is shown in Figure 6
Figure 6 shows that the optimal number of clusters is 3when the DB index and the Silh index are used and it is 2when the CH index is used However it becomes to 5 whenthe Gap index is used erefore the optimal number ofclassications should belong to the interval [2 5] In this casethe PNN needs to be used to obtain more accurate results
For each K in this interval seventy (a 07) samplepoints nearby each ck are selected to train PNN classiersen the optimal classier is obtained by calculating themaximum value of D(K) e results have shown thatD(5) 1 while the other values are less thanD (5)at is tosay the optimal number of classications is 5 Since the sizeof matrix Rs is 500times1024 three columns are randomlyselected as the X-axis the Y-axis and the Z-axis to plot theclassication results diagram Let
Ack
y1k(1) y1k(2) middot middot middot y1k(1024)y2k(1) y2k(2) middot middot middot y2k(1024)⋮ ⋮ ⋮
yMkk(1) yMkk
(2) middot middot middot yMkk(1024)
(21)
represents a matrix consisting of all signals in class k afterclassifying whereMk is the number of samples in class k yjk
Yes
Determining thescope of the K from the
CH Silh DB index[Kmin Kmax]
Kmin = Kmax
Training PNNfor each K
Probability matrixfor different K
Wardsclustering
Classificationnumber K
Train PNNfrom sampling
points
PNNclassification
Outputresults
No
Dmax
Optimal numberof cluster Klowast
Preclassificationmodule
Accurateclassification
module
Evaluationmodule
Spectrumanalysis
Adaptivefiltering
DataProcessing
module
Dendrogram
Classification validityindex for each K
Actualdigital signal
Figure 3 Flowchart of signal classication
Input e original signal vectors yi that need to be classiede classication number K
Output e classied label vector CyCompute si by using self-adaptive ltering for yiCompute frequency spectrum Gi of siCompute center ck of each class k by using WCMSelect training samples xkj around ck and record their labels LxkjCreate the PNN classier by using xkj and LxkjDetermine the class of the remaining samples
End Classication Algorithm 1
ALGORITHM 1 Classication Algorithm 1
Computational Intelligence and Neuroscience 7
is the jth sample in class k and j 1 2 middot middot middot Mk us Ac [Ac1 Ac2 middot middot middotAc5]T is a matrix of size 500times1024 If the dataon columns a1 a2 a3 of Ac are selected to form a matrix Acof size 500times 3 each row of Ac is a three-dimensional arraythat is a point in the coordinate system Whena 05 σ 1 scatter plots of these data are shown inFigure 7 e rst column of Ac corresponds to the X-axisthe second column of Ac corresponds to the Y-axis and thethird column corresponds to the Z-axis
e experimental results show that all signal samples aredivided into ve classes and each class contains 100 signalserefore all signals can be thought to come from veemitters and each emitter emits 100 signals Although onlythree distribution gures of all classied signals are pre-sented in Figure 7 in fact in our experiments we haveobtained more than 1000 scatter plots which are drawn byrandomly selecting three columns from matrix Ac In theseclassication results the distributions of sample sets are
Input e original signal vectors yi that need to be classiedOutput e classied label vector Cy
Compute si by using self-adaptive ltering for yiCompute frequency spectrum Gi of siCompute Wardrsquos clustering dendrogramCompute CH(K) Silh(K) DB(K) and Gap(K) Compute KminKmaxif Kmin Kmax then
Compute center ck of each class kSelect training samples xkj around ck and record their labels LxkjCreate the PNN classier by using xkj and LxkjDetermine the class of the remaining samplesOutput the classied label of yi
else for KKmin Kmaxfor k 1 K
Compute center ck of each class kSelect samples xkj around ck and record their labels LxkjCreate the PNN classier by using xkj and LxkjDetermine the class of the remaining samplesCompute matrix Q (pkj) and D(K) for each KCompute Dmax and the optimal number of classications KlowastOutput the classied label of yi
endend
End Classication Algorithm 2
ALGORITHM 2 Classication Algorithm 2
0 1 2 3 4 5 6 7 8 9 10
times105
0
1
2
3
4
5
6
7times104
Am
plitu
de
Frequency (Hz)
(a)
times105
0 1 2 3 4 5 6 7 8 9 100
2000
4000
6000
8000
10000
12000
Am
plitu
de
Frequency (Hz)
(b)
Figure 4 e double-sided amplitude spectrum of a sampling signal (a) Before ltering (b) after ltering
8 Computational Intelligence and Neuroscience
0
50
100
150
755
575
2714
Figure 5 e dendrogram of the signals after using the WCM
2 4 6 8
CH v
alue
s
200
250
300
350
400
450
500
550
K
(a)
2 4 6 8
DB
valu
es
12
13
14
15
16
17
18
19
K
(b)
2 4 6 8
Silh
val
ues
02
025
03
035
04
045
05
K
(c)
0 2 4 6 8 10
Gap
val
ues
02
04
06
08
1
12
14
K
(d)
Figure 6 e number of clusters K versus the dierent evaluation indexes (a) e number of clusters K versus CH values (b) e numberof clusters K versus DB values (c) e number of clusters K versus Silh values (d) e number of clusters K versus Gap values
ndash500
50100
020
4060
80ndash20
0
20
40
60
80
XY
Z
class1class2class3
class4class5
(a)
050
100
020
4060
80ndash20
0
20
40
60
80
XY
Z
class1class2class3
class4class5
(b)
050
100
ndash200
2040
600
20
40
60
80
XY
Z
class1class2class3
class4class5
(c)
Figure 7e scatter plots of classication results (a)e classied results when a1 245 a2 562 a3 720 (b)e classied results whena1 268 a2 369 a3 547 (c) e classied results when a1 139 a2 367 a3 741
Computational Intelligence and Neuroscience 9
similar and the separations of them are obvious ereforethe proposed methods can eectively distinguish signalsfrom dierent emitters
4 Identification Scheme and Experiments ofEmitter Signals
41 Flowchart and Algorithms of Identi cation SchemeBesides classication data identication is an importantfunction of PNN Since PNN is based on the maximumposterior probability it will give the optimal solution underthe Bayesian criterion whether or not the samples to beidentied Ixi belong to the ve determined classes that havebeen obtained in Section 3 So if a sample belongs to one ofthem it will accurately identify it However it may lose itsfunction when the sample do not belong to them At thistime the amplitude spectrum of all samples can be analyzedbefore so that they can be identied whether they belong tothe determined classes in advance Considering that it isdicult to comparatively analyze the amplitude spectrum ofthe signals to be identied and each signal in every class weadopt the curve tting method to nd the feature sequencesof each class and the signals to be identied Finally thecorrelation degree of these sequences is calculated to get thepreliminary identity information of the samples to beidentied is method is called Bivariable correlationanalysis and it is introduced as follows
Step 1 Simplifying amplitude spectrum Let Li represent thelength of the signal Ixi Fsi represent the Fourier transform ofIxi |Fsi| is the amplitude spectrum of Ixi |Fsi| [gi(1)gi(2) middot middot middotgi(Li)] e sequence Fi of length N2 is extractedfrom |Fsi| which takes ΔTi as the step size where ΔTi ordmLiN2
Oslash
For each training sample xkl in class k the corre-sponding sequence Fkl can be obtained according to the samemethod where k 1 2 middot middot middot Klowast l 1 2 middot middot middot L i 1 2 middot middot middot pand L represents the number of training samples in class kand p represents the number of samples to be identied
Step 2 Fitting curve e tting curve zi can be obtained bytting the sequence Fi and the tting curve ykl in class k canbe obtained by tting the sequence Fkl
Step 3 Constructing the feature sequence First for dierentk ykl(t) t 1 2 middot middot middot T can be calculated after giving the
upper bound T en the tth signal feature of the class k canbe obtained by the following equation
Yk(t) 1LsumL
l1ykl(t) (22)
Finally Cs(k) Yk(1) Yk(2) middot middot middot Yk(T) is the featuresequence of the class k Similarly the feature sequences Zi Zi(1) Zi(2) middot middot middot Zi(T) (i 1 2 middot middot middot p) of the samples tobe identied can be obtained
Step 4 Correlation analysis e correlation coecient be-tween theZi and theCs(k) can be calculated as the followingequation
rik T sumTt1Yk(t) middot Zi(t)( )minus sumTt1Yk(t)( ) middot sumTt1Zi(t)( )
T sumTt1Y
2k(t)( )minus sumTt1Yk(t)( )
2[ ] middot T sumTt1Z
2i (t)( )minus sumTt1Zi(t)( )
2[ ]
radic
(23)
where T(sumTt1Yk(t) middot Zi(t))minus (sumTt1Yk(t)) middot (sum
Tt1Zi(t))
represents the sample covariance of Cs(k) and Zi[T(sumTt1Y
2k(t))minus (sum
Tt1Yk(t))
2] and [T(sumTt1Z2i (t))minus
(sumTt1Zi(t))2] are the sample standard variation of Cs(k) and
Zi respectively e performance of the correlation testindicates that the sample to be identied belongs to thecorresponding class when rge 095 All samples that do notsatisfy this condition should be removed Finally theremaining samples can be eectively identied by thetrained PNN e owchart of the proposed identicationscheme is shown in Figure 8
Figure 8 shows that the owchart mainly includes twoblocks One is the preidentication module and the other isthe identication module e role of the previous module isto eliminate the sample with a small correlation to thedetermined classes When the correlations between thesamples to be identied and several dierent classes are highPNN will accurately identify it based on Bayesian criteriae pseudocodes are given in Algorithm 3 which is calledidentication algorithm
rough the methods proposed in Section 3 all signalsamples have been classied to ve classes at is to say theidentity of each sample has been determined us theidentication algorithm consists of two parts On the onehand some proximity points xkl around the center ck of classk are selected to train PNN k 1 2 middot middot middot Klowast l 1 2 middot middot middot Lxkl is the input vector of the network and its label is
Samples to beidentified Ixi
(i = 1 2 hellip p)
Amplitude spectrum
Fitting curves
Training samplexkl of Class k
(k = 1 2 hellip Klowast)
Amplitude spectrum
Fitting curves
Correlation testing
Passed PNN
No Dont belongto class k
Pre-identification module
Identification module
Feature sequence
Feature sequenceof the class k
Outputresults
Figure 8 Flowchart of signal identication
10 Computational Intelligence and Neuroscience
the output of the system On the other hand the trainedPNN classier is used to determine the identity of Ixii 1 2 middot middot middot p
If the dimension of Ixi is greater than xkl the method ofadding time window can be used to adjust their di-mensions Let Dx represent the dimension of xkl and DIxrepresent the dimension of Ixi e time window Ts ordmDIxDx
Oslash
is used to reduce the value of DIx us theadjusted samples to be identied Ixi [Ixi(1) Ixi(1) +Ts middot middot middot Ixi(1) + (Dx minus 1)Ts] When DIx ltDx the samemethod can be used to reduce the dimension of xkl andmake it consistent with DIx At this moment DIx and Dxneed to be exchanged
42 Identi cation Experiments By adjusting some param-eters of emitters such as pulse width and output powersignals that are dierent from yi(i 1 2 middot middot middot 500) can beobtained Suppose that sample Ixi(i 1 2 3 4) is randomlyselected from these signals for identication and the di-mension of Ixi is 10240 xkl represents the lth training
sample in class k Bxkl is the label matrix FirstIxi [Ixi(1) Ixi(1) + 10 middot middot middot Ixi(1) + 10230] can beobtained according to the method of adding time windowen the single-sided amplitude spectrum of center ck forclass k is shown in Figure 9 k 1 2 middot middot middot 5 e double-sidedamplitude spectrumof Ixi(i 1 2 3 4) is shown in Figure 10Finally the identity of Ixi(i 1 2 3 4) is preliminary de-termined by observing the similarity between these amplitudespectrum
It is observed that the amplitude spectrum of Ix1 issimilar to that of the signals in class 2 or class 3 and Ix2 islikely to belong to class 5 But the class of Ix3 and Ix4 isdicult to determine only by observation At this time it isnecessary to carry out correlation test for these samples etest results are shown in Table 1 when N2 300 andT 100
Table 1 shows that r12 09704 and r13 09945 whichare all greater than 095 So Ix1 might be the element of class2 or class 3 Ix2 should be classied into class 5ese resultsare consistent with the observations Ix3 and Ix4 should beremoved before formal classication erefore it is
0 2 4 60
50
100
150
200
250
300
350
400
Frequency (Hz)
Am
plitu
de
Class 1
times 105
(a)
times 105
0 2 4 60
50
100
150
200
250
300
Frequency (Hz)
Am
plitu
de
Class 2
(b)
times 105
0 2 4 60
10
20
30
40
50
60
70
80
Frequency (Hz)
Am
plitu
de
Class 3
(c)
times 105
0 2 4 60
20
40
60
80
100
120
140
Frequency (Hz)
Am
plitu
de
Class 4
(d)
times 105
0 2 4 60
50
100
150
200
250
300
350
Frequency (Hz)
Am
plitu
de
Class 5
(e)
Figure 9 e single-sided amplitude spectrum of class k k 1 2 middot middot middot 5 (a) k 1 (b) k 2 (c) k 3 (d) k 4 (e) k 5
Input e training samples xkl label matrix BxklSamples to be identied Ixi
Output Ixi is the element of the class kNormalize xkl IxiCreate PNN model by using xkl and BxklAdjust the dimension of Ixi to make it consistent with the xklDetermining sequences Fi and FklCompute tting curves zi yklCreate feature sequences Cs(k) ZiCompute rik and if rik ge 095 then
Put the Ixi into the trained PNNelse
Ixi does not belong to any classEnd Identication algorithm
ALGORITHM 3 Identication algorithm
Computational Intelligence and Neuroscience 11
necessary to identify Ix1 and Ix2 by using PNN L points areselected as training samples in each class to train PNNL 70 Finallye trained PNN is used to judge the identityof Ix1 and Ix2 Since Ix1 corresponds to Ix1 Ix2 corre-sponds to Ix2 we can obtained the identity of Ix1 and Ix2 byidentifying Ix1 and Ix2 e identied results are shown inFigure 11 when σ 1
In order to obtain intuitive results the data on columns41 256 682 of Ix1 are selected to form a three-dimensionalarray [Ix1(41) Ix1(256) Ix1(682)] Data on the samecolumns of Ac are selected to form a matrix of size 500 times 3All data are drawn in Figure 11(a) Obviously Ix1 should bethe element in class 3 (black solid ball) and Ix2 should bethe element in class 5 (red solid ball) e same results canalso be obtained when the data on columns 35 709 and 929of Ix1 and Ac are selected e corresponding results aredrawn in Figure 11(b)
5 Comparative Experiments
e performance of the proposed algorithm can be reectedthrough comparative experiments erefore it is necessaryto compare it with some usual identication methods suchas support vector machine based schemes [32] particleswarm optimization and support vector machine basedschemes [12] articial neural networks and intelligent lterbased schemes [33] PNN and simplied fuzzy adaptiveresonance theory map neural networks based schemes [15]and fuzzy c-means based schemes [34] When the class label
of each signal is known the performance of the abovemethods can be compared by calculating the classicationaccuracy and the identication accuracy e comparisonresults are shown in Table 2 e samples that cannot becorrectly judged are shown in Figure 12
Table 2 shows that the classication accuracy obtainedfrom Liursquos and our methods is 100 e value of identi-cation accuracy obtained from the proposed method alsoreaches 100 Figure 12(a) shows that some algorithms failto give the correct classication results for some signals Interms of signal classication the number of samples withoutcorrect classication for each method is 9 0 18 11 27 and0 By comparison the identication accuracy derived fromZareirsquos and Cannonrsquos scheme is poor and they fail to identifythe sample 3 and 4 (Figure 12(b)) is is mainly becausearticial neural networks and fuzzy c-means algorithm cangive a judgment result for each signal whether or not thesignal belongs to the determined classes Although the PNNhas some similar problems they can be skillfully solved bythe method of Bivariable correlation analysis It makes theproposed method have unique advantages in signalidentication
6 Concluding Remarks
It is an indisputable fact that the probabilistic neural net-works can be used to classify and identify patterns It hasa wide range of application including the identication ofemitter signals In this paper a novel classication and
0 2 4times105
0
5
10
15
20
25
30
Frequency (Hz)
Am
plitu
deSample 1
(a)
times105
0 2 40
5
10
15
20
25
30
Frequency (Hz)
Am
plitu
de
Sample 2
(b)
times105
0 2 40
5
10
15
20
25
30
Frequency (Hz)
Am
plitu
de
Sample 3
(c)
times105
0 2 4
20
40
60
80
100
120
140
Frequency (Hz)
Am
plitu
de
Sample 4
(d)
Figure 10 e double-sided amplitude spectrum of Ixi(i 1 2 3 4) (a) i 1 (b) i 2 (c) i 3 (d) i 4
Table 1 Correlation test of the samples to be identied
rik Class 1 Class 2 Class 3 Class 4 Class 5Ix1 03687 09704 09945 05473 06910Ix2 07991 07447 06674 07882 09941Ix3 02364 08907 07982 05202 05583Ix4 07864 03572 03083 06887 06841
12 Computational Intelligence and Neuroscience
020
4060
80
ndash200
2040
60ndash20
0
20
40
60
XY
Z
class1class2class3class4
class5sample1sample2
(a)
ndash200
2040
60
ndash200
2040
60ndash20
0
20
40
60
XY
Z
class1class2class3class4
class5sample1sample2
(b)
Figure 11 e identied results of [Ixi(a1) Ixi(a2) Ixi(a3)] i 1 2 (a) a1 41 a2 256 a3 682 and i 1 (b) a1 35 a2 709a3 929 and i 2
Table 2 Accuracy comparison of dierent methods (K 5)
Literature Grylliasrsquos [32] Liursquos [12] Zareirsquos [33] Jaouherrsquos [15] Cannonrsquos [34] is workClassication accuracy () 9820 10000 9640 9780 9460 10000Identication accuracy () 7500 7500 5000 7500 5000 10000
1 2 3 4 5 6 70
50100150200250
300350400450500
Schemes
Sam
ple n
umbe
r
1-Gryllias3-Zarei
4-Jaouher5-Cannon
(a)
1 2 3 4 5 6 71
2
3
4
5
6
7
Schemes
Iden
tific
atio
n sa
mpl
e num
ber
1-Gryllias2-Liu3-Zarei
4-Jaouher5-Cannon
(b)
Figure 12 e samples that cannot be judged correctly by dierent schemes (a) e samples that cannot be correctly classied (b) esamples that cannot be correctly identied
Computational Intelligence and Neuroscience 13
identification scheme which is designed by the WCM andthe PNN with correlation analysis has been proposed foremitter signals e scheme starts with self-adaptive filteringprocessing and spectrum analysis then the WCM andclustering validity indexes including CH Silh DB and Gapare utilized to determine the range of the optimal number ofclusters For different classification number K 70 samplesnearby each center are selected as training samples to es-tablish PNN classifiers Finally the optimal PNN classifierwhich is used to identify signals is determined by themaximum of the classification validity index D(K) At thisstage the method of Bivariable correlation analysis iscleverly used to improve the identification accuracy of PNNclassifier Experiments show that the proposed method canobtain higher accuracy and it is more stable than otherschemes in identification problems
Finally it should be pointed out that the scheme pre-sented above is mainly used to classify the obtained signalswhich are derived from some pulse emitters e classifi-cation and identification of signals derived from somecontinuous wave emitters or the mixed emitters of these twotypes are the next topic to be studied In addition theproposed method can also be used to identify other signalssuch as biomedical signals and monitoring signals of digitalvirtual assets When the data set to be classified are notnumeric they can first be converted to binary string andthen converted to the required format
Data Availability
Data involve secrets and need to be kept confidential
Conflicts of Interest
e authors declare that there are no conflicts of interestsregarding the publication of this paper
Acknowledgments
is study was funded in part by the National Key Researchand Development Program of China under Grant2016YFB0800601 and in part by the National Natural ScienceFoundation of China under Grants 61472331 and 61772434
References
[1] N Visnevski Syntactic Modeling of Multi-Function RadarsPhDrsquos thesis McMaster University 2005
[2] A Wang and V Krishnamurthy ldquoreat estimation of multi-function radars modeling and statistical signal processing ofstochastic context free grammarsrdquo in Proceedings of IEEEInternational Conference on Acoustics Speech and SignalProcessing (ICASSP) pp 793ndash796 Honolulu HI USA 2007
[3] L Dai B Wang and B Cai ldquoA method for states estimationof multi-function radar based on stochastic context freegrammarrdquo Journal of Air Force Engineering University vol 15no 3 pp 31ndash39 2014
[4] M Jan and L Paradowski ldquoA knowledge based approach foremitter identificationrdquo in Proceedings of International Con-ference on Microwaves and Radar (MIKONrsquo98) vol 3pp 810ndash814 Krakow Poland 1998
[5] M Jan Specific Emitter Identification in Proceedings of In-ternational Radar Symposium pp 1ndash4 Krakow Poland 2008
[6] J Dudczyk ldquoe concept of ELINT DataBase based on ERDmodellingrdquo Elektronika vol 2018 pp 34ndash37 2018
[7] C S Shieh and C T Lin ldquoA vector network for emitteridentificationrdquo IEEE Transactions on Antennas and Propa-gation vol 50 no 8 pp 1120ndash1127 2002
[8] B Tang and H Guang rui ldquoRecognition of radar signal usingimmune RBF networkrdquo Journal of Data Acquisition andProcessing vol 17 no 4 pp 371ndash375 2002
[9] J Dudczyk ldquoA method of feature selection in the aspect ofspecific identification of radar signalsrdquo Bulletin of the PolishAcademy of Sciences Technical Sciences vol 65 no 1pp 113ndash119 2017
[10] G Zhang Y Zhou and W Jiang ldquoA method of Radiatoridentification based on Bayes theoryrdquo Signal Processingvol 20 no 4 pp 350ndash352 2004
[11] G X Zhang H N Rong and W D Jin ldquoApplication ofsupport vector machine to radar emitter signal recognitionrdquoJournal of Southwest Jiaotong University vol 41 no 1pp 25ndash30 2006
[12] Z Liu H Cao X Chen and Z He ldquoMulti-fault classificationbased on wavelet SVM with PSO algorithm to analyze vi-bration signals from rolling element bearingsrdquo Neuro-computing vol 99 no 1 pp 399ndash410 2013
[13] Q Liu ldquoA novel radar emitters scheme recognition algorithmusing support vector machinerdquo Information TechnologyJournal vol 13 no 4 pp 725ndash729 2014
[14] R Hussain ldquoSynthetic Aperture Radar (SAR) images featuresclustering using Fuzzy c-means (FCM) clustering algorithmrdquoComputational Ecology and Software vol 2 no 4 pp 220ndash225 2012
[15] J Ben Ali L Saidi and A Mouelhi ldquoLinear feature selectionand classification using PNN and SFAM neural networks fora nearly online diagnosis of bearing naturally progressingdegradationsrdquo Engineering Applications of Artificial In-telligence vol 42 pp 67ndash81 2015
[16] J Iounousse S Er-Raki and A E Motassadeq ldquoUsing anunsupervised approach of Probabilistic Neural Network(PNN) for land use classification from multitemporal satelliteimagesrdquo Applied Soft Computing vol 30 pp 1ndash13 2015
[17] Z Wu Advanced digital signal processing pp 133ndash135 ChinaMachine Press Beijing China 2009
[18] C Gou and L Yi ldquoA variable step size LMS algorithm basedon bell-shaped functionrdquo Marine Electric and ElectronicEngineering vol 35 no 11 pp 31ndash39 2015
[19] N Yorek I Ugulu andH Aydin ldquoUsing self-organizing neuralnetwork map combined with Wardrsquos clustering algorithm forvisualization of studentsrsquo cognitive structural models aboutaliveness conceptrdquo Computational Intelligence and Neurosci-ence vol 2016 Article ID 2476256 14 pages 2016
[20] B E Husic and V S Pande ldquoWard clustering improves cross-validated markov state models of protein foldingrdquo Journal ofChemicaleory and Computation vol 13 no 3 pp 963ndash9672017
[21] A J Gomez-Nuntildeez B Vargas-Quesada and F de Moya-Anegon ldquoUpdating the SCImago journal and country rankclassification a new approach using Wardrsquos clustering andalternative combination of citation measuresrdquo Journal of theAssociation for Information Science and Technology vol 67no 1 pp 178ndash190 2015
[22] O Arbelaitz I Gurrutxaga and J Muguerza ldquoAn extensivecomparative study of cluster validity indicesrdquo Pattern iden-tification vol 46 no 1 pp 243ndash256 2013
14 Computational Intelligence and Neuroscience
[23] S Łukasik and P A Kowalski ldquoClustering using flowerPollination algorithm and calinski-harabasz indexrdquo IEEECongress on Evolutionary Computation (CEC) pp 2724ndash27282016
[24] R Cordeiro de Amorim and C Hennig ldquoRecovering thenumber of clusters in data sets with noise features usingfeature rescaling factorsrdquo Information Sciences vol 324pp 126ndash145 2015
[25] P J Rousseeuw ldquoSilhouettes a graphical aid to the in-terpretation and validation of cluster analysisrdquo Journal ofComputational and Applied Mathematics vol 20 no 20pp 53ndash65 1987
[26] D L Davies and D W Bouldin ldquoA cluster separationmeasurerdquo IEEE Transactions on Pattern Analysis andMachineIntelligence PAMI-1 no 2 pp 224ndash227 1979
[27] R Tibshirani G Walther and T Hastie ldquoEstimating thenumber of clusters in a data set via the gap statisticrdquo Journal ofthe Royal Statistical Society vol 63 no 2 pp 411ndash423 2001
[28] S R Mohanty P K Ray N Kishor and B K PanigrahildquoClassification of disturbances in hybrid DG system usingmodular PNN and SVMrdquo International Journal of ElectricalPower and Energy Systems vol 44 no 1 pp 764ndash777 2013
[29] S Wang X Li S Zhang J Gui and D Huang ldquoTumorclassification by combining PNN classifier ensemble withneighborhood rough set based gene reductionrdquo Computers inBiology and Medicine vol 40 no 2 pp 179ndash189 2010
[30] J Iounousse S Er-Raki and A E Motassadeq ldquoUsing anunsupervised approach of Probabilistic Neural Network(PNN) for land use classification from multitemporal satelliteimagesrdquo Applied Soft Computing vol 30 pp 1ndash13 2015
[31] A T C Goh ldquoProbabilistic neural network for evaluatingseismic liquefaction potentialrdquo Canadian Geotechnical Jour-nal vol 39 no 1 pp 219ndash232 2002
[32] K C Gryllias and I A Antoniadis ldquoA Support VectorMachine approach based on physical model training forrolling element bearing fault detection in industrial envi-ronmentsrdquo Engineering Applications of Artificial Intelligencevol 25 no 2 pp 326ndash344 2012
[33] J Zarei M Amin Tajeddini and H Reza Karimi ldquoVibrationanalysis for bearing fault detection and classification using anintelligent filterrdquo Mechatronics vol 24 no 2 pp 151ndash1572014
[34] L Cannon Robert V Dave Jitendra J C Bezdek andM M Trivedi ldquoSegmentation of a thematic Mapper imageusing fuzzy c-means clustering algorithmrdquo IEEE Transactionson Geoscience and Remote Sensing vol GE-24 no 3pp 400ndash408 1986
Computational Intelligence and Neuroscience 15
Computer Games Technology
International Journal of
Hindawiwwwhindawicom Volume 2018
Hindawiwwwhindawicom
Journal ofEngineeringVolume 2018
Advances in
FuzzySystems
Hindawiwwwhindawicom
Volume 2018
International Journal of
ReconfigurableComputing
Hindawiwwwhindawicom Volume 2018
Hindawiwwwhindawicom Volume 2018
Applied Computational Intelligence and Soft Computing
thinspAdvancesthinspinthinsp
thinspArtificial Intelligence
Hindawiwwwhindawicom Volumethinsp2018
Hindawiwwwhindawicom Volume 2018
Civil EngineeringAdvances in
Hindawiwwwhindawicom Volume 2018
Electrical and Computer Engineering
Journal of
Journal of
Computer Networks and Communications
Hindawiwwwhindawicom Volume 2018
Hindawi
wwwhindawicom Volume 2018
Advances in
Multimedia
International Journal of
Biomedical Imaging
Hindawiwwwhindawicom Volume 2018
Hindawiwwwhindawicom Volume 2018
Engineering Mathematics
International Journal of
RoboticsJournal of
Hindawiwwwhindawicom Volume 2018
Hindawiwwwhindawicom Volume 2018
Computational Intelligence and Neuroscience
Hindawiwwwhindawicom Volume 2018
Mathematical Problems in Engineering
Modelling ampSimulationin EngineeringHindawiwwwhindawicom Volume 2018
Hindawi Publishing Corporation httpwwwhindawicom Volume 2013Hindawiwwwhindawicom
The Scientific World Journal
Volume 2018
Hindawiwwwhindawicom Volume 2018
Human-ComputerInteraction
Advances in
Hindawiwwwhindawicom Volume 2018
Scientic Programming
Submit your manuscripts atwwwhindawicom

0
50
100
150
755
575
2714
Figure 5 e dendrogram of the signals after using the WCM
2 4 6 8
CH v
alue
s
200
250
300
350
400
450
500
550
K
(a)
2 4 6 8
DB
valu
es
12
13
14
15
16
17
18
19
K
(b)
2 4 6 8
Silh
val
ues
02
025
03
035
04
045
05
K
(c)
0 2 4 6 8 10
Gap
val
ues
02
04
06
08
1
12
14
K
(d)
Figure 6 e number of clusters K versus the dierent evaluation indexes (a) e number of clusters K versus CH values (b) e numberof clusters K versus DB values (c) e number of clusters K versus Silh values (d) e number of clusters K versus Gap values
ndash500
50100
020
4060
80ndash20
0
20
40
60
80
XY
Z
class1class2class3
class4class5
(a)
050
100
020
4060
80ndash20
0
20
40
60
80
XY
Z
class1class2class3
class4class5
(b)
050
100
ndash200
2040
600
20
40
60
80
XY
Z
class1class2class3
class4class5
(c)
Figure 7e scatter plots of classication results (a)e classied results when a1 245 a2 562 a3 720 (b)e classied results whena1 268 a2 369 a3 547 (c) e classied results when a1 139 a2 367 a3 741
Computational Intelligence and Neuroscience 9
similar and the separations of them are obvious ereforethe proposed methods can eectively distinguish signalsfrom dierent emitters
4 Identification Scheme and Experiments ofEmitter Signals
41 Flowchart and Algorithms of Identi cation SchemeBesides classication data identication is an importantfunction of PNN Since PNN is based on the maximumposterior probability it will give the optimal solution underthe Bayesian criterion whether or not the samples to beidentied Ixi belong to the ve determined classes that havebeen obtained in Section 3 So if a sample belongs to one ofthem it will accurately identify it However it may lose itsfunction when the sample do not belong to them At thistime the amplitude spectrum of all samples can be analyzedbefore so that they can be identied whether they belong tothe determined classes in advance Considering that it isdicult to comparatively analyze the amplitude spectrum ofthe signals to be identied and each signal in every class weadopt the curve tting method to nd the feature sequencesof each class and the signals to be identied Finally thecorrelation degree of these sequences is calculated to get thepreliminary identity information of the samples to beidentied is method is called Bivariable correlationanalysis and it is introduced as follows
Step 1 Simplifying amplitude spectrum Let Li represent thelength of the signal Ixi Fsi represent the Fourier transform ofIxi |Fsi| is the amplitude spectrum of Ixi |Fsi| [gi(1)gi(2) middot middot middotgi(Li)] e sequence Fi of length N2 is extractedfrom |Fsi| which takes ΔTi as the step size where ΔTi ordmLiN2
Oslash
For each training sample xkl in class k the corre-sponding sequence Fkl can be obtained according to the samemethod where k 1 2 middot middot middot Klowast l 1 2 middot middot middot L i 1 2 middot middot middot pand L represents the number of training samples in class kand p represents the number of samples to be identied
Step 2 Fitting curve e tting curve zi can be obtained bytting the sequence Fi and the tting curve ykl in class k canbe obtained by tting the sequence Fkl
Step 3 Constructing the feature sequence First for dierentk ykl(t) t 1 2 middot middot middot T can be calculated after giving the
upper bound T en the tth signal feature of the class k canbe obtained by the following equation
Yk(t) 1LsumL
l1ykl(t) (22)
Finally Cs(k) Yk(1) Yk(2) middot middot middot Yk(T) is the featuresequence of the class k Similarly the feature sequences Zi Zi(1) Zi(2) middot middot middot Zi(T) (i 1 2 middot middot middot p) of the samples tobe identied can be obtained
Step 4 Correlation analysis e correlation coecient be-tween theZi and theCs(k) can be calculated as the followingequation
rik T sumTt1Yk(t) middot Zi(t)( )minus sumTt1Yk(t)( ) middot sumTt1Zi(t)( )
T sumTt1Y
2k(t)( )minus sumTt1Yk(t)( )
2[ ] middot T sumTt1Z
2i (t)( )minus sumTt1Zi(t)( )
2[ ]
radic
(23)
where T(sumTt1Yk(t) middot Zi(t))minus (sumTt1Yk(t)) middot (sum
Tt1Zi(t))
represents the sample covariance of Cs(k) and Zi[T(sumTt1Y
2k(t))minus (sum
Tt1Yk(t))
2] and [T(sumTt1Z2i (t))minus
(sumTt1Zi(t))2] are the sample standard variation of Cs(k) and
Zi respectively e performance of the correlation testindicates that the sample to be identied belongs to thecorresponding class when rge 095 All samples that do notsatisfy this condition should be removed Finally theremaining samples can be eectively identied by thetrained PNN e owchart of the proposed identicationscheme is shown in Figure 8
Figure 8 shows that the owchart mainly includes twoblocks One is the preidentication module and the other isthe identication module e role of the previous module isto eliminate the sample with a small correlation to thedetermined classes When the correlations between thesamples to be identied and several dierent classes are highPNN will accurately identify it based on Bayesian criteriae pseudocodes are given in Algorithm 3 which is calledidentication algorithm
rough the methods proposed in Section 3 all signalsamples have been classied to ve classes at is to say theidentity of each sample has been determined us theidentication algorithm consists of two parts On the onehand some proximity points xkl around the center ck of classk are selected to train PNN k 1 2 middot middot middot Klowast l 1 2 middot middot middot Lxkl is the input vector of the network and its label is
Samples to beidentified Ixi
(i = 1 2 hellip p)
Amplitude spectrum
Fitting curves
Training samplexkl of Class k
(k = 1 2 hellip Klowast)
Amplitude spectrum
Fitting curves
Correlation testing
Passed PNN
No Dont belongto class k
Pre-identification module
Identification module
Feature sequence
Feature sequenceof the class k
Outputresults
Figure 8 Flowchart of signal identication
10 Computational Intelligence and Neuroscience
the output of the system On the other hand the trainedPNN classier is used to determine the identity of Ixii 1 2 middot middot middot p
If the dimension of Ixi is greater than xkl the method ofadding time window can be used to adjust their di-mensions Let Dx represent the dimension of xkl and DIxrepresent the dimension of Ixi e time window Ts ordmDIxDx
Oslash
is used to reduce the value of DIx us theadjusted samples to be identied Ixi [Ixi(1) Ixi(1) +Ts middot middot middot Ixi(1) + (Dx minus 1)Ts] When DIx ltDx the samemethod can be used to reduce the dimension of xkl andmake it consistent with DIx At this moment DIx and Dxneed to be exchanged
42 Identi cation Experiments By adjusting some param-eters of emitters such as pulse width and output powersignals that are dierent from yi(i 1 2 middot middot middot 500) can beobtained Suppose that sample Ixi(i 1 2 3 4) is randomlyselected from these signals for identication and the di-mension of Ixi is 10240 xkl represents the lth training
sample in class k Bxkl is the label matrix FirstIxi [Ixi(1) Ixi(1) + 10 middot middot middot Ixi(1) + 10230] can beobtained according to the method of adding time windowen the single-sided amplitude spectrum of center ck forclass k is shown in Figure 9 k 1 2 middot middot middot 5 e double-sidedamplitude spectrumof Ixi(i 1 2 3 4) is shown in Figure 10Finally the identity of Ixi(i 1 2 3 4) is preliminary de-termined by observing the similarity between these amplitudespectrum
It is observed that the amplitude spectrum of Ix1 issimilar to that of the signals in class 2 or class 3 and Ix2 islikely to belong to class 5 But the class of Ix3 and Ix4 isdicult to determine only by observation At this time it isnecessary to carry out correlation test for these samples etest results are shown in Table 1 when N2 300 andT 100
Table 1 shows that r12 09704 and r13 09945 whichare all greater than 095 So Ix1 might be the element of class2 or class 3 Ix2 should be classied into class 5ese resultsare consistent with the observations Ix3 and Ix4 should beremoved before formal classication erefore it is
0 2 4 60
50
100
150
200
250
300
350
400
Frequency (Hz)
Am
plitu
de
Class 1
times 105
(a)
times 105
0 2 4 60
50
100
150
200
250
300
Frequency (Hz)
Am
plitu
de
Class 2
(b)
times 105
0 2 4 60
10
20
30
40
50
60
70
80
Frequency (Hz)
Am
plitu
de
Class 3
(c)
times 105
0 2 4 60
20
40
60
80
100
120
140
Frequency (Hz)
Am
plitu
de
Class 4
(d)
times 105
0 2 4 60
50
100
150
200
250
300
350
Frequency (Hz)
Am
plitu
de
Class 5
(e)
Figure 9 e single-sided amplitude spectrum of class k k 1 2 middot middot middot 5 (a) k 1 (b) k 2 (c) k 3 (d) k 4 (e) k 5
Input e training samples xkl label matrix BxklSamples to be identied Ixi
Output Ixi is the element of the class kNormalize xkl IxiCreate PNN model by using xkl and BxklAdjust the dimension of Ixi to make it consistent with the xklDetermining sequences Fi and FklCompute tting curves zi yklCreate feature sequences Cs(k) ZiCompute rik and if rik ge 095 then
Put the Ixi into the trained PNNelse
Ixi does not belong to any classEnd Identication algorithm
ALGORITHM 3 Identication algorithm
Computational Intelligence and Neuroscience 11
necessary to identify Ix1 and Ix2 by using PNN L points areselected as training samples in each class to train PNNL 70 Finallye trained PNN is used to judge the identityof Ix1 and Ix2 Since Ix1 corresponds to Ix1 Ix2 corre-sponds to Ix2 we can obtained the identity of Ix1 and Ix2 byidentifying Ix1 and Ix2 e identied results are shown inFigure 11 when σ 1
In order to obtain intuitive results the data on columns41 256 682 of Ix1 are selected to form a three-dimensionalarray [Ix1(41) Ix1(256) Ix1(682)] Data on the samecolumns of Ac are selected to form a matrix of size 500 times 3All data are drawn in Figure 11(a) Obviously Ix1 should bethe element in class 3 (black solid ball) and Ix2 should bethe element in class 5 (red solid ball) e same results canalso be obtained when the data on columns 35 709 and 929of Ix1 and Ac are selected e corresponding results aredrawn in Figure 11(b)
5 Comparative Experiments
e performance of the proposed algorithm can be reectedthrough comparative experiments erefore it is necessaryto compare it with some usual identication methods suchas support vector machine based schemes [32] particleswarm optimization and support vector machine basedschemes [12] articial neural networks and intelligent lterbased schemes [33] PNN and simplied fuzzy adaptiveresonance theory map neural networks based schemes [15]and fuzzy c-means based schemes [34] When the class label
of each signal is known the performance of the abovemethods can be compared by calculating the classicationaccuracy and the identication accuracy e comparisonresults are shown in Table 2 e samples that cannot becorrectly judged are shown in Figure 12
Table 2 shows that the classication accuracy obtainedfrom Liursquos and our methods is 100 e value of identi-cation accuracy obtained from the proposed method alsoreaches 100 Figure 12(a) shows that some algorithms failto give the correct classication results for some signals Interms of signal classication the number of samples withoutcorrect classication for each method is 9 0 18 11 27 and0 By comparison the identication accuracy derived fromZareirsquos and Cannonrsquos scheme is poor and they fail to identifythe sample 3 and 4 (Figure 12(b)) is is mainly becausearticial neural networks and fuzzy c-means algorithm cangive a judgment result for each signal whether or not thesignal belongs to the determined classes Although the PNNhas some similar problems they can be skillfully solved bythe method of Bivariable correlation analysis It makes theproposed method have unique advantages in signalidentication
6 Concluding Remarks
It is an indisputable fact that the probabilistic neural net-works can be used to classify and identify patterns It hasa wide range of application including the identication ofemitter signals In this paper a novel classication and
0 2 4times105
0
5
10
15
20
25
30
Frequency (Hz)
Am
plitu
deSample 1
(a)
times105
0 2 40
5
10
15
20
25
30
Frequency (Hz)
Am
plitu
de
Sample 2
(b)
times105
0 2 40
5
10
15
20
25
30
Frequency (Hz)
Am
plitu
de
Sample 3
(c)
times105
0 2 4
20
40
60
80
100
120
140
Frequency (Hz)
Am
plitu
de
Sample 4
(d)
Figure 10 e double-sided amplitude spectrum of Ixi(i 1 2 3 4) (a) i 1 (b) i 2 (c) i 3 (d) i 4
Table 1 Correlation test of the samples to be identied
rik Class 1 Class 2 Class 3 Class 4 Class 5Ix1 03687 09704 09945 05473 06910Ix2 07991 07447 06674 07882 09941Ix3 02364 08907 07982 05202 05583Ix4 07864 03572 03083 06887 06841
12 Computational Intelligence and Neuroscience
020
4060
80
ndash200
2040
60ndash20
0
20
40
60
XY
Z
class1class2class3class4
class5sample1sample2
(a)
ndash200
2040
60
ndash200
2040
60ndash20
0
20
40
60
XY
Z
class1class2class3class4
class5sample1sample2
(b)
Figure 11 e identied results of [Ixi(a1) Ixi(a2) Ixi(a3)] i 1 2 (a) a1 41 a2 256 a3 682 and i 1 (b) a1 35 a2 709a3 929 and i 2
Table 2 Accuracy comparison of dierent methods (K 5)
Literature Grylliasrsquos [32] Liursquos [12] Zareirsquos [33] Jaouherrsquos [15] Cannonrsquos [34] is workClassication accuracy () 9820 10000 9640 9780 9460 10000Identication accuracy () 7500 7500 5000 7500 5000 10000
1 2 3 4 5 6 70
50100150200250
300350400450500
Schemes
Sam
ple n
umbe
r
1-Gryllias3-Zarei
4-Jaouher5-Cannon
(a)
1 2 3 4 5 6 71
2
3
4
5
6
7
Schemes
Iden
tific
atio
n sa
mpl
e num
ber
1-Gryllias2-Liu3-Zarei
4-Jaouher5-Cannon
(b)
Figure 12 e samples that cannot be judged correctly by dierent schemes (a) e samples that cannot be correctly classied (b) esamples that cannot be correctly identied
Computational Intelligence and Neuroscience 13
identification scheme which is designed by the WCM andthe PNN with correlation analysis has been proposed foremitter signals e scheme starts with self-adaptive filteringprocessing and spectrum analysis then the WCM andclustering validity indexes including CH Silh DB and Gapare utilized to determine the range of the optimal number ofclusters For different classification number K 70 samplesnearby each center are selected as training samples to es-tablish PNN classifiers Finally the optimal PNN classifierwhich is used to identify signals is determined by themaximum of the classification validity index D(K) At thisstage the method of Bivariable correlation analysis iscleverly used to improve the identification accuracy of PNNclassifier Experiments show that the proposed method canobtain higher accuracy and it is more stable than otherschemes in identification problems
Finally it should be pointed out that the scheme pre-sented above is mainly used to classify the obtained signalswhich are derived from some pulse emitters e classifi-cation and identification of signals derived from somecontinuous wave emitters or the mixed emitters of these twotypes are the next topic to be studied In addition theproposed method can also be used to identify other signalssuch as biomedical signals and monitoring signals of digitalvirtual assets When the data set to be classified are notnumeric they can first be converted to binary string andthen converted to the required format
Data Availability
Data involve secrets and need to be kept confidential
Conflicts of Interest
e authors declare that there are no conflicts of interestsregarding the publication of this paper
Acknowledgments
is study was funded in part by the National Key Researchand Development Program of China under Grant2016YFB0800601 and in part by the National Natural ScienceFoundation of China under Grants 61472331 and 61772434
References
[1] N Visnevski Syntactic Modeling of Multi-Function RadarsPhDrsquos thesis McMaster University 2005
[2] A Wang and V Krishnamurthy ldquoreat estimation of multi-function radars modeling and statistical signal processing ofstochastic context free grammarsrdquo in Proceedings of IEEEInternational Conference on Acoustics Speech and SignalProcessing (ICASSP) pp 793ndash796 Honolulu HI USA 2007
[3] L Dai B Wang and B Cai ldquoA method for states estimationof multi-function radar based on stochastic context freegrammarrdquo Journal of Air Force Engineering University vol 15no 3 pp 31ndash39 2014
[4] M Jan and L Paradowski ldquoA knowledge based approach foremitter identificationrdquo in Proceedings of International Con-ference on Microwaves and Radar (MIKONrsquo98) vol 3pp 810ndash814 Krakow Poland 1998
[5] M Jan Specific Emitter Identification in Proceedings of In-ternational Radar Symposium pp 1ndash4 Krakow Poland 2008
[6] J Dudczyk ldquoe concept of ELINT DataBase based on ERDmodellingrdquo Elektronika vol 2018 pp 34ndash37 2018
[7] C S Shieh and C T Lin ldquoA vector network for emitteridentificationrdquo IEEE Transactions on Antennas and Propa-gation vol 50 no 8 pp 1120ndash1127 2002
[8] B Tang and H Guang rui ldquoRecognition of radar signal usingimmune RBF networkrdquo Journal of Data Acquisition andProcessing vol 17 no 4 pp 371ndash375 2002
[9] J Dudczyk ldquoA method of feature selection in the aspect ofspecific identification of radar signalsrdquo Bulletin of the PolishAcademy of Sciences Technical Sciences vol 65 no 1pp 113ndash119 2017
[10] G Zhang Y Zhou and W Jiang ldquoA method of Radiatoridentification based on Bayes theoryrdquo Signal Processingvol 20 no 4 pp 350ndash352 2004
[11] G X Zhang H N Rong and W D Jin ldquoApplication ofsupport vector machine to radar emitter signal recognitionrdquoJournal of Southwest Jiaotong University vol 41 no 1pp 25ndash30 2006
[12] Z Liu H Cao X Chen and Z He ldquoMulti-fault classificationbased on wavelet SVM with PSO algorithm to analyze vi-bration signals from rolling element bearingsrdquo Neuro-computing vol 99 no 1 pp 399ndash410 2013
[13] Q Liu ldquoA novel radar emitters scheme recognition algorithmusing support vector machinerdquo Information TechnologyJournal vol 13 no 4 pp 725ndash729 2014
[14] R Hussain ldquoSynthetic Aperture Radar (SAR) images featuresclustering using Fuzzy c-means (FCM) clustering algorithmrdquoComputational Ecology and Software vol 2 no 4 pp 220ndash225 2012
[15] J Ben Ali L Saidi and A Mouelhi ldquoLinear feature selectionand classification using PNN and SFAM neural networks fora nearly online diagnosis of bearing naturally progressingdegradationsrdquo Engineering Applications of Artificial In-telligence vol 42 pp 67ndash81 2015
[16] J Iounousse S Er-Raki and A E Motassadeq ldquoUsing anunsupervised approach of Probabilistic Neural Network(PNN) for land use classification from multitemporal satelliteimagesrdquo Applied Soft Computing vol 30 pp 1ndash13 2015
[17] Z Wu Advanced digital signal processing pp 133ndash135 ChinaMachine Press Beijing China 2009
[18] C Gou and L Yi ldquoA variable step size LMS algorithm basedon bell-shaped functionrdquo Marine Electric and ElectronicEngineering vol 35 no 11 pp 31ndash39 2015
[19] N Yorek I Ugulu andH Aydin ldquoUsing self-organizing neuralnetwork map combined with Wardrsquos clustering algorithm forvisualization of studentsrsquo cognitive structural models aboutaliveness conceptrdquo Computational Intelligence and Neurosci-ence vol 2016 Article ID 2476256 14 pages 2016
[20] B E Husic and V S Pande ldquoWard clustering improves cross-validated markov state models of protein foldingrdquo Journal ofChemicaleory and Computation vol 13 no 3 pp 963ndash9672017
[21] A J Gomez-Nuntildeez B Vargas-Quesada and F de Moya-Anegon ldquoUpdating the SCImago journal and country rankclassification a new approach using Wardrsquos clustering andalternative combination of citation measuresrdquo Journal of theAssociation for Information Science and Technology vol 67no 1 pp 178ndash190 2015
[22] O Arbelaitz I Gurrutxaga and J Muguerza ldquoAn extensivecomparative study of cluster validity indicesrdquo Pattern iden-tification vol 46 no 1 pp 243ndash256 2013
14 Computational Intelligence and Neuroscience
[23] S Łukasik and P A Kowalski ldquoClustering using flowerPollination algorithm and calinski-harabasz indexrdquo IEEECongress on Evolutionary Computation (CEC) pp 2724ndash27282016
[24] R Cordeiro de Amorim and C Hennig ldquoRecovering thenumber of clusters in data sets with noise features usingfeature rescaling factorsrdquo Information Sciences vol 324pp 126ndash145 2015
[25] P J Rousseeuw ldquoSilhouettes a graphical aid to the in-terpretation and validation of cluster analysisrdquo Journal ofComputational and Applied Mathematics vol 20 no 20pp 53ndash65 1987
[26] D L Davies and D W Bouldin ldquoA cluster separationmeasurerdquo IEEE Transactions on Pattern Analysis andMachineIntelligence PAMI-1 no 2 pp 224ndash227 1979
[27] R Tibshirani G Walther and T Hastie ldquoEstimating thenumber of clusters in a data set via the gap statisticrdquo Journal ofthe Royal Statistical Society vol 63 no 2 pp 411ndash423 2001
[28] S R Mohanty P K Ray N Kishor and B K PanigrahildquoClassification of disturbances in hybrid DG system usingmodular PNN and SVMrdquo International Journal of ElectricalPower and Energy Systems vol 44 no 1 pp 764ndash777 2013
[29] S Wang X Li S Zhang J Gui and D Huang ldquoTumorclassification by combining PNN classifier ensemble withneighborhood rough set based gene reductionrdquo Computers inBiology and Medicine vol 40 no 2 pp 179ndash189 2010
[30] J Iounousse S Er-Raki and A E Motassadeq ldquoUsing anunsupervised approach of Probabilistic Neural Network(PNN) for land use classification from multitemporal satelliteimagesrdquo Applied Soft Computing vol 30 pp 1ndash13 2015
[31] A T C Goh ldquoProbabilistic neural network for evaluatingseismic liquefaction potentialrdquo Canadian Geotechnical Jour-nal vol 39 no 1 pp 219ndash232 2002
[32] K C Gryllias and I A Antoniadis ldquoA Support VectorMachine approach based on physical model training forrolling element bearing fault detection in industrial envi-ronmentsrdquo Engineering Applications of Artificial Intelligencevol 25 no 2 pp 326ndash344 2012
[33] J Zarei M Amin Tajeddini and H Reza Karimi ldquoVibrationanalysis for bearing fault detection and classification using anintelligent filterrdquo Mechatronics vol 24 no 2 pp 151ndash1572014
[34] L Cannon Robert V Dave Jitendra J C Bezdek andM M Trivedi ldquoSegmentation of a thematic Mapper imageusing fuzzy c-means clustering algorithmrdquo IEEE Transactionson Geoscience and Remote Sensing vol GE-24 no 3pp 400ndash408 1986
Computational Intelligence and Neuroscience 15
Computer Games Technology
International Journal of
Hindawiwwwhindawicom Volume 2018
Hindawiwwwhindawicom
Journal ofEngineeringVolume 2018
Advances in
FuzzySystems
Hindawiwwwhindawicom
Volume 2018
International Journal of
ReconfigurableComputing
Hindawiwwwhindawicom Volume 2018
Hindawiwwwhindawicom Volume 2018
Applied Computational Intelligence and Soft Computing
thinspAdvancesthinspinthinsp
thinspArtificial Intelligence
Hindawiwwwhindawicom Volumethinsp2018
Hindawiwwwhindawicom Volume 2018
Civil EngineeringAdvances in
Hindawiwwwhindawicom Volume 2018
Electrical and Computer Engineering
Journal of
Journal of
Computer Networks and Communications
Hindawiwwwhindawicom Volume 2018
Hindawi
wwwhindawicom Volume 2018
Advances in
Multimedia
International Journal of
Biomedical Imaging
Hindawiwwwhindawicom Volume 2018
Hindawiwwwhindawicom Volume 2018
Engineering Mathematics
International Journal of
RoboticsJournal of
Hindawiwwwhindawicom Volume 2018
Hindawiwwwhindawicom Volume 2018
Computational Intelligence and Neuroscience
Hindawiwwwhindawicom Volume 2018
Mathematical Problems in Engineering
Modelling ampSimulationin EngineeringHindawiwwwhindawicom Volume 2018
Hindawi Publishing Corporation httpwwwhindawicom Volume 2013Hindawiwwwhindawicom
The Scientific World Journal
Volume 2018
Hindawiwwwhindawicom Volume 2018
Human-ComputerInteraction
Advances in
Hindawiwwwhindawicom Volume 2018
Scientic Programming
Submit your manuscripts atwwwhindawicom
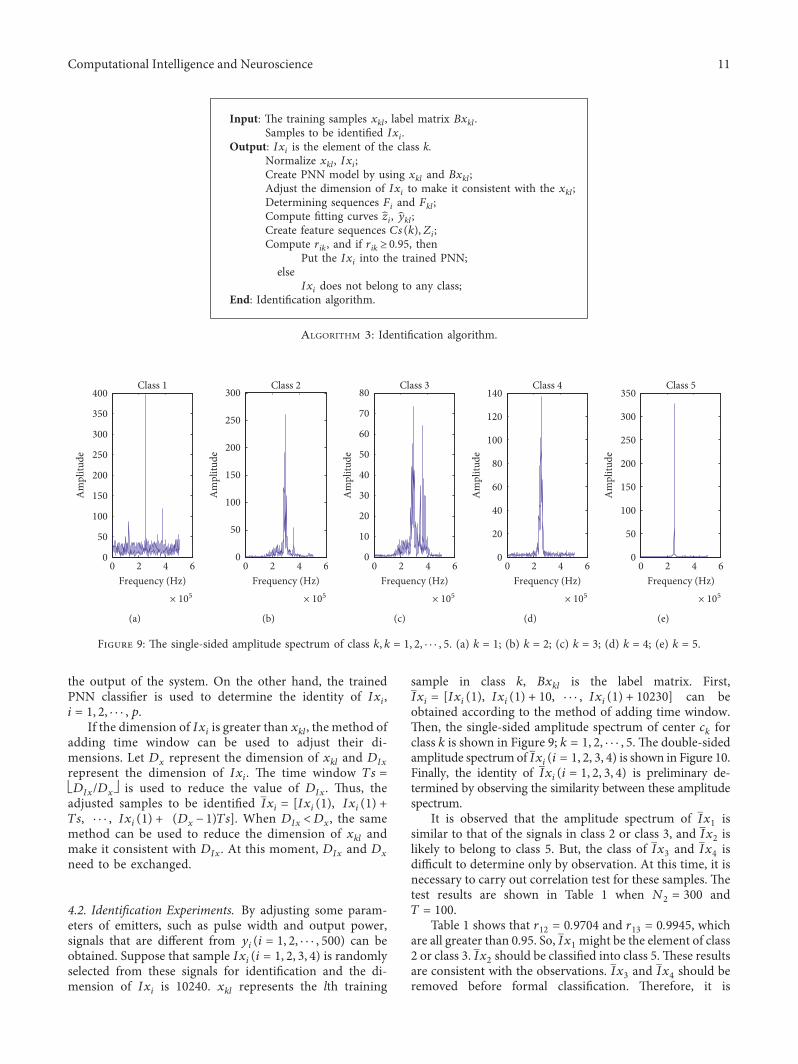
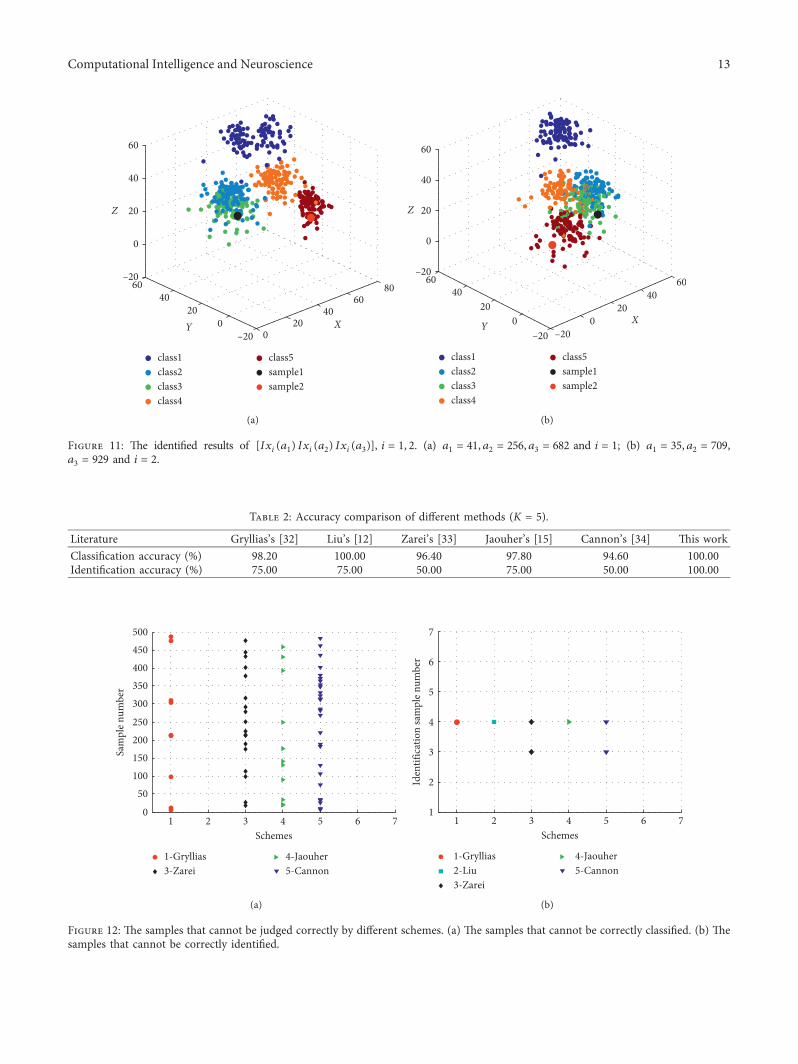