answering descriptive questions in multivariate research when we are studying more than one...
TRANSCRIPT

Answering Descriptive Questions in Multivariate Research
• When we are studying more than one variable, we are typically asking one (or more) of the following two questions:– How does a person’s score on the first variable compare to
his or her score on a second variable?– How do scores on one variable vary as a function of scores
on a second variable?

Making Sense of Scores
• Let’s work with this first issue for a moment. • Let’s assume we have Marc’s scores on his
first two Nursing 320 exams.• Marc has a score of 50 on his first exam and
a score of 50 on his second exam.• On which exam did Marc do best?
GRADE
0 20 40 60 80 100
05
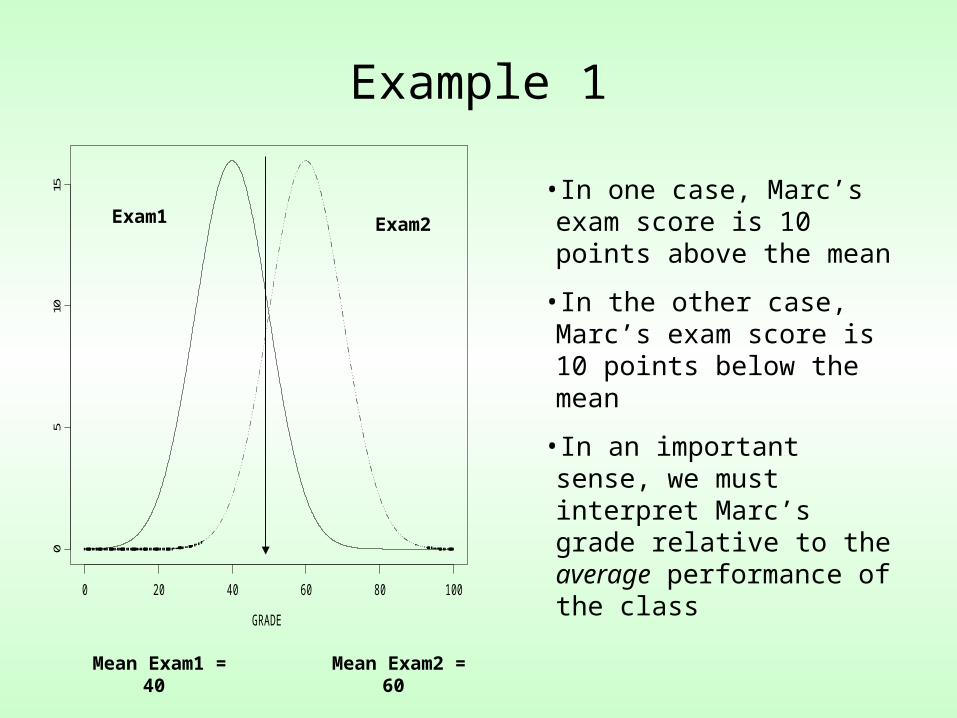
1015 •In one case, Marc’s exam
score is 10 points above the mean
•In the other case, Marc’s exam score is 10 points below the mean
•In an important sense, we must interpret Marc’s grade relative to the average performance of the class
Exam1 Exam2
Mean Exam2 = 60
Example 1
Mean Exam1 = 40
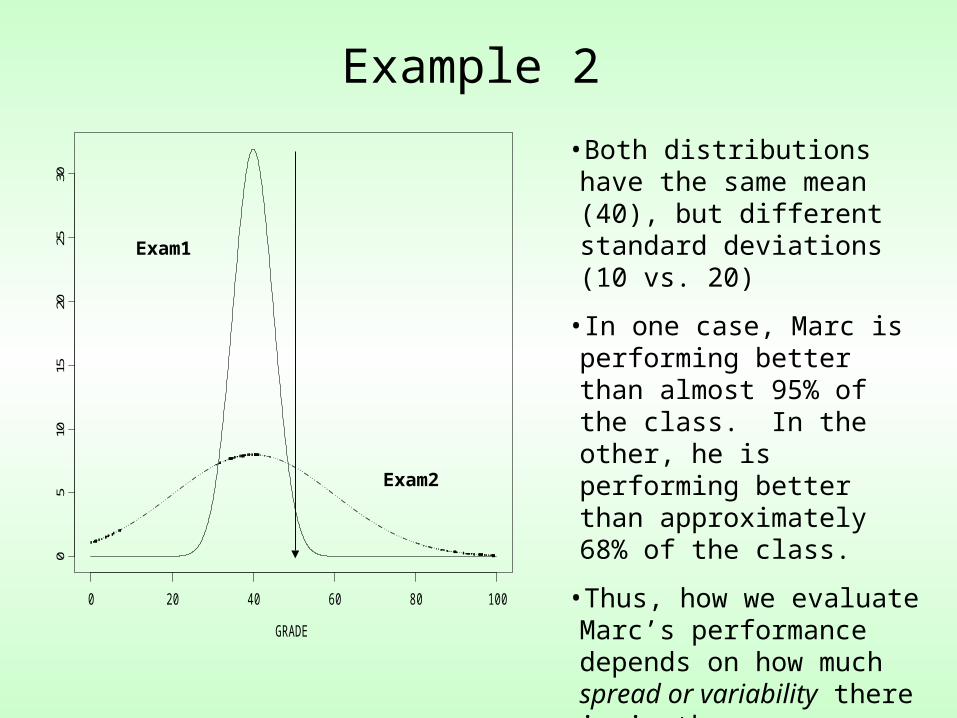
•Both distributions have the same mean (40), but different standard deviations (10 vs. 20)
•In one case, Marc is performing better than almost 95% of the class. In the other, he is performing better than approximately 68% of the class.
•Thus, how we evaluate Marc’s performance depends on how much spread or variability there is in the exam scoresGRADE
0 20 40 60 80 100
05
1015
2025
30Example 2
Exam2
Exam1
Standard Scores
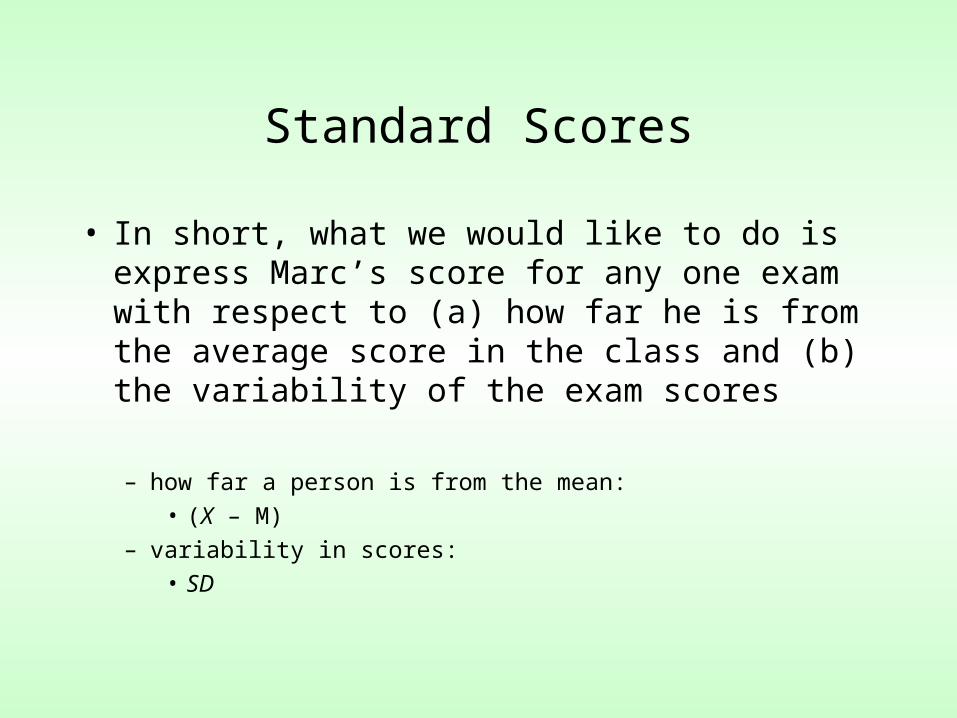
• In short, what we would like to do is express Marc’s score for any one exam with respect to (a) how far he is from the average score in the class and (b) the variability of the exam scores
– how far a person is from the mean: • (X – M)
– variability in scores: • SD

Standard Scores
• Standardized scores, or z-scores, provide a way to express how far a person is from the mean, relative to the variation of the scores.
• (1) Subtract the person’s score from the mean. (2) Divide that difference by the standard deviation.
** This tells us how far a person is from the mean, in the metric of standard deviation units **
Z = (X – M)/SD
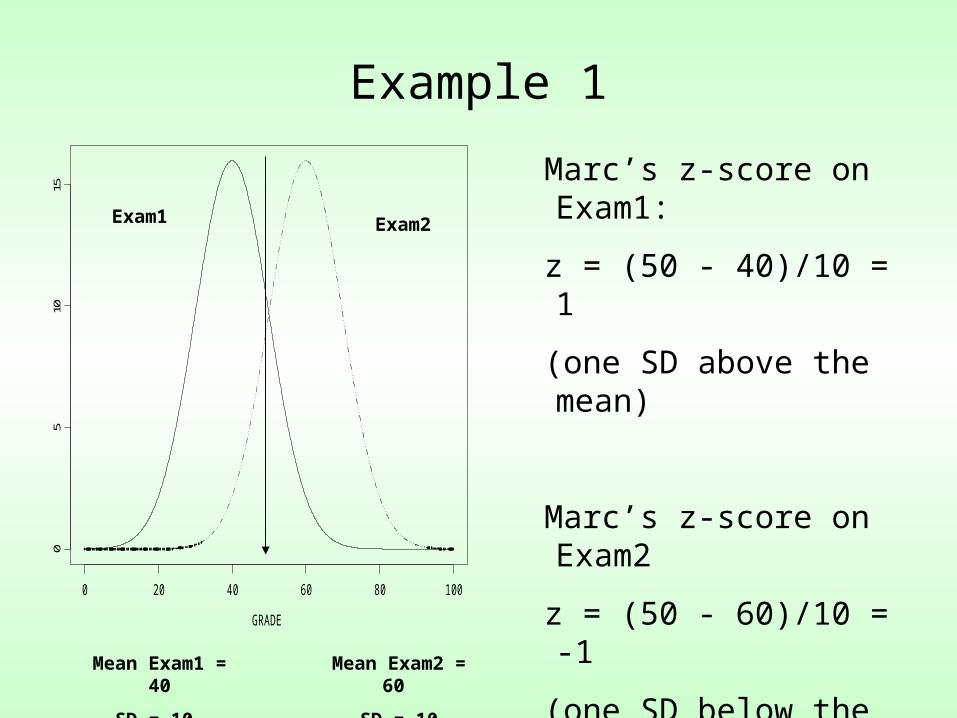
Marc’s z-score on Exam1:
z = (50 - 40)/10 = 1
(one SD above the mean)
Marc’s z-score on Exam2
z = (50 - 60)/10 = -1
(one SD below the mean)
Example 1
GRADE
0 20 40 60 80 100
05
1015
Exam1 Exam2
Mean Exam2 = 60
SD = 10
Mean Exam1 = 40
SD = 10

An example where the means are identical, but the two sets of scores have different spreads
Marc’s Exam1 Z-score
(50-40)/5 = 2
Marc’s Exam2 Z-score
(50-40)/20 = .5GRADE
0 20 40 60 80 100
05
1015
2025
30
Example 2
Exam2
SD = 20
Exam1
SD = 5

Some Useful Properties of Standard Scores
(1) The mean of a set of z-scores is always zero
Why? If we subtract a constant, C, from each score, the mean of the scores will be off by that amount (M – C). If we subtract the mean from each score, then mean will be off by an amount equal to the mean (M – M = 0).
50 60 70 80403020
0 1 2 3-1-2-3
x
z
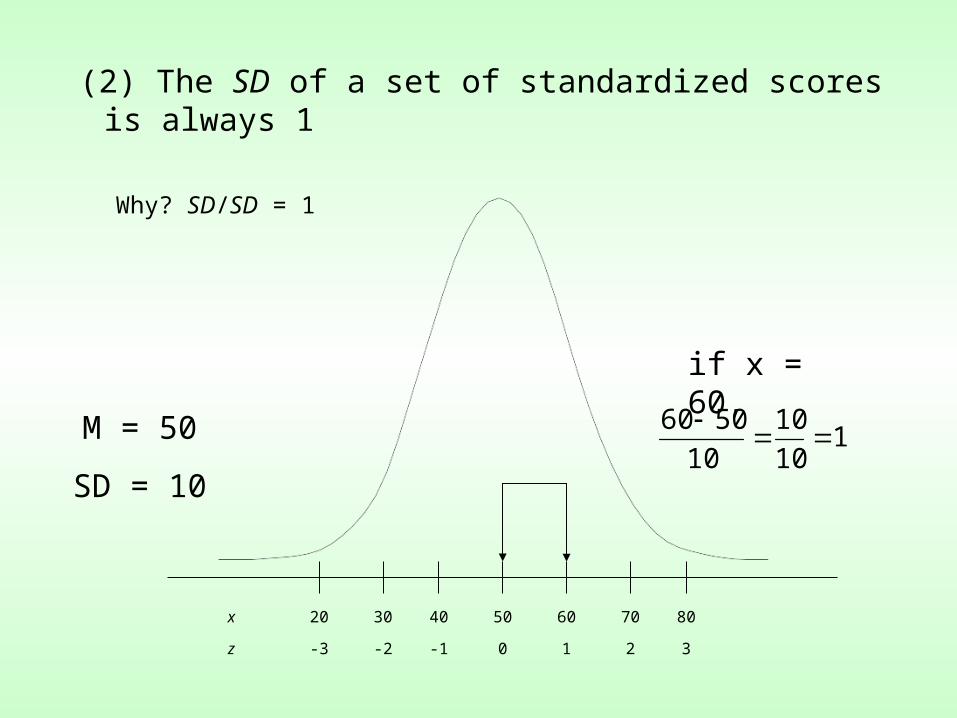
M = 50
SD = 10
if x = 60,
110
10
10
5060
(2) The SD of a set of standardized scores is always 1
Why? SD/SD = 1

SCORE
-4 -2 0 2 4
0.0
0.1
0.2
0.3
0.4
A “Normal” Distribution
(3) The distribution of a set of standardized scores has the same shape as the unstandardized (raw) scores
beware of the “normalization” misinterpretation
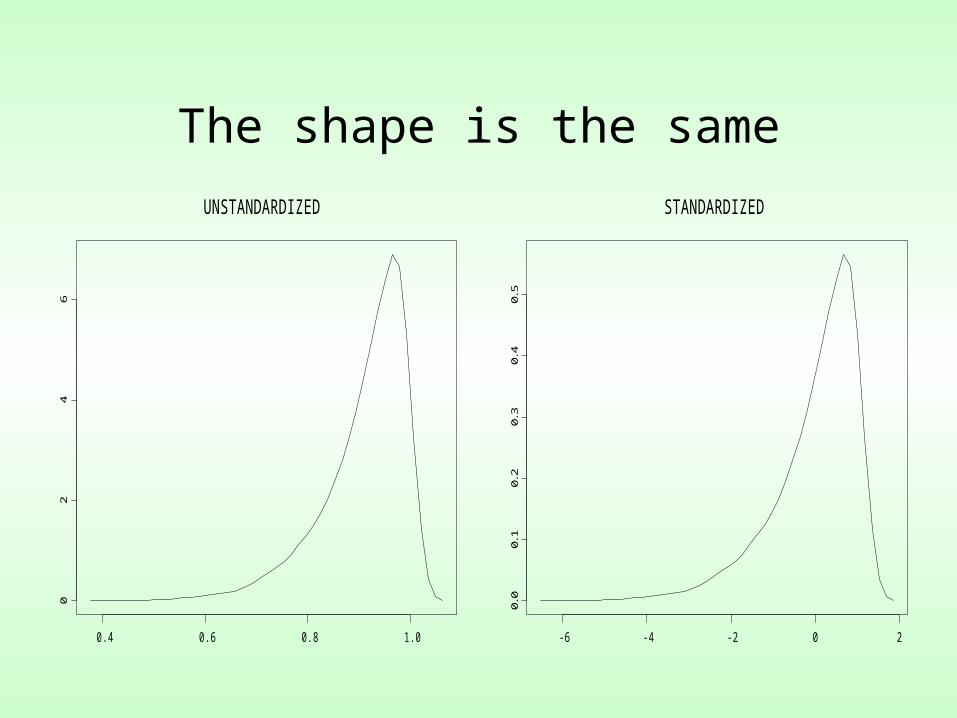
The shape is the same
UNSTANDARDIZED
0.4 0.6 0.8 1.0
02
46
STANDARDIZED
-6 -4 -2 0 2
0.0
0.1
0.2
0.3
0.4
0.5
Some Useful Properties of Standard Scores
(4) Standard scores can be used to compute centile scores: the proportion of people with scores less than or equal to a particular score.

SCORE
-4 -2 0 2 4
0.0
0.1
0.2
0.3
0.4
34% 34%
14%14%
2%2%
50%
The area under a normal curve
Some Useful Properties of Standard Scores
(5) Z-scores provide a way to “standardize” very different metrics (i.e., metrics that differ in variation or meaning). Different variables expressed as z-scores can be interpreted on the same metric (the z-score metric). (Each score comes from a distribution with the same mean [zero] and the same standard deviation [1].)

Examples of Z’s
• Leadership score• Planning ability
Reverse
Z = (X – M)/SD
So
X = M + Z(SD)

In-Class Exercise #1