ant colony optimization based clustering …page 1 of 50 accepted manuscript 1 ant colony...
TRANSCRIPT
Accepted Manuscript
Title: Ant Colony Optimization based Clustering Methodology
Author: Tulin Inkaya Sinan Kayalıgil Nur Evin Ozdemirel
PII: S1568-4946(14)00633-4DOI: http://dx.doi.org/doi:10.1016/j.asoc.2014.11.060Reference: ASOC 2672
To appear in: Applied Soft Computing
Received date: 28-2-2014Revised date: 31-8-2014Accepted date: 17-11-2014
Please cite this article as: T. Inkaya, S. Kayaligil, N.E. Ozdemirel, Ant ColonyOptimization based Clustering Methodology, Applied Soft Computing Journal (2014),http://dx.doi.org/10.1016/j.asoc.2014.11.060
This is a PDF file of an unedited manuscript that has been accepted for publication.As a service to our customers we are providing this early version of the manuscript.The manuscript will undergo copyediting, typesetting, and review of the resulting proofbefore it is published in its final form. Please note that during the production processerrors may be discovered which could affect the content, and all legal disclaimers thatapply to the journal pertain.
Page 1 of 50
Accep
ted
Man
uscr
ipt
1
Ant Colony Optimization based Clustering Methodology
Tülin İnkayaa,*, Sinan Kayalıgilb, Nur Evin Özdemirelb
a Uludağ University, Industrial Engineering Department, Görükle, 16059, Bursa,
TURKEY
b Middle East Technical University, Industrial Engineering Department, Çankaya,
06800, Ankara, TURKEY
E-mail addresses: [email protected] (Tülin İnkaya), [email protected] (Sinan
Kayalıgil), [email protected] (Nur Evin Özdemirel)
* Corresponding author. Tel.: +90 224 2942605. E-mail address: [email protected]
(Tülin İnkaya)
Page 2 of 50
Accep
ted
Man
uscr
ipt
2
Highlights
A novel ACO based methodology, ACO-C, is proposed for the spatial clustering
problem with no a priori information on the number of clusters and the
neighborhoods.
ACO-C addresses several challenging issues of the clustering problem including
solution evaluation, extraction of local properties, scalability and the clustering
task itself.
Two objective functions are proposed to quantify the quality of a clustering
solution with arbitrary shaped clusters and different densities.
ACO-C works in a multi-objective framework, and yields a set of non-dominated
solutions.
Experimental results show that ACO-C outperforms other competing approaches.
Abstract
In this work we consider spatial clustering problem with no a priori information. The
number of clusters is unknown, and clusters may have arbitrary shapes and density
differences. The proposed clustering methodology addresses several challenges of the
clustering problem including solution evaluation, neighborhood construction, and data
Page 3 of 50
Accep
ted
Man
uscr
ipt
3
set reduction. In this context, we first introduce two objective functions, namely adjusted
compactness and relative separation. Each objective function evaluates the clustering
solution with respect to the local characteristics of the neighborhoods. This allows us to
measure the quality of a wide range of clustering solutions without a priori information.
Next, using the two objective functions we present a novel clustering methodology
based on Ant Colony Optimization (ACO-C). ACO-C works in a multi-objective setting
and yields a set of non-dominated solutions. ACO-C has two pre-processing steps:
neighborhood construction and data set reduction. The former extracts the local
characteristics of data points, whereas the latter is used for scalability. We compare the
proposed methodology with other clustering approaches. The experimental results
indicate that ACO-C outperforms the competing approaches. The multi-objective
evaluation mechanism relative to the neighborhoods enhances the extraction of the
arbitrary-shaped clusters having density variations.
Keywords: Clustering, Ant Colony Optimization, Multiple objectives, Data set
reduction.
Page 4 of 50
Accep
ted
Man
uscr
ipt
4
1. Introduction
Cluster analysis is the organization of a collection of data points into clusters
based on similarity [1]. Clustering is usually considered as an unsupervised
classification task. That is, the characteristics of the clusters and the number of clusters
are not known a priori, and they are extracted during the clustering process. In this work
we focus on spatial data sets in which a priori information about the data set (the number
of clusters, shapes and densities of the clusters) is not available. Finding such clusters
has applications in geographical information systems [2], computer graphics [3], and
image segmentation [4]. In addition, clusters of spatial defect shapes provide valuable
information about the potential problems in manufacturing processes of semiconductors
[5, 6].
We consider spatial clustering as an optimization problem. Our aim is to obtain
compact, connected and well-separated clusters. To the best of our knowledge, there is
not a single objective function that works well for any kind of geometrical clustering
structure. Therefore, we first introduce two solution evaluation mechanisms for
measuring the quality of a clustering solution. The main idea behind both mechanisms is
similar, and each mechanism is based on two objectives: adjusted compactness and
relative separation. The first objective measures the compactness and connectivity of a
clustering solution, and the second objective is a measure for separation. The difference
between the two mechanisms is the degree of locality addressed in the calculations. The
main advantage of these objectives is that the length of an edge is evaluated relatively,
that is, it is scaled relative to the lengths of other edges within its neighborhood. This

Page 5 of 50
Accep
ted
Man
uscr
ipt
5
scaling permits us to evaluate the quality of the clustering solution independent of the
shape and density of the clusters.
We implement the proposed solution evaluation mechanisms in a clustering
framework based on Ant Colony Optimization (ACO). In order to find the target
clusters, we use two complementary objective functions (adjusted compactness and
relative separation) in a multiple-objective context. Hence, the output of ACO-C is a set
of non-dominated solutions. Different from the literature, we are not interested in
finding all non-dominated solutions or the entire Pareto efficient frontier. ACO-C has
two pre-processing steps: neighborhood construction and data set reduction.
Neighborhood construction extracts the local connectivity, proximity and density
information inherent in the data set. Data set reduction helps reduce the storage
requirements and processing time for the clustering task. Our experimental results
indicate that ACO-C finds the arbitrary-shaped clusters with varying densities
effectively, where the number of clusters is unknown.
Our contributions to the literature are as follows.
1. The proposed solution evaluation mechanisms allow us to quantify the quality of a
clustering solution having arbitrary-shaped clusters with different densities in an
optimization context. The use of these evaluation mechanisms is not restricted to ACO.
They can be used in other metaheuristics and optimization-based clustering approaches.
2. The proposed ACO-based methodology introduces a general, unified framework for
the spatial clustering problem without a priori information. It includes the solution
evaluation mechanism, extraction of local properties, data set reduction, and the
clustering task itself.
Page 6 of 50
Accep
ted
Man
uscr
ipt
6
3. ACO-C is a novel methodology for the clustering problem in which there is no a
priori information, that is,
the number of clusters is unknown,
clusters may have arbitrary shapes,
there may be density variations within the clusters, and
different clusters may have density differences.
We provide the related literature in Section 2. Section 3 introduces the solution
evaluation mechanisms. The details of ACO-C are explained in Section 4. Section 5 is
about the empirical performance of ACO-C. First, we set the algorithm parameters using
a full factorial design. Then, we compare ACO-C with some well-known algorithms.
Finally, we conclude in Section 6.
2. Related Literature
The clustering algorithms can be classified into partitional, hierarchical, density-
based algorithms, and metaheuristics (simulated annealing, tabu search, evolutionary
algorithms, particle swarm optimization, ACO, and so on). [1], [7] and [8] provide
comprehensive reviews of clustering approaches.
In this section, we present the related literature on the solution evaluation
mechanisms and ant-based clustering algorithms.
2.1. Solution Evaluation Mechanisms
Page 7 of 50
Accep
ted
Man
uscr
ipt
7
A good clustering solution has compact and connected clusters that are well-
separated from each other. However, quantifying and measuring the clustering
objectives (compactness, connectivity and separation) for a data set is not a trivial task.
We review the solution evaluation mechanisms in the literature under four categories:
partitional approaches, graph-based approaches, clustering validity indices, and multi-
objective approaches.
Partitional approaches consider objective functions such as minimization of total
variance/distance between all pairs of data points, or minimization of total
variance/distance between data points and a cluster representative such as k-means [9,
10] or k-medoids [11]. In these approaches, the number of clusters needs to be given as
input, and the resulting clusters have spherical or ellipsoid shapes in general.
In order to handle the data sets with arbitrary-shaped clusters and density
variations, graph-based approaches are proposed. Objective functions used are
minimization of the maximum edge length in a cluster, maximization of the
minimum/maximum/average distance between two clusters, and so on [12, 13]. A
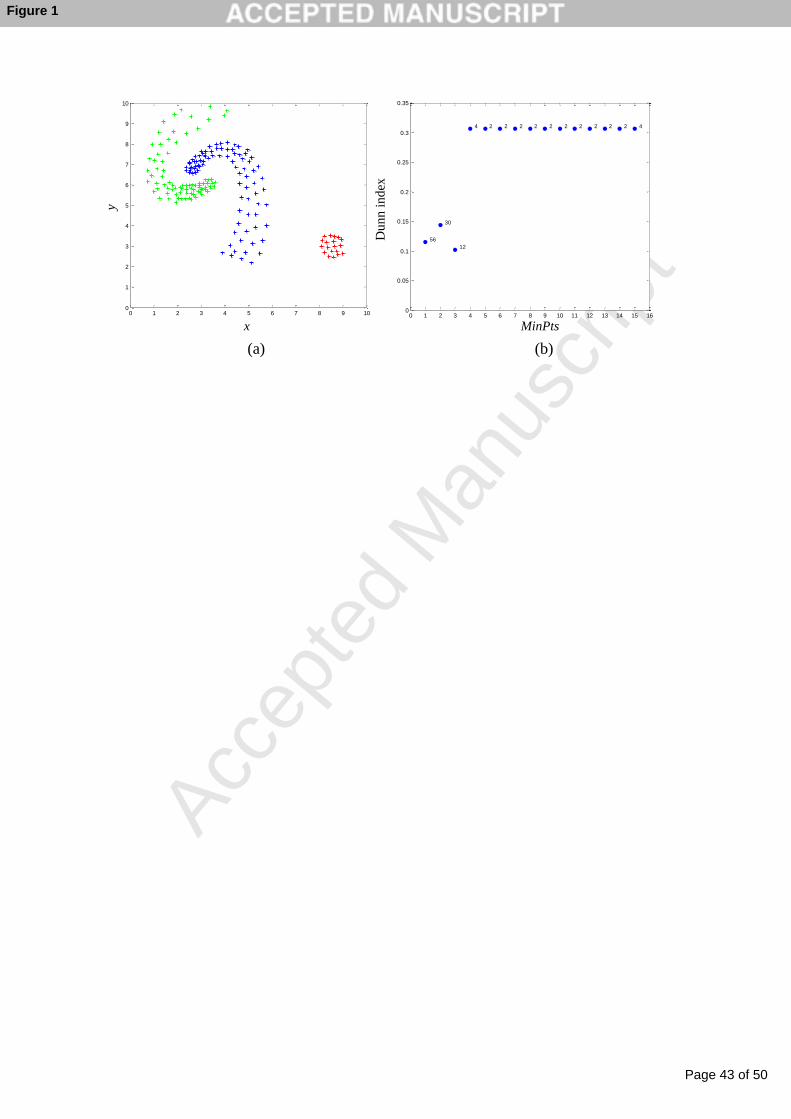
typical complication for such objective functions is illustrated in Figure 1(a). In Figure
1(a) the maximum edge length within the spiral clusters is larger than the distance
between these two clusters. In this case elimination of the longest edge causes division
of the spiral clusters.
Another research stream in solution evaluation makes use of cluster validity
indices. Validity indices are used to quantify the quality of a clustering solution and to
determine the number of clusters in a data set [14, 15]. In an effort to find the target
clusters, some researchers use validity indices as objective functions in genetic
algorithms [16, 17, 18, 19, 20, 21]. However, most of the validity indices assume a
Page 8 of 50
Accep
ted
Man
uscr
ipt
8
certain geometrical structure in the cluster shapes. When a data set includes several
different cluster structures, such as arbitrary shapes and density differences, these
indices may fail. An example is provided in Figure 1(b). The clustering solutions
generated by DBSCAN [22] are evaluated using Dunn index [23] with different MinPts
settings (within a range of 1 to 15). The number of clusters found with each setting is
shown, e.g. 30 clusters are found when MinPts is set to two. Dunn index measures the
minimum separation to maximum compactness ratio, so a higher Dunn index implies
better clustering. Although the highest Dunn index (0.31) is achieved for the solutions
with two and four clusters, the target solution has three clusters with a Dunn index of
0.09. Hence, Dunn index is not a proper objective function for such a data set.
[24] evaluates the performance of three clustering algorithms, namely k-means,
single-linkage, and simulated annealing (SA) by using four cluster validity indices,
namely Davies-Bouldin index, Dunn index, Calinski-Harabasz index, and index I.
Compared to other validity indices, index I is found to be more consistent and reliable in
finding the correct number of clusters. However, the four cluster validity indices are
limited to extracting spherical clusters only. To handle different geometrical shapes, [25]
uses a point symmetry-based distance measure in a genetic algorithm. The algorithm has
difficulty in handling asymmetric clusters and density differences within a cluster.
- Insert Figure 1 here. -
Since a single objective is often unsuitable to extract target clusters, multi-
objective (MO) approaches are considered to optimize several objectives
simultaneously. To the best of our knowledge, VIENNA [26] is the first multi-objective
Page 9 of 50
Accep
ted
Man
uscr
ipt
9
clustering algorithm, which is based on PESA [27]. It optimizes two objective functions,
total intra-cluster variance and connectedness. However, the algorithm requires the
target number of clusters. One of the well-known MO clustering algorithms is the multi-
objective clustering with automatic k-determination (MOCK) [28]. MOCK is based on
evolutionary algorithms, and uses compactness and connectedness as two
complementary objective functions. It can detect the number of clusters in the data set.
The output of the algorithm is a set of non-dominated clustering solutions. However, it is
capable of finding well-separated clusters having hyperspherical shapes. Improvements
in this algorithm and its applications have been investigated [29, 30]. [31] also considers
the clustering problem in a multi-objective framework. They optimize Xie-Beni (XB)
index [32] and Sym-index [21] simultaneously, and introduce a multi-objective SA
algorithm. This work is also limited to finding symmetric clusters. [33] proposes several
connectivity-based validity indices based on the relative neighborhood graph. In addition
to Sym-index and index I, [34] uses one of the connectivity-based validity indices in [33]
as the third objective. Adding this connectivity measure helps extraction of arbitrary
shapes and asymmetric clusters.
There are additional solution approaches proposed for MO clustering such as
differential evolution [35, 36], immune-inspired method [37], and particle swarm
optimization [38]. In these studies clustering objectives are either cluster validity indices
such as XB index, Sym-index and FCM index, or compactness-connectivity objectives as
in [28].
To the best of our knowledge, [39] is the only study that applies ACO to MO
clustering problem. In this algorithm, there are two ant colonies working in parallel.
Each colony optimizes a single objective function, either compactness or connectedness.
Page 10 of 50
Accep
ted
Man
uscr
ipt
10
The number of clusters is required as input. In addition, they test the proposed algorithm
using the Iris data set only.
2.2. ACO and Ant-based Clustering Algorithms
ACO was introduced by [40, 41, 42]. It is inspired from the behaviors of real
ants. As ants search for food on the ground, they deposit a substance called pheromone
on their paths. The concentration of the pheromone on the paths helps direct the colony
to the food sources. Ant colony finds the food sources effectively by interacting with the
environment. Solution representation, solution construction and pheromone update
mechanisms are the main design choices of ACO.
In the clustering literature, several ant-based clustering algorithms have been
proposed. For a comprehensive review about ant-based and swarm-based clustering one
can refer to [43]. In this study, we categorize the related studies into three: ACO-based
approaches, approaches that mimic ants’ gathering/sorting activities, and other ant-based
approaches.
ACO-based approaches [44, 45, 46, 47, 48, 49, 50, 51, 52] are built upon the
work of [42]. In these studies the total intra-cluster variance/distance is considered as the
objective function, and the number of clusters is required a priori. An ant constructs a
solution by assigning a data point to a cluster. The desirability of assigning a data point
to a cluster is represented by the amount of pheromone. Ants update the pheromone in
an amount proportional to the objective function value of the solution they generate. The
proposed algorithms are capable of finding the clusters with spherical and compact
shapes. There are also hybrid algorithms using ACO [53, 54, 55]. For instance, [53]
Page 11 of 50
Accep
ted
Man
uscr
ipt
11
modifies the k-means algorithm by adding a probabilistic centroid assignment procedure.
[54] introduces a hybridization of ACO and particle swarm optimization (PSO). In this
approach, PSO helps optimize continuous variables, whereas ACO directs the search to
promising regions using the pheromone values. Another hybrid algorithm that combines
k-means, ACO and PSO is [55]. In [55] the cluster centers obtained by ACO and PSO
are used to initialize k-means. In these hybrid studies the number of clusters is required
as input, and the resulting clusters are compact and spherical.
The approaches that mimic ants’ gathering/sorting activities [56] form another
research stream. ACO uses an explicit objective function whereas these approaches have
an implicit objective function, and clusters emerge as the result of the gathering/sorting
activities. An ant picks up a point in the space and drops it off near the points that are
similar to it. These picking up and dropping off operations are performed using the
probabilities that are calculated based on the similarity of the points in the
neighborhood. Hence, ants work as if they are forming a topographic map. After
forming this pseudo-topographic map, a cluster retrieval operation is applied to find the
final clusters. [57] generalizes this method for exploratory data analysis. [58, 59, 60, 61,
62, 63, 64, 65] are the extensions and modifications of the algorithms proposed by [55,
56]. For instance, [60] uses parallel and independent ant colonies aggregated by a
hypergraph model. In [65] the local similarity of a point is measured by entropy rather
than distance.
Other ant-based approaches use the emergent behavior of the ants. [66]
introduces a hierarchical ant-based algorithm to build a decision tree. Ants move a data
point close to the similar points and away from the dissimilar ones on the decision tree.
In [67, 68] ants generate tours by inserting edges between data points. Pheromone is
Page 12 of 50
Accep
ted
Man
uscr
ipt
12
updated for each edge connecting a pair of points. The closer the distance between two
points, the larger the amount of pheromone released. In the first phase of the algorithm,
the edges between similar points become denser in terms of pheromone concentration.
The next phase is the cluster retrieval process by using a hierarchical clustering
algorithm. [69] introduces a clustering approach based on aggregation pheromone.
Aggregation pheromone leads the data points to accumulate around the points with
higher pheromone density. In order to obtain the desired number of clusters, merging
operations are performed using the average-linkage agglomerative hierarchical
clustering algorithm. Another ant-based clustering algorithm is the chaotic ant swarm
optimization proposed by [70]. It combines the chaotic behavior of a single ant and self-
organizing behavior of the ant colony. Given the number of clusters, the proposed
approach optimizes the total intra-cluster variation. Although it provides some
improvement over PSO and k-means, the resulting clusters are still spherical.
3. How to Evaluate a Clustering Solution?
Our aim is to obtain compact, connected and well-separated clusters. For this
purpose, we introduce two solution evaluation mechanisms: Clustering Evaluation
Relative to Neighborhood (CERN) and Weighted Clustering Evaluation Relative to
Neighborhood (WCERN).
3.1. Clustering Evaluation Relative to Neighborhood (CERN)
Adjusted Compactness: This objective is built upon the trade-off between the
connectivity and relative compactness.
Page 13 of 50
Accep
ted
Man
uscr
ipt
13
a) Connectivity: Basically, connectivity is the degree to which neighboring data points
are placed in the same cluster [26, 28]. Then, we first need to define the neighborhood of
a point. There are several neighborhood construction algorithms such as k-nearest
neighbors (KNN), ε-neighborhood [22], NC algorithm [71], and so on. When there are
arbitrary-shaped clusters with density differences, NC outperforms KNN and ε-
neighborhood. It provides a unique neighborhood for each data point. NC also generates
subclusters (closures), which are formed by merging the data points having common
neighbors. These closures can be used as the basis of a clustering solution. For these
reasons, we use the NC algorithm to determine the neighborhoods of individual data
points.
Let Cm and Clp be the sets of points in cluster m and closure p, respectively.
Connectivity of cluster m with respect to closure p is ppmmpconnect ClClC if
pm ClC . In the ideal case, connectivity takes a value of one, which means that
cluster m and closure p fully overlap. The connectivity of cluster m is calculated as
nc
pmpm connectconnect
1
, where nc is the total number of closures. In this calculation,
if pm ClC , then closure p is part of a cluster other than m, and, in this case, we
take 1mpconnect so that the value of mconnect is not affected by such unrelated
closure and cluster pairs. Merging multiple closures that are in the same cluster results in
a connectivity value of one, whereas it is less than one when there are divided clusters.
b) Relative compactness: We define the relative compactness of cluster m as the most
inconsistent edge within its neighborhood. In relative compactness calculation we
consider the edges in the minimum spanning tree (MST) of a cluster. MST is a graph in
Page 14 of 50
Accep
ted
Man
uscr
ipt
14
which the sum of the edge lengths is the minimum, and the graph is connected with no
cycles. These two properties together allow us to define compactness of a cluster in an
efficient way. Then, we compare each edge in the MST with the edges in the
neighborhood. More formally, relative compactness of cluster m is
kl
lk
lk
ij
jim d
dccompr
jm
im
m
)(
)(
MST),(orMST),(
MST),( maxmax__ where (i,j) is the edge between points i and j,
dij is the Euclidean distance between points i and j, MSTm and MSTm(i) are the sets of
edges in the MST of the points in cluster m and in the neighborhood of point i in cluster
m, respectively.
When the number of clusters increases, relative compactness improves
(decreases) whereas the connectivity deteriorates (decreases). Combining connectivity
and compactness, adjusted compactness of cluster m is obtained as
m
mm connect
ccomprcomp
__ . The overall compactness of a clustering solution is found as
mm
compmax .
Relative Separation: A good clustering solution must have well-separated clusters. We
define the relative separation based on the local properties of clusters. Let the nearest
cluster to cluster m be n such that nmjidjnim nmij ,C,C:argmin*))(*),(( .
The relative separation of cluster m is
Page 15 of 50
Accep
ted
Man
uscr
ipt
15
otherwise. ,1
1Cor 1Cif ,max
min__
1CifMST),(or
1CifMST),(
*)(*),(
*)(
*)(
nmkl
lk
lk
jnim
m d
d
csepr
njn
mim
The overall separation of a clustering solution is mm
csepr __min . CERN
minimizes the adjusted compactness and maximizes the relative separation.
3.2. Weighted Clustering Evaluation Relative to Neighborhood (WCERN)
WCERN is similar to CERN; both compactness and separation are calculated
relative to the neighborhoods. The only difference between CERN and WCERN is that
the edge lengths are used as a weight factor in compactness and separation calculations
in WCERN. Hence, relative compactness and relative separation of cluster m are
calculated as
kl
lk
lk
ij
jim d
dwcompr
jm
im
m
)(
)(
MST),(orMST),(
2
MST),( maxmax__ and
otherwise. ,
1Cor 1Cif ,max
min__
*)(*),(
1CifMST),(or
1CifMST),(
2*)(*),(
*)(
*)(
jnim
nmkl
lk
lk
jnim
m
d
d
d
wsepr
njn
mim
Similar to CERN, WCERN minimizes the adjusted compactness, and maximizes
the relative separation.
4. The ACO-based Clustering (ACO-C) Methodology
Page 16 of 50
Accep
ted
Man
uscr
ipt
16
ACO-C is a clustering methodology in a multi-objective framework. It has two
pre-processing steps: neighborhood construction and data set reduction. Neighborhood
construction helps extract the local information inherent in the data set. This local
information is used in the solution evaluation. Data set reduction ensures the scalability
of the approach.
In ACO-C an ant is a search agent. Ants construct tours by inserting edges
between pairs of data points. Connected points in a tour form a cluster. During edge
insertion each point is connected to exactly two points. This makes it easier to extract
arbitrary-shaped clusters and reduces computational requirements.
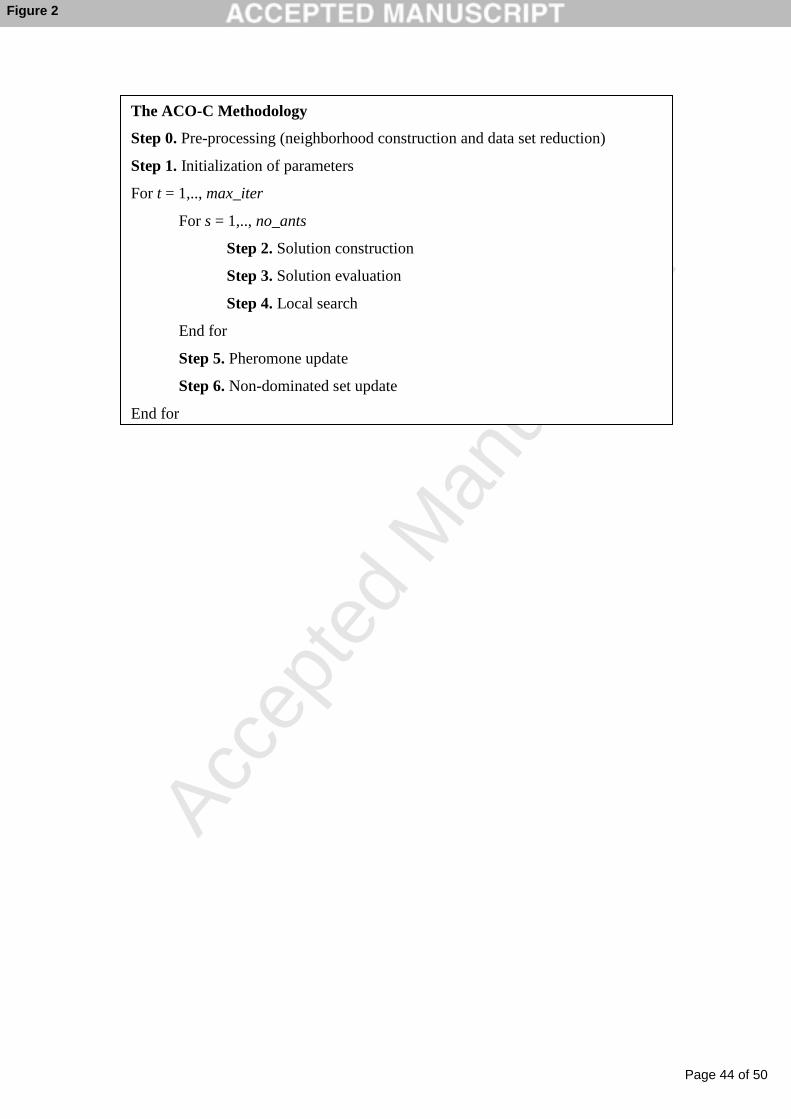
The outline of the ACO-C methodology is presented in Figure 2 where max_iter
and no_ants denote the maximum number of iterations and the number of ants,
respectively.
- Insert Figure 2 here. -
Step 0. Pre-processing
Neighborhood Construction
We construct the neighborhood of each data point and obtain closures
(subclusters) using the NC algorithm [71]. NC closures have two properties: 1) A
closure is either a cluster itself or a subset of a cluster (divided cluster). 2) There may be
an outlier mix on the boundary of a closure. Hence, we focus on the merging operations
and outlier detection in the clustering. In order to allow outlier detection and closure
merging, we extend NC neighborhoods with distant neighbors and nowhere. Distant
neighbors are the nearest pair of data points between two adjacent closures. Nowhere is
Page 17 of 50
Accep
ted
Man
uscr
ipt
17
a dummy point used for outlier detection. If a data point is connected to nowhere twice,
then it is classified as an outlier. If a data point is connected to nowhere once, then it is
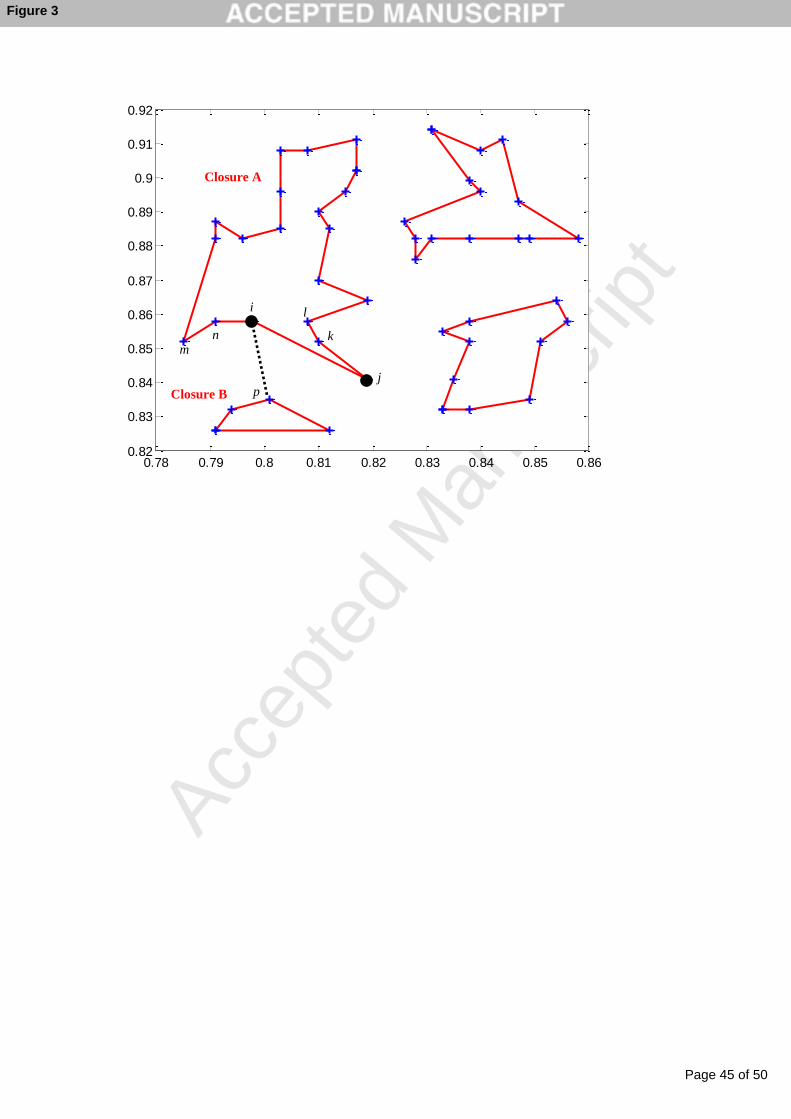
the start/end point of a cluster. An example for neighborhood definition is provided in
Figure 3. Points j, k, l, m and n are neighbors of point i generated by NC, and point p is
the distant neighbor of point i. Neighborhood of point i is extended by point p and
nowhere. Note that not every point has a distant neighbor.
- Insert Figure 3 here. -
Data Set Reduction via Boundary Formation
The interior points of a closure are already connected, hence it is sufficient to
consider only the points on the boundaries of the closures for merging and outlier
detection. Exclusion of interior points in a closure decreases the number of points in a
data set and contributes to the scalability of ACO-C. We use the boundary extraction
algorithm in [72].
Step 1. Initialization of parameters
The parameters of ACO-C, including the number of ants (no_ants), the number
of maximum iterations (max_iter), and the evaporation rate ( ) are initialized. We
conduct a factorial design in Section 5 to determine the values of these parameters.
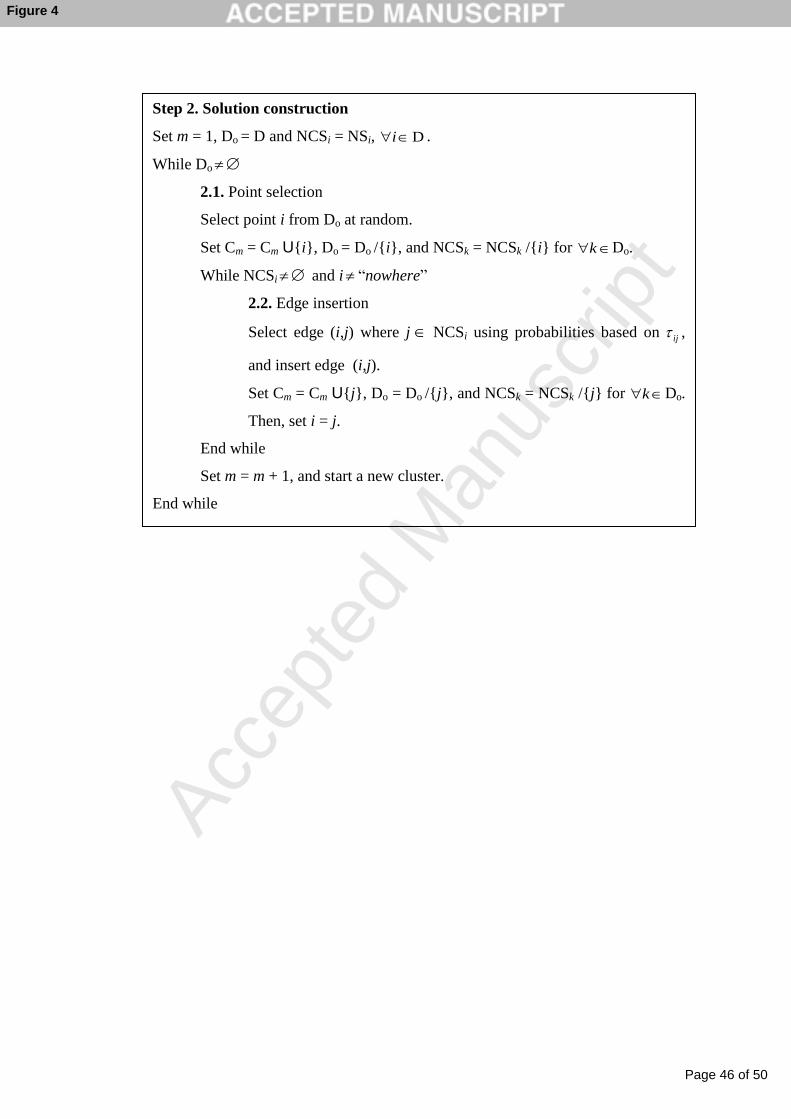
Step 2. Solution construction
Page 18 of 50
Accep
ted
Man
uscr
ipt
18
When an ant starts clustering, the set of unvisited points, Do, is initialized as the
entire data set, D. For each point in the data set, the set of currently available neighbors,
NCSi, is initialized as the set of its neighbors, NSi. The current number of clusters (m) is
set to one. There are two substeps in solution construction: point selection and edge
insertion.
Point selection: Every time an ant starts a new tour, a new cluster is formed. When a
new cluster, Cm, is initialized, a point, say point i, is selected at random from the set of
unvisited points, Do. Then, the related sets are updated as Cm = Cm U{i}, Do = Do /{i},
and NCSk = NCSk /{i} for k Do. If NCSi is non-empty or point i is not nowhere, we
continue with edge insertion. Otherwise, the construction of the current cluster is
finished, and a new cluster is initialized by incrementing the cluster index, m, by 1.
Edge insertion: An ant inserts an edge between point i and a point selected from NCSi.
The pheromone concentration on edge (i,j), ij , represents the tendency of edge (i,j) to
occur in a cluster. Hence, the probability of selecting edge (i,j) is calculated as
ikik
ijijp
NCS
for ij NCS . Then, the ant continues edge insertion starting from point
j. The initial pheromone concentration is inversely proportional to the evaporation rate,
1
ij for iji NSD, .
Point selection and edge insertion substeps are repeated until Do is empty. The
details of Step 2 are presented in Figure 4.
- Insert Figure 4 here. -
Page 19 of 50
Accep
ted
Man
uscr
ipt
19
Step 3. Solution evaluation
The performance of a clustering solution is evaluated using CERN and WCERN
as described in Section 3.
Step 4. Local search
In order to strengthen the exploitation property of ACO-C we apply local search
to each clustering solution constructed. Conditional merging operations are performed in
the local search. Let clusters m and n are adjacent clusters considered for merging, and
let comp and sep be the adjusted compactness and relative separation of the current
clustering solution, respectively. The adjusted compactness and relative separation after
merging are comp’ and sep’, respectively. If comp’ ≤ comp and sep’ ≥ sep, clusters m
and n are merged. The clustering solutions at the end of the local search form the set of
solutions constructed by the ants (SC) in the current iteration.
Step 5. Pheromone update
Pheromone update is performed for each solution component (edge) so that the
effect of the solution component is well-reflected in the pheromone concentration.
There are two important properties about our clustering problem: 1) We are
interested in arbitrary-shaped clusters with different densities, so reflecting the local
density, connectivity and proximity relations are crucial in finding the target clusters. 2)
We use adjusted compactness and relative separation as two complementary objective
functions. Hence, we use the following pheromone update mechanism. For each data
point i, the incumbent (minimum) adjusted compactness obtained so far for point i,
Page 20 of 50
Accep
ted
Man
uscr
ipt
20
inc_compi, and the incumbent (maximum) relative separation obtained so far for point i,
inc_sepi, are kept in the memory. We check whether or not the adjusted compactness
and relative separation of the cluster to which edge (i,j) belongs are better than the
corresponding incumbent values. More pheromone is released if an incumbent improves.
For all the edges in the clustering solution, E, the amount of pheromone released
is proportional to the amount of improvement in the incumbents. The initial incumbent
adjusted compactness and relative separation for each point are taken from the closures
of the NC algorithm. Formally, the pheromone values are updated as
iijijijij jiw NS,D )1( ,
where
otherwise. ,0
E),(if ,_,_max
_,_min ),(
),(
jisepincsepinc
sep
comp
compinccompinc
w ji
ji
ji
ji
ij
Step 6. Non-dominated set update
Let s1 and s2 be two clustering solutions generated by the ants. The aim is to minimize
the maximum adjusted compactness and to maximize the minimum relative separation.
Definition 1: Solution s1 dominates solution s2 if
i) 21 ss compcomp and 21 ss sepsep , or
ii) 21 ss compcomp and 21 ss sepsep .
Definition 2: If there does not exist any other clustering solutions dominating solution
s1, then solution s1 is called a non-dominated solution.
Page 21 of 50
Accep
ted
Man
uscr
ipt
21
We update the current set of non-dominated solutions (SN) at the end of each
iteration using Definitions 1 and 2. We also update the incumbent compactness and
separation (inc_compi and inc_sepi) for the data set.
If the maximum number of iterations is not exceeded, Steps 2-6 are repeated.
Otherwise, ACO-C terminates with the non-dominated solutions in set SN.
5. Experimental Results for the ACO-C Methodology
In this section, we test the performance of ACO-C empirically. First, we present
the test data sets and the performance evaluation criteria. Second, using some pilot data
sets, we conduct a full factorial experiment in order to set the ACO-C parameters. Third,
we elaborate on the impact of data set reduction. Finally, we compare the performance
of ACO-C with other clustering algorithms.
The algorithm was coded in Matlab 7.9 and run on a PC with Intel Core2 Duo
2.33 GHz processor and 2 GB RAM.
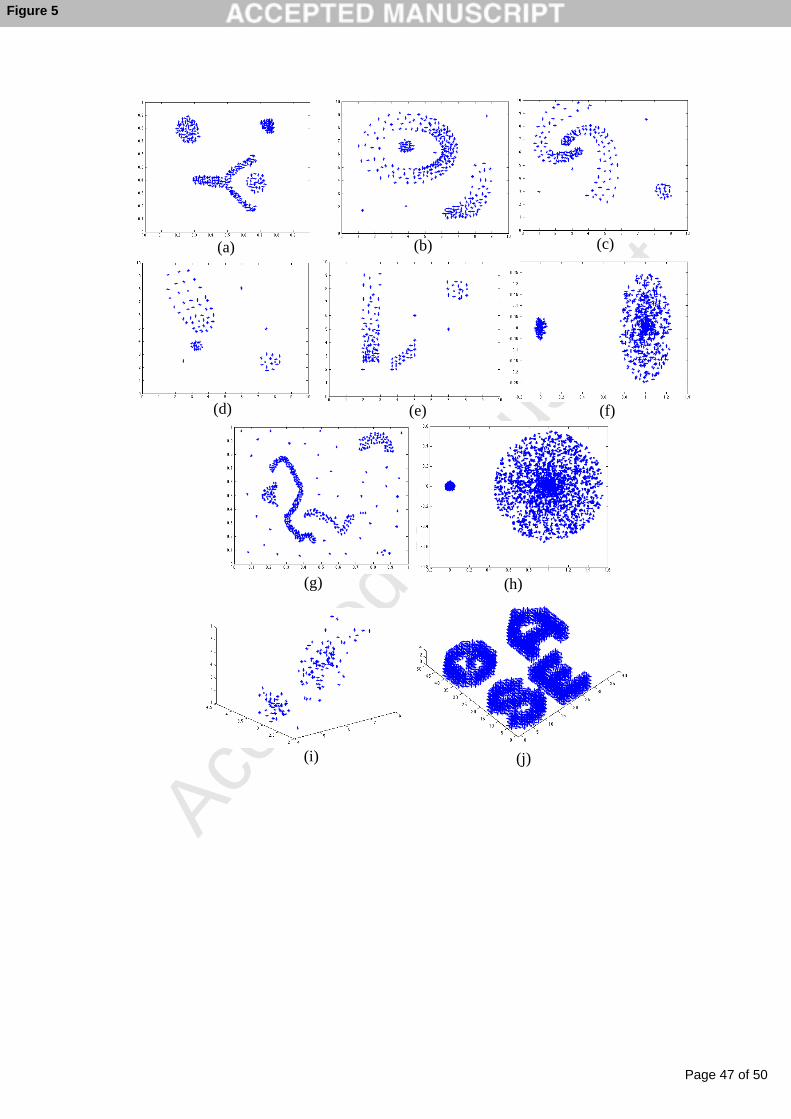
5.1. Data Sets and Performance Evaluation Criteria
We tested ACO-C using 32 data sets compiled from several sources [73, 74, 75].
These include 2- and higher dimensional data sets with various shapes of clusters
(circular, elongated, spiral, etc.), intra-cluster and inter-cluster density variations, and
outliers. Some example data sets are presented in Figure 5.
We evaluated the accuracy of the clustering solution using Jaccard index (JI) and
Rand index (RI). We define these measures as follows.
a: the number of point pairs that belong to the same target cluster and are assigned to the
same cluster in the solution.
Page 22 of 50
Accep
ted
Man
uscr
ipt
22
b: the number of point pairs that belong to the same target cluster but are assigned to
different clusters in the solution.
c: the number of point pairs that belong to different target clusters but are assigned to the
same cluster in the solution.
d: the number of point pairs that belong to different target clusters and are assigned to
different clusters in the solution.
- Insert Figure 5 here. -
cba
a
JI (1)
dcba
da
RI (2)
JI is one of the well-known external clustering validity indices. It takes values
between zero and one, one indicating the target clustering is achieved. RI is also known
as the simple matching coefficient. While JI focuses on point pairs correctly assigned to
the same cluster, RI also takes into account the point pairs correctly assigned to different
clusters. Both indices penalize the division of clusters as well as mixing them. We report
the maximum JI and RI values in the set of non-dominated solutions.
5.2. Parameter Settings for ACO-C
The three parameters of ACO-C are no_ants, max_iter, and . We set max_iter
to twice the number of points in the data set, and recorded the iteration number in which
the target clustering was found. We used a full factorial experimental design in order to
Page 23 of 50
Accep
ted
Man
uscr
ipt
23
determine the best settings for no_ants and . We also studied the impact of the
solution evaluation function (EF) on the performance of ACO-C. The three factors used
in the experimental design and their levels are presented in Table 1. We conducted the
full factorial experiment using a subset of 15 data sets. These 15 data sets were selected
to represent different properties of all data sets.
- Insert Table 1 here. –
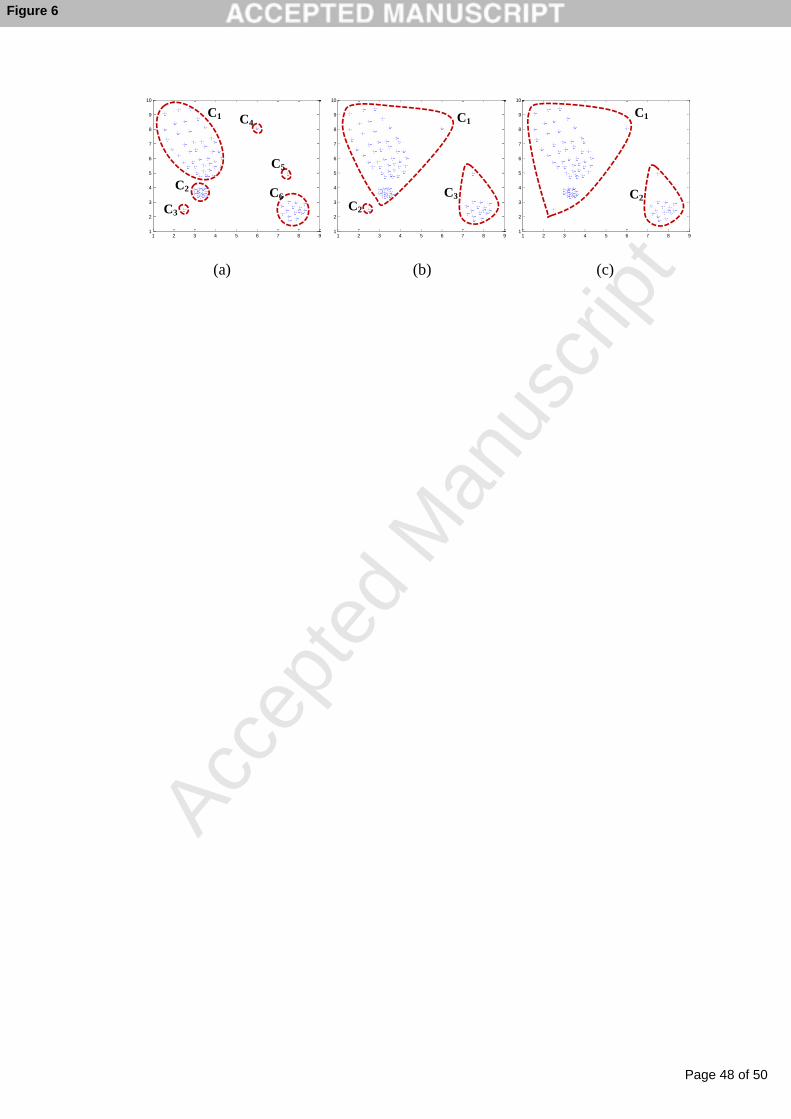
Before discussing the full factorial design results, we present the ACO-C results
for the example data set given in Figure 5(d). The three non-dominated clustering
solutions found by ACO-C are presented in Figure 6. These solutions include the target
clustering with a JI value of one. The resulting non-dominated solutions can be
interpreted as clustering of points in different resolutions.
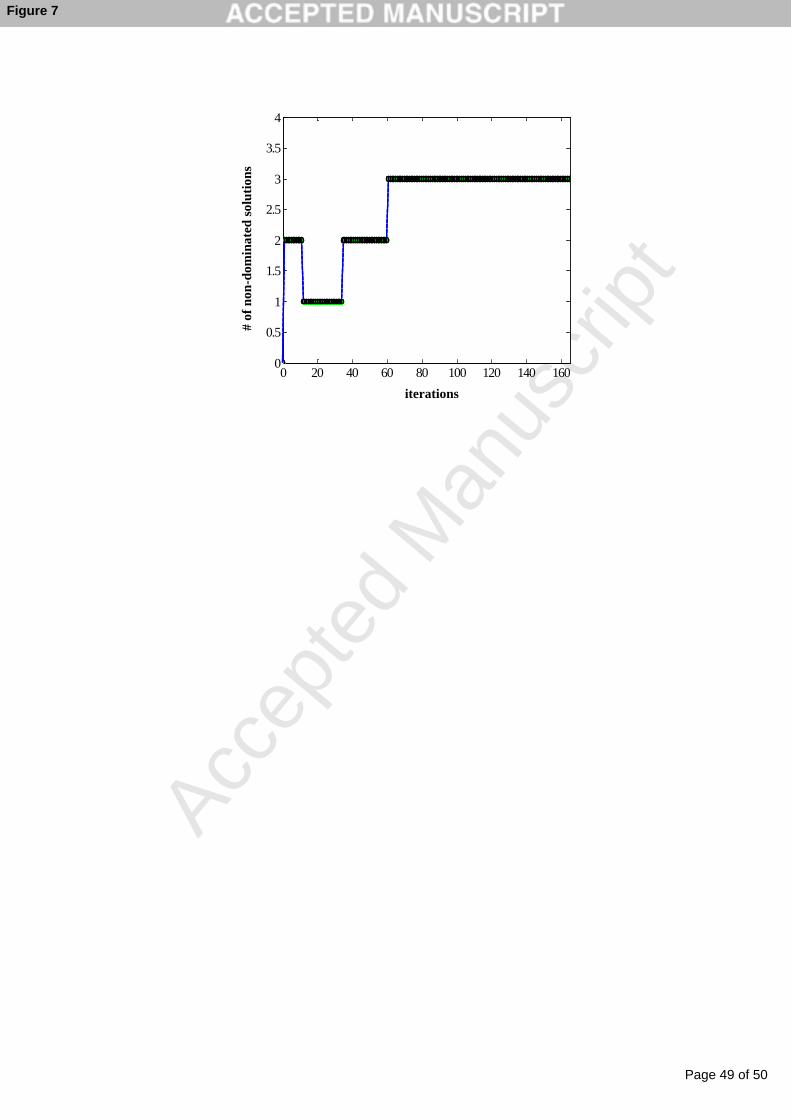
We also checked the convergence of ACO-C in the example data set. In Figure 7
the set of non-dominated solutions stays the same after iteration number 70. This implies
that convergence is achieved.
The main effect plots for the maximum RI and execution time are presented in
Figure 8. The low setting of the evaporation rate slows the convergence down and
prevents ACO-C from missing the target solutions. However, the time spent in ACO-C
increases three times with this setting. Increasing the number of ants used in ACO-C
provides a slight improvement in the maximum RI in return for increase in the time.
Considering the trade-offs between the performance and time, the experiments are
performed with the parameter settings = 0.01 and no_ants = 5.
Page 24 of 50
Accep
ted
Man
uscr
ipt
24
In Figures 8(a) and 8(b) WCERN performs better than CERN in terms of the
maximum RI and time. On the other hand, only CERN finds the target clustering in
some data sets, i.e. data sets in Figures 5(d) and 5(e). Hence, CERN ensures finding the
target clustering that is visible in low resolution. WCERN is more powerful in extracting
clusters that are visible in higher resolution such as data sets in Figures 5(f) and 5(h).
CERN and WCERN complement each other in finding the target clusters, so we run
ACO-C using both evaluation mechanisms. We consider the union of the non-dominated
solutions obtained by both as the final solution set.
Note that there is no significant interaction among the factors.
- Insert Figure 6 here. -
- Insert Figure 7 here. -
- Insert Figure 8 here. -
5.3. Data Set Reduction
We tested the impact of data set reduction using 32 data sets. The boundary
extraction algorithms in [72] were used for data set reduction. The number of points in
the original data set was compared with the number of points after reduction.
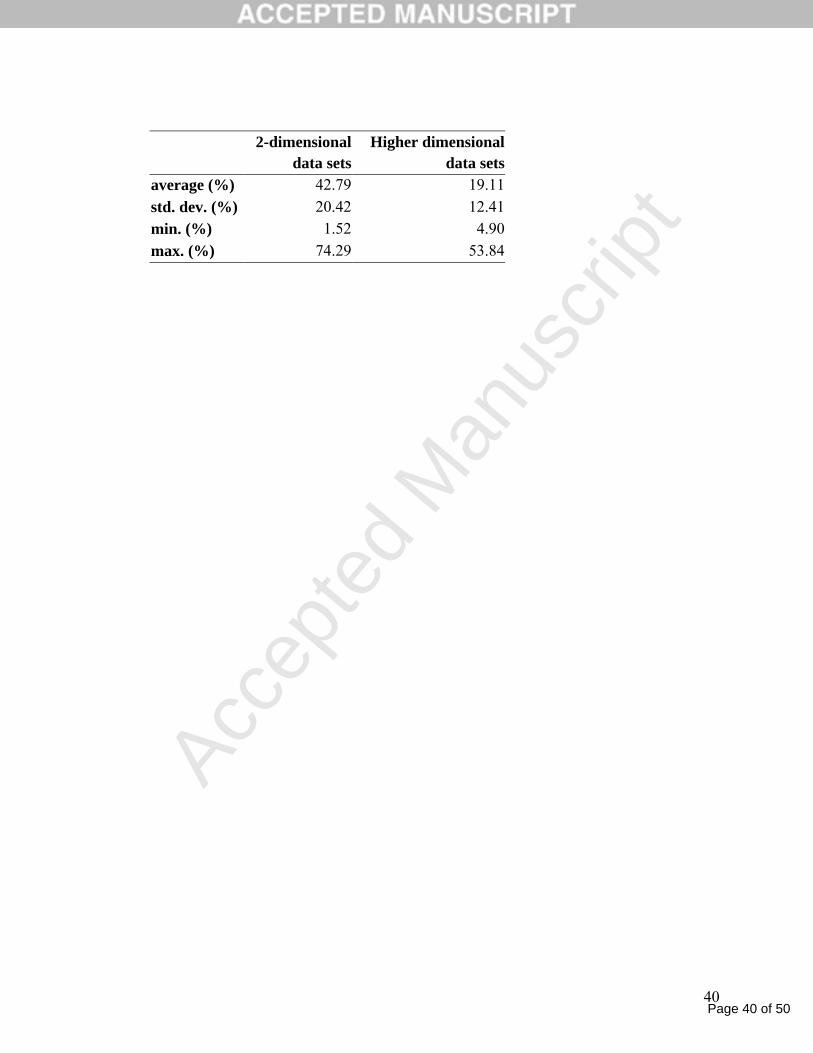
Table 2 shows the data set reduction percentages for 2- and higher dimensional
data sets. The reduction percentages vary depending on the shape of the clusters. The
highest data set reduction percentages are achieved when clusters are convex, as in
Page 25 of 50
Accep
ted
Man
uscr
ipt
25
Figures 5(f) and 5(h). When there are non-convex clusters as in Figure 5(g), the
reduction percentages are lower.
In Section 5.4 clustering is performed on the data sets after the reduction.
- Insert Table 2 here. -
5.4. Comparison of the ACO-C Methodology with Others
The performance of ACO-C is compared with the results of k-means, single-
linkage, DBSCAN, NC closures, and NOM [76]. In our comparisons k-means represents
the partitional clustering algorithms, and single-linkage the hierarchical clustering
algorithms. DBSCAN is selected as a representative of the density-based clustering
algorithms. The number of clusters is an input for k-means and single-linkage, therefore
we run k-means and single-linkage for several values of the number of clusters. This
number varies between 2-10% of the number of points in the data set with increments of
1, and the one with the best JI value is selected for each algorithm. In the same manner,
for DBSCAN, among several MinPts settings the one with the best JI value is selected
for comparison. NOM is a graph theoretical clustering algorithm. It also uses the
neighborhoods constructed by the NC algorithm, hence we can elaborate on the impact
of ACO-C better. For ACO-C, we consider the union of the non-dominated solutions
obtained with CERN and WCERN settings, and the sum of the execution times with
CERN and WCERN is considered as the execution time of ACO-C.
Page 26 of 50
Accep
ted
Man
uscr
ipt
26
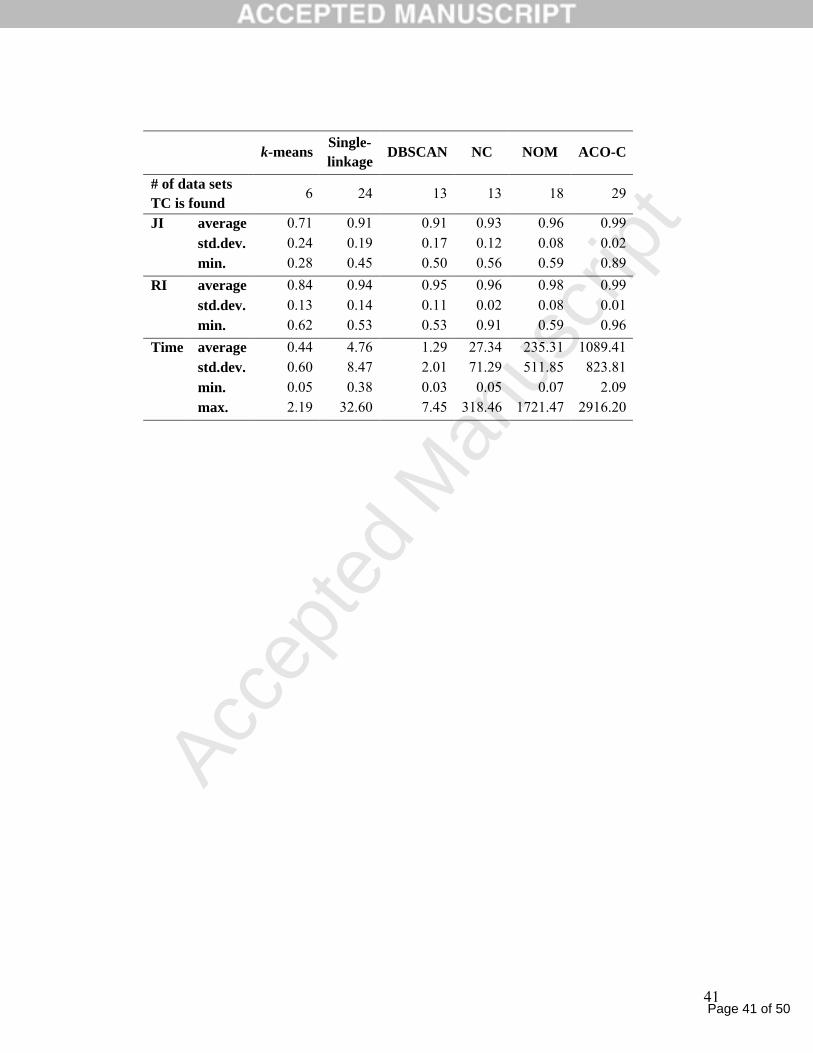
The results for 32 data sets are summarized in Table 3. ACO-C finds the target
clusters in 29 data sets out of 32. Single-linkage and NOM follow ACO-C with 24 and
18 data sets, respectively. ACO-C has the best average JI and RI values, followed by
NOM, NC, DBSCAN and single-linkage. This indicates that ACO-C is able to form
clusters that are close to the target clusters on the average. Moreover, the standard
deviations of JI and RI are the smallest, and the minimum values of JI and RI are the
highest for ACO-C. This indicates that even in the worst case ACO-C performs better
than the competing approaches.
Typically, ACO-C has difficulty in detecting target clusters when there is noise,
as for the data set in Figure 5(g). The relative solution evaluation mechanisms of both
CERN and WCERN are sensitive to density and distance changes, so these points are
labeled as separate clusters. Although ACO-C yields the general structure of the target
clusters in such data sets, it forms clusters by enclosing the noise as well.
- Insert Table 3 here. -
The number of non-dominated solutions generated by CERN and WCERN varies
between 1 to 6 for different data sets. Hence, the size of the non-dominated sets is
reasonable for practical use.
The main limitation of ACO-C is the longer execution times compared to k-
means, single-linkage and DBSCAN, partly due to the Matlab implementation. In this
respect, improvements are required.
6. Conclusion
Page 27 of 50
Accep
ted
Man
uscr
ipt
27
In this work we consider the spatial clustering problem with no a priori
information on the data set. The clusters may include arbitrary shapes, and there may be
density differences within and between the clusters. Moreover, the number of clusters is
unknown. We present a novel ACO-based clustering methodology, namely ACO-C. In
ACO-C we combine the connectivity, proximity, density and distance information with
the exploration and exploitation capabilities of ACO in a multi-objective framework.
The proposed clustering methodology is capable of handling several challenging issues
of the clustering problem including solution evaluation, extraction of local properties,
scalability and the clustering task itself. The performance of ACO-C is tested using a
variety of data sets. The experimental results indicate that ACO-C outperforms other
competing approaches in terms of the validity indices JI and RI. In particular, the multi-
objective framework and the solution evaluation relative to the neighborhoods enhance
the algorithm in extracting arbitrary-shaped clusters, handling density variations, and
finding the correct number of clusters. ACO-C achieves a reasonable number of non-
dominated solutions for practical use.
The proposed methodology can generate non-dominated clustering solutions,
which include the target clustering most of the time. These solutions represent
alternative clustering patterns having different levels of resolution. Solutions with
different resolutions allow the decision maker to analyze the trade-offs between the
merging and division operations. A future research direction can be to find all the non-
dominated clustering solutions in different resolutions, i.e. the Pareto efficient frontier.
ACO-C typically has problems with detection of the noise. Also, its execution
times are relatively longer. The proposed approach can be improved in both areas.
Page 28 of 50
Accep
ted
Man
uscr
ipt
28
References
[1] Jain, A.K., Murty, M.N., and Flynn, P.J., 1999. Data clustering: A review. ACM
Computing Surveys. 31 (3), 264–323.
[2] Alani, H., Jones, C.B., and Tudhope, D., 2001. Voronoi-based region approximation
for geographical information retrieval with gazetteers. International Journal of
Geographical Information Science, 15 (4), 287-306.
[3] Pfister, H., and Gross, M., 2004. Point-based computer graphics. IEEE Computer
Graphics and Applications, 24 (4), 22-23.
[4] Freixenet, J., Muñoz, X., Raba, D., Martí, J., and Cufí, X., 2002. Yet another survey
on image segmentation: Region and boundary information integration. Lecture Notes in
Computer Science, 2352/2002, 21-25, DOI: 10.1007/3-540-47977-5_27.
[5] Yuan, T., and Kuo, W., 2007. A model-based clustering approach to the recognition
of the spatial defect patterns produced semiconductor fabrication. IIE Transactions, 40
(2), 93-101.
[6] Wang, C.H., Kuo, W., and Bensmail, H., 2006. Detection and classification of defect
patterns on semiconductor wafers. IIE Transactions, 39, 1059-1068.
[7] Xu, R., and Wunsch, D., 2005. Survey of clustering algorithms. IEEE Transactions
on Neural Networks. 16 (3), 645-678.
[8] Berkhin, P., 2006. A survey of clustering data mining techniques. In Kogan, J.,
Nicholas, C., and Teboulle M., editors, Grouping Multidimensional Data: Recent
Advances in Clustering, 25-71. Springer, Berlin.
[9] MacQueen, J.B., 1967. Some methods for classification and analysis of multivariate
observations. In: Proceedings of the Fifth Berkeley Symposium on Mathematical
Statistics and Probability. Berkeley, 281-297.
Page 29 of 50
Accep
ted
Man
uscr
ipt
29
[10] Hartigan, J.A., and Wong, M.A., 1979. Algorithm AS 136: A k-means clustering
algorithm. Journal of the Royal Statistical Society. Series C (Applied Statistics). 28 (1),
100-108.
[11] Kaufman, L., and Rousseeuw, P.J., 1990. Finding groups in data: An introduction to
cluster analysis. John Wiley & Sons.
[12] Zahn, C.T., 1971. Graph-theoretical methods for detecting and describing gestalt
clusters. IEEE Transactions on Computers. C-20 (1), 68-86.
[13] Jain, A.K., and Dubes, R.C., 1988. Algorithms for clustering data. Prentice-Hall
advanced reference series. Prentice-Hall Inc., Upper Saddle River, NJ.
[14] Halkidi, M., Batistakis, Y., and Vazirgiannis, M., 2002. Cluster validity methods:
Part I. ACM SIGMOD Record. 31 (2), 40-45.
[15] Halkidi, M., Batistakis, Y., and Vazirgiannis, M., 2002. Cluster validity methods:
Part II. ACM SIGMOD Record. 31 (3), 19-27.
[16] Bandyopadhyay, S., and Maulik, U., 2001. Nonparametric genetic clustering:
Comparison of validity indices. IEEE Transactions on Systems, Man, and Cybernetics –
Part C: Applications and Reviews. 31 (1), 120-125.
[17] Bandyopadhyay, S., and Maulik, U., 2002. Genetic clustering for automatic
evolution of clusters and application to image classification. Pattern Recognition. 35,
1197–1208.
[18] Hruschka, E.R., and Ebecken, N.F.F., 2003. A genetic algorithm for cluster
analysis. Intelligent Data Analysis. 7, 15–25.
[19] Sheng, W., Swift, S., Zhang, L., and Liu, X., 2005. A weighted sum validity
function for clustering with a hybrid niching genetic algorithm. IEEE Transactions on
Systems, Man, and Cybernetics – Part B: Cybernetics. 35 (6), 1156-1167.
Page 30 of 50
Accep
ted
Man
uscr
ipt
30
[20] Bandyopadhyay, S., and Saha, S., 2007. GAPS: A clustering method using a new
point symmetry-based distance measure. Pattern Recognition. 40, 3430-3451.
[21] Bandyopadhyay, S., and Saha, S., 2008. A point symmetry-based clustering
technique for automatic evolution of clusters. IEEE Transactions on Knowledge and
Data Engineering. 20 (11), 1441-1457.
[22] Ester, M., Kriegel, K.P., Sander, J., and Xu, X., 1996. A density-based algorithm
for discovering clusters in large spatial databases with noise. In: Proceedings of the
Second International Conference on Knowledge Discovery and Data Mining, Portland,
Oregon, 226-231.
[23] Dunn, J.C., 1974. Well-separated clusters and optimal fuzzy partitions. Journal of
Cybernetics. 4 (1), 95-104.
[24] Maulik, U., and Bandyopadhyay, S., 2002. Performance evaluation of some
clustering algorithms and validity indices. IEEE Transactions on Pattern Analysis and
Machine Intelligence, 24 (12), 1650-1654.
[25] Bandyopadhyay, S., Maulik, U., and Mukhopadhyay, A., 2007. Multi-objective
genetic clustering for pixel classification in remote sensing imagery. IEEE Transactions
on Geoscience and Remote Sensing, 45 (5), 1506-1511.
[26] Handl, J., and Knowles, J., 2004. Evolutionary multi-objective clustering. In:
Proceedings of 8th International Conference on Parallel Problem Solving From Nature.
1081–1091.
[27] Corne, D.W., Jerram, N.R., Knowles, J.D., and Oates, M.J., 2001. PESA-II:
Region-based selection in evolutionary multi-objective optimization. In: Proceedings of
Genetic Evolutionary Computation Conference, 283–290.
[28] Handl, J., and Knowles, J., 2007. An evolutionary approach to multi-objective
Page 31 of 50
Accep
ted
Man
uscr
ipt
31
clustering. IEEE Transactions on Evolutionary Computation. 11 (1), 56-76.
[29] Matake, N., Hiroyasu, T., Miki, M., and Senda, T., 2007. Multi-objective clustering
with automatic k-determination for large-scale data. In: Proceedings of Genetic and
Evolutionary Computation Conference, London, England, 2007.
[30] Tsai, C.-W., Chen W.-L., and Chiang, M.-G., 2012. A modified multi-objective
EA-based clustering algorithm with automatic determination of the number of clusters.
In: Proceedings of IEEE International Conference on Systems, Man, and Cybernetics.
Doi: 10.1109/ICSMC.2012.6378178.
[31] Saha, S., and Bandyopadhyay, S., 2010. A symmetry-based multi-objective
clustering technique for automatic evolution of clusters. Pattern Recognition. 43, 738-
751.
[32] Xie, X.L., and Beni, G., 1991. A validity measure for fuzzy clustering. IEEE
Transactions on Pattern Analysis and Machine Intelligence. 13, 841-847.
[33] Saha, S., and Bandyopadhyay, S., 2012. Some connectivity-based cluster validity
indices. Applied Soft Computing. 12, 1555–1565.
[34] Saha, S., and Bandyopadhyay, S., 2013. A generalized automatic clustering
algorithm in a multi-objective framework. Applied Soft Computing. 13, 89-108.
[35] Das, S., Abraham, A., and Konar, A., 2009. Clustering using multi-objective
differential evolution algorithms. Metaheuristic Clustering, Springer, 213–238.
[36] Suresh, K., Kundu, D., Ghosh, S., Das, S., and Abraham, A., 2009. Data clustering
using multi-objective differential evolution algorithms. Fundamenta Informaticae. 97
(4), 381-403.
Page 32 of 50
Accep
ted
Man
uscr
ipt
32
[37] Gong, M., Zhang, L., Jiao, L., and Gou, S., 2007. Solving multi-objective clustering
using an immune-inspired algorithm. In: Proceedings of IEEE Congress on Evolutionary
Computation. Doi: 10.1109/CEC.2007.4424449.
[38] Paoli, A., Melgani, F., and Pasolli, E., 2009. Clustering of hyperspectral images
based on multi-objective Particle Swarm Optimization. IEEE Transactions on
Geoscience and Remote Sensing. 47 (12), 4175-4188.
[39] Santos, D.S., Oliveira, D.D., and Bazzan, A.L.C., 2009. A multiagent multi-
objective clustering algorithm. Data Mining and Multi-agent Integration. Springer, 239-
249.
[40] Dorigo, M., Maniezzo, V., and Colorni, A., 1991. Positive feedback as a search
strategy. Technical report, 91-016, Politecnico di Milano, Dip. Elettronica.
[41] Dorigo, M., Maniezzo, V., and Colorni, A., 1996. Ant system: Optimization by a
colony of cooperating agents. IEEE Transactions on Systems, Man, and Cybernetics -
Part B. 26 (1), 29–41.
[42] Dorigo, M., Caro, G.D., and Gambardella, L.M., 1999. Ant algorithms for discrete
optimization. Artificial Life. 5 (2), 137–172.
[43] Handl, J., and Meyer, B., 2007. Ant-based and swarm-based clustering. Swarm
Intelligence. 1, 95–113.
[44] Liu, X., and Hu, F., 2010. An effective clustering algorithm with ant colony.
Journal of Computers, 5(4), 598-605.
[45] Yong, W., and Peng-Cheng, W., 2009. Data clustering method based on ant swarm
intelligence. In: Proceedings of IEEE International Conference on Computer Science
and Information Technology. 358-361.
Page 33 of 50
Accep
ted
Man
uscr
ipt
33
[46] Chen, A.-P., and Chen, C.-C., 2006. A new efficient approach for data clustering in
electronic library using ant colony clustering algorithm. The Electronic Library. 24 (4),
548-559.
[47] He, Y., Hui, S., and Sim, Y., 2006. A novel ant-based clustering approach for
document clustering. Ng, H., Leong, M.-K., Kan, M.-Y., and Ji, D. (Eds.), Asia
Information Retrieval Symposium, Springer, Singapore, 537–544.
[48] Kao, Y., and Fu, S.C., 2006. An ant-based clustering algorithm for manufacturing
cell design. International Journal of Advanced Manufacturing Technology. 28, 1182–
1189.
[49] Ho, C.K., and Ewe, H.T., 2005. A hybrid ant colony optimization approach (hACO)
for constructing load-balanced clusters. In: Proceedings of the 2005 IEEE Congress on
Evolutionary Computation. Doi: 10.1109/CEC.2005.1554942.
[50] Runkler, T.A., 2005. Ant colony optimization of clustering models. International
Journal of Intelligent Systems. 20 (12), 1233-1251.
[51] Saatchi, S., and Hung, C.C., 2005. Hybridization of the ant colony optimization
with the k-means algorithm for clustering. Lecture notes in computer science: Vol. 3540.
Image analysis. Berlin: Springer. 511-520.
[52] Shelokar, P.S., Jayaraman, V.K., and Kulkarni, B.D., 2004. An ant colony approach
for clustering. Analytica Chimica Acta. 509, 187–195.
[53] Kuo, R.J., Wang, H.S., Hu, T.-L., and Chou, S.H., 2005. Application of ant k-means
on clustering analysis. Computers and Mathematics with Applications. 50, 1709-1724.
[54] Huang, C.L., Huang, W.-C., Chang, H.Y., Yeh, Y.-C., and Tsai, C.-Y., 2013.
Hybridization strategies for continuous ant colony optimization and particle swarm
optimization applied to data clustering. Applied Soft Computing. 13, 3864–3872.
Page 34 of 50
Accep
ted
Man
uscr
ipt
34
[55] Niknam, T., and Amiri, B., 2010. An efficient hybrid approach based on PSO, ACO
and k-means for cluster analysis. Applied Soft Computing. 10 (1), 183-197.
[56] Deneubourg, J.-L., Goss, S., Franks, N., Sendova-Franks, A., and Detrain, C., 1991.
The dynamics of collective sorting: robot-like ant and ant-like robot. In: Proceedings of
the First Conference on Simulation of Adaptive Behavior: From Animals to Animats,
MIT Press. 356–365.
[57] Lumer, E., and Faieta, B., 1994. Diversity and adaptation in populations of
clustering ants. In: Proceedings of the Third International Conference on Simulation of
Adaptive Behavior, Cambridge: MIT Press. 501–508.
[58] Boryczka, U., 2009. Finding groups in data: Cluster analysis with ants. Applied
Soft Computing. 9, 61–70.
[59] Kao, Y., and Fu, S.C., 2006. An ant-based clustering algorithm for manufacturing
cell design. International Journal of Advanced Manufacturing Technology. 28, 1182–
1189.
[60] Yang, Y., and Kamel, M.S., 2006. An aggregated clustering approach using multi-
ant colonies algorithms. Pattern Recognition. 39, 1278 – 1289.
[61] Handl, J., Knowles, J., and Dorigo, M., 2006. Ant-based clustering and topographic
mapping. Artificial Life. 12, 35–61.
[62] Martin, M., Chopard, B., and Albuquerque, P., 2002. Formation of an ant cemetery:
Swarm intelligence or statistical accident? Future Generation Computer Systems. 18,
951–959.
[63] Handl, J., and Meyer, B., 2002. Improved ant-based clustering and sorting in a
document retrieval interface. Lecture notes in computer science. Vol: 2439. Parallel
problem solving from nature, Berlin: Springer. 913–923.
Page 35 of 50
Accep
ted
Man
uscr
ipt
35
[64] Monmarché, N., Slimane, M., and Venturini, G., 1999. On improving clustering in
numerical databases with artificial ants. Lecture notes in artificial intelligence: Vol.
1674. Advances in artificial life. Berlin: Springer. 626–635.
[65] Zhang, L., Cao, Q., and Lee, J., 2013. A novel ant-based clustering algorithm using
Renyi entropy. Applied Soft Computing. 13 (5), 2643-2657.
[66] Azzag, H., Venturini, G., Oliver, A., and Guinot, C., 2007. A hierarchical ant-based
clustering algorithm and its use in three real-world applications. European Journal of
Operational Research. 179 (3), 906-922.
[67] Sinha, A.N., Das, N., and Sahoo, G., 2007. Ant colony based hybrid optimization
for data clustering. Kybernetes. 36 (1/2), 175-191.
[68] Tsai, C.F., Tsai, C.W., Wu, H.C., and Yang, T., 2004. ACODF: A novel data
clustering approach for data mining in large databases. Journal of Systems and Software.
73 (1), 133-145.
[69] Ghosh, A., Halder, A., Kothari, M., and Ghosh, S., 2008. Aggregation pheromone
density-based data clustering. Information Sciences. 178, 2816–2831.
[70] Wan, M., Wang, C., Li, L., and Yang, Y., 2012. Chaotic ant swarm approach for
data clustering. Applied Soft Computing. 12 (8), 2387-2393.
[71] İnkaya, T., Kayalıgil, S., and Özdemirel, N.E., 2013a. A neighborhood construction
algorithm for the clustering problem. Technical Report. Middle East Technical
University, Ankara, Turkey.
[72] İnkaya, T., Kayalıgil, S., and Özdemirel, N.E., 2013b. Extracting the non-convex
boundary of a data set via Delaunay Triangulation. Technical Report. Middle East
Technical University, Ankara, Turkey.
[73] Bache, K., and Lichman, M., 2013. UCI Machine Learning Repository
Page 36 of 50
Accep
ted
Man
uscr
ipt
36
[http://archive.ics.uci.edu/ml]. Irvine, CA: University of California, School of
Information and Computer Science.
[74] Sourina, O., 2013. Current projects in the homepage of Olga Sourina.
(http://www.ntu.edu.sg/home/eosourina/projects.html, last accessed on November 21,
2013).
[75] Iyigun, C., 2008. Probabilistic distance clustering. Ph.D. Dissertation. Rutgers
University, New Brunswick, New Jersey.
[76] İnkaya, T., Kayalıgil, S., and Özdemirel, N.E., 2010. A new density-based
clustering approach in graph theoretic context. IADIS International Journal on Computer
Science and Information Systems. 5 (2), 117-135.
Page 37 of 50
Accep
ted
Man
uscr
ipt
37
Figure Captions
Figure 1. (a) Example data set. (b) Dunn index values for the clustering solutions
generated by DBSCAN with different MinPts settings.
Figure 2. The outline of the ACO-C methodology.
Figure 3. An example for neighbors of point i.
Figure 4. The details of Step 2.
Figure 5. Example data sets: (a) train2, (b) data-c-cc-nu-n, (c) data-uc-cc-nu-n, (d) data-
c-cv-nu-n, (e) data-uc-cv-nu-n, (f) data_circle, (g) train3, (h) data_circle_1_20_1_1, (i)
iris (projected to 3-dimensional space), (j) letters.
Figure 6. Non-dominated clustering solutions for data-c-cv-nu-n, (a) Solution with six
clusters (JI=1), (b) Solution with three clusters (JI=0.57), (c) Solution with two clusters
(JI=0.54).
Figure 7. Convergence analysis for the example data set, data-c-cv-nu-n.
Figure 8. (a) Main effect plots for maximum RI, (b) Main effect plots for time.
Page 38 of 50
Accep
ted
Man
uscr
ipt
38
Table Captions
Table 1. Experimental factors in ACO-C.
Table 2. The percentages of data set reduction.
Table 3. Comparison of ACO-C with k-means, single-linkage, NC closures and NOM
(32 data sets).

Page 39 of 50
Accep
ted
Man
uscr
ipt
39
Factors Level 0 Level 1evaluation function, EF CERN WCERNevaporation rate, 0.01 0.05
number of ants, no_ants 5 10
Page 40 of 50
Accep
ted
Man
uscr
ipt
40
2-dimensionaldata sets
Higher dimensionaldata sets
average (%) 42.79 19.11
std. dev. (%) 20.42 12.41
min. (%) 1.52 4.90
max. (%) 74.29 53.84
Page 41 of 50
Accep
ted
Man
uscr
ipt
41
k-meansSingle-linkage
DBSCAN NC NOM ACO-C
# of data sets TC is found
6 24 13 13 18 29
average 0.71 0.91 0.91 0.93 0.96 0.99
std.dev. 0.24 0.19 0.17 0.12 0.08 0.02JI
min. 0.28 0.45 0.50 0.56 0.59 0.89
average 0.84 0.94 0.95 0.96 0.98 0.99
std.dev. 0.13 0.14 0.11 0.02 0.08 0.01RI
min. 0.62 0.53 0.53 0.91 0.59 0.96
average 0.44 4.76 1.29 27.34 235.31 1089.41std.dev. 0.60 8.47 2.01 71.29 511.85 823.81
min. 0.05 0.38 0.03 0.05 0.07 2.09
Time
max. 2.19 32.60 7.45 318.46 1721.47 2916.20
Page 42 of 50
Accep
ted
Man
uscr
ipt
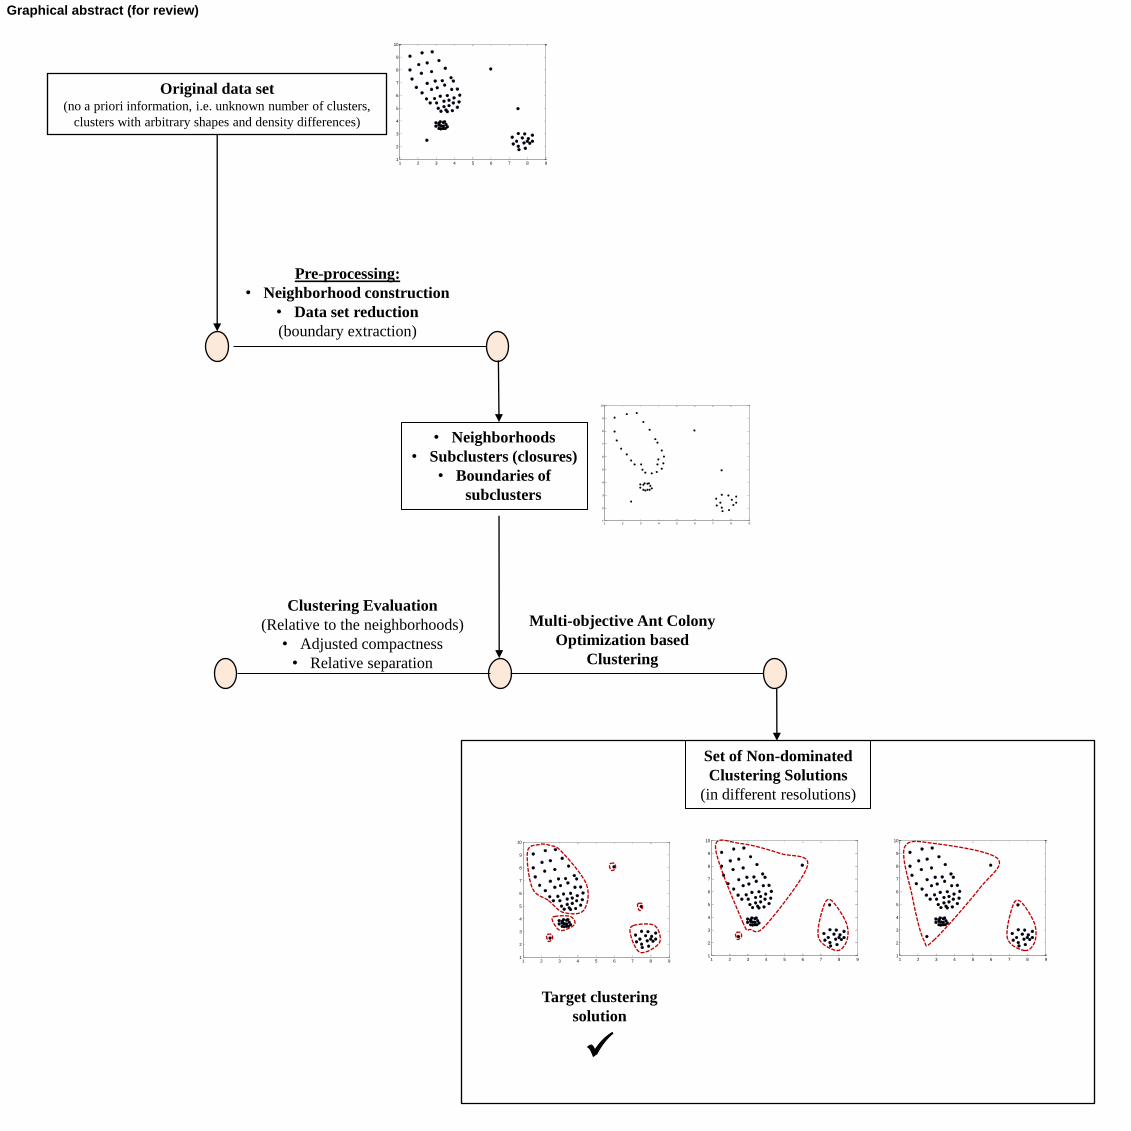
Original data set (no a priori information, i.e. unknown number of clusters,
clusters with arbitrary shapes and density differences)
1 2 3 4 5 6 7 8 91
2
3
4
5
6
7
8
9
10
Pre-processing:
• Neighborhood construction
• Data set reduction
(boundary extraction)
• Neighborhoods
• Subclusters (closures)
• Boundaries of
subclusters
Multi-objective Ant Colony
Optimization based
Clustering
Clustering Evaluation
(Relative to the neighborhoods)
• Adjusted compactness
• Relative separation
Set of Non-dominated
Clustering Solutions
(in different resolutions)
1 2 3 4 5 6 7 8 91
2
3
4
5
6
7
8
9
10
1 2 3 4 5 6 7 8 91
2
3
4
5
6
7
8
9
10
1 2 3 4 5 6 7 8 91
2
3
4
5
6
7
8
9
10
1 2 3 4 5 6 7 8 91
2
3
4
5
6
7
8
9
10
Target clustering
solution
Graphical abstract (for review)
Page 43 of 50
Accep
ted
Man
uscr
ipt
(a) (b)
0 1 2 3 4 5 6 7 8 9 100
1
2
3
4
5
6
7
8
9
10
0 1 2 3 4 5 6 7 8 9 10 11 12 13 14 15 160
0.05
0.1
0.15
0.2
0.25
0.3
0.35
56
30
12
4 2 2 2 2 2 2 2 2 2 2 4
MinPts
Du
nn
in
dex
x
y
Figure 1
Page 44 of 50
Accep
ted
Man
uscr
ipt
The ACO-C Methodology
Step 0. Pre-processing (neighborhood construction and data set reduction)
Step 1. Initialization of parameters
For t = 1,.., max_iter
For s = 1,.., no_ants
Step 2. Solution construction
Step 3. Solution evaluation
Step 4. Local search
End for
Step 5. Pheromone update
Step 6. Non-dominated set update
End for
Figure 2
Page 45 of 50
Accep
ted
Man
uscr
ipt
0.78 0.79 0.8 0.81 0.82 0.83 0.84 0.85 0.860.82
0.83
0.84
0.85
0.86
0.87
0.88
0.89
0.9
0.91
0.92
k
Closure A
i
p Closure B
j
i
n m
l
Figure 3
Page 46 of 50
Accep
ted
Man
uscr
ipt
Step 2. Solution construction
Set m = 1, Do = D and NCSi = NSi, Di .
While Do
2.1. Point selection
Select point i from Do at random.
Set Cm = Cm U{i}, Do = Do /{i}, and NCSk = NCSk /{i} for k Do.
While NCSi and i “nowhere”
2.2. Edge insertion
Select edge (i,j) where j NCSi using probabilities based on ij ,
and insert edge (i,j).
Set Cm = Cm U{j}, Do = Do /{j}, and NCSk = NCSk /{j} for k Do.
Then, set i = j.
End while
Set m = m + 1, and start a new cluster.
End while
Figure 4
Page 47 of 50
Accep
ted
Man
uscr
ipt
(a) (b) (c)
(d) (e) (f)
(g) (h)
(i) (j)
Figure 5
Page 48 of 50
Accep
ted
Man
uscr
ipt
(a) (b) (c)
1 2 3 4 5 6 7 8 91
2
3
4
5
6
7
8
9
10
1 2 3 4 5 6 7 8 91
2
3
4
5
6
7
8
9
10
1 2 3 4 5 6 7 8 91
2
3
4
5
6
7
8
9
10
C1
C2
C3
C4
C5
C6
C1
C2 C3 C2
C1
Figure 6
Page 49 of 50
Accep
ted
Man
uscr
ipt
0 20 40 60 80 100 120 140 1600
0.5
1
1.5
2
2.5
3
3.5
4
iterations
# of
non
-dom
inat
ed s
olut
ions
iterations
# o
f n
on
-do
min
ate
d s
olu
tio
ns
Figure 7

Page 50 of 50
Accep
ted
Man
uscr
ipt
(a) (b)
ma
x R
I
10
0,990
0,985
0,980
0,975
0,970
10
10
0,990
0,985
0,980
0,975
0,970
evaporation rate no. of ants
evaluation function
tim
e
10
15000
12500
10000
7500
5000
10
10
15000
12500
10000
7500
5000
evaporation rate no. of ants
evaluation function
Figure 8