antarctic science news posted on 27/3/2014 major … · antarctic science news posted on 27/3/2014...
TRANSCRIPT

Antarctic Science News posted on 27/3/2014 compiled by Dr. Alvarinho J. Luis
Major increase in West Antarctic glacial loss Six massive glaciers in West Antarctica are moving faster than they did 40 years ago, causing more ice to discharge into the ocean and global sea level to rise, according to new research.
The amount of ice draining collectively from those half-dozen glaciers increased by 77 % from 1973 to 2013. Pine Island Glacier, the most active of the studied glaciers, has accelerated by 75% in 40 years, according to the research published in GRL. Thwaites Glacier, the widest glacier, started to accelerate in 2006, following a decade of stability.
The study is the first to look at the ice coming off the six most active West Antarctic glaciers over such an extended time period. Almost 10 % of the world's sea-level rise per year comes from just these six glaciers.
The researchers found was a sustained increase in ice discharge -- which has a significant impact on sea level rise.
The researchers studied the Pine Island, Thwaites, Haynes, Smith, Pope and Kohler glaciers, all of which discharge ice into a vast bay known as the Amundsen Sea Embayment in West Antarctica.
The amount of ice released by these six glaciers each year is comparable to the amount of ice draining from the entire Greenland Ice Sheet annually, Mouginot said. If melted completely, the glaciers' disappearance would raise sea levels another 1.2 meters , according to co-author and UC-Irvine Professor Eric Rignot.
The decades of increasing speeds and ice loss are "a strong indication of a major, long-term leakage of ice into the ocean from that sector of Antarctica," noted Rignot.
This region is considered the potential leak point for Antarctica because of the low seabed. The only thing holding it in is the ice shelf. Ice shelves are platforms of permanent floating ice that form where glaciers meet the sea. In West Antarctica, ice shelves prevent the glaciers investigated in the study from slipping more rapidly into the ocean.
Mouginot and his colleagues from University of California used satellite data to look at sequential images of the glaciers from 1973 to 2013. The scientists then calculated how fast the ice was moving by tracking surface features, such as cracks in the ice, to determine the distance the glaciers traveled from month to month and year to year.
While the study considered the six glaciers collectively, it also revealed unprecedented change on the individual glacier level. Thwaites Glacier, the largest of the six with a width of 120 kilometers, experienced a decade of near-stability until 2006, when its speed picked up by 0.8 kilometers per year – a 33% increase in speed, according to the study. This is the first time that such changes on Thwaites Glacier have been observed, said Mouginot.
Of all the glaciers in the study, Pine Island Glacier accelerated the most since 1973, increasing by 1.7 kilometers, per year. That's a 75% increase in speed from approximately 2.5 kilometers per year in 1973 to 4 kilometers per year in 2013.
Both Pine Island and Thwaites glaciers contribute the most to overall ice discharge -- about ¾ of the total amount documented in the study. However, scientists also documented even higher rates of increased discharge in some of the smaller glaciers. Smith and Pope Glaciers nearly tripled the amount of ice they drained into the ocean since 1973.
The research team also found that the Pine Island Glacier is accelerating along its entire drainage system -- up to 230 kilometers inland from where it meets the ocean. The conclusion is that if you disturb the ice sheet near the coast, the glaciers will feel the push and rapidly respond hundreds of kilometers inland.
This finding suggests that glacier acceleration models may need to be reevaluated. Most current models only take into account isolated speed changes resulting from a local disturbance, rather than representing how these changes affect the glacier as a whole.
Journal Reference: J. Mouginot, E. Rignot, B. Scheuchl. Sustained increase in ice discharge from the Amundsen Sea Embayment, West Antarctica, from 1973 to 2013. Geophysical Research Letters, 2014; DOI: 10.1002/2013GL059069.
Geophysical Research Letters
RESEARCH LETTER10.1002/2013GL059069
Key Points:• Sustained ASE mass flux increase:
77% since 1973• Thwaites accelerated by 33% during
the last 6 years• Speed changes are pervasive and
rapid: major implications for iceflow modeling
Supporting Information:• Readme• Table S1• Table S2
Correspondence to:J. Mouginot,[email protected]
Citation:Mouginot, J., E. Rignot, and B. Scheuchl(2014), Sustained increase in ice dis-charge from the Amundsen SeaEmbayment, West Antarctica, from1973 to 2013, Geophys. Res. Lett., 41,doi:10.1002/2013GL059069.
Received 19 DEC 2013
Accepted 7 FEB 2014
Accepted article online 12 FEB 2014
Sustained increase in ice discharge from the Amundsen SeaEmbayment, West Antarctica, from 1973 to 2013J. Mouginot1, E. Rignot1,2, and B. Scheuchl1
1Department of Earth System Science, University of California, Irvine, California, USA, 2Jet Propulsion Laboratory,California Institute of Technology, Pasadena, California, USA
Abstract We combine measurements of ice velocity from Landsat feature tracking and satellite radarinterferometry, and ice thickness from existing compilations to document 41 years of mass flux from theAmundsen Sea Embayment (ASE) of West Antarctica. The total ice discharge has increased by 77% since1973. Half of the increase occurred between 2003 and 2009. Grounding-line ice speeds of Pine Island Glacierstabilized between 2009 and 2013, following a decade of rapid acceleration, but that acceleration reachedfar inland and occurred at a rate faster than predicted by advective processes. Flow speeds across ThwaitesGlacier increased rapidly after 2006, following a decade of near-stability, leading to a 33% increase in fluxbetween 2006 and 2013. Haynes, Smith, Pope, and Kohler Glaciers all accelerated during the entire studyperiod. The sustained increase in ice discharge is a possible indicator of the development of a marine icesheet instability in this part of Antarctica.
1. Introduction
Pine Island, Thwaites, Haynes, Smith, Pope, and Kohler Glaciers are among the fastest-flowing glaciersin continental Antarctica [Rignot et al., 2011b]. Combined together, they drain one third of the WestAntarctic Ice Sheet into the Amundsen Sea Embayment (ASE), or 393 million square kilometers. Their massflux into the southern Pacific Ocean (280± 9 Gt/yr in 2007) [Rignot, 2008] is comparable to that of the entireGreenland Ice Sheet into the Arctic Ocean [Rignot and Kanagaratnam, 2006]. Since first revealed with satel-lite radar interferometry in the 1990s [Rignot, 1998], this sector has been significantly out of balance [Rignotet al., 2008; Chen et al., 2009; Rignot, 2002] due to glacier speedup [Rignot, 2001, 2006, 2008; Joughin et al.,2003]. Concurrent with the acceleration in ice flow, the glaciers have been thinning and their grounding-linepositions—where ice goes afloat—have been retreating at a rate of 1 km/yr, one of the fastest retreat ratesin the world [Rignot, 1998, 2001; Rignot et al., 2013; MacGregor et al., 2012; Holland et al., 2008]. Together,the ASE glaciers are major contributors to sea level rise from Antarctica with about 0.28± 0.05 mm/yrbetween 2005 and 2010 [Shepherd et al., 2012], which itself amounts to about 10% of the global sea level rise(3 mm/yr) [Church and White, 2011]. Together, these glaciers and their catchment basins combined contain1.2 m global sea level rise.
Prior studies have shown that Pine Island Glacier sped up from 2.25 km/yr in 1974 [Crabtree and Doake,1982; Williams et al., 1982; Lindstrom and Tyler, 1984] to >4 km/yr by 2008 [Rignot et al., 2002; Joughin etal., 2003; Rignot, 1998, 2008]. No change in speed was reported for the time period 2009–2010 [Joughin etal., 2010]. Satellite observations also showed that between 1996 and 2006, Thwaites Glacier [Rignot et al.,2002; Rignot, 2008] had been slowly widening, with no major change in speed over its fast-moving, centralportion. Substantial changes in speed have been recorded on Smith Glacier, which accelerated 75%between 1996 and 2006 [Rignot, 2008]. No significant change in speed was noted between 1973 and 1992for its neighbor Kohler Glacier [Lucchitta et al., 1994].
Here, the mass flux from all the glaciers in the ASE over the last 41 years is revisited, combining data span-ning from Landsat in 1973 to satellite radar interferometry data in 2013. We then estimate the mass fluxof the glaciers and present maps of the evolution of ice flow over the entire drainage basin since 2006.We conclude with analysis and discussion of the nearly half-a-century evolution of this major sector ofWest Antarctica.
MOUGINOT ET AL. ©2014. American Geophysical Union. All Rights Reserved. 1

Geophysical Research Letters 10.1002/2013GL059069
Table 1. Ice Flux in Gt/yr at the 2011 Grounding Line of Pine Island, Thwaites, Haynes,Smith/Pope, and Kohler Glaciers, in the Amundsen Sea Embayment (ASE) of WestAntarctica From 1973 to 2013a
Year Pine Island Thwaites Haynes Smith/Pope Kohler Total
1974.0± 1.00 78± 7 - - - - 189± 17b
1978.0± 5.00 - 72± 7 10± 2 12± 2 - 191± 17b
1981.0± 7.50 - - - - 17± 2 193± 17b
1986.0± 2.00 - 83± 8 12± 2 14± 2 - 197± 17b
1987.0± 1.00 87± 7 - - - - 197± 17b
1989.0± 1.00 - 91± 8 - 16± 2 - 220± 17b
1992.2± 0.08 84± 2 91± 3 - - 17± 1 220± 10b
1994.3± 0.04 87± 3 93± 3 11± 1 17± 2 18± 2 226± 111996.1± 0.25 89± 2 96± 4 11± 1 20± 1 20± 1 235± 92001.0± 0.29 97± 3 97± 4 12± 1 20± 2 20± 1 247± 122002.0± 0.29 98± 3 - - - - 249± 12b
2003.0± 0.29 101± 3 98± 4 11± 1 22± 2 21± 2 253± 122004.0± 0.29 103± 3 102± 4 12± 1 22± 2 21± 2 260± 122005.0± 0.29 108± 3 101± 4 12± 1 23± 1 23± 3 268± 112006.0± 0.29 111± 9 103± 4 12± 1 25± 2 26± 3 278± 172006.9± 0.29 116± 3 104± 4 12± 1 27± 1 26± 1 285± 102007.9± 0.29 127± 3 110± 4 13± 1 29± 1 27± 1 306± 102008.9± 0.29 132± 4 114± 4 13± 1 30± 1 28± 1 317± 112009.9± 0.29 134± 4 116± 4 13± 1 31± 1 29± 2 323± 122010.9± 0.29 135± 4 119± 5 13± 1 31± 1 31± 2 328± 132011.7± 0.08 135± 4 122± 5 14± 1 30± 1 31± 1 332± 122012.9± 0.08 133± 4 124± 5 15± 1 30± 3 31± 3 333± 152013.5± 0.13 132± 4 126± 5 14± 1 31± 1 31± 3 334± 14
aFluxes are corrected for ice thickness change (see supporting information for details).bMissing glacier fluxes are interpolated.
2. Data and Methods
We derive ice velocity using data from the Landsat Thematic Mapper and MultiSpectral Scanner,the Earth Remote Sensing imaging radar satellite (ERS-1/2), the Advanced Land Observation System(ALOS) Phased-array L-band Synthetic Aperture Radar (PALSAR), the RADARSAT-1/2 radars, and theTANDEM-X mission.
Ice surface velocities prior to 1992 are from Landsat data. Using sequential images, average velocities arecalculated from the displacements of recognizable surface features such as crevasses and rifts. Velocities forPine Island Glacier in 1973–1975 and 1986–1988 and Thwaites Glacier in 1988–1990 are from the NationalSnow and Ice Center (NSIDC); other velocity data are from this study. To track image features, we coregisterthe Landsat scenes with the 2004 Landsat Image Mosaic of Antarctica (LIMA) by selecting a set of groundcontrol points with zero velocity and then calculate image offsets between registered images acquired atdifferent times. LIMA registration accuracy is better than 1 pixel (30 m). Our results are in excellent agree-ment with those obtained prior to the advent of LIMA [Rosanova et al., 1998; Ferrigno et al., 1993; Lucchittaet al., 1994, 1995]. We estimate accuracy of the glacier displacements to be 4 pixels, yielding errors in icevelocity ranging from 16 m/yr to 60 m/yr depending on the time interval between images.
The ERS-1/2 data are 1 day repeat data from the winter of 1995–1996 processed interferometrically usinga combination of ascending and descending passes [Joughin et al., 1998]. The remaining radar data areanalyzed using a speckle tracking algorithm [Michel and Rignot, 1999]. Partial coverage of the glaciersis available in the winters of 1992 and 1994 during a 3 day cycle of ERS-1. The RADARSAT-1/2 data are24 day repeat data from six winters between 2001 and 2006, fall 2011, and spring 2013. The ALOS PALSARdata are 46 day repeat cycle data acquired during five consecutive winters between 2006 and 2011. TheTANDEM-X data are 11 day repeat data, from the winter of 2012 and summer 2013. All data are calibratedand mosaicked together using the procedure described by Mouginot et al. [2012]. Errors in InSAR ice velocity(after 1992) are 5 m/yr [Rignot et al., 2011b; Mouginot et al., 2012].
Ice fluxes are calculated by combining surface velocity from different years with ice thickness from year 2004[Fretwell et al., 2013] corrected for temporal changes in ice thickness derived from time series of satellitealtimetry data (see Table 1 and supplemental information). For each glacier, we calculate the average fluxfrom five different flux gates, approximately equally spaced, located within a few kilometers upstream of
MOUGINOT ET AL. ©2014. American Geophysical Union. All Rights Reserved. 2

Geophysical Research Letters 10.1002/2013GL059069
Figure 1. (a) Flow speed of the Amundsen Sea Embayment (ASE) sector of West Antarctica, color coded on a logarithmicscale and obtained combining satellite observations spanning from year 1996 to year 2013 with flux gates at the locationof the grounding lines in 2011 (thick black lines) [Rignot et al., 2011a] and topographic divides (thin black lines); and(b) change in flow speed between 2008 and 1996 color coded on a logarithmic scale and overlaid on a MODIS mosaic.
the 2011 grounding-line positions. The flux is corrected to account for surface mass balance and ice thin-ning between the flux gate and the 2011 grounding line. This process helps quantify errors in flux estimates.When few gaps are present in the velocity record along flux gates (<30%), we employ ice velocity from theclosest year with no gap, which we adjust vertically at both ends of the missing segments and linearly inter-polate in between. For years with more than 30% gap, we scale the ice flux to that measured in the closestyear with no gap.
Following Wingham et al. [2009], ice thinning is modeled as a parabolic trend: h(𝜏) = h2004 − h2004(𝜏 − 2004)− 1
2h2004(𝜏−2004)2, where h(𝜏) is the ice thickness at a given year 𝜏 , h2004 is the ice thickness from BedMap-2
[Fretwell et al., 2013] in 2004, h2004 is the thickening rate (>0 means thickening) deduced from 2003–2008ICESat data calculated as in Pritchard et al. [2012] (see supporting information), and h2004 is the accelerationin thickening in 2004. Wingham et al. [2009] estimate h2004 = −0.12 m/yr2 between 1995 and 2006 for PineIsland Glacier, or about 7% of the 2004 thinning rate. For the other glaciers, we assume an acceleration inice thinning at the grounding line h04 of 7% of h04. This would mean that ice started thinning around 1988with a quadratic increase since then. Thus, we neglect the glacier thinning that may have occurred duringthe period 1973–1988 [Jenkins et al., 2010]. We have no information on thinning rates prior 1992, but theywere presumably smaller, because the glacier acceleration was less. Assuming a thinning rate of 1 m/yr, theglaciers may have been 15 m thicker in 1973 than in 1988, which corresponds to an error of about 1% on theice flux.
The error in ice thickness is 40 m [Fretwell et al., 2013]. Estimates of flux error 𝛿F integrate errors in velocity𝛿V and thickness 𝛿H along flux gates as 𝛿F = H𝛿V + V𝛿H. When a scaling factor is used to estimate flux, theassociated error 𝛿F is calculated as 𝛿F = 𝛼𝛿F0 + F0𝛿𝛼, where 𝛼 is the scaling factor and F0 the scaled flux (seesupporting information). 𝛿𝛼 is taken as 0.05.
In 1996 and 2008, a nearly complete mapping of ice velocity over the northernmost reaches of the entireASE sector was possible. We detect the spatial pattern of change in ice velocity (Figure 1b). Comprehensivemappings of velocity change are also available for 2009, 2010, and 2011. Velocity mapping is only partialprior to 1996 or after 2011 due to a lack of data acquisition by satellites or the termination of satellite mis-sions. In the upper reaches of Thwaites and Pine Island Glaciers, data coverage is incomplete due to sparsedata acquisitions, combined with low coherence levels attributed to significant reworking of the ice/snowsurface by weathering.
MOUGINOT ET AL. ©2014. American Geophysical Union. All Rights Reserved. 3
Geophysical Research Letters 10.1002/2013GL059069
-250 -200 -150 -100 -50 0 500
1
2
3
4
Sur
face
spe
ed (
km/y
r)
-150 -100 -50 0 500.0
0.2
0.4
0.6
0.8
1.0
1.2
1.4
-100 -50 0 500
1
2
3
4
-50 -40 -30 -20 -10 0 100.0
0.2
0.4
0.6
0.8
1.0
-60 -40 -20 0 20 40 60
Distance (km)
0.0
0.5
1.0
1.5
Sur
face
spe
ed (
km/y
r)
-50 0 50
Distance (km)
0.0
0.2
0.4
0.6
0.8
1.0
1.2
1.4
-100 -50 0 50
Distance (km)
0.0
0.2
0.4
0.6
0.8
1.0
1.2
1.4
-50 0 50 100
Distance (km)
0.0
0.2
0.4
0.6
0.8
1.0
1.2
(a) Pine IslandA1 A2
(b) Thwaites Eastern Ice ShelfB1 B2
(c) Thwaites Ice tongueC1 C2
(d) HaynesD1 D2
(e) Crosson Ice Shelf - PopeE1 E2
(f) Crosson Ice Shelf - SmithF1 F2
(g) Dotson Ice Shelf - Kohler east branch G1 G2
(h) Dotson Ice Shelf - Kohler west branchH1 H2
2006
200520042003 2002 2001200019961994
19921988-19901986-19881984-19881973-19881973-19841973-1975
Floating
Grounded
2013201220112010200920082007
-100
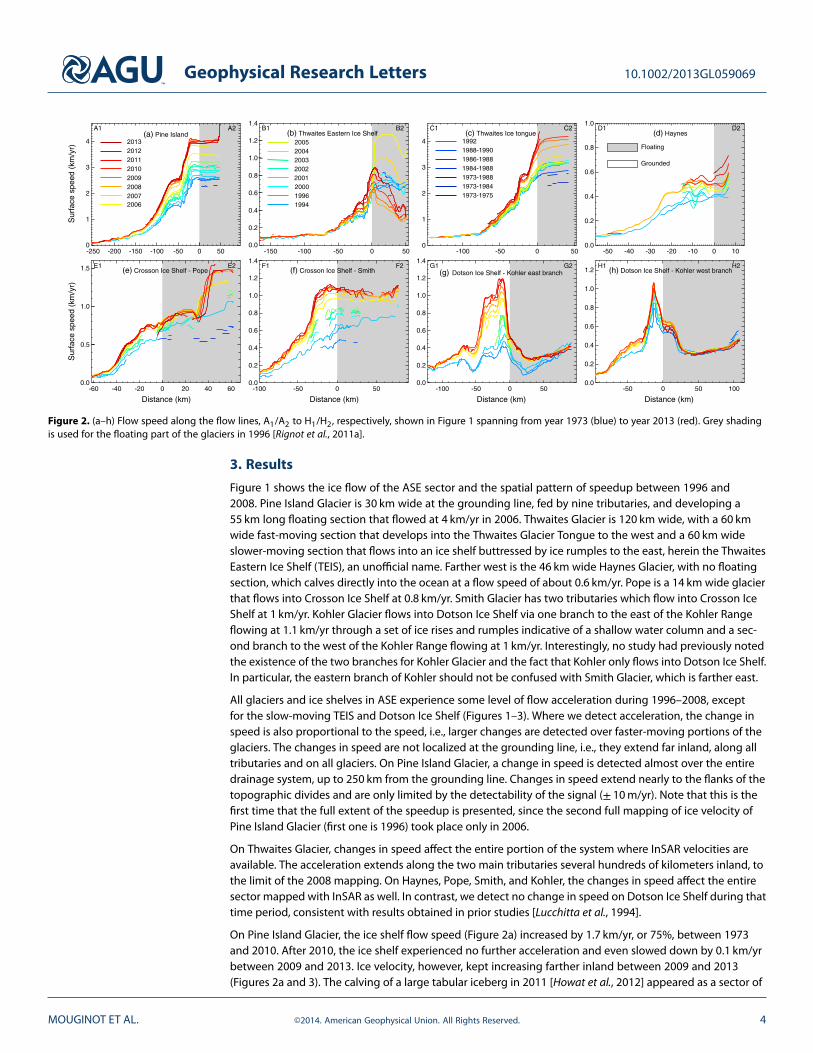
Figure 2. (a–h) Flow speed along the flow lines, A1/A2 to H1/H2, respectively, shown in Figure 1 spanning from year 1973 (blue) to year 2013 (red). Grey shadingis used for the floating part of the glaciers in 1996 [Rignot et al., 2011a].
3. Results
Figure 1 shows the ice flow of the ASE sector and the spatial pattern of speedup between 1996 and2008. Pine Island Glacier is 30 km wide at the grounding line, fed by nine tributaries, and developing a55 km long floating section that flowed at 4 km/yr in 2006. Thwaites Glacier is 120 km wide, with a 60 kmwide fast-moving section that develops into the Thwaites Glacier Tongue to the west and a 60 km wideslower-moving section that flows into an ice shelf buttressed by ice rumples to the east, herein the ThwaitesEastern Ice Shelf (TEIS), an unofficial name. Farther west is the 46 km wide Haynes Glacier, with no floatingsection, which calves directly into the ocean at a flow speed of about 0.6 km/yr. Pope is a 14 km wide glacierthat flows into Crosson Ice Shelf at 0.8 km/yr. Smith Glacier has two tributaries which flow into Crosson IceShelf at 1 km/yr. Kohler Glacier flows into Dotson Ice Shelf via one branch to the east of the Kohler Rangeflowing at 1.1 km/yr through a set of ice rises and rumples indicative of a shallow water column and a sec-ond branch to the west of the Kohler Range flowing at 1 km/yr. Interestingly, no study had previously notedthe existence of the two branches for Kohler Glacier and the fact that Kohler only flows into Dotson Ice Shelf.In particular, the eastern branch of Kohler should not be confused with Smith Glacier, which is farther east.
All glaciers and ice shelves in ASE experience some level of flow acceleration during 1996–2008, exceptfor the slow-moving TEIS and Dotson Ice Shelf (Figures 1–3). Where we detect acceleration, the change inspeed is also proportional to the speed, i.e., larger changes are detected over faster-moving portions of theglaciers. The changes in speed are not localized at the grounding line, i.e., they extend far inland, along alltributaries and on all glaciers. On Pine Island Glacier, a change in speed is detected almost over the entiredrainage system, up to 250 km from the grounding line. Changes in speed extend nearly to the flanks of thetopographic divides and are only limited by the detectability of the signal (± 10 m/yr). Note that this is thefirst time that the full extent of the speedup is presented, since the second full mapping of ice velocity ofPine Island Glacier (first one is 1996) took place only in 2006.
On Thwaites Glacier, changes in speed affect the entire portion of the system where InSAR velocities areavailable. The acceleration extends along the two main tributaries several hundreds of kilometers inland, tothe limit of the 2008 mapping. On Haynes, Pope, Smith, and Kohler, the changes in speed affect the entiresector mapped with InSAR as well. In contrast, we detect no change in speed on Dotson Ice Shelf during thattime period, consistent with results obtained in prior studies [Lucchitta et al., 1994].
On Pine Island Glacier, the ice shelf flow speed (Figure 2a) increased by 1.7 km/yr, or 75%, between 1973and 2010. After 2010, the ice shelf experienced no further acceleration and even slowed down by 0.1 km/yrbetween 2009 and 2013. Ice velocity, however, kept increasing farther inland between 2009 and 2013(Figures 2a and 3). The calving of a large tabular iceberg in 2011 [Howat et al., 2012] appeared as a sector of
MOUGINOT ET AL. ©2014. American Geophysical Union. All Rights Reserved. 4
Geophysical Research Letters 10.1002/2013GL059069
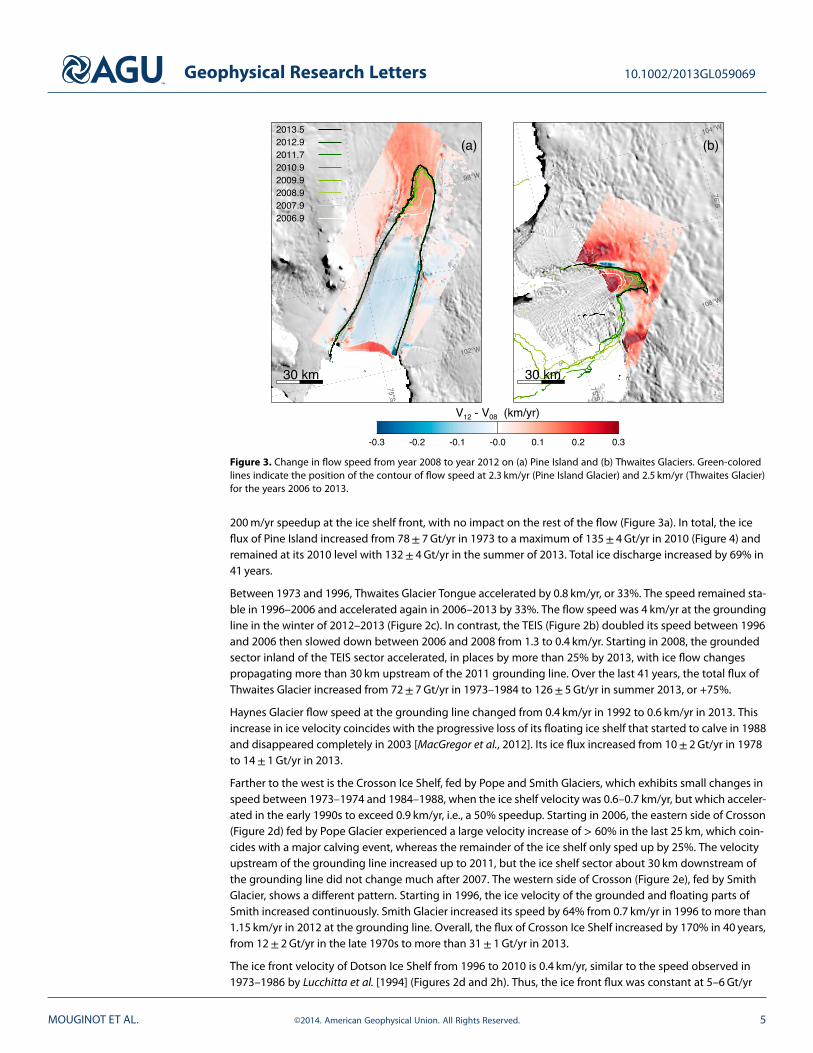
Figure 3. Change in flow speed from year 2008 to year 2012 on (a) Pine Island and (b) Thwaites Glaciers. Green-coloredlines indicate the position of the contour of flow speed at 2.3 km/yr (Pine Island Glacier) and 2.5 km/yr (Thwaites Glacier)for the years 2006 to 2013.
200 m/yr speedup at the ice shelf front, with no impact on the rest of the flow (Figure 3a). In total, the iceflux of Pine Island increased from 78± 7 Gt/yr in 1973 to a maximum of 135± 4 Gt/yr in 2010 (Figure 4) andremained at its 2010 level with 132± 4 Gt/yr in the summer of 2013. Total ice discharge increased by 69% in41 years.
Between 1973 and 1996, Thwaites Glacier Tongue accelerated by 0.8 km/yr, or 33%. The speed remained sta-ble in 1996–2006 and accelerated again in 2006–2013 by 33%. The flow speed was 4 km/yr at the groundingline in the winter of 2012–2013 (Figure 2c). In contrast, the TEIS (Figure 2b) doubled its speed between 1996and 2006 then slowed down between 2006 and 2008 from 1.3 to 0.4 km/yr. Starting in 2008, the groundedsector inland of the TEIS sector accelerated, in places by more than 25% by 2013, with ice flow changespropagating more than 30 km upstream of the 2011 grounding line. Over the last 41 years, the total flux ofThwaites Glacier increased from 72± 7 Gt/yr in 1973–1984 to 126± 5 Gt/yr in summer 2013, or +75%.
Haynes Glacier flow speed at the grounding line changed from 0.4 km/yr in 1992 to 0.6 km/yr in 2013. Thisincrease in ice velocity coincides with the progressive loss of its floating ice shelf that started to calve in 1988and disappeared completely in 2003 [MacGregor et al., 2012]. Its ice flux increased from 10± 2 Gt/yr in 1978to 14± 1 Gt/yr in 2013.
Farther to the west is the Crosson Ice Shelf, fed by Pope and Smith Glaciers, which exhibits small changes inspeed between 1973–1974 and 1984–1988, when the ice shelf velocity was 0.6–0.7 km/yr, but which acceler-ated in the early 1990s to exceed 0.9 km/yr, i.e., a 50% speedup. Starting in 2006, the eastern side of Crosson(Figure 2d) fed by Pope Glacier experienced a large velocity increase of > 60% in the last 25 km, which coin-cides with a major calving event, whereas the remainder of the ice shelf only sped up by 25%. The velocityupstream of the grounding line increased up to 2011, but the ice shelf sector about 30 km downstream ofthe grounding line did not change much after 2007. The western side of Crosson (Figure 2e), fed by SmithGlacier, shows a different pattern. Starting in 1996, the ice velocity of the grounded and floating parts ofSmith increased continuously. Smith Glacier increased its speed by 64% from 0.7 km/yr in 1996 to more than1.15 km/yr in 2012 at the grounding line. Overall, the flux of Crosson Ice Shelf increased by 170% in 40 years,from 12± 2 Gt/yr in the late 1970s to more than 31± 1 Gt/yr in 2013.
The ice front velocity of Dotson Ice Shelf from 1996 to 2010 is 0.4 km/yr, similar to the speed observed in1973–1986 by Lucchitta et al. [1994] (Figures 2d and 2h). Thus, the ice front flux was constant at 5–6 Gt/yr
MOUGINOT ET AL. ©2014. American Geophysical Union. All Rights Reserved. 5
Geophysical Research Letters 10.1002/2013GL059069
1980 1990 2000 2010
Year
60
80
100
120
140
Ice
flux
(Gt/y
r)
Pine Island
Thwaites
(a)
1980 1990 2000 2010
Year
5
10
15
20
25
30
35
40
Haynes
Crosson/Smith+Pope
Dotson/Kohler
(b)
1980 1990 2000 2010
Year
150
200
250
300
350
All glaciers(c)
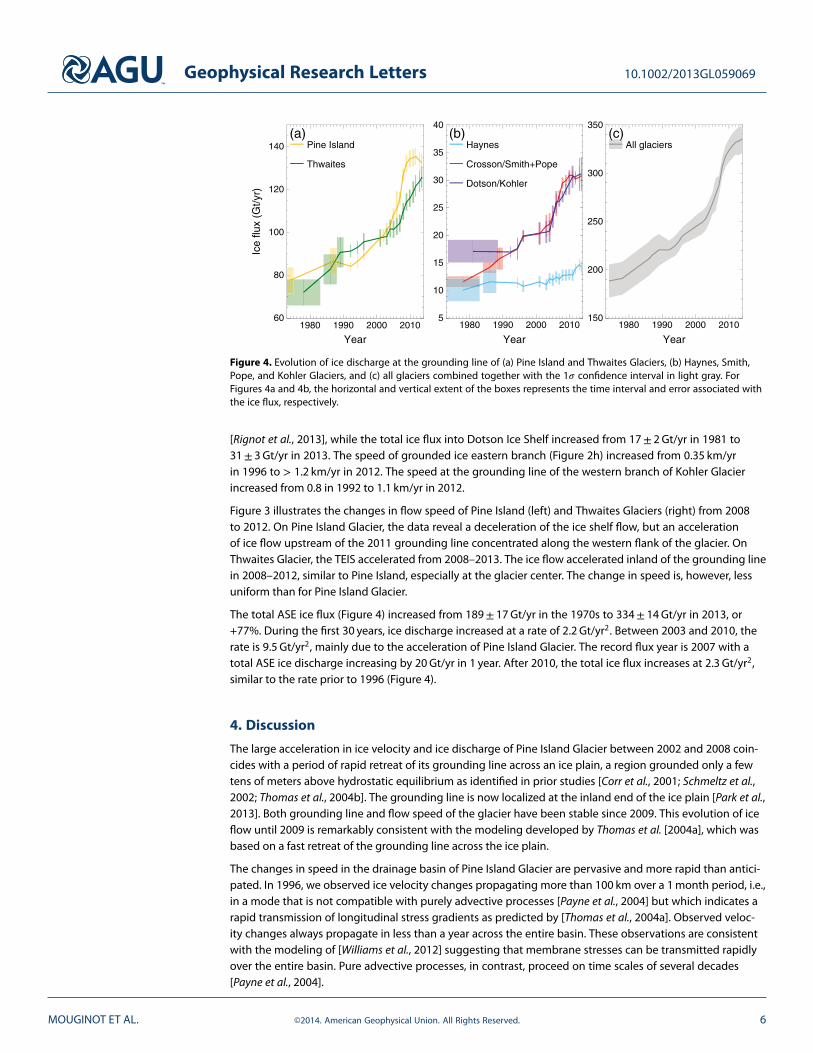
Figure 4. Evolution of ice discharge at the grounding line of (a) Pine Island and Thwaites Glaciers, (b) Haynes, Smith,Pope, and Kohler Glaciers, and (c) all glaciers combined together with the 1𝜎 confidence interval in light gray. ForFigures 4a and 4b, the horizontal and vertical extent of the boxes represents the time interval and error associated withthe ice flux, respectively.
[Rignot et al., 2013], while the total ice flux into Dotson Ice Shelf increased from 17± 2 Gt/yr in 1981 to31± 3 Gt/yr in 2013. The speed of grounded ice eastern branch (Figure 2h) increased from 0.35 km/yrin 1996 to > 1.2 km/yr in 2012. The speed at the grounding line of the western branch of Kohler Glacierincreased from 0.8 in 1992 to 1.1 km/yr in 2012.
Figure 3 illustrates the changes in flow speed of Pine Island (left) and Thwaites Glaciers (right) from 2008to 2012. On Pine Island Glacier, the data reveal a deceleration of the ice shelf flow, but an accelerationof ice flow upstream of the 2011 grounding line concentrated along the western flank of the glacier. OnThwaites Glacier, the TEIS accelerated from 2008–2013. The ice flow accelerated inland of the grounding linein 2008–2012, similar to Pine Island, especially at the glacier center. The change in speed is, however, lessuniform than for Pine Island Glacier.
The total ASE ice flux (Figure 4) increased from 189± 17 Gt/yr in the 1970s to 334± 14 Gt/yr in 2013, or+77%. During the first 30 years, ice discharge increased at a rate of 2.2 Gt/yr2. Between 2003 and 2010, therate is 9.5 Gt/yr2, mainly due to the acceleration of Pine Island Glacier. The record flux year is 2007 with atotal ASE ice discharge increasing by 20 Gt/yr in 1 year. After 2010, the total ice flux increases at 2.3 Gt/yr2,similar to the rate prior to 1996 (Figure 4).
4. Discussion
The large acceleration in ice velocity and ice discharge of Pine Island Glacier between 2002 and 2008 coin-cides with a period of rapid retreat of its grounding line across an ice plain, a region grounded only a fewtens of meters above hydrostatic equilibrium as identified in prior studies [Corr et al., 2001; Schmeltz et al.,2002; Thomas et al., 2004b]. The grounding line is now localized at the inland end of the ice plain [Park et al.,2013]. Both grounding line and flow speed of the glacier have been stable since 2009. This evolution of iceflow until 2009 is remarkably consistent with the modeling developed by Thomas et al. [2004a], which wasbased on a fast retreat of the grounding line across the ice plain.
The changes in speed in the drainage basin of Pine Island Glacier are pervasive and more rapid than antici-pated. In 1996, we observed ice velocity changes propagating more than 100 km over a 1 month period, i.e.,in a mode that is not compatible with purely advective processes [Payne et al., 2004] but which indicates arapid transmission of longitudinal stress gradients as predicted by [Thomas et al., 2004a]. Observed veloc-ity changes always propagate in less than a year across the entire basin. These observations are consistentwith the modeling of [Williams et al., 2012] suggesting that membrane stresses can be transmitted rapidlyover the entire basin. Pure advective processes, in contrast, proceed on time scales of several decades[Payne et al., 2004].
MOUGINOT ET AL. ©2014. American Geophysical Union. All Rights Reserved. 6
Geophysical Research Letters 10.1002/2013GL059069
A second major observation of recent changes in ice dynamics is the acceleration of Thwaites Glacier since2006. Prior observations suggested that the glacier did not experience significant change in flow speedbetween 1992 and 2005. During a transition period between 2006 and 2008, as the main part of the glacieraccelerated, the TEIS switched from accelerating to decelerating. Between 1996 and 2000, the TEIS wasreported to be cracking up and rifting at its grounding line [Rignot, 2006], which indicated excessive lon-gitudinal straining of the ice shelf, i.e., the ice shelf was pulled away from the continent. This can only beexplained from the entrainment of the TEIS by lateral shearing from the fast-moving main ice tongue. Theregion in between the two floating sections is a complex mixture of rifts, cracks, and icebergs trapped in azone of intense shear: 4 km/yr to 0.6 km/yr in less than 1 to 9 km. We hypothesize that prior to 2006 the twoice shelves were strongly coupled, which explains the faster flow rate of TEIS. After 2006, the coupling musthave decreased, with the result that TEIS decelerates. The physical processes responsible for the change incoupling are unknown at this time. They could be due to oceanic changes [Jacobs et al., 2011, 2012], to thecalving of the main ice tongue in 2010 [MacGregor et al., 2012], or to mechanical failure of the ice mélange.For instance, warmer waters beneath the ice shelf would melt the ice tongue faster, reduce back stressfrom the main glacier, and entrain speedup, which would significantly affect the mechanical rigidity of themélange between the TEIS and the main ice tongue. After 2008, the TEIS accelerated again, but a restora-tion of the coupling between the two ice shelves seems unlikely as the main ice tongue calved in 2010. Therecent acceleration might be better explained by a reduced buttressing of the pinning point at its terminus[Tinto and Bell, 2011; MacGregor et al., 2012] and/or the retreat of its grounding line due to enhanced thin-ning caused by warmer ocean water. This behavior requires further investigation using numerical modeling.It illustrates the important role of the TEIS in the overall evolution of Thwaites Glacier. The observationsalso indicate that changes in ice dynamics of Thwaites Glacier are just as significant as those of Pine IslandGlacier. Thwaites Glacier is, however, 120 km wide and not confined in a valley [Fretwell et al., 2013], hencewith the potential for a much larger increase in ice flux if the flow acceleration continues at the same pace.
Between 1996 and 2008, the grounding line of Smith Glacier retreated across a 20 km long ice plaingrounded only a few tens of meters above hydrostatic equilibrium [Rignot, 2006]. Ice thinning of severalmeters per year, recorded by altimeters, must have been sufficient to bring the ice plain to floatation, reducebuttressing at the grounding line, and entrain further speedup, thinning, and glacier retreat [Thomas et al.,2004a]. The Crosson Ice Shelf doubled its grounding-line ice flux in the last 41 years. The flow changes onCrosson Ice Shelf are proportionally larger than those on Pine Island and Thwaites Glaciers. Future studiesshould examine the apparent great sensitivity of Smith Glacier to thermal forcing from the ocean.
In complete contrast, Dotson Ice Shelf maintained a steady flow during the entire observation period. Withan area-average thinning rate of 2.9± 0.3 m/yr [Rignot et al., 2013], its ice front flux has remained steadyor decreased slightly at about 5–6 Gt/yr [Rignot et al., 2013], while its grounding-line flux continuouslyincreased between 1981 and 2013 from 17 Gt/yr to 31 Gt/yr. The surface mass balance of the 5803 km2
ice shelf did not change detectably during that period, but the ice shelf volume decreased significantly[Pritchard et al., 2012]. We attribute this evolution to an increase in ice shelf melting, caused by enhancedadvection of oceanic heat beneath the ice shelf. The Dotson Ice Shelf has a shallow sub-ice shelf cavityinferred from the presence of numerous ice rises on its northern flank as well as in its center. With a sur-face mass balance of 16± 1 Gt/yr [Shepherd et al., 2012], Kohler Glacier changed from near equilibrium in1981 to well out of balance in 2013. Assuming Dotson Ice Shelf was also at equilibrium in 1981 and apply-ing the principles of mass conservation between the ice front and the grounding line, we calculate that thearea-average melt rate of Dotson Ice Shelf increases by 2.6± 0.4 m/yr in 32 years. If we assume a sensitivityof 10 m/yr/◦C, this enhanced melt rate (2.6 m/yr) combined with the thinning (2.9 m/yr) reported by Rignotet al. [2013] would imply that the average ocean thermal forcing beneath the ice shelf increased by about0.55◦C in 32 years.
Despite steady flow at the grounding line of Pine Island Glacier since 2008 (Figure 3), the ice discharge andmass loss of the ASE sector is increasing during the entire observational period, including in 2010–2013.On Pine Island Glacier, the speedup is propagating inland, which is inconsistent with the modeling claimsof stagnation for the next 500 years [Joughin et al., 2010] but consistent with recent studies that indicate astrong coupling between glacier retreat and ice shelf melting [Favier et al., 2014]. The recent accelerationof Thwaites Glacier indicates that all the glaciers in the ASE sector are losing an increasing amount of iceinto the ocean every year. These observations are a possible sign of the progressive collapse of this sector inresponse to the high melting of its buttressing ice shelves by the ocean.
MOUGINOT ET AL. ©2014. American Geophysical Union. All Rights Reserved. 7
Geophysical Research Letters 10.1002/2013GL059069
5. Conclusions
Observations of the ASE of West Antarctica since 1973 indicate speedup of all the glaciers and a steadyincrease in ice discharge into the ocean from the collective ensemble of these large, major glaciers. Duringretreat across their respective ice plains, Pine Island and Smith Glaciers underwent a rapid increase in ice dis-charge. However, since 2009, the ice discharge of Pine Island has remained steady. Thwaites Glacier, whichhad experienced a steady flow since 1992, started to speed up in 2006 and has increased its ice dischargeconsiderably since. The acceleration of Thwaites Glacier more than compensated for the recent stoppage ofthe acceleration of Pine Island Glacier. These satellite measurements and subsequent results are of impor-tance to revise our understanding and projection of the evolution of this major part of West Antarctica.The velocity data analyzed in this study will be available at NSIDC as part of the MEaSUREs project. Untilnumerical ice sheet models coupled with realistic oceanic forcing are able to replicate these observations,projections of the evolution of this sector of West Antarctica should be interpreted with caution.
ReferencesChen, J. L., C. R. Wilson, D. Blankenship, and B. D. Tapley (2009), Accelerated Antarctic ice loss from satellite gravity measurements, Nat.
Geosci., 2, 859–862.Church, J. A., and N. J. White (2011), Sea-level rise from the late 19th to the early 21st century, Surv. Geophys., 32, 585–602.Corr, H., C. Doake, A. Jenkins, and D. Vaughan (2001), Investigations of an “ice plain” in the mouth of Pine Island Glacier, Antarctica, J.
Glaciol., 47, 51–57.Crabtree, D. R., and C. S. M. Doake (1982), Pine Island Glacier and its drainage basin: Results from radio echo-sounding, Ann. Glaciol., 3,
65–70.Favier, L., G. Durand, S. L. Cornford, G. H. Gudmundsson, O. Gagliardini, F. Gillet-Chaulet, T. Zwinger, A. J. Payne, and A. M. Le Brocq (2014),
Retreat of Pine Island Glacier controlled by marine ice-sheet instability, Nat. Clim. Change, 4, 117–121.Ferrigno, J. G., B. K. Lucchitta, K. F. Mullins, A. L. Allison, R. J. Allen, and W. G. Gould (1993), Velocity measurements and changes in
position of Thwaites Glacier/iceberg tongue from aerial-photography, Landsat images and NOAA AVHRR data, Ann. Glaciol., 17,239–244.
Fretwell, P., et al. (2013), Bedmap2: Improved ice bed, surface and thickness datasets for Antarctica, The Cryosphere, 7, 375–393.Holland, D., R. Thomas, B. de Young, M. Ribergaard, and B. Lyberth (2008), Acceleration of Jakobshavn Isbrae triggered by warm
subsurface ocean waters, Nat. Geosci., 1, 659–664.Howat, I. M., K. Jezek, M. Studinger, J. A. MacGregor, J. Paden, D. Floricioiu, R. Russell, M. Linkswiler, and R. T. Dominguez (2012), Rift in
Antarctic Glacier: A unique chance to study ice shelf retreat, Eos. Trans. AGU, 93, 77–78.Jacobs, S., A. Jenkins, H. Hellmer, C. Giulivi, F. Nitsche, B. Huber, and R. Guerrero (2012), The Amundsen Sea and the Antarctic Ice Sheet,
Oceanography, 25, 154–163.Jacobs, S. S., A. Jenkins, C. F. Giulivi, and P. Dutrieux (2011), Stronger ocean circulation and increased melting under Pine Island Glacier
ice shelf, Nat. Geosci., 4, 519–523.Jenkins, A., P. Dutrieux, S. Jacobs, S. McPhail, J. Perrett, A. Webb, and D. White (2010), Observations beneath Pine Island Glacier in West
Antarctica and implications for its retreat, Nat. Geosci., 3, 468–472.Joughin, I., E. Rignot, C. E. Rosanova, B. K. Lucchitta, and J. Bohlander (2003), Timing of recent accelerations of Pine Island Glacier,
Antarctica, Geophys. Res. Lett., 30(13), 1706, doi:10.1029/2003GL017609.Joughin, I., B. E. Smith, and D. M. Holland (2010), Sensitivity of 21st century sea level to ocean-induced thinning of Pine Island Glacier,
Antarctica, Geophys. Res. Lett., 37, L20502, doi:10.1029/2010GL044819.Joughin, I. R., R. Kwok, and M. A. Fahnestock (1998), Interferometric estimation of three-dimensional ice-flow using ascending and
descending passes, IEEE Trans. Geosci. Remote Sens., 36, 25–37.Lindstrom, D., and D. Tyler (1984), Preliminary results of Pine Island and Thwaites Glaciers study, Antarct. J. U.S., 19, 53–55.Lucchitta, B. K., K. F. Mullins, C. E. Smith, and J. G. Ferrigno (1994), Velocities of the Smith Glacier ice tongue and Dotson Ice Shelf,
Walgreen Coast, Marie Byrd Land, West Antarctica, Ann. Glaciol., 20, 101–109.Lucchitta, B. K., C. E. Rosanova, and K. F. Mullins (1995), Velocities of Pine Island Glacier, West Antarctica, from ERS-1 SAR images, Ann.
Glaciol., 21, 277–283.MacGregor, J. A., G. A. Catania, M. S. Markowski, and A. G. Andrews (2012), Widespread rifting and retreat of ice-shelf margins in the
eastern Amundsen Sea Embayment between 1972 and 2011, J. Glaciol., 58, 458–466.Michel, R., and E. Rignot (1999), Flow of Glaciar Moreno, Argentina, from repeat-pass Shuttle Imaging Radar images: Comparison of the
phase correlation method with radar interferometry, J. Glaciol., 45, 93–100.Mouginot, J., B. Scheuchl, and E. Rignot (2012), Mapping of ice motion in Antarctica using synthetic-aperture radar data, Remote Sens., 4,
2753–2767.Park, J. W., N. Gourmelen, A. Shepherd, S. W. Kim, D. G. Vaughan, and D. J. Wingham (2013), Sustained retreat of the Pine Island Glacier,
Geophys. Res. Lett., 40, 2137–2142, doi:10.1002/grl.50379.Payne, A. J., A. Vieli, A. P. Shepherd, D. J. Wingham, and E. Rignot (2004), Recent dramatic thinning of largest West Antarctic ice stream
triggered by oceans, Geophys. Res. Lett., 31, L23401, doi:10.1029/2004GL021284.Pritchard, H. D., S. R. M. Ligtenberg, H. A. Fricker, D. G. Vaughan, M. R. van den Broeke, and L. Padman (2012), Antarctic ice-sheet loss
driven by basal melting of ice shelves, Nature, 484, 502–505.Rignot, E. (1998), Fast recession of a West Antarctic Glacier, Science, 281, 549–551.Rignot, E. (2001), Evidence for rapid retreat and mass loss of Thwaites Glacier, West Antarctica, J. Glaciol., 47, 213–222.Rignot, E. (2002), Ice-shelf changes in Pine Island Bay, Antarctica, 1947–2000, J. Glaciol., 48, 247–256.Rignot, E. (2006), Changes in ice dynamics and mass balance of the Antarctic ice sheet, Philos. Trans. R. Soc. A, 364, 1637–1655.Rignot, E. (2008), Changes in West Antarctic ice stream dynamics observed with ALOS PALSAR data, Geophys. Res. Lett., 35, L12505,
doi:10.1029/2008GL033365.Rignot, E., and P. Kanagaratnam (2006), Changes in the velocity structure of the Greenland ice sheet, Science, 311, 986–990.
AcknowledgmentsThis work was performed at theUniversity of California, Irvine, andat the Jet Propulsion Laboratory,California Institute of Technology,under a grant from the NationalAeronautics and Space Admin-istration’s Cryospheric ScienceProgram and MEaSUREs program.The authors gratefully acknowl-edge the European Space Agency,the Canadian Space Agency, theJapan Aerospace Exploration Agency,and the Deutsches Zentrum fürLuft- und Raumfahrt for the use ofERS-1&-2, RADARSAT-1&-2, ALOSPALSAR, and TanDEM-X data,respectively. Data acquisition wascoordinated by the Space Task Group(2006–2009) and the Polar Space TaskGroup (post 2009).
The Editor thanks Robert Thomasand an anonymous reviewer for theirassistance in evaluating this paper.
MOUGINOT ET AL. ©2014. American Geophysical Union. All Rights Reserved. 8
Geophysical Research Letters 10.1002/2013GL059069
Rignot, E., D. Vaughan, M. Schmeltz, T. Dupont, and D. MacAyeal (2002), Acceleration of Pine Island and Thwaites Glaciers, WestAntarctica, Ann. Glaciol., 34, 189–194.
Rignot, E., J. Bamber, M. van den Broeke, C. Davis, Y. Li, W. van de Berg, and E. van Meijgaard (2008), Recent Antarctic ice mass loss fromradar interferometry and regional climate modelling, Nat. Geosci., 1(2), 106–110.
Rignot, E., J. Mouginot, and B. Scheuchl (2011a), Antarctic grounding line mapping from differential satellite radar interferometry,Geophys. Res. Lett., 38, L10504, doi:10.1029/2011GL047109.
Rignot, E., J. Mouginot, and B. Scheuchl (2011b), Ice Flow of the Antarctic Ice Sheet, Science, 333, 1427–1430.Rignot, E., S. Jacobs, J. Mouginot, and B. Scheuchl (2013), Ice shelf melting around Antarctica, Science, 341, 266–270.Rosanova, C. E., B. K. Lucchitta, and J. G. Ferrigno (1998), Velocities of Thwaites Glacier and smaller glaciers along the Marie Byrd Land
coast, West Antarctica, Ann. Glaciol., 27, 47–53.Schmeltz, M., E. Rignot, T. Dupont, and D. MacAyeal (2002), Sensitivity of Pine Island Glacier, West Antarctica, to changes in ice-shelf and
basal conditions: A model study, J. Glaciol., 48, 552–558.Shepherd, A., et al. (2012), A reconciled estimate of ice-sheet mass balance, Science, 338, 1183–1189.Thomas, R., E. Rignot, P. Kanagaratnam, W. Krabill, and G. Casassa (2004a), Force-perturbation analysis of Pine Island Glacier, Antarctica,
suggests cause for recent acceleration, Ann. Glaciol., 39, 133–138.Thomas, R., et al. (2004b), Accelerated sea-level rise from West Antarctica, Science, 306, 255–258.Tinto, K. J., and R. E. Bell (2011), Progressive unpinning of Thwaites Glacier from newly identified offshore ridge: Constraints from
aerogravity, Geophys. Res. Lett., 38, L20503, doi:10.1029/2011GL049026.Williams, C. R., R. C. A. Hindmarsh, and R. J. Arthern (2012), Frequency response of ice streams, Proc. R. Soc. A, 468, 3285–3310.Williams, R. S., Jr., J. G. Ferrigno, T. M. Kent, and W. J. Schoonmaker Jr. (1982), Landsat images and mosaics of Antarctica for mapping and
glaciological studies, Ann. Glaciol., 3, 321–327.Wingham, D. J., D. W. Wallis, and A. Shepherd (2009), Spatial and temporal evolution of Pine Island Glacier thinning, 1995–2006, Geophys.
Res. Lett., 36, L17501, doi:10.1029/2009GL039126.
MOUGINOT ET AL. ©2014. American Geophysical Union. All Rights Reserved. 9