antecedents and consequences of perceived customer value
TRANSCRIPT

Antecedents and consequences ofperceived customer value in the
restaurant industryA preliminary test of a holistic model
Vincent M. ThielemannHochschule Heilbronn, Heilbronn, Germany
Michael C. OttenbacherKansas State University, Manhattan, Kansas, USA, and
Robert James HarringtonSchool of Hospitality Business Management, College of Business,
Washington State University, Richland, Washington, USA
AbstractPurpose – The purpose of this paper is to identify the antecedents of perceived customer value, such as theperceived quality and perceived sacrifices, and the effects on customer satisfaction and customer loyalty (CL)in the restaurant industry.Design/methodology/approach – Based on an extensive literature review, a research model andquestionnaire were designed. To assess the hypothesised relationships, data were collected in a field survey.Partial least squares regression (a variance-based regression analysis of SEM) was selected to analyse therelationships within the research model.Findings – The findings of this study indicate that the perceived monetary sacrifice (PMS) and perceivedservice quality were found to be antecedents of perceived value (PV), whereas PMS was the major precursorof PV. Further, PV was found to have a substantial influence on customer satisfaction and CL.Originality/value – The study provides a better understanding of the price–value–satisfaction–loyaltyrelationships in the restaurant context in a more holistic sense and recommendations to move this researchstream forward.Keywords Customer loyalty, Customer satisfaction, Perceived customer value, Monetary sacrificePaper type Research paper
IntroductionHistorically, most companies have relied on the supremacy of their products or services todistinguish themselves from competitors and determine prices based on their costs or basedon the prices of their competition. Many companies, however, have been looking for newways to distinguish themselves with more focus on customers rather than only theirproducts, services or competition (Rao and Kartono, 2009). Of all the marketing decisions,the determination price is the major decision that directly affects revenue and yield.In customer-centric pricing (value-based pricing), the customers’ value perceptions are in thefocus. In general, the delivery of value has evolved to become the primary goal ofbusinesses, rather than generating profit (Reichheld and Teal, 1996). Thus, the question isnot whether but how companies compete in delivering value (Harrington et al., 2017).
International Hospitality ReviewVol. 32 No. 1, 2018pp. 26-45Emerald Publishing Limited2516-8142DOI 10.1108/IHR-06-2018-0002
Received 25 June 2018Revised 27 August 2018Accepted 12 September 2018
The current issue and full text archive of this journal is available on Emerald Insight at:www.emeraldinsight.com/2516-8142.htm
© Vincent M. Thielemann, Michael C. Ottenbacher and Robert James Harrington. Published inInternational Hospitality Review. Published by Emerald Publishing Limited. This article is publishedunder the Creative Commons Attribution (CC BY 4.0) licence. Anyone may reproduce, distribute,translate and create derivative works of this article (for both commercial and non-commercialpurposes), subject to full attribution to the original publication and authors. The full terms of thislicence may be seen at http://creativecommons.org/licences/by/4.0/legalcode
26
IHR32,1

The restaurant industry is a highly competitive market in which customers cannotevaluate the purchase before consumption and meets the prerequisites to implementvalue-based pricing (Holden and Burton, 2008). The application of value-based pricing inother industries has provided evidence that it can increase revenues and affect customer’spurchase behaviour. In spite of the stated importance of delivering value, practitioners andresearchers still have a dissonance on the antecedents and consequences of perceived value(PV). Therefore, the importance of the current study lies in identifying some of the keyantecedents and consequences related to restaurants’ PV and the resulting customerbehaviours. A clearer understanding is critical for decisions on pricing strategies, valueproposition strategies and restaurant success.
Literature reviewToday’s customers have a strong value orientation seeking quality and an outcome thatexceeds the price they have paid for a product or service. Many companies and recentresearch has suggested setting prices based on perceived customer value rather thantraditional cost-based pricing (Chandler and Lusch, 2015; Harrington et al., 2017;Hinterhuber and Liozu, 2012; Zheng and Forgacs, 2017). Thus, pricing should be not onlyabout setting prices based on costs and the competition but about justifying a price basedon PV. While value has numerous definitions in the literature, it appears clear that valuemust be communicated and delivered to meet or exceed customer expectations(Simon, 2015). As Kotler and Keller (2012) stated, “the key to perceived-value pricing is todeliver more unique value than the competitor […]” (p. 421).
The concept of customer value appears to be impacted by the concepts of quality,benefits, sacrifices and utility; these constructs are often not clearly defined and subjectto individual perceptions (Woodruff, 1997). Harrington et al. (2017) suggested a model ofvalue-based strategies for quick service restaurants (QSR) that included “7 Ps” tied tomarketing decisions and consumer value assessments that included differentiation fromcompetitors, relevance to fulfilling consumer needs, esteem provisions (quality andreliability), and consumer knowledge of the brand. While the concept of consumer value andvalue pricing has been studied for several decades, defining value and understandingperceptions of value by consumers in the restaurant experience remains a challenge for bothpractitioners and researchers.
The following sections provide an overview of earlier study of value-based pricing,customer value, PV and quality, perceived sacrifices and consumer outcomes.
Customer value and value-based pricingWith no consistent definition, a major problem in customer value research is thecomplexity of the construct and interdependence of the PV components, such as quality,utility, price and values (Lapierre et al., 1999). Zeithaml (1988) defined value as “theconsumer’s overall assessment of the utility of a product based on perceptions of what isreceived and what is given” (p. 14). Other researchers extended this to a multi-dimensionalapproach with an interdependence of the perceived price, quality, benefit and sacrifice(Babin et al., 1994; Sweeney and Soutar, 2001). Recent research on restaurants indicated aweakness remains on assessing value strategies but provided support for the notion thatvalue is subjective and need-based (Harrington et al., 2017). Recent research in servicessuggested that the assessment of value is not straightforward with links toother stakeholders’ processes as well as personal factors of consumers (Chandler andLusch, 2015).
Perceived value pricing is defined as “a customer-centric approach […] that prioritizes thecustomer’s product valuation above cost, competition and other considerations”(Rao and Kartono, 2009, p. 29). When setting prices, the customer’s PV, and not what the
27
Perceivedcustomer value
customer is willing to pay, forms the basis of this pricing approach. While cost-plus pricing setsa price floor, perceived value pricing sets an upper price ceiling that reflects the PV (Armstronget al., 2016). Hence, the major deficit of cost-plus pricing is it neglects the fact that customersmay be willing to pay more than the company cost requirements – if they perceive the value tobe greater than the price (Chandler and Lusch, 2015; Schlissel and Chasin, 1991).
Traditional cost-plus pricing schemes are thought to utilise five pricing strategy drivers:an awareness of the value that the services and products provide, an understanding of theservice life cycle, the economics of the branch, competitors’ reactions and a companyconsensus on a pricing strategy (Holden and Burton, 2008). The process of using perceivedvalue pricing starts with the identification of customer needs, then prices are determinedbased on the value provided. Afterwards, the provider tries to minimise costs incurred byimproving the processes based on customer needs (Armstrong et al., 2016).
The PV in attributes such as service, atmosphere, food and prices in the consumptionprocess has been shown to vary across restaurant types (Ha and Jang, 2012). Harringtonet al. (2012) found the value placed on various attributes impacted positive or negativeexperiences and varied based on consumer age, gender and dining frequency. Arora andSinger (2006) found that higher levels of service and product quality positively influencedPV, whereas price negatively influenced PV. Thus, the need to understand these trade-offsin the value-based pricing process cannot be overstated.
Kim et al. (2012) suggested “brand attitude should be an antecedent of customersatisfaction and behavioural intentions when it is treated as a pre-purchase construct”(p. 407). These competing propositions raise the question of whether brand attitude is to beconsidered as an antecedent or an outcome of customer satisfaction that is formed over time.As this study focuses on post-purchase behaviour, brand attitude is thought to be aconsequence of customer satisfaction and antecedent of PV in line with Oh (2000), Babinet al. (1994) and Harrington et al. (2017).
Perceived qualityThree of the main characteristics of a service (intangibility, inseparability andheterogeneity) have been shown to make it difficult to assess customers’ serviceevaluation (Parasuraman et al., 1985). The perishability characteristic along with the otherthree has been shown to be related to pricing. Adapting earlier approaches (i.e. Lovelock,1983; Nelson, 1974), Parasuraman et al. (1985) developed a popular model to assess perceivedservice quality (SERVQUAL) and argued these determinants of service quality may overlapand are subject to individual judgement on their importance.
This early service quality model has since been adapted to a variety of service contextssuch as DINESERV (Kim et al., 2009), SEVRPERF ( Jain and Gupta, 2004), HOLSTAT(Tribe and Snaith, 1998) and others indicating similarities and differences based oncontext. Recent research by Dasu and Chase (2013) proposed the need to design serviceoperations to impact perceived quality via emotions and consumers’ hedonic state. Thus,perceived service quality in restaurants appears to have an impact on perceived value(Alhelalat et al., 2017), be multi-dimensional in nature and an aggregate of interdependentattributes (Sánchez-Fernández and Iniesta-Bonillo, 2007). PV and quality appearidiosyncratic in nature with opportunities for firm control over various intangibleaspects of the service process, assuming firms can identify key antecedents of PV andconsumer behaviours.
Perceived non-monetary and monetary sacrificeFollowing Zeithaml (1988), value has been defined as a gap between what the customerreceives (gets) and what the customer sacrifices (gives), including monetary andnon-monetary sacrifices, such as the accessibility to and the time spent in the restaurant.
28
IHR32,1

Considering consumers’ price judgement, Grewal et al. (1998) found consumers comparethe actual price with similar past experiences and develop an internal reference price. Thisis influenced by advertised prices and reflects a reference point in the consumer’s memory.Adapting this approach, Ashton et al. (2010) found consumers compared differentrestaurant meal attributes with their internal reference price and made value evaluationsaccordingly. Further, restaurant consumers perceived non-monetary sacrifices (PNMS) toinclude “a trade-off between the time and energy waiting for a meal and service” (Ashtonet al., 2010, p. 213; Tam, 2004).
Scitovszky (1945) found consumers did not solely see the price as a sacrifice but also asa quality cue. In this vein, Athola (1984) found that price reflects what the consumer mustgive to obtain a product and provides a basis for price/PV research. The definition ofdifferentiating between “give” and “get” components has been adapted by manyresearchers (e.g. Parasuraman et al., 1994; Sweeney et al., 1999; Zeithaml, 1988). Earlyresearch found that previous experiences and brand knowledge diminished the negativeeffect of price (Rao and Monroe, 1989). Similarly, Arora and Singer (2006) found the highdegree of negative influence from price on PV could be balanced with positive influencefactors. In contrast, Monroe (1990) suggested improving other cues would not have thesame effect on the perceived benefit compared to the effect of a price decrease on perceivedsacrifice. Thus, consumers appear to compare price with past experiences of similarproducts and services; then, they develop an internal reference price that can be influencedby advertised prices.
While the impact of the price on perceived quality and PV appears lower when thecustomers have brand familiarity, there is no consensus on the effect of familiarity leveland the interaction with a quality inference based on price. Studies have demonstrated thenegative relationship between price and PV when consumers receive limited informationon the brand (Dodds et al., 1991). Simon (2015) found customers judge quality when “theabsolute price of the product is not very high, when they have little transparency on pricesfor alternatives, or when they are under time pressure” (p. 29). Tellis and Gaeth (1990)examined the impact of incomplete information on price quality judgements andconsumers’ choice; they found two components of information impacted consumerchoices: objective information and personal experience. Past experiences may leadconsumers to infer quality based on price or consumers may infer that the higher price isthe result of a willingness to pay by the market for the degree of quality (Kwun and Oh,2004; Tellis and Gaeth, 1990). While some sort of trade-off between what the restaurantcustomer “gives” compared to “gets” exists, a clear understanding of the relationshipsamong sacrifices and perceived quality and value is lacking.
Customer satisfaction and post-purchase behaviourKotler and Keller (2012) defined customer satisfaction as the reflection of “a person’sjudgement of a product’s perceived performance in relationship to expectations” (p. 32).An outcome that is below expectations was proposed to result in a negative disconfirmation,whereas, a performance outcome assessed above the reference point resulted in a positivedisconfirmation (Oliver, 1980). While many have adopted this paradigm, a directrelationship between outcomes and satisfaction has been elusive.
Tam (2004) found that PV had a higher impact on post-purchase intentions than customersatisfaction. The study revealed including perceived sacrifice, value, service quality andcustomer satisfaction provided a framework for better prediction of post-purchase behaviour.For example, consumers may perceive high service quality but the effect on PV could bediminished by a high perceived sacrifice (Tam, 2004). Thus, customers may be satisfied with aservice but still perceive low value due to high perceived sacrifice.
29
Perceivedcustomer value

While it has been proposed that post-purchase intentions can partly be explained by thePV of a service (Bolton and Drew, 1991), a positively perceived price-performance ratio issuggested to influence future intentions directly (McDougall and Levesque, 2000). Hence,weaknesses in earlier research is the neglected direct influence of PV on future intentionsand the assumption that perceived value primarily contributed to customer satisfaction andindirectly to future intentions.
Generally, post-purchase behaviour is separated into two main areas: intention toreturn and positive word-of-mouth. Intention to return can be defined as a customer’sdesire to repeatedly visit and purchase in an establishment (Kim et al., 2009). For therestaurant industry, the management of word-of-mouth is crucial as it can quickly spreadwhen a negative experience occurs (Harrington et al., 2019; Söderlund, 1998). Severalstudies have found a positive relationship between satisfaction and the likelihood ofpositive word-of-mouth; when customer expectations are exceeded, customers appearedmore likely to return to the restaurant and tell others about the experience (e.g. Ha andJang, 2012; Jalilvand et al., 2017). Due to online opinion platforms, the range of potentialcustomers that can be impacted by word-of-mouth has increased dramatically. Onlinereviews have a double meaning for consumers; they provide information about qualityand function as recommendations to other users (Park et al., 2007). Zhang et al. (2010)found online reviews are crucial as customers can obtain pre-purchase information on theintangible hospitality service. A study in the hotel industry revealed that positive onlinecustomer reviews enhanced the awareness and attitude of customers towards anestablishment (Vermeulen and Seegers, 2009).
Customer satisfaction has been found to be an essential premise of customer loyalty (CL)and a key driver of financial performance (Heskett et al., 1997). For two decades, researchhas shown that perceived quality increases PV, which in turn increases customersatisfaction – ensuring a competitive advantage and long-term success (e.g. Ali et al., 2016).
Etemad-Sajadi and Rizzuto (2013) found customers must be highly satisfied to becomeloyal and profitable for a company with customer satisfaction seen as an antecedent toloyalty. While some authors suggested perceived service quality as an antecedent tosatisfaction (Cronin and Taylor, 1992; Parasuraman et al., 1985), others suggested servicequality as a consequence (Bolton and Drew, 1991). The assumption of perceived servicequality as an antecedent impacting the price-performance ratio and leading to eithersatisfaction or dissatisfaction was adopted here.
HypothesesPrior studies have revealed that restaurant attributes affect behavioural intentions (Ryuand Han, 2010). Ambience, food quality and service quality are the most commonrestaurant attributes (DiPietro et al., 2011; Ryu and Han, 2010). Nevertheless, there is noconsensus on the causal relationship of restaurant attributes or the constructs of servicequality, PV and customer satisfaction on CL. But, there appears to be agreement on adifferentiation between give and get components related to PV. This study’s definition ofPV is a “cognitive trade-off between perceived quality and sacrifice” (Dodds et al., 1991,p. 316). The literature indicated customers’ perceive price as a monetary sacrifice and thetime spent as a non-monetary sacrifice; product and service quality are perceivedas benefits (e.g. Parasuraman et al., 1994; Sweeney et al., 1999). Additionally, a positiveprice/perceived quality relationship was assumed; Sweeney et al. (1999) found price wasoften used as a cue to infer quality when only limited information was available. Studiesalso revealed a negative relationship among perceived sacrifices and perceived servicequality, making price perception a multi-faceted influencing variable. However,Tam (2004) suggested price was not a factor that influenced the perception of service
30
IHR32,1
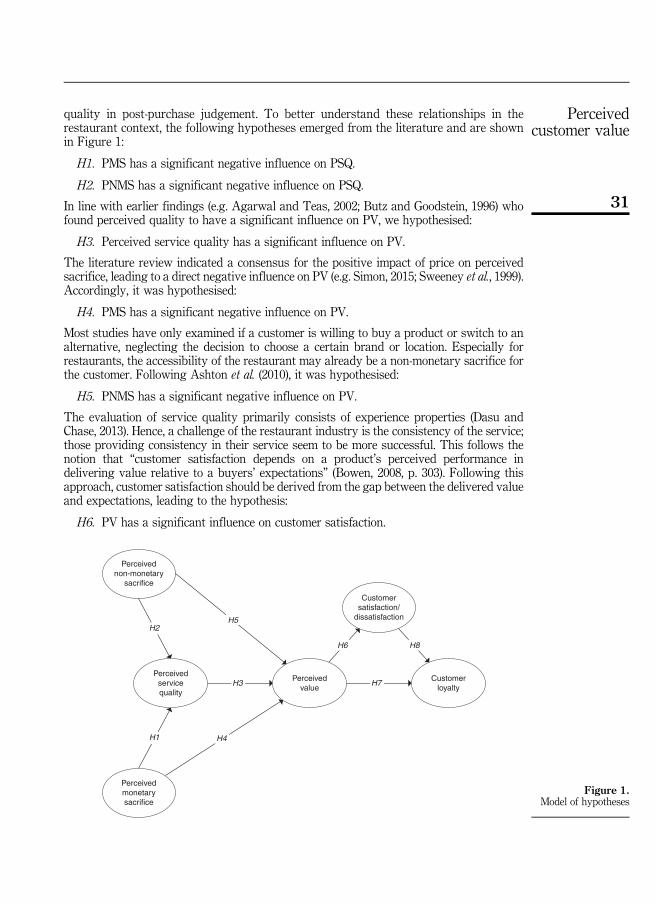
quality in post-purchase judgement. To better understand these relationships in therestaurant context, the following hypotheses emerged from the literature and are shownin Figure 1:
H1. PMS has a significant negative influence on PSQ.
H2. PNMS has a significant negative influence on PSQ.
In line with earlier findings (e.g. Agarwal and Teas, 2002; Butz and Goodstein, 1996) whofound perceived quality to have a significant influence on PV, we hypothesised:
H3. Perceived service quality has a significant influence on PV.
The literature review indicated a consensus for the positive impact of price on perceivedsacrifice, leading to a direct negative influence on PV (e.g. Simon, 2015; Sweeney et al., 1999).Accordingly, it was hypothesised:
H4. PMS has a significant negative influence on PV.
Most studies have only examined if a customer is willing to buy a product or switch to analternative, neglecting the decision to choose a certain brand or location. Especially forrestaurants, the accessibility of the restaurant may already be a non-monetary sacrifice forthe customer. Following Ashton et al. (2010), it was hypothesised:
H5. PNMS has a significant negative influence on PV.
The evaluation of service quality primarily consists of experience properties (Dasu andChase, 2013). Hence, a challenge of the restaurant industry is the consistency of the service;those providing consistency in their service seem to be more successful. This follows thenotion that “customer satisfaction depends on a product’s perceived performance indelivering value relative to a buyers’ expectations” (Bowen, 2008, p. 303). Following thisapproach, customer satisfaction should be derived from the gap between the delivered valueand expectations, leading to the hypothesis:
H6. PV has a significant influence on customer satisfaction.
Perceivednon-monetary
sacrifice
H2
H3
H4H1
H6
H7
H8
H5
Customersatisfaction/dissatisfaction
Perceivedservicequality
Perceivedmonetarysacrifice
Perceivedvalue
Customerloyalty
Figure 1.Model of hypotheses
31
Perceivedcustomer value

As the review has shown, there is a general assumption that PV has an impact onpre-purchase decisions (Zeithaml, 1988) and post-purchase intentions, such as the intentionto patronise (Arora and Singer, 2006; Lee et al., 2005; Tam, 2004), word-of-mouthrecommendations (Lee et al., 2005; Tam, 2004) and CL (Tam, 2004; Chang, 2013; Lee et al.,2005; McDougall and Levesque, 2000). These behavioural consequences have been selectedas the behavioural expression of CL, as they are likely to affect the providers’ profitability(Söderlund, 1998), leading to the following hypothesis:
H7. PV has a direct influence on CL.
Several studies have indicated that when customer expectations are exceeded, the customeris more likely to return and tell other people, creating word-of-mouth advertising and loyalty(Lee et al., 2005; Ha and Jang, 2012; Oh, 2000, Bowen, 2008). Hence, it is hypothesized that:
H8. Customer satisfaction has a significant influence on CL.
To test these hypotheses, the research model shown in Figure 1 was developed. The value ofthis model is the simultaneous testing of these relationships to better understand theantecedents and consequences in a restaurant context with implications for practitionerresource allocations.
MethodologyBased on the findings of the literature review and the hypotheses, respectively, a survey wasdeveloped. The survey items were adopted from previous studies (Tam, 2004) with minoradjustments to fit the restaurant context. Three questions were posed to measure PNMS andthree questions for PMS (PMS). Five questions were asked to measure perceived servicequality (PSQ), one to measure the PV, two questions to measure customer satisfaction (CS),and three questions related to CL. A seven-point Likert scale, as suggested by, was used.The survey was conducted in one major city in South Germany and one major city in NorthGermany. The sample was taken randomly at locations in these two cities; participants wereasked to respond “based on your last visit in a restaurant […]” and the questionnaire wascompleted via pen and paper (see the Appendix). In sum, 103 people participated in the survey(n¼ 103). The respondents were slightly more women (57 per cent) than men (43 per cent) andranged relatively equally by age group: 18–25 (10 per cent), 26–35 (19 per cent), 36-45 (15 percent), 46–55 (19 per cent), 56–65 (19 per cent) and 65+ (17 per cent).
While larger sample sizes tend to produce more reliable results (Bentler and Yuan, 1999),a sufficient sample size is dependent on the number of latent variables (LVs) and the numberof indicators per LV in PLS. Because PLS has no assumptions of data distribution, it isrecommended when the study sample size is small (Wong, 2013). Several rules-of-thumbprovide support for the adequacy of the sample size in this study. First, the number ofindicators used to measure a single construct should be at least ten times the largest number(Hair et al., 2013). In this study, five indicators was the largest number of indicators perconstruct (on PSQ) with a 20+ times relationship. Second, the sample should be ten times thelargest number of structural paths directed at any particular construct in the model. In thecurrent study, the largest number of paths to any one construct was three (PV); thus, thisrule was not violated (Hair et al., 2013). Additionally, given typical significance levels, powerand R2 values in business research, the suggested minimum sample size for a maximumnumber of three arrows pointing to a model LV is 59 respondents (Wong, 2013).
Statistical first-generation techniques, such as linear regressions, correlations andvariances analyses are only able to analyse a complex model in fragments (Lowryand Gaskin, 2014). Therefore, the partial least squares (PLS) regression (a variance-basedregression analysis of SEM) was selected to analyse the relationships within the researchmodel. For the analysis, SmartPLS 3 (Ringle et al., 2015) was used. First, the relationship
32
IHR32,1

between the indicators and the LVs were determined and a reflective model wasdeveloped. Next, a PLS algorithm was calculated providing criteria (squared outerloadings, composite reliability, average variance extracted (AVE), variance inflation factor(VIF), Fornell–Larcker criterion, among others) to analyse as indicators of the modelgoodness-of-fit (GoF). In addition, t-statistics and probability values were calculated toassess statistical significance (tested at 95 % confidence).
Goodness-of-fitThe first run of the PLS was used to determine whether the outer loadings of the indicatorswere above the threshold of β¼ 0.7 (Wong, 2013; Lowry and Gaskin, 2014). To enhanceaccuracy, indicators below this threshold were removed from this reflective model (Lowryand Gaskin, 2014; Götz et al., 2010).
Next, the model’s fit and internal reliability were tested. Several tests on the reliabilityand validity of the model were conducted before the analysis of causal relationships, indirecteffects or significance could be performed. In PLS–SEM, the traditional reliability indicator(Cronbach’s α) is not a reliable indicator of model GoF (Bagozzi and Yi, 1988). Due to this,composite reliability was assessed by measuring the GoF of the model (Bagozzi and Yi,1988; Hair et al., 2011) using a threshold of ρ¼ 0.6 (Wong, 2013). The composite reliabilityfor all variables exceeded the threshold of ρ¼ 0.6, indicating good internal consistency.With the exception of PSQ indicators, the square loadings of each indicator on the LVs wereshown to be higher than β²¼ 0.7, indicating reliability. However, due to the exploratorynature of this study, even PSQ indicators exceeded the exploratory threshold (aboveβ²¼ 0.4) (Wong, 2013; Lowry and Gaskin, 2014).
The convergent validity of the model indicators was tested by analysing the AVE; allvariables exceeded the 0.5 threshold (Wong, 2013; Götz et al., 2010). Consequently,convergent validity of the model was confirmed. To analyse whether correlations for theindicators on different LVs existed, discriminant validity was tested. The Fornell –Larckercriterion in the present model was not violated; the square roots of the LV AVEs werehigher than the correlations among the others (Hair et al., 2011, p. 145). However,Henseler et al. (2015) criticised the Fornell–Larcker criterion suggesting the heterotrait–monotrait–ratio test (HTMT). As a second test, the HTMT (0.862) was slightly above thepreferred value of less than 0.85 but deemed acceptable for this exploratory study(Henseler et al., 2015).
To analyse the GoF, the VIF of the inner and outer model were analysed. A VIF below5 represents a good overall fit of the model and shows that there are no multi-collinearityproblems (Hair et al., 2011). The analysis of the inner VIF and outer VIF indicated none ofthe values exceeded this suggested threshold.
Path analysis and resultsThe model in Figure 2 provides the results of the fifth and final run of the PLS algorithm.The indicators with outer loadings below the suggested threshold ( βo0.7) were removedfrom the model. A summary of indicators and significant loadings included in assessingLVs for the final model are shown in Table I. For PNMS, two indicators (perceived wait andwait expectations) were retained with time sacrificed excluded. Two indicators for PMS(cheap expensive price and expected price) were also retained and a third (price fairness)excluded. Atmosphere quality expectations were removed as an indicator for PSQ with fourindicators retained (low–high quality, comparable quality, product quality expectations andservice quality expectations). PV and CS used one overall item for each and CL retainedthree indicators (revisit intentions, tell others and recommend to others).
All outer loadings were larger than β¼ 0.7. The adjusted R² in the LV of PSQ shows thatthe perceived sacrifices, monetary and non-monetary, accounted for 18.2 per cent of the
33
Perceivedcustomer value

variance in PSQ, indicating a weak effect. The adjusted R² of PV (R²¼ 0.402) indicated themodel explained 40.2 per cent of the variance. The overall model showed a moderate effectfor CL explaining 60.2 per cent of the variance in this endogenous variable. The adjusted R²for customer satisfaction was found to be relatively weak with 22.1 per cent of the varianceexplained by the model.
When analysing the factor loadings, it can be said that the non-monetary sacrifice did notaffect PSQ ( β¼−0.058) and did not directly affect PV ( β¼ 0.035). In contrast, the factorloadings of PMS indicated a moderate negative effect on perceived quality ( β¼−0.414) anda direct, positive impact on PV ( β¼−0.525). Further analysis of the factor loadingsindicated perceived service quality had a weak positive effect on PV ( β¼ 0.236). The directeffect of PV on customer satisfaction was moderate ( β¼ 0.478); whereas, the direct effect onCL was weak ( β¼ 0.120). A substantial effect was found between customer satisfaction andCL ( β¼ 0.717). Apart from direct effects, the indirect effects were analysed and inferredfrom Table II. The indirect effect of PNMS on PV was negligible ( β¼−0.014). The indirecteffect of PMS on PV via perceived service quality was also shown to be weak ( β¼−0.098),although it appeared to enhance the effect of PMS on PV.
NMS2
NMS3
SQ1
0.182[+]
0.402
[+]0.221
0.602
MS1
MS2
SQ2
SQ3
SQ4
0.914 (0.000)0.862 (0.000)
Perceived non-monetary sacrifice
–0.058 (0.704) 0.035 (0.674)
0.749 (0.000)
0.236 (0.016)0.836 (0.000)0.764 (0.000)
0.740 (0.000)
0.903 (0.000)
–0.414 (0.003)
Perceived servicequality
–0.525 (0.000)
Perceived value
0.478 (0.000)Customer
satisfaction/dissatisfaction
0.120 (0.047)
0.717 (0.000)
Customer loyalty
Adjusted coefficient ofdetermination R2
Path coefficients �(p-value)
CL1
CL2
CL3
0.918 (0.000)0.950 (0.000)0.828 (0.000)
0.884 (0.000)
Perceivedmonetary sacrifice
Figure 2.Path results forsacrifice-quality-value-satisfaction-loyaltymodel
LV Indicators Loadings
Perceived non-monetary sacrifice Time sacrificed NSPerceived wait 0.914Wait expectations 0.862
Perceived monetary sacrifice Cheap expensive price 0.903Expected price 0.884Price fairness NS
Perceived service quality Low/high quality 0.749Comparable quality 0.836Product quality expectation 0.764Service quality expectations 0.740Atmosphere quality expectations NS
Perceived value Overall restaurant value 1 itemCustomer service Overall satisfaction 1 itemCustomer loyalty Future visit intentions 0.918
Tell others 0.950Recommend to others 0.828
Table I.Results summary ofstudy reflectiveouter models
34
IHR32,1
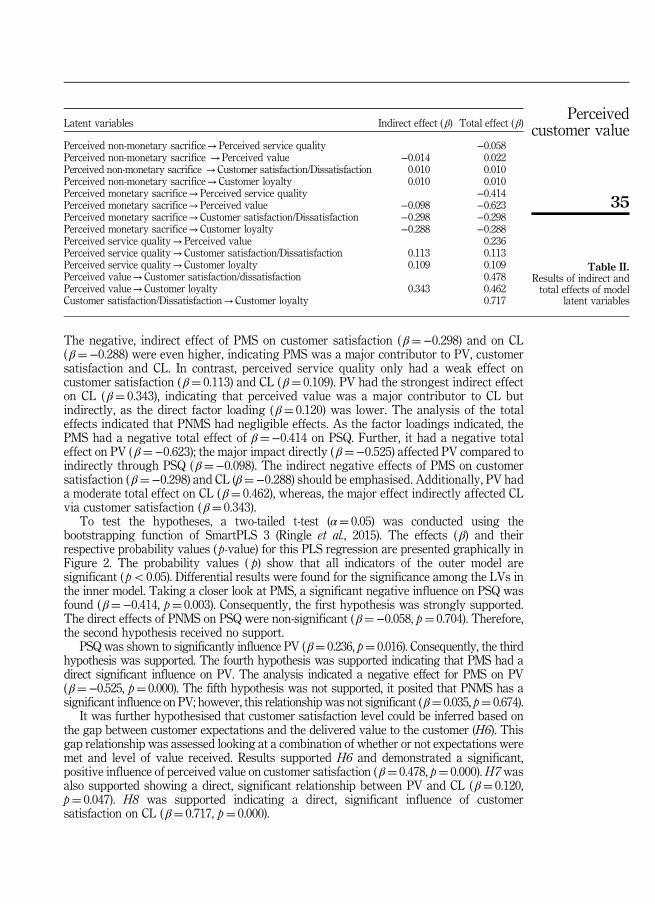
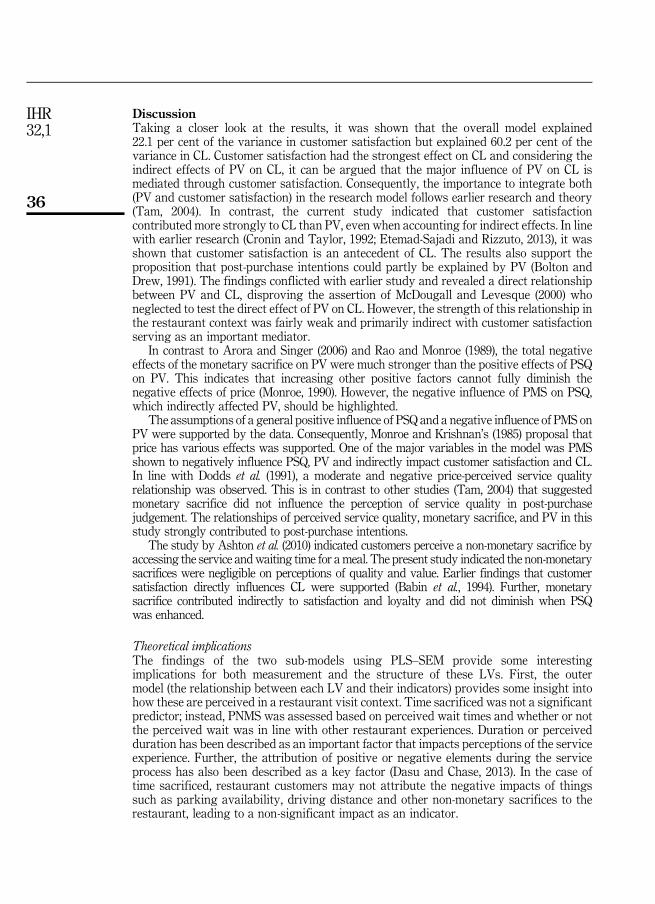
The negative, indirect effect of PMS on customer satisfaction ( β¼−0.298) and on CL( β¼−0.288) were even higher, indicating PMS was a major contributor to PV, customersatisfaction and CL. In contrast, perceived service quality only had a weak effect oncustomer satisfaction ( β¼ 0.113) and CL ( β¼ 0.109). PV had the strongest indirect effecton CL ( β¼ 0.343), indicating that perceived value was a major contributor to CL butindirectly, as the direct factor loading ( β¼ 0.120) was lower. The analysis of the totaleffects indicated that PNMS had negligible effects. As the factor loadings indicated, thePMS had a negative total effect of β¼−0.414 on PSQ. Further, it had a negative totaleffect on PV ( β¼−0.623); the major impact directly ( β¼−0.525) affected PV compared toindirectly through PSQ ( β¼−0.098). The indirect negative effects of PMS on customersatisfaction ( β¼−0.298) and CL (β¼−0.288) should be emphasised. Additionally, PV hada moderate total effect on CL ( β¼ 0.462), whereas, the major effect indirectly affected CLvia customer satisfaction ( β¼ 0.343).
To test the hypotheses, a two-tailed t-test (α¼ 0.05) was conducted using thebootstrapping function of SmartPLS 3 (Ringle et al., 2015). The effects ( β) and theirrespective probability values ( p-value) for this PLS regression are presented graphically inFigure 2. The probability values ( p) show that all indicators of the outer model aresignificant ( po0.05). Differential results were found for the significance among the LVs inthe inner model. Taking a closer look at PMS, a significant negative influence on PSQ wasfound ( β¼−0.414, p¼ 0.003). Consequently, the first hypothesis was strongly supported.The direct effects of PNMS on PSQ were non-significant ( β¼−0.058, p¼ 0.704). Therefore,the second hypothesis received no support.
PSQ was shown to significantly influence PV ( β¼ 0.236, p¼ 0.016). Consequently, the thirdhypothesis was supported. The fourth hypothesis was supported indicating that PMS had adirect significant influence on PV. The analysis indicated a negative effect for PMS on PV(β¼−0.525, p¼ 0.000). The fifth hypothesis was not supported, it posited that PNMS has asignificant influence on PV; however, this relationship was not significant (β¼ 0.035, p¼ 0.674).
It was further hypothesised that customer satisfaction level could be inferred based onthe gap between customer expectations and the delivered value to the customer (H6). Thisgap relationship was assessed looking at a combination of whether or not expectations weremet and level of value received. Results supported H6 and demonstrated a significant,positive influence of perceived value on customer satisfaction ( β¼ 0.478, p¼ 0.000). H7 wasalso supported showing a direct, significant relationship between PV and CL ( β¼ 0.120,p¼ 0.047). H8 was supported indicating a direct, significant influence of customersatisfaction on CL ( β¼ 0.717, p¼ 0.000).
Latent variables Indirect effect ( β) Total effect ( β)
Perceived non-monetary sacrifice→Perceived service quality −0.058Perceived non-monetary sacrifice →Perceived value −0.014 0.022Perceived non-monetary sacrifice →Customer satisfaction/Dissatisfaction 0.010 0.010Perceived non-monetary sacrifice→Customer loyalty 0.010 0.010Perceived monetary sacrifice→Perceived service quality −0.414Perceived monetary sacrifice→Perceived value −0.098 −0.623Perceived monetary sacrifice→Customer satisfaction/Dissatisfaction −0.298 −0.298Perceived monetary sacrifice→Customer loyalty −0.288 −0.288Perceived service quality→Perceived value 0.236Perceived service quality→Customer satisfaction/Dissatisfaction 0.113 0.113Perceived service quality→Customer loyalty 0.109 0.109Perceived value→Customer satisfaction/dissatisfaction 0.478Perceived value→Customer loyalty 0.343 0.462Customer satisfaction/Dissatisfaction→Customer loyalty 0.717
Table II.Results of indirect andtotal effects of model
latent variables
35
Perceivedcustomer value
DiscussionTaking a closer look at the results, it was shown that the overall model explained22.1 per cent of the variance in customer satisfaction but explained 60.2 per cent of thevariance in CL. Customer satisfaction had the strongest effect on CL and considering theindirect effects of PV on CL, it can be argued that the major influence of PV on CL ismediated through customer satisfaction. Consequently, the importance to integrate both(PV and customer satisfaction) in the research model follows earlier research and theory(Tam, 2004). In contrast, the current study indicated that customer satisfactioncontributed more strongly to CL than PV, even when accounting for indirect effects. In linewith earlier research (Cronin and Taylor, 1992; Etemad-Sajadi and Rizzuto, 2013), it wasshown that customer satisfaction is an antecedent of CL. The results also support theproposition that post-purchase intentions could partly be explained by PV (Bolton andDrew, 1991). The findings conflicted with earlier study and revealed a direct relationshipbetween PV and CL, disproving the assertion of McDougall and Levesque (2000) whoneglected to test the direct effect of PV on CL. However, the strength of this relationship inthe restaurant context was fairly weak and primarily indirect with customer satisfactionserving as an important mediator.
In contrast to Arora and Singer (2006) and Rao and Monroe (1989), the total negativeeffects of the monetary sacrifice on PV were much stronger than the positive effects of PSQon PV. This indicates that increasing other positive factors cannot fully diminish thenegative effects of price (Monroe, 1990). However, the negative influence of PMS on PSQ,which indirectly affected PV, should be highlighted.
The assumptions of a general positive influence of PSQ and a negative influence of PMS onPV were supported by the data. Consequently, Monroe and Krishnan’s (1985) proposal thatprice has various effects was supported. One of the major variables in the model was PMSshown to negatively influence PSQ, PV and indirectly impact customer satisfaction and CL.In line with Dodds et al. (1991), a moderate and negative price-perceived service qualityrelationship was observed. This is in contrast to other studies (Tam, 2004) that suggestedmonetary sacrifice did not influence the perception of service quality in post-purchasejudgement. The relationships of perceived service quality, monetary sacrifice, and PV in thisstudy strongly contributed to post-purchase intentions.
The study by Ashton et al. (2010) indicated customers perceive a non-monetary sacrifice byaccessing the service andwaiting time for a meal. The present study indicated the non-monetarysacrifices were negligible on perceptions of quality and value. Earlier findings that customersatisfaction directly influences CL were supported (Babin et al., 1994). Further, monetarysacrifice contributed indirectly to satisfaction and loyalty and did not diminish when PSQwas enhanced.
Theoretical implicationsThe findings of the two sub-models using PLS–SEM provide some interestingimplications for both measurement and the structure of these LVs. First, the outermodel (the relationship between each LV and their indicators) provides some insight intohow these are perceived in a restaurant visit context. Time sacrificed was not a significantpredictor; instead, PNMS was assessed based on perceived wait times and whether or notthe perceived wait was in line with other restaurant experiences. Duration or perceivedduration has been described as an important factor that impacts perceptions of the serviceexperience. Further, the attribution of positive or negative elements during the serviceprocess has also been described as a key factor (Dasu and Chase, 2013). In the case oftime sacrificed, restaurant customers may not attribute the negative impacts of thingssuch as parking availability, driving distance and other non-monetary sacrifices to therestaurant, leading to a non-significant impact as an indicator.
36
IHR32,1

Of course, it should be noted that the relative statistical importance of a variable is notthe same as its strategic or operational importance. Thus, the operational service designdecisions related to time sacrifice and attribution of these elements are likely to beimportant considerations to enhance perceived quality and value. Similarly, while pricefairness was a non-significant indicator of monetary sacrifice, the notion of fairness as aconstruct may be much more idiosyncratic and likely to create more noise in the data thanmore straightforward indicators such comparisons to expectations or how cheap orexpensive – where customers can use a clear point of reference.
The inner model indicates some interesting relationships among the LVs used in the study.A revised model appears possible based on a review of earlier research, consumer perceptionsand theoretical relationships. Money sacrifice appears to have direct negative relationships withperceptions of quality and value. This path suggests that quality and value have direct effectson customer satisfaction. PV appears to positively impact CL with satisfaction as a partialmediator. Therefore, these relationships are important considerations and the creation of ataxonomy related to value-based pricing would provide a valuable framework for researchers tobetter assess these constructs and predict behaviour. For example, this could include the impactof monetary sacrifices and how non-monetary sacrifices can be designed to minimise impacts onperceptions of quality and value. Improved attribute categorisation (basic, performance,excitement) (e.g. Mathe-Soulek et al., 2015) and unique value concepts (experiential, time saving,memorability, etc.) would be beneficial in future research and provide greater clarity forpractitioners. The framework and related research should also include more evolved measuresand concepts related to satisfaction and loyalty. For instance, what other benefits are useful toassess the impact of a restaurant experience? Do they create more customer engagement andtrust? Does this result in higher return business and positive word-of-mouth? And, do restaurantexperiences impact perceptions of well-being or quality-of-life?
Practical implicationsStarting with the end in mind first, CL is a key outcome that provides success for firms.In this study, loyalty included not only return visits but also recommendations and positiveword-of-mouth. This conceptualization and an extension of it has important implications forfirms; first, loyalty suggests greater trust and connection to a brand or firm and studieshave shown this facilitates higher spending per customer, higher profit margins and lowermarketing costs (Ottenbacher and Harrington, 2010). In today’s environment, this loyaltyconcept is likely to facilitate social media evangelists resulting in multiple avenues ofelectronic word-of-mouth.
From a sacrifice perspective, this study demonstrated the important relationshipbetween monetary sacrifice and perceptions of quality and value. Non-monetary sacrificewas less evident. For practitioners, this finding indicates that service design can beimplemented to reduce or eliminate non-monetary sacrifice by finding creative ways toreduce negative perceptions of wait time (e.g. temporary seating in the bar before a table isready, the use of pagers to notify diners, entertainment options to distract from the actualduration, etc.) or the attribution of other weaknesses to external sources (e.g. lack ofparking, easy access to establishment, alcohol consumption restrictions, etc.). The impactof monetary sacrifice demonstrates a three-part relationship among price–quality–valueperceptions. To minimise negative effects of price on perceived quality, practitionersshould communicate price fluctuations as discounts rather than surcharges to allow formaximising revenues and enhancing acceptance (Kimes et al., 1998). Second, operatorsshould assess restaurant attributes for impact on perceptions of value and satisfaction.Based on the firms’ primary markets, is an attribute a dis-satisfier (higher resourceinvestments will do little for increasing satisfaction but if lowered below expectationsresulting in dissatisfaction), satisfier (a direct relationship between higher resource
37
Perceivedcustomer value

investments and higher PV/satisfaction) or exciter (“wows” that increase the likelihood ofloyalty and associated behaviours) (Mathe-Soulek et al., 2015)?
In terms of value, operators should articulate their unique value proposition and ensurethis lines up with target market values. This definition may be quite different thantraditional value descriptions such as quality food or reliable service. For the consumer, thevalue may be defined by aspects such as “time saving”, “personalized”, “on-going socialrelationship”, “exclusivity”, etc. The traditional value notions of quality food, beverage andservice may be “must be” elements in today’s competitive landscape.
The concept of value may also be viewed from a “customer journey” perspective.This perspective reflects the stages of the total customer experience and flows frompre-purchase (all interactions with the brand and environment prior to purchase),purchase (all interactions and processes during the purchase event itself ),to post-purchase (interactions after purchase – creating triggers that lead to loyalty).This indicates restaurateurs should consider a variety of touchpoints along this journeythat impact perceptions of value; these may be brand-owned, partner-owned, customer-owned, or social/external touchpoints (Lemon and Verhoef, 2016). Brand-owned includeaspects such as communications, social media, promotions not owned by the individualrestaurant. Partner-owned are those touchpoints that are jointly controlled/managed suchas regional promotions (CVBs), promotions with supplier partners (seasonal products,local wines, etc.), delivery systems (Grubhub), or other franchise owners. Customer-ownedtouchpoints include payment options or a desire to have co-created experiences to meetneeds/values. Finally, social/external touchpoints include Yelp, peer influences, ratingsystems and health inspections that influence the journey before, during and after thepurchase event. This framework of customer journey touchpoints provides a basis forthinking through this process and how the restaurant can influence them to enhance PVacross the customer journey. This concept tied with an understanding of restaurantattribute categories (dis-satisfiers, satisfiers and exciters) would allow operators to morefully understand what constitutes the “right bundle” to enhance satisfaction, loyalty andcompetitive advantage.
Finally, an important aspect of this study is the direct effect of PV on loyalty and theintervening effect of satisfaction between value and loyalty. This indicates decisions onrestaurant loyalty behaviours are transmitted, in part, directly from perceptions of valueand indirectly via satisfaction. This relationship indicates operators with an understandingof what value is created for their customers and delivery of quality products and servicesduring the purchase event work in conjunction to drive loyalty.
Limitations and future research suggestionsWhile the current study provided a more holistic representation of theprice–quality–value–satisfaction–loyalty relationship, a 60.2 per cent explanation of thevariance in CL indicates other influence factors may not be addressed in this model. Anextension of the model to include brand attitudes, either as an antecedent of PV (e.g. Rao andMonroe, 1989; Ashton et al., 2010) or as an outcome of customer satisfaction (e.g. Oh, 2000;Tam, 2004) may provide additional explanatory power and should be included in futureresearch. Additionally, measuring more dimensions of PV, particularly hedonic value, couldprovide interesting results. Another possibility is to measure PV using the PERVAL scaleenhance predictive accuracy. Further, a comparison between SERVQUAL to PERVALrelationships in a restaurant context may also deliver interesting results.
The survey that was applied as a preliminary study consisted of 103 participants. Thissample size should be expanded alongwith a full confirmatory factor analysis (Thompson, 2004)in the future to reveal redundant variables, enhance the predictive accuracy of the model,and increase generalisability.
38
IHR32,1

ConclusionThe literature revealed that PV is a subjective evaluation and a cognitive trade-off of what isgiven and what is received. Prior experiences, price references and expectations also appearto influence the assessment of each transaction. The review indicated researchers have someconsensus that PV consists of several dimensions, dimensions range from utility to intrinsicconsumption experiences depending on context, and value-based pricing is a viable butchallenging method to use in the service/restaurant context. This study demonstrated that amore holistic model of price-quality-value-satisfaction-loyalty is needed to utilisevalue-based pricing. In the model, six of the eight hypotheses were supported. In sum,PV had a stronger influence on CL in an indirect way (via customer satisfaction). The directimpact of customer satisfaction on CL was also shown to be strong. Consequently, it can besaid that customer satisfaction and PV are primary predictors of CL.
PMS was the major influence factor of PV in contrast to the hypothesised PSQrelationship with PV. Further, PMS appeared to be a strong driver of PSQ. Moreover, thenegative effect of PMS on PV indicated this impact may be a challenge mitigate in arestaurant context. This is important for managers as the effort and resources needed todeliver more value could be higher than the resulting yield of a price increase.Customer-centric pricing requires restaurant managers know their customers’ needs anddesires to set prices. Compared to cost-based pricing, additional revenue and yield can begenerated from higher prices or lowered process costs. Moreover, applying value-basedpricing may indirectly lower the costs of maintaining the customer relationship due to theinfluence of PV on customer satisfaction and CL. The downside of value-pricing could be adecrease in CL if customers do not perceive value based on the value proposition put forthby the firm, leading to dissatisfaction. Therefore, restaurant managers must keep in mindbalancing the impact of price, value propositions, and word-of-mouth behaviours as theseappear crucial to the restaurant’s long-term success. The identification of customer needsand monitoring the customers’ PV are keys to successfully applying value-based pricingin the restaurant industry.
References
Agarwal, S. and Teas, R. (2002), “Cross-national applicability of a perceived quality model”, Journal ofProduct & Brand Management, Vol. 11 No. 4, pp. 213-236.
Alhelalat, J.A., Habiballah, M.A. and Twaissi, N.M. (2017), “The impact of personal and functionalaspects of restaurant employee service behaviour on customer satisfaction”, InternationalJournal of Hospitality Management, Vol. 66, September, pp. 46-53.
Ali, F., Amin, M. and Cobanoglu, C. (2016), “An integrated model of service experience, emotions,satisfaction, and price acceptance: an empirical analysis in the Chinese hospitality industry”,Journal of Hospitality Marketing & Management, Vol. 25, No. 4, pp. 449-475.
Armstrong, G., Kotler, P. and Opresnik, M. (2016),Marketing: An Introduction, 13th Global ed., PearsonEducation Limited, Boston, MA.
Arora, R. and Singer, J. (2006), “Customer satisfaction and value as drivers of business success for finedining restaurants”, Services Marketing Quarterly, Vol. 28 No. 1, pp. 89-102.
Ashton, A., Scott, N., Solnet, D. and Breakey, N. (2010), “Hotel restaurant dining: the relationshipbetween perceived value and intention to purchase”, International Journal of Tourism andHospitality Research, Vol. 10 No. 3, pp. 206-218.
Athola, O. (1984), “Price as a ‘give’ component in an exchange theoretic multicomponent model”,Advances in Consumer Research, Vol. 11, pp. 623-626.
Babin, B., Griffin, M. and Babin, L. (1994), “The effect of motivation to process on consumers’satisfaction reaction”, NA – Advances in Consumer Research, Vol. 21, pp. 406-411.
39
Perceivedcustomer value

Bagozzi, R. and Yi, Y. (1988), “On the evaluation of structural equation models”, Journal of the Academyof Marketing Science, Vol. 16 No. 1, pp. 74-94.
Bentler, P.M. and Yuan, K.H. (1999), “Structural equation modeling with small samples: test statistics”,Multivariate Behavioral Research, Vol. 34 No. 2, pp. 181-197.
Bolton, R. and Drew, J. (1991), “Linking customer satisfaction to service operations and outcomes”,in Rust, R.T. and Oliver, R.L. (Eds), Service Quality: New Directions in Theory and Practice, SagePublications, Inc., Newbury Park, CA, pp. 173-200.
Bowen, J. (2008), “Marketing and consumer behavior in hospitality”, in Brotherton, B. and Wood, R.(Eds), The SAGE Handbook of Hospitality Management, 1st ed., SAGE Publications Ltd,London, pp. 302-330.
Butz, H.J. and Goodstein, L. (1996), “Measuring customer value: gaining the strategic advantage”,Organizational Dynamics, Vol. 24 No. 3, pp. 63-77.
Chandler, J.D. and Lusch, R.F. (2015), “Service systems: a broadened framework and research agendaon value propositions, engagement, and service experience”, Journal of Service Research, Vol. 18No. 1, pp. 6-22.
Chang, K.-C. (2013), “How reputation creates loyalty in the restaurant sector”, International Journal ofContemporary Hospitality Management, Vol. 25 No. 4, pp. 536-557.
Cronin, J.J. and Taylor, S. (1992), “Measuring service quality: a reexamination and extension”, Journalof Marketing, Vol. 56 No. 3, pp. 55-68.
Dasu, S. and Chase, R. (2013), The Customer Service Solution: Managing Emotions, Trust, and Controlto win your Customer’s Business, McGaw Hill Education, New York, NY.
DiPietro, R., Parsa, H. and Gregory, A. (2011), “Restaurant QSC inspections and financial performance:an empirical investigation”, International Journal of Contemporary Hospitality Management,Vol. 23 No. 7, pp. 982-999.
Dodds, W., Monroe, K. and Grewal, D. (1991), “Effects of price, brand, and store information on buyer’sproduct evaluations”, Journal of Marketing Research, Vol. 28, pp. 307-319.
Etemad-Sajadi, R. and Rizzuto, D. (2013), “The antecedents of consumer satisfaction and loyalty in fastfood industry: a cross-national comparison between Chinese and Swiss consumers”,International Journal of Quality & Reliability Management, Vol. 30 No. 7, pp. 780-798.
Götz, O., Liehr-Gobbers, K. and Krafft, M. (2010), “Evaluation of structural equation models using thepartial least squares (PLS) approach”, in Esposito Vinzi, V., Chin, W., Henseler, J. and Wang, H.(Eds), Handbook of Partial Least Squares: Concepts, Methods and Application, Spinger–Verlag,Berlin, pp. 691-712.
Grewal, D., Krishnan, R. and Baker, J.B.N. (1998), “The effect of store name, brand name and pricediscounts on consumers’ evaluations and purchase intentions”, Journal of Retailing, Vol. 74No. 3, pp. 331-352.
Ha, J. and Jang, S. (2012), “Consumer dining value: does it vary across different restaurant segments?”,Journal of Foodservice Business Research, Vol. 15 No. 2, pp. 123-142.
Hair, J., Ringle, C. and Sarstedt, M. (2011), “PLS–SEM: indeed a silver bullet”, Journal of MarketingTheory and Practice, Vol. 19 No. 2, pp. 139-151.
Hair, J.F., Ringle, C.M. and Sarstedt, M. (2013), “Partial least squares structural equation modeling:rigorous applications, better results and higher acceptance”, Long Range Planning, Vol. 46Nos 1-2, pp. 1-12.
Harrington, R.J., Fauser, S. and Ottenbacher, M.C. (2017), “QSR brand value strategies: assessingperceived relative differences in marketing mix dimensions among brands, loyal customers andnon-customers”, International Journal of Contemporary Hospitality Management, Vol. 29 No. 1,pp. 551-570.
Harrington, R.J., Hammond, R., Ottenbacher, M.C., Chathoth, P. and Marlowe, B. (2019), “From goods-service logic to a memory-dominant logic: demand-side strategy research and application inhospitality”, International Journal of Hospitality Management, Vol. 76, pp. 252-260.
40
IHR32,1

Harrington, R.J., Ottenbacher, M.C., Staggs, A. and Powell, A. (2012), “Generation Y consumers: keyrestaurant attributes impacting positive and negative experiences”, Journal of Hospitality &Tourism Research, Vol. 36 No. 4, pp. 431-449.
Henseler, J., Ringle, C. and Sarstedt, M. (2015), “A new criterion for assessing discriminant validity invariance-based structural equation modeling”, Journal of the Academy of Marketing Science,Vol. 43 No. 1, pp. 115-135.
Heskett, J., Sasser, W.J. and Schlesinger, L. (1997), The Service Profit Chain: How Leading CompaniesLink Profit and Growth to Loyalty, Satisfaction and Value, 1st ed., The Free Press, New York.
Hinterhuber, A. and Liozu, S. (2012), “Is it time to rethink your pricing strategy?”, MIT SloanManagement Review, Vol. 53 No. 4, pp. 69-77.
Holden, R. and Burton, M. (2008), Pricing with Confidence: 10 Ways to Stop Leaving Money on the Table,Wiley, Hoboken, NJ.
Jain, S.K. and Gupta, G. (2004), “Measuring service quality: SERVQUAL vs SERVPERF scales”,Vikalpa, Vol. 29 No. 2, pp. 25-38.
Jalilvand, M.R., Salimipour, S., Elyasi, M. and Mohammadi, M. (2017), “Factors influencing word ofmouth behaviour in the restaurant industry”, Marketing Intelligence & Planning, Vol. 35 No. 1,pp. 81-110.
Kim, I., Jeon, S. and Hyun, S. (2012), “Chain restaurant patrons’ well-being perception and diningintentions: the moderating role of involvement”, International Journal of ContemporaryHospitality Management, Vol. 24 No. 3, pp. 402-429.
Kim, W., Ng, C. and Kim, Y. (2009), “Influence of institutional DINESERV on customer satisfaction,return intention, and word-of-mouth”, International Journal of Hospitality Management, Vol. 28,pp. 10-17.
Kimes, S.E., Chase, R.B., Choi, S., Lee, P.Y. and Ngonzi, E.N. (1998), “Restaurant revenue management:applying yield management to the restaurant industry”, Cornell Hotel and RestaurantAdministration Quarterly, Vol. 39 No. 3, pp. 32-39.
Kotler, P. and Keller, K. (2012), Marketing Management, 14th ed., Pearson Education Limited, Essex.
Kwun, J. and Oh, H. (2004), “Effects of brand, price, and risk on customers’ value perceptions andbehavioral intentions in the restaurant industry”, Journal of Hospitality & Leisure Marketing,Vol. 11 No. 1, pp. 31-49.
Lapierre, J., Filiatrault, P. and Chebat, J. (1999), “Value strategy rather than quality strategy: a case ofbusiness-to-business professional services”, Journal of Business Research, Vol. 45 No. 2, pp. 235-246.
Lee, Y.K., Park, K.H., Park, D.H., Lee, K.A. and Kwon, Y.J. (2005), “The relative impact of service qualityon service value, customer satisfaction, and customer loyalty in Korean family restaurantcontext”, International Journal of Hospitality & Tourism Administration, Vol. 6 No. 1, pp. 27-51.
Lemon, K.N. and Verhoef, P.C. (2016), “Understanding customer experience throughout the customerjourney”, Journal of Marketing, Vol. 80 No. 6, pp. 69-96.
Lovelock, C. (1983), “Classifying services to gain strategic advantage”, Journal of Marketing, Vol. 47,July, pp. 9-20.
Lowry, P. and Gaskin, J. (2014), “Partial least squares (PLS) structural equation modeling (SEM) forbuilding and testing behavioural causal theory: when to choose it and how to use it”, IEEETransactions on Professional Communication, Vol. 57 No. 2, pp. 123-146.
McDougall, G. and Levesque, T. (2000), “Customer satisfaction with services: putting perceived valueinto the equation”, Journal of Services Marketing, Vol. 14 No. 5, pp. 392-410.
Mathe-Soulek, K., Slevitch, L. and Dallinger, I. (2015), “Applying mixed methods to identify what drivesquick service restaurant’s customer satisfaction at the unit-level”, International Journal ofHospitality Management, Vol. 50, pp. 46-54.
Monroe, K. (1990), Pricing: Making Profitable Decisions, 2nd ed., McGraw-Hill PublishingCompany, Singapore.
41
Perceivedcustomer value
Monroe, K. and Krishnan, R. (1985), “The effect of price on subjective product evaluations”, in Jacoby, J.and Olson, J. (Eds), Perceived Quality: How Consumers View Stores and Merchandise, LexingtonBooks, Toronto; Lexington, MA, pp. 209-232.
Nelson, P. (1974), “Advertising as information”, Journal of Political Economy, Vol. 82 No. 4, pp. 729-754.
Oh, H. (2000), “Diners’ perceptions of quality, value and satisfaction”, Cornell Hotel and RestaurantAdministration Quarterly, Vol. 41 No. 3, pp. 58-66.
Oliver, R. (1980), “A cognitive model of the antecedents and consequences of satisfaction decisions”,Journal of Marketing Research, Vol. 17 No. 4, pp. 460-469.
Ottenbacher, M. and Harrington, R.J. (2010), “A study of innovative versus incremental new servicedevelopments: different strategies for achieving success”, Journal of Services Marketing, Vol. 24No. 1, pp. 3-15.
Parasuraman, A., Zeithaml, V. and Berry, L. (1985), “A conceptual model of service quality and itsimplications for future research”, Journal of Marketing, Vol. 49, October, pp. 41-50.
Parasuraman, A., Zeithaml, V. and Berry, L. (1994), “Reassessment of expectations as a comparisonstandard in measuring service quality: implications for further research”, Journal of Marketing,Vol. 58 No. 1, pp. 111-124.
Park, D., Lee, J. and Han, I. (2007), “The effect of online consumer reviews on consumer purchasingintention: the moderating role of involvement”, International Journal of Electronic Commerce,Vol. 11 No. 4, pp. 125-148.
Rao, A. and Monroe, K. (1989), “The effect of price, brand name, and store name on buyer’s perceptionsof product quality: an integrative review”, Journal of Marketing Research, Vol. 26, August,pp. 351-357.
Rao, V. and Kartono, B. (2009), “Pricing objectives and strategies: a cross-country survey”, in Rao, V.R.(Ed.), Handbook of Pricing Research in Marketing, Edward Elgar Publishing Limited,Cheltenham, pp. 9-36.
Reichheld, F. and Teal, T. (1996), The Loyalty Effect: The Hidden Force behind Growth, Profits, andLasting Value, Harvard Business School Press, Cambridge, MA.
Ringle, C., Wende, S. and Becker, J.-M. (2015), SmartPLS 3, SmartPLS, Bönningstedt, available at:www.smartpls.com (accessed 29 September 2017).
Ryu, K. and Han, H. (2010), “Influence of the quality of food, service, and physical environment oncustomer satisfaction and behavioural intentions”, Journal of Hospitality & Tourism Research,Vol. 34 No. 3, pp. 310-329.
Sánchez-Fernández, R. and Iniesta-Bonillo, M. (2007), “The concept of perceived value: a systematicreview of the research”, Marketing Theory, Vol. 7 No. 4, pp. 427-451.
Schlissel, M. and Chasin, J. (1991), “Pricing of services: an interdisciplinary review”, The ServiceIndustries Journal, Vol. 11 No. 3, pp. 271-286.
Scitovszky, T. (1945), “Some consequences of the habit of judging quality by price”, The Review ofEconomic Studies, Vol. 12, pp. 100-105.
Simon, H. (2015), “Confessions of the pricing man: how price affects everything”, English ed. adaptedfrom Original German Language Edition “Preisheiten: Alles, was Sie über Preise wissenmüssen” by Hermann Simon (2013) ed., International Publishing, Heidelberg.
Söderlund, M. (1998), “Customer satisfaction and its consequences on customer behaviour revisited –the impact of different levels of satisfaction on word-of-mouth, feedback to the supplier andloyalty”, International Journal of Service Industry Management, Vol. 9 No. 2, pp. 169-188.
Sweeney, J. and Soutar, G. (2001), “Consumer perceived value: the development of a multiple itemscale”, Journal of Retailing, Vol. 77 No. 2, pp. 203-220.
Sweeney, J., Soutar, G. and Johnson, L. (1999), “The role of perceived risk in the quality-valuerelationship: a study in a retail environment”, Journal of Retailing, Vol. 75 No. 1, pp. 77-105.
Tam, J. (2004), “Customer satisfaction, service quality and perceived value: an integrative model”,Journal of Marketing Management, Vol. 20 No. 7, pp. 897-917.
42
IHR32,1

Tellis, G. and Gaeth, J. (1990), “Best value, price-seeking, price-aversion: the impact of information andlearning on consumer choices”, Journal of Marketing, Vol. 54, April, pp. 34-45.
Thompson, B. (2004), Exploratory and Confirmatory Factor Analysis: Understanding Concepts andApplications, 1st ed., American Psychological Association, Washington, DC.
Tribe, J. and Snaith, T. (1998), “From SERVQUAL to HOLSAT: holiday satisfaction in Varadero,Cuba”, Tourism Management, Vol. 19 No. 1, pp. 25-34.
Vermeulen, I. and Seegers, D. (2009), “Tried and tested: the impact of online hotel reviews on consumerconsiderations”, Tourism Management, Vol. 30 No. 1, pp. 123-127.
Wong, K.-K. (2013), “Partial least squares structural equation modeling (PLS-SEM) techniques usingSmartPLS”, Marketing Bulletin, Vol. 24 No. 1, pp. 1-32.
Woodruff, R. (1997), “Customer value: the next source for competitive advantage”, Journal of theAcademy of Marketing Science, Vol. 25 No. 2, pp. 139-153.
Zeithaml, V. (1988), “Consumer perceptions of price, quality, and value: a means-end model andsynthesis of evidence”, Journal of Marketing, Vol. 52, July, pp. 2-22.
Zhang, Z., Ye, Q., Law, R. and Li, Y. (2010), “The impact of e-word-of-mouth on the online popularity ofrestaurants: a comparison of consumer reviews and editor reviews”, International Journal ofHospitality Management, Vol. 29, pp. 694-700.
Zheng, C. and Forgacs, G. (2017), “The emerging trend of hotel total revenue management”, Journal ofRevenue and Pricing Management, Vol. 16 No. 3, pp. 238-245.
Further reading
Monroe, K. and Chapman, J. (1987), “Framing effects on buyers’ subjective product evaluations”,in Wallendorf, M. and Anderson, P. (Eds), NA – Advances in Consumer Research, Vol. 14,Association for Consumer Research, Provo, UT, pp. 193-197.
Ryu, K., Han, H. and Jang, S. (2010), “Relationships among hedonic and utilitarian values, satisfactionand behavioural intentions in the fast-casual restaurant industry”, International Journal ofContemporary Hospitality Management, Vol. 22 No. 3, pp. 416-432.
(The Appendix follows overleaf.)
43
Perceivedcustomer value

Appendix
44
IHR32,1

Corresponding authorRobert James Harrington can be contacted at: [email protected]
For instructions on how to order reprints of this article, please visit our website:www.emeraldgrouppublishing.com/licensing/reprints.htmOr contact us for further details: [email protected]
45
Perceivedcustomer value