anthropogenic drivers for exceptionally large meander
TRANSCRIPT

Anthropocene 32 (2020) 100263
Anthropogenic drivers for exceptionally large meander formationduring the Late Holocene
Cindy Quika,*, Jasper H.J. Candela, Bart Makaskea, Roy van Beeka,b, Maurice Paulissenb,Gilbert J. Maasc, Menno Verplaka, Theo Spekd, Jakob Wallingaa,e
a Soil Geography and Landscape Group, Wageningen University, Wageningen, the NetherlandsbCultural Geography Group, Wageningen University, Wageningen, the NetherlandscWageningen Environmental Research, Wageningen, the NetherlandsdCentre for Landscape Studies, University of Groningen, Groningen, the NetherlandseNetherlands Centre for Luminescence dating, Wageningen University, Wageningen, the Netherlands
A R T I C L E I N F O
Article history:Received 16 April 2020Received in revised form 7 September 2020Accepted 9 September 2020Available online 15 September 2020
Keywords:Fluvial geomorphologyLateral migrationHistorical land useDrift-sandHoloceneOptically stimulated luminescence (OSL)dating
A B S T R A C T
Large-amplitude meanders may form in low-energy rivers despite generally limited mobility in thesessystems. Exceptionally large meanders which even extend beyond the valley sides have developed in theOverijsselse Vecht river (the Netherlands) between ca. 1400 CE (Common Era) and the early 1900s, whenchannelization occurred. Previous studies have attributed the enhanced lateral dynamics of this river tochanges in river regime due to increased discharges, reflecting climate and/or land-use alterations in thecatchment. This paper focuses on local aspects that may explain why exceptionally large meandersdeveloped at specific sites. Through an integrated analysis based on archaeological, historical, andgeomorphological data along with optically stimulated luminescence dating, we investigated the relativeimpact of three direct and indirect anthropogenic causes for the local morphological change andenhanced lateral migration rates: (1) lack of strategies to manage fluvial erosion; (2) a strong increase inthe number of farmsteads and related intensified local land use from the High Middle Ages onwards; and(3) (human-induced) drift-sand activity directly adjacent to the river bends, causing a change in bankstability. Combined, these factors led locally to meander amplitudes well beyond the valley sides. Lessonslearned at this site are relevant for management and restoration of meandering rivers in similar settingselsewhere, particularly in meeting the need to estimate spatial demands of (restored) low-energy fluvialsystems and manage bank erosion.© 2020 The Authors. Published by Elsevier Ltd. This is an open access article under the CC BY license
(http://creativecommons.org/licenses/by/4.0/).
Contents lists available at ScienceDirect
Anthropocene
journal homepage: www.else vie r .com/ locate /ance ne
1. Time periods as used in this paper
Period Time frame
Late Palaeolithic 12,500 – 8800 BCEMesolithic period 8800 – 4900 BCENeolithic period 4900 – 2000 BCEBronze age 2000 – 800 BCEIron age 800 – 12 BCERoman period 12 BCE – 450 CEEarly Middle ages 450 – 1000 CEHigh Middle ages 1000 – 1250 CELate Middle ages 1250 – 1500 CEEarly Modern period 1500 – 1800 CELate Modern period 1800 – 1900 CE
* Corresponding author at: P.O. Box 47, 6700AA, Wageningen, the Netherlands.E-mail address: [email protected] (C. Quik).
http://dx.doi.org/10.1016/j.ancene.2020.1002632213-3054/© 2020 The Authors. Published by Elsevier Ltd. This is an open access articl
2. Introduction
Low-energy meandering rivers often show relatively littlelateral migration (Kuenen, 1944; Eekhout, 2014; Makaske et al.,2016; Candel, 2020) because of their low specific stream power(< 10 W m�2) (Nanson and Croke, 1992). Nevertheless, meanderswith high amplitude may occur in low-energy rivers, withrelatively high lateral migration rates compared to other reachesof the same river (e.g. Hooke, 2007). Generally, the lateralmigration rates of rivers strongly depend on local bank strength(Schumm, 1960; Hickin and Nanson, 1984; Ferguson, 1987; Nicolland Hickin, 2010). For example, Hudson and Kesel (2000)compared sections of the Mississippi river and showed that thelowest lateral migration rates occurred in sections where erosion-resistant deposits were present (e.g. clay plugs).
Additionally, anthropogenic effects on river morphodynamicsspecifically deserve attention, as their influences are much morevaried and intense than previously thought (Gibling, 2018). Many
e under the CC BY license (http://creativecommons.org/licenses/by/4.0/).

Fig. 1. The Overijsselse Vecht river in the Netherlands. Capitals A��D indicate position of subfigures (a)-(d). (a) Digital elevation model (DEM) of the river reach fromDalfsen to Hardenberg, showing present-day spatial distribution of arenosols (former drift-sand areas, most are currently forested). Meander names are indicated, citynames are written in capitals. (b) DEM of the study area showing the two meander bends (Junner Koeland and Prathoek) and the three drift-sand locations (1, 2, 3).Elevation is in meters relative to Dutch Ordinance Datum (roughly mean sea level). The dashed yellow line indicates the valley side, reconstructed at places where large
2 C. Quik et al. / Anthropocene 32 (2020) 100263

C. Quik et al. / Anthropocene 32 (2020) 100263 3
rivers worldwide have been subject to significant anthropogenicpressure during the Late Holocene by land use changes, partlyexplaining increased fluvial activity on the entire river-scale(Kondolf et al., 2002; Macklin et al., 2010; Notebaert andVerstraeten, 2010; Brown et al., 2018; Candel et al., 2018; Gibling,2018; Notebaert et al., 2018). More locally, humans have stabilizedmany river channels by bank protection, groynes, dikes and otherengineering works (Hudson et al., 2008; Dépret et al., 2017). Thepotential direct and indirect role of humans in destabilising riverbanks locally has received little attention in literature, and is themain topic of this paper.
Formation of exceptionally large meanders extending beyondvalley sides has previously been linked to major climate changes intemperate regions (Alford and Holmes, 1985; Vandenberghe,1995). At the transition from the Pleniglacial to the Late Glacial, theclimate became warmer and wetter and vegetation re-established.Consequently, sediment availability decreased and river dischargeincreased, resulting in large incising meandering rivers (Vanden-berghe and Bohncke, 1985; Vandenberghe and Van Huissteden,1988; Vandenberghe, 1995). Large meanders from this period arestill visible in many river valleys, such as the Dommel, Roer andNiers valleys in the Netherlands (Kasse et al., 2005, 2017; Candelet al., 2020), Tisza valley in Hungary and Serbia (Vandenbergheet al., 2018) and Murrumbidgee valley in Australia (Schumm,1968).
Exceptionally large meander bends locally also occur in theDutch Overijsselse Vecht river valley, reaching well beyond thevalley sides with a maximum amplitude of almost 1.5 km (Fig. 1).This is more than twice as large as would be expected based onempirical estimations for the Overijsselse Vecht given by Hobo(2006), whose calculations are based on discharge regime andsediment characteristics. Recent geochronological researchrevealed that these remarkably large meanders formed betweenca. 1400–1900 CE (Quik and Wallinga, 2018a,b). During this periodmeander amplitudes increased at a relatively steady rate of 1–3 my�1. After ca. 1900 CE, meander migration was halted as the rivercourse was straightened and channelized. Factors that mightexplain the exceptional meander growth between 1400 and 1900CE include regime shifts, bedload changes, high-discharge events,varying erodibility of bank sediments, or (indirect) humaninterference with the river system.
Candel et al. (2018) demonstrated that the Overijsselse Vechtriver experienced a discharge regime change around the 15thcentury, resulting in a shift from a laterally stable to a meanderingchannel pattern and marking the onset of meander formation. Thechange in palaeodischarge, characterized by increased peakdischarges, may have resulted from climatic fluctuations duringthe Little Ice Age and large-scale land use change in the catchment(i.e. peat reclamation). This catchment-scale change does howevernot explain the exceptional meander expansion observed locally,and the historical changes of bankfull discharges and bedloadreconstructed by Candel et al. (2018) could not account for theongoing lateral migration of the large meanders during the 19thand early 20th century.
The Overijsselse Vecht river valley predominantly consists ofaeolian coversand deposited during the Late-Pleniglacial, overlyingolder fluvial deposits (Huisink, 2000). Several meanders of theriver seem to have been confined in their expansion (Fig. 1a,Wolfert and Maas, 2007) by the sides of the river’s Late-Pleistocenevalley, whereas locally some meanders have expanded beyond the
meander bends occur. A detailed view of the meanders is provided in (c) and (d), showirelief. Main topographical elements are heathland (purple), forest (dark green) and mvertical resolution 0.2 m): AHN, 2018; Van Heerd et al., 2000; river course 1851 CE dereferences to colour in this figure legend, the reader is referred to the web version of t
valley sides. It has been suggested that (human-induced) drift-sand complexes that developed on river banks may have enhancedbank erodibility locally (Wolfert et al., 1996; Wolfert and Maas,2007). Alternatively, large meander formation may be linked toincreased settlement density and anthropogenic pressure since theHigh Middle Ages. Additionally, river management may haveplayed a role in local prevention and/or acceleration of bankerosion.
Due to excellent preservation of some cut-off meanders, theavailability of detailed geochronological information for thedevelopment of two meander bends (Quik and Wallinga,2018a,b) and a previous palaeohydrological reconstruction (Candelet al., 2018), we consider the Overijsselse Vecht river an ideal caseto study local factors influencing lateral meander migration. Togain insight in these factors and their degree of influence weaddress the following research questions:
(1) What is the character of historical river management duringthe period of meander expansion (i.e. Modern period), anddoes this indicate direct human interferences with the riversystem that resulted in exceptional meander formationobserved locally?
(2) How did habitation density in the direct vicinity of thefloodplain change through time (i.e. prior to and duringmeander expansion), and could related land use changes fromthe Modern period onwards cause enhanced local meandergrowth?
(3) What was the timing and spatial distribution of (human-induced) drift-sand activity in the study region during theperiod of meander expansion, and is there evidence forinteraction of aeolian and fluvial dynamics resulting in thelocal formation of exceptional meanders?
To answer these research questions we performed an integratedanalysis of archaeological, historical and geomorphological infor-mation and optically stimulated luminescence (OSL) dating.
3. Study area
The Overijsselse Vecht (Fig. 1) is a low-energy sand-bed riveroriginating west of Münster in North Rhine-Westphalia (Germany)and entering the Netherlands south of the city of Coevorden. It is arain-fed river with a catchment of 3785 km2. The river has its outletin the Zwarte Water near the city of Zwolle, which debouches intothe IJsselmeer (Lake IJssel). Before 1932, the IJsselmeer was still aninland sea (Zuiderzee), with a small tidal range of about 0.2 m(Dirkx et al., 1996; Makaske et al., 2003). Characterizations of thewater levels in 1850 demonstrate that the Overijsselse Vecht didnot experience tidal influences before closure of the Zuiderzee(Middelkoop et al., 2003; their figures 4 and 5 shows no tidal strokeat Kampen and Katerveer). In the Dutch part the valley gradient isfairly uniform at 1.4 * 10�4 (Wolfert and Maas, 2007). According tomeasurements in the period 1995–2015 from a discharge station inthe investigated section of the river, the average discharge andmean annual flood discharge are 22.8 and 160 m3 s�1 respectively.The area is characterized by an average annual rainfall of800�875 mm and an average maximum temperature of 4.9–5.4 �C in January and 24.3–24.7 �C in July (KNMI, 2019a, 2019b).Through large-scale engineering works between 1896 and the1930s, the original river length of 90 km in the Netherlands has
ng the topographical map overlying the hillshade DEM with scroll bars and swaleseadows (light green). Digital elevation model (AHN2; horizontal resolution 0.5 m,rived from: Kadaster, 2018; OpenTopo: Van Aalst (2016) (For interpretation of thehis article).

dddddne
lfedefeda
d-s,n
tg.eeddedpdre)sn-ed
eeeysilhsse
og
4 C. Quik et al. / Anthropocene 32 (2020) 100263
been reduced to 60 km by cutting off 69 meanders (Wolfert andMaas, 2007). Revetments fix the position of river banks and thewater level is controlled by weirs.
The Dutch part of the Overijsselse Vecht was subdivided intothree river reaches by Wolfert and Maas (2007) based on fluvialstyle. The central reach, stretching from the city of Hardenberg(east) to the city of Dalfsen (west), is characterized by severalconspicuous meanders (Fig. 1a). For this study we focus on twopresently cut-off meander bends with exceptional amplitudesreaching outside the valley sides named ‘Junner Koeland’ and‘Prathoek’ (Fig. 1b), (cf. Quik and Wallinga, 2018a,b; and Candelet al., 2018), and their wider environment (area of circa 4 � 4 km).These meanders were not cut-off naturally, but through channeli-zation in the early 1900s.
The river banks consist of aeolian coversand on top offluvioperiglacial deposits. Near the studied bends, the riverchannel had a width of about 40 m in 1848 CE, and theelevation difference between the river banks and deepest partof the channel was approximately 2.3 m (Staring and Stieltjes,1848). In the vicinity of the floodplain between Hardenbergand Ommen drift-sand complexes developed that consist oferoded and re-deposited coversand. Nearly all these drift-sandareas are now stabilized by forests that were planted since themid-nineteenth century. Currently several parts of thefloodplain and former drift-sand areas are protected naturereserves.
4. Methods
To identify potential factors for the formation of large meandersin the Overijsselse Vecht we used a combination of data fromdifferent disciplines, drawing methods from archaeology, histori-cal geography, geomorphology and geochronology. The methodol-ogy is divided in three parts, consisting of analyses of (1) historicalriver management, to understand the type and level of directinterference with the river system, (2) habitation history and landuse change, to detect changing pressures on the landscape, and (3)occurrence and activity period of (human-induced) drift-sandsnear the two investigated meander bends, which may changestability of river banks. All parts are described below, furtherdetails are available in the Supplementary Material. For methodsregarding reconstruction of meander formation (lateral migrationrates), palaeodischarge and meander cross sections we refer toearlier publications (Quik and Wallinga, 2018a,b; Candel et al.,2018).
4.1. Historical river management
Following a general literature review (Wieringa andSchelhaas, 1983; Coster, 1999; Neefjes et al., 2011) severalgovernmental levels were selected for closer study: the higherauthorities being the Dutch government and the province ofOverijssel, followed by dike districts (after 1879 continuing aswater boards) and marks (local commons (Dutch: 'marken'), i.e.Late Medieval and Early Modern farmer collectives). To reconstructthe character and intensity of historical river management twosubsequent methods were applied. First, we studied generaltrends in river management for the Dutch part of the OverijsselseVecht catchment by analysing activities at different governmentallevels. Information was obtained from the archives of the variousgovernmental institutions. Second, we focused on river manage-ment activities in one of the marks in the study area (i.e. the markof Arriën), to gain detailed insights in local management. Arriënwas chosen because the archives of the mark of Junne are lost,whereas those from the mark of Stegeren are obscured by lowreadability.
4.2. Habitation history and land use development
To identify possible land use related drivers for increasemeander expansion we reviewed various archaeological anhistorical geographical sources. Late prehistoric, Roman anMedieval archaeological sites from the study area were inventorieusing the national Dutch archaeological database (Archis III) anpublished literature. Historical sources provide information ohabitation development from the Middle Ages onwards (seSupplementary Materials for further details).
Within the scope of the present study, highly detailed archivaresearch on the age of individual farmsteads and the numbers ofarm animals per unit surface area was not feasible. Instead, wused (1) number of farmsteads as proxy for land use intensity, an(2) a generic retrospective method to date the farmsteads (seSupplementary Materials), based on the historical layering oMedieval property rights (Spek et al., 2010; Neefjes et al., 2011). Ware aware that the relation between habitation density anincreasing land use intensity is not necessarily linear, but assume
positive correlation as corroborated by e.g. Bieleman (2008).Additional information on collective land use was obtaine
from the archives kept by the marks. Toponymical and etymological publications were used to explain and date field name typefrom the scroll-bar complexes in the Dutch part of the river valleyto interpret former local land use (e.g. Schönfeld, 1955, 1950; VaBerkel and Samplonius, 1989; Malinckrodt, 1974).
4.3. Drift-sand activity
Recent integrative analyses by Pierik et al. (2018) indicated thahuman pressure on the landscape was the predominant facilitatincondition for Late-Holocene drift-sand activity in the NetherlandsAnalyses of drift-sands near the Overijsselse Vecht could thereforbe considered as part of investigations on habitation and land usdevelopment (section 4.2). However, as the geomorphological angeochronological methods that we applied to analyse drift-sanactivity diverge from the methods applied in section 4.2, wpresent them separately here (similarly in the Results anDiscussion). To investigate whether a chronological overlabetween drift-sand activity and meander expansion exists anto what extent drift-sand deposition may have destabilized rivebanks we: (1) analysed subsequent historical maps to determinthe size of the area covered by active drift-sands through time; (2conducted a lithological survey of two distinct drift-sand dunenear the two meander bends (location in Fig. 1a, detailed view iFig. 3a and 3b) and (3) performed optically stimulated luminescence (OSL) dates on selected drift-sand samples to determine thonset of local drift-sand deposition. These steps are describebelow.
4.3.1. Use of historical maps to estimate drift-sand extentWe analysed the area covered by active drift-sand based on fiv
historical maps dating from 1720 to 1884 CE that were used in thgeochronology developed by Quik and Wallinga (2018a). Mordetails on these maps are available in the SupplementarMaterials. We used the area currently classified as arenosol(Dutch: 'duinvaaggronden' and 'vlakvaaggronden') in the Dutch soclassification system (Alterra, 2014) as validation to compare witthe historically indicated drift-sand surface, as these young soilpredominantly formed in stabilized drift-sand areas (Jongmanet al., 2013). Further details on the historical maps and procedurare provided in the Supplementary Materials.
4.3.2. Lithological survey drift-sand areasA lithogenetic survey of two former drift-sand areas adjacent t
the two meander bends was performed based on corings coverin
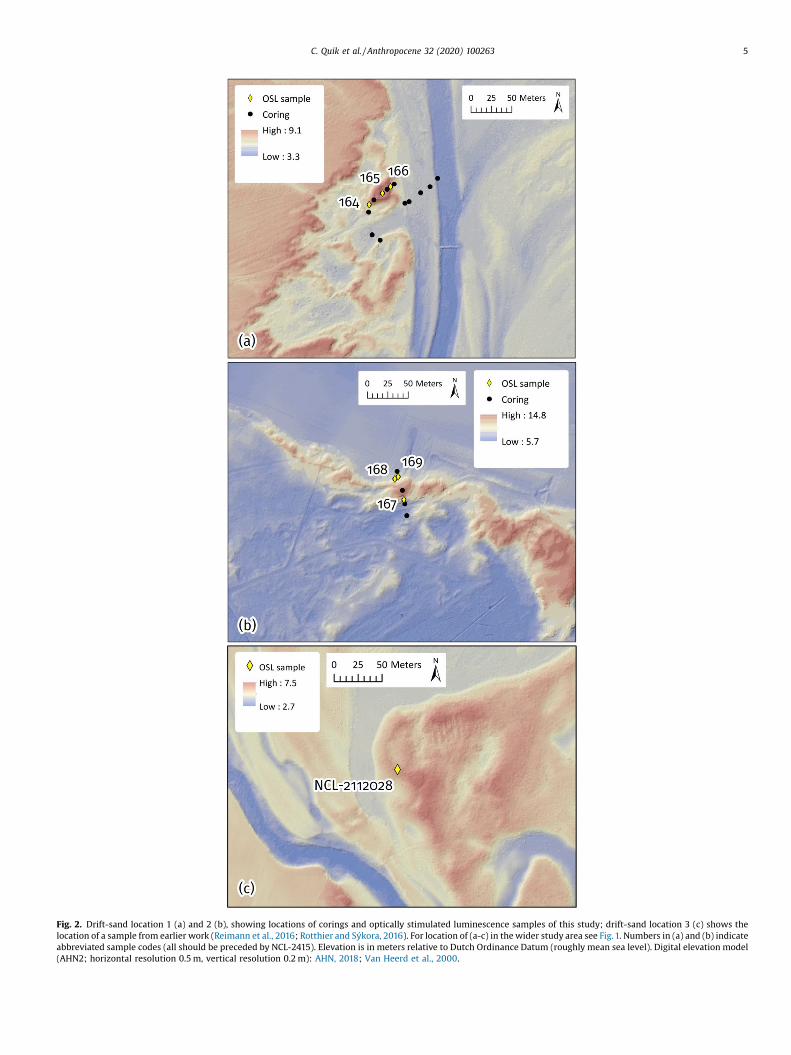
Fig. 2. Drift-sand location 1 (a) and 2 (b), showing locations of corings and optically stimulated luminescence samples of this study; drift-sand location 3 (c) shows thelocation of a sample from earlier work (Reimann et al., 2016; Rotthier and Sýkora, 2016). For location of (a-c) in the wider study area see Fig. 1. Numbers in (a) and (b) indicateabbreviated sample codes (all should be preceded by NCL-2415). Elevation is in meters relative to Dutch Ordinance Datum (roughly mean sea level). Digital elevation model(AHN2; horizontal resolution 0.5 m, vertical resolution 0.2 m): AHN, 2018; Van Heerd et al., 2000.
C. Quik et al. / Anthropocene 32 (2020) 100263 5
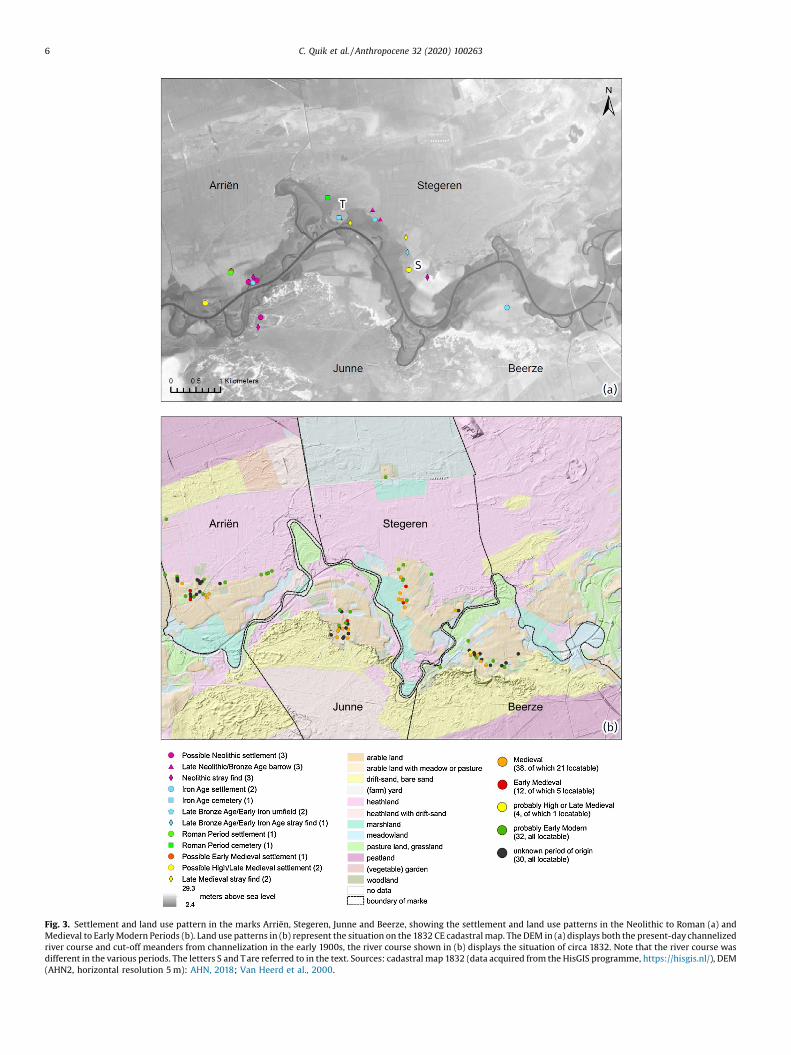
Fig. 3. Settlement and land use pattern in the marks Arriën, Stegeren, Junne and Beerze, showing the settlement and land use patterns in the Neolithic to Roman (a) andMedieval to Early Modern Periods (b). Land use patterns in (b) represent the situation on the 1832 CE cadastral map. The DEM in (a) displays both the present-day channelizedriver course and cut-off meanders from channelization in the early 1900s, the river course shown in (b) displays the situation of circa 1832. Note that the river course wasdifferent in the various periods. The letters S and T are referred to in the text. Sources: cadastral map 1832 (data acquired from the HisGIS programme, https://hisgis.nl/), DEM(AHN2, horizontal resolution 5 m): AHN, 2018; Van Heerd et al., 2000.
6 C. Quik et al. / Anthropocene 32 (2020) 100263

Fig. 4. The temporal development of the estimated number of farmsteads in thefour marks of the study area. For two marks (Junne, Beerze) data for 1300 CE werenot available.
C. Quik et al. / Anthropocene 32 (2020) 100263 7
the width of a distinct dune. The drift-sand deposits are located ontop of coversand deposits. Both sediments are often clearlydistinguishable by a palaeo-podzol that formed in the top of thecoversand prior to burial by drift-sand. In some places drift-sand isfound directly on top of coversand parent material, indicating thatthe podzol eroded prior to drift-sand deposition. The two dunes(Fig. 1a, 2a and 2b) were selected based on (1) their proximity tothe investigated meander bends and position such that drift-sandwould have blown towards the river channel under the dominantSW��NE wind direction (Koster, 2010), and (2) presence of apalaeo-podzol in the underlying coversand deposits (at least at thelee side of the dune), to maximize chances that the base of thedrift-sand deposit represents the age of first drift-sand activity.Further information on lithogenetic interpretation is available inthe Supplementary Materials. Corings were performed using anextended Edelman auger to a depth of 1.2–3.6 m, which was atmost points sufficiently deep to reach the in-situ podzol (ifpresent). Five corings were done between the abandoned channelof Junner Koeland and the adjacent drift-sand dune to excludepresence of fluvial deposits underneath the drift-sand covered area(also visible in Fig. 2a). The location and elevation of the coringswere determined with a Topcon Global Navigation Satellite System(GNSS) receiver, with a horizontal precision of �10 mm andvertical precision of �15 mm.
4.3.3. Optically stimulated luminescence (OSL) dating of drift-sandsTo determine the onset of drift-sand deposition near the two
river bends, six OSL samples were collected in drift-sand areas 1and 2 directly above the coversand podzols, aiming to determinethe age of first drift-sand deposition and podzol burial (samplelocations: see Fig. 2a and b and Supplementary Materials for moredetails).
After augering to the desired depth, OSL samples were collectedin a PVC pipe extension attached to the auger head, which wascarefully pressed down the auger hole. At one location (sampleNCL-2415164) the pipe was pressed into a vertical exposure. Uponretrieval of the PVC pipe both ends were immediately covered withplastic caps and light-impermeable black tape. For OSL measure-ments and dose rate determination we followed the proceduresdescribed by Quik and Wallinga (2018a). Statistical analysis of thedating results was done using the bootstrapped Minimum AgeModel (Galbraith et al., 1999; Cunningham and Wallinga, 2012)with an assumed overdispersion of 0.15 � 0.03.
5. Results
5.1. Historical river management
Archival study demonstrated that the Overijsselse Vecht wasscarcely mentioned in archives of various institutions on multiplegovernmental levels, indicating that river management waslimited and poorly coordinated. This is most evident from reportedconversations between the Dutch government and the province ofOverijssel, including a request from the government in 1853 CE tothe province to investigate which party was concerned with rivermanagement. Inevitably, the province of Overijssel concluded thatno party was concerned with river management and that landowners locally applied river management practices (e.g. placementof groynes) without governmental coordination (HCO, 2018a).Additionally, willingness of water boards and dike districts todevelop regional river management was limited. Archival materialof the dyke districts (HCO, 2018b, 2018c, 2018d, 2018e) indicatesthat these institutions were solely concerned with water safety andrelated reparation works. The river is also barely mentioned in theconstitutions of the local water boards (HCO, 2018f,g). Additional-ly, the province of Overijssel refused to contribute financially, upon
which the government discontinued its financial support for riverimprovements. Complaints about troublesome water levelsdownstream of our study area at the municipality of Dalfsen weredisregarded by the province, eventually causing the municipalityto directly address the king in search for help in 1863 CE (HCO,2018h).
The mark books of Arriën (1549–1826 and 1765–1835 CE) alsoindicate scarce attention for river management. Some erosionproblems and prevention discussions were recorded, which weresolely directed at protection of the mark’s greenlands (see 4.2.2).Interestingly, the expansion of the Junner Koeland meander, whichmigrated northward eroding land in the Arriën territory, was notdiscussed in the Arriën mark books (HCO, 2018i,j).
5.2. Habitation history and land use development
5.2.1. Spatiotemporal patterns in habitationThe study area includes four rural villages and their territories
named Arriën, Junne, Stegeren and Beerze (Fig. 3). These were firstmentioned in Late Medieval written sources. However, thefrequent occurrence of manorial property rights indicates thatall four villages already existed since at least the Early Middle Ages(Neefjes et al., 2011). They are situated at the lower slopes ofcoversand ridges nearby the Overijsselse Vecht (Fig. 3b) and maywell be the successors of earlier settlements that were situated onthe higher parts of the coversand ridges. These areas wereinhabited since late prehistory. This is corroborated by thedistribution pattern of the approximately 20 archaeological sitesin the area, including late prehistoric, Roman period and EarlyMedieval finds (Fig. 3a). A Pleistocene terrace remnant directly eastof the Junner Koeland meander was inhabited from late prehistoricto Roman times as well, but has been deserted since then (compareFig. 3a, letter T, with Fig. 3b). The cultural landscape patterns of thefour village territories are rather similar. However, some localdifferences occur. For example, the oldest nucleus of Stegeren issituated close to the river floodplain on the valley margin (Fig. 3a,letter S), whereas Arriën, Junne and Beerze are slightly furtheraway from the river.
Fig. 4 shows the estimated number of farmsteads at four datesbetween the end of the Early Middle Ages and 1832 CE. Startingfrom a very low number of farms around 1000 CE, there is a clearincrease until 1300 CE, after which the growth reduces or stagnatesuntil 1500 CE. The Early Modern period shows again a marked

Fig. 5. Development of river planform and drift-sand areas as derived from five historical maps. The dates mentioned are based on the revision date or, if none is given, onthe survey date (see Table 2). For the map sheet of the Hottinger atlas the survey covered 3 years; we indicated the middle year in (b). Low-water channel centrelines werederived from the analysis by Quik and Wallinga (2018a). Dotted areas in (a-e) indicate the area covered by drift-sand as displayed on historical maps. Grey shading indicatesthe area currently classified as arenosols in the Dutch soil classification ('duinvaaggronden' and 'vlakvaaggronden' combined). The graph in (f) shows the relative areacovered by drift-sand through time. Source Dutch soil map: Alterra (2014).
8 C. Quik et al. / Anthropocene 32 (2020) 100263

C. Quik et al. / Anthropocene 32 (2020) 100263 9
increase in the number of farmsteads. The foundation of variousnew farmsteads in (especially) the High and Late Middle Agesresulted in a more compact settlement pattern, as new farms werebuilt nearby older ones and in similar landscape settings (Fig. 3b).In the Early Modern period this densification process accelerated.Additionally, new groups of farmsteads were built at some distancefrom the older settlement nuclei, most prominently at the edge ofthe heathland zone (Fig. 3b).
5.2.2. Spatiotemporal patterns in land useIn late prehistory and the Roman period, the arable fields were
situated nearby the settlements. Both were located on the higherparts of the large coversand ridges alongside the river valley (VanBeek, 2009; Van Beek and Groenewoudt, 2011). The position of thearable fields did not change much through time; in the HighMedieval period the tops of the coversand ridges were reclaimedinto open field complexes (arable land; Dutch: ‘essen’), whichstayed in use for agriculture until the present day (Neefjes et al.,2011; Van Beek and Groenewoudt, 2011). The settlements hadgradually moved to their present-day position, at the lower slopesof the coversand ridges, from the Medieval period onwards. Thisimportant change of settlement location led to a larger fixation orplace continuity of different landscape elements, most notably thehamlets and their open field complexes.
Not much is known about the appearance and exploitation ofthe river floodplain in late prehistory and the Roman period. High-quality archaeobotanical evidence is lacking. With regard to theHigh Middle Ages, archaeobotanical data (macro remains andpollen) were collected at the archaeologically investigatedsettlement site of Dalfsen-Gerner Marke, situated approximately15 km downstream of our study area in a similar landscape setting(Van Haaster, 2006). It was demonstrated that the investigatedcoversand ridge along the Overijsselse Vecht had lost most of itsoriginal woodland vegetation before the Middle Ages. In the HighMiddle Ages it was largely in use as arable fields, where rye, flaxand probably barley and oats were grown. Two different types ofgrasslands were present in the nearby river valley: one type relatedto relatively dry soils, that probably was exploited as pasture, and atype linked to wetter soils that was probably used as hayland (VanHaaster, 2006). After the harvest these areas may temporarily havebeen used for grazing as well. Heather probably grew on the largecoversand plains at some distance from the river and may havebeen used for sheep grazing (Neefjes et al., 2011).
The evidence obtained at Dalfsen corresponds well withinformation derived from historical sources, which indicate theMedieval reclamation of floodplains for use as haylands (Bakker,1989). Grasslands were essential for local communities. In hisresearch on farming in the province of Drenthe in the period 1600–1910 CE, Bieleman (1987) analysed old land-tax registers. Thesedistinguish several types of ‘greenland’ (Dutch: 'groenland')occurring in stream and river valleys, which were used as eitherhayland and/or pasture. Even though the various greenland typeswere taxed differently, the overall value of greenlands wassubstantial (1.5–2.5 times higher) compared to the value of arablelands. Hay formed an indispensable crop, providing winter fodderfor draught animals that were used to cultivate the arable fields(Franklin, 1953; Dirkx, 1997).
The Overijsselse Vecht formed the administrative boundarybetween marks north and south of the river (Fig. 3b). The typicallylarge floodplain parcels directly bordering the river were owned bythe marks and consisted of high-quality grasslands that wereexceptionally suited for grazing by cattle, which have higherdemands regarding food quality than sheep. In these commonpastures every mark member had rights to graze a specific numberof cattle (Van Engelen van der Veen, 1924). These greenlands areoften indicated with the terms ‘mars’ or ‘maat/maten’. ‘Mars’ is a
toponym for ‘land by the water’ (Van Berkel and Samplonius, 1989)or ‘marshland’ (De Vries and De Tollenaere, 1995). ‘Mat’ stems fromthe word ‘dagmaat’ (Schönfeld, 1950), an old land measureindicating the area that could be mown by one man in one day(Bieleman and Brood,1980). By custom, pastures were named afterthe livestock type grazing there (Schönfeld, 1950). For instance,‘maat’ also occurs in the eastern Netherlands combined with theDutch word for cow (‘koe’), as in ‘Koemaat’ (Ter Laak andGroenewoudt, 2005). The two scroll-bar complexes investigatedhere are situated in the marks of Junne and Stegeren. The name‘Junner Koeland’, literally translates as ‘cowland of Junne’. ‘Prathoek’is a combination indicating the shape of the land (‘hoek’ meanscorner, Schönfeld, 1950) and its vegetation (‘prat’ probablyoriginates from the Latin pratum, meaning grassland, Malinckrodt,1974). Based on the combination of archaeological, historical andtoponymical information it is highly likely that both scroll-barcomplexes were intensively used for cattle grazing for centuries,and that this practice goes back to at least the High Middle Ages.
5.3. Drift-sand activity
5.3.1. Drift-sand covered area through timeThe drift-sand covered area derived from each of the five
historical maps is displayed in Fig. 5a to 5e, combined with theposition of the river as indicated by each map (following Quik andWallinga, 2018a). The graph in Fig. 5f shows the relative surfacearea of the drift-sand through time. The area covered by drift-sandincreased over time to approximately 17 % in 1851 CE, subsequentlarge-scale afforestation led to a quick drop in the drift-sandcovered area. The former drift-sand areas largely overlap withpresent-day arenosols, while at a few locations podzols havedeveloped in the drift-sand deposits after stabilization (Alterra,2008, 2014). For instance in the southern areas in Fig. 5c, wherethere is no overlap with arenosols, podzols have developed overtime. As the onset of drift-sand activity took place at least at 1500CE (see below), initial development of the drift-sands could not bederived from the maps. The spatial patterns in Fig. 5 clearly showthe development of drift-sands directly adjacent to the meandersof Junner Koeland and Prathoek. The land use pattern in Fig. 3bcorresponds well with the indicated drift-sand area in Fig. 5c.
Intruding sands formed a nuisance for the inhabitants of theOverijsselse Vecht valley. The first records of defence measuresagainst the drift-sand in mark books from the Dutch part of theriver valley date from the 16th century (Bruins, 1981). Sand-drifting was controlled e.g. by construction of tree girths (visible onthe historical map of 1720 CE in Fig. 6) or dykes. Consequentlydrift-sands could reach the river only locally. For instance, thedrift-sand west of Junner Koeland at location 1 probably causedrelatively few problems, because the arable fields of Arriën layupwind of the predominant SW-NE wind direction (Koster, 2010).As human-induced barriers were absent, the drift-sand couldinfluence the meander at Junner Koeland. A large part of the drift-sand coming from south of the river was probably caught in thetree girths and dykes surrounding the arable fields of Junne. Drift-sand blowing towards the apex of Prathoek was probably notlimited in this way, because no arable fields were present directlysouth of this meander.
5.3.2. Lithological survey drift-sand areasThe drift-sand dune at location 1 has a diameter of about 30 m
and varies in elevation from circa 6–9 above sea level (a.s.l.). At thecoring locations the thickness of the drift-sand layer variesbetween 10 and 180 cm. At location 2 the drift-sand forms alinear structure bordering the arable fields of Junne (Fig. 2b). Thisdrift-sand ridge has a width of about 60 m and a length of circa1 km. It varies in elevation from circa 8 m a.s.l. at its borders to

ness,tdseg,g
Fig. 6. Section of the map drawn by Pieter de la Rive around 1720 CE. Various areas are characterized by sand dunes. Arable fields are often bordered by tree girths forprotection against drift-sand. The dominant wind direction and position where drift-sand could blow towards the river are indicated by arrows. Sources: Algemeen RijksArchief (1996); Wolfert et al. (1996); Box (2007).
10 C. Quik et al. / Anthropocene 32 (2020) 100263
about 16 m a.s.l. at its highest point. Corings showed that thicknessof the drift-sand layer varies between 120 and 350 cm (here themaximum thickness of the drift-sand layer is at least 350 cm;augering depth was not sufficient to reach the coversand depositsat the centre of the ridge). The five corings that were placedbetween the abandoned channel of Junner Koeland and theadjacent drift-sand dune (Fig. 2a) demonstrated that these drift-sands are underlain by coversand, indicating absence of Holocenefluvial deposits underneath the drift-sands. The two corings at thewest end of this transect proved that the boundary between fluvialdeposits and the drift-sand area is abrupt, which matchesgeomorphological observations based on the DEM (Fig. 2a) andin the field.
Table 1Optically stimulated luminescence (OSL) dating results for the drift-sand samples. Thethat underlies the drift-sand. RD = Dutch coordinate system, NA = not available. For aModel (Cunningham and Wallinga, 2012). Source of sample NCL-2112028: Reimann
Sample Dune side Podzol Location(RD coordinates)
Sample depth belsurface (m)
Code Site x y Upper limit Low
NCL-2415164 1 Stoss Yes 228798 505,776 0.15 0.2NCL-2415165 1 Middle Yes 228814 505,790 0.39 0.6NCL-2415166 1 Lee Yes 228824 505,798 0.15 0.4NCL-2415167 2 Stoss No 230201 503,787 �3.00 3.19NCL-2415168 2 Lee Yes 230190 503,813 3.09 3.2NCL-2415169 2 Lee Yes 230194 503,815 1.24 1.42NCL-2112028 3 NA NA 229096 505,375 0.28 0.4
5.3.3. Optically stimulated luminescence (OSL) dating resultsThe OSL dating results are listed in Table 1. At drift-sand locatio
1 the OSL results show that the sample taken in the middle of thdune is the oldest (1837 � 20 CE). The sample from the lee side isomewhat younger (1919 � 13 CE) and the stoss side sample iyoungest (1983 � 10 CE). A similar pattern was found for location 2where the sample collected near the middle of the dune is oldes(1500 � 31 CE), the lee side sample is younger (1620 � 48 CE) anthe stoss side sample is youngest (1820 � 45 CE). These ageindicate that growth of the dunes was directed against thdominant wind direction, perhaps with some sediment blowinover the dune to the lee side during stormy weather. At location 1where some bare patches are present today and the datin
column ‘Podzol’ refers to presence or absence of a spodic horizon in the coversandll samples the palaeodoses and ages are based on the bootstrapped Minimum Age
et al. (2016); Rotthier and Sýkora (2016).
ow Palaeodose (Gy) Total dose rate (Gy/ka) OSL age(ka)
OSL age(year CE)
er limit m s m s m s m s
0.04 0.01 1.18 0.04 0.03 0.01 1983 104 0.19 0.02 1.08 0.04 0.18 0.02 1837 20 0.10 0.01 1.08 0.04 0.10 0.01 1919 13
0.15 0.03 0.76 0.02 0.20 0.05 1820 456 0.42 0.02 0.82 0.03 0.52 0.03 1500 31
0.34 0.04 0.87 0.03 0.40 0.05 1620 483 0.46 0.06 1.31 0.04 0.35 0.05 1659 51

C. Quik et al. / Anthropocene 32 (2020) 100263 11
indicated very recent sedimentation, an increasing importance ofNE winds in currently active drift-sands (Jungerius and Riksen,2010) could also have played a role. According to the cadastral map(Fig. 3b) drift-sand location 1 was covered by heather in 1832 CE,however the OSL dates indicate that the drift-sand remained activeuntil 1983. The largest part of the drift-sand ridge at location 2 hadbeen stabilized by a forest cover in 1851 CE (Fig. 5d). One OSL datewas available from earlier work (Reimann et al., 2016; Rotthier andSýkora, 2016) and denoted as drift-sand location 3 (Fig. 1b, Fig. 2c,listed at the bottom of Table 1). This sample was collected at adepth of 0.28�0.43 meters below the surface in aeolian depositsfound on top of a Pleistocene terrace remnant in Junner Koeland. Itwas dated at 1463 � 28 CE (Reimann et al., 2016), matching withthe ages found at drift-sand location 2, where the oldest samplewas dated at 1500 � 31 CE.
6. Discussion
6.1. River management
The consulted archival material demonstrated that there was nospecific authority concerned with regional coordination of rivermanagement of the Overijsselse Vecht. Locally, farmers and landowners concerned with protection of their property applied small-scale practices such as placement of groynes. However, thishappened only to a limited degree as appears from the low numberof records. The aloofness of higher authorities and resulting lack ofregional management strategies provided free rein for local landuse and drift-sand activity to affect meander development.
6.2. Settlement pattern and land use
The chronological development of the estimated number offarmsteads (Fig. 4, Fig. 7) follows the common trend in NorthwestEurope (Bieleman, 2008; Persson and Sharp, 2015). A gradual
Fig. 7. Multidisciplinary overview of developments in the study area. Top: averagenumber of farmsteads (i.e. averaged for the marks Arriën, Beerze, Junne, Stegeren,see Fig. 4). Upper middle: period of activity of drift-sand areas 1 and 2 asdetermined with OSL dating and relative drift-sand area as derived from historicalmaps (see Fig. 5). Lower middle: shift from a laterally stable to a meanderingchannel pattern (circa 1400 –1500 CE, set to 1450 in the graph, data derived fromCandel et al., 2018) and development of meander amplitude of Prathoek and JunnerKoeland (data derived from Quik and Wallinga, 2018a). Bottom: reconstructedmean bankfull discharge (data derived from Candel et al., 2018). For the sake ofclarity uncertainties are not shown here.
increase in settlement size during the Early Middle Ages wasfollowed by a strong population growth and reclamation activitybetween c. 1100 – c. 1350, followed by a stabilization phase orperiod of reduced growth between c. 1350–1500, and a strongrenewed growth after 1500 CE. The farmstead numbers for 1832are exact as they were derived from the first national Cadastre. Thenumbers for all other time points should be considered asconservative estimates, since there may have been yeomen andpeasants owning farms that were unrecorded in the used LateMedieval sources.
Historical sources indicate that drift-sand became exceedinglyproblematic near the river valley since at least the 16th century,and that different measures were taken to restrain them (Bruins,1981). This trend coincides with the strong growth in farmsteadnumbers from 1500 CE onwards (Fig. 4). It is highly likely thatintensified land use led to increased drift-sand activity (Castelet al., 1989; Pierik et al., 2018), as corroborated by the OSL datingresults indicating drift-sand deposition from the beginning of the16th century CE onwards (Table 1). We previously showed that theshift of the Overijsselse Vecht from a laterally stable to ameandering channel pattern took place during the Late MiddleAges, caused by an increase of peak discharges (1400–1500 CE,Fig. 7; Candel et al., 2018). The period of large meander formationlocally (roughly 1400–1900 CE, Quik and Wallinga, 2018a,b)overlaps with strong growth in the farmstead numbers and theactivity period of drift-sands directly adjacent to the meanders ofJunner Koeland and Prathoek (Fig. 7). It seems reasonable toassume that the increase in farmstead numbers resulted in newreclamations, higher land use intensity and indirectly affectedactivity and expansion of drift-sands.
The grasslands on the scroll-bar complexes (Fig. 3b) were usedfor grazing (and possibly hay-making) from (at least) the HighMiddle Ages onwards (cf. Van Haaster, 2006). It remains howeverdifficult to assess whether related land use effects had a significantimpact on meander development, as land use on scroll-barcomplexes of meanders expanding beyond the Pleistocene valleymay have been similar in meanders that remained confined by thevalley side. Detecting land use changes at this scale wouldconsequently require archival study at the level of individual farms.We hypothesize that (1) cattle may have enhanced local bankerosion through trampling (Trimble and Mendel, 1995), withshallow water levels in the Overijsselse Vecht (Staring and Stieltjes,1848) potentially aiding access of cattle to the concave river bank;(2) the high value of the grasslands and the function of the river asadministrative border between the marks suggests an economicincentive for deliberate human-induced bank disruption or actionspromoting erosion of the concave bend and point-bar develop-ment along the convex bend. The mark affected by erosion wouldlose only drift-sand covered territory of low value. We have, so far,not been able to identify historical sources to test thesehypotheses. Highly detailed archival studies may shed light onthe relevance of these processes.
6.3. Drift-sand
Our dating results indicate a chronological conformity betweenlateral meander expansion (ca. 1400–1900 CE, Quik and Wallinga,2018a,b) and nearby drift-sand activity (Fig. 7). The oldest drift-sand sample was dated at 1500 � 31 CE. This date indicates thestart of the formation of the drift-sand dyke surrounding the arablefields of Junne. Activity of drift-sands must have started evenearlier, as construction of this dyke signifies a response to the drift-sands threatening the arable land.
Previous studies suggested that bank stability of outer banksmay decrease as they become covered by drift-sand (Wolfert et al.,1996; Wolfert and Maas, 2007). Deposition on the banks may cause

hdsrgdysr
y,odtrl
t,fengoed.eyletdye-l.dg--
cne
ad
dhne
n)
12 C. Quik et al. / Anthropocene 32 (2020) 100263
riparian vegetation to cease, diminishing the bank erosion-resistance. Additionally, the drift-sand cover itself consists of verynon-cohesive material that is prone to fluvial erosion. Historicalmaps show that the drift-sands were situated directly adjacent tothe meanders of Junner Koeland and Prathoek (Fig. 5), and orientedsuch that sand would blow towards the river under thepredominant wind direction (Fig. 6). Protection measures suchas the dyke of Junne (drift-sand location 2) locally inhibit drift-sands from reaching the river. Lacking protective structures leavethe apex of Prathoek fully exposed. Consequently drift-sanddeposition will have affected bank stability of this meander’sapex. Additionally, as Prathoek is located directly upstream ofJunner Koeland, blown-in sands may have affected Junner Koelandas well prior to drift-sand activity west of this meander (at drift-sand location 1). According to our OSL dates drift-sands were activehere from 1837 � 20 CE onwards. However, historical maps pointtowards drift-sand activity at this site from as early as 1720 CE(Fig. 5a). Drift-sand activity at location 1 overlaps partly withmeander formation at Junner Koeland, and fully with formation ofthe skewed apex. Drift-sands that were present north of JunnerKoeland, as visible on the historical map of 1720 (Fig. 5a), willgradually have been eroded by the river. Drift-sand in this positionwould not blow towards the river under the predominant winddirection, but the drift-sand cover probably resulted in lowerstability of the northern bank and hence was prone to erosion bythe expanding Junner Koeland meander. In addition, coringevidence from drift-sand location 1 shows a sharp boundarybetween fluvial and drift-sand deposits which points towardsfluvial erosion of drift-sand-covered terrain (Fig. 2a).
Interactions between fluvial and aeolian geomorphology arewidespread but are often not studied in combination, hence theunderlying mechanisms are less well understood (Liu andCoulthard, 2015). Our observations support a reduction of bankstability following drift-sand deposition as discussed by Wolfertet al. (1996) and Wolfert and Maas (2007) as active geomorphicprocess. Additionally, drift-sands can act as an extra sedimentsupply to the river, altering its morphodynamics by enhancing therate of scroll bar growth and therefore the rate of bank erosion(Ferguson, 1987; Nanson and Croke, 1992). The collapse of drift-sand covered banks upon fluvial erosion will also lead to additionalsediment supply to the river, which may affect river morphody-namics. Cross-sections by Candel et al. (2018) showed that thechannel deposits did not incise since 1400/1500 CE, but thatthe river bed in fact slightly aggraded during the meanderingphase. This may point towards high sediment supply due to thedrift-sands.
6.4. Reflection on relative importance of drivers
Formation of the Junner Koeland meander started at 1433 � 92CE (Quik and Wallinga, 2018a,b). Following the channel patternchange from laterally stable to meandering, the initial formation ofmeanders was part of the natural regime of the river (Candel et al.,2018). This initial meander formation was not caused or influencedby local allogenic drivers, but by a catchment-scale dischargeregime change. However, the continuous growth of meanders likeJunner Koeland and Prathoek which migrated beyond the river’svalley sides reaching amplitudes over twice their expected size isremarkable. Lack of regional river management strategies led to asituation where the river could meander freely. Rising numbers offarmsteads in the study area created land use pressures that werehitherto unprecedented. A consequence of this high land useintensity was formation of local drift-sands (Castel et al., 1989;Pierik et al., 2018), and drift-sand deposition on river banks willhave lowered their resistance to fluvial erosion (Wolfert et al.,1996; Wolfert and Maas, 2007). Our data show that drift-sand
influence was present during the entire period of meander growtat Prathoek, and from 1720 CE onwards for Junner Koeland. Baseon our multidisciplinary analysis we consider drift-sand activity athe most prominent effect to cause the exceptional meandeexpansion observed at Junner Koeland and Prathoek. Sand-driftinis in itself a consequence of the high population density and lanuse pressure. Lacking fluvial management left the boundarconditions for meandering unchanged and allowed drift-sandthat locally affected the river to exert their influence on rivedynamics.
6.5. Implications
During the Late-Holocene, fluvial activity of rivers generallincreased due to catchment-scale land use changes by humanschanging rivers into more actively laterally migrating rivers due tenhanced sediment load and discharges (e.g. Notebaert anVerstraeten, 2010; Brown et al., 2018; Gibling, 2018; Notebaeret al., 2018). Here we show that human influence did not only occuat the catchment-scale, but also contributed to exceptionamorphodynamics at the level of individual meander bends.
The lessons learned at this site are relevant for managemenand restoration of meandering rivers in similar settings elsewhereparticularly considering the need to estimate spatial demands o(restored) low-energy fluvial systems and to adequately managbank erosion and related hazard risks (e.g. Piégay et al., 2005). Imany parts of the world, low-energy rivers are presently beinrestored from their channelized state to rivers that are allowed tfreely erode their banks (Wohl et al., 2005). Restoration goals aroften based on the channel planform preceding channelization anaiming to resemble the river course from historical mapsConsequently palaeochannels are reconnected to redesign thriver channel (Kondolf, 2006). However, meandering activitstrongly relates to stream power (Candel et al., 2018) and localand use, which change over time. Hence, rivers should not brestored to a certain historical reference, as the conditions thaallowed this planform to develop may no longer be valid animpossible to return to (Dufour and Piégay, 2009). Instead, prioritshould be given to characterizing the current and futurmorphological conditions prior to setting goals for river restoration. We have shown that local changes of morphologicaconditions may result in exceptional changes of river dynamicsThis may lead to unwanted and unexpected erosion of land aninfrastructure. Hence a further development of our understandinof small-scale human-landscape interactions in fluvial environments could be of great practical value for the restoration of lowenergy rivers and predicting future change.
7. Conclusion
We identified potential direct and indirect anthropogenidrivers for the development of exceptionally large meanders ilowland rivers. Our multidisciplinary and in-depth analysis of thOverijsselse Vecht river:
(1) Indicates lacking regional management of the river systemthroughout the Early and Late Modern period, which created
situation where local land use and drift-sand deposition coulinterfere with river dynamics;
(2) Shows a strong increase in the number of farmsteads anrelated intensification of local land use starting in the HigMiddle Ages and continuing through the Early and Late Moderperiod. This increase in habitation density matches with thperiod of meander growth;
(3) Reveals a chronological conformity between lateral migratioof two exceptionally large meanders and (human-induced

C. Quik et al. / Anthropocene 32 (2020) 100263 13
drift-sand deposition on their outer banks. Our results indicatethat this interaction may have caused exceptional meanderexpansion beyond the valley sides.
Data availability
All data from this study are available under CC��BY 4.0 licenseat the 4TU.Centre for Research Data; see Quik et al. (2020). Detailsof the OSL dates of the meander bends are available in Quik andWallinga (2018a, 2018b) and additional information on thepalaeohydrological reconstruction can be found in Candel et al.(2018).
Author contributions
BM, GM, JW and CQ proposed the initial outline of theresearch and selected the field sites. CQ performed the corings inthe drift-sand areas followed by OSL sample collection by CQ, JC,and BM. CQ assisted with preparation of the OSL samples in thelaboratory, OSL results were analysed by JW. RvB collected andanalysed the archaeological data. MP, RvB and TS performed theanalyses of Medieval farmsteads. MV analysed historical rivermanagement based on archival study under the supervision ofRvB, MP and JC. CQ wrote the initial manuscript, with mainadditions by JC, RvB, and MP. The draft was finalized by allauthors.
Declaration of Competing Interest
The authors declare that they have no known competingfinancial interests or personal relationships that could haveappeared to influence the work reported in this paper.
Acknowledgements
This research is part of the research programme RiverCare,supported by the Netherlands Organization for Scientific Research(NWO) and the Dutch Foundation of Applied Water Research(STOWA), and is partly funded by the Ministry of Economic Affairsunder grant number P12-14 (perspective programme). We thankStaatsbosbeheer Vechtdal and Landgoed Junne for access to andinside knowledge of the field sites; Peter, Sylvia and Jim Quik fortheir assistance with the field work; the Laboratory of Geo-information Science and Remote Sensing (Wageningen University)for the provision of GNSS-equipment; Alice Versendaal and ErnaVoskuilen of The Netherlands Centre for Luminescence dating fortheir efforts in the laboratory; Jeroen Zomer of the Dutch CulturalHeritage Agency for the kind supply of a database of Medievalfarmsteads in the study area; Hans Mol (HisGIS) for making the1832 cadastral data of Overijssel available to our study; Erik vanden Berg and Luc Jehee for their help with historical sources. Wethank two anonymous reviewers for their helpful comments toimprove our manuscript.
Appendix A. Supplementary data
Supplementary material related to this article can befound, in the online version, at doi:https://doi.org/10.1016/j.ancene.2020.100263.
References
AHN, 2018. De details van het Actueel Hoogtebestand Nederland [Details of the DigitalElevation Model of The Netherlands]. Available at: http://ahn.maps.arcgis.com/
apps/Cascade/index.html?appid=75245be5e0384d47856d2b912fc1b7ed[Accessed 22 February 2018].
Alford, J.L., Holmes, J.C., 1985. Meander scars as evidence of major climate change insouthwest Louisiana. Ann. Assoc. Am. Geogr. 75, 395–403.
Algemeen Rijks Archief, 1996. Limiten tussen Bentheim en Overijssel by Pieter de laRive, Genie-archief, Situatiekaart 07. .
Alterra, 2008. Geomorfologische kaart van Nederland. 1:50.000, versie 2008[Digital file]. Wageningen UR – Alterra, the Netherlands. .
Alterra, 2014. Bodemkaart van Nederland. 1:50.000, versie 2014 [Digital file].Wageningen UR – Alterra, the Netherlands. .
Bakker, J.P., 1989. Nature Management by Grazing and Cutting: on the EcologicalSignificance of Grazing and Cutting Regimes Applied to Restore Former Species-rich Grassland Communities in the Netherlands. Kluwer Academic Publishers,Dordrecht.
Bieleman, J., 1987. Boeren op het Drentse Zand 1600-1910: Een nieuwe visie op deoude landbouw. Landbouwuniversiteit Wageningen.
Bieleman, J., 2008. Boeren in Nederland. Geschiedenis van de landbouw 1500-2000.Boom: Amsterdam. .
Bieleman, J., Brood, P., 1980. Zeventiende-eeuwse Drentse landmaten en hungebruik. Geog. Tijdschrift 14 (2), 112–119.
Box, L., 2007. Pieter de La Rive (1694-1771) ‘Directeur der Fortificatiën vanMaastricht’. Caert Thresoor - Tijdschrift voor de Geschiedenis van de Cartografie3, 65–69.
Brown, A., Lespez, L., Sear, D., Macaire, J., Houben, P., Klimek, K., Brazier, R., Van Oost,K., Pears, B., 2018. Natural vs anthropogenic streams in Europe: history, ecologyand implications for restoration, river-rewilding and riverine ecosystemservices. Earth. Rev. 180, 185–205. doi:http://dx.doi.org/10.1016/j.earscirev.2018.02.001.
Bruins, H., 1981. Vechten tegen het zand - Stuifzandbestrijding in de marken langsde Vecht. In: Aalbers, J. (Ed.), Bijdragen Uit Het Land Van IJssel En Vecht: 4eBundel IJsselakademie. Waanders, Zwolle, pp. 7–22.
Candel, J., 2020. Ahead of the Curve - Channel Pattern Formation of Low-energyRivers. Wageningen University.
Candel, J.H.J., Kleinhans, M.G., Makaske, B., Hoek, W.Z., Quik, C., Wallinga, J., 2018.Late Holocene channel pattern change from laterally stable to meandering – apalaeohydrological reconstruction. Earth Surf. Dyn. 6 (3), 723–741. doi:http://dx.doi.org/10.5194/esurf-6-723-2018.
Candel, J., Makaske, B., Kijm, N., Kleinhans, M., Storms, J., Wallinga, J., 2020. Self-constraining of low-energy rivers explains low channel mobility and tortuousplanforms. Depos. Rec. 00, 1–22. doi:http://dx.doi.org/10.1002/dep2.112.
Castel, I., Koster, E., Slotboom, R., 1989. Morphogenetic aspects and age of LateHolocene eolian drift sands in Northwest Europe. Zeitschrift furGeomorphologie 33 (1), 1–26.
Coster, W., 1999. Omtrent de Vechtlanden: waterschapsgeschiedenis in NoordoostOverijssel. Waanders, Zwolle.
Cunningham, A.C., Wallinga, J., 2012. Realizing the potential of fluvial archives usingrobust OSL chronologies. Quat. Geochronol. 12, 98–106. doi:http://dx.doi.org/10.1016/j.quageo.2012.05.007.
De Vries, J., De Tollenaere, F., 1995. Etymologisch Woordenboek. Het Spectrum.Dépret, T., Gautier, E., Hooke, J., Grancher, D., Virmoux, C., Brunstein, D., 2017. Causes
of planform stability of a low-energy meandering gravel-bed river (Cher River,France). Geomorphology 285, 58–81. doi:http://dx.doi.org/10.1016/j.geomorph.2017.01.035.
Dirkx, G.H.P., 1997. Ende men sal van een erve ende goedt niet meer dan een tropschaepe holden. Historische begrazing van gemeenschappelijke weidegrondenin Gelderland en Overijssel, Wageningen.
Dirkx, G.H.P., PWFM, Hommel, Vervloet, J.A.J.,1996. Kampereiland: een wereld op degrens van zout en zoet. Matrijs: Utrecht. .
Dufour, S., Piégay, H., 2009. From the myth of a lost paradise to targeted riverrestoration: forget natural references and focus on human benefits. River Res.Appl. 25 (5), 568–581. doi:http://dx.doi.org/10.1002/rra.1239.
Eekhout, J.P.C., 2014. Morphological Processes in Lowland Streams - Implications forStream Restoration. Wageningen University doi:http://dx.doi.org/10.1017/CBO9781107415324.004.
Ferguson, R.I., 1987. Accuracy and precision of methods for estimating river loads.Earth Surf. Process. Landf. 12 (1), 95–104. doi:http://dx.doi.org/10.1002/esp.3290120111.
Franklin, T.B., 1953. British Grasslands from the Earliest Times to the Present Day.Faber and Faber, London.
Galbraith, R.F., Roberts, R.G., Laslett, G.M., Yoshida, H., Olley, J.M., 1999. Opticaldating of single and multiple grains of quartz from Jinmium rock shelter,Northern Australia: part I, Experimental design and statistical models.Archaeometry 41 (2), 339–364. doi:http://dx.doi.org/10.1111/j.1475-4754.1999.tb00987.x.
Gibling, M.R., 2018. River systems and the Anthropocene: a Late Pleistocene andHolocene timeline for human influence. Quaternary 1 (21), 1–37. doi:http://dx.doi.org/10.3390/quat1030021.
HCO, 2018a. Rijkswaterstaat in Overijssel: Stukken betreffende de verbetering vande rivier, 1853 - 1855, 1860 - 1863. Historisch Centrum Overijssel, 0140.1, Inv.nr.676: Zwolle.
HCO, 2018b. Derde Dijkdistrict Van Overijssel: Registers Houdende Notulen Van HetDijksbestuur, 1836-1872. Historisch Centrum Overijssel, WS-20, Inv.nr. 3:Zwolle.
HCO, 2018c. Waterschap De Zuider Vechtdijken (Zesde Dijkdistrict Van Overijssel):Register Van Notulen Van De Vergaderingen Van Het Verenigd College En HetDijkbestuur, 1836-1849. Historisch Centrum Overijssel, WS-15, Inv.nr. 1: Zwolle.

)
es.
d7.
rv.
8.
s
o
k,le//
gs.
.,ly
.
e
rt
.
-
n.nt.
.),d7
4
14 C. Quik et al. / Anthropocene 32 (2020) 100263
HCO, 2018d. Waterschap De Zuider Vechtdijken (Zesde Dijkdistrict Van Overijssel):Register Van Notulen Van De Vergaderingen Van Het Verenigd College En VanHet Dijkbestuur, 1849-1883. Historisch Centrum Overijssel, WS-15, Inv.nr. 2:Zwolle.
HCO, 2018e. Waterschap De Zuider Vechtdijken (Zesde Dijkdistrict Van Overijssel):Bestekken En Akten Van Aanbestedingen Van Werkzaamheden Aan De DijkenEn Kaden En De Krib- En Pakwerken, 1836-1855. Historisch Centrum Overijssel,WS-15, Inv.nr. 147: Zwolle.
HCO, 2018f. Derde Dijkdistrict Van Overijssel: Stukken Betreffende De VaststellingVan Het Grondreglement Voor De Waterschappen in Overijssel, 1879-1883.Historisch Centrum Overijssel, WS-20, Inv.nr. 18: Zwolle.
HCO, 2018g. Derde Dijkdistrict Van Overijssel: Stukken Betreffende Het Concept-reglement Voor Het Waterschap De Noorder Vechtdijken, 1883. HistorischCentrum Overijssel, WS-20, Inv.nr. 19: Zwolle.
HCO, 2018h. Gemeente Dalfsen, Gemeentebestuur: Stukken Betreffende HetOnderhoud Aan En De Verbetering Van De Bevaarbaarheid Van De Vecht, MetTekeningen, 1856 - 1866, 1905 - 1908. Historisch Centrum Overijssel, 0624, Inv.nr. 1023: Zwolle.
HCO, 2018i. Marken in de provincie Overijssel: Markeboek, 1549-1826. HistorischCentrum Overijssel, 0157, Inv.nr. 29: Zwolle.
HCO, 2018j. Marken in de provincie Overijssel: Markeboeken, 1765-1835. HistorischCentrum Overijssel, 0157, Inv.nr. 33: Zwolle.
Hickin, E.J., Nanson, G.C., 1984. Lateral migration rates of river bends. Journal ofHydraulic Engineering1 110 (11), 1557–1567.
Hobo, N., 2006. Hydraulische effecten van verschillende inrichtingsscenarios voorde Overijsselse Vecht; een verkennende studie met behulp van een SOBEK-model. Wageningen. .
Hooke, J.M., 2007. Spatial variability, mechanisms and propagation of change in anactive meandering river. Geomorphology 84 (3–4), 277–296. doi:http://dx.doi.org/10.1016/j.geomorph.2006.06.005.
Hudson, P., Kesel, R., 2000. Channel migration and meander-bend curvature in thelower Mississippi River prior to major human modification. Geology 28 (6),531–534.
Hudson, P., Middelkoop, H., Stouthamer, E., 2008. Flood management along theLower Mississippi and Rhine Rivers (the Netherlands) and the continuum ofgeomorphic adjustment. Geomorphology 101 (1–2), 209–236. doi:http://dx.doi.org/10.1016/j.geomorph.2008.07.001.
Huisink, M., 2000. Changing river styles in response to Weichselian climate changesin the Vecht valley, eastern Netherlands. Sediment. Geol. 133, 115–134.
Jongmans, A.G., Van den Berg, M.W., Sonneveld, M.P.W., GJWC, Peek, Van den Bergvan Saparoea, R.M., 2013. Landschappen van Nederland - Geologie, Bodem enLandgebruik. Wageningen Academic Publishers, Wageningen.
Jungerius, P.D., Riksen, M.J.P.M., 2010. Contribution of laser altimetry images to thegeomorphology of the Late Holocene inland drift sands of the European SandBelt. Baltica 23 (1), 59–70.
Kadaster, 2018. Topographische en Militaire Kaart van het Koninkrijk derNederlanden, 1: 50 000, map sheet 22 (publication date 1859), Digital file. CC-BY Kadaster, Apeldoorn, The Netherlands. .
Kasse, C., Hoek, W.Z., Bohncke, S.J.P., Konert, M., Weijers, J.W.H., Cassee, M.L., Van derZee, R.M., 2005. Late Glacial fluvial response of the Niers-Rhine (westernGermany) to climate and vegetation change. J. Quat. Sci. 20 (4), 377–394. doi:http://dx.doi.org/10.1002/jqs.923.
Kasse, C., Van Balen, R., Bohncke, S.J.P., Wallinga, J., Vreugdenhil, M., 2017.Climate and base-level controlled fluvial system change and incisionduring the last glacial–interglacial transition, Roer river, the Netherlands– western Germany. Geol. En Mijnb. 96 (2), 71–92. doi:http://dx.doi.org/10.1017/njg.2016.50.
KNMI, 2019a. Maandoverzicht van het weer in Nederland - Januari 2019. De Bilt.. .KNMI, 2019b. Maandoverzicht van het weer in Nederland - Juli 2019. De Bilt.. .Kondolf, G.M., 2006. River restoration and meanders. Ecol. Soc. 11 (2), 42.Kondolf, G., Piégay, H., Landon, N., 2002. Channel response to increased and
decreased bedload supply from land use change: contrasts between twocatchments. Geomorphology 45 (1–2), 35–51. doi:http://dx.doi.org/10.1016/S0169-555X(01)00188-X.
Koster, E.A., 2010. Origin and development of Late Holocene drift sands. In: Fanta,J., Siepel, H. (Eds.), Inland Drift Sand Landscapes. KNNV Publishing, Zeist, pp.25–48.
Kuenen, P., 1944. The Drentse riviertjes en het meander-vraagstuk: Overdruk uitGedenkboek P. Tesch. .
Liu, B., Coulthard, T., 2015. Mapping the interactions between rivers and sand dunes:implications for fluvial and aeolian geomorphology. Geomorphology 231, 246–257. doi:http://dx.doi.org/10.1016/j.geomorph.2014.12.011.
Macklin, M., Jones, A., Lewin, J., 2010. River response to rapid Holoceneenvironmental change: evidence and explanation in British catchments. Quat.Sci. Rev. 29 (13–14), 1555–1576. doi:http://dx.doi.org/10.1016/j.quascirev.2009.06.010.
Makaske, B., Van Smeerdijk, D., Peeters, H., Mulder, J., Spek, T., 2003. Relative water-level rise in the Flevo lagoon (the Netherlands), 5300-2000 cal. yr BC: Anevaluation of new and existing basal peat time-depth data. Geologie enMijnbouw/Netherlands J. Geosci. 82 (2), 115–131. doi:http://dx.doi.org/10.1017/S0016774600020680.
Makaske, B., van der Deijl, E., Kleinhans, M., 2016. Het natuurlijke patroon vanbeken. Landschap 33, 185–193.
Malinckrodt, H.H., 1974. Latijns Nederlands Woordenboek. UItgeverij Het Spectrum,Utrecht/Antwerpen.
Middelkoop, H., Stouthamer, E., Schoor, M.M., Wolfert, H.P., Maas, G.J., 2003.Kansrijkdom voor rivierecotopen vanuit historisch-geomorfologischperspectief; Rijntakken - Maas - Benedenrivieren. NCR, Delft.
Nanson, G.C., Croke, J.C., 1992. A genetic classification of floodplains.Geomorphology 4 (6), 459–486. doi:http://dx.doi.org/10.1016/0169-555X(9290039-Q.
Neefjes, J., Brinkkemper, O., Jehee, L., Van de Griendt, W., 2011. CultuurhistorischAtlas van de Vecht: Biografie van Nederlands grootste kleine rivier. WBOOKS i.m. provincie Overijssel en Rijksdienst voor het Cultureel Erfgoed. .
Nicoll, T.J., Hickin, E.J., 2010. Planform geometry and channel migration of confinemeandering rivers on the Canadian prairies. Geomorphology 116 (1–2), 37–4doi:http://dx.doi.org/10.1016/j.geomorph.2009.10.005.
Notebaert, B., Verstraeten, G., 2010. Sensitivity of West and Central European rivesystems to environmental changes during the Holocene: a review. Earth. Re103 (3–4), 163–182. doi:http://dx.doi.org/10.1016/j.earscirev.2010.09.009.
Notebaert, B., Broothaerts, N., Verstraeten, G., 2018. Evidence of anthropogenictipping points in fluvial dynamics in Europe. Glob. Planet. Change 164, 27–3doi:http://dx.doi.org/10.1016/j.gloplacha.2018.02.008.
Persson, K., Sharp, P., 2015. An Economic History of Europe: Knowledge, Institutionand Growth, 600 to the Present. Cambridge University Press, Cambridge.
Piégay, H., Darby, S.E., Mosselman, E., Surian, N., 2005. A review of techniquesavailable for delimiting the erodible river corridor: A sustainable approach tmanaging bank erosion. River Res. Appl. 21, 773–789. doi:http://dx.doi.org/10.1002/rra.881.
Pierik, H.J., Lanen, R.J.V., MTIJ, Gouw-bouman, Groenewoudt, B.J., Wallinga, J., HoeW.Z., 2018. Controls on Late-Holocene drift-sand dynamics: the dominant roof human pressure in the Netherlands. Holocene 28 (9), 1361–1381. doi:http:dx.doi.org/10.1177/0959683618777052.
Quik, C., Wallinga, J., 2018a. Reconstructing lateral migration rates in meanderinsystems; a novel Bayesian approach combining OSL dating and historical mapEarth Surf. Dyn. 6, 705–721. doi:http://dx.doi.org/10.5194/esurf-6-705-2018.
Quik, C., Wallinga, J., 2018b. Data from: Reconstructing lateral migration rates inmeandering systems; a novel Bayesian approach combining OSL dating andhistorical maps. 4TU.Centre for Research Data doi:http://dx.doi.org/10.4121/uuid:1ca25393-aa99-48dc-b382-0506322bc449.
Quik, C., Candel, J.H.J., Makaske, B., van, Beek R., Paulissen, M., Maas, G.J., Verplak, MSpek, T., Wallinga, J., 2020. Data from: Anthropogenic drivers for exceptionallarge meander formation during the Late Holocene. 4TU.Centre for ResearchData doi:http://dx.doi.org/10.4121/uuid:c9c892de-4f3f-4c1b-b684-17c700b02f31.
Reimann, T., Versendaal, A., Wallinga, J., 2016. Luminescence Dating Report -Stroomdalgrasland (project number 2112). Wageningen. .
Rotthier, S., Sýkora, K., 2016. Zandafzetting, standplaats, beheer en botanischekwaliteit van stroomdalgrasland. KNNV Uitgeverij/Publishing, Driebergen.
Schönfeld, 1950. Veldnamen in Nederland. Noord-Hollandsche UitgeversMaatschappij, Amsterdam.
Schönfeld, 1955. Nederlandse Waternamen. Noord-Hollandsche UitgeversMaatschappij, Amsterdam.
Schumm, S.A., 1960. The shape of alluvial channels in relation to sediment typeUnited States Government Printing Office, Washington.
Schumm, S., 1968. River adjustment to altered hydrologic regimen. MurrumbidgeRiver and paleochannels. US Government Printing Office, Australia.
Spek, T., Van der Velde, H., Hannink, H., Terlouw, B., 2010. Mens en land in het havan Salland. Bewonings- en landschapsgeschiedenis van het Kerspel Raalte,Matrijs: Utrecht..
Staring, W., Stieltjes, T., 1848. De Overijsselsche Wateren. Zwolle. .Ter Laak, J., Groenewoudt, B.J., 2005. De taal van het landschap: pilotproject
toponiemen in de Berkelstreek: een verkennend onderzoek naar debruikbaarheid van geografische namen voor het reconstrueren van degeschiedenis van het Oost-Nederlandse landschap. Amersfoort. .
Trimble, S.W., Mendel, A.C., 1995. The cow as a geomorphic agent - A critical reviewGeomorphology 13, 233–253. doi:http://dx.doi.org/10.1016/0169-555X(95)00028-4.
Van Aalst J.W. 2016. www.opentopo.nl.Van Beek, R., 2009. Reliëf in tijd en ruimte - Interdisciplinair onderzoek naar
bewoning en landschap van Oost-Nederland tussen vroege prehistorie enmiddeleeuwenn. PhD-thesis. Wageningen University.
Van Beek, R., Groenewoudt, B., 2011. An Odyssey along the river Vecht in the DutchGerman border area: Aregional analysis of Roman-period sites in GermaniaMagna. Germania 89, 157–190.
Van Berkel, G., Samplonius, K., 1989. Het plaatsnamenboek: de herkomst enbetekenis van Nederlandse plaatsnamen. Van Holkema en Warendorf, Houte
Van Engelen van der Veen, G., 1924. In: De Jonge van Ellemeet, B. (Ed.), Marken iOverijsel. In de Marken van Drente, Groningen, Overijsel, Gelderland en UtrechGeschiedkundige Atlas van Nederland (5 Volumes, 1920-1925). Nijhoff:’ s-Gravenhage.
Van Haaster, H., 2006. Archeobotanie. In: Blom, E., Wyns, S., Van der Velde, H. (EdsDalfsen ‘De Gerner Marke’. Sporen van bewoning uit de IJzertijd, Romeinse tijen middeleeuwen op een dekzandrug langs de Overijsselse Vecht, , pp. 149–15ADC-rapport 766: Amersfoort.
Van Heerd, R.M., Kuijlaars, E.A.C., Teeuw, M.P., Van’t Zand, R.J., 2000.Productspecificatie Actueel Hoogtebestand Nederland. RapportnummerMDTGM 2000.13. Rijkswaterstaat Meetkundige Dienst, Delft.
Vandenberghe, J.,1995. Timescales, climate and river development. Quat. Sci. Rev.1(6), 631–638.

C. Quik et al. / Anthropocene 32 (2020) 100263 15
Vandenberghe, J., Bohncke, S.J.P., 1985. The Weichselian Late Glacial in a smalllowland valley (Mark river, Belgium and the Netherlands). Bulletin del’Association française d’Etudes quaternaires 2–3, 167–175.
Vandenberghe, J., Van Huissteden, J., 1988. Fluvio-aeolian interaction in a region ofcontinuous permafrost. Proceedings of the V International Conference onPermafrost, Trondheim, Norway, pp. 876–881.
Vandenberghe, J., Kasse, C., Popov, D., Markovic, S., Vandenberghe, D., Bohncke, S.,Gabris, G., 2018. Specifying the external impact on fluvial lowland evolution: thelast glacial Tisza (Tisa) catchment in Hungary and Serbia. Quaternary 1, 14.
Wieringa, H., Schelhaas, H., 1983. Waterstaat in Overijssel. Provincie Overijssel:Zwolle. .
Wohl, E., Angermeier, P.L., Bledsoe, B., Kondolf, G.M., MacDonnell, L., Merritt,D.M., Palmer, M.A., LeRoy Poff, N., Tarboton, D., 2005. River restoration.Water Resour. Res. 41 (10), 1–12. doi:http://dx.doi.org/10.1029/2005WR003985.
Wolfert, H.P., Maas, G.J., 2007. Downstream changes of meandering styles in thelower reaches of the River Vecht, the Netherlands. Geologie en Mijnbouw/Netherlands J. Geosci. 86 (3), 257–271.
Wolfert, H.P., Maas, G.J., Dirkx, G.H.P., 1996. Het meandergedrag van de OverijsselseVecht: Historische morfodynamiek en kansrijkdom voor natuurontwikkeling.DLO-Staring Centrum, Wageningen. .