antibacterial resistance in wales 2006-2015 resistance... · antibacterial resistance in wales...
TRANSCRIPT

Antibacterial
Resistance
in Wales
2006-2015 June 2016
Microbiology Division, Public Health Wales

1
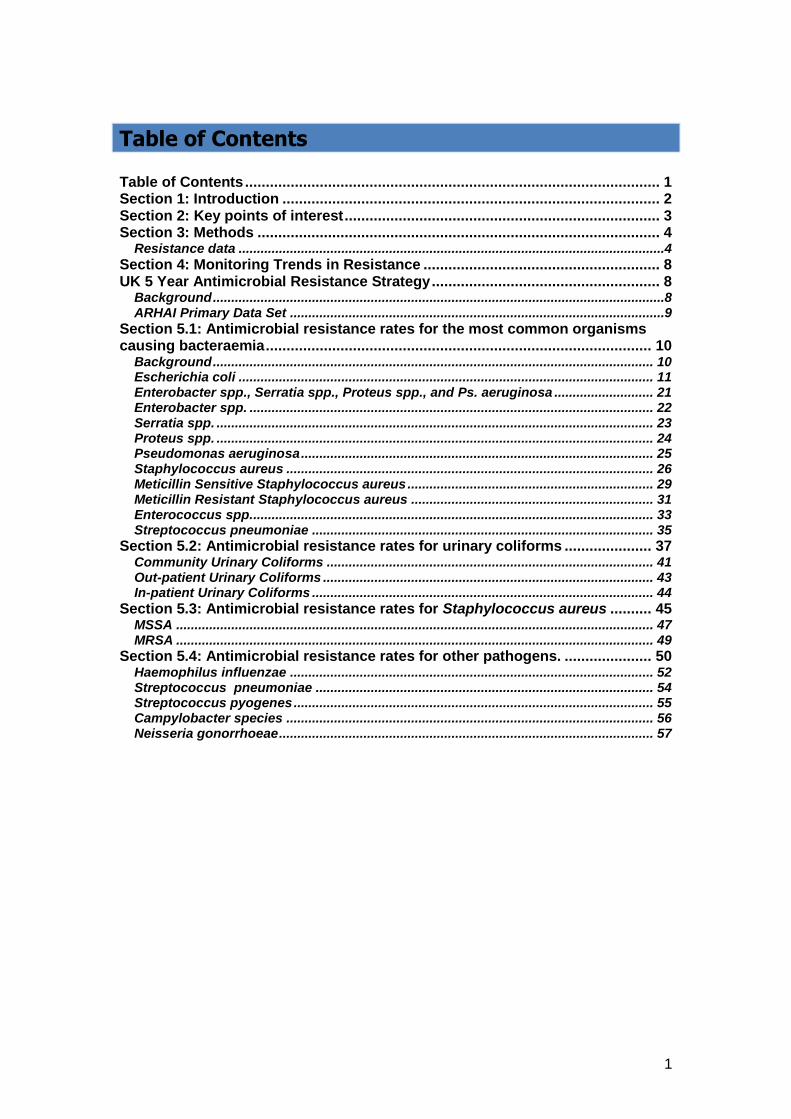
Table of Contents Table of Contents .................................................................................................... 1 Section 1: Introduction ........................................................................................... 2 Section 2: Key points of interest ............................................................................ 3 Section 3: Methods ................................................................................................. 4
Resistance data ....................................................................................................................4 Section 4: Monitoring Trends in Resistance ......................................................... 8 UK 5 Year Antimicrobial Resistance Strategy ....................................................... 8
Background ...........................................................................................................................8 ARHAI Primary Data Set ......................................................................................................9
Section 5.1: Antimicrobial resistance rates for the most common organisms causing bacteraemia ............................................................................................. 10
Background ........................................................................................................................ 10 Escherichia coli ................................................................................................................. 11 Enterobacter spp., Serratia spp., Proteus spp., and Ps. aeruginosa ........................... 21 Enterobacter spp. .............................................................................................................. 22 Serratia spp. ....................................................................................................................... 23 Proteus spp. ....................................................................................................................... 24 Pseudomonas aeruginosa ................................................................................................ 25 Staphylococcus aureus .................................................................................................... 26 Meticillin Sensitive Staphylococcus aureus ................................................................... 29 Meticillin Resistant Staphylococcus aureus .................................................................. 31 Enterococcus spp.............................................................................................................. 33 Streptococcus pneumoniae ............................................................................................. 35
Section 5.2: Antimicrobial resistance rates for urinary coliforms ..................... 37 Community Urinary Coliforms ......................................................................................... 41 Out-patient Urinary Coliforms .......................................................................................... 43 In-patient Urinary Coliforms ............................................................................................. 44
Section 5.3: Antimicrobial resistance rates for Staphylococcus aureus .......... 45 MSSA .................................................................................................................................. 47 MRSA .................................................................................................................................. 49
Section 5.4: Antimicrobial resistance rates for other pathogens. ..................... 50 Haemophilus influenzae ................................................................................................... 52 Streptococcus pneumoniae ............................................................................................ 54 Streptococcus pyogenes .................................................................................................. 55 Campylobacter species .................................................................................................... 56 Neisseria gonorrhoeae ...................................................................................................... 57

2
Section 1: Introduction Antimicrobial resistance is an increasing problem that can result in difficulty in treating infections, leading to failed therapy and potential complications. Treatment for most infections is started empirically before antimicrobial susceptibilities are known. A particular problem with the spread of antimicrobial resistance is that it becomes more difficult to select empirical therapy that will have reliable activity. The aim of this report from the Welsh Antimicrobial Resistance Programme Surveillance Unit is to provide data that can be used to design empirical therapy guidance, and to track antimicrobial resistance trends in Wales from 2005 to 2014. The report has had to be selective in what is presented, and concentrates on the major acute hospitals and district general hospitals in Wales, and the local community health boards.

3
Section 2: Key points of interest
UK 5 Year Antimicrobial Resistance Strategy The Wales resistance trends for drug-bug combinations reported by ARHAI as part of the UK 5 year Antimicrobial Resistance Strategy are comparable to the aggregated rates and trends for the UK (page 10). However, in some cases there is considerable variability in resistance rates between different areas and hospitals.
E. coli (the commonest cause of blood stream infections in Wales) No significant change in resistance to co-amoxiclav in 2015 , but resistance
was variable between hospitals and ranged from 18.2% in Velindre to 46.2% in University Hospital Llandough (UHL)
Resistance to gentamicin appears to be increasing, with particularly high rates emerging in some hospitals (23% in UHL).
Carbapenem resistance remains below 1% in Wales
Enterobacter spp. and Serratia spp. (Blood stream infections) Third generation cephalosporins and fluoroquinolone resistance decreasing
across time (2006-2015).
Staphylococcus aureus Flucloxacillin resistance rates for Staphylococcus aureus bacteraemias were
variable between hospitals and ranged from 0% in Bronglais general hospital to 30.0% in University Hospital Llandough (page 28).
Urinary tract infections
“Coliforms” (the commonest cause of urinary tract infections in Wales) Resistance to most antimicrobials has increased over the last 10 years in
coliforms from community urinary samples (page 39): o Trimethoprim (first-line empirical therapy for uncomplicated UTI in the
community) resistance has increased to 38.2%.This high rate of resistance reflects an element of selective testing. The true rate of resistance in patients presenting with uncomplicated UTI in the community is likely to be considerably lower, and trimethoprim remains the suggested first-line empirical therapy for these patients.
o However, in the elderly, or patients who have received antibiotics within the last 3 months, the likelihood of infection with a resistant organism is higher, and an alternative antibiotic should be considered.
o Co-amoxiclav resistance increased from 10.5% in 2013, to 12.9% in 2014, and 15.1% in 2015.
o Ciprofloxacin resistance remained stable at approximately 10%. o Nitrofurantoin resistance remained stable at approximately 11%.
4
Section 3: Methods
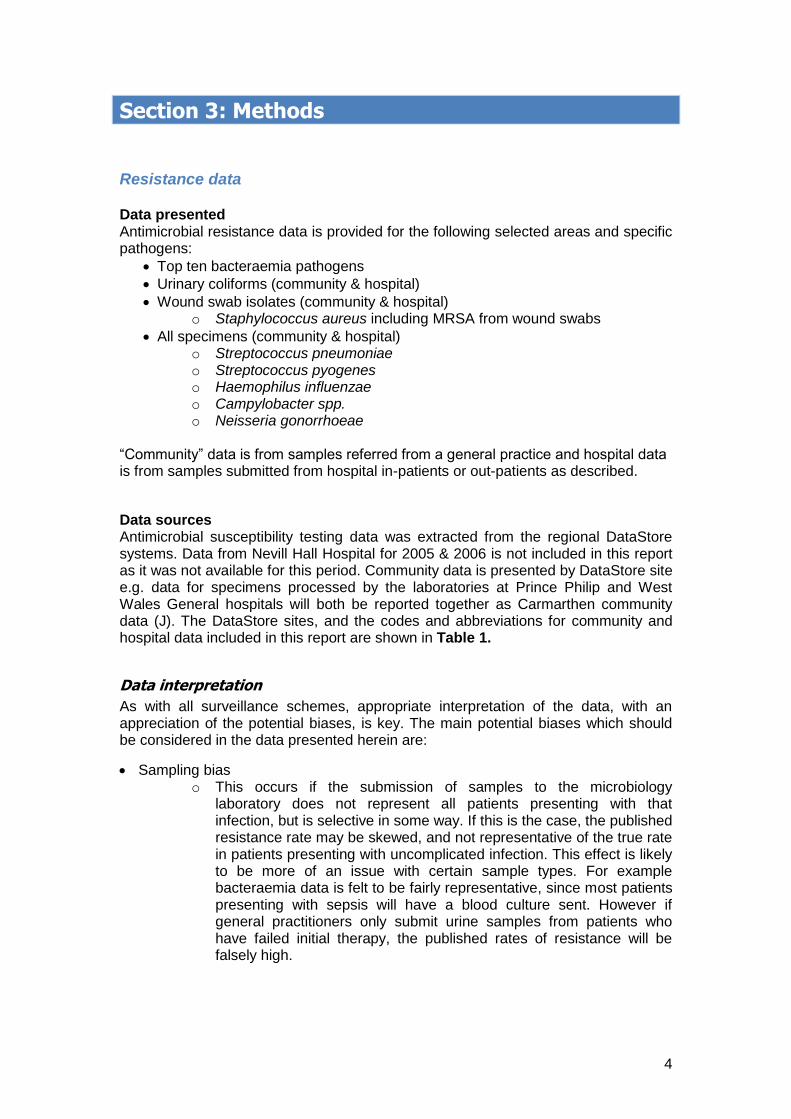
Resistance data Data presented Antimicrobial resistance data is provided for the following selected areas and specific pathogens:
Top ten bacteraemia pathogens
Urinary coliforms (community & hospital)
Wound swab isolates (community & hospital) o Staphylococcus aureus including MRSA from wound swabs
All specimens (community & hospital) o Streptococcus pneumoniae o Streptococcus pyogenes o Haemophilus influenzae o Campylobacter spp. o Neisseria gonorrhoeae
“Community” data is from samples referred from a general practice and hospital data is from samples submitted from hospital in-patients or out-patients as described.
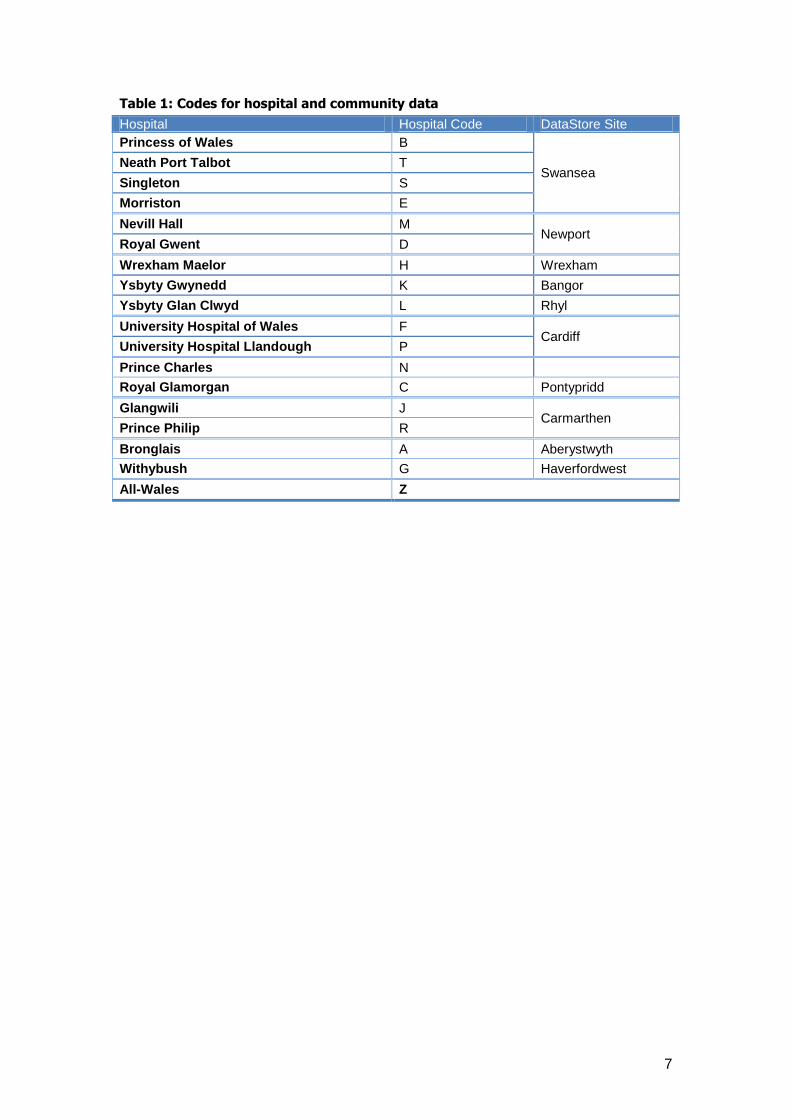
Data sources Antimicrobial susceptibility testing data was extracted from the regional DataStore systems. Data from Nevill Hall Hospital for 2005 & 2006 is not included in this report as it was not available for this period. Community data is presented by DataStore site e.g. data for specimens processed by the laboratories at Prince Philip and West Wales General hospitals will both be reported together as Carmarthen community data (J). The DataStore sites, and the codes and abbreviations for community and hospital data included in this report are shown in Table 1.
Data interpretation
As with all surveillance schemes, appropriate interpretation of the data, with an appreciation of the potential biases, is key. The main potential biases which should be considered in the data presented herein are:
Sampling bias o This occurs if the submission of samples to the microbiology
laboratory does not represent all patients presenting with that infection, but is selective in some way. If this is the case, the published resistance rate may be skewed, and not representative of the true rate in patients presenting with uncomplicated infection. This effect is likely to be more of an issue with certain sample types. For example bacteraemia data is felt to be fairly representative, since most patients presenting with sepsis will have a blood culture sent. However if general practitioners only submit urine samples from patients who have failed initial therapy, the published rates of resistance will be falsely high.
5
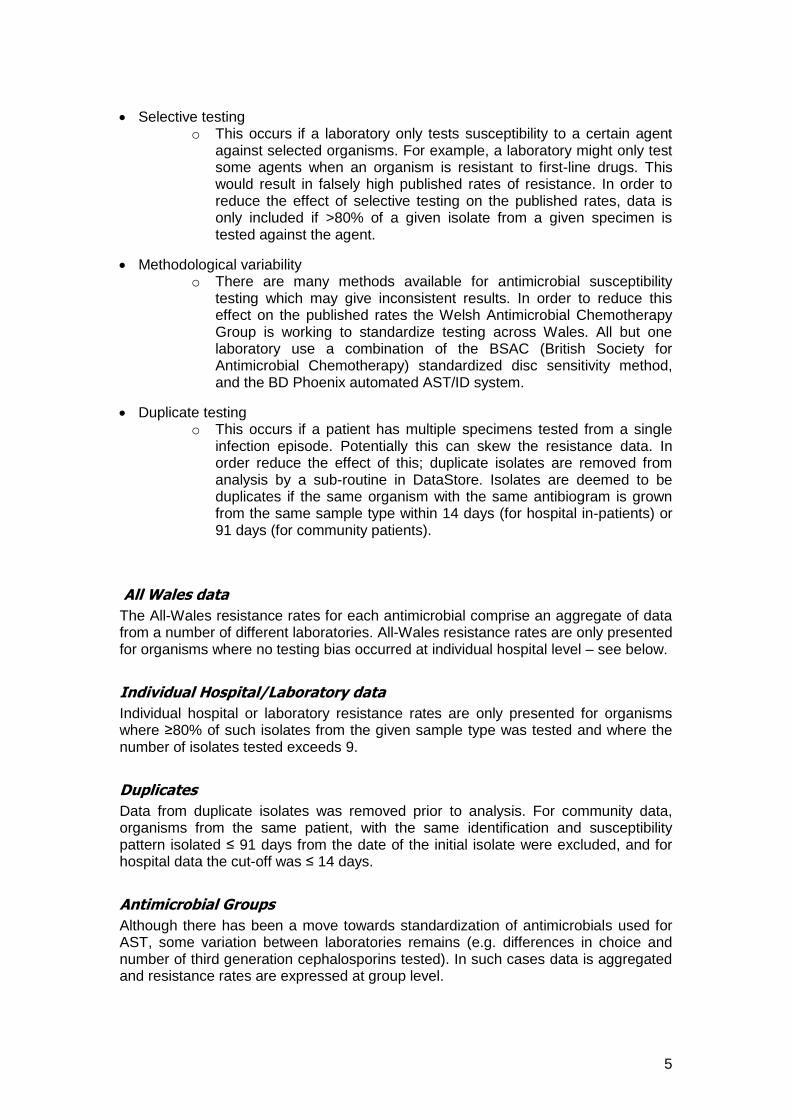
Selective testing o This occurs if a laboratory only tests susceptibility to a certain agent
against selected organisms. For example, a laboratory might only test some agents when an organism is resistant to first-line drugs. This would result in falsely high published rates of resistance. In order to reduce the effect of selective testing on the published rates, data is only included if >80% of a given isolate from a given specimen is tested against the agent.
Methodological variability o There are many methods available for antimicrobial susceptibility
testing which may give inconsistent results. In order to reduce this effect on the published rates the Welsh Antimicrobial Chemotherapy Group is working to standardize testing across Wales. All but one laboratory use a combination of the BSAC (British Society for Antimicrobial Chemotherapy) standardized disc sensitivity method, and the BD Phoenix automated AST/ID system.
Duplicate testing o This occurs if a patient has multiple specimens tested from a single
infection episode. Potentially this can skew the resistance data. In order reduce the effect of this; duplicate isolates are removed from analysis by a sub-routine in DataStore. Isolates are deemed to be duplicates if the same organism with the same antibiogram is grown from the same sample type within 14 days (for hospital in-patients) or 91 days (for community patients).
All Wales data
The All-Wales resistance rates for each antimicrobial comprise an aggregate of data from a number of different laboratories. All-Wales resistance rates are only presented for organisms where no testing bias occurred at individual hospital level – see below.
Individual Hospital/Laboratory data
Individual hospital or laboratory resistance rates are only presented for organisms where ≥80% of such isolates from the given sample type was tested and where the number of isolates tested exceeds 9.
Duplicates
Data from duplicate isolates was removed prior to analysis. For community data, organisms from the same patient, with the same identification and susceptibility pattern isolated ≤ 91 days from the date of the initial isolate were excluded, and for hospital data the cut-off was ≤ 14 days.
Antimicrobial Groups
Although there has been a move towards standardization of antimicrobials used for AST, some variation between laboratories remains (e.g. differences in choice and number of third generation cephalosporins tested). In such cases data is aggregated and resistance rates are expressed at group level.

6
Generally, most laboratories only test a single agent from antimicrobial groups such as fluoroquinolones and carbapenems where appropriate, but the choice of agent often varies between laboratories. The antimicrobial groups included in this report comprise of the following aggregated susceptibility data:
Fluoroquinolones – ciprofloxacin &/or levofloxacin, norfloxacin
Third generation cephalosporins (3GC) – ceftazidime &/or cefotaxime, ceftriaxone, cefpodoxime.
Carbapenems – imipenem &/or meropenem, ertapenem.
Susceptibility results
Throughout data is presented in tables and on graphs as resistance rates with 95% confidence intervals (95% CI). 1 For the purpose of this report susceptibility results recorded as ‘intermediate’ are included in the category ‘resistant’, and in the case of penicillin susceptibility results for S. pneumoniae results recorded as intermediate, low- level or high-level resistance are included in the category ‘resistant’.
1. Newcombe, Robert G. "Two-Sided Confidence Intervals for the Single Proportion: Comparison of Seven Methods," Statistics in Medicine, 17, 857-872 (1998).
Other surveillance schemes
This report focuses on comparisons of data collected for Wales in the calendar years 2005 and 2013. To provide some external context to the data presented, it has been also been compared to surveillance data from other sources – see websites:
Public Health England (PHE): https://www.gov.uk/health-protection/infectious-diseases
British Society for Antimicrobial Chemotherapy (BSAC): http://www.bsacsurv.org/reports/bacteraemia
All of the above surveillance schemes are also susceptible to potential biases, particularly selective coverage and selective reporting. Thus comparisons with the presented data should be treated with caution.
NB. Throughout this document all resistance rates quoted from PHE publications relate to England, Wales and Northern Ireland (unless otherwise stated).
7
Table 1: Codes for hospital and community data
Hospital Hospital Code DataStore Site
Princess of Wales B
Swansea Neath Port Talbot T
Singleton S
Morriston E
Nevill Hall M Newport
Royal Gwent D
Wrexham Maelor H Wrexham
Ysbyty Gwynedd K Bangor
Ysbyty Glan Clwyd L Rhyl
University Hospital of Wales F Cardiff
University Hospital Llandough P
Prince Charles N
Royal Glamorgan C Pontypridd
Glangwili J Carmarthen
Prince Philip R
Bronglais A Aberystwyth
Withybush G Haverfordwest
All-Wales Z

8
Section 4: Monitoring Trends in Resistance UK 5 Year Antimicrobial Resistance Strategy
Background In 2014, a sub-group of ARHAI was established to recommend surveillance outputs to support the UK Five Year Antimicrobial Resistance Strategy. Appendix C “Monitoring Trends in Resistance” of the Strategy document states: “Changes in the level of resistance to antibiotics like the carbapenems, which are often the last option for hard to treat infections, will be monitored”. The agreed “drug-bug” combinations for monitoring resistance are listed in Table 2; the combinations were ratified by the Department of Health (DoH) High-Level Steering Group. Public Health Wales provided the Wales data to ARHAI for this surveillance project.
Blood specimens (except N. gonorrhoeae data)
14 day episode de-duplication
Non-susceptible (NS) is resistant and intermediate isolate totals combined
Where two antimicrobials from the same class are listed an ‘or’ relationship is applied, the more resistant result takes priority
Table 2: ARHAI Drug-Bug Combinations
Specimen Organism Data Set Antimicrobial
Blood Culture
Escherichia coli Primary
cefotaxime or ceftazidime
imipenem or meropenem
ciprofloxacin
gentamicin
Secondary piperacillin/tazobactam
Klebsiella pneumoniae Primary
cefotaxime or ceftazidime
imipenem or meropenem
ciprofloxacin
gentamicin
Secondary piperacillin/tazobactam
Klebsiella oxytoca Primary
cefotaxime or ceftazidime
imipenem or meropenem
ciprofloxacin
gentamicin
piperacillin/tazobactam
Pseudomonas spp. Primary ceftazidime
imipenem or meropenem
Acinetobacter spp. Secondary colistin
Enterococcus spp. Secondary vancomycin
Staphylococcus aureus Secondary meticillin
Streptococcus pneumoniae Primary penicillin
All specimens Neisseria gonorrhoeae Primary
ceftriaxone
azithromycin
9
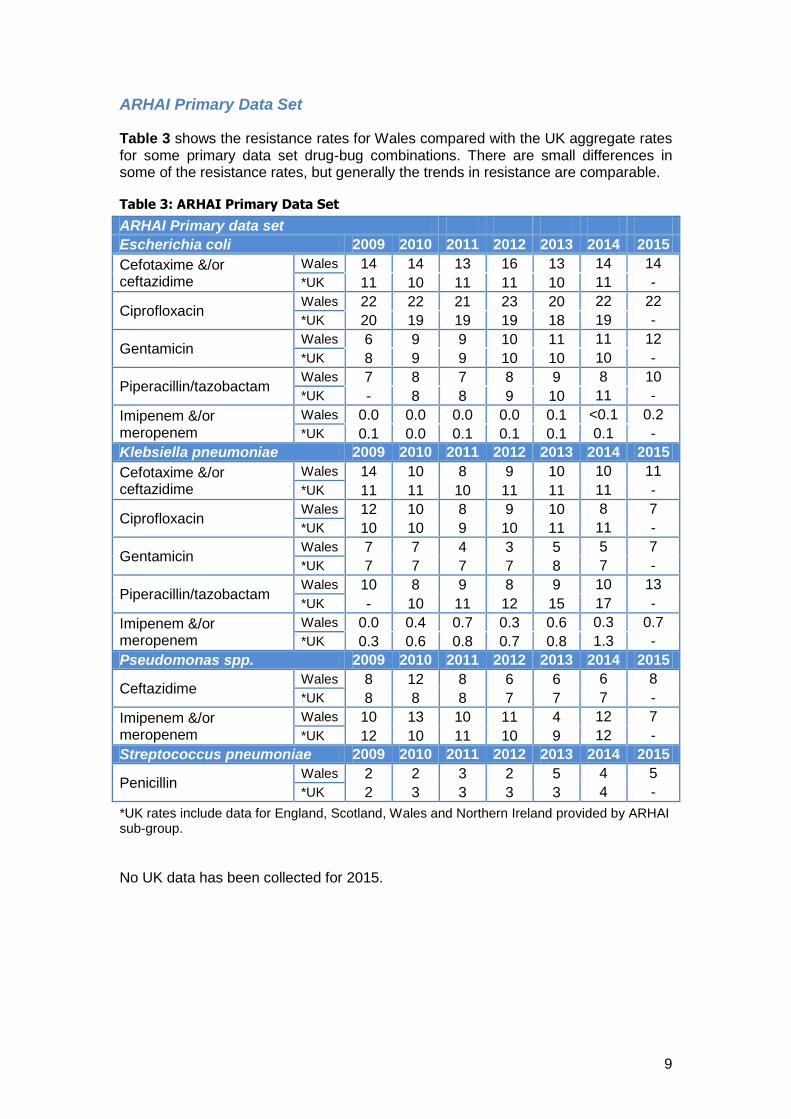
ARHAI Primary Data Set
Table 3 shows the resistance rates for Wales compared with the UK aggregate rates for some primary data set drug-bug combinations. There are small differences in some of the resistance rates, but generally the trends in resistance are comparable.
Table 3: ARHAI Primary Data Set
ARHAI Primary data set
Escherichia coli 2009 2010 2011 2012 2013 2014 2015
Cefotaxime &/or ceftazidime
Wales 14 14 13 16 13 14 14
*UK 11 10 11 11 10 11 -
Ciprofloxacin Wales 22 22 21 23 20 22 22
*UK 20 19 19 19 18 19 -
Gentamicin Wales 6 9 9 10 11 11 12
*UK 8 9 9 10 10 10 -
Piperacillin/tazobactam Wales 7 8 7 8 9 8 10
*UK - 8 8 9 10 11 -
Imipenem &/or meropenem
Wales 0.0 0.0 0.0 0.0 0.1 <0.1 0.2
*UK 0.1 0.0 0.1 0.1 0.1 0.1 -
Klebsiella pneumoniae 2009 2010 2011 2012 2013 2014 2015
Cefotaxime &/or ceftazidime
Wales 14 10 8 9 10 10 11
*UK 11 11 10 11 11 11 -
Ciprofloxacin Wales 12 10 8 9 10 8 7
*UK 10 10 9 10 11 11 -
Gentamicin Wales 7 7 4 3 5 5 7
*UK 7 7 7 7 8 7 -
Piperacillin/tazobactam Wales 10 8 9 8 9 10 13
*UK - 10 11 12 15 17 -
Imipenem &/or meropenem
Wales 0.0 0.4 0.7 0.3 0.6 0.3 0.7
*UK 0.3 0.6 0.8 0.7 0.8 1.3 -
Pseudomonas spp. 2009 2010 2011 2012 2013 2014 2015
Ceftazidime Wales 8 12 8 6 6 6 8
*UK 8 8 8 7 7 7 -
Imipenem &/or meropenem
Wales 10 13 10 11 4 12 7
*UK 12 10 11 10 9 12 -
Streptococcus pneumoniae 2009 2010 2011 2012 2013 2014 2015
Penicillin Wales 2 2 3 2 5 4 5
*UK 2 3 3 3 3 4 -
*UK rates include data for England, Scotland, Wales and Northern Ireland provided by ARHAI sub-group.
No UK data has been collected for 2015.
10
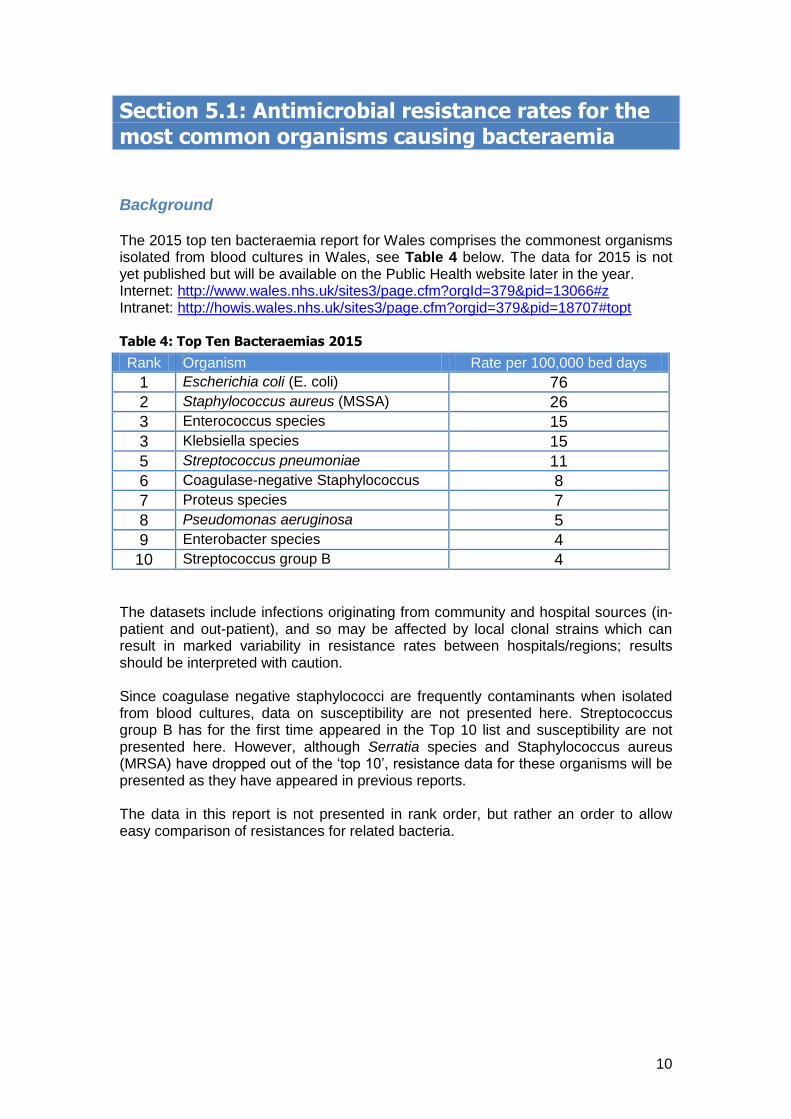
Section 5.1: Antimicrobial resistance rates for the most common organisms causing bacteraemia
Background The 2015 top ten bacteraemia report for Wales comprises the commonest organisms isolated from blood cultures in Wales, see Table 4 below. The data for 2015 is not yet published but will be available on the Public Health website later in the year. Internet: http://www.wales.nhs.uk/sites3/page.cfm?orgId=379&pid=13066#z Intranet: http://howis.wales.nhs.uk/sites3/page.cfm?orgid=379&pid=18707#topt Table 4: Top Ten Bacteraemias 2015
Rank Organism Rate per 100,000 bed days
1 Escherichia coli (E. coli) 76
2 Staphylococcus aureus (MSSA) 26
3 Enterococcus species 15
3 Klebsiella species 15
5 Streptococcus pneumoniae 11
6 Coagulase-negative Staphylococcus 8
7 Proteus species 7
8 Pseudomonas aeruginosa 5
9 Enterobacter species 4
10 Streptococcus group B 4 The datasets include infections originating from community and hospital sources (in-patient and out-patient), and so may be affected by local clonal strains which can result in marked variability in resistance rates between hospitals/regions; results should be interpreted with caution. Since coagulase negative staphylococci are frequently contaminants when isolated from blood cultures, data on susceptibility are not presented here. Streptococcus group B has for the first time appeared in the Top 10 list and susceptibility are not presented here. However, although Serratia species and Staphylococcus aureus (MRSA) have dropped out of the ‘top 10’, resistance data for these organisms will be presented as they have appeared in previous reports. The data in this report is not presented in rank order, but rather an order to allow easy comparison of resistances for related bacteria.
11
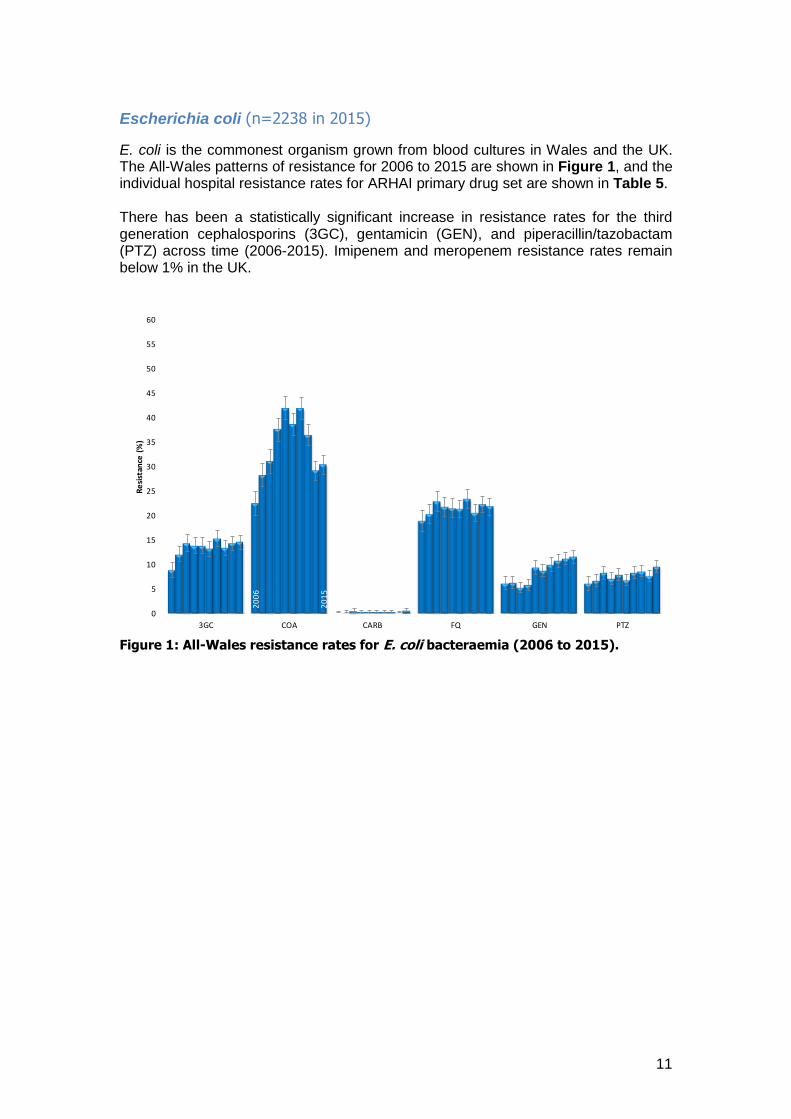
Escherichia coli (n=2238 in 2015)
E. coli is the commonest organism grown from blood cultures in Wales and the UK. The All-Wales patterns of resistance for 2006 to 2015 are shown in Figure 1, and the individual hospital resistance rates for ARHAI primary drug set are shown in Table 5. There has been a statistically significant increase in resistance rates for the third generation cephalosporins (3GC), gentamicin (GEN), and piperacillin/tazobactam (PTZ) across time (2006-2015). Imipenem and meropenem resistance rates remain below 1% in the UK.
Figure 1: All-Wales resistance rates for E. coli bacteraemia (2006 to 2015).
20
06
20
15
0
5
10
15
20
25
30
35
40
45
50
55
60
3GC COA CARB FQ GEN PTZ
Re
sist
ance
(%
)

12
Table 5: Escherichia coli
Note: The range of resistance is outlined with boxes e.g. the range for co-amoxiclav (COA) was 18.2% to 46.2%; individual hospital resistance rates statistically higher than the All-Wales rate are highlighted in blue. Resistance rates are not recorded when <80% of the isolates were tested. The resistance rates for E. coli bacteraemia in Neath Port Talbot were notably high to a number of agents, but the number of isolates was small (n=10). Imipenem resistant E. coli were reported from Ysbyty Gwynedd (K), Ysbyty Glan Clwyd (L) and Prince Charles hospital (N).
13
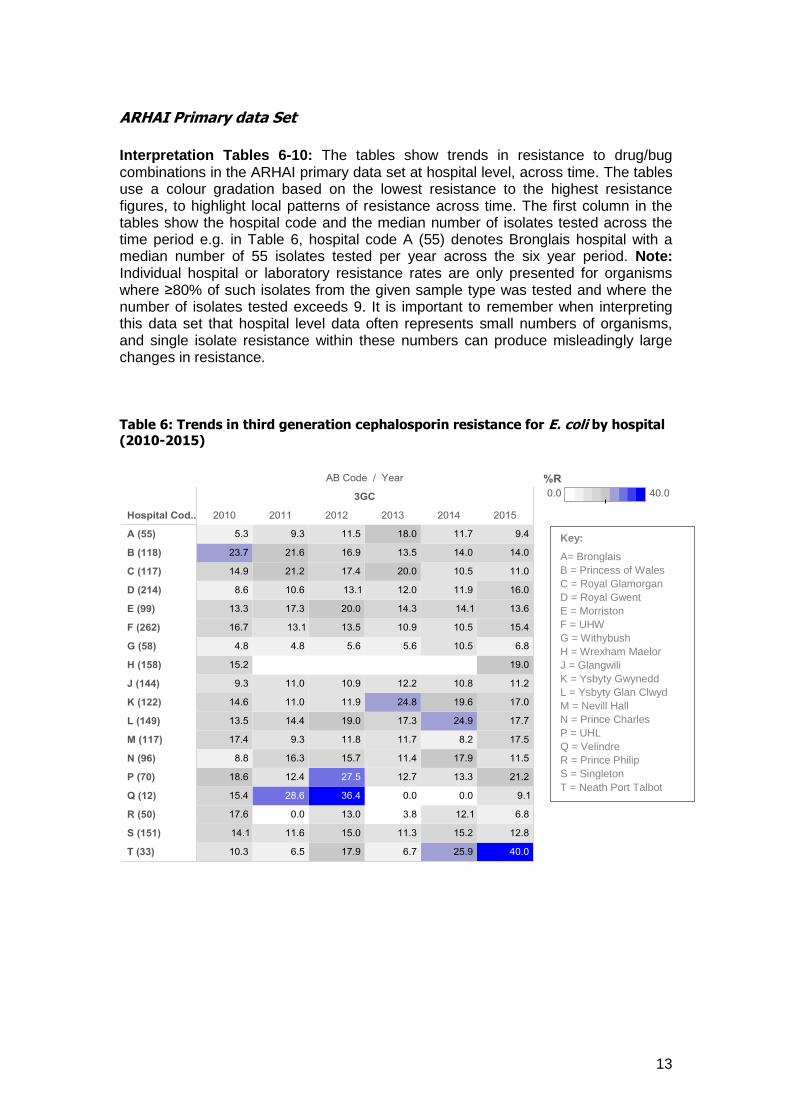
ARHAI Primary data Set
Interpretation Tables 6-10: The tables show trends in resistance to drug/bug combinations in the ARHAI primary data set at hospital level, across time. The tables use a colour gradation based on the lowest resistance to the highest resistance figures, to highlight local patterns of resistance across time. The first column in the tables show the hospital code and the median number of isolates tested across the time period e.g. in Table 6, hospital code A (55) denotes Bronglais hospital with a median number of 55 isolates tested per year across the six year period. Note: Individual hospital or laboratory resistance rates are only presented for organisms where ≥80% of such isolates from the given sample type was tested and where the number of isolates tested exceeds 9. It is important to remember when interpreting this data set that hospital level data often represents small numbers of organisms, and single isolate resistance within these numbers can produce misleadingly large changes in resistance. Table 6: Trends in third generation cephalosporin resistance for E. coli by hospital (2010-2015)
Key:
A= Bronglais
B = Princess of Wales
C = Royal Glamorgan
D = Royal Gwent
E = Morriston
F = UHW
G = Withybush
H = Wrexham Maelor
J = Glangwili
K = Ysbyty Gwynedd
L = Ysbyty Glan Clwyd
M = Nevill Hall
N = Prince Charles
P = UHL
Q = Velindre
R = Prince Philip
S = Singleton
T = Neath Port Talbot

14
Table 7: Trends in fluoroquinolone resistance for E. coli by hospital (2010-2015)
Table 8: Trends in gentamicin resistance for E. coli by hospital (2010-2015)
Key:
A= Bronglais
B = Princess of Wales
C = Royal Glamorgan
D = Royal Gwent
E = Morriston
F = UHW
G = Withybush
H = Wrexham Maelor
J = Glangwili
K = Ysbyty Gwynedd
L = Ysbyty Glan Clwyd
M = Nevill Hall
N = Prince Charles
P = UHL
Q = Velindre
R = Prince Philip
S = Singleton
T = Neath Port Talbot

15
Table 9: Trends in piperacillin/tazobactam resistance for E. coli (2010-2015)
Table 10: Trends in imipenem/meropenem resistance for E. coli (2010-2015)
Key:
A= Bronglais
B = Princess of Wales
C = Royal Glamorgan
D = Royal Gwent
E = Morriston
F = UHW
G = Withybush
J = Glangwili
K = Ysbyty Gwynedd
L = Ysbyty Glan Clwyd
M = Nevill Hall
N = Prince Charles
P = UHL
Q = Velindre
R = Prince Philip
S = Singleton
T = Neath Port Talbot
16
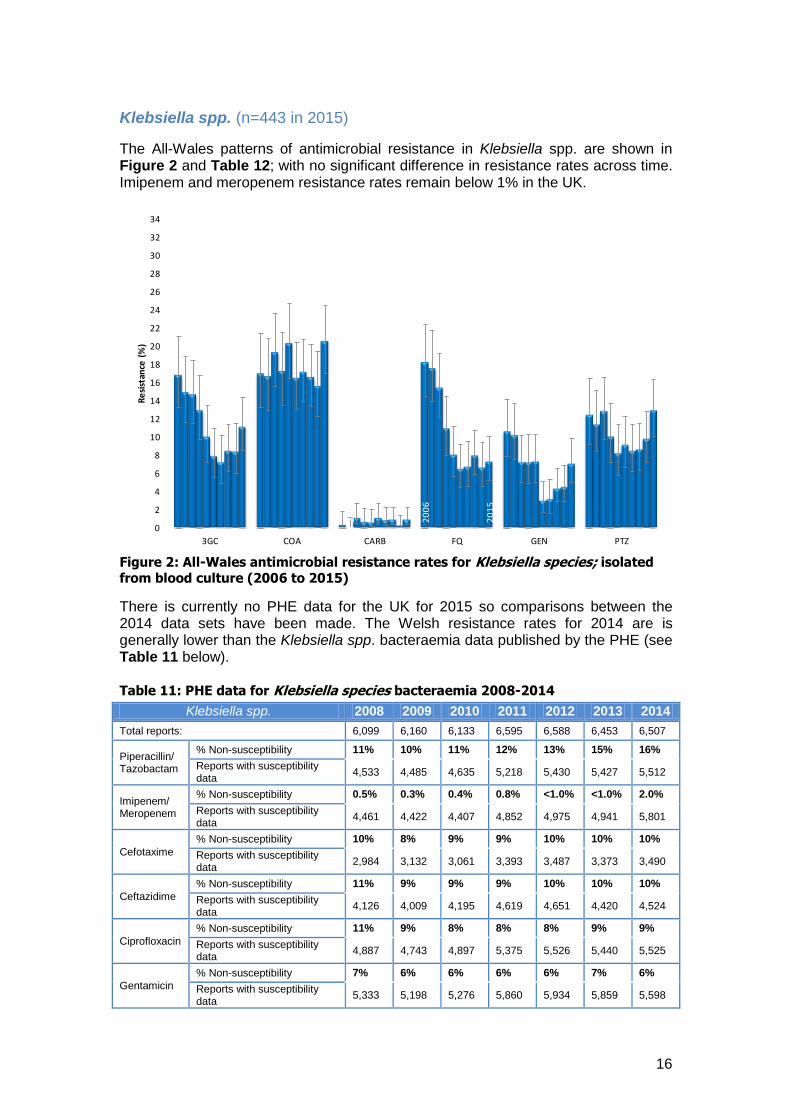
Klebsiella spp. (n=443 in 2015)
The All-Wales patterns of antimicrobial resistance in Klebsiella spp. are shown in Figure 2 and Table 12; with no significant difference in resistance rates across time. Imipenem and meropenem resistance rates remain below 1% in the UK.
Figure 2: All-Wales antimicrobial resistance rates for Klebsiella species; isolated from blood culture (2006 to 2015)
There is currently no PHE data for the UK for 2015 so comparisons between the 2014 data sets have been made. The Welsh resistance rates for 2014 are is generally lower than the Klebsiella spp. bacteraemia data published by the PHE (see Table 11 below). Table 11: PHE data for Klebsiella species bacteraemia 2008-2014
Klebsiella spp. 2008 2009 2010 2011 2012 2013 2014
Total reports: 6,099 6,160 6,133 6,595 6,588 6,453 6,507
Piperacillin/ Tazobactam
% Non-susceptibility 11% 10% 11% 12% 13% 15% 16%
Reports with susceptibility data
4,533 4,485 4,635 5,218 5,430 5,427 5,512
Imipenem/ Meropenem
% Non-susceptibility 0.5% 0.3% 0.4% 0.8% <1.0% <1.0% 2.0%
Reports with susceptibility data
4,461 4,422 4,407 4,852 4,975 4,941 5,801
Cefotaxime
% Non-susceptibility 10% 8% 9% 9% 10% 10% 10%
Reports with susceptibility data
2,984 3,132 3,061 3,393 3,487 3,373 3,490
Ceftazidime
% Non-susceptibility 11% 9% 9% 9% 10% 10% 10%
Reports with susceptibility data
4,126 4,009 4,195 4,619 4,651 4,420 4,524
Ciprofloxacin
% Non-susceptibility 11% 9% 8% 8% 8% 9% 9%
Reports with susceptibility data
4,887 4,743 4,897 5,375 5,526 5,440 5,525
Gentamicin
% Non-susceptibility 7% 6% 6% 6% 6% 7% 6%
Reports with susceptibility data
5,333 5,198 5,276 5,860 5,934 5,859 5,598
20
06
20
06
20
15
0
2
4
6
8
10
12
14
16
18
20
22
24
26
28
30
32
34
3GC COA CARB FQ GEN PTZ
Re
sist
ance
(%
)

17
Table 12: Klebsiella spp.
Note: Resistance rates are not recorded if the organisms are intrinsically resistant to an antibacterial agent e.g. for amoxicillin. The range of resistance is outlined with boxes e.g. the range for co-amoxiclav (COA) was 0.0% to 31.7%; individual hospital resistance rates statistically higher than the All-Wales rate are highlighted in blue. Locally, co-amoxiclav and piperacillin/tazobactam resistance rates for Klebsiella spp. bacteraemia from Morriston hospital (E) were notably higher than the rest of Wales. Imipenem and/or meropenem resistant Klebsiella spp. were reported in Royal Glamorgan (C), Morriston (E) and Ysbyty Glan Clwyd (L).
18
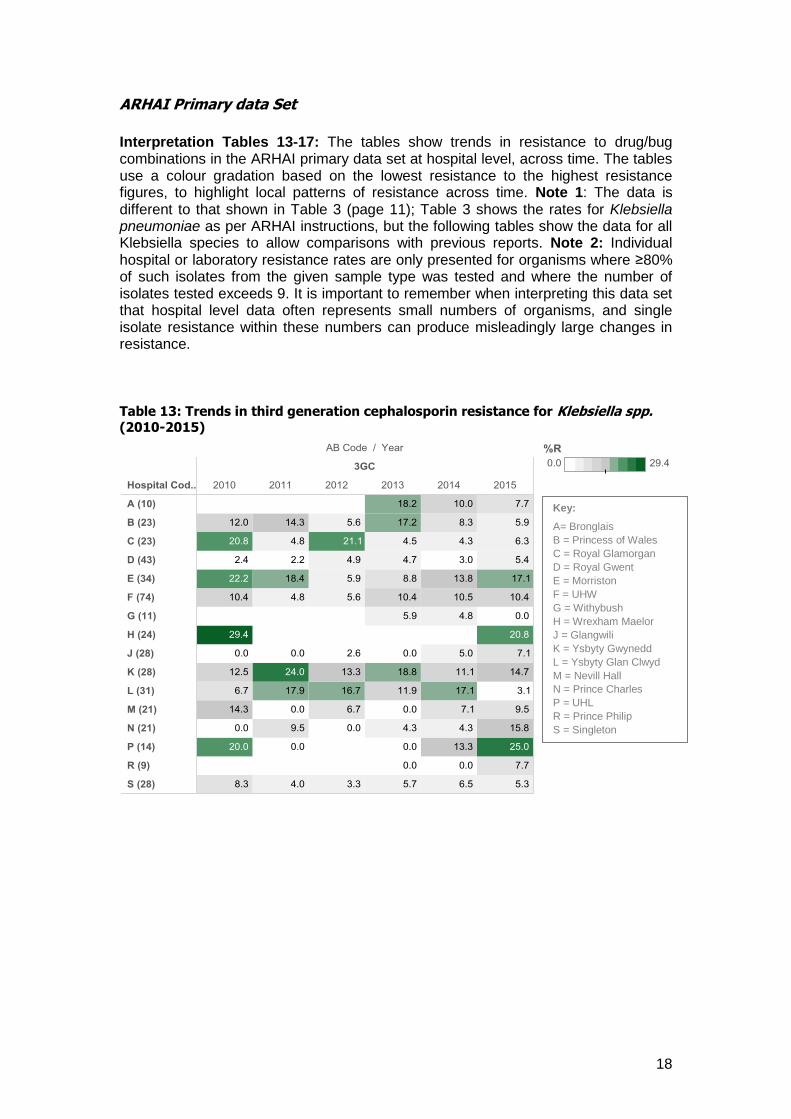
ARHAI Primary data Set
Interpretation Tables 13-17: The tables show trends in resistance to drug/bug combinations in the ARHAI primary data set at hospital level, across time. The tables use a colour gradation based on the lowest resistance to the highest resistance figures, to highlight local patterns of resistance across time. Note 1: The data is different to that shown in Table 3 (page 11); Table 3 shows the rates for Klebsiella pneumoniae as per ARHAI instructions, but the following tables show the data for all Klebsiella species to allow comparisons with previous reports. Note 2: Individual hospital or laboratory resistance rates are only presented for organisms where ≥80% of such isolates from the given sample type was tested and where the number of isolates tested exceeds 9. It is important to remember when interpreting this data set that hospital level data often represents small numbers of organisms, and single isolate resistance within these numbers can produce misleadingly large changes in resistance. Table 13: Trends in third generation cephalosporin resistance for Klebsiella spp. (2010-2015)
Key:
A= Bronglais
B = Princess of Wales
C = Royal Glamorgan
D = Royal Gwent
E = Morriston
F = UHW
G = Withybush
H = Wrexham Maelor
J = Glangwili
K = Ysbyty Gwynedd
L = Ysbyty Glan Clwyd
M = Nevill Hall
N = Prince Charles
P = UHL
R = Prince Philip
S = Singleton

19
Table 14: Trends in fluoroquinolone resistance for Klebsiella spp. (2010-2015)
Table 15: Trends in gentamicin resistance for Klebsiella spp. (2010-2015)
Key:
A= Bronglais
B = Princess of Wales
C = Royal Glamorgan
D = Royal Gwent
E = Morriston
F = UHW
G = Withybush
H = Wrexham Maelor
J = Glangwili
K = Ysbyty Gwynedd
L = Ysbyty Glan Clwyd
M = Nevill Hall
N = Prince Charles
P = UHL
R = Prince Philip
S = Singleton

20
Table 16: Trends in piperacillin/tazobactam resistance for Klebsiella spp.
(2010-2015)
Table 17: Trends in imipenem/meropenem resistance for Klebsiella spp.
(2010-2015)
Key:
A= Bronglais
B = Princess of Wales
C = Royal Glamorgan
D = Royal Gwent
E = Morriston
F = UHW
G = Withybush
H = Wrexham Maelor
J = Glangwili
K = Ysbyty Gwynedd
L = Ysbyty Glan Clwyd
M = Nevill Hall
N = Prince Charles
P = UHL
R = Prince Philip
S = Singleton
21
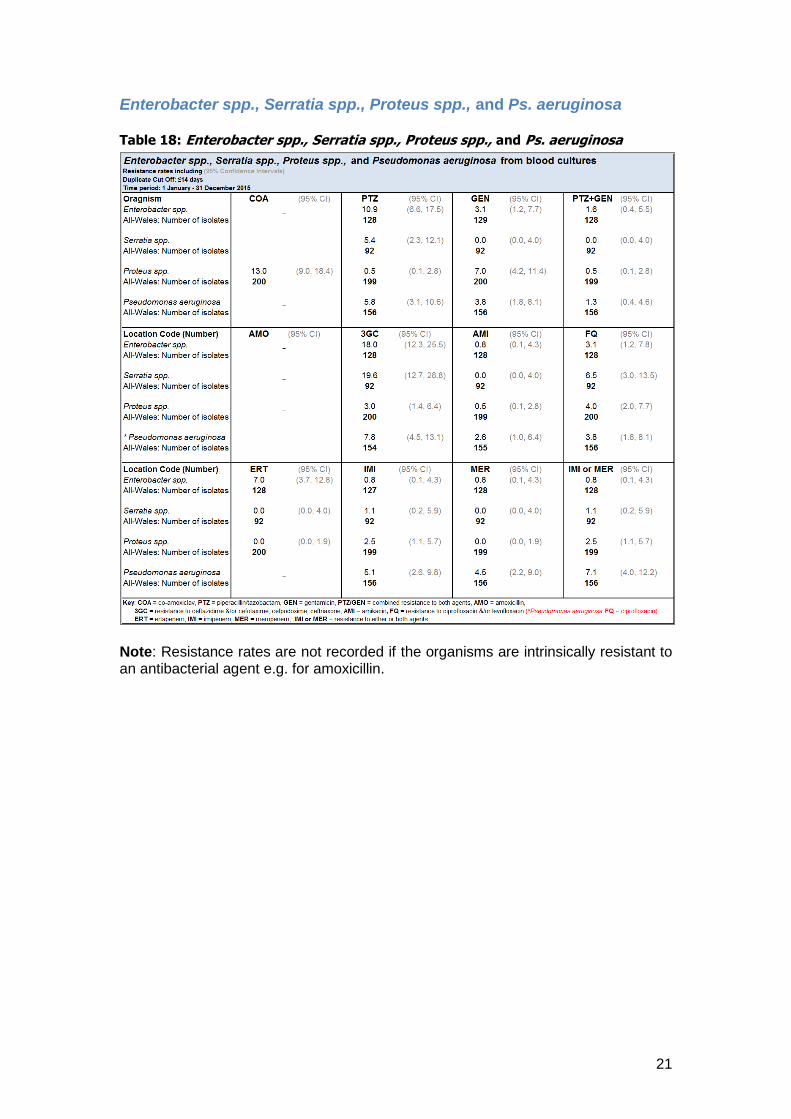
Enterobacter spp., Serratia spp., Proteus spp., and Ps. aeruginosa Table 18: Enterobacter spp., Serratia spp., Proteus spp., and Ps. aeruginosa
Note: Resistance rates are not recorded if the organisms are intrinsically resistant to an antibacterial agent e.g. for amoxicillin.
22
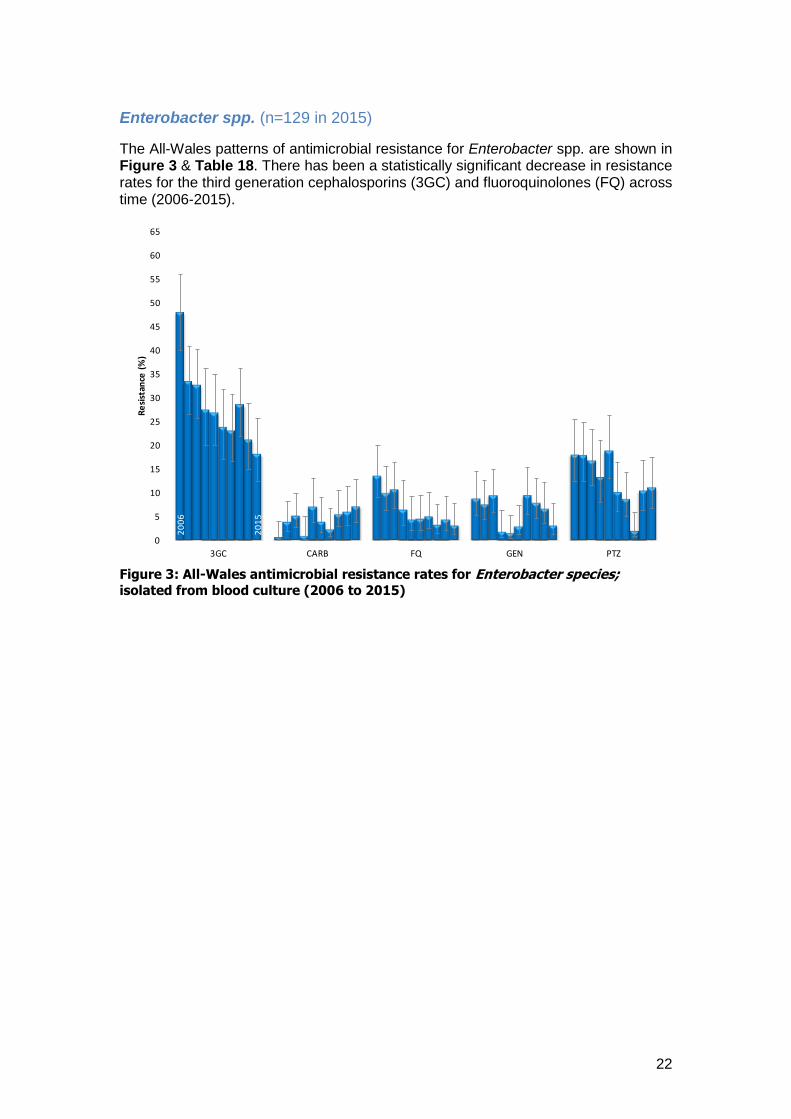
Enterobacter spp. (n=129 in 2015)
The All-Wales patterns of antimicrobial resistance for Enterobacter spp. are shown in Figure 3 & Table 18. There has been a statistically significant decrease in resistance rates for the third generation cephalosporins (3GC) and fluoroquinolones (FQ) across time (2006-2015).
Figure 3: All-Wales antimicrobial resistance rates for Enterobacter species; isolated from blood culture (2006 to 2015)
20
06
20
15
0
5
10
15
20
25
30
35
40
45
50
55
60
65
3GC CARB FQ GEN PTZ
Re
sist
ance
(%
)
23
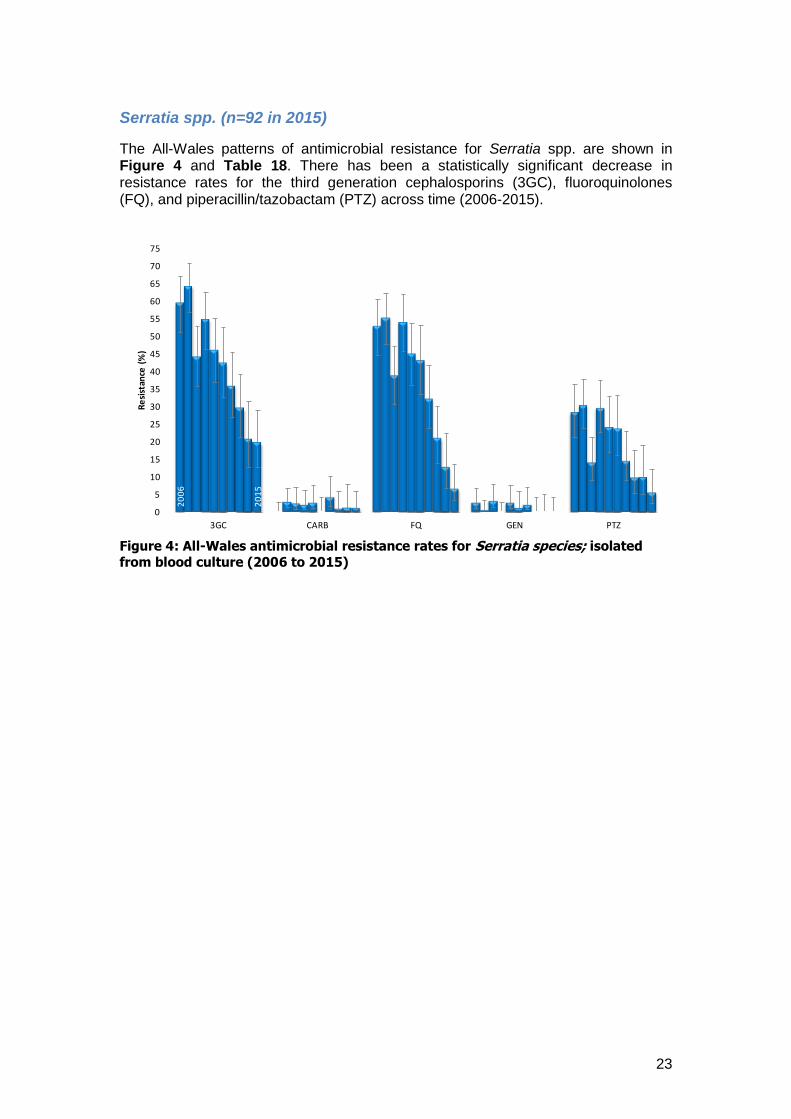
Serratia spp. (n=92 in 2015)
The All-Wales patterns of antimicrobial resistance for Serratia spp. are shown in Figure 4 and Table 18. There has been a statistically significant decrease in resistance rates for the third generation cephalosporins (3GC), fluoroquinolones (FQ), and piperacillin/tazobactam (PTZ) across time (2006-2015).
Figure 4: All-Wales antimicrobial resistance rates for Serratia species; isolated
from blood culture (2006 to 2015)
20
06
20
15
0
5
10
15
20
25
30
35
40
45
50
55
60
65
70
75
3GC CARB FQ GEN PTZ
Re
sist
ance
(%
)
24
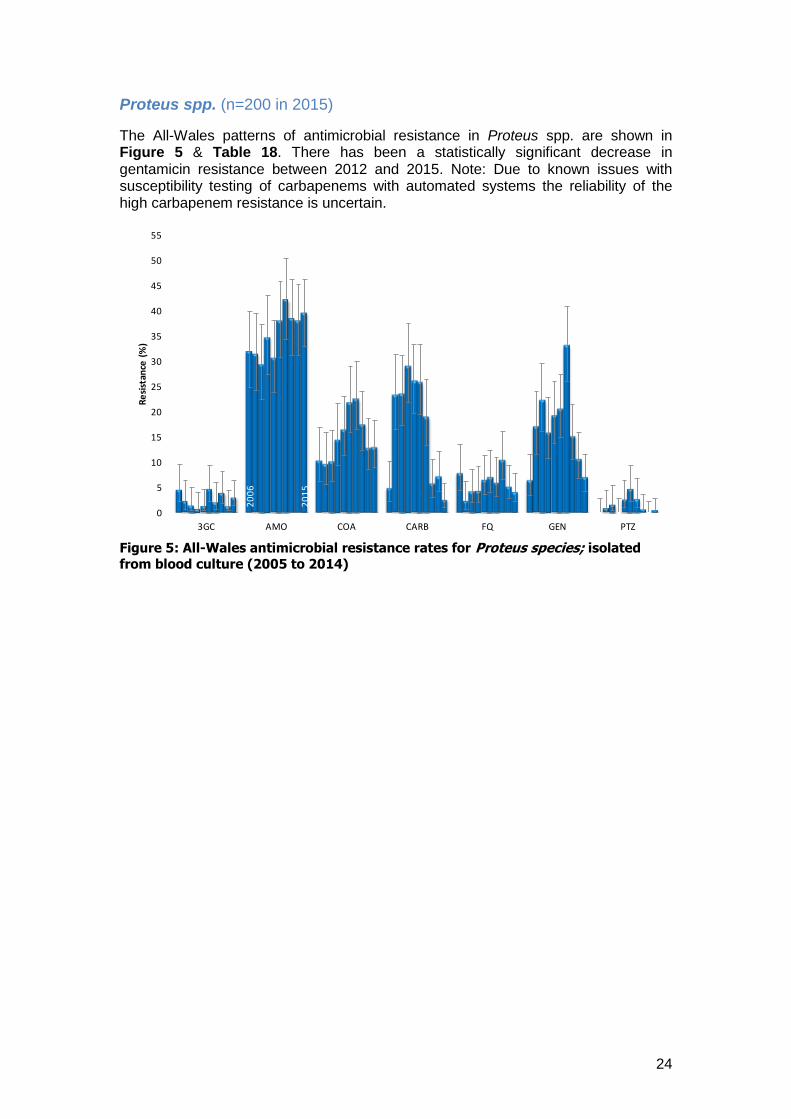
Proteus spp. (n=200 in 2015)
The All-Wales patterns of antimicrobial resistance in Proteus spp. are shown in Figure 5 & Table 18. There has been a statistically significant decrease in gentamicin resistance between 2012 and 2015. Note: Due to known issues with susceptibility testing of carbapenems with automated systems the reliability of the high carbapenem resistance is uncertain.
Figure 5: All-Wales antimicrobial resistance rates for Proteus species; isolated
from blood culture (2005 to 2014)
20
06
20
15
0
5
10
15
20
25
30
35
40
45
50
55
3GC AMO COA CARB FQ GEN PTZ
Re
sist
ance
(%
)

25
Pseudomonas aeruginosa (n=156 in 2015)
The All-Wales patterns of antimicrobial resistance in Pseudomonas aeruginosa are shown in Figure 6 & Table 18. The data is different to that shown in Table 3 (page 11); Table 3 shows the rates for Pseudomonas spp as per ARHAI instructions, but the following tables show the data for Ps. aeruginosa to allow comparisons with previous reports.
Figure 6: All-Wales antimicrobial resistance rates for Pseudomonas aeruginosa; isolated from blood culture (2006 to 2015)
There has been a statistically significant decrease in ciprofloxacin resistance in Pseudomonas aeruginosa from blood culture between 2011 and 2015.
20
06
20
15
0
2
4
6
8
10
12
14
16
18
20
22
24
26
28
30
IMI/MER CAZ CIP GEN PTZ
Re
sist
ance
(%
)

26
Staphylococcus aureus The All-Wales resistance rates for Staphylococcus aureus at hospital level are shown in Table 19, the data includes all Staphylococcus aureus both MSSA and MRSA. In 2015, flucloxacillin resistance rates for S. aureus bacteraemias in University Hospital Llandough are notably higher than the All-Wales rate, 30.0% compared with 12.7%. Flucloxacillin resistance reflects the proportion of S. aureus bacteraemias that were MRSA; the proportions of MRSA bacteraemias were notably higher in this locality than other acute hospitals in Wales. Figure 7 shows the numbers of Staphylococcus aureus bacteraemias from 2005 to 2015. Across time both the number of Staphylococcus aureus (SAUR) and Meticillin Resistant Staphylococcus aureus (MRSA) bacteraemias has decreased, whilst the numbers of Meticillin Sensitive Staphylococcus aureus (MSSA) bacteraemias have increased.
Figure 7: All-Wales Staphylococcus aureus bacteraemia numbers (2005 to 2015)
407
110
632
758
1039
868
0
200
400
600
800
1000
1200
2005 2006 2007 2008 2009 2010 2011 2012 2013 2014 2015
MRSA 407 341 363 344 286 229 203 180 164 145 110
MSSA 632 682 658 638 681 664 661 701 759 717 758
SAUR 1039 1023 1021 982 967 893 864 881 923 862 868
Nu
mb
er
of
bac
tera
em
ias

27
Table 19: Staphylococcus aureus (MSSA & MRSA)
28
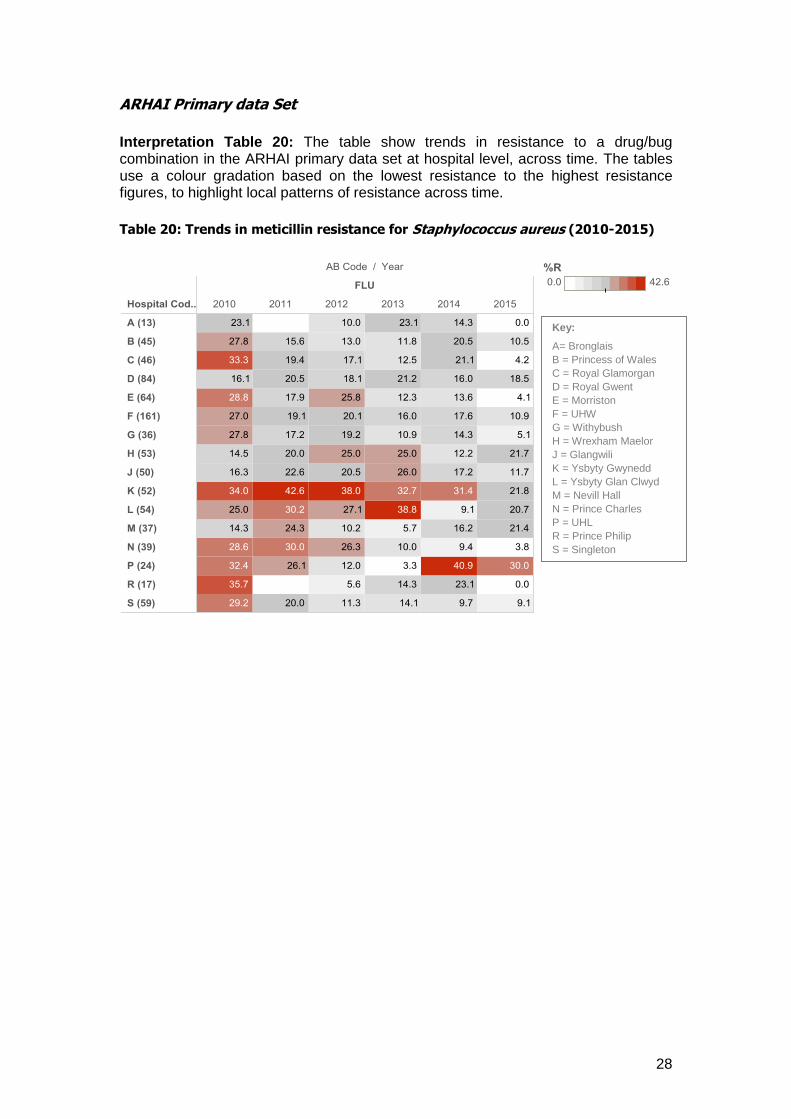
ARHAI Primary data Set
Interpretation Table 20: The table show trends in resistance to a drug/bug combination in the ARHAI primary data set at hospital level, across time. The tables use a colour gradation based on the lowest resistance to the highest resistance figures, to highlight local patterns of resistance across time.
Table 20: Trends in meticillin resistance for Staphylococcus aureus (2010-2015)
Key:
A= Bronglais
B = Princess of Wales
C = Royal Glamorgan
D = Royal Gwent
E = Morriston
F = UHW
G = Withybush
H = Wrexham Maelor
J = Glangwili
K = Ysbyty Gwynedd
L = Ysbyty Glan Clwyd
M = Nevill Hall
N = Prince Charles
P = UHL
R = Prince Philip
S = Singleton
29
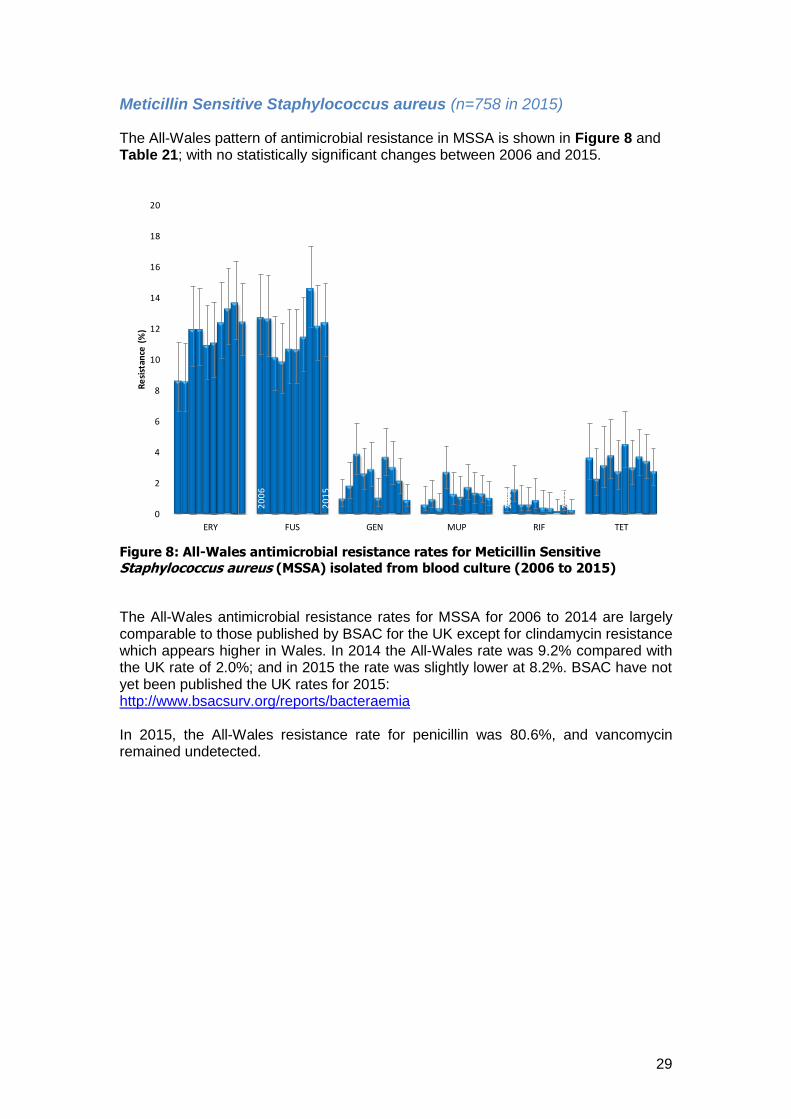
Meticillin Sensitive Staphylococcus aureus (n=758 in 2015)
The All-Wales pattern of antimicrobial resistance in MSSA is shown in Figure 8 and Table 21; with no statistically significant changes between 2006 and 2015.
Figure 8: All-Wales antimicrobial resistance rates for Meticillin Sensitive
Staphylococcus aureus (MSSA) isolated from blood culture (2006 to 2015)
The All-Wales antimicrobial resistance rates for MSSA for 2006 to 2014 are largely comparable to those published by BSAC for the UK except for clindamycin resistance which appears higher in Wales. In 2014 the All-Wales rate was 9.2% compared with the UK rate of 2.0%; and in 2015 the rate was slightly lower at 8.2%. BSAC have not yet been published the UK rates for 2015: http://www.bsacsurv.org/reports/bacteraemia In 2015, the All-Wales resistance rate for penicillin was 80.6%, and vancomycin remained undetected.
20
06
20
06
20
14
20
15
0
2
4
6
8
10
12
14
16
18
20
ERY FUS GEN MUP RIF TET
Re
sist
ance
(%
)

30
Table 21: Meticillin Sensitive Staphylococcus aureus
31
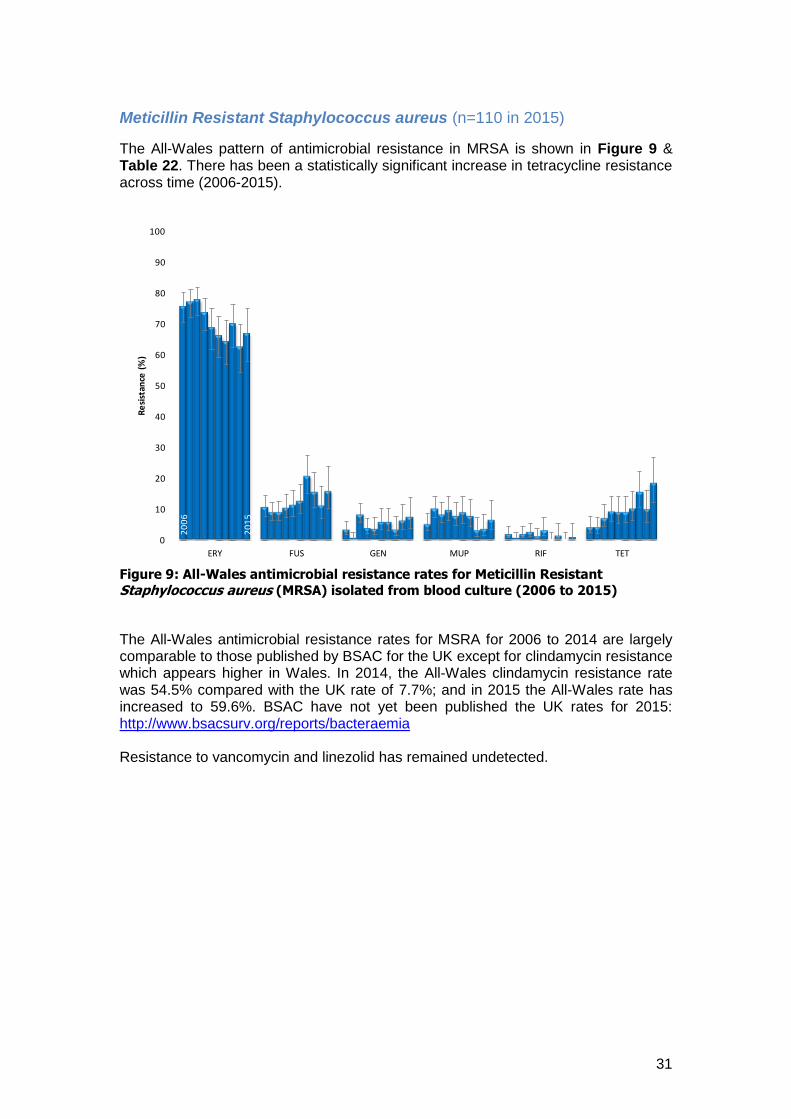
Meticillin Resistant Staphylococcus aureus (n=110 in 2015)
The All-Wales pattern of antimicrobial resistance in MRSA is shown in Figure 9 & Table 22. There has been a statistically significant increase in tetracycline resistance across time (2006-2015).
Figure 9: All-Wales antimicrobial resistance rates for Meticillin Resistant
Staphylococcus aureus (MRSA) isolated from blood culture (2006 to 2015)
The All-Wales antimicrobial resistance rates for MSRA for 2006 to 2014 are largely comparable to those published by BSAC for the UK except for clindamycin resistance which appears higher in Wales. In 2014, the All-Wales clindamycin resistance rate was 54.5% compared with the UK rate of 7.7%; and in 2015 the All-Wales rate has increased to 59.6%. BSAC have not yet been published the UK rates for 2015: http://www.bsacsurv.org/reports/bacteraemia Resistance to vancomycin and linezolid has remained undetected.
20
06
20
15
0
10
20
30
40
50
60
70
80
90
100
ERY FUS GEN MUP RIF TET
Re
sist
ance
(%
)
32
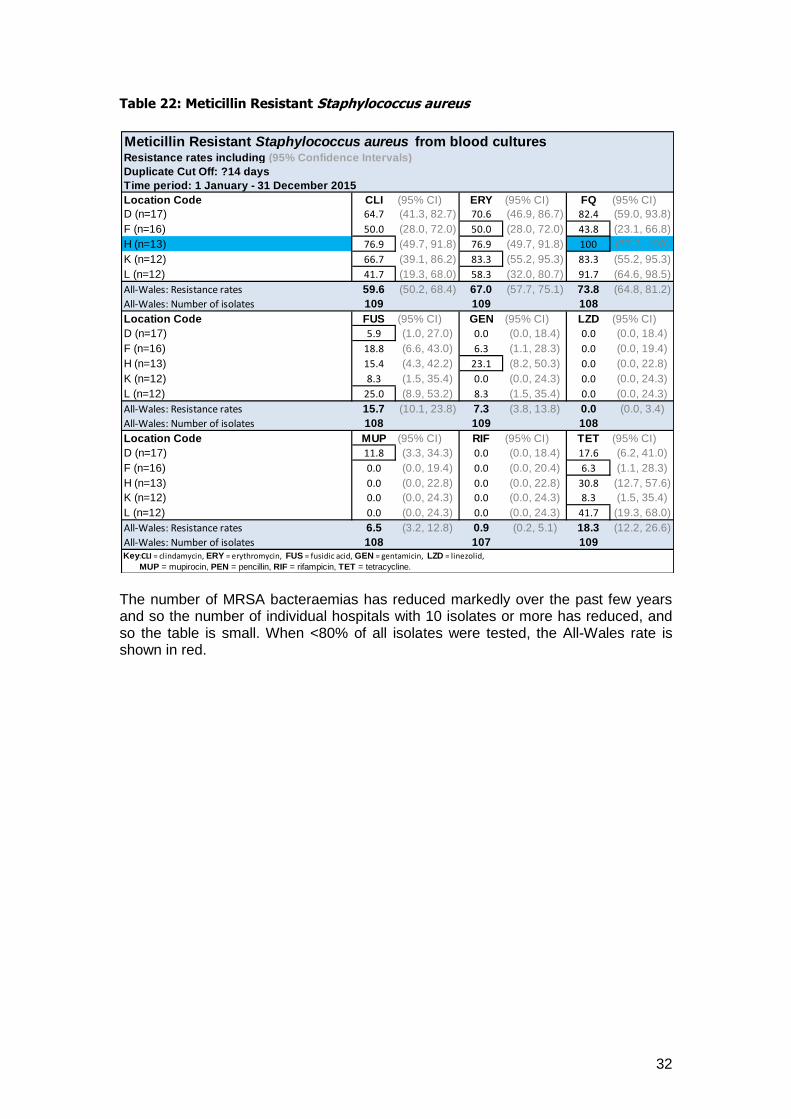
Table 22: Meticillin Resistant Staphylococcus aureus
The number of MRSA bacteraemias has reduced markedly over the past few years and so the number of individual hospitals with 10 isolates or more has reduced, and so the table is small. When <80% of all isolates were tested, the All-Wales rate is shown in red.
Meticillin Resistant Staphylococcus aureus from blood culturesResistance rates including (95% Confidence Intervals)
Duplicate Cut Off: ?14 days
Time period: 1 January - 31 December 2015
Location Code CLI (95% CI) ERY (95% CI) FQ (95% CI)
D (n=17) 64.7 (41.3, 82.7) 70.6 (46.9, 86.7) 82.4 (59.0, 93.8)
F (n=16) 50.0 (28.0, 72.0) 50.0 (28.0, 72.0) 43.8 (23.1, 66.8)
H (n=13) 76.9 (49.7, 91.8) 76.9 (49.7, 91.8) 100 (77.2, 100)
K (n=12) 66.7 (39.1, 86.2) 83.3 (55.2, 95.3) 83.3 (55.2, 95.3)
L (n=12) 41.7 (19.3, 68.0) 58.3 (32.0, 80.7) 91.7 (64.6, 98.5)
All-Wales: Resistance rates 59.6 (50.2, 68.4) 67.0 (57.7, 75.1) 73.8 (64.8, 81.2)
All-Wales: Number of isolates 109 109 108
Location Code FUS (95% CI) GEN (95% CI) LZD (95% CI)
D (n=17) 5.9 (1.0, 27.0) 0.0 (0.0, 18.4) 0.0 (0.0, 18.4)
F (n=16) 18.8 (6.6, 43.0) 6.3 (1.1, 28.3) 0.0 (0.0, 19.4)
H (n=13) 15.4 (4.3, 42.2) 23.1 (8.2, 50.3) 0.0 (0.0, 22.8)
K (n=12) 8.3 (1.5, 35.4) 0.0 (0.0, 24.3) 0.0 (0.0, 24.3)
L (n=12) 25.0 (8.9, 53.2) 8.3 (1.5, 35.4) 0.0 (0.0, 24.3)
All-Wales: Resistance rates 15.7 (10.1, 23.8) 7.3 (3.8, 13.8) 0.0 (0.0, 3.4)
All-Wales: Number of isolates 108 109 108
Location Code MUP (95% CI) RIF (95% CI) TET (95% CI)
D (n=17) 11.8 (3.3, 34.3) 0.0 (0.0, 18.4) 17.6 (6.2, 41.0)
F (n=16) 0.0 (0.0, 19.4) 0.0 (0.0, 20.4) 6.3 (1.1, 28.3)
H (n=13) 0.0 (0.0, 22.8) 0.0 (0.0, 22.8) 30.8 (12.7, 57.6)
K (n=12) 0.0 (0.0, 24.3) 0.0 (0.0, 24.3) 8.3 (1.5, 35.4)
L (n=12) 0.0 (0.0, 24.3) 0.0 (0.0, 24.3) 41.7 (19.3, 68.0)
All-Wales: Resistance rates 6.5 (3.2, 12.8) 0.9 (0.2, 5.1) 18.3 (12.2, 26.6)
All-Wales: Number of isolates 108 107 109Key:CLI = clindamycin, ERY = erythromycin, FUS = fusidic acid, GEN = gentamicin, LZD = linezolid,
MUP = mupirocin, PEN = pencillin, RIF = rifampicin, TET = tetracycline.

33
Enterococcus spp. (n=430 in 2015)
The All-Wales pattern of antimicrobial resistance in Enterococcus spp. is shown in Figure 10 and Table 23; with no statistically significant changes in resistance between 2014 and 2015.
Figure 10: All-Wales antimicrobial resistance rates for Enterococcus spp. isolated
from blood culture (2006 to 2015)
In 2015, the All-Wales resistance rate for amoxicillin was 45.5% (40.8, 50.3). Susceptibility to amoxicillin is a guide to speciation of the organism, E. faecalis being normally susceptible and E. faecium being normally resistant, and suggests that in 2015, 54.5% of entercoccal bacteraemias were due to E. faecalis. Table 23: Enterococcus spp.
2006
2015
0
5
10
15
20
25
30
35
40
45
50
55
60
AMO VAN
Resi
stan
ce (
%)

34
Note: Locally resistance rates for amoxicillin varied from 20.0% in Glangwili hospital (J) to 70.0% in Prince Charles hospital (N) and this may simply reflect variation in the proportion of E. faecalis to E. faecium. Vancomycin resistance varied from 0.0% to 50.0% in Nevill Hall (M).
ARHAI Primary data Set
Interpretation Table 24: The table show trends in resistance to a drug/bug combination in the ARHAI primary data set at hospital level, across time. The tables use a colour gradation based on the lowest resistance to the highest resistance figures, to highlight local patterns of resistance across time. The number following the hospital code e.g. (9) represents the median number of isolates per year over the data set. Resistance rates are only shown when the number of isolates were 10 or more for any one year e.g. for hospital A data is not shown for 2011, 2013, 2014 or 2015. Table 24: Trends in vancomycin resistance for Enterococcus spp. (2010-2015)
Key:
B = Princess of Wales
C = Royal Glamorgan
D = Royal Gwent
E = Morriston
F = UHW
G = Withybush
H = Wrexham Maelor
J = Glangwili
K = Ysbyty Gwynedd
L = Ysbyty Glan Clwyd
N = Prince Charles
P = UHL
S = Singleton
35
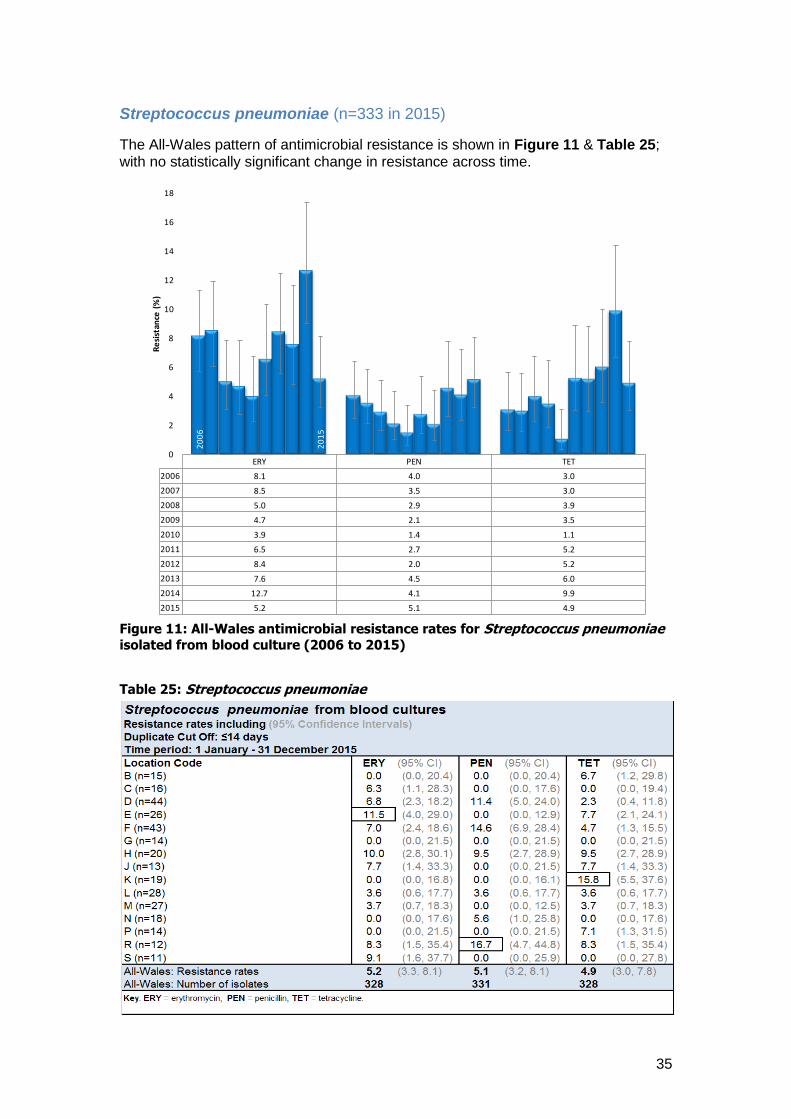
Streptococcus pneumoniae (n=333 in 2015)
The All-Wales pattern of antimicrobial resistance is shown in Figure 11 & Table 25; with no statistically significant change in resistance across time.
Figure 11: All-Wales antimicrobial resistance rates for Streptococcus pneumoniae
isolated from blood culture (2006 to 2015)
Table 25: Streptococcus pneumoniae
ERY PEN TET
2006 8.1 4.0 3.0
2007 8.5 3.5 3.0
2008 5.0 2.9 3.9
2009 4.7 2.1 3.5
2010 3.9 1.4 1.1
2011 6.5 2.7 5.2
2012 8.4 2.0 5.2
2013 7.6 4.5 6.0
2014 12.7 4.1 9.9
2015 5.2 5.1 4.9
20
06
20
15
0
2
4
6
8
10
12
14
16
18
Re
sist
ance
(%
)

36
ARHAI Primary data Set
Interpretation Table 26: The table show trends in resistance to a drug/bug combination in the ARHAI primary data set at hospital level, across time. The tables use a colour gradation based on the lowest resistance to the highest resistance figures, to highlight local patterns of resistance across time.
Table 26: Trends in penicillin resistance for S. pneumoniae (2010-2015)
Key:
A= Bronglais
B = Princess of Wales
C = Royal Glamorgan
D = Royal Gwent
E = Morriston
F = UHW
G = Withybush
H = Wrexham Maelor
J = Glangwili
K = Ysbyty Gwynedd
L = Ysbyty Glan Clwyd
M = Nevill Hall
N = Prince Charles
P = UHL
S = Singleton
37
Section 5.2: Antimicrobial resistance rates for urinary coliforms For the purposes of this report the term coliform refers to organisms that were reported as a ‘coliform’ by the laboratory, or when identified further, were reported as one of the genera belonging to the family Enterobacteriaceae. The genera included in this section of the report comprise:
Citrobacter
Edwardsiella
Enterobacter
Escherichia
Hafnia
Klebsiella
Kluyvera
Morganella
Pantoea
Proteus
Providencia
Rahnella
Salmonella
Serratia
Yersinia It should be noted that data from routinely-submitted urine specimens is more prone to bias than data from blood culture isolates due to variable sampling by clinicians. Thus resistance rates quoted here are likely to be higher due to increased sampling from patients who are more likely to have resistant organisms (e.g. patients with recurrent infections or infections that have failed to respond to initial therapy). This should be factored into any use of the data presented for the design of empiric treatment guidance. The generation of more specific data reports (e.g. different patient age groups) can be discussed with the Welsh AR Programme.
38
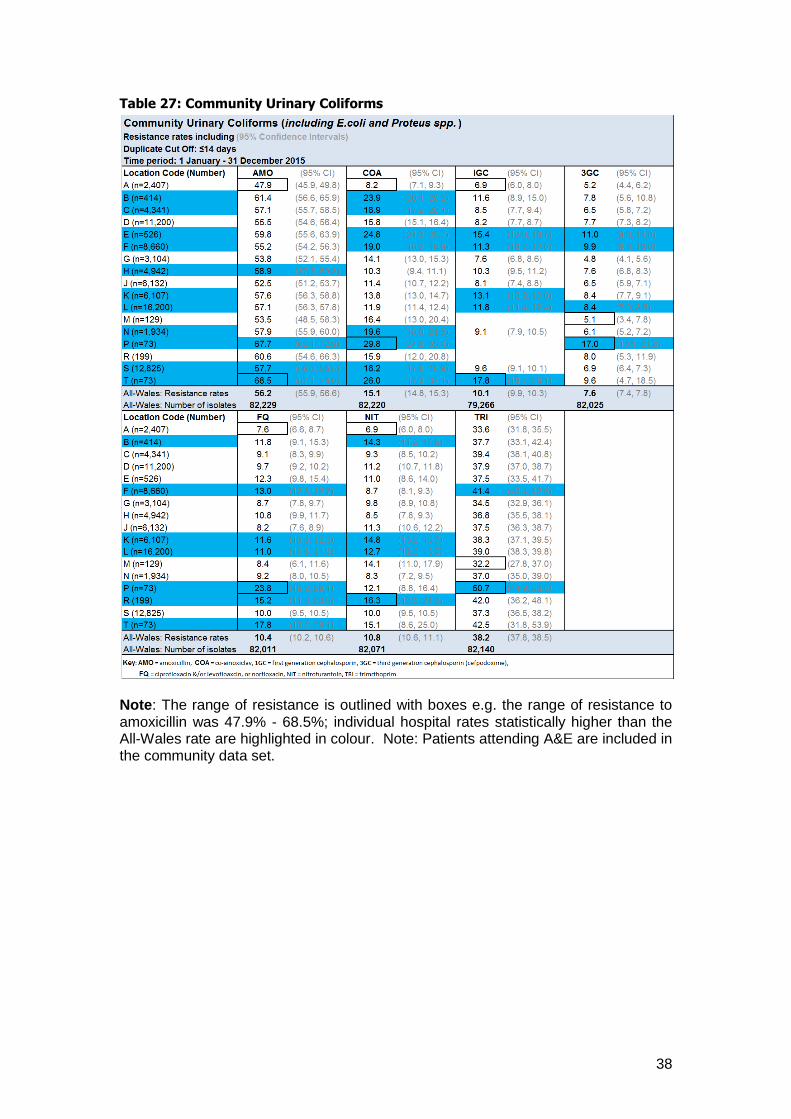
Table 27: Community Urinary Coliforms
Note: The range of resistance is outlined with boxes e.g. the range of resistance to amoxicillin was 47.9% - 68.5%; individual hospital rates statistically higher than the All-Wales rate are highlighted in colour. Note: Patients attending A&E are included in the community data set.
39
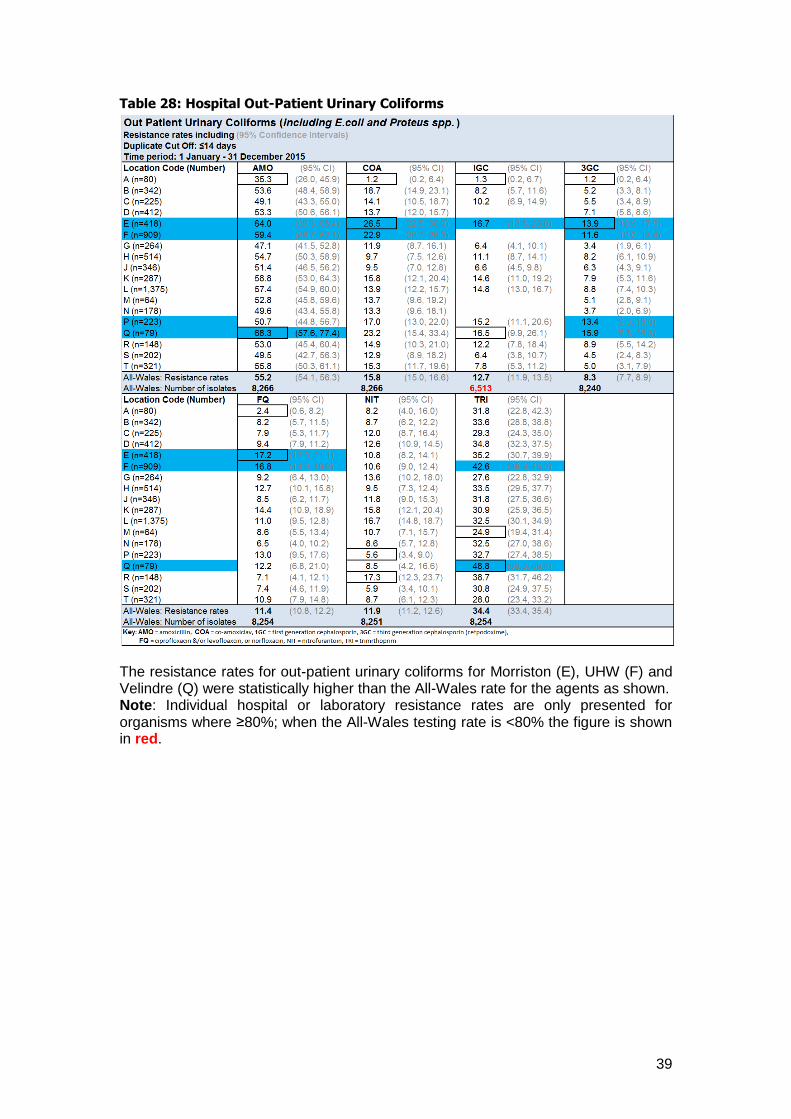
Table 28: Hospital Out-Patient Urinary Coliforms
The resistance rates for out-patient urinary coliforms for Morriston (E), UHW (F) and Velindre (Q) were statistically higher than the All-Wales rate for the agents as shown. Note: Individual hospital or laboratory resistance rates are only presented for organisms where ≥80%; when the All-Wales testing rate is <80% the figure is shown in red.

40
Table 29: Hospital In-Patient Urinary Coliforms
In 2015, the All-Wales resistance rates for in-patients urinary coliforms were statistically higher for all the agents listed than those for community or out-patients (Tables 27, 28 & 29). In 2015, a number of hospitals had resistance rates for urinary coliforms that were statistically higher than the All-Wales rate; the most notable was Neath Port Talbot (T).

41
Community Urinary Coliforms (n=82,233 in 2015)
The All-Wales pattern of antimicrobial resistance for community urinary coliforms is shown in Figure 12 & Table 27.
Figure 12: All-Wales antimicrobial resistance rates for coliforms from community urine samples (2006 to 2015)
There has been a statistically significant increase in resistance to third generation cephalosporins, fluoroquinolones and trimethoprim across time. Co-amoxiclav resistance decreased in 2013, but has increased again in 2014 and 2015. Figure 13 over page shows antimicrobial resistance in the 65-79 and 80+ age groups by gender for 2015. Resistance to trimethoprim has increased over time, with high resistance noted in the 80+ age group (47.8% in females and 47.5% in males). Whilst resistance to trimethoprim continues to rise the high rates of resistance may reflect an element of selective testing within the community. The true rate of resistance to trimethoprim in patients presenting with uncomplicated UTI in the community is likely to be considerably lower, and trimethoprim remains the suggested first-line empirical therapy for most of these patients. However, in the elderly, or patients who have received antibiotics within the last 3 months, the likelihood of infection with a resistant organism is higher, and an alternative antibiotic should be considered. Alternatives include:
o Nitrofurantoin 100mg m/r BD for 3 days in women and 7 days in men (not recommended if renal impairment with GFR <60mL/min).
o Co-amoxiclav 625mg TDS for 3 days in women and 7 days in men. o Pivmecillinam 400mg initially, then 200mg TDS for 3 days in women and 7
days in men.

42
Figure 13: All-Wales trimethoprim resistance rates for coliforms from community
urine samples from the elderly by age group and gender (2015)
0
10
20
30
40
50
60
3GC COA FQ NIT TRI
65-79 F 7.2 14.8 10.1 5.2 37.5
80+ F 11.9 20.8 17.3 8.3 47.9
65-79 M 11.6 22.7 15.2 10.5 37.3
80+ M 14.5 25.8 19.7 13.5 47.5
Res
ista
nce
(A
ge G
rou
p &
Gen
der
) %
Antibacterial

43
Out-patient Urinary Coliforms (n=8,266 in 2015)
The All-Wales pattern of antimicrobial resistance for out-patient urinary coliforms is shown in Figure 14 & Table 28. There has been a statistically significant increase in trimethoprim resistance across time, from 27.9% in 2006 to 34.4% in 2015.
Figure 14: All-Wales antimicrobial resistance rates for coliforms from out-patient
urine samples (2006 to 2015)

44
In-patient Urinary Coliforms (n=14,879 in 2015)
The All-Wales pattern of antimicrobial resistance for in-patient urinary coliforms is shown in Figure 15 & Table 29. There has been a statistically significant increase in trimethoprim resistance across time, from 32.3% in 2006 to 40.3% in 2015.
Figure 15: All-Wales antimicrobial resistance rates for coliforms from in-patient urine samples (2006 to 2015)
45
Section 5.3: Antimicrobial resistance rates for Staphylococcus aureus The data in this section is presented to reflect the antimicrobial susceptibility of organisms causing skin and soft tissue infections occurring in the community, and is based on the specimen description ‘wound swab’. However, it should be noted that there is a significant sampling bias in this data. Royal Gwent and Nevill Hall are not included in the MSSA or MRSA data sets as they do not use the specimen type description ‘wound swab’ in their laboratory management systems.
46
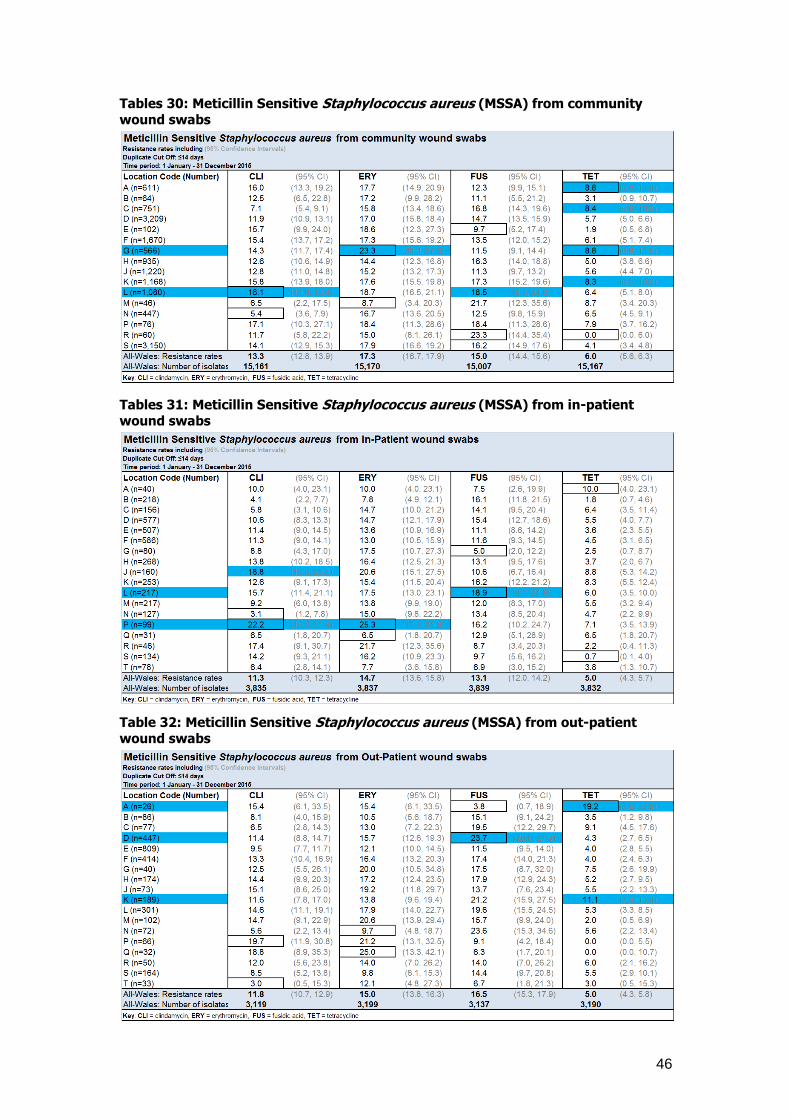
Tables 30: Meticillin Sensitive Staphylococcus aureus (MSSA) from community
wound swabs
Tables 31: Meticillin Sensitive Staphylococcus aureus (MSSA) from in-patient
wound swabs
Table 32: Meticillin Sensitive Staphylococcus aureus (MSSA) from out-patient
wound swabs

47
MSSA ( n=22,206 in 2015)
Community MSSA (n=15,171 in 2015) The All-Wales pattern of antimicrobial resistance for MSSA from community wound swabs are shown in Figure 16 and Table 30 with a notable increase in trend for erythromycin resistance.
Figure 16: All-Wales antimicrobial resistance rates for MSSA from community Wound swabs (2006 to 2015)
In 2015, the All-Wales resistance rates for community, out-patients and in-patients MSSA were comparable for most of the antimicrobials listed: erythromycin (ERY), gentamicin (GEN), mupirocin (MUP), penicillin (PEN) and tetracycline (TET) see Tables 30, 31 and 32. At different times in the ten year period 2006 to 2015, there were increases in resistance to different agents in different geographical areas, but there was no set pattern of increasing or high resistance in any particular community or hospital, and this probably reflects the varying presence of epidemic strains.
Resistance to fusidic acid (FUS) was higher for out-patient MSSA compared to in-patient and community rates.
Vancomycin resistance remained undetected in MSSA between 2006 & 2015.
20
06
20
15
0
2
4
6
8
10
12
14
16
18
20
ERY FUS GEN TET
Re
sist
ance
(%
)
48
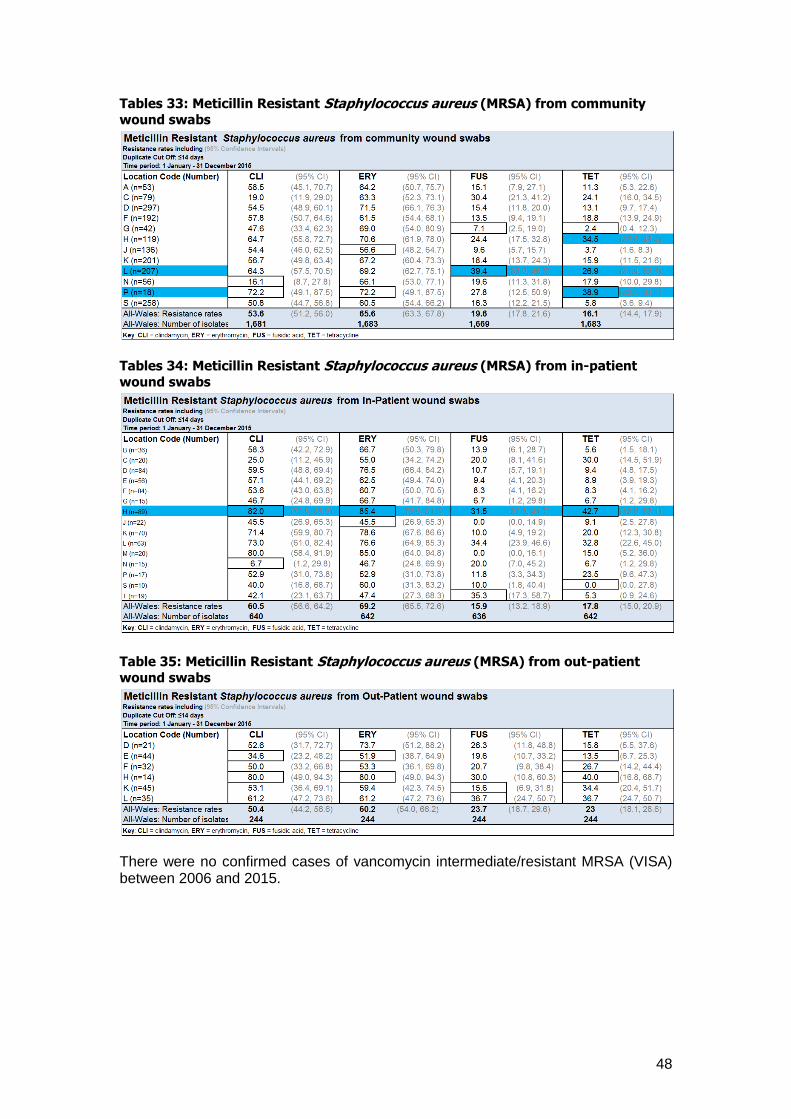
Tables 33: Meticillin Resistant Staphylococcus aureus (MRSA) from community
wound swabs
Tables 34: Meticillin Resistant Staphylococcus aureus (MRSA) from in-patient
wound swabs
Table 35: Meticillin Resistant Staphylococcus aureus (MRSA) from out-patient
wound swabs
There were no confirmed cases of vancomycin intermediate/resistant MRSA (VISA) between 2006 and 2015.

49
MRSA (n=2,603 in 2015)
Community MRSA (n=1,696 in 2015) The All-Wales pattern of antimicrobial resistance for MRSA from community wound swabs is shown in Figure 17 and Table 33, with no statistically significant changes in the resistance rates for any of the agents listed between 2014 and 2015.
Figure 17: All-Wales antimicrobial resistance rates for MRSA from community
Wound swabs (2006 to 2015)
Locally, there was wide variability in resistance rates within Wales; with notably high rates in some areas e.g. fusidic acid and tetracycline resistance in communities served by the laboratory in Ysbyty Glan Clwyd (L), see Table 33. Hospital In-Patient and Out-Patient MRSA (n=907 in 2015) The trends in antimicrobial resistance for both hospital in-patient and out-patient MRSA are similar to those seen in the community, with no statistically significant changes in the resistance rates for any of the agents listed between 2014 and 2015. Some of the same local patterns of resistance seen in the community were also reflected in hospital patients from the same geographical area, with notably high fusidic acid and tetracycline rates in patients from Wrexham Maelor (H) and Ysbyty Glan Clwyd (L): See Tables 34 and 35.
20
05
20
15
0
10
20
30
40
50
60
70
80
90
100
ERY FQ FUS GEN LZD MUP RIF TET
Re
sist
ance
(%
)

50
Section 5.4: Antimicrobial resistance rates for other
pathogens.
The data in this section of the report comprises other pathogens which may commonly cause important infections other than bacteraemia. The data is for all specimens from all locations (community, in-patient and out-patient).
Haemophilus influenzae
Streptococcus pneumoniae
Streptococcus pyogenes
Campylobacter species
Neisseria gonorrhoeae

51
Table 36: Haemophilus influenzae - all specimens and all locations
Note: The range of resistance is outlined with boxes e.g. the range of resistance to amoxicillin was 21.4% - 47.4%; individual location rates statistically higher than the All-Wales rate are highlighted in colour.
52
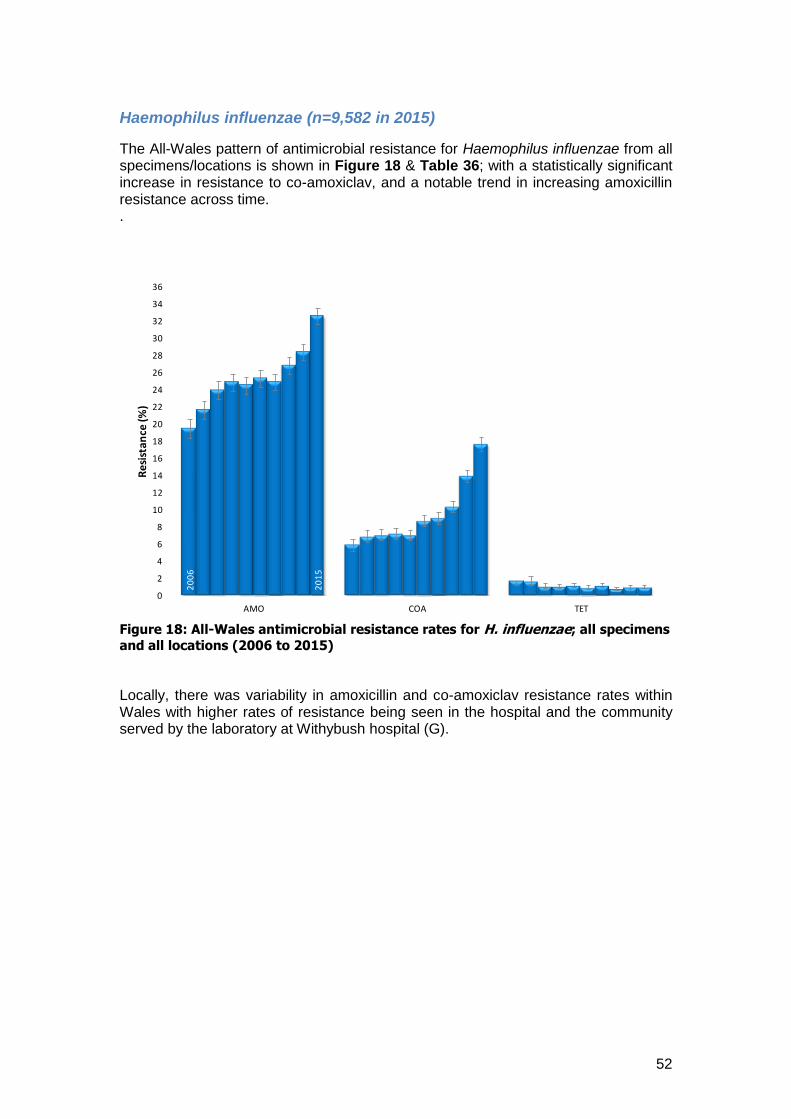
Haemophilus influenzae (n=9,582 in 2015)
The All-Wales pattern of antimicrobial resistance for Haemophilus influenzae from all specimens/locations is shown in Figure 18 & Table 36; with a statistically significant increase in resistance to co-amoxiclav, and a notable trend in increasing amoxicillin resistance across time. .
Figure 18: All-Wales antimicrobial resistance rates for H. influenzae; all specimens
and all locations (2006 to 2015)
Locally, there was variability in amoxicillin and co-amoxiclav resistance rates within Wales with higher rates of resistance being seen in the hospital and the community served by the laboratory at Withybush hospital (G).
20
06
20
15
0
2
4
6
8
10
12
14
16
18
20
22
24
26
28
30
32
34
36
AMO COA TET
Re
sist
ance
(%)

53
Table 37: Streptococcus pneumoniae - all specimens and all locations
Streptococcus pneumoniae, all specimens all locationsResistance rates including (95% Confidence Intervals)
Duplicate Cut Off: ?14 days
Time period: 1 January - 31 December 2015
Location Code ERY (95% CI) PEN (95% CI) TET (95% CI)
A (n=75) 5.3 (2.1, 12.9) 1.3 (0.2, 7.2) 4.0 (1.4, 11.1)
B (n=42) 2.1 (0.4, 10.9) 0.0 (0.0, 7.4) 8.3 (3.3, 19.6)
C (n=112) 11.6 (6.9, 18.9) 4.4 (1.9, 9.9) 5.4 (2.5, 11.2)
D (n=543) 12.7 (10.2, 15.8) 5.0 (3.4, 7.1) 8.1 (6.1, 10.7)
E (n=75) 14.8 (8.7, 24.1) 4.9 (1.9, 12.0) 11.1 (6.0, 19.8)
F (n=422) 9.0 (6.6, 12.1) 9.1 (6.7, 12.2) 6.6 (4.6, 9.4)
G (n=64) 7.8 (3.4, 17.0) 1.5 (0.3, 8.2) 0.0 (0.0, 5.6)
H (n=280) 10.7 (7.6, 14.8) 7.4 (4.9, 11.0) 8.2 (5.5, 11.9)
J (n=216) 9.3 (6.1, 13.9) 3.7 (1.9, 7.1) 6.0 (3.6, 10.0)
K (n=291) 11.3 (8.1, 15.4) 8.5 (5.8, 12.3) 9.2 (6.4, 13.1)
L (n=256) 10.5 (7.3, 14.9) 4.3 (2.4, 7.5) 10.1 (7.0, 14.4)
M (n=68) 7.4 (3.2, 16.1) 2.9 (0.8, 10.1) 5.9 (2.3, 14.2)
N (n=81) 6.2 (2.7, 13.6) 4.9 (1.9, 11.9) 7.4 (3.4, 15.2)
P (n=62) 12.9 (6.7, 23.4) 8.1 (3.5, 17.5) 12.9 (6.7, 23.4)
R (n=37) 10.8 (4.3, 24.7) 10.8 (4.3, 24.7) 8.1 (2.8, 21.3)
S (n=315) 11.2 (8.3, 14.9) 4.8 (3.0, 7.6) 7.8 (5.4, 11.1)
T (n=10) 40.0 (16.8, 68.7) 10.0 (1.8, 40.4) 20.0 (5.7, 51.0)
All-Wales: Resistance rates 10.5 (9.5, 11.7) 5.8 (5.0, 6.7) 7.7 (6.8, 8.8)
All-Wales: Number of isolates 3017 3017 3010Key: ERY = erythromycin, PEN = penicillin, TET = tetracycline.
54
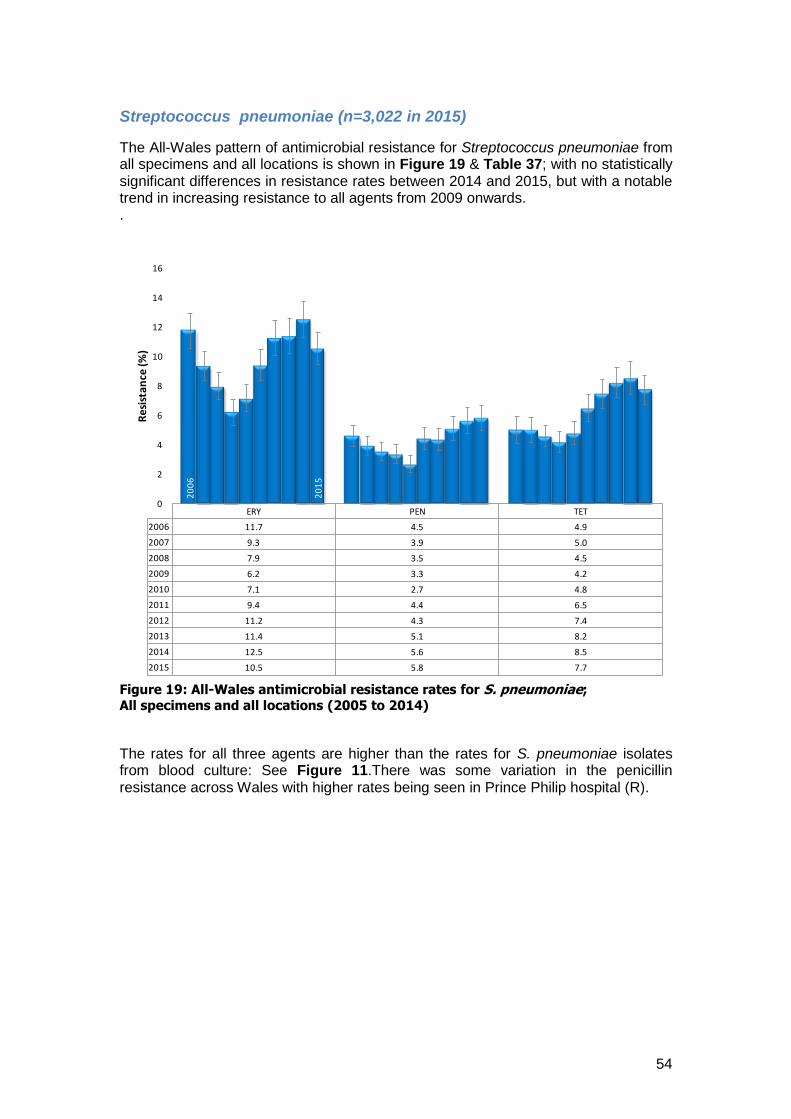
Streptococcus pneumoniae (n=3,022 in 2015)
The All-Wales pattern of antimicrobial resistance for Streptococcus pneumoniae from all specimens and all locations is shown in Figure 19 & Table 37; with no statistically significant differences in resistance rates between 2014 and 2015, but with a notable trend in increasing resistance to all agents from 2009 onwards. .
Figure 19: All-Wales antimicrobial resistance rates for S. pneumoniae; All specimens and all locations (2005 to 2014)
The rates for all three agents are higher than the rates for S. pneumoniae isolates from blood culture: See Figure 11.There was some variation in the penicillin resistance across Wales with higher rates being seen in Prince Philip hospital (R).
ERY PEN TET
2006 11.7 4.5 4.9
2007 9.3 3.9 5.0
2008 7.9 3.5 4.5
2009 6.2 3.3 4.2
2010 7.1 2.7 4.8
2011 9.4 4.4 6.5
2012 11.2 4.3 7.4
2013 11.4 5.1 8.2
2014 12.5 5.6 8.5
2015 10.5 5.8 7.7
20
06
20
15
0
2
4
6
8
10
12
14
16
Res
ista
nce
(%)

55
Streptococcus pyogenes (n=5,210 in 2015)
The All-Wales pattern of antimicrobial resistance for Streptococcus pyogenes from all specimens/locations is shown in Figure 20; with statistically significant changes in resistance between 2014 and 2015 (reduction in erythromycin and tetracycline rates).
Figure 20: All-Wales antimicrobial resistance rates for S. pyogenes; all specimens and all locations (2005 to 2014)
There were no validated cases of penicillin resistant S. pyogenes in Wales from 2006 to 2015.
20
06
20
15
0
2
4
6
8
10
12
14
ERY PEN TET
Res
ista
nce
(%)

56
Campylobacter species (n=3,635 in 2014)
The All-Wales pattern of antimicrobial resistance for Campylobacter spp. from all locations is shown in Figure 21; with a statistically significant increase in ciprofloxacin resistance across time (2006-2015).
Figure 21: All-Wales antimicrobial resistance rates for Campylobacter spp.; all
specimens and all locations (2006 to 2015)
20
05
20
15
0
5
10
15
20
25
30
35
40
45
CIP ERY
Re
sist
ance
(%)

57
Neisseria gonorrhoeae (n=564 in 2015)
The All-Wales pattern of antimicrobial resistance for Neisseria gonorrhoeae from all specimens and all locations is shown in Figure 22; with a statistically significant increase in ciprofloxacin resistance between 2014 and 2015.
Figure 22: All-Wales antimicrobial resistance rates for N. gonorrhoeae; all
specimens and all locations (2006 to 2015)
Note: GRASP (Gonococcal Resistance to Antimicrobials Surveillance Programme) is a national sentinel surveillance programme which has monitored trends and drifts in susceptibility in gonococcal isolates since 2000. It collects isolates from consecutive patients attending a network of 26 genitourinary medicine (GUM) clinics that give regional representation in England and Wales. The 2014 GRASP report published by the Public Health England reported the following antimicrobial susceptibility Overview: Susceptibility to first line antimicrobials, ceftriaxone and azithromycin:
There were no gonococcal isolates resistant to ceftriaxone in GRASP in 2014; 0.3% of gonococcal isolates routinely tested in primary diagnostic laboratories in 2014 were reported as resistant to ceftriaxone
Resistance to azithromycin in GRASP isolates decreased from 1.6% in 2013 to 1.0% in 2014; three isolates had high-level resistance to azithromycin (MIC >256 mg/L)
In 2015, the STBRU reference service detected an outbreak of 14 cases of high-level azithromycin resistant N. gonorrhoeae in heterosexual
20
05
20
15
0
5
10
15
20
25
30
35
40
45
50
55
60
65
70
75
CIP CRX PEN SPE TET
Res
ista
nce
(%)

58
Other antimicrobial susceptibility data:
In GRASP, resistance to cefixime declined across all sexual orientation sub-groups from 5.1% in 2013 to 1.4% in 2014
0.4% of isolates reported in SGSS were resistant to cefixime in 2014
37.3% of isolates in GRASP and 29.6% of isolates reported in SGSS were resistant to ciprofloxacin in 2014
22.6% of isolates in GRASP and 25.9% of isolates in SGSS were resistant to penicillin in 2014
No isolates in GRASP and 0.4% of isolates reported in SGSS were resistant to spectinomycin in 2014
https://www.gov.uk/government/uploads/system/uploads/attachment_data/file/476582/GRASP_2014_report_final_111115.pdf