antibody modeling: a quick reference guide to building...
TRANSCRIPT
Application Guide
Antibody Modeling: A quick reference guide to building Antibody homology models, and
graphical identification and refinement of CDR loops in Discovery Studio.
Francisco G. Hernandez-Guzman, PhD
Introduction
Antibody research has been and continues to be an attractive area of study for researchers interested in understanding detailed antibody-antigen interactions (Kabat, 1983 and Imai, 2006). Given the vast diversity for antibody recognition of antigens, experimental structural information may not always be readily available for a particular target of interest (Edwards, 1992 and Morea, 2000). In such cases, the most successful alternative is to harness the high homology of the antibody family and construct high-quality homology models (Chothia, 1987 and 1989, Al-Lazikani, 1997). The goal of this application note is to present a quick reference guide for constructing antibody homology models using MODELER (Sali, 1995) in Discovery Studio®. Models are then screened for quality and further refined with tools in Discovery Studio. Additional analysis tools are also introduced to further help in the structure refinement and quality improvement of the newly built model.
Building an Antibody Homology Model
The Fab fragment is the portion of the antibody that contains the antigen binding sites, therefore it is sufficient for antigen binding analysis to only build a model for the functionally relevant part of the antibody. Let us consider the Fab fragment with Protein Data Bank (PDB) code 2aab. This Fab fragment is of interest because it is involved in a clinically relevant melanoma antigen system (Chang, 2005). For this application note, we will only use the sequence information derived from the pdb file and will consider the structure to be unknown, even though it was solved by X-ray crystallography in 2005. At the end, we will use the experimentally-determined structure of the Fab fragment to evaluate the quality of our homology model. Given the high number of antibody related structures in the PDB, we are fairly confident that we will find a template with high homology to our ‘unknown’ protein.
Summary of Steps to be Performed
Step 1: Sequence similarity searchStep 2: Sequence alignmentStep 3: Building of homology modelStep 4: Analysis of homology modelStep 5: Identification and refinement of the Complimentary Determining Region (CDR) loopsStep 6: Additional analysis
Step 1: Sequence Similarity Search
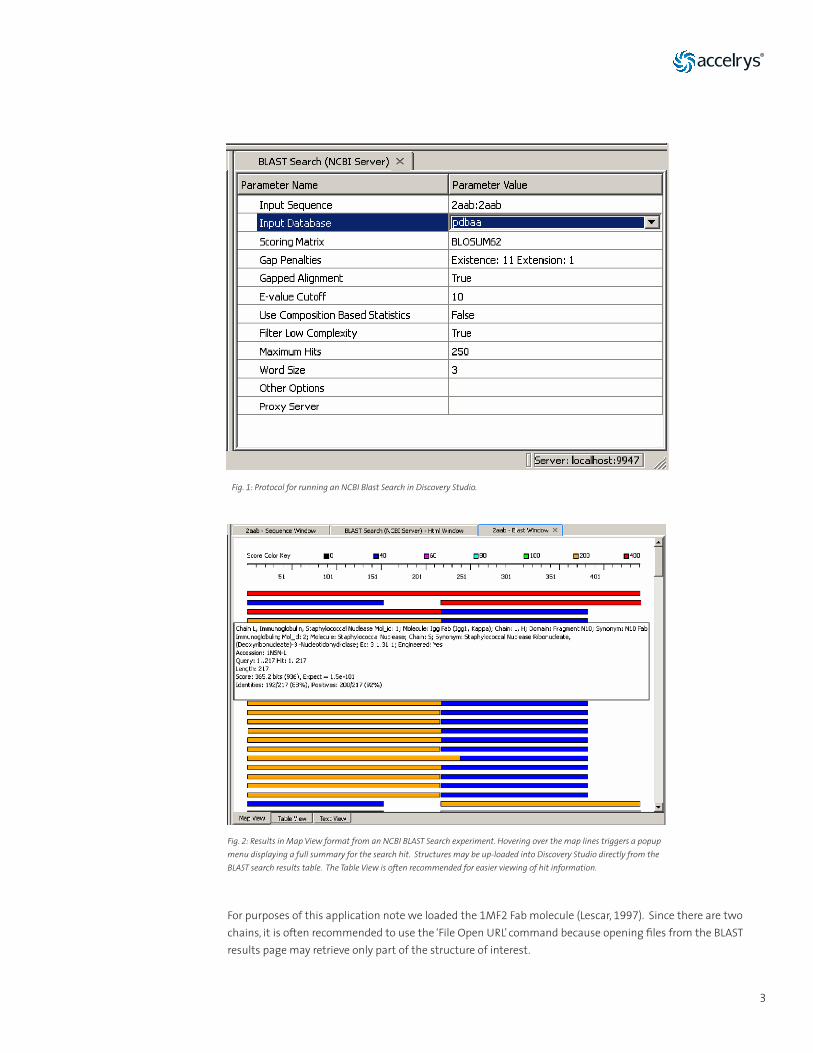
The first step in homology modeling is to find a template with high sequence similarity to our unknown protein, and of course with a known structure. Using Discovery Studio’s BLAST Search (NCBI Server) protocol (Figure 1) from the Sequence Analysis folder of the Protocols menu, we searched the NCBI database and found many highly homologous hits (Figure 2). Discovery Studio also offers more advanced protocols such as PSI-BLAST or Scan Sequence Profiles. However, these protocols are used in cases of low homology, and therefore, in our antibody example there was no need for advanced searching tools given the high homology within the antibody family.
2
3
For purposes of this application note we loaded the 1MF2 Fab molecule (Lescar, 1997). Since there are two chains, it is often recommended to use the ‘File Open URL’ command because opening files from the BLAST results page may retrieve only part of the structure of interest.
Fig. 1: Protocol for running an NCBI Blast Search in Discovery Studio.
Fig. 2: Results in Map View format from an NCBI BLAST Search experiment. Hovering over the map lines triggers a popup menu displaying a full summary for the search hit. Structures may be up-loaded into Discovery Studio directly from the BLAST search results table. The Table View is often recommended for easier viewing of hit information.
Step 2: Sequence Alignment
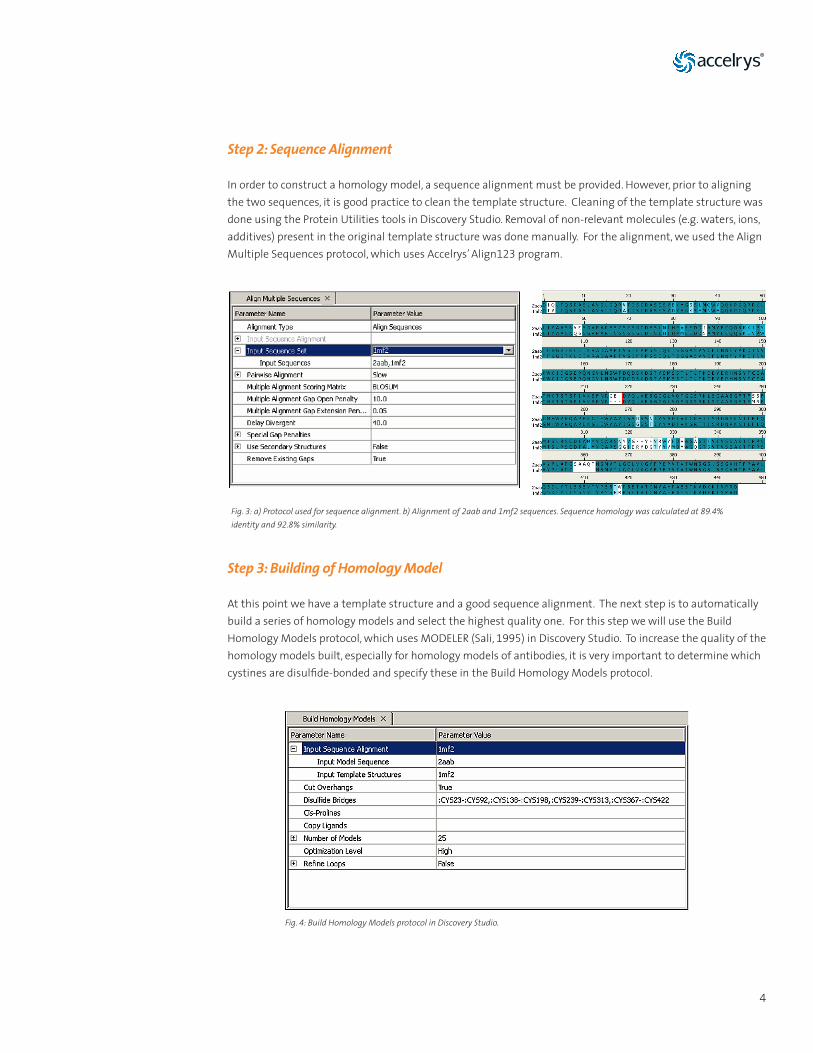
In order to construct a homology model, a sequence alignment must be provided. However, prior to aligning the two sequences, it is good practice to clean the template structure. Cleaning of the template structure was done using the Protein Utilities tools in Discovery Studio. Removal of non-relevant molecules (e.g. waters, ions, additives) present in the original template structure was done manually. For the alignment, we used the Align Multiple Sequences protocol, which uses Accelrys’ Align123 program.
�
Fig. 3: a) Protocol used for sequence alignment. b) Alignment of 2aab and 1mf2 sequences. Sequence homology was calculated at 89.4% identity and 92.8% similarity.
Step 3: Building of Homology Model
At this point we have a template structure and a good sequence alignment. The next step is to automatically build a series of homology models and select the highest quality one. For this step we will use the Build Homology Models protocol, which uses MODELER (Sali, 1995) in Discovery Studio. To increase the quality of the homology models built, especially for homology models of antibodies, it is very important to determine which cystines are disulfide-bonded and specify these in the Build Homology Models protocol.
Fig. 4: Build Homology Models protocol in Discovery Studio.
Step 4: Analysis of Homology Models
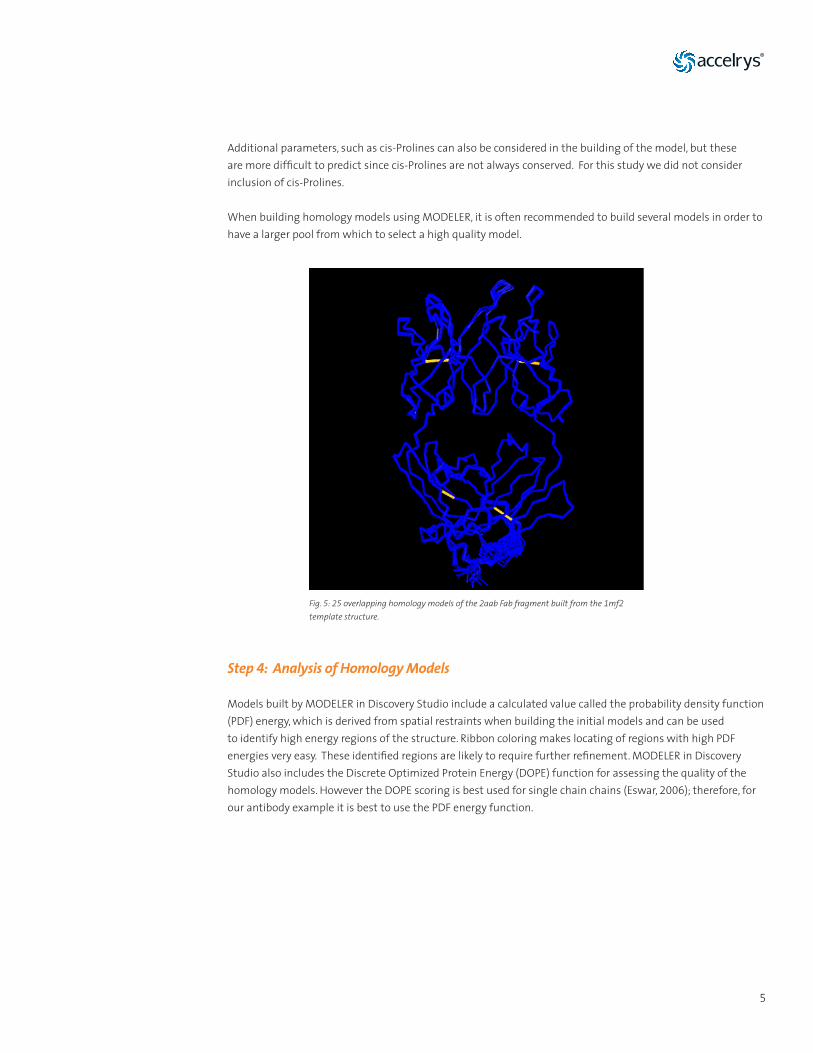
Models built by MODELER in Discovery Studio include a calculated value called the probability density function (PDF) energy, which is derived from spatial restraints when building the initial models and can be used to identify high energy regions of the structure. Ribbon coloring makes locating of regions with high PDF energies very easy. These identified regions are likely to require further refinement. MODELER in Discovery Studio also includes the Discrete Optimized Protein Energy (DOPE) function for assessing the quality of the homology models. However the DOPE scoring is best used for single chain chains (Eswar, 2006); therefore, for our antibody example it is best to use the PDF energy function.
5
Fig. 5: 25 overlapping homology models of the 2aab Fab fragment built from the 1mf2 template structure.
Additional parameters, such as cis-Prolines can also be considered in the building of the model, but these are more difficult to predict since cis-Prolines are not always conserved. For this study we did not consider inclusion of cis-Prolines.
When building homology models using MODELER, it is often recommended to build several models in order to have a larger pool from which to select a high quality model.
6
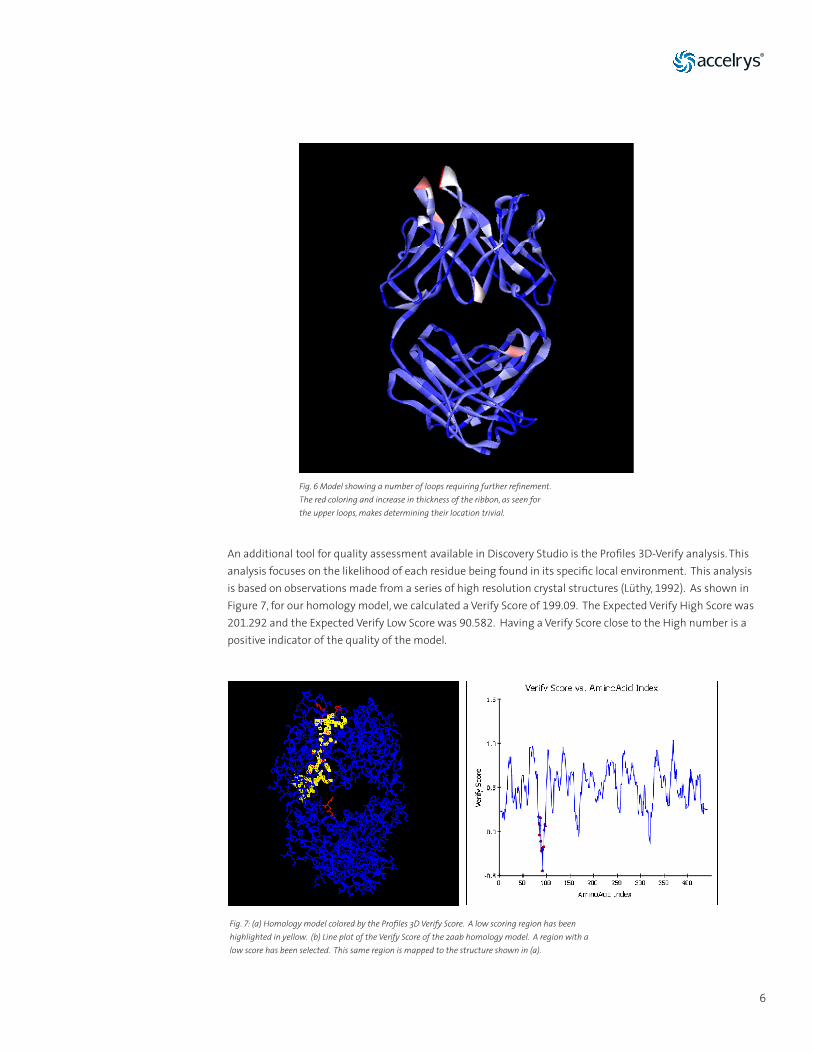
An additional tool for quality assessment available in Discovery Studio is the Profiles 3D-Verify analysis. This analysis focuses on the likelihood of each residue being found in its specific local environment. This analysis is based on observations made from a series of high resolution crystal structures (Lüthy, 1992). As shown in Figure 7, for our homology model, we calculated a Verify Score of 199.09. The Expected Verify High Score was 201.292 and the Expected Verify Low Score was 90.582. Having a Verify Score close to the High number is a positive indicator of the quality of the model.
Fig. 6 Model showing a number of loops requiring further refinement. The red coloring and increase in thickness of the ribbon, as seen for the upper loops, makes determining their location trivial.
Fig. 7: (a) Homology model colored by the Profiles 3D Verify Score. A low scoring region has been highlighted in yellow. (b) Line plot of the Verify Score of the 2aab homology model. A region with a low score has been selected. This same region is mapped to the structure shown in (a).
7
Step 5: Identification and Refinement of CDR Loops
Identification of the CDRs can be done by visual analysis with graphical tools like Discovery Studio or by knowledge-based approaches (Morea, 2000). Visual identification of the CDR loops lead to the following classification illustrated in Table 1.
For reference, the overall backbone RMSD was 2.�1 when obtained by sequence alignment of all ��1 residues, and only 1.83 by structural alignment with 282 residues used for the superposition. On the other hand, we calculated an RSMD of 1.18 when doing a structural alignment of only the Fv region (233 residues), which verifies the high degree of structural homology within the antibody family.
To assess the quality of our best homology model, we calculated in Table 2 the RMSD of all six CDR loops of our best homology model and compared these values to those of the crystal structure.
Fig. 9 Superposition of retrieved active ligands (yellow) over X-ray ligands of Src Tyrosine kinase
Fig. 8 Scaffold and all fragments of Src Tyrosine Kinase inhibitors
CDR Loop Residues Sequence
L1 27 – 35 ESVEYYGSS
L2 70 – 7� GSGTD
L3 95 – 100 SRKIPY
H1 2�5 – 2�9 TFSSF
H2 267 – 276 YISSDSSNIY
H3 318 – 325 YVGYHVRW
Table 1: Classification of residues in CDR loops.
CDR Loop RMSD – all atoms RMSD – Ca atomsL1 1.391 1.132L2 0.75� 0.76�L3 0.809 0.769H1 0.7�� 0.790H2 0.86� 0.82�
H3 �.106 �.39�
Table 2: RMSD calculation the CDR loops of our best homology in reference to the crystal structure.
We observed that the H3 loop showed the highest deviation to the crystal structure. This large deviation was expected given that this is the region with the lowest local homology within the antibody family (Morea, 1998 and Martin 1989).
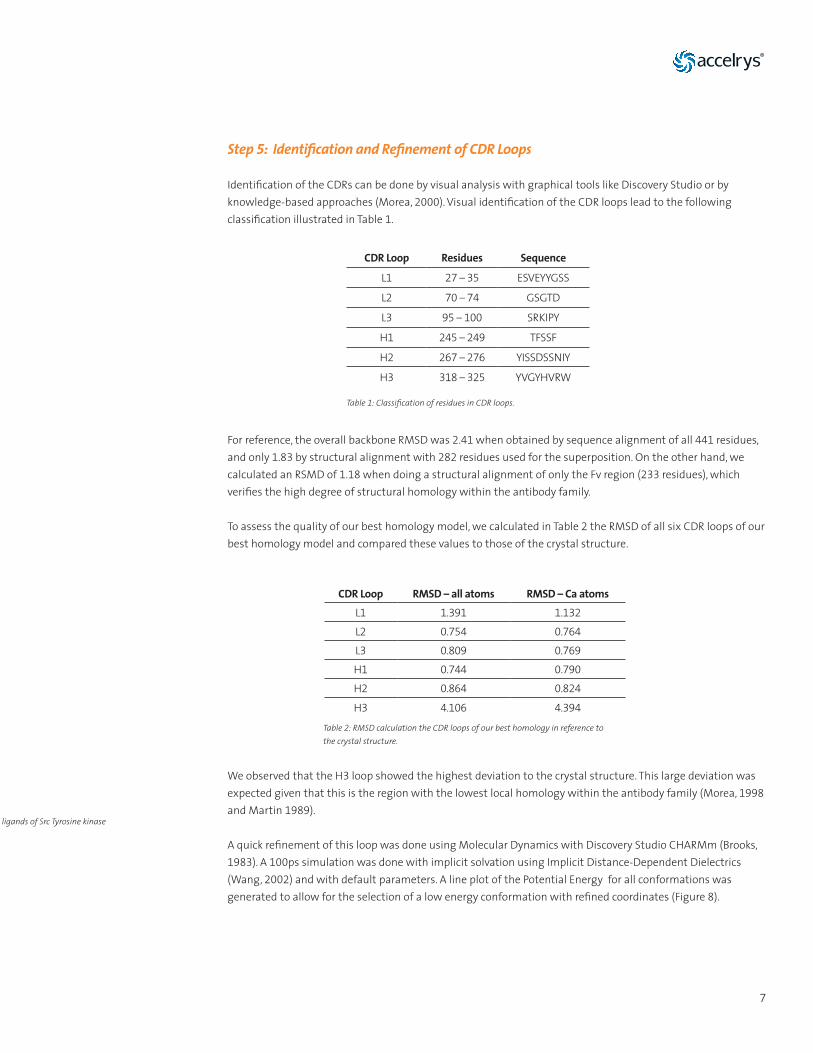
A quick refinement of this loop was done using Molecular Dynamics with Discovery Studio CHARMm (Brooks, 1983). A 100ps simulation was done with implicit solvation using Implicit Distance-Dependent Dielectrics (Wang, 2002) and with default parameters. A line plot of the Potential Energy for all conformations was generated to allow for the selection of a low energy conformation with refined coordinates (Figure 8).
8
After the simulation, we calculated an RMSD of 3.50 for the backbone atoms, and 3.69 for the C-alpha atoms. By performing a relatively quick molecular simulation experiment, we were able to improve the RMSD of our loop by about 0.6.
Table 3: All atom RMSD comparison of the pre and post-refined H3 CDR loop. Performing Molecular Dynamics is able to have a significant improvement on the initial loop conformation.
Discovery Studio offers other methods that may be used for the refinement of the loops, including use of the LOOPER algorithm (Spassov, 2006), MODELER’s Loop refinement protocol, Simulated Annealing, and extended Molecular Dynamics. Preliminary results using these methods did not show a significant improvement of the loop conformation. However a more extensive analysis is underway to better understand in which scenario it is effective to use the refinement methods mentioned above.
Step 6: Additional Analysis
Additional analysis of a newly built homology model may include various calculations for assessing model quality. For example, a Ramachandran plot may be calculated to verify the distribution of phi and psi angles of peptides in the structure. High-quality structures are expected to have most residues in the allowable regions of the plot (Ramachandran, 1955). Figure 9a shows that all of the residues except for glycines and N-terminus and C-terminus residues, do fall within the allowable regions of the plot. This is a good indication that no obvious structural violations are present in the model.
Fig. 8: Line plot of the Potential Energy of 100 conformations for a 100ps CHARMm simulation. In this plot the lowest energy conformation was for conformation 62.
CDR Loop RMSD – all atoms Post refinedRMSD – all atoms
H3 �.11 3.50
9
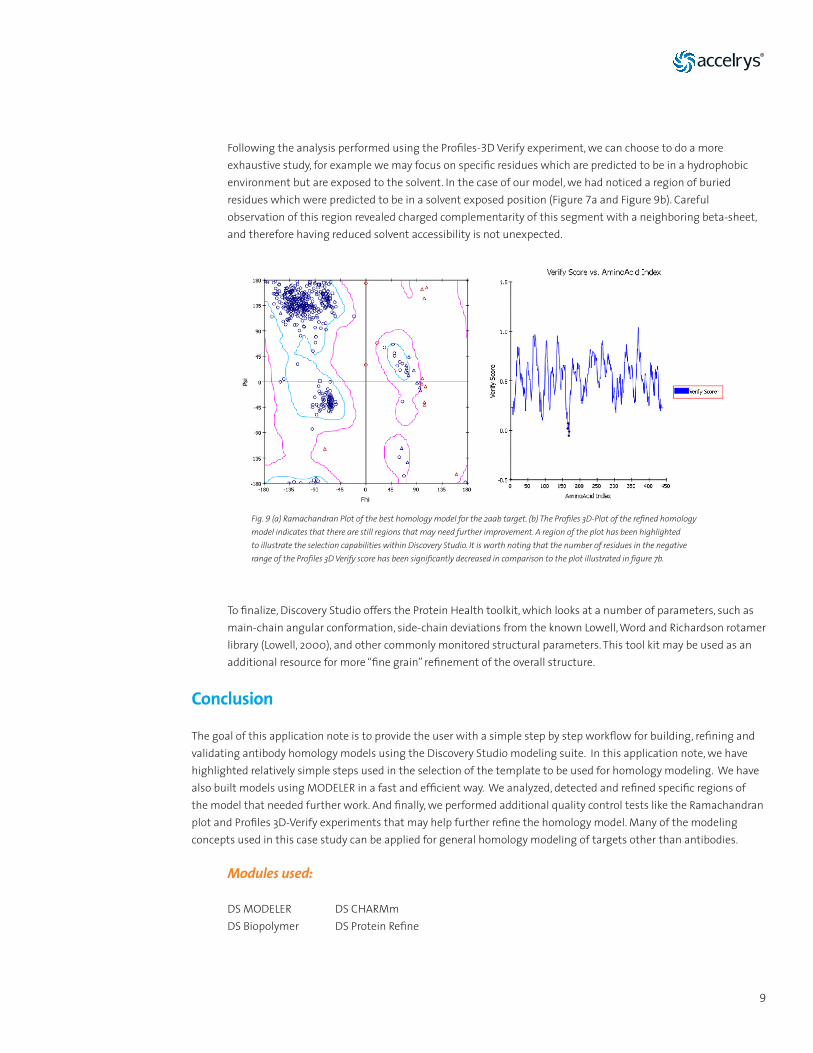
Following the analysis performed using the Profiles-3D Verify experiment, we can choose to do a more exhaustive study, for example we may focus on specific residues which are predicted to be in a hydrophobic environment but are exposed to the solvent. In the case of our model, we had noticed a region of buried residues which were predicted to be in a solvent exposed position (Figure 7a and Figure 9b). Careful observation of this region revealed charged complementarity of this segment with a neighboring beta-sheet, and therefore having reduced solvent accessibility is not unexpected.
Fig. 9 (a) Ramachandran Plot of the best homology model for the 2aab target. (b) The Profiles 3D-Plot of the refined homology model indicates that there are still regions that may need further improvement. A region of the plot has been highlighted to illustrate the selection capabilities within Discovery Studio. It is worth noting that the number of residues in the negative range of the Profiles 3D Verify score has been significantly decreased in comparison to the plot illustrated in figure 7b.
To finalize, Discovery Studio offers the Protein Health toolkit, which looks at a number of parameters, such as main-chain angular conformation, side-chain deviations from the known Lowell, Word and Richardson rotamer library (Lowell, 2000), and other commonly monitored structural parameters. This tool kit may be used as an additional resource for more “fine grain” refinement of the overall structure.
Conclusion
The goal of this application note is to provide the user with a simple step by step workflow for building, refining and validating antibody homology models using the Discovery Studio modeling suite. In this application note, we have highlighted relatively simple steps used in the selection of the template to be used for homology modeling. We have also built models using MODELER in a fast and efficient way. We analyzed, detected and refined specific regions of the model that needed further work. And finally, we performed additional quality control tests like the Ramachandran plot and Profiles 3D-Verify experiments that may help further refine the homology model. Many of the modeling concepts used in this case study can be applied for general homology modeling of targets other than antibodies.
Modules used:
DS MODELER DS CHARMmDS Biopolymer DS Protein Refine
10
References
Al-Lazikani, B., Chothia, C., Lesk, A. M.,“Standard conformations for the canonical structures of immunoglobulins,” J. Mol. Biol., 1997, 273(4), 927.Brooks,B.R.,Bruccoleri,R.E.,Olafson,B.D.,States,D.J.,Swaminathan,S.,and Karplus,M.,“CHARMM:A program for macromolecular energy,minimization, and dynamics calculations,” J. Comput.Chem., 1983, 4, 187-217.Chang, C., Hernandez-Guzman, F.G., Luo, W., Wang, X., Ferrone, S., Ghosh, D., “Structural basis of antigen mimicry in a clinical relevant melanoma antigen system.”, J. Biol. Chem., 2005, 280, �15�6 – �1552. Chothia, C. and Lesk, A.M.,“Canonical structures for the hypervariable loops of immunoglobulins,”J.Mol.Biol.,1987,196,901.Chothia, C., Lesk, A.M., Tramontano, A., Levitt, M., Smith-Gill, S.J., Air, G., et al., “ Conformations of immunoglobulin hypervariable regions, ”Nature, 1989, 342, 877.Edwards, D.J., Hubbard, R.E.,and Brady, R.L.,“Homology Modeling of Antibody Combining Sites,”ImmunoMethods,1992,1,71.Eswar, N., Eramian, D., Webb, B., Shen, M., Sali. A. Protein Structure Modeling With MODELLER. in press, 2006.Imai, K. and Takaoka, A., “Comparing antibody and small-molecule therapies for cancer,” Nature Reviews Cancer, 2006, 6, 71� – 727.Kabat, E. A., Wu,T.T., Bilofsky, H., Reid-Milner, M., and Perry, H., “Sequences of Proteins of Immunological Interest,”1983, Public Health Service, NIH,Washington, DC.Lescar, J., Stouracova, R., Riottot, M.M., Chitarra, V., Brynda, J., Fabry, M., Horejsi, M., Sedlacek, J., Bentley, G.A. “ Three-dimensional structure of an Fab-peptide complex: structural basis of HIV-1 protease inhibition by a monoclonal antibody,” J. Mol. Biol., 1997, 267, 1207-1222Lowell, S., Word, J.M., Richardson, J., Richardson, D., Proteins: Structure, Function and Genetics, 2000, 40, 389 – �08.LÜTHY, R., BOWIE, J., EISENBERG, D., “Assessment of protein models with three-dimensional profiles,” Nature, 1992, 356, 83 – 85.Martin, A. C. R., Cheetham, J. C., and Rees, A. R.,“Modelling antibody hypervariable loops: a combined algorithm,” Proc. Natl. Acad. Sci. USA, 1989, 86, 9268.Morea, V., Tramontano, A., Rustici,M., Chothia, C.,and Lesk, A. M.,“Conformation of the third hypervariable region in the Vh domain of antibodies,” J. Mol. Biol., 1998, 275, 269.Morea, V., Lesk, A., and Tramontano, A. “Antibody Modeling: Implications for Engineering and Design,” METHODS, 2000, 20, 267.Ramachandran, G.N. and Kartha, G., Nature, 1955, 176, 593 – 59�.Sali, A., Pottertone, L., Yuan, F., van Vlijmen, H., and Karplus, M., “Evaluation of comparative protein modeling by MODELLER,” Proteins, 1995, 23, 318.Spassov, V., Yan, L. and Flook, P. “The Dominant Role of Side-chain Backbone Interactions in Structural Realization of Amino-acid Code. ChiRotor: a Side-chain Prediction Algorithm Based on Side-chain Backbone Interactions,” Protein Science, 2007Wang, T., Wade, R., “Implicit solvent models for flexible protein-protein docking by molecular dynamics simulation,” Proteins: Structure, Function and Genetics, 2002, 50, 158 – 169.
1.
2.
3.
�.5.
6.7.8.9.
10.
11.12.13.
1�.
15.16.17.
18.
19.