anticipated environmental impacts & mitigation · pdf filenticipated environmental impacts...
TRANSCRIPT
Chapter 4
Anticipated Environmental Impacts & Mitigation Measures
The predictions of impacts and mitigation measures have been assessed
in the following four sections:
Section –I: Assessment and prediction of impacts due to proposed
nuclear power park at Jaitapur.
Section –II: Radiological Risk Assessment & Emergency Response
System
Section –III: The assessment and prediction of impacts under Coastal
Regulation Zone (CRZ) for the proposed nuclear power park
at Jaitapur
Section –IV: Assessment of Irreversible and Irretrievable Impacts and
Significant Impacts
Section -I
The impacts on environment due to activities of the proposed project could
be broadly divided into two parts as discussed in the chapter-1: -
1) Impact during project construction phase
2) Impact during operation phase of the project

Chapter 4: Anticipated Environmental Impact And Mitigation Measures
National Environmental
Engineering Research
Institute
328
3) Impact during decommissioning phase of the project
4.1 Impacts Assessment during Project Construction Phase
The construction of nuclear power plant of proposed magnitude would
require large input from civil, mechanical aspects including transport, labour etc. The
construction activity will be carried out over rocky barren area with basaltic rock upto
20 m depth.
4.1.1 Positive Impact on Landscape
There will be positive impact on existing landscape due to proper planning
for landscaping, development of roads with avenue trees and green belt development
around the project building making the landscape beautiful with lush green cover.
4.1.2 Impact Assessment for SPM arising out of Construction Activities
Fugitive Dust Model (FDM) Impact on air due to engine exhausts and emission of dust as a result of
temporary increase in number of transport vehicles and operation of heavy vehicles
for transport of construction material and machinery and loading / unloading
operations is envisaged. Fugitive Dust Model (FDM) is used to predict the ground
level concentrations (GLCs) during construction activities.
Fugitive Dust Model (FDM) is used for predictions due to construction
operations. The impact on air quality due to emissions from single source or a group
of sources is evaluated by use of mathematical models. When air pollutants are
emitted into the atmosphere, they are immediately diffused into surrounding
atmosphere, transported and diluted due to winds. The air quality models are
designed to simulate these processes mathematically and to relate emissions of
primary pollutants to the resulting downwind air quality. The inputs include emissions,
meteorology and surrounding topographic details to predict the impacts of
conservative pollutants.
The Fugitive Dust Model (FDM) is a computerized air quality model
specifically designed for computing concentration and deposition impacts due to
fugitive dust sources. The sources may be point, line or area sources. The model has
not been designed to compute the impacts of buoyant point sources, thus it contains
no plume-rise algorithm. The model is generally based on the well-known

Chapter 4: Anticipated Environmental Impact And Mitigation Measures
National Environmental
Engineering Research
Institute
329
Gaussian Plume formulation for computing concentrations, but the model has been
specifically adapted to incorporate an improved gradient-transfer deposition
algorithm. Emissions for each source are apportioned by the user into a series of
particle size classes. A gravitational setting velocity and a deposition velocity are
calculated by FDM for each class. Concentration and deposition are computed at all
user-selectable receptor locations. It should be noted that while FDM has the
capability of treating 500 receptors, POSTZ can only accept 200 receptors, thus long-
term sequential uses of FDM should carefully consider the number of receptors to be
used.
The sources can be of three types: points, lines or areas. The line source
and area source algorithms are based on algorithms in the CALINE3 Model
(California Department of Transportation, 1979). For area sources, the user supplies
the coordinates of the center and the dimension in the x and y directions. Area
sources need not be square, but rather can be rectangular, up to an aspect ratio of 1
to 5 (ratio of width to length). Area sources with the length greater than five times the
width must be divided in a series of area sources, or modeled as a line source. The
model divides the area source into a series of line sources perpendicular to the wind
direction. Emissions from all sources may be divided into a maximum of 20 particle
size classes.
Prediction of Impacts due to Construction Activities Following operations are considered during construction: Drilling, Blasting,
Dozing, Loading trucks, Unloading trucks, loading & unloading of Quarry waste,
Dumps, Active waste dumps, Haul road dust etc. Emission factors for different
operations estimated as per USEPA Emission estimation manual. Fugitive Dust
Model (FDM) is used for predictions due to construction operations. Maximum
incremental GLC of SPM due to construction activities at project site is predicted to
be 37 µg/m3 which is within NAAQS for residential/industrial areas.
Reduced level emissions were predicted considering water sprinkling and
wind breaking by green belts as a mitigation measure of environmental management
plan. Efficiency of control methods is considered as per the USEPA standards for
emission factors. With proper EMP, maximum incremental GLC of SPM due to
construction activities at project site is found to be 15 µg/m3. There will be a decrease
of more than 50% of SPM concentration after employing control methods at various
activities within the study area.
Chapter 4: Anticipated Environmental Impact And Mitigation Measures
National Environmental
Engineering Research
Institute
330
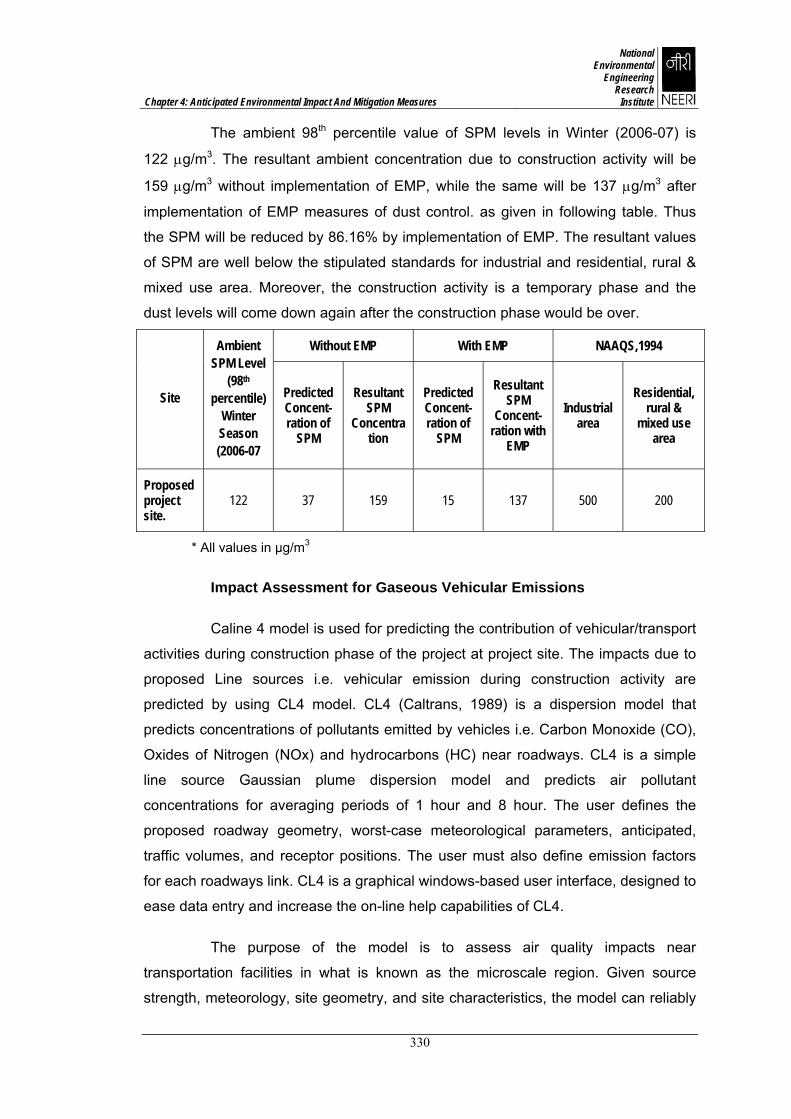
The ambient 98th percentile value of SPM levels in Winter (2006-07) is
122 µg/m3. The resultant ambient concentration due to construction activity will be
159 µg/m3 without implementation of EMP, while the same will be 137 µg/m3 after
implementation of EMP measures of dust control. as given in following table. Thus
the SPM will be reduced by 86.16% by implementation of EMP. The resultant values
of SPM are well below the stipulated standards for industrial and residential, rural &
mixed use area. Moreover, the construction activity is a temporary phase and the
dust levels will come down again after the construction phase would be over.
Without EMP With EMP NAAQS,1994
Site
Ambient SPM Level
(98th percentile)
Winter Season (2006-07
Predicted Concent-ration of
SPM
Resultant SPM
Concentration
Predicted Concent-ration of
SPM
Resultant SPM
Concent-ration with
EMP
Industrial area
Residential, rural &
mixed use area
Proposed project site.
122 37 159 15 137 500 200
* All values in µg/m3
Impact Assessment for Gaseous Vehicular Emissions
Caline 4 model is used for predicting the contribution of vehicular/transport
activities during construction phase of the project at project site. The impacts due to
proposed Line sources i.e. vehicular emission during construction activity are
predicted by using CL4 model. CL4 (Caltrans, 1989) is a dispersion model that
predicts concentrations of pollutants emitted by vehicles i.e. Carbon Monoxide (CO),
Oxides of Nitrogen (NOx) and hydrocarbons (HC) near roadways. CL4 is a simple
line source Gaussian plume dispersion model and predicts air pollutant
concentrations for averaging periods of 1 hour and 8 hour. The user defines the
proposed roadway geometry, worst-case meteorological parameters, anticipated,
traffic volumes, and receptor positions. The user must also define emission factors
for each roadways link. CL4 is a graphical windows-based user interface, designed to
ease data entry and increase the on-line help capabilities of CL4.
The purpose of the model is to assess air quality impacts near
transportation facilities in what is known as the microscale region. Given source
strength, meteorology, site geometry, and site characteristics, the model can reliably

Chapter 4: Anticipated Environmental Impact And Mitigation Measures
National Environmental
Engineering Research
Institute
331
predict pollutant concentrations for receptors located within 500 meters of the
roadways.
In this modeling exercise, 8 hourly concentrations of CO, NOx, are
predicted for the duration 10-17 Hrs, 18-01 Hrs and 02-09 Hrs.
CL4 divides individual highway links into a series of elements from which
incremental concentration are computed and then summed to form a total
concentration estimate for a particular receptor location. The receptor distance is
measured along a perpendicular from the reactor to the roadway centerline. The first
element is formed at this point as a square with sides equal to the line source width.
Thus, as element resolution becomes less important with distance from the
receptor, elements become larger to permit efficiency in computation. The choice of
the element growth factor as a function of roadway-wind angle (PHI) range
represents a good compromise between accuracy and computational efficiency.
Finer initial element resolution is unwarranted because the vertical dispersion curves
used by CL4 have been calibrated for the link half – width (W2) distance from the
element center point.
Each element is modeled as an “equivalent” finite line source (EFLS)
positioned normal to the wind direction and centered at the element midpoint. A local
x-y coordinate system aligned with the wind direction and originating at the element
midpoint is defined for each element. The emissions occurring within an element are
assumed to be released along the EFLS representing the element. The emissions
are then assumed to disperse in a Gaussian manner downwind from the element.
The length and orientation of the EFLS are functions of the element size and the
angle (PHI, φ) between the average wind direction and highway alignment. Values of
PHI = 0 or PHI = 90 degrees are altered within the program an insignificant amount
to avoid division by zero during the FELS trigonometric computations.
CL4 treats the region directly over the highway as a zone of uniform
emissions and turbulence. This is designated as the mixing zone, and is defined as
the region over the traveled way (traffic lanes – not including shoulders) plus three
meters on either side. The additional width accounts for the initial horizontal
dispersion imparted to pollutants by the vehicle wake effect. Within the mixing zone,
Chapter 4: Anticipated Environmental Impact And Mitigation Measures
National Environmental
Engineering Research
Institute
332
the mechanical turbulence created by moving vehicles and the thermal turbulence
created by hot vehicle exhaust is assumed to predominate near the ground.
Prediction of Impacts Following vehicles movement is considered for impact due to vehicular
emissions: Trucks – 125; Excavator – 2; Loaders – 6; Drills – 3; Water Tanks – 3;
Jeeps – 5; Dozer – 2; Grader – 1. Diesel is the main fuel used in these vehicles. US
EPA emission factors are used for computing the pollutant emission rates. Prediction
of impacts for CO and NOx was made on 8 hourly bases up to a distance of 500 m on
either side of the roads of project site.
The GLCs of CO and NOx are found to be less than 10 µg/m3 and 5 µg/m3
respectively. Thus, there is no significant impact due to vehicular emissions within
the study area against stipulated standards of 80 µg/m3 and 2000 µg/m3 for NOx and
CO respectively. The background concentration of NOx at project site is 8 µg/m3, so
resultant concentration of NOx would be 13 µg/m3 which is well below the stipulated
standards (MoEF, 2009).
Impact due to Noise Pollution during Construction Phase
The movement of heavy vehicles and machinery and construction activity
may contribute to noise pollution during construction phase. There will be impact of
noise on construction workers, however the village people will not be affected due to
long distance between plant and village.
Mitigation Measures
The machinery, vehicles (all types), blasting and construction activity may
contribute to the noise level in the area for on-site workers, who will be provided
noise protective ear muffs in high noise level zone. The green belt will be developed
in exclusion zone in construction phase which will act as barrier to noise and dust
generated during construction. The nearest village is at 2 km distance for the project
site and the noise levels reaching the village will be very low and the impact due to
above will be insignificant.
The regular maintenance and up keeping of construction machinery, heavy
vehicles, dumpers, and trucks will be helpful in reducing gaseous emissions and
noise. On site workers near noise producing source shall be provided ear muffs and
the workers near construction site will be provided with helmets. The depth, charge
and the matrix of the holes, delaying and decking of shots for blasting will be
optimized to minimize and noise.
Chapter 4: Anticipated Environmental Impact And Mitigation Measures
National Environmental
Engineering Research
Institute
333
4.1.3 Impact on Environmental Sanitation
Temporary labour colonies, if not properly planned, may create
environmental pollution, unsanitary conditions and health problems.
Mitigation Measures
The temporary labour colonies with adequate sanitary measures will be
planned to minimize pollution of soil, water and public health problems.
4.1.4 Impact of Construction Activity on Coastal Ecology
The whole project site is plain rocky land with Basaltic rock available at a
depth of about 20 m from the ground surface. The overburden will be mostly in the
form of rock pieces, boulders etc. This will result in insignificant amount of turbidity in
coastal water which will be diluted rapidly due to northward or southward currents of
sea water during the year.
As the coastal area is poor in biodiversity and no sensitive habitat is
present in coastal water, the biological impact will be insignificant.
Limited dredging will be carried out for maneuvering of small ships and
barges at RoRo jetty and for laying down underground CCW discharge channels.
Inter tidal habitat area is too narrow near the project site due to elevated
rocky land for marine organisms to develop leading to low biodiversity of benthic
fauna, Low fish catch, except presence of a few sea weeds. Biodiversity is better on
northern and southern direction away from the project site (Vol II EIA Report, Annexure-VIII). Thus due to activities during construction phase in CRZ would not affect
coastal ecology.
The patches of mangrove flora is present at a distance of 5-6 km from the
project site in the estuary of Kodavali River. The estuary is far away from site and will not
be affected in any way by the project activity.
Mitigation Measures
The whole quantity of rocky overburden will be utilized for leveling of land
in project area as well as in the construction of the project and break water structure.
The overburden will be securely stored till it will be utilized as construction material.

Chapter 4: Anticipated Environmental Impact And Mitigation Measures
National Environmental
Engineering Research
Institute
334
The dredged sediment material will also be utilized in construction as well
as for land filling and excess silt will be disposed off in deep sea.
The construction of water intake structure and proposed Jetty will be carried
out by specialized engineering technology which does not produce turbidity in the coastal
waters and marine flora, fauna and fisheries would not be affected.
Though, the patches of mangrove flora is present at a distance of 5-6 km from
the project site, they will not be affected by the project activity, yet, special efforts will be
made for the conservation and propagation of mangrove vegetation at suitable sites
around the project area.
4.1.5 Impact of Construction and Operation of Jetty
As mentioned that the coastal area around the project site is not very
productive and devoid of presence of any sensitive species. The proposed jetty,
which will be of very small in size and will be situated inside the breakwater wall,
therefore, Construction of Jetty will not have any adverse impact on the coastal
environment. Moreover, the jetty, which will be used occasionally, will provide safe
habitat for the marine organism in long span of time.
Small ships and barges will visit the site during construction period only to
carry the imported instruments and equipments and will not be a continuous shipping
activity and may not have impact on the coastal environment.
4.1.6 Impact of Construction on Sea Water Currents
As per the study carried out by CWPRS, the flow in the open sea near
project site is unidirectional, either northerly or southerly. During non-monsoon period
(March-May) and SW monsoon period (June-September), the flow is southward while
during NE monsoon period (November-January), the flow is northward. In October-
February, the flow is in transition.
The seaward boundary of the project construction is well aligned with the
existing shoreline. Moreover, the discharge canals for disposal of condenser cooling
water will be underground. Therefore, the project structures will put minimum
resistance to the ocean currents which are parallel to the coast.

Chapter 4: Anticipated Environmental Impact And Mitigation Measures
National Environmental
Engineering Research
Institute
335
4.1.7 Impact Assessment due to Radiological Releases during Project Construction Phase
There will not be any radiological releases during the first phase of the twin
unit construction of JNPP. Therefore, there will not be any impact on the environment
due to radiological parameters during construction of the first phase of JNPP.
However, during second & third phase of the twin unit construction, the first phase
twin units and second phase twin units, already constructed will be under operation
and hence will have radiological impact which has been described in the
Section 4.2.1.3, 4.2.2.2 and 4.3.2.2.
4.1.8 Improvement of Communication Facilities
During construction phase, the infrastructural facilities like roads,
telephone, public transport will be improved in the area.
4.1.9 Availability of Direct Employment
Many local people including youths, contractors and small entrepreneurs
would get direct / indirect employment during construction phase.
4.2 Impacts during Project Operation Phase
This section describes the environmental impact, considering phased
construction and operation of all the six units of 1650 MWe in twin unit mode
4.2.1 Air Environment
The Air Environment will have impact due to conventional Air Pollutants
and Radioactive Pollutants.
4.2.1.1 Impact Assessment due to Conventional Air Pollutants
As such, there is no possibility of emission of conventional air pollutants
from nuclear power plants except during construction phase. Hence, the impacts of
the proposed nuclear power plant on ambient air quality due to conventional air
pollutants in that region will be insignificant. There will be marginal increase in
conventional air pollutants levels due to increase in vehicular traffic and urbanization,
which can be attributed to indirect impacts of the project in that region. However,
these concentrations shall be within the prescribed limits of CPCB / MPCB as the

Chapter 4: Anticipated Environmental Impact And Mitigation Measures
National Environmental
Engineering Research
Institute
336
proposed nuclear power project is not the source of conventional air pollution and
present levels of conventional air pollutants are very low.
4.2.1.2 Prediction of Impacts of DG sets
There are two Diesel Buildings (DBs), each house two Emergency Diesel
Generators (EDGs) and one Station Black Out (SBO) Diesel Generator sets along
with their diesel fuel storage tanks. Each DB houses two DGs of 1000 KVA (DB1-
DG1 & DB1-DG2 in DB1 and DB2-DG1 & DB2-DG2 in DB2) and one DG of 7000
KVA (DB1-DG3 and DB2-DG3) rating. These two diesel buildings are located on
opposite sides of the plant, providing physical separation for protection against
external hazards. Each DB contain two redundant trains comprised of the main diesel
generators for emergency power supply and one SBO diesel generator, fuel storage
tanks (within a dedicated fire compartment), air cooling equipment and roof level
silencer for diesel engines. A common stack of 30 m will be provided to vent out the
flue gases from the DGs of each DB. The stack height is estimated as per MoEF
Notification GSR 489 (E) July, 2002 for estimation of stack height of DG set
depending upon the KVA rating 1000 KVA to 7000 KVA. The diesel consumption will
be from 270 to 1900 litres/hr depending on KVA rating and test run of DG is carried
out for one hour once in a week.
In order to predict impacts on ambient air quality due to DG sets operation
on regular and emergency basis proposed at JNPP site, data on emission scenario
and micrometeorology data collected by NEERI and along with historical data
collected from India Meteorology Department (IMD) were used to predict Ground
Level Concentrations (GLCs) of SO2, NOx and SPM.
Micro Meteorology
The hourly wind speed, solar insulation and cloudiness during the day
whereas in the night, wind speed and cloudiness parameters were used to determine
the hourly atmospheric stability Class A to F (Pasquill and Gifford).
The hourly stabilities were determined based on the technique suggested
by Turner. Turner’s system used for determining the stability classes is as follows:
For day or night: If total cloud cover (TC) = 10/10 and ceiling <7000 ft
NR=0
Chapter 4: Anticipated Environmental Impact And Mitigation Measures
National Environmental
Engineering Research
Institute
337
For night-time (defined as period from one hour before sunset to one hour
after sunrise):
a) If TC<4/10, use NR = -2
b) If TC>4/10, use NR = -1
For day time: Determine insulation class number (IN)
a) If TC<5/10, use NR=IN
b) If TC>5/10, modify IN by the sum of the following applicable criteria
If ceiling<7000 ft (2134m), modification = -2
If ceiling>7000 ft but <16000 ft (4877 m), modification = -1
If TC=10/10 and ceiling>7000 ft, modification = -1, and let modified value of
IN=NR, except for day-time NR cannot be <+1
During winter winds were recorded from N, WNW, NE and E directions,
thereby, projecting the impact zone in S-SSE-SSW sector with respect to the location
of DG sets in JNPP site. Winds are found to be between 6-15 kmph from N; 6 – 10
kmph from NE and E during the 24 hours period. Calm winds are observed to be
about 16.7% during the study period on 24 hourly basis (Fig. 3.5.4 of Chapter 3 in
this report). The air quality model is run with hourly data of wind speed, wind
direction, temperature, atmospheric stability and mixing height of the study period.
The representative mean seasonal meteorological data are presented in tabular
form.
SCREEN3 – Model Description
SCREEN3 is a screening model based on Gaussian plume modeling
approach and is similar to ISCST3 model except for the meteorological data.
SCREEN3 considers a meteorological matrix of different wind speed along with
atmospheric stability classes and possible wind directions. This model is used for
estimating pollutant impacts due to worst case meteorological conditions.

Chapter 4: Anticipated Environmental Impact And Mitigation Measures
National Environmental
Engineering Research
Institute
338
ISCST3 - Model Description
The impact on air quality due to emissions from single source or group of
sources is evaluated by use of mathematical models. When air pollutants are emitted
into the atmosphere, they are immediately diffused into surrounding atmosphere,
transported and diluted due to winds. The air quality models are designed to simulate
these processes mathematically and to relate emissions of primary pollutants to the
resulting downwind air. The inputs needed for model development are emission load
and nature, meteorology and topographic features, to predict the GLCs.
The Industrial Source Complex – Short Term Version 3 (ISCST-3) models has been developed to simulate the effect of emissions from the point
sources on air quality. The ISCST-3 model was adopted from the USEPA guidelines
which are routinely used as a regulatory model to simulate plume dispersion and
transport from and up to 100 point sources and 20000 receptors. ISCST–3 is
extensively used for predicting the Ground Level Concentrations (GLCs) of
conservative pollutants from point, area and volume sources. The impacts of
conservative pollutants were predicted using this air quality model keeping in view
the plain terrain at and around the project site. The micrometeorological data
monitored at project site during study period have been used in this model.
The ISCST-3 model is, an hour-by-hour steady state Gaussian model
which takes into account the following:
- Terrain adjustments
- Stack-tip downwash
- Gradual plume rise
- Buoyancy-induced dispersion
- Complex terrain treatment and consideration of partial reflection
- Plume reflection off elevated terrain
- Building downwash
- Partial penetration of elevated inversions
- Hourly source emission rate, exit velocity, and stack gas temperature
The ISCST-3 model, thus, provides estimates of pollutant concentrations
at various receptor locations.

Chapter 4: Anticipated Environmental Impact And Mitigation Measures
National Environmental
Engineering Research
Institute
339
The ISC short term model for stacks uses the steady-state Gaussian
plume equation for a continuous elevated source. For each source and each hour,
the origin of the source's coordinate system is placed at the ground surface at the
base of the stack. The x axis is positive in the downwind direction, the y axis is
crosswind (normal) to the x axis and the z axis extends vertically. The fixed receptor
locations are converted to each source's coordinate system for each hourly
concentration calculation. The hourly concentrations calculated for each source at
each receptor are summed to obtain the total concentration produced at each
receptor by the combined source emissions.
For a steady-state Gaussian plume, the hourly concentration at downwind
distance x (meters) and crosswind distance y (meters) is given by:
……..(4.1)
Where:
Q = pollutant emission rate (mass per unit time)
K = a scaling coefficient to convert calculated concentrations to
desired units
V = vertical term
D = decay term
σy,σz = standard deviation of lateral and vertical concentration
distribution (m)
us = mean wind speed (m/s) at release height
Equation (1) includes a Vertical Term (V), a Decay Term (D), and
dispersion parameters (σy and σz). It should be noted that the Vertical Term includes
the effects of source elevation, receptor elevation, plume rise, limited mixing in the
vertical, and the gravitational settling and dry deposition of particulates (with
diameters greater than about 0.1 microns).
The ISC model uses either a polar or a Cartesian receptor network as
specified by the user. The model allows for the use of both types of receptors and for
multiple networks in a single run. All receptor points are converted to Cartesian (X,Y)
coordinates prior to performing the dispersion calculations. In the Cartesian
⎥⎥⎦
⎤
⎢⎢⎣
⎡−= 2
yZYS
)σy( 0.5 exp
SSU2QKVD ionConcentratπ

Chapter 4: Anticipated Environmental Impact And Mitigation Measures
National Environmental
Engineering Research
Institute
340
coordinate system, the X axis is positive to the east of the user-specified origin and
the Y axis is positive to the north.
The Vertical Term (V), which is included in the Equation, accounts for the
vertical distribution of the Gaussian plume. It includes the effects of source elevation,
receptor elevation, plume rise, limited mixing in the vertical, and the gravitational
settling and dry deposition of particulates. In addition to the plume height, receptor
height and mixing height, the computation of the Vertical Term requires the vertical
dispersion parameter (σz).
Prediction of Impacts
SCREEN3 and ISCST3 models are used to predict the ground level
concentrations (GLCs) of criteria pollutants: SO2, NOx and SPM that are emitted
from the DG sets during winter season. Prediction of GLCs has been carried for
three scenarios of DG sets operations: (i) one hour operation for testing regularly in
one week (DB1-DG1/DB1-DG2, DB1-DG3, DB1-DG1+DB1-DG2+DB1-DG3), (ii)
emergency operation for 24 hours (DB1-DG3+DB2-DG3) and (iii) emergency
operation of all DG sets (DB1-DG1+DB1-DG2+DB1-DG3+DB2-DG1+DB2-
DG2+DB2-DG3). Sulphur content of diesel fuel is taken as 2% by weight in
estimating the SO2 emission rates. Emission rates of SPM are computed assuming
the DG sets will be following norms of 50 ppm for particulate matter emissions for DG
sets. The emissions of SO2, NOx and SPM along with stack details, such as stack
height, stack internal diameter, stack gas exit velocity and stack gas exit
temperature, are given in Table 4.1. The meteorological data for winter season used
in prediction of GLCs is given in Table 4.2.
Prediction of GLCs under Different Scenarios
(i) One hour operation for testing regularly in one week (DB1-DG1/DB1-DG2, DB1-DG3, DB1-DG1+DB1-DG2+DB1-DG3)
SCREEN3 model is used predict the one hour concentrations of SO2, NOx
and SPM from each DG set in DB1 when operated for one hour as a regular testing
measure. The predicted GLCs are given Table 4.3. It is observed that one hour
concentrations of SPM are very low and negligible even all DGs are tested parallelly.
The GLCs of SO2 and NOx are found to be low when DGs of 1000 KVA are

Chapter 4: Anticipated Environmental Impact And Mitigation Measures
National Environmental
Engineering Research
Institute
341
operated, whereas the GLCs are high when DGs of 7000 KVA are operated. The
total concentrations (one hourly) when all three DGs in one DB are operated are
found to be 123 µg/m3 for SO2, 131 µg/m3 for NOx and 4.6 µg/m3 for SPM. These are
found to be well within the NAAQS for residential areas when converted to 24 hourly
averages viz. SPM 0.192 µg/m3, SO2 5.125 µg/m3 and NOx 6.46 µg/m3. Same
concentrations can be attributed to DG sets in DB2.
(ii) Emergency operation for 24 hours (DB1-DG3+DB2-DG3)
ISCST3 model is used to predict the GLCs due to emergency operations of
two 7000 KVA DGs (DB1-DG3+DB2-DG3) that are operated for 24 hours. The
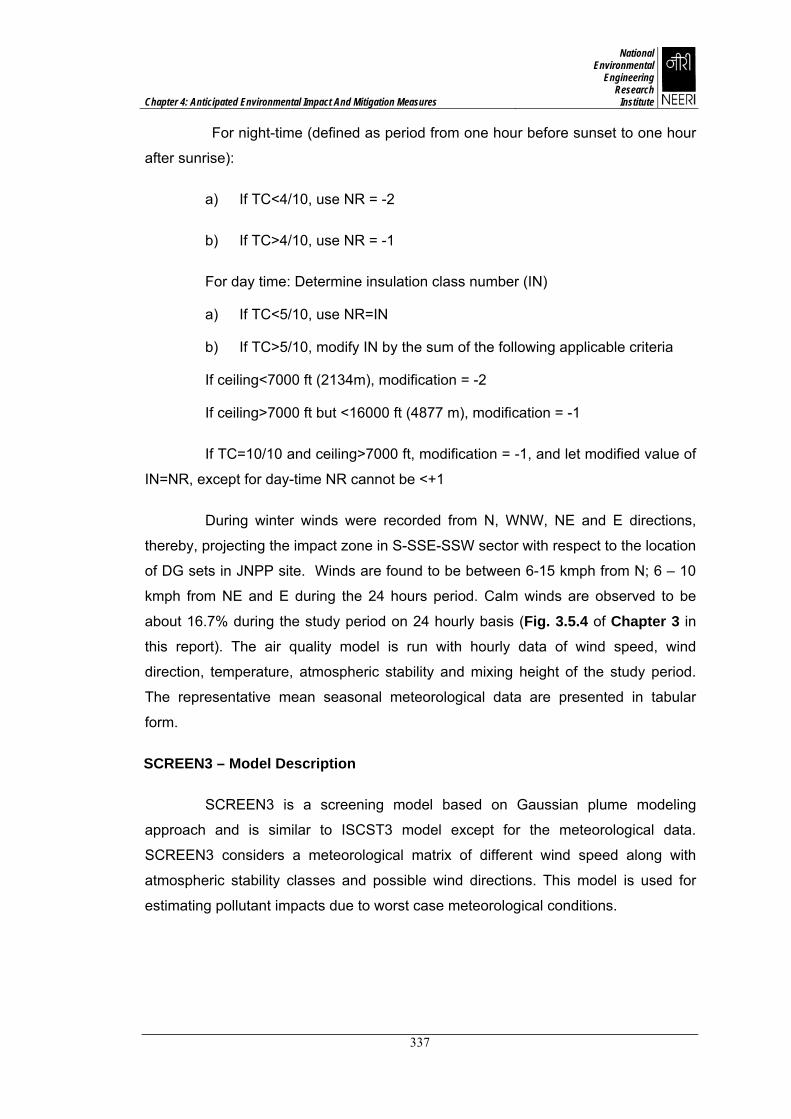
predicted GLCs are shown in the form of isopleths in Fig. 4.1 to 4.3. It is observed
that the GLCs of SO2, NOx and SPM are found to be 19.6 µg/m3, 20.84 µg/m3 and
0.72 µg/m3 occurring at a distance of 1.1 Km in SSE direction. These are very well
within NAAQS for residential areas.
(iii) Emergency operation of all DG sets (DB1-DG1+DB1-DG2+DB1-DG3+DB2-DG1+DB2-DG2+DB2-DG3)
ISCST3 model is used to predict the GLCs due to emergency operations of
all six (DB1-DG1+DB1-DG2+DB1-DG3+DB2-DG1+DB2-DG2+DB2-DG3) are perated
for 24 hours. The predicted GLCs are shown in the form of isopleths in Fig. 4.4 – 4.6.
It is observed that the GLCs of SO2, NOx and SPM are found to be 25.2 µg/m3, 26.8
µg/m3 and 0.93 µg/m3 occurring at a distance of 1.1 Km in SSE direction. These are
very well within NAAQS for residential areas.
The results of all the three scenarios are summarized in following table.
SPM SO2 NOx Different Scenarios
Different Scenarios of operation µg/m3
Remarks
Ambient Concentrations 122.00 7.00 12.00
Scenario i
Incremental concentration due to Weekly One hour operation of all DGs for regular testing
0.192 5.125 5.46
Resultant concentrations 122.192 12.125 17.46 Below
stipulated

Chapter 4: Anticipated Environmental Impact And Mitigation Measures
National Environmental
Engineering Research
Institute
342
SPM SO2 NOx Different Scenarios
Different Scenarios of operation µg/m3
Remarks
standards
Scenario ii
Incremental concentration due to Emergency operation of two 7000 KVA DGs for 24 hours
0.72 19.6 20.84
Resultant concentrations 122.72 26.6 32.84
Below stipulated standards
Scenario iii
Incremental concentration due to Emergency operation of all DG sets for 24 hours
0.93 25.2 26.8
Resultant concentrations 122.93 32.2 38.8
Below stipulated standards
NAAQS for Industrial Area 500 120 120
NAAQS for Residential, Rural & Mixed use Area
200 80 80
From the study it is interpreted that operation of these DG sets on regular
for one hour testing as well as emergency basis for 24 hours will not impact the
ambient air quality of the study area as the GLCs of criteria pollutants are well within
the prescribed NAAQS for residential areas and also their occurrence is within the
plant boundary only.
Chapter 4: Anticipated Environmental Impact And Mitigation Measures
National Environmental
Engineering Research
Institute
343
Project site
Max. GLC = 19.6 µg/m3 at 1.1 Km in SSE direction
Fig.4.1: Incremental GLCs of SO2 due to Emergency Operation of Two DG Sets of 7000 KVA (One DG of 7000 KVA Housed in Each DB) During Winter Season at JNPP

Chapter 4: Anticipated Environmental Impact And Mitigation Measures
National Environmental
Engineering Research
Institute
344
Project site
Max. GLC = 20.84 µg/m3 at 1.1 Km in SSE direction
Fig.4.2 : Incremental GLCs of NOx due to Emergency Operation of Two DG Sets of 7000 KVA (One DG of 7000 KVA Housed in Each DB) During Winter Season at JNPP

Chapter 4: Anticipated Environmental Impact And Mitigation Measures
National Environmental
Engineering Research
Institute
345
Project site
Max. GLC = 0.72 µg/m3 at 1.1 Km in SSE direction
Fig.4.3 : Incremental GLCs of SPM due to Emergency Operation of Two DG Sets of 7000 KVA (One DG of 7000 KVA Housed in Each DB) During Winter Season at JNPP

Chapter 4: Anticipated Environmental Impact And Mitigation Measures
National Environmental
Engineering Research
Institute
346
Project site
Max. GLC = 25.2 µg/m3 at 1.1 Km in SSE direction
Fig.4.4: Incremental GLCs of SO2 due to Emergency Operation of All DG Sets (Two DGs of 1000 KVA and One DG of 7000 KVA Housed in Each DB) During Winter Season at JNPP

Chapter 4: Anticipated Environmental Impact And Mitigation Measures
National Environmental
Engineering Research
Institute
347
Project site
Max. GLC = 26.8 µg/m3 at 1.1 Km in SSE direction
Fig.4.5 : Incremental GLCs of NOx due to Emergency Operation of All DG Sets (Two DGs of 1000 KVA and One DG of 7000 KVA Housed in Each DB) During Winter Season at JNPP

Chapter 4: Anticipated Environmental Impact And Mitigation Measures
National Environmental
Engineering Research
Institute
348
Project site
Max. GLC = 0.93 µg/m3 at 1.1 Km in SSE direction
Fig.4.6: Incremental GLCs of SPM due to Emergency Operation of All DG Sets (Two DGs of 1000 KVA and One DG of 7000 KVA Housed in Each DB) During Winter Season at JNPP

Chapter 4: Anticipated Environmental Impact And Mitigation Measures
National Environmental
Engineering Research
Institute
349
Table 4.1
Stack Emissions of DG Sets along with Details
Emission rate (g/s) Sr.No. Stack Id Capacity
(KVA) h
(m) d
(m) V
(m/s) T (K) SO2 NOx SPM
1 DB1-DG1 1000 30 1.2 20 623 2.44 2.60 0.09
2 DB1-DG2 1000 30 1.2 20 623 2.44 2.60 0.09
3 DB1-DG3 7000 30 1.2 20 623 17.10 18.20 0.63
4 DB2-DG1 1000 30 1.2 20 623 2.44 2.60 0.09
5 DB2-DG2 1000 30 1.2 20 623 2.44 2.60 0.09
6 DB2-DG3 7000 30 1.2 20 623 17.10 18.20 0.63
h – stack height; d – stack internal dimater; V – stack gas exit velocity; T – stack gas exit temperature

Chapter 4: Anticipated Environmental Impact And Mitigation Measures
National Environmental
Engineering Research
Institute
350
Table 4.2
Meteorological Data for Winter Season
Hrs. Wind Direction (deg. From)
Wind Speed (m/s)
Ambient Temp.
(K)
Atmospheric Stability
Class Mixing Height
(m)
1 90 1.6 293.9 5 100 2 90 1.5 293.3 5 100 3 45 1.8 293.3 5 100 4 360 2.5 292.8 5 100 5 360 2.2 292.1 5 100 6 315 1.8 291.0 5 100 7 315 1.5 289.9 3 300 8 270 3.5 291.3 3 450 9 315 1.8 293.9 3 600 10 315 1.8 294.8 2 800 11 360 3.0 295.9 2 900 12 360 3.7 296.8 2 950 13 360 4.2 297.7 2 950 14 360 3.6 298.1 2 1000 15 360 3.7 298.3 2 900 16 315 2.5 298.6 3 700 17 360 3.8 297.7 3 600 18 360 4.6 295.9 4 400 19 360 2.8 294.5 5 200 20 360 2.7 293.8 5 200 21 360 2.6 293.3 5 100 22 45 1.8 292.9 5 100 23 45 1.9 293.3 5 100 24 315 1.5 292.9 5 100
Table 4.3
GLCs due to One Hour Operation for Testing Regularly in One Week
Scenario Pollutant Concentration
(µg/m3) DB1-DG1 DB1-DG2 DB1-DG3 DB1-DG1+DB1-DG2+DB1-DG3
SO2 13.66 13.66 95.62 122.90
NOx 14.56 14.56 101.92 131.04
SPM 0.51 0.51 3.57 4.59

Chapter 4: Anticipated Environmental Impact And Mitigation Measures
National Environmental
Engineering Research
Institute
351
4.2.1.3 Impact Assessment due to Radioactive Emissions
During operation phase, the impacts from nuclear power projects to air
environment would be mainly radiological type because of the release of radioactive
gaseous emissions.
The following main gaseous radioactive components may be generated
from the project during the operation phase.
Radio-nuclides through Air- Route Fission Product Noble Gases (FPNGs)
Iodine131
Particulates
Mitigation Measures The actual releases will be regularly monitored and reviewed and will be
far lower than the stipulated limits. The details of gaseous waste processing System
and the typical annual discharges to comply with the dose apportionment are given
below.
Gaseous Waste Processing
General Design
The Gaseous Waste Processing System (GWPS) is designed for all
normal operating conditions of the plant. The details are presented in
Section 2.6.7.1, Chapter -2.
The different systems connected to the GWPS consist mainly of tanks and
vessels, which contain a variable volume of free gas.
Accordingly, there are two primary functions to be fulfilled:
- To compensate the level deviations of the free gas atmosphere in the
connected tanks by the corresponding gas volume, injecting or
accommodating.
- To purge components in which coolant degasification occurs in order to
process the waste gases.
Chapter 4: Anticipated Environmental Impact And Mitigation Measures
National Environmental
Engineering Research
Institute
352
General Design Criteria:
- Prevent the release of radioactive gases from the connected systems and
components into the atmosphere of the building; this is ensured by
exhausting gases originating in the Reactor Coolant System and
maintaining a sub-atmospheric pressure in the flushing part of the GWPS.
- Minimize the discharge of gases to the environment by using a closed
loop GWPS in which the flushing gas nitrogen is reused after reduction of
the H2 and O2 content at a value of approx. 0 to 0.3 % H2 by volume and
approx. 0 to 0.1% O2 by volume.
- Hold up the radioactive gases (xenon, krypton) for a sufficient decay time
and release to the Nuclear Auxiliary Building Ventilation System.
- Use activated charcoal for delaying the noble gases to reduce the
necessary component volume of the delay line.
- Limit the oxygen concentration in the GWPS to <0.1 % by volume in order
to prevent absorption of oxygen by the reactor coolant, which could cause
corrosion in the Reactor Coolant System.
- Limit the hydrogen concentration in the GWPS to < 4 % by volume in
order to prevent the formation of an explosive gas mixture with oxygen
(the limits of flammability of such a mixture is 4% H2 by volume and 5% O2
by volume).
- Reduce the hydrogen and oxygen concentration in the flushing gas. For
this purpose, a catalytic re-combiner is installed in the GWPS.
The noble gases Xenon and Krypton are retained in the delay line by
adsorption until radioactivity has decayed to a level permissible for release to the
vent stack of height 100 m. The lifetime of the charcoal is designed for an operation
time of 60 years.

Chapter 4: Anticipated Environmental Impact And Mitigation Measures
National Environmental
Engineering Research
Institute
353
Aerosols, Iodine and Tritium are mainly retained in the liquid phase at the
different coolers and at the waste gas compressor unit. Therefore they are not
relevant for the design of the delay unit.
Typical Annual Gaseous Discharges
The following tables provide the expected annual releases of radioactive
gases into the atmosphere per unit after filtering.
Radionuclides Expected performance
excluding operating contingencies
Maximum release
Tritium 500 GBq 3000 GBq Carbon-14 350 GBq 900 GBq
Iodine isotopes 0.05 GBq 0.400 GBq
Noble gases 800 GBq 22 500 GBq
Other FP/AP 0.004 GBq 0.340 GBq
Dose Apportionment
The radiation dose apportionment from each unit of JNPP is given below.
Also the report on The Preliminary Radiological Dose Apportionment for Jaitapur Site
carried out by HPD BARC is enclosed as Annexure-IX (d), Vol –II. The report
presents the dose apportionment up to unit level. However, dose apportionment for
emitted radionuclide from the plant will be carried out once a detailed site specific
meteorological data on hourly basis are available for the Jaitapur site. It is planned
that the proposed Environmental Survey Laboratory (ESL), which will be set up at the
Jaitapur site much before the plant operation will generate the required data. This
whole scheme of dose apportionment will be approved by AERB.
Dose limit of each site as per AERB = 1milli Sievert per year(from all routes)
Dose limit of each unit of JNPP= 0.1 milli Sievert per year(from all routes)
Dose limit of each unit of JNPP from air route = 0.08 milli Sievert per year
Noble gases 0.06 milli Sievert per year
I131 and other gases 0.02 milli Sievert per year
Chapter 4: Anticipated Environmental Impact And Mitigation Measures
National Environmental
Engineering Research
Institute
354
Releases through air route will be constantly monitored and reviewed such
that the actual releases are much less than the specified limits. Therefore, the impact
on air environment due to radioactive discharges through air route will be
insignificant.
4.2.2 Water Environment 4.2.2.1 Impact Assessment Due to Conventional Water Pollutants 4.2.2.1.1 Water Availability and Water Balance
Water Availability
The Jaitapur nuclear power project is proposed to be situated on the west
coast of India. The seawater availability is plenty, however groundwater availability is
less. The lateritic rock cover up to a depth of 20-30 m from surface level seems to
show poor water retentivity hence no groundwater-saturated zone is found within this
unit. The saturation zone level lie at the junction between the laterite and the
underlying weathered basalt, which also fluctuates from 14 m below ground water
level during post monsoon time to less than 18 m in summer. It gets contaminated
during post-monsoon season.
Mitigation Measures
The groundwater and freshwater resources are limited in this area and are
required to be conserved for public utility. Therefore, the seawater which is of good
quality and is present in plenty will be used for JNPP. The details of water balance
are given below.
Water Balance
Water requirement of the project for condenser cooling system would be
met from seawater. The Process water, raw water and domestic water (for Plant Site
and Residential complex) are proposed to be met from Desalination Plant of
appropriate capacity to be installed at Plant Site of JNPP. The details of the
desalination plant are described in Section 2.8, Chapter-2 of this report.
The total water requirements, which include condenser cooling sea water,
Desalination plant sea water and fresh water requirements for each unit of 1650
MWe JNPPs, is given in Tables 3 and 4 of the Summary EIA of this report.

Chapter 4: Anticipated Environmental Impact And Mitigation Measures
National Environmental
Engineering Research
Institute
355
Sea water (8640000 m3/day) will be used as condenser cooling water,
which will be discharged after its circulation through condensers. Seawater 20000
m3/d will be used for desalination plant with production of 6650 m3/d freshwater and
13350 m3/d brine water. The brine water will be mixed with condenser cooling water
before discharge in the sea.
Out of total freshwater produced, 2200 m3/d will be used for drinking and
domestic purpose, resulting in the formation of 1830 m3/d of domestic sewage which
will be treated in Sewage Treatment Plant and treated sewage will be used for
development of green belt.
The remaining 4450 m3/d fresh water will be utilized in plant as process
water, service water and fire water. The wastewater from plant will be treated to
remove radioactive and other impurities and then mixed with CCW before discharge
in sea.
4.2.2.1.2 Impact due to Discharges from Desalination Plant
Brine generated by this technology (MVC) has temperature only about 2 to
3 0C higher than sea water intake temperature. Very small quantities of chemicals are
used to protect equipment from scaling and bio-fouling. The residual concentration of
these chemicals will be within the allowable regulatory limits and are not harmful &
bio-degradable. Salt concentration in brine typically shall be 2 to 3 times that intake
sea water. To dilute the salt concentration, the brine shall be mixed with condenser
cooling sea water before discharging into sea. Because of this the temperature rise
and salinity level will be comparable to intake sea water levels and hence will not
have any impact on sea water due to discharges from desalination plant.
4.2.2.1.3 Impacts due to Domestic Wastewater
If domestic wastewater from residential complex, canteen and toilet is
allowed to be disposed of in surface water viz. river, creek or coastal water without
treatment, it may lead to deterioration of coastal water through eutrophication. Thus
domestic wastewater needs to be treated and recycled/reused in a proper way.
Mitigation Measures
The domestic sewage will be treated in STP of proper capacity with
arrangement for transport pipelines to carry treated sewage to irrigate green belt
around the plant / to irrigate park and avenue plantations in the residential complex.

Chapter 4: Anticipated Environmental Impact And Mitigation Measures
National Environmental
Engineering Research
Institute
356
A guard pond of appropriate capacity would also be provided to store the domestic
wastewater for a short period of 1 -2 days in case of breakdown of STP and the time
required for repairs.
The sewage treatment plant (STP) has been designed as given in
Section 2.12.13, Chapter 2 and the treated effluent will be utilized for irrigating
plantation in the residential complex and green belt in plant area. The stabilized dried
sludge cake obtained from STP will be utilized as manure for the plantation.
Baseline data indicates that the coastal water quality as well as water
quality of rivers in study area is oligotrophic in nature with slight organic
contamination. The area is also important for local fisheries. These water bodies
have, thus, large resilience and may undertake self-purification with limited quantity
of waste. Thus, with implementation of proposed EMP as given in Chapter 7 would
be helpful in maintaining the good water quality in surface water bodies of the study
area.
4.2.2.1.4 Impacts of CCW Discharges on Water Quality and Biodiversity
The condenser cooling (CCW) sea is drawn from intake channel and it
goes to chlorination plant for removal of sea weeds etc. This purified seawater
passes through the condenser tubes and takes away the residual heat of condensate
steam, before discharged to the sea through a specially designed underground
outfall tunnel. The details are presented in Section 2.6.3, Chapter-2. It is mentioned
that residual chlorine levels in the CCW at the outfall will be below stipulated limits of
0.5 ppm of MoEF. Hence there will be no impact on water quality and biodiversity of
the sea environment due to residual chlorine of CCW discharges.
The stipulated standard of MoEF for thermal discharge in sea water is the
maximum allowable rise of 70C in receiving sea water above ambient sea water
temperature. This indicates that If the temperature rise exceeds 70C above ambient
sea water temperature, the flora and fauna will be affected.
Mitigation Measures
The condenser cooling system is designed in such a way that the rise in
seawater temperature across the condenser will be below 70C above the intake
seawater temperature. Then, on the basis of the study carried out by CWPRS, Pune,
the discharge channels are designed in such a way that the temperature rise of the
receiving sea water will be below 4 0C at most of the places and around 4.9 0C at

Chapter 4: Anticipated Environmental Impact And Mitigation Measures
National Environmental
Engineering Research
Institute
357
very small area near the discharge point. The literature survey as well as the
laboratory studies carried out at NEERI indicate that the local fishes and the benthic
and planktonic microflora and fauna are affected only above seawater temperature of
36 to 380C. The study by CWPRS predicted the temperature of receiving sea water
at Jaitapur to be upto 33 to 340C. Therefore the marine flora and fauna will not be
affected by discharge of CCW in seawater at Jaitapur. The College of Fisheries,
Ratnagiri also recommended that the rise in temperature of receiving seawater
should be maintained below 50C above ambient seawater temperature i.e. 340C to
350C (ambient maximum seawater temperature in winter 290C and in summer 300C
at Jaitapur). The details of above mentioned study carried out by CWPRS is given
below.
(a) Prediction of Temperatures of Coastal Water at Jaitapur due to Thermal Discharge
For assessing impact of elevated temperature on marine biota, it was
prerequisite to predict temperature of receiving marine water. The CWPRS has
conducted the studies using MIKE 21 model (HD & AD module) on water
temperature considering the maximum rise in temperature of receiving coastal water
upto 7 0C due to discharge of condenser cooling water (Annexure-V(b), Volume II). Scenarios were generated for different seasons. A worst case scenario was
generated, by taking a scenario where six units are discharging condenser cooling
water (100 cubic m /s) at a temperature 7 °C rise across the condenser at a distance
of 1.5 km for the first two units, 2 km for the second two units and at 2.5 km for the
last two units. The resultant temperature rise ∆T at intake point near breakwater has
been predicted to be below 2.5 0C– 3 0C at most of the places with around 4.0 -4.9 0C
will be confined to a limited area of 0.28 km2, when all the six units are operating and
ocean currents are in transient state, which is the most severe conditions throughout
the year. The rise in water temperature ∆T along the coast (northern and southern
side) has been shown to be below 2 0C. Thus the maximum water temperature due
to discharge of condenser cooling water will be 33 0C in winter (ambient max. 29 0C)
and 34 0C in summer (ambient max. 30 0C) and 31 0C considering annual average
temperature of 27 0C. Temperature increase is not predicted in creek waters and thus
mangrove flora in the creek will not have any impact.
Detailed studies on marine bio-diversity and their temperature tolerance
were carried out by College of Fisheries, Ratnagiri (Annexure-VIII, Vol II). The
Chapter 4: Anticipated Environmental Impact And Mitigation Measures
National Environmental
Engineering Research
Institute
358
results indicated that this rise of ambient seawater temperature will not have any
adverse impact on marine flora and fauna, including benthos.
(b) Effect of Predicted Water Temperature on Fish
Maximum rise in temperature of marine water near JNPP is predicted to be
upto 33 0C to 34 0C after discharge of cooling water. Literature review indicates that
at this temperature (Table 4.4), fish will not generally face any acute stress. Moreover, the
influence of temperature is restricted to a maximum of 2 m depth due to low density of
warm water (Hameed et al., 2007). The fish may easily escape the undesirable
temperature by moving to deep sea water near JNPP.
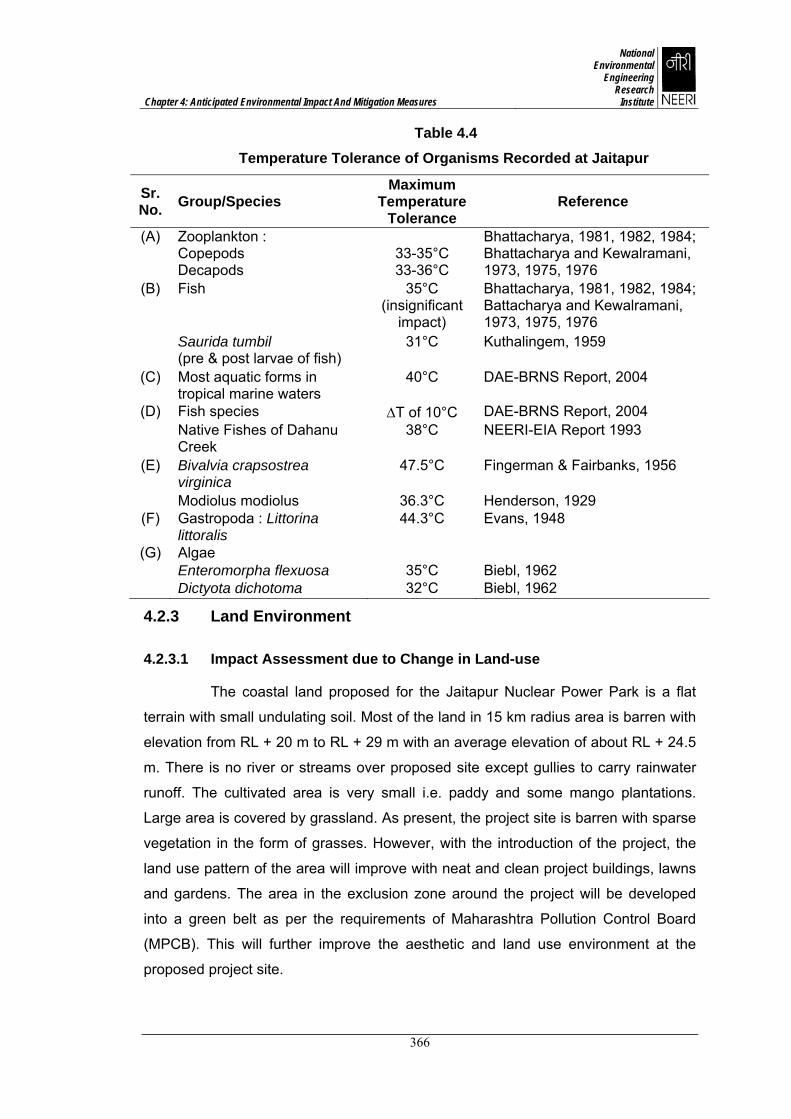
The literature survey was carried out and the temperature tolerance ranges for the
genera and groups of aquatic organisms recorded in Jaitapur coastal seawater has been
given in Table 4.4. According to DAE-BRNS Report 2004, the fish can tolerate ∆T of 10 0C,
while NEERI (EIA Report 1993) reported temperature tolerance of fish from Dahanu upto
380C. Other reports on Indian marine fish indicate that fish is insignificantly affected at
35 0C temperature. DAE-BRNS Report, 2004 reported that most aquatic forms in tropical
water can tolerate temperature upto 40 0C and that fish species mostly tolerate ∆T of 10 0C. According many Indian authors (Bhattacharya, 1981, 1982, 1984; Battacharya and Kewalramani, 1973, 1975, 1976, Biebl, 1962), zooplankton fauna and algae
tolerate temperature upto 33 – 36 0C temperature. Bivalvia and gastropoda tolerate
temperature upto 47.5 0C and 36.3 0C (Fingerman & Fairbanks, 1956; Evans, 1948; Henderson, 1929). It is observed from this table that most of the indigenous organisms
start getting affected above 36-38 0C temperature of sea water.
(c) Thermal Ecological Studies Carried Out Under Project Sponsored by Department of Atomic Energy and Board of Research in Nuclear Sciences (DAE-BRNS) and National Environmental Engineering Research Institute (NEERI) Under DAE-BRNS Project, 2000-2004, detail studies were carried out on
the impact of thermal discharges from Madras Atomic Power Station (MAPS) on
coastal waters of Kalpakkam. The ∆T was observed to be ~3 0C -5 0C in ~o.1 km2
area in zone 1 and ∆T of 1 0C-3 0C in ~0.15 km2 area in zone 2. It was observed that
the thermal discharges did not affect the distribution of the physicochemical
parameters of coastal water.
Most aquatic forms in tropics generally show an optimum temperature
requirement of 25 0C-33 0C for their growth and development and they also tolerate

Chapter 4: Anticipated Environmental Impact And Mitigation Measures
National Environmental
Engineering Research
Institute
359
temperature rise up to 40 0C, though higher temperatures above 40 0C are lethal
(DAE-BRNS Report, 2004).
The algal species richness and their proportional abundance were not very
different between the intake and outfall waters and the sediments, though species
composition showed differences.
The field study on micro-algae distribution showed that power plant
induced effect on phytoplankton is only localized. The coastal waters showed no
indication of altered species composition or reduced phytoplankton standing stock.
The reduction in phytoplankton observed during the transit of water through the
cooling circuit (caused by thermal and chlorine stress) was not observed beyond the
mixing point, due to rapid and effective mixing of the discharge with the coastal
water.
Laboratory experiments to study the Thermal impact on native fishes of
Dahanu creek area was carried out at NEERI (NEERI- EIA Report 1993) the results
showed that the fish can exhibit normal behavior up to 350C and below for a longer
period. When the temperature was gradually increased, the fish showed stress up to
40 0C. Fish lost balance at and above 400C temperature. The incipient lethal
temperature was estimated as 38 0C.
In order to evaluate different scenarios, as may come across due to
discharge of warm water during different tidal conditions, laboratory studies on the
model fish Sarotherodon mossambica (average weight 59.3g; length 16.0 cm) which can
tolerate wide range of salinity, were carried out (NEERI 1993). Besides estimating tolerance
of extreme lethal temperature, the fish were exposed at different temperatures
simulating various consequences (Fig. 4.7). Loss of equilibrium (LE) was determined
as the time when a fish could not maintain its normal swimming position, while death was
defined as the time when opercular activity and response to physical stimulus ceased.
(d) Study on Aquatic Biodiversity and Thermal Impact by College of Fisheries, Ratnagiri (Volume –II, Annexure-VIII)
The diagrammatic representation of marine biodiversity around proposed
JNPP is presented in Fig. 4.8.
Chapter 4: Anticipated Environmental Impact And Mitigation Measures
National Environmental
Engineering Research
Institute
360
The Main Findings of the Study
1. The bottom & surface sea water temperature varied from 25 to 26.5 °C
indicating well -mixed water due to ocean currents.
2. The seawater pH showed narrow fluctuation with values of 8.39- 8.78 ,
3. The levels of Dissolved Oxygen (DO) at the surface varied in the range
6.28- 6.92 mg/l. Typically the DO declined with depth with a lowest value of
4.6 mg/l at the bottom water.
4. The nutrients in sea water especially phosphate and nitrate are very low
indicate absence of pollution and low productivity of the seawater in the
study area. Therefore, planktons are very less in amount.
5. The fish catch is low near the shore, which increases towards seaside with
increase in depth.
6. The sensitive species in the study area like mangroves, present in the
Jaitapur along the creak are quite far away (approximately 5 km) from the
influencing area of the thermal plume from the project.
7. The thermal dispersion studies carried out by CWPRS shows that the
maximum temperature rise of around 5 0C will be confined to a limited area
of 0.28 km2, when all the six units are operating and ocean currents are in
transient state, which is the most severe conditions throughout the year
hence will not adversely affect the native flora and fauna under normal
ambient conditions.
The study and literature glance indicates important points, which need to
be considered as under,
1. The magnitude of temperature rise of the receiving water body (sea in this
case) depends upon the mixing pattern and season.
2. The effect of warm water discharge are localized in nature and short term
due to the coastal mixing processes bringing out horizontal and vertical
distribution of the biota. However, it should be noted that alteration in the
aquatic ecosystem could also be due to natural influences, which should be
clearly differentiated from man -made activities.

Chapter 4: Anticipated Environmental Impact And Mitigation Measures
National Environmental
Engineering Research
Institute
361
3. The response of marine species would depend on acclimation period and
the ambient temperature, as seen from the Fig. 2 (Volume –II, Annexure-VIII) zones of activity and inactivity exist for the species under
consideration
4. Stenberg, (1985) suggested that besides heat loading, the radioactive
waste and chlorine also may appear as pollutant in the CCW from nuclear
power plant. However, studies carried out at Kalpakkam site and other
nuclear power plant sites in the country with advanced design features,
indicates that radioactive and chlorine levels in the CCW are much below
the stipulated limits and do not pose any impact on the marine ecosystem.
Conclusion
Above enumerations and thermal dispersion studies indicate that the marine
aquatic food chain organisms will not be affected by the predicted maximum temperature
rise of around 5 0C will be confined to a limited area of 0.28 km2, when all the six
units are operating and ocean currents are in transient state, which is the most
severe conditions throughout the year. At this range of temperature rise above ambient
temperature of water, most of the organisms are either not affected or get benefit of
stimulation of metabolic activity. The marine biodiversity of the coastal stretch around
proposed Jaitapur Nuclear Power Park is prepared and shown in Fig 4.8. When this
figure is compared with thermal prediction in coastal water, it is observed that the
temperature zone of 4 °C to 5 °C lie in low fish catch and low marine biodiversity area,
while at other place temperature rise is mostly upto 1-3 °C. Further, no sensitive marine
species have been recorded on the coastal area near JNPP site, however, mangrove
flora is present in the estuary far away from the project site where no thermal impact is
predicted and may not be affected by discharge of condenser cooling water.
4.2.2.2 Impact Assessment due to Radiological Releases through Water Route: Mitigation Measures The main aim of mitigation measures is to design the plant to keep the
radiological discharges through water route below stipulated standards. The details
are given below.
The data provided hereafter gives indicative typical values of effective
dose, critical exposure pathway and critical nuclide related to liquid waste of one Unit
of NPP. The Liquid Waste Storage and Processing Systems are designed to store
and process Liquid Waste Water accumulated into the controlled area during power

Chapter 4: Anticipated Environmental Impact And Mitigation Measures
National Environmental
Engineering Research
Institute
362
operation, overhauls and refueling. The details are presented in Section 2.6.7.2, Chapter 2.
Average Amount of Liquid Waste expected ≈ 360 m3/week, (which
includes Tritium balance of about 45 m3/week & regenerated / flushing water of about
70 m3/week). The total expected liquid effluent discharges are about 1500 m3/year.
The systems are controlled from a separate local station. Due to retention equipment
in the waste treatment plant and the mode of operation, activity releases less than 4
x 1010 Bq/y for radionuclide mixture without tritium and less than 6 x 10¹³ Bq/y for
Tritium (H3) are expected.
4.2.2.2.1 Typical Annual Liquid Discharges
The following table shows the expected annual and maximum discharge of
radioactive substances released into the sea per unit.
Radionuclides Expected performance
excluding operating contingencies
Maximum release
Tritium 52 000 GBq 75 000 GBq
Carbon-14 23 GBq 95 GBq
Iodine isotopes 0.007 GBq 0.05 GBq
Other FP/AP 0.6 GBq 10 GBq
4.2.2.2.2 Laundry System
An active laundry is provided to decontaminate clothing and rubber wears
such as lab coats, hand gloves, Shoe cover, coveralls etc received from the station.
The laundry equipment is provided to take care of the entire washing load of
contaminated protective wears from the plant on a single shift operation basis.
However, increased load requirements, if any, during shutdown and other
contingencies can be met by increasing the no. of shifts. This system is located in
nuclear building very close to change room (point of generation) and new cloth issue
room (point of utilization) thereby avoiding movement of contaminated clothing from
change room to laundry system. The drain lines from these laundry machines are led
to laundry waste collection sump from where it is pumped to laundry waste collection
tank of dyke area.

Chapter 4: Anticipated Environmental Impact And Mitigation Measures
National Environmental
Engineering Research
Institute
363
4.2.2.2.3 Radioactive Concentrates Processing
The Radioactive Concentrates Processing System is designed to receive
condition and process Liquid Radioactive Waste stored in storage tanks. The type of
waste to be processed is evaporator concentrate, slurry, spent resins, and the liquid
radioactive waste residues generated in water and waste waster treatment systems.
Typical Values: per unit
- Evaporator ≈ 20m3 /y
- Slurry ≈ 2 m3/y
- Spent resins ≈ 2.5 m3/y
4.2.2.2.4 Radiation Dose Apportionment through Water Route
The radiation dose apportionment from each unit of JNPP is given below.
Dose limit of each site as per AERB = 1milli Sievert per year (from all routes) Dose limit of each unit of JNPP= 0.1 milli Sievert per year (from all routes) Dose limit of each unit of JNPP from water route = 0.02 milli Sievert per year
Radionuclide mixture without Tritium (H3) 0.01 milli Sievert per year
Tritium (H3) 0.01 milli Sievert per year
Releases through water route will be constantly monitored and reviewed
such that the actual releases are much less than the specified limits. The above
apportionment of dose through liquid will be reviewed and approved by AERB. It is
mentioned that permissible AERB dose limit form all the units at the site is 1 mSv /
year. Therefore, the impact on water environment due to radioactive discharges
through water route will be insignificant.

Chapter 4: Anticipated Environmental Impact And Mitigation Measures
National Environmental
Engineering Research
Institute
364
Fig. 4.7: Exposure of Fish Sarotherodon mossambica at Different Temperatures under Different Consequences
(NT: normal temperature; MT: maximum temperature)

Chapter 4: Anticipated Environmental Impact And Mitigation Measures
National Environmental
Engineering Research
Institute
365
Fig. 4.8: Diagrammatic Representation of Marine Biodiversity around Proposed Jaitapur Nuclear Power Park
Chapter 4: Anticipated Environmental Impact And Mitigation Measures
National Environmental
Engineering Research
Institute
366
Table 4.4 Temperature Tolerance of Organisms Recorded at Jaitapur
Sr. No. Group/Species
Maximum Temperature
Tolerance Reference
(A) Zooplankton : Copepods Decapods
33-35°C 33-36°C
Bhattacharya, 1981, 1982, 1984; Bhattacharya and Kewalramani, 1973, 1975, 1976
(B) Fish 35°C (insignificant
impact)
Bhattacharya, 1981, 1982, 1984; Battacharya and Kewalramani, 1973, 1975, 1976
Saurida tumbil (pre & post larvae of fish)
31°C
Kuthalingem, 1959
(C) Most aquatic forms in tropical marine waters
40°C
DAE-BRNS Report, 2004
(D) Fish species ∆T of 10°C DAE-BRNS Report, 2004 Native Fishes of Dahanu
Creek 38°C NEERI-EIA Report 1993
(E) Bivalvia crapsostrea virginica
47.5°C Fingerman & Fairbanks, 1956
Modiolus modiolus 36.3°C Henderson, 1929 (F) Gastropoda : Littorina
littoralis 44.3°C Evans, 1948
(G) Algae Enteromorpha flexuosa 35°C Biebl, 1962 Dictyota dichotoma 32°C Biebl, 1962
4.2.3 Land Environment
4.2.3.1 Impact Assessment due to Change in Land-use
The coastal land proposed for the Jaitapur Nuclear Power Park is a flat
terrain with small undulating soil. Most of the land in 15 km radius area is barren with
elevation from RL + 20 m to RL + 29 m with an average elevation of about RL + 24.5
m. There is no river or streams over proposed site except gullies to carry rainwater
runoff. The cultivated area is very small i.e. paddy and some mango plantations.
Large area is covered by grassland. As present, the project site is barren with sparse
vegetation in the form of grasses. However, with the introduction of the project, the
land use pattern of the area will improve with neat and clean project buildings, lawns
and gardens. The area in the exclusion zone around the project will be developed
into a green belt as per the requirements of Maharashtra Pollution Control Board
(MPCB). This will further improve the aesthetic and land use environment at the
proposed project site.

Chapter 4: Anticipated Environmental Impact And Mitigation Measures
National Environmental
Engineering Research
Institute
367
4.2.3.2 Impact Assessment due to Radiological Solid Waste
Active solid waste is produced from different sections of nuclear power
plants in the form of metallic and non metallic waste. These solid wastes need to be
treated and disposed off properly for the protection of flora, fauna and human being.
Mitigation Measures
Treatment and disposal of radioactive solid waste at Jaitapur Nuclear
Power Project will be carried out as per AERB requirements. The solid processing
and storage system is designed to handle and deal with solid radioactive waste
generated in the controlled area during power operation, overhauls and refueling and
to store the operational solid radioactive waste in the storage rooms. The designed
features are presented in Section 2.6.7.3, Chapter 2.
The operational solid radioactive waste generated per year is handled and
stored in the drums / containers as described following.
Categorisation of solid waste storage drums: Type I : capacity 140 litre for resins & concentrates with different thickness
Type II : capacity 350 litre for resins & concentrates with different thickness
Type III : capacity 950 litre for resins & concentrates with different thickness
Type IV : capacity 500 litre for filter cartridges with different thickness
Typical overall volume of waste to be treated for one year for TWO UNITS
Filter cartridges ≈ 300 Units
Spent resins ≈ 45 m3 (high activity 10 m3, medium activity 15 m3, Low activity 10
m3, very low activity 10 m3)
Concentrates ≈ 30 m3
Chemical waste ≈ negligible
Miscellaneous dry waste ≈ 420 m3 (of which 85% is Compactable – reduction by the
factor of 9 and 15 % is non- Compactable)
Average annual drum output for one year for two plant units Type I: ≈ 120
Type II: ≈ 100
Type III: ≈ 200
Type IV: ≈ 150
Chapter 4: Anticipated Environmental Impact And Mitigation Measures
National Environmental
Engineering Research
Institute
368
ANS 55 (208 litres) Gallon metal drums ≈ 800
Spent resin or concentrate volume in different concrete drums
Type I: ≈ 340 litres of concentrates or ≈ 300 litres of spent resins
Type II: ≈ 130 liters of concentrates or ≈ 130 litres of spent resins
Type III: ≈ 50 liters of spent resins
Activated Metallic Waste The instruments lances and RCCA drive shafts remain in the reactor
building stored under water during outages. Should any of such items need to be
stored during normal plant operation, they can be stored in the instrumentation lance
compartment, which remains flooded in every plant state.
Large components such as lower core plate and heavy reflector are
designed for full life of the plant. In case of unexpected event of the replacement of
such equipment the dismantling (cutting into smaller pieces and putting into a special
container) of the irradiated equipment is done underwater in the internal
compartment of reactor pool and then the container is stored at a specified place
called radioactive solid waste disposal site at the project site.
After sealing, the dose rate at outside surface of the drum / container will
be <2 mSv/h. They are then placed in temporary storage area. After some time they
are then stored in long-term storage area. The dose rate at outside surface of the
drum will be <2 mSv/h. The dose rate outside the storage building will be < 0.75
mSv/h.
The NPP unit is so designed that activity releases to the environment are
through pre-designated release points. These radioactive effluent releases to the
environment through the designated release points are continuously monitored and
controlled. The minimum sensitivity of the monitoring instruments is such that even a
sufficiently small fraction of the releases, which leads to dose consumption in the
public domain, can be measured.
Presently in respect of NPP’s in India, the low and intermediate radio-
active solid / solidified wastes are stored in Near Surface Disposal Facility (NSDF).
They are stored under ground at a depth of maximum up to 4 m either in trenches /
RCC vaults / tile holes depending upon the surface dose rate of the waste. The solid
waste disposal site is fenced and designed to store waste for an active control
(monitoring, surveillance, remedial work) period of 100 years followed by passive
control (land use control) period of 200 years.
The above facility has sufficient number of bore-holes all around at definite

Chapter 4: Anticipated Environmental Impact And Mitigation Measures
National Environmental
Engineering Research
Institute
369
intervals. Ground water samples are collected from these bore-holes on regular basis
to check the activity in ground water.
Further, as technical particulars received for EPR plants, the low and
intermediate level radioactive solid / solidified waste are envisaged to be stored in the
radioactive waste storage building suitably designed for this purpose, where solid
waste storage need to be stored for an active control (monitoring, surveillance,
remedial work) period of 100 years followed by passive control (land use control)
period of 200 years above ground. However, the above technological option will be
reviewed in detail by NPCIL and final decision will be taken with due approval of
AERB, before implementation. The features about the facility are given below in brief.
The radioactive waste storage building is planned to store low and
intermediate level radioactive solid / solidified waste having half life less than 30 yrs.
The total storage time envisaged for this waste is 100 years active control period
followed by passive control period of another 200 years. Hence in the design an
active storage period of 100 years is considered. After 300 years of storage (with ten
or more half lives), the total radioactivity of the material will be almost negligible.
Waste storage facility is a seismically qualified structure. Solid / solidified
waste is always stored inside the building with multiple barrier concepts. The stored
solid waste will never come in contact with ground water during its operational life.
Therefore, solid radioactive waste disposal with effective disposal
mechanism will not have any adverse impact on the land and water components of
the environment.
The existing environmental radioactivity levels are not expected to be
changed due to operation of proposed nuclear plant. The design of the plant,
radioactive monitoring and waste management systems are of highest quality as per
international and national guidelines and the radioactive emissions from the stacks
would be insignificant. Therefore the fallout would be minimum and land would not be
exposed to radioactive pollutants.
4.2.4 Noise Environment
4.2.4.1 Impacts due to Stationary Noise Sources
The cumulative noise level at a particular location within the study area
due to noise source can be computed by using Wave Divergence Model as given
below:
Lp2 = Lp1 - 20 log (r2/r1) - Ae1,2 - - - - - - - - - - - - (4.2.4.1)

Chapter 4: Anticipated Environmental Impact And Mitigation Measures
National Environmental
Engineering Research
Institute
370
where,
Lp2 and Lp1 are the noise levels at the distances r2 and r1 respectively
from the source and Ae1, 2 is the excess attenuation along the path r2-r1 due to
environmental absorption, scattering and other shielding effects. In the present case,
excess attenuation was not considered.
Total noise level Lp (Total) due to all sources can be determined as follows:
Lp(Total) = 10 log (10Lpa/10 + 10Lpb/10 + 10Lpc/10 + - - ) - - - - - - (4.2.4.2) where,
Lpa, Lpb, Lpc, are the noise levels at a sampling point due to sources A, B, C,
etc.
The above-mentioned model is used for predicting increase in noise levels
due to proposed unit in Jaitapur nuclear power plant. Cumulative noise levels
considering sources in proposed Units are also predicted.
4.4.4.2 Identification of Sources of Noise in the Proposed Plant
The main sources of noise in the nuclear power plant are 1) Turbines, 2)
Air Compressors, 3) Ventilation inlets, 4) Diesel Generators, 5) Pump House
Equipments, 6) Chillers, 7) Vents, 8) Exhaust Fans and 9) Heavy and medium
automobiles moving around the plant. The noise levels likely to be generated by
these sources are presented in Table 4.5. It is likely that improved technology may
further reduce the noise levels. Most of the machines will be working continuously
round the clock during operation of the nuclear power plant. However, these
machines would be housed in acoustic enclosures / buildings such that they would
not be contributing any additional noise levels in the surrounding environment.
The noise level contours due to the noise sources in units of the proposed
nuclear power plant without considering noise barriers are shown in Fig. 4.9. Without
any barriers viz. buildings and green belt, it is predicted that the noise levels in the
surrounding environment due to above said equipments of the proposed units at a
distance of 500 m will be 52 dB(A) and at 1000 m will be 50 dB(A). It is also predicted
that the noise levels from these sources at 2000 m distance will be <50 dB(A).
Therefore, background noise levels in the nearest village i.e. Kuveshi located at a
distance of 2 km will remain below 50 dB(A).
The maximum noise levels will occur at receptors located near all the
proposed units which are predicted to be less than 60 dB(A) without any barriers viz.

Chapter 4: Anticipated Environmental Impact And Mitigation Measures
National Environmental
Engineering Research
Institute
371
buildings. These noise levels would be significantly reduced when the barrier of
building is considered at the time of operation of plant.
Considering the attenuation due to specially designed building within which
noise generating machineries will be housed, the increase in noise levels will be
around 1-2 dB(A) just outside the building of power plant. Thus, there will not be any
change in the ambient noise levels due to operation of nuclear power plant in the
nearest village Kuveshi at 2 km distance.
4.2.4.3 Prediction of Impacts on Community
Above discussion indicates that there will not be any increase in noise
levels above ambient due to operation of the nuclear power plant in the nearest
village Kuveshi at 2 km distance. Therefore the community will not be affected by the
operation of the NPP at Jaitapur.
As the human settlement near to the plant site are relatively less and study
area consisting of green belt and vegetation with very less vehicular density, the
noise impact on surrounding population would be insignificant.
4.2.4.4 Prediction of Impact on Occupational Health
Equivalent sound pressure level, 8 hrs average, (Leq 8 hrs), is used to
describe exposure to noise in workplaces. The damage risk criteria for hearing loss,
enforced by Occupational Safety and Health Administration, (OSHA) USA and
stipulated by other organizations, is that noise levels upto 90 dB(A) are acceptable
for eight hours exposure per day. Ministry of Labour, Government of India has also
recommended similar criterion vide Factories Act, Schedule No. XXIV (Government
Notification FAC/1086/CR-9/Lab-4, dated 8/2/1988).
The noise levels in the building are predicted to be 90 dB(A). However, the
workers in the noise zone area will be provided with protective equipments like ear
muffs and as a result the occupational exposure of the workers is reduced
considerably within stipulated limits.

Chapter 4: Anticipated Environmental Impact And Mitigation Measures
National Environmental
Engineering Research
Institute
372
Fig 4.9: Predicted Noise Levels due to Noise Sources in the Proposed Nuclear Power Plant without Considering Attenuation due to Barriers Like Building and Greenbelt. The noise level in the building of NPP is predicted to be 95 dB(A)
0 1000 2000 3000 4000 5000 6000 7000 8000 9000 10000Distance in East Direction, meters
0
1000
2000
3000
4000
5000
6000
7000
8000
9000
10000
Dis
tanc
e In
Nor
th D
irect
ion,
met
ers
Units of Power Plant

Chapter 4: Anticipated Environmental Impact And Mitigation Measures
National Environmental
Engineering Research
Institute
373
Table 4.5
Main Sources of Noise from Different Equipments in Proposed NPP & Their Noise Levels
Sr. No. Source Noise Levels Range, dB(A)
Distance from Noise Source
1 Turbine 94 – 96 5 m
2 Diesel Generator 92 – 98 2 m
3 Air Compressor 92 – 98 2 m
4 Cooling Water Pump 89 – 95 2 m
5 Deaerator 92 – 94 2 m
6 Intake Ventilator 94 – 97 5 m
7 Exhaust Ventilator 92 – 96 2 m
Source: NPCIL
Note:
1. All the above-mentioned equipments will be housed in properly designed
and engineered buildings, which will work as protective enclosures
2. The occupancy of human beings like occupational workers on continuous
basis is not envisaged in the areas around these equipments

Chapter 4: Anticipated Environmental Impact And Mitigation Measures
National Environmental
Engineering Research
Institute
374
4.2.5 Biological Environment
The project area is occupied by barren land with grasses and scrub
vegetation. Thus development of JNPP would not affect the green cover of the area
on the contrary, JNPP has extensive developmental plan for green belt and
plantation in plant and residential complex area resulting in increase in green cover
and biodiversity of plants and birds in the area apart from creation of beautiful
landscape.
There is no discharge of conventional pollutants in the aquatic
environment; so marine fauna and flora would not be affected.
The thermal discharges of condenser cooling water would not exceed the
stipulated standards and thus would not create stress on aquatic flora and fauna.
There is no sensitive ecosystem like National Park, Sanctuary or
Biosphere Reserve within 10 km radial area around the JNPP (Fig. 4.10). The
authenticated maps showing locations of JNPP, National Park/Sanctuary/Biosphere
Reserve are included in Annexure XII, Vol. II. Thus, biodiversity would not be
affected, on the contrary, would be enriched, due to plantation drive of JNPP.
The radioactive release due to operation of JNPP is expected to be
insignificant and impact would be negligible. The discharge of liquid effluents from
the plant will be within the stipulated limits of AERB therefore their impacts would be
negligible.
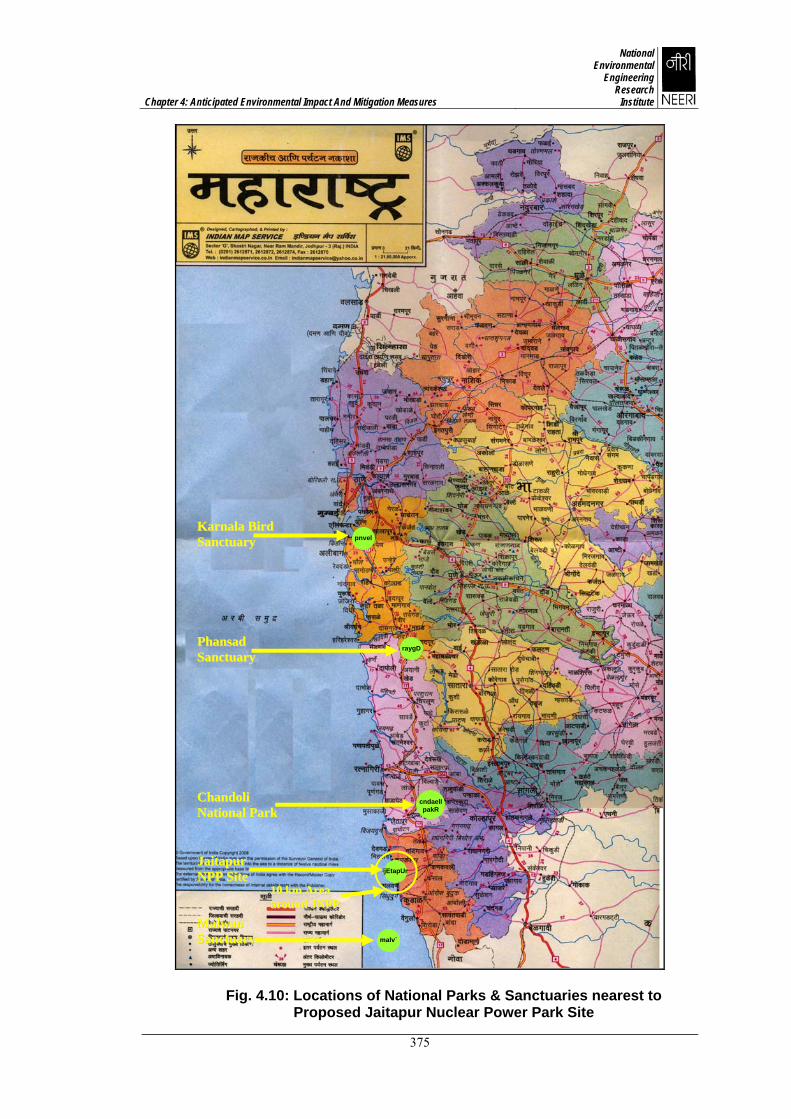
Chapter 4: Anticipated Environmental Impact And Mitigation Measures
National Environmental
Engineering Research
Institute
375
Fig. 4.10: Locations of National Parks & Sanctuaries nearest to Proposed Jaitapur Nuclear Power Park Site
pnvel KKaarrnnaallaa BBiirrdd SSaannccttuuaarryy
raygD PPhhaannssaadd SSaannccttuuaarryy
malv`
MMaallwwaann SSaannccttuuaarryy
jEtapUr JJaaiittaappuurr NNPPPP SSiittee
cndaelIpakR
CChhaannddoollii NNaattiioonnaall PPaarrkk
1100 kkmm AArreeaa aarroouunndd JJNNPPPP

Chapter 4: Anticipated Environmental Impact And Mitigation Measures
National Environmental
Engineering Research
Institute
376
4.2.6 Socio-economic Environment
4.2.6.1 Social Welfare & Community Development Programme around NPPs by NPCIL
The policy of NPCIL towards social welfare & community development
aims at strengthening the bond between the project / station authorities and the
local population in the vicinity of nuclear power plants.
4.2.6.2 Welfare Measures Proposed to be implemented around JNPP Assistance in Educational Welfare Measures
• Assistance for Up-gradation of Schools facilities like
classrooms, laboratories and other associated requirements.
• Providing computers, sports item, laboratory equipment etc.
• Introduction of the talent nurture schemes for students from
nearby villages by providing admission to AECS schools of
NPCIL for free education or by providing suitable scholarships.
Assistance in Health-Care Welfare Measures
• Organization of the regular medical camps for chronic ailments
prevailing amongst the peoples of villages in and around
JNPP.
• Proving consultancy and medicines as a part of preventive and
promotive health care
• Hepatitis ‘B’ vaccination to school & village children.
Assistance in Community Welfare Measures
• Assistance in providing drinking water, street lighting, widening
of roads, etc.
• Assistance in construction of general community infrastructure
facilities.
Assistance in Development of Fisherman’s Welfare Measures
• Distribution of life jackets to fisherman for local costal villages
around JNPP and release of fish seedlings into water bodies
around JNPP
• Assistance in upgrading fishing facilities in area around JNPP.

Chapter 4: Anticipated Environmental Impact And Mitigation Measures
National Environmental
Engineering Research
Institute
377
4.2.6.3 Socio Economic Impact
Critically analyzing the baseline status of the socioeconomic profile and
visualizing the scenario with the project, the impacts of the project would be varied
nature. Prediction of qualitative impacts on socioeconomic environment is shown in
Table 4.6. Expected change in subjective and cumulative quality of life (QoL) in the
project region is presented in Table 4.7 and Table 4.8 respectively.
4.2.6.3.1 Beneficial Impacts The proposed project would generate indirect employment
opportunities as daily wage labors during construction, transportation
activities, supply of raw materials, auxiliary and ancillary works etc.
The project has favorable ranking by the majority of the people
surveyed and is looked upon as a step for further development of the
area
Due to the project there would be an overall development of the area
and job opportunities, which may improve the quality of life in the
region.
Proposed project would help to fulfill the gap between demand and
supply of electricity within the country and particularly in the region
The electricity generated in plant will result in electrification of villages,
development of irrigation facilities, drinking water supply, development
of industries etc
Development in housing, education, medical, health, sanitation, power
supply, electrification and transport in the study area
4.2.6.3.2 Adverse Impacts Influx of workers during the project construction phases would impose
marginal strain on the existing basic amenities within the study area
Although low level generation of conventional pollutants may exists
during the construction phase but with proper Environmental
Management Plan (EMP), it will have insignificant impact on the
environment

Chapter 4: Anticipated Environmental Impact And Mitigation Measures
National Environmental
Engineering Research
Institute
378
Table 4.6
Prediction of Qualitative Impacts on Socio-Economic Environment
Sr. No. Parameter Direct Indirect Reversible Irreversible
1. Employment + + • +
2. Income + + • +
3. Transport • + • +
4. Education • + • +
5. Medical facilities • + • +
6. Communication • + • +
7. Availability of power supply + • • +
8. Sanitation • + + •
9. Housing • + • +
10. Health • + + •
11. Agriculture + • • +
12. Cost of living • + • +
13. Business + + • +
14. Per Capita Income • + • +
+ Positive Impact - Negative Impact
• Insignificant
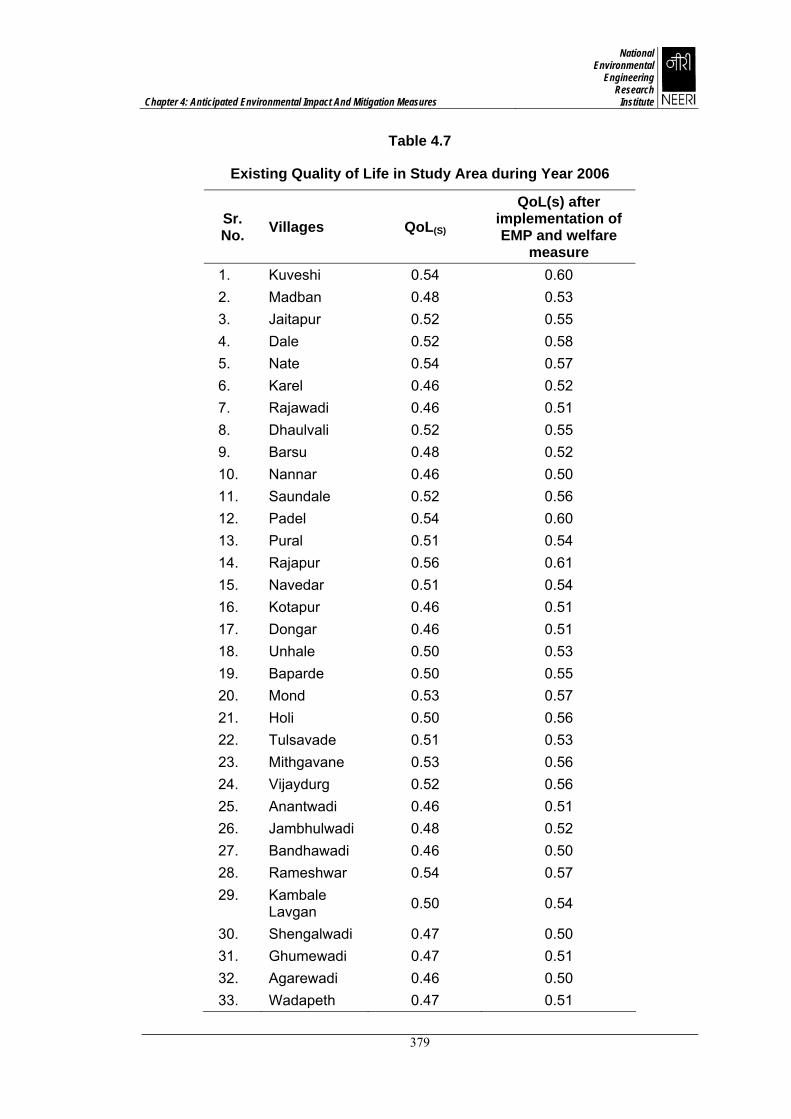
Chapter 4: Anticipated Environmental Impact And Mitigation Measures
National Environmental
Engineering Research
Institute
379
Table 4.7
Existing Quality of Life in Study Area during Year 2006
Sr. No. Villages QoL(S)
QoL(s) after implementation of EMP and welfare
measure 1. Kuveshi 0.54 0.60 2. Madban 0.48 0.53 3. Jaitapur 0.52 0.55 4. Dale 0.52 0.58 5. Nate 0.54 0.57 6. Karel 0.46 0.52 7. Rajawadi 0.46 0.51 8. Dhaulvali 0.52 0.55 9. Barsu 0.48 0.52 10. Nannar 0.46 0.50 11. Saundale 0.52 0.56 12. Padel 0.54 0.60 13. Pural 0.51 0.54 14. Rajapur 0.56 0.61 15. Navedar 0.51 0.54 16. Kotapur 0.46 0.51 17. Dongar 0.46 0.51 18. Unhale 0.50 0.53 19. Baparde 0.50 0.55 20. Mond 0.53 0.57 21. Holi 0.50 0.56 22. Tulsavade 0.51 0.53 23. Mithgavane 0.53 0.56 24. Vijaydurg 0.52 0.56 25. Anantwadi 0.46 0.51 26. Jambhulwadi 0.48 0.52 27. Bandhawadi 0.46 0.50 28. Rameshwar 0.54 0.57 29. Kambale
Lavgan 0.50 0.54
30. Shengalwadi 0.47 0.50 31. Ghumewadi 0.47 0.51 32. Agarewadi 0.46 0.50 33. Wadapeth 0.47 0.51
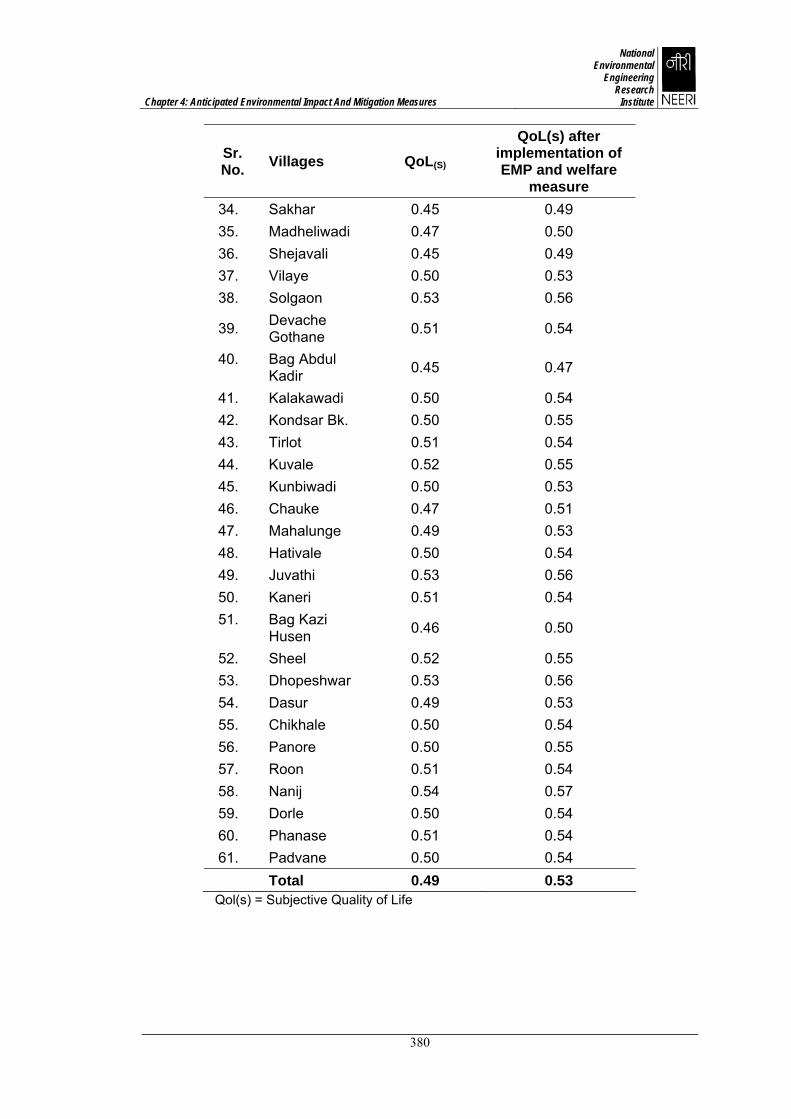
Chapter 4: Anticipated Environmental Impact And Mitigation Measures
National Environmental
Engineering Research
Institute
380
Sr. No. Villages QoL(S)
QoL(s) after implementation of EMP and welfare
measure 34. Sakhar 0.45 0.49 35. Madheliwadi 0.47 0.50 36. Shejavali 0.45 0.49 37. Vilaye 0.50 0.53 38. Solgaon 0.53 0.56
39. Devache Gothane 0.51 0.54
40. Bag Abdul Kadir 0.45 0.47
41. Kalakawadi 0.50 0.54 42. Kondsar Bk. 0.50 0.55 43. Tirlot 0.51 0.54 44. Kuvale 0.52 0.55 45. Kunbiwadi 0.50 0.53 46. Chauke 0.47 0.51 47. Mahalunge 0.49 0.53 48. Hativale 0.50 0.54 49. Juvathi 0.53 0.56 50. Kaneri 0.51 0.54 51. Bag Kazi
Husen 0.46 0.50
52. Sheel 0.52 0.55 53. Dhopeshwar 0.53 0.56 54. Dasur 0.49 0.53 55. Chikhale 0.50 0.54 56. Panore 0.50 0.55 57. Roon 0.51 0.54 58. Nanij 0.54 0.57 59. Dorle 0.50 0.54 60. Phanase 0.51 0.54 61. Padvane 0.50 0.54
Total 0.49 0.53 Qol(s) = Subjective Quality of Life

Chapter 4: Anticipated Environmental Impact And Mitigation Measures
National Environmental
Engineering Research
Institute
381
Table 4.8
Expected Change in Cumulative Quality of Life
Sr. No. Villages QoL(C) QoL(c) after
implementation of EMP and welfare
measure 1. Kuveshi 0.55 0.59 2. Madban 0.49 0.55 3. Jaitapur 0.53 0.57 4. Dale 0.53 0.56 5. Nate 0.55 0.60 6. Karel 0.47 0.52 7. Rajawadi 0.47 0.52 8. Dhaulvali 0.53 0.58 9. Barsu 0.49 0.53 10. Nannar 0.47 0.51 11. Saundale 0.53 0.58 12. Padel 0.55 0.60 13. Pural 0.52 0.57 14. Rajapur 0.57 0.61 15. Navedar 0.52 0.56 16. Kotapur 0.47 0.52 17. Dongar 0.47 0.53 18. Unhale 0.51 0.54 19. Baparde 0.51 0.56 20. Mond 0.54 0.59 21. Holi 0.51 0.55 22. Tulsavade 0.52 0.56 23. Mithgavane 0.54 0.57 24. Vijaydurg 0.53 0.56 25. Anantwadi 0.47 0.51 26. Jambhulwadi 0.49 0.55 27. Bandhawadi 0.47 0.52 28. Rameshwar 0.55 0.60 29. Kambale Lavgan 0.51 0.55 30. Shengalwadi 0.48 0.53 31. Ghumewadi 0.48 0.53 32. Agarewadi 0.47 0.52 33. Wadapeth 0.48 0.52 34. Sakhar 0.46 0.50 35. Madheliwadi 0.48 0.52 36. Shejavali 0.46 0.50 37. Vilaye 0.51 0.55 38. Solgaon 0.54 0.58 39. Devache
Gothane 0.52 0.56
40. Bag Abdul Kadir 0.46 0.51
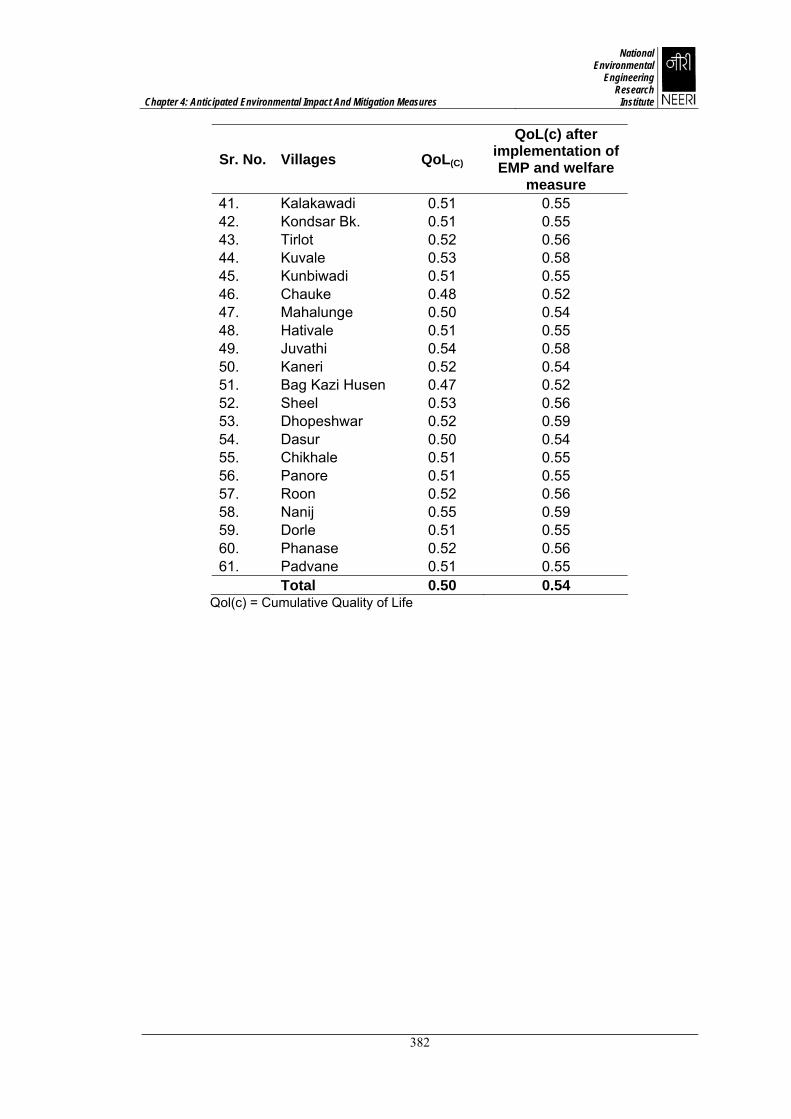
Chapter 4: Anticipated Environmental Impact And Mitigation Measures
National Environmental
Engineering Research
Institute
382
Sr. No. Villages QoL(C) QoL(c) after
implementation of EMP and welfare
measure 41. Kalakawadi 0.51 0.55 42. Kondsar Bk. 0.51 0.55 43. Tirlot 0.52 0.56 44. Kuvale 0.53 0.58 45. Kunbiwadi 0.51 0.55 46. Chauke 0.48 0.52 47. Mahalunge 0.50 0.54 48. Hativale 0.51 0.55 49. Juvathi 0.54 0.58 50. Kaneri 0.52 0.54 51. Bag Kazi Husen 0.47 0.52 52. Sheel 0.53 0.56 53. Dhopeshwar 0.52 0.59 54. Dasur 0.50 0.54 55. Chikhale 0.51 0.55 56. Panore 0.51 0.55 57. Roon 0.52 0.56 58. Nanij 0.55 0.59 59. Dorle 0.51 0.55 60. Phanase 0.52 0.56 61. Padvane 0.51 0.55
Total 0.50 0.54 Qol(c) = Cumulative Quality of Life

Chapter 4: Anticipated Environmental Impact And Mitigation Measures
National Environmental
Engineering Research
Institute
383
4.3 Impacts during Decommissioning Phase
At the end of the operating life of the operating units, which would be
around 60 years for EPR type NPPs, proposed to be established at Jaitapur site, a
detail decommissioning plan will be worked out. The process of decommissioning will
start after the final shutdown of the plant and ends with the release of the site for a
responsible organization as authorized by AERB or for unrestricted use by the public.
The decommissioning plan will be prepared by NPCIL & approved by AERB and will
be implemented as stated above. The plan will ensure that there will not be any
radioactive releases in the public domain / environment, thus impact in the public
domain due to decommissioning of the unit will be negligible.

Chapter 4: Anticipated Environmental Impact And Mitigation Measures
National Environmental
Engineering Research
Institute
384
Section -II
4.4 Radiological Risk Assessment & Emergency Response System
4.4.1 Introduction & Design Philosophy
The Pressurized Water Reactors (PWRs) proposed to be set up at Jaitapur
have all the features of the modern third generation technology, similar to western
designs in respect of philosophy, features and construction. The design of plant is
consistent with the standard international practices for safety systems. The basic
concept of defense in depth in this plant includes the use of redundancy, diversity,
independence and fail safe design. In fact, design features of the PWR’s proposed to
be set up fall in the category of advanced Light Water Reactor (LWR) as per
International Atomic Energy Agency (IAEA).
According to International Nuclear Safety Advisory Group, INSAG – 10
IAEA 1996 for water cooled reactors at power operation, the barriers confining the
fission products are typically the fuel matrix, the fuel cladding, the boundary of the
reactor coolant system and the containment system. Accordingly, there are five
levels of defense in depth with objectives as briefly explained in Section 2.3,
Chapter 2 of this report.
4.4.2 Safety Objectives
The safety objective is to verify that the reactor and safety systems are
properly designed and operated so that the occupational doses and dose to the
members of public as a result of discharge of radioactive substances from the plant
remain within the limits specified by AERB.
4.4.2.1 Safety Aspects of NPP at Jaitapur
All the radioactive sources in the plant which may lead to radioactive
releases are identified and assessed for their hazard magnitude. However, the worst
case scenario for any nuclear power plant is considered to be the damage of core
where the fuel is loaded and a sustained chain reaction takes place in normal course
of plant operation.

Chapter 4: Anticipated Environmental Impact And Mitigation Measures
National Environmental
Engineering Research
Institute
385
Accordingly, safety aspects are identified and evaluated by deterministic
as well as by probabilistic assessment. Probabilistic safety assessment is seen as
an extension of or complement to deterministic analyses. It systematically considers
conceivable accident causes (Postulated Initiating Events (PIEs)) and for each
initiating events, which can lead to core damage of different categories Core Damage
Frequency (CDF) is calculated based on individual initiating events (IE) frequency.
Through individual event sequence analysis for different IEs, it is estimated that the
plant is provided adequate safety features and measures to mitigate or minimize any
unsafe consequences.
As per AERB Safety Guide (SG-D-5), DBE (Design Basis Events) are
categorized into four categories on the basis of their expected frequency of
occurrence. Each of the DBE considered should be assigned to one of the following
groups.
(1) Category-1 Events- Normal Operation, Operation transient and AOO
(2) Category-2 Events- Events of moderate frequency
(3) Category-3 Events- Events of low frequency
(4) Category-4 Events- Multiple failures and rare events.
Events not falling in any of the above categories are called BDBE (Beyond
Design Basis Events).
The concept of defense-in-depth is conveyed at all phases or activities
related to ensuring the NPP safety. Here, the strategy for preventing unfavorable
plant damage state initiating events, especially for the 1st and 2nd level is of primary
importance (details are provided in Section 2.3 of Chapter 2 of this report).
In normal operating conditions, all of the physical barriers must be capable
of functioning, whereas the measures on protecting them must be available. On
detecting any problems in any of the barriers envisaged by the design or
unavailability of measures for protecting it, the reactor plant must be shut down and
measures for bringing the nuclear power unit in a safe state must be taken.
The engineering measures and managerial, decisions meant for ensuring
safety of NPP must be proven by the previous experience or tests, studies or
operating experience with prototypes. Such an approach should be applied not only
when developing the equipment and designing the NPP, but when manufacturing the

Chapter 4: Anticipated Environmental Impact And Mitigation Measures
National Environmental
Engineering Research
Institute
386
equipment, constructing and operating the NPP and upgrading its systems
(components) as well.
The values of overall Core Damage Frequency (CDF) will be within the
design target of 1.0 E-6 /reactor-year for the reactor proposed to be set up at
Jaitapur, which is below acceptable limit of 1.0 E-5 /reactor-year, as per International
Atomic Energy Agency (IAEA) Safety Series No. 75 – INSAG-3, 1988.
4.4.2.2 Multi Barriers of Safety
The safety of the NPP is ensured by incorporating many barriers between
the source and the receptor. Protection implies a system of physical barriers on the
way by which the ionizing radiation and radioactive substances can release into the
environment. This system is used together with a complex of engineering and
managerial measures for protecting these barriers and maintaining their
effectiveness and measures for protecting the personnel, population and the
environment.
The system of physical barriers of the NPP power unit incorporates: a fuel
element, fuel element cladding, the pressure boundary of the reactor coolant and the
containment. An exclusion zone also provides a dilution of radioactivity before it is
reaches to the public domain.
4.4.3 Radiological Objectives
The general principle applied is that, for the transients, incidents and
accidents considered in the design (Table 4.9), the more frequent the event, the
lower the radiological consequences must be.
The normal operating and transient conditions must not result in normal
operating limits being exceeded. These operating conditions and transients are
covered by the overall dose limit of 1.0 mSv /yr to the members of public at 1.6 km
from the reactor i.e. the fence post of the exclusion zone.
The radiological objectives associated with other conditions viz. accidents
(Table 4.9) to meet the appropriate reference dose limits under these conditions. For
the above referred conditions, the maximum thyroid and whole body doses from NPP
at a distance of 1.6 km would be kept well within the reference doses of 500 mSv to
child thyroid and 100 mSv to an adult whole body as stipulated by AERB.
Chapter 4: Anticipated Environmental Impact And Mitigation Measures
National Environmental
Engineering Research
Institute
387
4.4.3.1 Radiological Aspects for NPP at Jaitapur
The radiological consequences to the public can be broadly divided into
two categories i.e. during normal operation and during accident condition. During
normal operations, the controlled release of radioactive materials is governed by the
Effective Dose Limits (EDL), applicable to the members of public. EDL as stipulated
by AERB is 1 mSv/year. There are mainly two routes of exposures i.e. air route and
aquatic route. In accident conditions, the consequence depends on the accident
scenario.
While siting nuclear power plants, three areas are defined as exclusion
zone, sterilized zone and monitoring zone. Exclusion zone extends up to 1.6 kms,
which will be under the exclusive control of the power station where no public
habitation is allowed. The sterilized zone is the annulus between 1.6 kms and 5 kms
radius from the reactors where natural growth is permitted but new expansion of
activities which lead to enhance population growth are regulated. Whereas, the area
from project to site 30 kms zone is the monitoring zone. The areas under plant zone,
exclusion zone and sterilized zone for the JNPP Project are shown in Fig. 4.11.
For, Jaitapur Site, the methodology for calculation of doses during off
normal situations will be as per AERB safety guide (AERB/SG/S-5D-21). The doses
will be worked out by using the two types of dose conversion factors. For initial two
hrs into the accident, the site-specific worst meteorological parameters are assumed
to maximize the dose. For subsequent releases, time averaged dispersion
parameters are used. The worst affected sector will be taken with no change in wind
direction.
The maximum thyroid and whole body doses from NPP under abnormal
situations at a distance of 1.6 km will be kept well within the reference doses of 500
mSv and 100 mSv as stipulated by AERB for thyroid and whole body respectively.
4.4.3.2 Radiation Protection Considerations
4.4.3.2.1 ALARA Policy
The radiation protection policy taken into account for design is to ensure
that the individual dose of site personnel and members of the public does not exceed
the dose limits set by the regulatory agency and is kept at a level As Low As
Chapter 4: Anticipated Environmental Impact And Mitigation Measures
National Environmental
Engineering Research
Institute
388
Reasonably Achievable (ALARA) and as per the requirements of AERB. The details
are presented as in Section 2.9.4, Chapter -2.
This policy is embodied in the design, construction, operation,
maintenance, in-service inspection, refueling, and non-routine activities.
4.4.3.2.2 General Design Considerations
General design considerations and methods employed to maintain in
Plant occupational radiation exposures, in line with ALARA have two objectives:
- to minimize the amount of personnel time spent in radiation areas,
- to minimize radiation levels in routinely occupied Plant areas and in the
vicinity of Plant equipment expected to require personnel attention.
Equipment and facility design are considered in maintaining occupational
radiation exposures ALARA during plant operations including: normal operation,
maintenance and repairs, refueling operations and fuel storage, in-service inspection
and calibrations, radioactive waste handling and disposal, and other anticipated
operational occurrences.
General equipment design considerations to minimize the amount of
personnel time spent in a radiation area include:
- Reliability, durability, construction, and design features of equipment,
components, and materials to reduce or eliminate the need for repair or
preventive maintenance.
- Service convenience for anticipated maintenance or potential repair,
including ease of disassembly and modularization of components for
replacement or removal to a lower radiation area for repair,
- Redundancy of equipment or components to reduce the need for
immediate repair when radiation levels may be high, and when no feasible
method is available to reduce radiation levels,
- Provisions, where practicable, to remotely or mechanically operate, repair,
service, monitor, or inspect equipment.

Chapter 4: Anticipated Environmental Impact And Mitigation Measures
National Environmental
Engineering Research
Institute
389
General facility layout design considerations to minimize the amount of
personnel time spent in a radiation area include:
- locating equipment, instruments, and sampling stations which will require
routine maintenance, calibration, operation, or inspection, for ease of
access and minimum required occupancy time in radiation areas,
- laying out Plant areas to allow remote or mechanical operation, service,
monitoring, or inspection of highly radioactive equipment,
- providing, where practicable, for transportation of equipment or
components requiring service to a lower radiation area.
General facility layout design considerations directed towards minimizing
radiation levels in Plant access areas and in the vicinity of equipment requiring
personnel attention, include:
- separating radiation sources and occupied areas, where practicable (e.g.,
pipes or ducts containing potentially highly radioactive fluids, do not pass
through occupied areas),
- providing adequate shielding between radiation sources, and access and
service areas,
- where appropriate, separating equipment or components in service areas
with permanent shielding,
- locating equipment, instruments and sampling sites in the lowest
practicable radiation zone,
- providing means and adequate space for utilizing movable shielding for
sources within the service area, when required,
- providing means for decontamination of service areas,
- providing means to control radioactive contamination and to facilitate
decontamination of potentially contaminated areas.
4.4.3.3 Average Environmental Radiation Dose to the Members of Public at 1.6 Km Radius for Operating NPP’s in India
As per the reports from Environmental Survey Laboratory (ESL), BARC,
the average environmental radiation dose (micro Sievert per year) at 1.6 Km radius
due to operation of Nuclear Power Plants in India 2000-2007 is given in the Fig. 8 of
the Summary EIA. The present AERB public domain dose limit is 1000 micro Sievert

Chapter 4: Anticipated Environmental Impact And Mitigation Measures
National Environmental
Engineering Research
Institute
390
/year. It may be seen that the public domain dose values in case of TAPS, RAPS
and MAPS have been reported to be mostly below 50 micro Sievert / year (20 times
lesser than stipulated standard). In the case of NAPS, KAPS and Kaiga, these value
are in the range of 1.7 to 2.8 micro Sievert / year. This is also to mention that these
values are excluding background natural radiation average dose of 2400 micro
Sievert / year and medical exposures. This indicates that the exposure of public to
the radiation is far below the stipulated limit in all the nuclear power plants in India.
4.4.4 Monitoring of Environment around NPP Site
At each nuclear power plant, Environmental Survey Laboratories are set
up long before the plant goes into operation. These laboratories carry out analysis of
background radioactivity in the area. The purpose is to establish the baseline
radiation levels. Thereafter, when the power plant is commissioned and operated, the
radiation levels in the environment are monitored regularly up to 30 km distance from
the reactors. Within the exclusion boundary, continuous monitoring of radiation
situation is done by automated environmental radiation monitoring system. This is
being done at all the nuclear power plants in India on continuous basis.
It has been reassuring to note that there has been no adverse impact on
the environment due to operation of the Nuclear Power Plants in India.
4.4.4.1 Environmental Survey Laboratory
An Environmental Survey Laboratory (ESL) will be set up for regular
monitoring of environmental parameters throughout the operation of the plant.
The primary aim of the environment monitoring program is to assess the
radiation exposure of public residing around Jaitapur site and to demonstrate that
radiation exposure received by the member of the public is within the limit prescribed
by the regulatory agency based on international guidelines
Objectives of Environmental Monitoring
• To generate environmental radiological database.
• To assess the possible dose commitments to the population due to operation
of the nuclear power station.
• To determine control action during site / off site emergencies.
Chapter 4: Anticipated Environmental Impact And Mitigation Measures
National Environmental
Engineering Research
Institute
391
This requires detailed measurements on a number of environmental
matrices for radioactivity content that may result from the release of radioactivity
effluents during the normal operation of the nuclear facilities.
• Pre-operational survey
• Operational Survey
– External Radiation
– Radioactivity concentration in air & water.
– Strontium, Cesium and Iodine activity in environmental matrices.
Type of Sample Number of Typical Samples Analyzed in a Year
----------------------------------------------------------------------------------------------------------------- Surface water 500 Drinking water 200 Well water 400 Air Samples for tritium 500 Air samples for particulates 50 Goat Thyroid 50 Vegetables, milk, pulses, cereals, meat, eggs, fish, etc. 70 Weed, silt, soil, sediments, grass, leaves, etc. 40 -----------------------------------------------------------------------------------------------------------------
Environmental Survey Laboratories (ESL) are located at each of the
nuclear power project sites in the country. These ESLs are operated by an
independent organization viz. Health Physics Division of Bhabha Atomic Research
Centre. At the existing NPPs, ESLs have been collecting samples in the radius of 30
km from the plant site and their reports conclude that the dose to population at the
fence resulting from the existing NPPs in the country is about 1.5% of the authorized
dose limit, which is a small fraction of the natural background radiation. The doses at
further distances are still lower.
4.4.5 Radiation Emergency Response System in Indian Nuclear Power Plants
The purpose of planning for on-site/off-site radiation emergency response
is to ensure adequate preparedness for protection of the plant personnel and
members of the public from significant radiation exposures in the unlikely event of a
severe accident. The probability of a major accident resulting in the releases of large
quantities of radioactivity is extremely small. The probability, however, can never be

Chapter 4: Anticipated Environmental Impact And Mitigation Measures
National Environmental
Engineering Research
Institute
392
reduced to absolute zero and therefore this residual risk is sought to be mitigated by
appropriate siting criteria and implementing suitable arrangements for emergency
planning and preparedness.
As stipulated in AERB Safety Guide No. SG/HS-1, to limit the radiological
consequences in public domain, the whole area around NPPs is divided into three
domains based on severity of prevailing radiation fields subsequent to the accidental
release of radioactivity. Appropriate intervention levels and derived intervention levels
are assigned in advance for each domain so that off-site emergency counter-
measures could be implemented in a pre-planned manner. Following counter-
measures have been found suitable to deal with radiological emergency in the public
domain.
• Iodine Prophylaxis administration
• Sheltering
• Evacuation
• Decontamination
• Control of food and water supplies
• Use of stored animal feed
• Decontamination of area
The selection of one or more of the above protective measures is based on
the nature of the accident and its associated risk and in particular, time factor
associated with these two factors.
The intervention levels as stipulated in AERB Safety Guide No. SG/HS-1
for protective measures are implemented at very low radiation levels, compared to
radiation levels which cause serious injurious to persons receiving acute whole-body
radiation exposure.
The requirements of emergency counter-measures in case of various DBE
are assessed. Emergency counter-measures like distribution of iodine prophylaxis
and sheltering would be needed based on intervention level.
The agencies responsible for carrying out remedial measures during the
different categories of emergencies mentioned above are as follows:

Chapter 4: Anticipated Environmental Impact And Mitigation Measures
National Environmental
Engineering Research
Institute
393
Type of Emergency Responsible Agency Emergency Standby Personnel Emergency Plant Emergency
Site Emergency
Plant / Site Management
Off-site Emergency District authorities of the State Government having jurisdiction over the public domain affected by the accident, normally the District Collector.
Emergency Standby Emergency standby is defined as abnormal plant conditions with potential
to develop into accident situations, if timely preventive actions are not taken. During
this situation pre-identified plant personnel are placed in a state of alert for
implementing the emergency response procedure.
Personnel Emergency When the radiological consequences of an abnormal situation are confined
to some personnel working in a plant, without affecting the plant, it is described as a
personnel emergency. For example, some of the plant personnel may be working at
a location within the reactor building where the radiation field is significantly above
prescribed limits for extended period resulting in their excessive radiation exposure.
Some other examples of personnel emergency are given below:
- splashing of radioactive material on personnel while carrying out
operation/maintenance in such a manner that excessive contamination,
internal and/or external, has occurred or is suspected;
- high uptake of radioactive material has inadvertently occurred or is
suspected;
- personnel contamination at levels exceeding prescribed limits;
- high external exposures has occurred or is indicated;
- the person is physically ill or incapacitated;
- exposed to a heavy chlorine dose in a chlorine plant.

Chapter 4: Anticipated Environmental Impact And Mitigation Measures
National Environmental
Engineering Research
Institute
394
Plant Emergency When the radiological consequences of an abnormal situation are
expected to remain confined to the plant, it is described as a plant emergency. This
situation may arise during operation or shutdown maintenance of the reactor.
Site Emergency An accidental release of radioactivity extending beyond the plant but
confined to the site boundary (exclusion zone) constitutes a site emergency. An
assessment of such a situation would imply that protective measures are limited to
the exclusion zone. Site Emergency is declared and terminated by Site Emergency
Director (SED). The protective measures in a Site emergency include evacuation
from the affected parts of the site and also radiological monitoring of the environment
in the Emergency Planning Zone (EPZ). The emergency reference level for on-site
emergency is given below.
Off Site Emergency An off-site emergency occurs when the radiological consequences of an
emergency situation originating from NPP are likely to extend beyond the site
boundary (exclusion zone) and into the public domain. For the purpose of planning
off-site emergency, an emergency-planning zone (EPZ) up to 16-km radius is
specified. There should be fixed criteria to determine an off-site emergency in terms
of the release of radioactivity as indicated by the radiation monitoring system.
The protective measures in public domain shall be implemented by the
District Officials under the supervision of the district collector or the divisional
Commissioner, who shall be designated as the off-site Emergency Director (OED).
The manual on Off-site Emergency Response Plans would be issued by
the State Level Emergency Response Committee. The manual shall specify the need
of radiation impact assessment based on immediate, intermediate and long-term
consequences according to space-time domain concept and the necessary
intervention measures such as evaluation, sheltering and food control. Off-site
emergency shall be declared and terminated by OED on the basis of technical
assessment made by SED.
The Station Director JNPP is identified as the Plant Emergency Director
(PED) and all the Superintendent and Health Physicist are the members of the plant
Emergency Committees.

Chapter 4: Anticipated Environmental Impact And Mitigation Measures
National Environmental
Engineering Research
Institute
395
Consequent to the declaration of the site emergency the Station Director of
JNPP handover the charge of Plant emergency director (PED) to Chief
Superintendent and assumes the charge of Site Emergency Director (SED). The
PED provides all plant related information to the SED and works as per the advice of
the SED to mitigate the situation in the plant.
The SED is the Chairman of the Site Emergency Committee (SEC) and is
responsible for convening the SEC, when the 1st report of the initiation of an
emergency is received by SED. SED shall obtain technical inputs, such as particulars
of the accident, from the members of the SEC. The decisions for
declaration/termination of an emergency shall be based on inputs so obtained. The
Site Emergency Organisation structure & the recommended plant emergency
response action flow diagram are chalked out.
Consequent to the declaration of the Off-site emergency For JNPP, the
District Collector, Ratnagiri will be the Off-site Emergency Director (OED). Its
membership includes the chiefs of all public services relevant to the emergency
management in the district and the Station Director of JNPP. The OED shall be the
Chairman of the Off-site Emergency Committee (OEC) and is responsible for
convening OEC when the report of the initiation of an emergency is received by
OED. The Action Flow Diagram for the site/off-site emergencies and Information
Flow Diagram for site/off-site emergencies have been chalked out.
The Shift Charge Engineer (SCE) on duty is among the first to learn about
the occurrence of an off-normal situation. He shall evaluate the condition and the
data on the basis of which an emergency may be declared / terminated. He shall
notify SED about any condition which may warrant the declaration of an emergency.
Exercises
Emergency scenarios shall be developed to test emergency plans and
operational response at all levels. Exercises and drills shall be conducted once in a
quarter for Plant Emergency to see that the staffs are adequately trained and all the
emergency equipment are kept in good conditions. At the end of each exercise/drill
an evaluation of the response call shall be carried out to take care of any deficiency
noticed. Site emergency exercise is carried out once in a year. Off-site Emergency
exercise is carried out once in two years.

Chapter 4: Anticipated Environmental Impact And Mitigation Measures
National Environmental
Engineering Research
Institute
396
Emergency plan shall be reviewed at least once in five years, the
improvements and updating procedures shall be implemented based on feed back
and critiques from exercises.
Periodic exercises are conducted as per stipulation of AERB with the
active participation of relevant state and public authorities. These exercises are
witnessed by observers from Crisis Management Group (CMG), DAE, AERB, BARC
and NPCIL-HQ.
Feed back is a very valuable aspect of the exercise of offsite emergency
and authorities will resolve the deficiencies surfaced out and action plan will be
chalked out depending upon the requirements.
The approved plan for JNPP will be ready before criticality of JNPP -unit1.
The nature and magnitude of response measures would depend on the
specific category or extent of emergency. Though safety evaluation of an NPP
relates to design basis, the JNPP emergency response plan shall be based not only
on design basis events but also on accident conditions due to more severe events,
even if they have a very low probability of occurrence. An analysis of such events
and the projected radiological consequences specific to the NPP shall form the basis
of response plan, so that the nature and magnitude of response actions could be
established.
4.4.6 Emergency Preparedness System for JNPP
The documented emergency planning and preparedness program to be
established and practiced for JNPP will be approved by AERB. This documented
manual on emergency preparedness and response for JNPP will be in two volumes
as follows:
Volume-I - Plant/Site Emergency Procedure.
Volume-II - Procedure for Off-Site Emergency.
The salient features of the emergency preparedness system for JNPP are
elaborated in the following sections.

Chapter 4: Anticipated Environmental Impact And Mitigation Measures
National Environmental
Engineering Research
Institute
397
4.4.7 Volume-I Plant/Site Emergency Procedure
4.4.7.1 Emergency Organization and Responsibility
To effectively manage the emergency situation at JNPP, Jaitapur site
Emergency Committee (JEC) consisting of Advisory Group, Service Group, Damage
Control Group and Rescue Team will be established. The details of Jaitapur
Emergency action flow diagram for site / off site emergencies is presented in
Fig. 4.4.2.
4.4.7.2 Communication
The responsibility of communication during emergency lies with
Communication Group. This group ensures that all communication equipment is kept
functional at all time. It consists of Engineer- in -charge of the Plant, communication
system, Telephone operators and wireless operator.
4.4.7.3 Resources and Facilities
Main Control Room conference room will be made into Plant Emergency
Control Centre (PECC) and Station Director’s Office will be converted in to Site
Emergency Control Centre. These centers will be provided with communication
facility within the JNPP site and outside agency.
The plant emergency equipment centre will be located at Administrative
building or any suitable location and it will be augmented with ready to use
equipment for the plant /site emergency. Normally Zone-II and Zone III area shower
and wash room are to be used for emergency personnel decontamination purpose.
However there will be a separate facility for casualty at Residential complex hospital
when it is commissioned. A special emergency service vehicle fitted with two –way
radio equipment and necessary monitoring & survey equipment will be available at all
time under control of on duty Shift Charge- Engineer (SCE). Different assembly
areas for different working groups will be identified inside the operating area or plant
fencing and maintained for assembly in the event of an emergency. Emergency
shelter locations will be identified for sheltering /evacuation due to emergency
condition and the plant personnel shall proceed to the shelter areas in the event of an
emergency.

Chapter 4: Anticipated Environmental Impact And Mitigation Measures
National Environmental
Engineering Research
Institute
398
4.4.7.4 Action plan for responding to Emergency
After hearing the emergency siren and announcement about emergency
situation and or getting information of the same through telephone, all responsible
members of the JEC shall proceed to Main control room/ PECC. Details of handling
plant /on-site emergency situations will be documented and made available at PECC.
The action flow diagram for on site and off site emergencies is given in Fig. 4.12.
4.4.8 Volume-II Procedure for Off-Site Emergency
This volume will provide guidelines for handling off-site emergency at
JNPP and deals with emergency management organization, emergency equipment
and facilities for handling the situation up to 16 km radius.
4.4.8.1 Emergency Planning Zones and Sectors
The area around the plant site is divided into various zones and sectors as
described below for effective handling of the emergency situations:
In normal operation of the proposed PWR category nuclear power plant,
the impact zone would not be beyond 1.6 km, which would also hold good for off
normal situations due to advanced technological features in built in the design of the
reactor. However, on a conservative side, an area of 16 km around the plant is
considered as emergency planning zone as per the requirements of AERB as
described below:
As per AERB requirements, the exclusion zone covers a distance of about
1.6 km around the plant site within which no habitation is permitted and is protected
by security personal from state /central government agency/Central Industrial
Security Force (CISF). The sterilized zone covers a distance from exclusion
boundary at 1.6 km to 5 km radius around the plant site within which natural growth
of population is permitted and unrestricted growth of population and development are
controlled by state administration through administrative measures. The zone of
0 -16 km is termed as emergency planning zone (EPZ) and is divided in to 16 sectors
marked as A to P in clockwise direction .
4.4.9 Frequency /Periodicity of Emergency Exercises
• Plant emergency Exercise – Quarterly
• Site emergency Exercise – Yearly
Chapter 4: Anticipated Environmental Impact And Mitigation Measures
National Environmental
Engineering Research
Institute
399
• Off-Site emergency Exercise – Two Yearly
4.4.10 Habitability of Control Rooms under Accident Conditions
The habitability of control rooms under accident conditions is ensured as
indicated below:-
The habitability systems of the main control room (MCR) and
supplementary control room (SCR) incorporate systems and equipment, protecting
the operators from radioactive, toxic and harmful gases, aerosols and smoke, for
creating safe normal habitability conditions permitting the operators to control the
power unit and also to maintain it in a safe state even under emergency modes,
including accidents involving the primary circuit loss of coolant.
4.4.10.1 Mode I – Normal Operating Conditions
In the normal mode, supply of outdoor air cleaned from dust is provided.
Duration of mode I is not restricted. The air entering from outside is mixed with
recirculation air, is cleaned on coarse and fine filters, cooled in the air cooler and by
the fan along air ducts network is supplied to the room via fire-retarding ducts. The
air from the rooms is withdrawn by exhaust fans and is supplied to the suction of the
air conditioning systems and to plenum vent center. The difference between the
amount of the plenum and recirculation air creates the required air head in the MCR
rooms.
4.4.10.2 Mode II – Filtering/Ventilation Mode
The operation mode II is introduced automatically by indications of the
radiation monitoring transducers on rise of radioactivity in the intake air more than
≥3⋅10-7 Gy/h, corresponding value of volume activity of iodine radionuclides 3⋅10 +2
Bq/m3. Mode II duration is not less than 10 hr - period required for bringing the unit to
cool down state. The outdoor air flow rate is determined by the necessity to create a
head in the MCR air-tight area, as well as providing of the personnel with the outdoor
air meeting the sanitary (public health) standards (60 m3 per human being).
Outdoor air, now passes via filters, is cleaned, and supplied to suction of
the air conditioning system. The air conditioning system continues functioning as in
mode I.
Chapter 4: Anticipated Environmental Impact And Mitigation Measures
National Environmental
Engineering Research
Institute
400
4.4.10.3 Mode III – Mode of Total Isolation of the MCR Rooms
This mode is introduced during emergencies for a period permitting the
external services of radiometric and chemical control to determine the content and
concentration of toxic substances in the atmospheric air in the MCR conditioners air
intake area.
Besides, mode III shall be introduced in case of the outdoor air
contamination by toxic substances, carbon monoxide (in case of fire) and other
harmful substances not retained by the absorbing filters. In mode III air-tight valves in
the outdoor line close, the operator opens manually a valve on compressed air
pipeline. On loss of power supply to the system the operator manually opens a valve
on compressed air pipeline. The conditioning system continues operating for full
recirculation.
To maintain the required pressure in the MCR rooms, compressed air from
cylinders is used. The mode duration is assumed to be 4 h, without replenishment.
With replenishment, the occupancy for indefinite period is possible. Storage location
on the cylinders is decided considering this aspect.
By signals of external surveillance services the operator takes decision
about the necessary mode of ventilation (I, II, III).

Chapter 4: Anticipated Environmental Impact And Mitigation Measures
National Environmental
Engineering Research
Institute
401
Fig. 4.11: Various Zones around Proposed Site of Jaitapur NPP
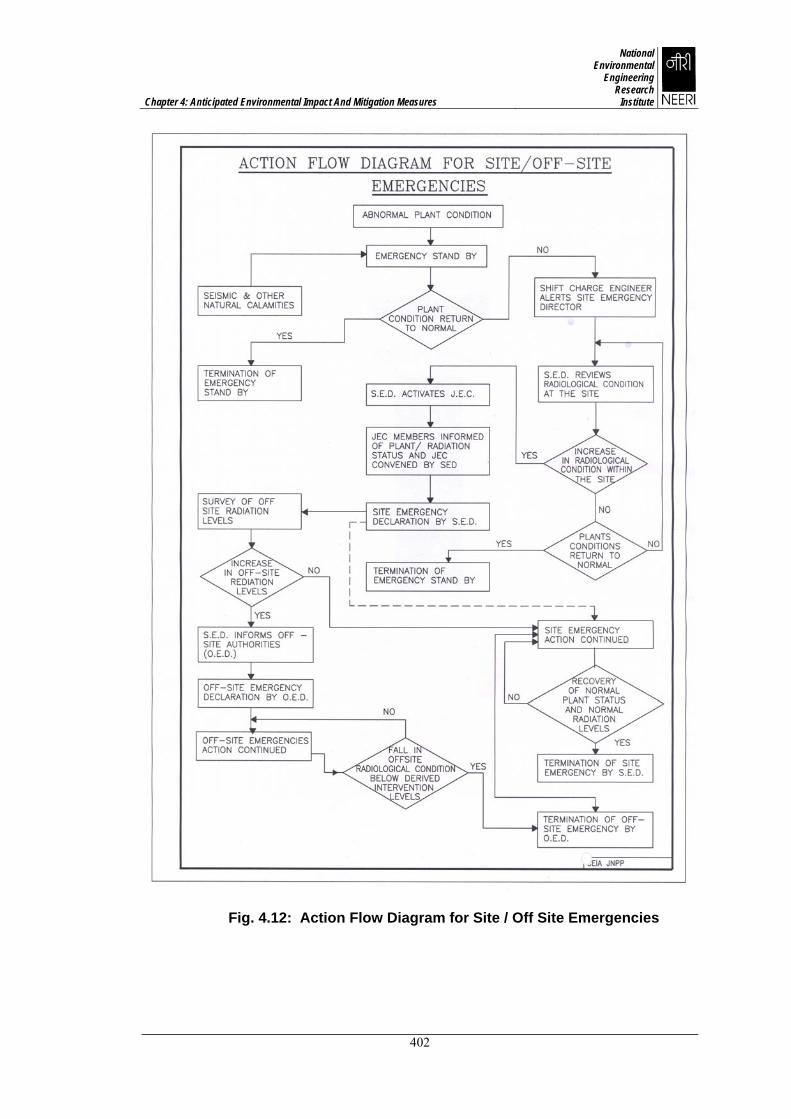
Chapter 4: Anticipated Environmental Impact And Mitigation Measures
National Environmental
Engineering Research
Institute
402
Fig. 4.12: Action Flow Diagram for Site / Off Site Emergencies
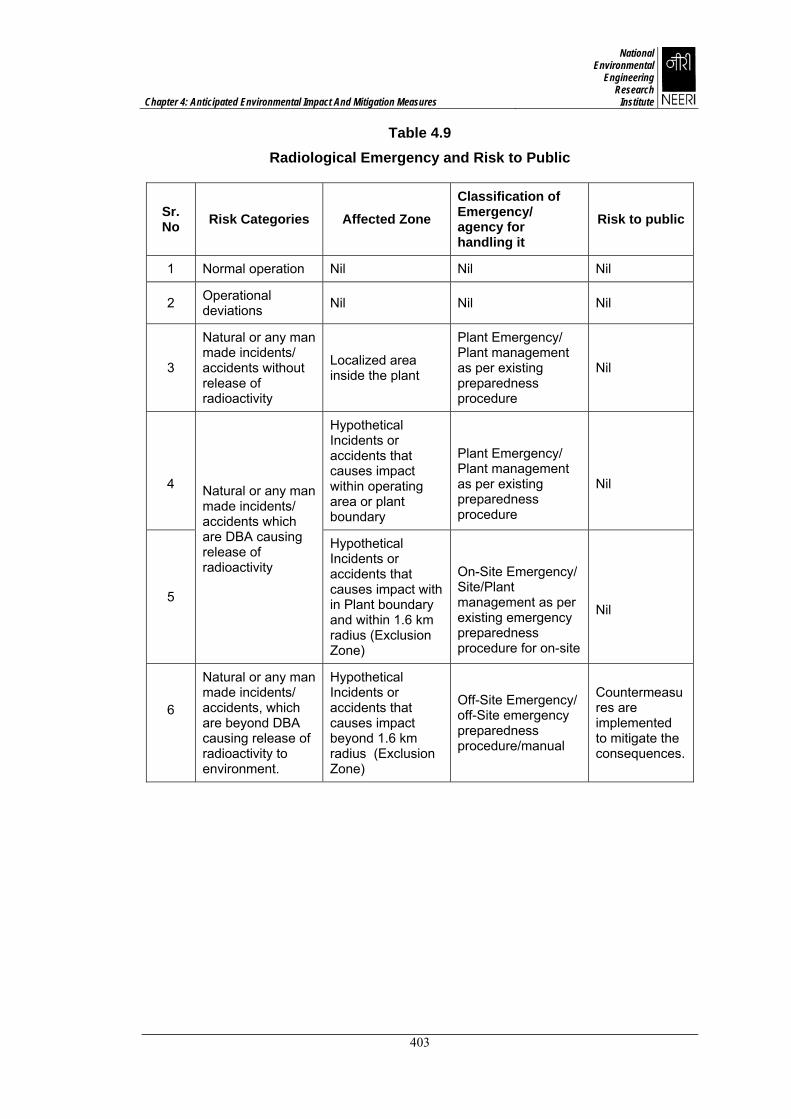
Chapter 4: Anticipated Environmental Impact And Mitigation Measures
National Environmental
Engineering Research
Institute
403
Table 4.9 Radiological Emergency and Risk to Public
Sr. No Risk Categories Affected Zone
Classification of Emergency/ agency for handling it
Risk to public
1 Normal operation Nil Nil Nil
2 Operational deviations Nil Nil Nil
3
Natural or any man made incidents/ accidents without release of radioactivity
Localized area inside the plant
Plant Emergency/ Plant management as per existing preparedness procedure
Nil
4
Hypothetical Incidents or accidents that causes impact within operating area or plant boundary
Plant Emergency/ Plant management as per existing preparedness procedure
Nil
5
Natural or any man made incidents/ accidents which are DBA causing release of radioactivity
Hypothetical Incidents or accidents that causes impact with in Plant boundary and within 1.6 km radius (Exclusion Zone)
On-Site Emergency/ Site/Plant management as per existing emergency preparedness procedure for on-site
Nil
6
Natural or any man made incidents/ accidents, which are beyond DBA causing release of radioactivity to environment.
Hypothetical Incidents or accidents that causes impact beyond 1.6 km radius (Exclusion Zone)
Off-Site Emergency/ off-Site emergency preparedness procedure/manual
Countermeasures are implemented to mitigate the consequences.

Chapter 4: Anticipated Environmental Impact And Mitigation Measures
National Environmental
Engineering Research
Institute
404
Section -III
The assessment and prediction of impacts for Coastal Regulation Zone (as
per) due to the proposed nuclear power park at Jaitapur is enumerated below:
4.5 Environmental Impact Assessment for Coastal Regulation Zone (CRZ)
This proposed project is a coastal site project and thus falls under the
purview of Coastal Regulation Zone (CRZ) Notification -1991 amended till October
2001. Accordingly, a detailed CRZ demarcation study has been carried out by
National Institute of Ocean Technology (NIOT), Chennai. The report issued by NIOT,
Chennai in November, 2007 is appended as Annexure-VI, Volume-II. The plot plan
of all six units in proposed location with associated project facilities is superimposed
on the CRZ zoning map for assessment of the environmental impact on CRZ due to
the proposed project.
4. 5.1 Applicable Provisions of CRZ Notification to Projects Proposed by Department of Atomic Energy (DAE)
Costal Regulation Zone Notification dated 19th February, 1991 issued by
the Ministry of Environment & Forests (MoEF) (under section 3 (1) and Section 3 (2)
(v) of the Environment (Protection) Act, 1986 and Section 5(3)(d) of Environment
(Protection) Rules, 1986) as amended till October 2001 declares the Coastal
Stretches of seas, bays, estuaries, creeks, rivers and backwaters, which are
influenced by tidal actions (on the land ward side) up to 500 m from the High Tide
Line (HTL) and the intertidal land between the Low Tide Line (LTL) & HTL as Coastal
Regulation Zone (CRZ). As per the provisions of Para `2` of MOEF notification vide
S.O. 114 (E) in October 2001, the setting-up of new industries and expansion of
existing industries and other activities are prohibited in CRZ, except for (a) those
directly related to water front or directly need foreshore facilities and (b) Projects of
Department of Atomic Energy (DAE).
However, under Para 3.0 for “Regulation of Permissible Activities”, of
subject notification, the proposed Nuclear Power Park at Jaitapur under DAE, which
also requires water front and foreshore facilities falls in CRZ and need to obtain

Chapter 4: Anticipated Environmental Impact And Mitigation Measures
National Environmental
Engineering Research
Institute
405
“Environmental Clearance” from MOEF as per amended notification of October 2001
on CRZ from MOEF.
The subject CRZ Notification defines HTL as the line on the land up to
which the highest water line reaches during the spring tide. The MoEF guidelines
stipulate that HTL / LTL be identified based on geomorphologic signatures in the field
/ satellite imageries / aerial photographs.
4. 5.2 Salient Features of the Project Site
The Jaitapur Nuclear Power Park (JNPP) will be located in the area
between Rajapur creek and Vijaydurg creek, about 40 km south of Ratnagiri, on the
West Coast. At one corner of the site in the north - west direction, Waghapur point
lighthouse of Rajapur Bay is situated. The nearest village to the site is Madban
The Latitude and Longitude of the site are as follows:
Latitude : 16o 34’ 38” N - 16o 36’ 29” N
Longitude : 73o 19’ 02” E - 73o 20’ 48” E
A land measuring 692.301 ha adjoining the sea is available and being
acquired for locating a Nuclear Power Park of 10,000 MWe capacity (NPPs of 6 x
1650 MWe or 10 x 1000 MWe PWRs).
Most of the site area is barren with laterite rocks without any vegetation
and human activities. As per the baseline survey of land and marine area of
proposed NPP carried out by NEERI, Nagpur and an exclusive report on “The
Baseline Marine Ecological Assessment Study of Sea Around Proposed NPP”, by
College of Fisheries, Ratnagiri (The study report is appended as Annexure-VIII in
Volume-II), the report has concluded that there are no suitable sites for roosting or
breeding of the birds and marine species like tortoise etc. exists in the coastal zone
around the project site. The intertidal area varies from 0 to 2.8 m in width and is
rocky, therefore, no significant beach fauna and flora are present. The small patches
of mangrove vegetation are at about 5 km north from the proposed project site.
Fishing activities, salt pans etc are not being carried out in the CRZ area of the
project site.
The elevation of the site varies from RL + 20 m to RL + 29 m with an
average elevation of about RL + 24.5 m above the mean sea level. The safe

Chapter 4: Anticipated Environmental Impact And Mitigation Measures
National Environmental
Engineering Research
Institute
406
elevation for west coast is 3.0 m. The final designed safe elevation of the project site
would be decided considering the flood, tsunami, etc due to sea waves. Residential
complex is also proposed at a distance of about 5 km in South East direction from
the proposed site of nuclear power plant, and does not fall under CRZ.
4. 5.3 HTL / LTL Demarcation of Jaitapur Coast
High and Low Tide Line demarcation off Waghapur Head land for the
proposed JNPP was carried out by National Institute of Ocean Technology (NIOT),
Chennai.
The High tide level at the survey site was taken to be at +1.4 m (w. r. t
mean sea level). The chart datum which is equivalent to Low tide line is at –1.4 m
from MSL. These relations are derived from the tidal characteristics published on
Naval Hydrographic Chart (NHO 213).
The MSL reference was recovered from permanent Bench Marks situated
at Vijayadurg and Musakazi near the survey site. The tidal data from two tide gauges
installed at Musakazi and Vijayadurg port were used for bathymetry reduction as well
as confirmation of tidal characteristics. RTK-GPS reference station was set up along
with radio telemetry and the field measurements were carried out with respect to the
position and level of this Reference station.
The vertical control was tied to a permanent bench mark established by
Survey of India. The survey consisted of spot leveling and positioning by moving the
rover unit in profiles for HTL and bathymetry for LTL. The topographic survey was
supplemented by the data from Survey of India. Based on combined data of
topography and bathymetry, a digital terrain model was prepared and on which the
High Tide Line was delineated at a level of +1.4m and Low Tide line at -1.4m from
MSL.
The cadastral map issued by local revenue authorities has been
superimposed on the HTL demarcation. The scaling and orientation of cadastral map
were adjusted to match with the HTL for chart purposes.
The HTL/LTL demarcation superimposed on the revenue map of JNPP
Site is presented as in Fig. 5 of Summary EIA of this report in WGS-84 UTM
coordinates.

Chapter 4: Anticipated Environmental Impact And Mitigation Measures
National Environmental
Engineering Research
Institute
407
4.5.4 Project Facilities Located in CRZ
The lay-out of 6 X 1650 MWe units indicating all the buildings, structures
and other facilities of the project superimposed on HTL demarcation is presented in
Fig. 6 & Fig. 7 of the Summary EIA of this report. From the study of the Fig. 6 & Fig. 7, it is inferred that the following essential main plant buildings will be located in
CRZ.
i Reactor Buildings
ii Safeguard Buildings
iii Fuel Buildings
iv Nuclear Auxiliary Buildings
v Diesel Buildings
vi Radioactive Waste Processing Buildings
vii Electrical Buildings
viii Turbine Buildings
ix Pump House Buildings
x Health Physics Buildings
xi DM Water Plant
xii Desalination Plant.
xiii Fire Fighting Pumping Stations
xiv Oil and Grease Storage
xv Plant service Workshop/Ware-house
xvi Interim storage for Solid Rad-Waste
xvii Technical Services Building.
It is mentioned that some of the above mentioned buildings / facilities are
common for all the units. These buildings are required to be constructed, on sea
shore because of requirements of foreshore / water front facilities as well as in view
of economic viability of the project. The total covered area for all the above
mentioned essential buildings will be 1.5 km2 (3 km x 0.5 km) for proposed plot plan
for 6 units of 1650 MW each.

Chapter 4: Anticipated Environmental Impact And Mitigation Measures
National Environmental
Engineering Research
Institute
408
4. 5.5 Assessment of Impact on CRZ
4. 5.5.1 Impact on Coastal Line
The Jaitapur Nuclear Power Park (JNPP) requires water front and
foreshore facilities for drawing and discharging condenser cooling sea water.
Accordingly, the segment of coastal line of project site around 3 km length is required
for constructing the intake water structures and associated break wall structures. In
addition, the project will also require the construction of under sea bed condenser
cooling water discharge tunnels of varying lengths from 1.5 km to 2.5 km. Therefore,
the natural coastal area will have some of project structures. As the existing coastal
line is elevated and rocky, it functions as a natural barrier to the ocean currents and
waves. However, the proposed break water wall will also act as barrier to the sea
waves and will not affect the natural function of the coastal line.
4. 5.5.2 Effect of Excavation of Intake Channel, Construction of RoRo Jetty and Breakwater on Sediment Transport
Detailed studies for tidal hydrodynamics in the region of Jaitapur are
carried out by CWPRS, Pune and communicated vide their letter no.
MMC/PROJ/2009 dated 17/4/2009 (Annexure – V(a), Volume –II). The analysis of
prototype data indicated that at Jaitapur mean spring and neap tidal ranges are of the
order of 2.0 m and 1.0 m respectively. The current magnitude upto 0.4 m was
observed in March / April, while it was up to 0.3 m/s in January/ February. The
current flows were predominantly parallel to the shoreline with reversal in direction
taking place depending on the phase of the tide. The monthly ocean circulation
pattern indicated that near Jaitapur coast, the sea currents are northward during
November- January and are southward during March – September. During the
months of February and October, the currents are in transition.
For the proposed project, a breakwater of length of about 2300 m is
proposed which is aligned with the configuration of the Jaitapur headland with
opening towards north. All the six intakes are proposed to be installed in the channel
created by the breakwater. The velocity in the channel is of the order of 0.5 m/s
which is non scouring, non silting velocity. The RoRo jetty is proposed to be
developed in the sheltered area of the breakwater and would be mounted on piles so
that it would offer least resistance to the flow in the channel.

Chapter 4: Anticipated Environmental Impact And Mitigation Measures
National Environmental
Engineering Research
Institute
409
As regards effect of the proposed development on the sediment transport,
no major siltation is expected in the intake channel since velocities are maintained at
non scouring, non silting velocity. Some realignment of flow is expected at the tip of
the breakwater and along the breakwater. However, since the breakwater layout is
generally to the parallel to the configuration of the headland, no major change is
siltation pattern is expected.
The littoral drift in the Jaitapur region is also low, which is of the order of
100,000 m3/year with general direction towards North. Since the breakwater wall for
the proposed project is almost parallel to the configuration of the headland and
channel opening is towards North, the sediment transport in the region is expected to
be minimum.
4. 5.5.3 Disposal of excavated material from main Plant, Intake Channel and Hot Water Discharge Tunnels
It is estimated that approximately around 11 million m3 of excavated
material will be generated from the main plant, intake structure, and outfall tunnel. It
is planned to utilize the same in construction of breakwater, plant construction and
other areas depending upon the quality of the excavated material. If there is any clay
material / silt etc. in the excavated material, the same would be dumped in the sea
beyond 20 m depth contour, sufficiently away from the outfall locations. It is observed
that the sea currents off Jaitapur are generally parallel to the coastline throughout the
year. The currents are towards north during November-January and are towards
South during March-September. Therefore, the dumped material is expected to be
transported in the deep sea with the sea currents and not move to the coastline. The
dredged spoil would be dumped in the deep sea over a large area to avoid formation
of heaps, so that effect of dumping of excavated material on the environment would
be minimum.
4.5.5.4 Impact on Inter-tidal Region
The Jaitapur coastal area being rocky and elevated, the intertidal region is
very narrow varying from 0 to 2.8 m width with mostly rocky beach. This intertidal
region is poor in marine biodiversity of invertebrates, sea weeds etc. Therefore, the
conversion of intertidal area into constructed area to locate the various facilities of the
project in the small stretch will not affect the local marine ecosystem.

Chapter 4: Anticipated Environmental Impact And Mitigation Measures
National Environmental
Engineering Research
Institute
410
4. 5.5.5 Impact on Coastal Zone beyond HTL
The National institute of Ocean Technology (NIOT), Chennai, while
carrying out the CRZ demarcation studies and also Department of Environment,
State Government of Maharashtra, while granting NOC under CRZ -1991 Notification
have classified the coastal zone around JNPP site as CRZ-III, which is undeveloped
without any sensitive zones. Presently, this stretch of land with average elevation of
RL +24.5 above the Mean Sea Level is rocky and barren without any habitation,
vegetation or roosting and breeding sites of the birds and other species. It is also
mentioned that the above area is not being used for salt pans and by the fishermen
for any associated land based activities.
Therefore, conversion of this stretch of land for the construction of the
essential facilities will not have any significant adverse impact on flora, fauna and
human activities.
4.5.5.6 Impact on Sensitive Ecosystem
There is no sensitive eco-system in the intertidal area and 500 m coastal
zone beyond HTL and also this area is not included in any national park or sanctuary.
Therefore, the proposed project activity will not affect any sensitive ecosystem.
It has been observed that a small patch of mangroves is present along the Jaitapur
Creek at a distance of 5 km on the landward side in the northern direction from the
proposed project site. It will not in any way be affected by the proposed project.
A brief description of the impacts, mitigation measures and environmental
management plan for Jaitapur Nuclear Power Plant is given in Table 5 and 6 in
Summary EIA.
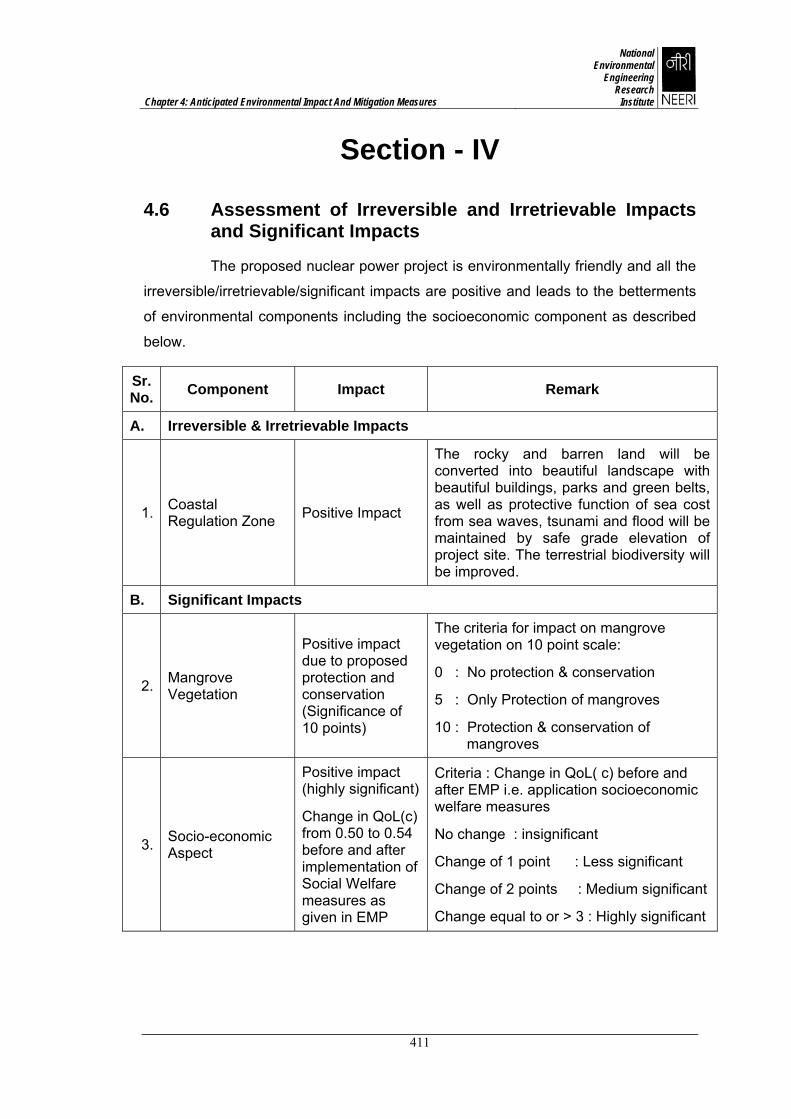
Chapter 4: Anticipated Environmental Impact And Mitigation Measures
National Environmental
Engineering Research
Institute
411
Section - IV
4.6 Assessment of Irreversible and Irretrievable Impacts and Significant Impacts
The proposed nuclear power project is environmentally friendly and all the
irreversible/irretrievable/significant impacts are positive and leads to the betterments
of environmental components including the socioeconomic component as described
below.
Sr. No. Component Impact Remark
A. Irreversible & Irretrievable Impacts
1. Coastal Regulation Zone Positive Impact
The rocky and barren land will be converted into beautiful landscape with beautiful buildings, parks and green belts, as well as protective function of sea cost from sea waves, tsunami and flood will be maintained by safe grade elevation of project site. The terrestrial biodiversity will be improved.
B. Significant Impacts
2. Mangrove Vegetation
Positive impact due to proposed protection and conservation (Significance of 10 points)
The criteria for impact on mangrove vegetation on 10 point scale:
0 : No protection & conservation
5 : Only Protection of mangroves
10 : Protection & conservation of mangroves
3. Socio-economic Aspect
Positive impact (highly significant)
Change in QoL(c) from 0.50 to 0.54 before and after implementation of Social Welfare measures as given in EMP
Criteria : Change in QoL( c) before and after EMP i.e. application socioeconomic welfare measures
No change : insignificant
Change of 1 point : Less significant
Change of 2 points : Medium significant
Change equal to or > 3 : Highly significant