anticipating likely consequences of lottery-based ...bgrofman/4 grofman-merrill...
TRANSCRIPT
Anticipating Likely Consequences ofLottery-Based Affirmative Actionn
Bernard Grofman, University of California, Irvine
Samuel Merrill, Wilkes University
Objectives. To better understand the consequences of whole or partial reliance ontest scores as a screening mechanism for college or university admissions or for jobplacement or promotion. Methods. We introduce a simple hurdles/threshold mod-el to study one particular mechanism that has been recently proposed to generate a‘‘compromise’’ between race-normed or gender-normed standards for acceptance,on the one hand, and the decision to select those with the highest score regardless ofrace or gender, on the other—a method we call lottery-based rules with minimumthresholds of acceptance. Results. We show the factors that determine how closeacceptance rates for the disadvantaged group under lottery-based methods will be tothe acceptance rates under either race-normal or pretest-score-based mecha-nisms. Conclusions. We argue that the likely consequences of using this method arenot nearly as attractive as they might first appear to reformers.
We can certainly find examples of ‘‘objective’’ tests as a choice mechanismin preindustrialized nations (Mandarin China is an example that immedi-ately leaps to mind), but modern industrialized societies have elevated test-ing as a mode of selection to heights never before seen. The United States, inparticular, can readily be characterized as a ‘‘test-taking society.’’ Manyimportant decisions (as to admissions, hiring, and promotion) are reached,at least in large part, on the basis of test results. This fact can have enormousimplications for equality within and across groups categorized by attributessuch as race or gender.
The role of testing in job hiring and promotion, and in all levels ofeducation from transfer to magnet high schools to admission to prestigiouslaw schools and medical schools, has been (and continues to be) the subjectof much political controversy, and of legislation and litigation. Variousmodes of affirmative action have been proposed to compensate for the factthat there are substantial differences in mean performance by race on most
nAddress correspondence to Bernard Grofman, School of Social Sciences, University ofCalifornia, Irvine, CA 92697 [email protected]. The first-named author will share alldata and coding information with those wishing to replicate the study. We are indebted toClover Behrend-Gethard, Dorothy Green, and Chau Tran for library assistance. This re-search was partially supported by the Program in Methodology, Measurement and Statistics,National Science Foundation, via SBR #97-30578 (to Bernard Grofman and AnthonyMarley). The listing of authors is alphabetical.
SOCIAL SCIENCE QUARTERLY, Volume 85, Number 5, December 2004r2004 by the Southwestern Social Science Association

standardized paper-and-pencil tests and in school grade distributions as well(see, e.g., Jencks and Phillips, 1998). Methods proposed to mitigate theconsequences of such differences for admissions, hirings, and promotionsinclude racial quotas, different test score or grade point ‘‘cutoffs’’ for dif-ferent groups, bonus points for ‘‘strivers’’ who overachieve relative to theirgroup’s average performance, lottery methods, methods that use class back-ground as a substitute for race,1 and methods designed to provide geo-graphic balance with the aim of also generating more racial and ethnicbalance in light of patterns of residential segregation (e.g., rules that au-tomatically admit to state universities students who are in the top k% oftheir high school class regardless of where they stand relative to the statewideapplicant pool as a whole).2 Recently, there have been highly publicizedreferenda on the use of racial or gender criteria by state governments thathave considerably affected affirmative action policies in California andWashington (including admission policies for the state universities). In 2003there were two major Supreme Court decisions revisiting the issues about theuse of race in admissions decisions in higher education that lay at the heartof Regents of the University of California v. Bakke, 438 U.S. 265 (1978).3
It is the group-related implications of testing that will be the focus of thisarticle. There is an ongoing debate on the power of tests (e.g., the SAT,ACT, LSAT, GRE) to predict school performance and subsequent life suc-cess, and a similar debate about the predictive power for job performance ofvarious paper-and-pencil and other tests used to help determine hiring orpromotion decisions. In this article we will not attempt to address thiscontroversy about the predictive power of tests for future success.4 Nor willwe seek to contribute to the ongoing debate why group differences in testscores exist/persist (see, e.g., Jencks and Phillips, 1998). Instead, we simplyfocus on the racial and ethnic and gender consequences for admissions orhiring or promotion decisions of using test scores as a key screening devicein situations where we may take the group means and standard deviations on thetest in question to be known. In particular, we develop a model to specify the
1See especially Kahlenberg (1996).2For a very useful general discussion, see Zwick (2002).3The cases are Grutter v. Bollinger, 539 U.S. 982 (2003), dealing with law school ad-
missions to the University of Michigan, and Gratz v. Bollinger, 538 U.S. 959 (2003), dealingwith undergraduate admissions at the same university.
4Courts have been skeptical of test use when it cannot either be directly linked to jobperformance or shown to be a ‘‘business necessity’’ in that it reduces arbitrariness and thepotential for bias in employment decisions (Kadane and Mitchell, 2001). Many civil rightsadvocates have expressed the belief that tests are often used merely to provide the ‘‘appear-ance’’ of fairness, because it will be known in advance that lower test performance can beexpected from members of ‘‘undesired’’ minorities. On the other hand, Spence (1974) notesthat even when a test is not directly related to the skills needed for job performance, testevidence may be used by employers for screening purposes as a signal of general competenceand/or of willingness to invest in human capital. Of course, sometimes testing is discrim-inatorily administered, as was, for example, often the case with literacy tests in the Americansouth (see, e.g., Alt, 1994).
1448 Social Science Quarterly
implications for group-specific acceptance rates as a function of the test-cutoff levels that are used, and of whether the final decision to accept/promote is based solely on test scores or also on some type of lottery-likeconsideration. Thus our models have six key variables: the means and stand-ard deviations of each group, the threshold, and the specific mechanism.5
Of course, we recognize that the desirability of any testing regime iscontingent on the value of the test as a predictor of future success. None-theless, the empirical implications of alternative testing regimes for race-specific (or gender-specific) acceptance rates can be investigated withoutaddressing the predictive value of particular tests, and without debating, inthe abstract, philosophic issues having to do with affirmative action.6
Consider two groups that differ in either their mean or standard devi-ations on some attribute, which we may take to be a test score. For values ofthe attribute that are approximately normally distributed, it is well knownamong statisticians that if we impose some threshold such that only groupmembers who score above that threshold will be chosen, then, ceteris paribus:(1) for unequal group means and identical standard deviations, the higher thethreshold, the greater will be the acceptance rate of the group with highermean relative to that of the group with lower mean; and (2) for identicalgroup means and unequal standard deviations, the higher the threshold (abovethe common mean), the greater will be the acceptance rate of the group withhigher standard deviation relative to that of the group with lower standarddeviation (see, e.g., Paulos, 1995; Berger, Wang, and Monahan, 1998).
These simple statistical insights (based on the properties of the normaldistribution and related unimodal distributions) have important implica-tions in a variety of applications. For example, the interaction betweenthresholds and acceptance rates can help explain why we may observe verylow proportions of members of some groups in situations where the selec-tion process chooses only those who are rather far out on the tails of dis-tributions (Crow, 2002:85). As we shall see, the magnitude of these ‘‘tails ofdistributions’’ effects can be rather astonishing, even to people who wouldsee themselves as generally familiar with the properties of the normal dis-tribution. Also, and even more importantly, despite this ‘‘tails of distribu-tion’’ phenomenon being well known to mathematicians (Poulos, 1995) andhighlighted by some students of educational policy (see, e.g., Kane,1998:435; Hedges and Nowell, 1999:125–30; Zwick, 2002), it is almostentirely neglected in the legal discussion of affirmative action issues.
The purpose of this article is to make use of insights about ‘‘tails ofdistributions’’ in the study of alternative modes of affirmative action. Webegin with an elementary exposition of the statistical logic underlying the
5However, we can usually simplify the model by considering ratios (or differences) of themean and standard deviation parameters (see below).
6For a insightful analytic discussion about competing ideas of equality, see Rae et al.(1981).
Consequences of Lottery-Based Affirmative Action 1449

basic threshold model. Although the approach we offer is a very general onethat can be applied to analyze the acceptance-rate consequences of any of awide variety of affirmative action methods, the heart of our article focuses onthe implications for acceptance rates of a recently proposed method toimplement affirmative action, what we call lottery-based rules with minimumthresholds of acceptance. Such rules set a minimum threshold for acceptanceand use a lottery to choose among applicants who score above that thresholdto achieve a fixed number of ‘‘winning’’ candidates. In the United States,such rules have recently been used in the context of affirmative action for(magnet) high school admissions in San Francisco and have been advocatedas desirable for implementation elsewhere (Cohen, 1994; Guinier, 1996; cf.Berger, Wang, and Monahan, 1998) as a compromise/way out of the long-standing debate between advocates of race-normed standards and advocatesof so-called merit (i.e., highest test-score based) hiring.7
With some appropriate threshold chosen, in terms of descriptive repre-sentation, we show that lottery-based rules do produce intermediate out-comes between race-normed or gender-normed standards for acceptance, onthe one hand, and the decision to simply select those with the highest scoreregardless of race or gender, on the other. Thus, these methods can con-tribute to diversity. We present some mathematical insights into the ques-tion of which of these poles the outcomes of lottery-based rules are mostlikely to resemble. We also look at the consequences for lotteries in terms ofmean test scores of the successful candidates. Here, when we use the samethreshold for the lottery cutoff as we did for the least advantaged of thegroups whose scores were normed to equalize success rates, lotteries must, ofnecessity, yield acceptance results for this group that lie below those of boththe other procedures. We look at GPA by major (at a public university) andSAT scores by race (for the nation as a whole) to investigate how lottery-based rules and related methods might operate in the real world.
7We must be careful not to confuse test scores with ‘‘merit,’’ since test scores may haveonly very limited predictive validity for job performance or of lifetime skill learning andretention. Moreover, even tests that might appear on their face to be neutral (i.e., race-blindand gender-blind) measures of performance (such as class ranks based on anonymous gradingof exams) may nonetheless conceal important disparities. In particular, there may be dif-ferences across groups in the relative accuracy of any given test as a predictor of futureperformance. In this context, Guinier, Fine, and Balin (1997) show that men and women atthe University of Pennsylvania Law School did not differ significantly on LSAT scores,college grade-point average, or a measure of quality of undergraduate institution, and, ingeneral, Penn students exhibited a very narrow range on these indicators. Yet, even afterLSAT scores and undergraduate grades are controlled for, race and gender remain statisticallysignificant predictors of the grade performance of students at the University of PennsylvaniaLaw School, with African Americans and women scoring lower than their white and malecounterparts—albeit race and gender were not nearly as powerful predictors of GPA at Pennas individual LSAT scores (see Guinier, Fine, and Balin, 1997:124–26, n.73). Guinier, Fine,and Balin argue that disparate outcomes in law-school performance between white males andother groups arise from an environment that devalues the perspectives of women or personsof color and/or emphasizes adversarial modes of interaction that help reinforce a hostileclimate for women and minorities. Of course, other explanations are possible.
1450 Social Science Quarterly
The Basic Hurdles/Threshold Model
In this article we offer a single hurdle, variable threshold model in which weconsider a selection process whereby a proportion of all those who apply fora given position are accepted based on their score on some exam (e.g., onlythose with the highest k percent of scores are chosen; or a lottery is heldamong only those who have scored above some threshold). Consider nsubgroups (i5 1, . . . , n) where the distribution of scores on some attributeA of the ith subgroup is characterized by a mean ai and standard deviation si.Let the passing score/threshold value be T. We use the expression succeed,that is, equal or exceed the threshold T, generically to mean ‘‘be accepted,’’‘‘succeed,’’ ‘‘pass the test,’’ ‘‘make the positive choice,’’ and so forth. Wewish to consider what proportion of each subgroup will succeed as a func-tion of ai, si, and T.
To make the discussion easier to follow so as to avoid losing the reader inunnecessary technicalities, we will provide an informal discussion of ourmathematical results in the text, with a number of illustrative tables andfigures. The results we give are based on normal distributions, as are theillustrative figures and charts. However, many of our basic results go throughfor a very general class of probability distributions, with no particular re-quirements on symmetry of the distribution needed.8 Although the resultswe give are based on simple statistical intuitions about the tails of distri-butions that are well known in the theory of reliability and survival analysis(see, e.g., Barlow and Proschan, 1965; Gross and Clark, 1975; Kalbfleischand Prentice, 1980), the notion of threshold effects is not, as far as we areaware, part of any of the standard introductory social science statistics text-book discussions of the key properties of normal (or related) distributions.Moreover, even though the basic statistical ideas are well known to stat-isticians, the specific extensions of the basic threshold model to rules thatcombine lottery rules with minimum test-score-based thresholds appear tobe original with the present authors.9
For illustrative purposes, and without great loss of generality, let us con-sider the case where n5 2. We may think of the two groups as men andwomen, or whites and African Americans, or Hispanics and non-Hispanics,or college graduates and noncollege graduates, and so forth. For conven-ience, let 0 � a1oa2. For a given value of T, Figure 1 allows us to visualizethe acceptance ratio between the two groups, that is, the ratio of the pro-portion of members of Group 2 who succeed to the proportion of membersGroup 1, which is the ratio of the areas to right of the threshold for each ofthe two distributions. The higher this ratio, the more are Group 2 members
8A formal statement of the theorems we rely on (and proofs thereof) are available onrequest from the authors. In other work we also extend the one-hurdle model presented hereto consider the implications of multiple hurdles.
9For reasons of space we will not attempt to discuss technical differences between ourmodels and those of other authors such as Berger, Wang, and Monanhan (1998).
Consequences of Lottery-Based Affirmative Action 1451
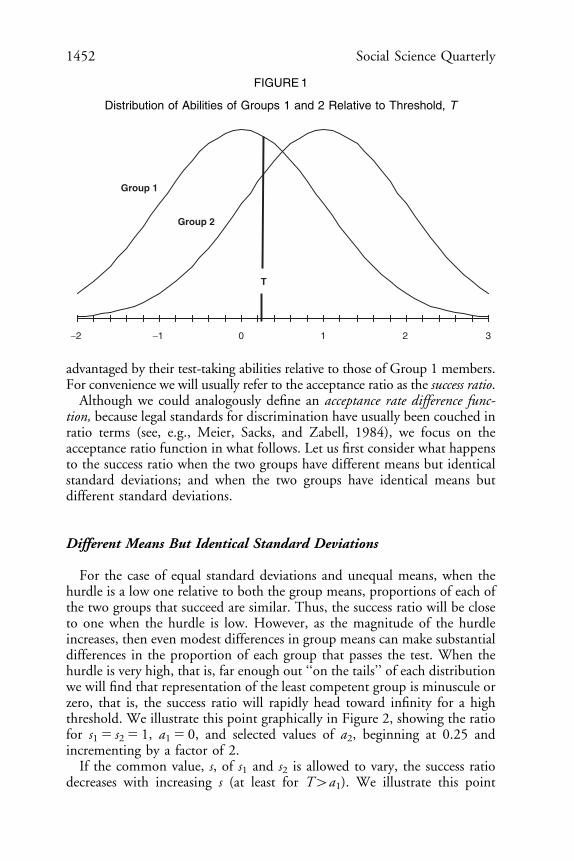
advantaged by their test-taking abilities relative to those of Group 1 members.For convenience we will usually refer to the acceptance ratio as the success ratio.
Although we could analogously define an acceptance rate difference func-tion, because legal standards for discrimination have usually been couched inratio terms (see, e.g., Meier, Sacks, and Zabell, 1984), we focus on theacceptance ratio function in what follows. Let us first consider what happensto the success ratio when the two groups have different means but identicalstandard deviations; and when the two groups have identical means butdifferent standard deviations.
Different Means But Identical Standard Deviations
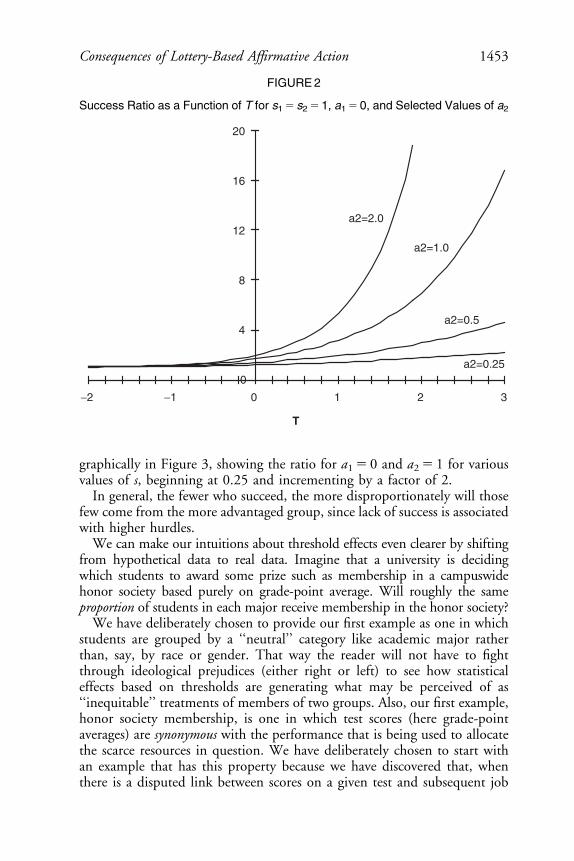
For the case of equal standard deviations and unequal means, when thehurdle is a low one relative to both the group means, proportions of each ofthe two groups that succeed are similar. Thus, the success ratio will be closeto one when the hurdle is low. However, as the magnitude of the hurdleincreases, then even modest differences in group means can make substantialdifferences in the proportion of each group that passes the test. When thehurdle is very high, that is, far enough out ‘‘on the tails’’ of each distributionwe will find that representation of the least competent group is minuscule orzero, that is, the success ratio will rapidly head toward infinity for a highthreshold. We illustrate this point graphically in Figure 2, showing the ratiofor s15 s25 1, a15 0, and selected values of a2, beginning at 0.25 andincrementing by a factor of 2.
If the common value, s, of s1 and s2 is allowed to vary, the success ratiodecreases with increasing s (at least for T4a1). We illustrate this point
−2 −1 0 1 2 3
Group 1
Group 2
T
FIGURE1
Distribution of Abilities of Groups 1 and 2 Relative to Threshold, T
1452 Social Science Quarterly
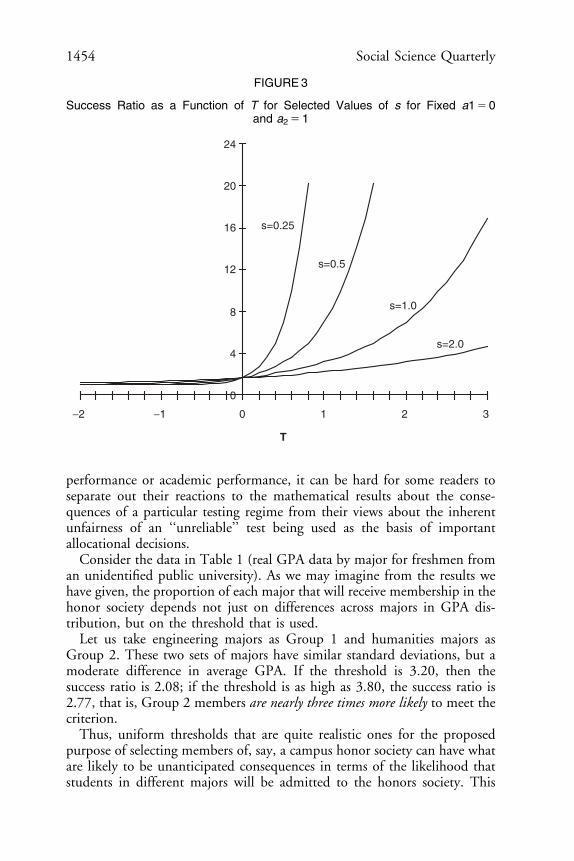
graphically in Figure 3, showing the ratio for a15 0 and a25 1 for variousvalues of s, beginning at 0.25 and incrementing by a factor of 2.
In general, the fewer who succeed, the more disproportionately will thosefew come from the more advantaged group, since lack of success is associatedwith higher hurdles.
We can make our intuitions about threshold effects even clearer by shiftingfrom hypothetical data to real data. Imagine that a university is decidingwhich students to award some prize such as membership in a campuswidehonor society based purely on grade-point average. Will roughly the sameproportion of students in each major receive membership in the honor society?
We have deliberately chosen to provide our first example as one in whichstudents are grouped by a ‘‘neutral’’ category like academic major ratherthan, say, by race or gender. That way the reader will not have to fightthrough ideological prejudices (either right or left) to see how statisticaleffects based on thresholds are generating what may be perceived of as‘‘inequitable’’ treatments of members of two groups. Also, our first example,honor society membership, is one in which test scores (here grade-pointaverages) are synonymous with the performance that is being used to allocatethe scarce resources in question. We have deliberately chosen to start withan example that has this property because we have discovered that, whenthere is a disputed link between scores on a given test and subsequent job
T
0
4
8
12
16
20
−2 −1 0 1 2 3
a2=1.0
a2=0.5
a2=0.25
a2=2.0
FIGURE2
Success Ratio as a Function of T for s15 s25 1, a15 0, and Selected Values of a2
Consequences of Lottery-Based Affirmative Action 1453
performance or academic performance, it can be hard for some readers toseparate out their reactions to the mathematical results about the conse-quences of a particular testing regime from their views about the inherentunfairness of an ‘‘unreliable’’ test being used as the basis of importantallocational decisions.
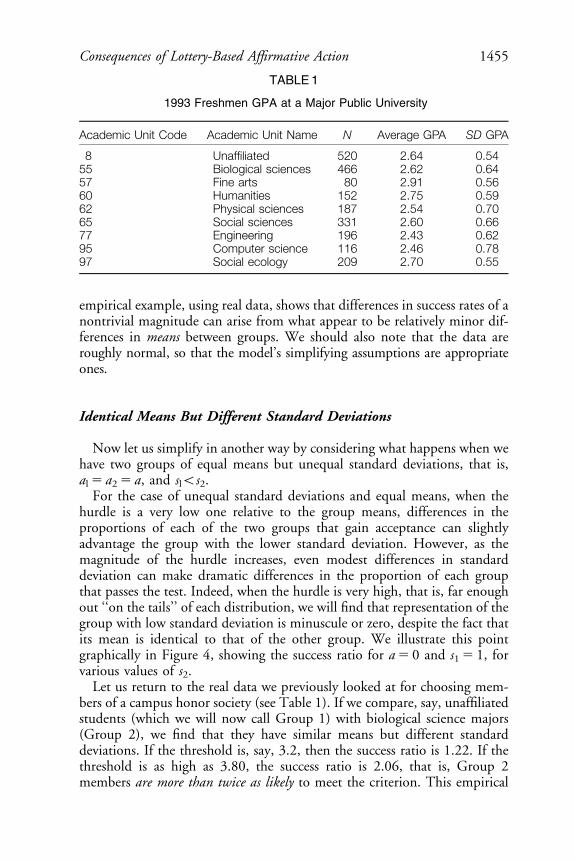
Consider the data in Table 1 (real GPA data by major for freshmen froman unidentified public university). As we may imagine from the results wehave given, the proportion of each major that will receive membership in thehonor society depends not just on differences across majors in GPA dis-tribution, but on the threshold that is used.
Let us take engineering majors as Group 1 and humanities majors asGroup 2. These two sets of majors have similar standard deviations, but amoderate difference in average GPA. If the threshold is 3.20, then thesuccess ratio is 2.08; if the threshold is as high as 3.80, the success ratio is2.77, that is, Group 2 members are nearly three times more likely to meet thecriterion.
Thus, uniform thresholds that are quite realistic ones for the proposedpurpose of selecting members of, say, a campus honor society can have whatare likely to be unanticipated consequences in terms of the likelihood thatstudents in different majors will be admitted to the honors society. This
T
0
4
8
12
16
20
24
−2 −1 0 1 2 3
s=0.25
s=0.5
s=1.0
s=2.0
FIGURE3
Success Ratio as a Function of T for Selected Values of s for Fixed a15 0and a25 1
1454 Social Science Quarterly
empirical example, using real data, shows that differences in success rates of anontrivial magnitude can arise from what appear to be relatively minor dif-ferences in means between groups. We should also note that the data areroughly normal, so that the model’s simplifying assumptions are appropriateones.
Identical Means But Different Standard Deviations
Now let us simplify in another way by considering what happens when wehave two groups of equal means but unequal standard deviations, that is,al5 a25 a, and slos2.
For the case of unequal standard deviations and equal means, when thehurdle is a very low one relative to the group means, differences in theproportions of each of the two groups that gain acceptance can slightlyadvantage the group with the lower standard deviation. However, as themagnitude of the hurdle increases, even modest differences in standarddeviation can make dramatic differences in the proportion of each groupthat passes the test. Indeed, when the hurdle is very high, that is, far enoughout ‘‘on the tails’’ of each distribution, we will find that representation of thegroup with low standard deviation is minuscule or zero, despite the fact thatits mean is identical to that of the other group. We illustrate this pointgraphically in Figure 4, showing the success ratio for a5 0 and s15 1, forvarious values of s2.
Let us return to the real data we previously looked at for choosing mem-bers of a campus honor society (see Table 1). If we compare, say, unaffiliatedstudents (which we will now call Group 1) with biological science majors(Group 2), we find that they have similar means but different standarddeviations. If the threshold is, say, 3.2, then the success ratio is 1.22. If thethreshold is as high as 3.80, the success ratio is 2.06, that is, Group 2members are more than twice as likely to meet the criterion. This empirical
TABLE1
1993 Freshmen GPA at a Major Public University
Academic Unit Code Academic Unit Name N Average GPA SD GPA
8 Unaffiliated 520 2.64 0.5455 Biological sciences 466 2.62 0.6457 Fine arts 80 2.91 0.5660 Humanities 152 2.75 0.5962 Physical sciences 187 2.54 0.7065 Social sciences 331 2.60 0.6677 Engineering 196 2.43 0.6295 Computer science 116 2.46 0.7897 Social ecology 209 2.70 0.55
Consequences of Lottery-Based Affirmative Action 1455
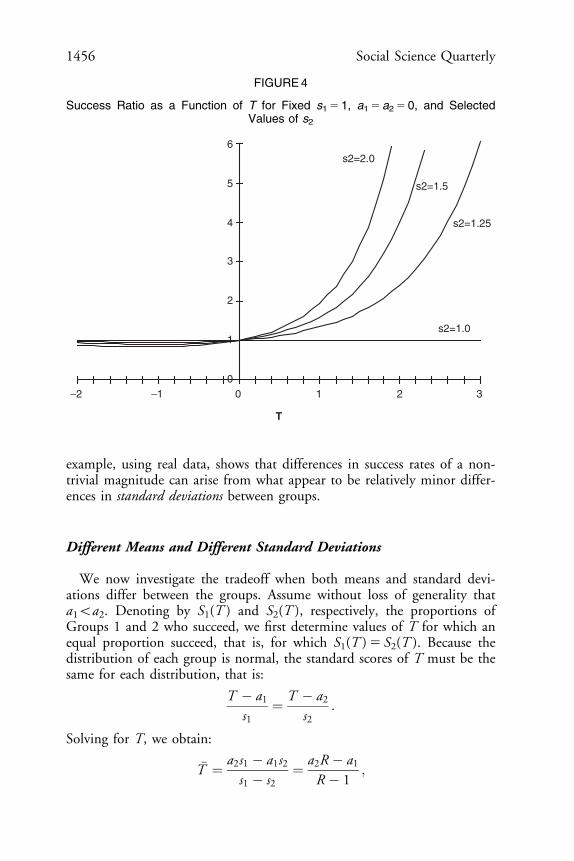
example, using real data, shows that differences in success rates of a non-trivial magnitude can arise from what appear to be relatively minor differ-ences in standard deviations between groups.
Different Means and Different Standard Deviations
We now investigate the tradeoff when both means and standard devi-ations differ between the groups. Assume without loss of generality thata1oa2. Denoting by S1(T ) and S2(T ), respectively, the proportions ofGroups 1 and 2 who succeed, we first determine values of T for which anequal proportion succeed, that is, for which S1(T )5 S2(T ). Because thedistribution of each group is normal, the standard scores of T must be thesame for each distribution, that is:
T � a1
s1¼ T � a2
s2:
Solving for T, we obtain:
�T ¼ a2s1 � a1s2s1 � s2
¼ a2R � a1
R � 1;
T
0
1
2
3
4
5
6
−2 −1 0 1 2 3
s2=2.0
s2=1.5
s2=1.0
s2=1.25
FIGURE4
Success Ratio as a Function of T for Fixed s15 1, a15 a25 0, and SelectedValues of s2
1456 Social Science Quarterly
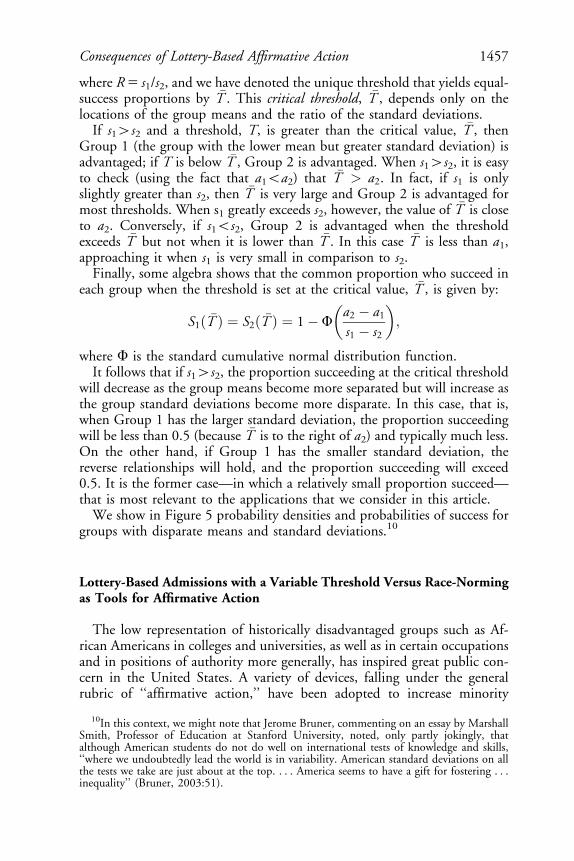
where R5 s1/s2, and we have denoted the unique threshold that yields equal-success proportions by �T . This critical threshold, �T , depends only on thelocations of the group means and the ratio of the standard deviations.
If s14s2 and a threshold, T, is greater than the critical value, �T , thenGroup 1 (the group with the lower mean but greater standard deviation) isadvantaged; if T is below �T , Group 2 is advantaged. When s14s2, it is easyto check (using the fact that a1oa2) that �T > a2. In fact, if s1 is onlyslightly greater than s2, then �T is very large and Group 2 is advantaged formost thresholds. When s1 greatly exceeds s2, however, the value of �T is closeto a2. Conversely, if s1os2, Group 2 is advantaged when the thresholdexceeds �T but not when it is lower than �T . In this case �T is less than a1,approaching it when s1 is very small in comparison to s2.
Finally, some algebra shows that the common proportion who succeed ineach group when the threshold is set at the critical value, �T , is given by:
S1ð �T Þ ¼ S2ð �T Þ ¼ 1 � Fa2 � a1
s1 � s2
� �;
where F is the standard cumulative normal distribution function.It follows that if s14s2, the proportion succeeding at the critical threshold
will decrease as the group means become more separated but will increase asthe group standard deviations become more disparate. In this case, that is,when Group 1 has the larger standard deviation, the proportion succeedingwill be less than 0.5 (because �T is to the right of a2) and typically much less.On the other hand, if Group 1 has the smaller standard deviation, thereverse relationships will hold, and the proportion succeeding will exceed0.5. It is the former case—in which a relatively small proportion succeed—that is most relevant to the applications that we consider in this article.
We show in Figure 5 probability densities and probabilities of success forgroups with disparate means and standard deviations.10
Lottery-Based Admissions with a Variable Threshold Versus Race-Normingas Tools for Affirmative Action
The low representation of historically disadvantaged groups such as Af-rican Americans in colleges and universities, as well as in certain occupationsand in positions of authority more generally, has inspired great public con-cern in the United States. A variety of devices, falling under the generalrubric of ‘‘affirmative action,’’ have been adopted to increase minority
10In this context, we might note that Jerome Bruner, commenting on an essay by MarshallSmith, Professor of Education at Stanford University, noted, only partly jokingly, thatalthough American students do not do well on international tests of knowledge and skills,‘‘where we undoubtedly lead the world is in variability. American standard deviations on allthe tests we take are just about at the top. . . . America seems to have a gift for fostering . . .inequality’’ (Bruner, 2003:51).
Consequences of Lottery-Based Affirmative Action 1457
success in admissions and in the employment arena.11 These devices rangefrom simple attempts to publicize opportunities better among the membersof the minority community, to giving preference to the minority candidatewhen candidates are otherwise regarded as equally qualified, to applyingdifferent standards for admissions (or hiring or promotion) to members ofdifferent groups (so-called race norming), to admitting applicants (or allo-cating jobs) on the basis of racial quotas. The further the deviation fromwhat is seen as ‘‘hiring the best qualified’’ (defined, of course, perhaps quite
−3.0
−2.6
−2.2
−1.8
−1.4
−1.0
−0.6
−0.2 0.2
0.6
1.0
1.4
1.8
2.2
2.6
3.0
0.000
0.100
0.200
0.300
0.400
0.500
0.600
0.700
0.800
0.900
1.000
Pro
po
rtio
n s
ucc
eed
ing
Group 1
Group 2
S1(T)
S2(T)
a1 a2
Critical threshold
FIGURE5
Success Functions and Critical Threshold for Groups with Disparate Means(a15 0, a25 0.5) and Disparate Standard Deviations (s15 1.5, s25 0.5)
11Gender differences in test scores are also important. There is considerable evidence thatthe key racial differences in test scores such as SATs tend to be in the means, while genderdifferences often are found in standard deviations as well, sometimes even where there is noreal difference in means (see, e.g., Bridgeman and Lewis, 1996; Hedges and Nowell, 1999).
1458 Social Science Quarterly
misleadingly, in terms of test scores/credentials), the more controversial areproposed techniques of affirmative action.12
In this section, we focus on the comparison of two different schemes forminority preference: race-norming and an important scheme that we havelabeled lottery-based rules with minimum thresholds of acceptance. Our con-cern will be to elucidate the statistical relationships that will determine theeffects that lottery-based minimum threshold schemes will have on the rel-ative success rates of minority and nonminority applicants when comparedto race-normed schemes, on the one hand, and to test-score-based admissionschemes that simply admit those who score best, on the other.
Race-norming sets the thresholds of acceptance for each group differently;in its most extreme form, these thresholds are chosen so that the sameproportion of each group will score success (proportional quotas). Race-norming of standards is found in many places; it is especially common ineducational admission. For example, in one ‘‘magnet’’ high school in SanFrancisco, Lowell High, because test scores of Chinese-American studentswere, on average, so much higher than most of those in other groups, inorder to assure more racial diversity in its student body, this high schoolrequired higher test scores for admitting students of Chinese-American de-scent than for any other students, with the next highest thresholds beingused for students of Asian-American but not Chinese-American backgroundand for non-Hispanic whites. The lowest thresholds were for African Amer-icans and for students of Hispanic/Latino heritage. The difference betweenthe cut-off value used for Chinese Americans and that used for AfricanAmericans was quite extreme.13 However, at Lowell High, as a result of a1994 lawsuit filed by Chinese-American parents, straight race-norming ofapplications was initially replaced by a combination of straight test scoresand GPA (for 80 percent of the students) and eight special weighting criteriafor 20 percent of the class-slots criteria that operate to favor Hispanic andAfrican-American students (Luis Fraga, personal communication, June 17,1998), and more recently by a complex formula that is referred to as‘‘diversity enhancing,’’ where diversity is defined by student and familybackground characteristics that include language use in the home, whetherthe mother has graduated from high school, whether the student is in
12In the employment arena, various forms of minority preferences are justified as (1)necessary equitable remedies for past histories of discrimination, especially for firms that havebeen legally found guilty of such discrimination; (2) given the argued persistence of sub rosaand institutional discrimination, needed means of compensation for continuing employmentpractices based on tests that supposedly do not usefully measure likely job performance andare biased against minorities; and/or (3) an appropriate way to reflect our national diversity.
13Chinese-American students had to score 62; non-Hispanic whites and non-ChineseAsians had to score 58; African Americans and Hispanics needed only score 53 (Petersen,1997:62). The form of race-norming that was used did not actually achieve proportionality inthe school since students of Chinese-American and Asian-American descent were still over-represented relative to the applicant pool. Moreover, there was a further complication in theform of a court-mandated requirement that no racial group could constitute more than 40percent of the school’s admittances.
Consequences of Lottery-Based Affirmative Action 1459

public housing or eligible for the free lunch program, and so forth (Fletcher,2002).
Lottery-based rules set a threshold for acceptance (presumably at or abovethe minimum level of competence needed for satisfactory performance) anduse a lottery to choose among applicants who score above that thresholdregardless or race or ethnicity or gender and regardless of differences in theirscores. As noted earlier, such rules have recently been proposed (Cohen,1994; Guinier, 1996) as a way to mediate between the seemingly irrecon-cilable positions of those who advocate race-normed standards and thosewho advocate so-called merit (i.e., test-score-based) decision making to beapplied in a color-blind fashion. Indeed, Guinier (1996) specifically sug-gested such rules might be used to resolve the conflict over admissionscriteria at Lowell High School.
Outside the United States, lotteries (with minimum thresholds) have beenused for pupil assignments so as to reduce SES differences in admittance thatwould arise from test-based procedures. For example, in the Netherlands,there is ‘‘a weighted system under which all applicants who pass a moderategrade threshold in specified subjects participate in the lottery, but those withhigher grades have more entry forms put in for them’’ (Heidenheimer,Heclo, and Adams, 1990:50, internal cites omitted). Similarly, Germany inthe 1980s began to determine some of its medical school admission de-cisions in this way (Heidenheimer, Heclo, and Adams, 1990:50). Lottery-based schemes with minimum threshold may achieve greater importance as atool for affirmative action if race-norming suffers further popular disap-proval via referenda (such as Proposition 209 in California in 1996 or asimilar referendum in 1998 in the State of Washington).14
Without great loss of generality, we shall focus on pure lottery rules withminimum thresholds rather than rules that mix this method with others.15
Suppose a (relatively low) threshold, T1, is used to establish a pool ofacceptable applicants, from whom a smaller subset is chosen by lottery foradmission. Since the lottery has no effect on the (expected value of the)proportions of the acceptable pool represented by each recognized subgroup,the relative proportions of subgroups accepted for admission depend entirely
14In its 2003 decisions about affirmative action admissions policies at the University ofMichigan (Grutter v. Bollinger, 539 U. S. 982, dealing with law school admissions to theUniversity of Michigan, and Gratz v. Bollinger, 538 U.S. 959), while the Supreme Courtrejected the points system used for undergraduate admissions, in holding the University ofMichigan Law School admission procedures to be constitutional, the Supreme Court ma-jority endorsed the view that diversity was a factor that could be taken into account. How-ever, exactly how diversity was to be defined and how much it could be allowed to matterwere matters left still open. Most importantly, while diversity goals are permitted in highereducation if they are narrowly tailored, they are not constitutionally required. Thus, weanticipate that partially lottery-based admission procedures of the sort we discuss will remainof interest to reformers who wish to achieve diversity but without mechanisms that explicitlytake race or ethnicity or gender into account.
15We can analyze the effect of such mixed rules by treating them as weighted combinationsof the pure types.
1460 Social Science Quarterly
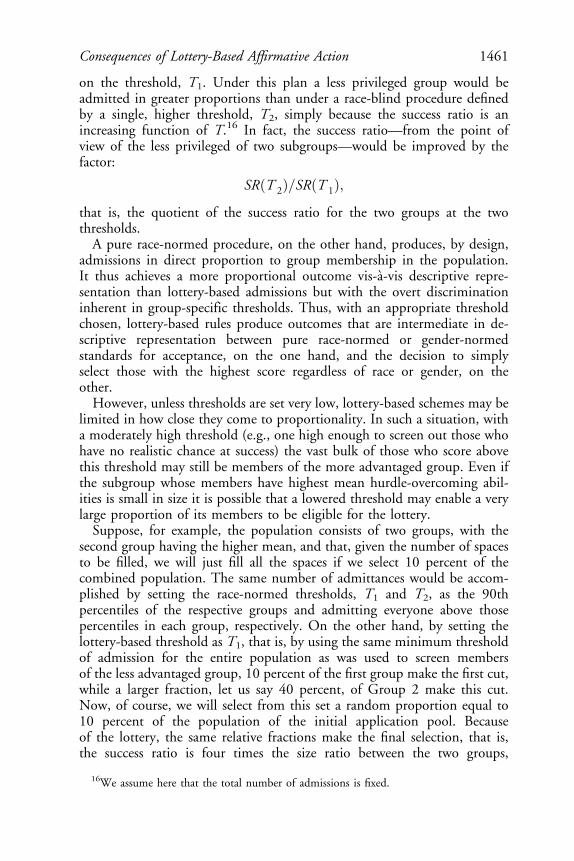
on the threshold, T1. Under this plan a less privileged group would beadmitted in greater proportions than under a race-blind procedure definedby a single, higher threshold, T2, simply because the success ratio is anincreasing function of T.16 In fact, the success ratio—from the point ofview of the less privileged of two subgroups—would be improved by thefactor:
SRðT 2Þ=SRðT 1Þ;
that is, the quotient of the success ratio for the two groups at the twothresholds.
A pure race-normed procedure, on the other hand, produces, by design,admissions in direct proportion to group membership in the population.It thus achieves a more proportional outcome vis-a-vis descriptive repre-sentation than lottery-based admissions but with the overt discriminationinherent in group-specific thresholds. Thus, with an appropriate thresholdchosen, lottery-based rules produce outcomes that are intermediate in de-scriptive representation between pure race-normed or gender-normedstandards for acceptance, on the one hand, and the decision to simplyselect those with the highest score regardless of race or gender, on theother.
However, unless thresholds are set very low, lottery-based schemes may belimited in how close they come to proportionality. In such a situation, witha moderately high threshold (e.g., one high enough to screen out those whohave no realistic chance at success) the vast bulk of those who score abovethis threshold may still be members of the more advantaged group. Even ifthe subgroup whose members have highest mean hurdle-overcoming abil-ities is small in size it is possible that a lowered threshold may enable a verylarge proportion of its members to be eligible for the lottery.
Suppose, for example, the population consists of two groups, with thesecond group having the higher mean, and that, given the number of spacesto be filled, we will just fill all the spaces if we select 10 percent of thecombined population. The same number of admittances would be accom-plished by setting the race-normed thresholds, T1 and T2, as the 90thpercentiles of the respective groups and admitting everyone above thosepercentiles in each group, respectively. On the other hand, by setting thelottery-based threshold as T1, that is, by using the same minimum thresholdof admission for the entire population as was used to screen membersof the less advantaged group, 10 percent of the first group make the first cut,while a larger fraction, let us say 40 percent, of Group 2 make this cut.Now, of course, we will select from this set a random proportion equal to10 percent of the population of the initial application pool. Becauseof the lottery, the same relative fractions make the final selection, that is,the success ratio is four times the size ratio between the two groups,
16We assume here that the total number of admissions is fixed.
Consequences of Lottery-Based Affirmative Action 1461

that is:
SR ¼ n2p2
n1p1;
where ni is the size of group i and pi is the proportion of group i making thefirst cut.
Thus, the relative proportion selected from the two groups differs fromsize proportionality by the factor, p2/p1, which is at least 1 and will tend tobe much higher if the group densities overlap little. In other words, if themore advantaged group has a much higher proportion of its members whocan pass the lower threshold, T1, than is true for the less advantaged group,lowering the threshold to reflect the minimal scores sufficient for acceptablecandidates to reflect those used to determine admissions for the less advan-taged group and then using a lottery may still give rise to greatly discrepantacceptance rates among members of the less advantaged and the more ad-vantaged groups. Moreover, the mean score of those admitted will fallcompared to the race-normed plan since now the members of Group 2 whowill be admitted have on average lower scores than before (we are selectingfrom the pool of people above T1 rather than the pool of those above T2).17
Note also the important result that the relative size of groups is immaterialin these conclusions (see example above).
When a single ‘‘group-blind’’ (i.e., color blind, gender blind, etc.) thresh-old of acceptability is used for both groups, such a standard necessarily liesbetween T1 and T2, and the success ratio may be far worse from the per-spective of Group 1 than under the lottery plan. But, in the example above,relative to a ‘‘group-blind’’ system, a lottery-based threshold system (re-stricted to 10 percent of the total population) does not, in fact, change therepresentation of the least represented group by that much (SR5 2.1 vs.SR5 2.3).
Whether the results of a lottery-based selection more resembles in de-scriptive representation that of a group-specific or a universal thresholdselection procedure depends on the relative positions of the two distribu-tions, as is illustrated in Figure 6. In Figure 6a, the universal thresholdwould be closer to T2 than to T1; in Figure 6b, the reverse would be true.
Figure 6 has important practical implications: the advocacy in the abstractof a lottery-based minimum threshold by spokespersons for ‘‘minority’’representation may turn out not to be very efficacious in increasing someparticular group’s proportion of the admittance pool in settings where sub-stantial differences in group means obtain—unless the minimum thresholdof acceptance is set so low that it may not be seen as sufficiently meritocratic.
For example, returning to the actual GPA data we discussed previously,suppose we plan to select 10 percent of an overall population consisting of
17However, lottery methods may yield lower overall standard deviations than race-nor-ming.
1462 Social Science Quarterly
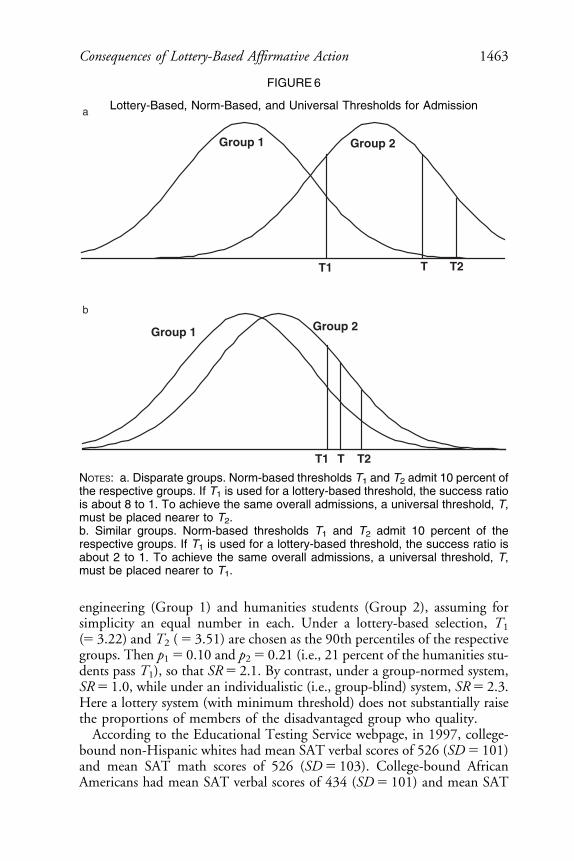
engineering (Group 1) and humanities students (Group 2), assuming forsimplicity an equal number in each. Under a lottery-based selection, T1
(5 3.22) and T2 (5 3.51) are chosen as the 90th percentiles of the respectivegroups. Then p15 0.10 and p25 0.21 (i.e., 21 percent of the humanities stu-dents pass T1), so that SR5 2.1. By contrast, under a group-normed system,SR5 1.0, while under an individualistic (i.e., group-blind) system, SR5 2.3.Here a lottery system (with minimum threshold) does not substantially raisethe proportions of members of the disadvantaged group who quality.
According to the Educational Testing Service webpage, in 1997, college-bound non-Hispanic whites had mean SAT verbal scores of 526 (SD5 101)and mean SAT math scores of 526 (SD5 103). College-bound AfricanAmericans had mean SAT verbal scores of 434 (SD5 101) and mean SAT
T1 T2T
Group 1 Group 2
T1 T2T
Group 1 Group 2
a
b
FIGURE6
Lottery-Based, Norm-Based, and Universal Thresholds for Admission
NOTES: a. Disparate groups. Norm-based thresholds T1 and T2 admit 10 percent ofthe respective groups. If T1 is used for a lottery-based threshold, the success ratiois about 8 to 1. To achieve the same overall admissions, a universal threshold, T,must be placed nearer to T2.b. Similar groups. Norm-based thresholds T1 and T2 admit 10 percent of therespective groups. If T1 is used for a lottery-based threshold, the success ratio isabout 2 to 1. To achieve the same overall admissions, a universal threshold, T,must be placed nearer to T1.
Consequences of Lottery-Based Affirmative Action 1463

math scores of 423 (SD5 97). Given the actual composition of SAT test-takers by race, if we wished to select the top 10 percent of scorers on theverbal part of the test, using a universal threshold, the proportion of whiteswho will surmount that threshold is 5.5 times the proportion of AfricanAmericans with scores that high. For the math SAT scores, because of thegreater separation between means and the smaller SDs, the result for a top10 percent selection is even more exaggerated; the proportion of whites whofall into that category is 8.5 times higher than the proportion of AfricanAmericans who fall into that category.
Using a 10 percent cutoff, as noted above, the group-blind procedure hada white/black success ratio of 5.5 for the SAT verbal and 8.5 for the SATmath. Of course, the group-normed procedure must have a success ratio of1.0. What about the lottery-based procedure with minimum threshold set atthe SAT score needed for the norming of African-American scores to achievea 10 percent success rate (here 563 verbal and 547 math)? For this lottery-based selection with minimum threshold, for the SAT verbal scores, 35.7percent of the white students pass the 563 threshold while only 10 percentof African-American students pass—yielding a white/black success ratio of3.6. For the SAT math scores, the corresponding lottery-based thresholdyields a success ratio of 5.5. Here, a lottery-based system with a realisticminimum threshold will result in only a minuscule rate of minority ac-ceptance compared to that of whites.
Another important issue has to do with the extent of reduction in meantest scores among those applicants chosen by the procedure as we shift froma pure test-score-based to a pure proportional-quota-based system (cf. Be-rger, Wang, and Monahan, 1998).
In our previous GPA example, if we set the universal threshold atT5 3.39, the mean score for the student who exceeds this threshold is 3.68.If a group-normed procedure is used with thresholds set to give rise to equalproportions of each group (on average) being selected (here with thresholdsat 3.22 and 3.51, respectively), the mean score among successful applicantsis 3.65, quite close to that of the group-blind system. On the other hand, fora lottery-based system (with threshold set at T15 3.22, the lower of the twogroup-normed thresholds), the expected mean score for the selected studentsdrops to 3.54. Thus, the lottery-based system yields the lowest mean testscore among those who are chosen.
The latter result goes through even when the groups we are comparing arevery different in means. If we look at SAT scores broken down by race, webegin with rather substantial mean differences, as we saw earlier. Again,consider an elite institution that uses a rather high SAT threshold to screenapplications in a group-blind (universal) fashion, taking the top 10 percent.For SAT verbal scores, this universal threshold is 623; for SAT math scoresit is 621. The mean score for the students who exceed this universal SATverbal threshold will be 674, and the same mean score obtains for thestudents who exceed the universal SAT math threshold.
1464 Social Science Quarterly
If a group-normed procedure is used, we get non-Hispanic white SATthresholds at 655 and 658, for SAT verbal scores and math scores, respec-tively; and comparable African-American thresholds at 563 and 547. Forthis group-normed procedure, the mean SAT scores of successful applicantsare 657 verbal and 650 math. This is a drop of roughly 20 points in each, onaverage, as compared to the mean scores for admittance under a universalthreshold. It is not as large as we might have thought because the raising ofthe threshold for non-Hispanic whites compensates in part for the loweringof the threshold for African Americans.
For a lottery-based system (with minimum threshold set at 563 for SATverbal scores and 547 for SAT math scores, the scores used previously todetermine African-American admittances under a group-normed scheme),the expected mean scores for the selected students drop to 627 for verbalscores and to 617 for math scores. Again, the lottery-based scheme has themost severe consequences for the mean test scores of those who are chosen.Moreover, the drops shown in these SAT examples are quite substantial—adrop of around 50 points in each, on average, as compared to the meanscores for admittance under a universal threshold.
Thus, lottery-based schemes (with minimum thresholds) must be scru-tinized closely for their likely effects. On the one hand, they may notimprove group representation in descriptive terms much over pure test-based rules; and they may lead to a severe drop in mean test scores of thesuccessful applicants as compared to either test-based rules or group-norming. Unlike a group-normed system, a lottery system adds to the poolof applicants eligible for (at risk for) selection not only those in the lessadvantaged group who meet the lower threshold—just as in a group-normedsystem—but also the larger number of persons in the more advantagedgroup that meets this threshold. The effect is that a lottery system tendsto lower the mean score of successful applicants far more than a group-normed system. We do not believe that this feature of lottery systems iswell understood by those who might advocate them in preference to race-norming.
Discussion
The models we have provided help us understand why the differencesamong subpopulations on test scores or on performance variables will havequite different consequences depending on the threshold that is used as thecutoff for admissions/hiring or for promotion/honor society membership,and so forth. When we turn to the recently proposed affirmative actionremedy of a lottery-based rule with minimum threshold, our analysis pro-vides the necessary guidelines to evaluate the likely impact of such a rulerelative to either pure highest-test-score admission rules or race-norming.Our SAT example shows that, when groups differ significantly in test scores,
Consequences of Lottery-Based Affirmative Action 1465
such lottery rules may not yield results that are particularly close toproportionality unless the threshold for acceptance is set unreasonablylow, and that, even with a minimum threshold, use of a lottery canhave a significant effect on the mean score of those who are accepted. Thus,while a lottery-based method avoids explicit race-norming, it can imposeother costs.
Although we have focused here only on three basic types of procedures;universal, race-normed, and lottery rules with minimum thresholds, theapproach we offer is considerably more general.18 Of course, the analyses wehave presented would need to be modified to take into account the com-plexities of various real-world allocational rules. For example, multipletests might be used. Or test scores might be used for some openings, withothers being filled through lottery-like procedures, while other spaces arefilled in ways that are explicitly attentive to diversity concerns. Or individ-uals might be given composite scores that combine test information withmore subjective judgments (e.g., based on personal interviews). Nonetheless,we believe that, in the context of affirmative action, it is clear that the basiclogic of statistical thresholds that we have exposited in this article will haveimportant uses for policy analysis and the analysis of institutional designwhen we are evaluating allocational schemes that make any use of tests onwhich groups may differ in their members’ means and/or standard devi-ations. Moreover our results are highly relevant for legal analyses of affirm-ative action questions, especially as they have to do with whether someparticular affirmative action scheme is ‘‘narrowly tailored’’ to achieve itsgoals.19
18Threshold-related models have been generated in a number of different disciplines—often in ignorance of previous work done in other subfields. Models mathematically similarto those we use have been applied in a number of different substantive contexts, ranging fromsignal detection in cognitive psychology (Luce, 1965); to modeling the impact of changes injuror thresholds for deciding guilt beyond a reasonable doubt on Type I and Type II errorrates (Nagel and Neef, 1975; Grofman, 1981); to modeling collective action (e.g., riotparticipation) as a sequential process (Granovetter, 1978; Granovetter and Soong, 1983;Macy, 1991; Lohmann, 1994, 1997); to modeling the impact of changes in voter registrationlaws (interpreted as barriers to participation) on the voter turnout of different socioeconomicgroups (Brians and Grofman, 1999; cf. Erikson, 1981; Cox and Munger, 1990; Fort, 1995).Space constraints have prevented us from exploring the similarities and contrasts betweenthese models and our own work on dichotomous-choice threshold models.
19In this context we should note that the University of Michigan Law School reviewed theoption of using a lottery-based rule with minimum threshold and rejected it in favor of whatthe Supreme Court majority in Grutter labeled more ‘‘holistic’’ approaches. Professor RichardLempert (University of Michigan Law School) testified at the trial challenging the lawschool’s admission criteria that a system in which the law school would lower its admissionsstandards, establish a numerical cutoff for ‘‘qualified’’ applicants, and then select randomlyamong those applicants, ‘‘would admit greater number of minority students, but would notyield meaningful racial and ethnic diversity’’ (cited in Grutter v. Bollinger et al., 2002 Fed.App. 0170P (6th Cir. en banc, Dec. 6, 2001)). In the Supeme Court decision in this case,Justice O’Connor, writing for the majority, indicated that she believed the law school planhad ‘‘adequately considered the available alternatives,’’ including a ‘‘lottery system.’’
1466 Social Science Quarterly
REFERENCES
Alt, James. 1994. ‘‘The Impact of the Voting Rights Act on Black and White Voter Reg-istration in the South.’’ In Chandler Davidson and Bernard Grofman, eds., Quiet Revolutionin the South. Princeton, NJ: Princeton University Press.
Barlow, Richard, and Frank Proschan. 1965. Mathematical Theory of Reliability. New York:J. Wiley & Sons.
Berger, Paul D., Chen Wang, and James P. Monahan. 1998. ‘‘Quantifying a StatisticalAspect of Segmented Selection/Quota Systems.’’ American Statistician 52:228–32.
Brians, Craig, and Bernard Grofman. 1999. ‘‘When Registration Barriers Fall, Who Votes?An Empirical Test of a Rational Choice Model.’’ Public Choice. 99:161–76.
Bridgeman, B., and C. Lewis. 1996. ‘‘Gender Differences in College Mathematics Gradesand SAT-M Scores—A Reanalysis of Wainer and Steinberg.’’ Journal of Educational Meas-urement 33(3):257–70.
Bruner, Jerome. 2003. ‘‘Comment on ‘Education Reform: A Report Card’.’’ Bulletin of theAmerican Academy of Arts and Sciences 56(2):38–52.
Cohen, Richard. 1994. ‘‘‘Bounding’ of Test Scores as a Merit-Based Remedy for Employ-ment Discrimination.’’ Remarks at Joyce Foundation Conference on The Civil Rights Act of1964 in Perspective. Washington, DC: National Judicial Center.
Cox, Gary, and Michael Munger. 1990. Putting Last Things Last: A Sequential Barriers Modelof Turnout and Voter Roll-Off. Unpublished manuscript. Department of Political Science,University of North Carolina.
Crow, James F. 2002. ‘‘Unequal by Nature: A Geneticist’s Perspective on Human Differ-ences.’’ Daedalus Winter:81–88.
Erikson, Robert. 1981. ‘‘Why Do People Vote? Because They Are Registered.’’ AmericanPolitics Quarterly 9(3):259–76.
Fletcher, Michael A. 2002. ‘‘Desegregation, But Not by Race: San Francisco Turns toSocioeconomic Factors to Balance Schools.’’ Washington Post National Weekly Edition March25–31:20.
Fort, Rodney. 1995. ‘‘A Recursive Treatment of the Hurdles to Voting.’’ Public Choice 85(1–2):45–69.
Granovetter, Mark. 1978. ‘‘Threshold Models of Collective Behavior.’’ American Journal ofSociology 83:1420–33.
Granovetter, Mark, and Roland Soong. 1983. ‘‘Threshold Models of Diffusion and Col-lective Behavior.’’ Journal of Mathematical Sociology 9:165–79.
Grofman, Bernard. 1981. ‘‘Mathematical Models of Juror and Jury Decision-Making: TheState of the Art.’’ Pp. 305–51 in Bruce D. Sales, ed., Perspectives in Law and Psychology,Volume II: The Trial Process. New York: Plenum.
Gross, Alan, and Virginia Clark. 1975. Survival Distributions: Reliability Applications in theBiomedical Sciences. New York: John Wiley & Sons.
Guinier, Lani. 1996. ‘‘The Need for a National Conversation on Race.’’ Remarks at the EPluribus Unum Conference, Program in Chicano Studies, Stanford University. Stanford,CA.
Guinier, Lani, Michelle Fine, and Jane Balin. 1997. Becoming a Gentleman: Women, LawSchool and Institutional Change. Boston, MA: Beacon Press.
Consequences of Lottery-Based Affirmative Action 1467
Hedges, Larry V., and Amy Nowell. 1999. ‘‘Changes in the Black-White Gap in Achieve-ment Test Scores.’’ Sociology of Education 72:111–35.
Heidenheimer, Arnold J., Hugh Heclo, and Carolyn Teich Adams. 1990. Comparative PublicPolicy, 3rd ed. New York: St. Martins Press.
Jencks, Christopher, and Meredith Phillips, eds. 1998. The Black-White Test Score Gap.Washington, DC: Brookings Institution Press.
Kadane, Joseph B., and Caroline Mitchell. 2000. ‘‘Statistics as Legal Proof in EmploymentDiscrimination Cases.’’ In Bernard Grofman, ed., Legacies of the Civil Rights Act of 1964 inPerspective. Charlottesville, VA: University Press of Virginia.
Kahlenberg, Richard D. 1996. The Remedy: Class, Race, and Affirmative Action. New York:Basic Books.
Kalbfleisch, John D., and Ross L. Prentice. 1980. The Statistical Analysis of Failure TimeData. New York: John Wiley & Sons.
Kane, Thomas J. 1998. ‘‘Racial and Ethnic Preferences in College Admissions.’’ Pp. 431–56in Christopher Jencks and Meredith Phillips, eds., The Black-White Test Score Gap. Wash-ington, DC: Brookings Institution Press.
Lohmann, Suzanne. 1994. ‘‘Dynamics of Informational Cascades: The Monday Demon-strations in Leipzig, East Germany, 1989–1991.’’ World Politics 47:42–101.
———. 1997. Dynamics of Information Cascades: Experimental Evidence. Unpublished man-uscript. Department of Political Science, UCLA.
Luce, R. Duncan, ed. 1965. Handbook of Mathematical Psychology. New York: Wiley.
Macy, Michael W. 1991. ‘‘Chains of Cooperation: Threshold Effects in Collective Action.’’American Sociological Review 55:730–47.
Meier, Paul, Jerome Sacks, and Sandy L. Zabell. 1984. ‘‘What Happened in Hazelwood:Statistics, Employment Discrimination and the 80% Rule.’’ American Bar Foundation Jour-nal 1:139–86.
Nagel, Stuart S., and Marian Neef. 1975. ‘‘Deductive Modeling to Determine OptimumJury Size and Fraction Required to Convict.’’ Washington University Law Review 97:933–78.
Petersen, William. 1997. Ethnicity Counts. New Brunswick, NJ: Transaction Publishers.
Poulos, John Allen. 1995. A Mathematician Reads the Newspaper. New York: Basic Books.
Rae, Douglas et al. 1981. Equalities. Cambridge, MA: Harvard University Press.
Spence, A. Michael. 1974. Market Signaling: Informational Transfer in Hiring and RelatedScreening Processes. Princeton: Princeton University Press.
Zwick, Rebecca. 2002. Fair Game? The Use of Standardized Admissions Tests in HigherEducation. New York/London. Routledge Falmer.
1468 Social Science Quarterly