antonis papaioannou - foundation for research &...
TRANSCRIPT

Design and Implementation of a Systemfor Evaluating Distributed Application
Deployments in Multi-Clouds
Antonis Papaioannou
Thesis submitted in partial fulfillment of the requirements for the
Masters’ of Science degree in Computer Science
University of CreteSchool of Sciences and EngineeringComputer Science Department
Voutes University Campus, Heraklion, GR-70013, Greece
Thesis Advisors: Prof. Evangelos Markatos
This work has been performed at the University of Crete, School of Science andEngineering, Computer Science Department and at the Institute of ComputerScience (ICS) - Foundation for Research and Technology - Hellas (FORTH),Heraklion, Crete, GREECE.
The work is partially supported by the PaaSage (FP7-317715) EU project.


University of CreteComputer Science Department
Design and Implementation of a System for EvaluatingDistributed Application Deployments in Multi-Clouds
Thesis submitted byAntonis Papaioannou
in partial fulfillment of the requirements for theMasters’ of Science degree in Computer Science
THESIS APPROVAL
Author:Antonis Papaioannou
Committee approvals:Evangelos MarkatosProfessor, Thesis Supervisor
Kostas MagoutisResearcher, ICS-FORTH, Thesis Co-Supervisor
Dimitris PlexousakisProfessor, Committee Member
Departmental approval:Angelos BilasProfessor, Director of Graduate Studies
Heraklion, October 2013


Abstract
Cloud computing has recently become an important model of infrastruc-tural services that complements, and in some cases replaces, traditional datacenters in providing distributed applications with the resources they need toserve Internet-scale workloads. The multitude of Cloud providers offeringinfrastructural services today raise the challenge of heterogeneity in the re-sources available to applications. An application developer is thus faced withthe problem of choosing an appropriate set of Cloud providers and resourcesto support their application. One way to address this problem is to establisha Cloud-independent classification of Cloud resources and to systematicallyexplore a large collection of past execution histories of real deployments ofapplications.
In this thesis we present an architecture for the modeling, collection,and evaluation of long-term histories of deployments of distributed multi-tier applications on federations of Clouds (Multi-Clouds). Our goal is tocapture several aspects of application development and deployment lifecy-cle, including the evolving application structure, requirements, goals, andservice-level objectives; application deployment descriptions; runtime moni-toring, and quality control; Cloud provider characteristics; and to provide aCloud-independent resource classification scheme that is a key to reasoningabout Multi-Cloud deployments of complex large-scale applications. Sinceour target is to capture the continuous evolution of applications and theirdeployments over time, we ensure that our metadata model is designed tooptimize space usage. Additionally, we demonstrate that using the modeland data collections over varying deployments of an application (using theSPEC jEnterprise2010 distributed benchmark as a case study) one can an-swer important questions about which deployment options work best in termsof performance, reliability, cost, and combinations thereof. As an example,our analysis can pinpoint the most cost-effective among a dozen deploymentsof an application leading to savings of $2,100 per year without impacting itsservice-level objectives.


Περίληψη
Τα Υπολογιστικά Νέφη αποτελούν σήμερα ένα σημαντικό μοντέλο υπηρε-
σιών υποδομής που συμπληρώνουν, και σε κάποιες περιπτώσεις αντικαθιστούν,
τα παραδοσιακά Κέντρα Δεδομένων στην παροχή πόρων σε κατανεμημένες ε-
φαρμογές μεγάλης κλίμακας. Ωστόσο, ο μεγάλος αριθμός παρόχων υπηρεσιών
Υπολογιστικού Νέφους και η ετερογένεια στους πόρους που παρέχουν συνι-
στούν μια πρόκληση για τις εφαρμογές. ΄Ενας τρόπος να αντιμετωπιστεί αυτή η
πρόκληση είναι η συστηματική μελέτη και κατηγοριοποίηση των πόρων Υπολο-
γιστικού Νέφους σε κλάσεις απόδοσης ανεξάρτητες του παρόχου. Ταυτόχρονα,
η ανάλυση του ιστορικού εγκατάστασης και εκτέλεσης κατανεμημένων εφαρ-
μογών σε ετερογενή περιβάλλοντα Νέφους μπορεί να βοηθήσει σημαντικά τους
μηχανικούς λογισμικού στο να κατανοήσουν τις σχέσεις κόστους - ωφέλειας
σε αυτά τα περιβάλλοντα.
Στην εργασία αυτή παρουσιάζουμε μια αρχιτεκτονική για τη μοντελοποίηση,
συλλογή και αξιολόγηση μακρόχρονων ιστορικών εκτέλεσης κατανεμημένων και
πολυεπίπεδων (multi-tier) εφαρμογών σε πολλαπλά Υπολογιστικά Νέφη. Οσκοπός μας είναι η καταγραφή της εγκατάστασης και εξέλιξης της εφαρμογής,
συμπεριλαμβανομένων των απαιτήσεων και στόχων, της παρακολούθησης (mon-itoring) και του ελέγχου κατά την εκτέλεση, και τέλος των χαρακτηριστικώντων παρόχων. Ταυτόχρονα, η κατηγοριοποίηση πόρων ανεξαρτήτως παρόχου
βάσει συστηματικών μετρήσεων αποτελεί σημαντικό παράγοντα για την επιλογή
της εγκατάστασης σύνθετων εφαρμογών μεγάλης κλίμακας σε πολλαπλά Υπο-
λογιστικά Νέφη. Παρουσιάζουμε ένα σχεσιακό μοντέλο μεταδεδομένων που
ενοποιεί την παραπάνω πληροφορία. Χρησιμοποιώντας αυτό το μοντέλο για
τη συλλογή δεδομένων από διαφορετικές εγκαταστάσεις και εκτελέσεις της ε-
φαρμογής (μελετώντας ως παράδειγμα την εφαρμογή-benchmark SPEC jEnter-prise2010) υποδεικνύουμε πως μπορούν να απαντηθούν σημαντικά ερωτήματαπου αφορούν την εύρεση του καλύτερου τρόπου εγκατάστασης της εφαρμογής
με κριτήριο την απόδοση, το κόστος, και την επίτευξη των στόχων ή συνδυα-
σμούς των προηγουμένων. Ως παράδειγμα της ανάλυσής μας, η συστηματική
μελέτη διαφορετικών συνδιασμών εγκατάστασης του SPEC jEnterprise2010μπορεί να υποδείξει τον πιο οικονομικό τρόπο εγκατάστασης της εφαρμογής,
επιφέρωντας εξοικονόμηση $2.100 ετησίως χωρίς να επηρεάζονται οι στόχοι
απόδοσης.


Acknowledgements
There are so many people that I would like to thank, each one helped mewith their own special way. First of all, I would like to thank my advisorProfessor Evangelos Markatos for supervising, guiding and having trust inthis work. I would also like to thank my co-supervisor Kostas Magoutis. Hehas been a tireless source of inspiration, encouragement and ideas, but mainlyI would like to thank him for his continuous enthusiasm and willingness tohelp me at every stage of this thesis. For all that and much more, I amgrateful. During my studies in the Master’s degree they introduced me tothe notion of research, giving me the bases for the continuation of my studiesand for my future career, so I am grateful to them.
I need to express my gratitude to the University of Crete and the De-partment of Computer Science for providing me with proper education; aswell as the Institute of Computer Science of the Foundation for Research andTechnology (ICS-FORTH) for supporting me.
I want to acknowledge Kuriakos, Giorgos, Chrysostomos, Panagiotis andKonstantina, members of PaaSage team for their valuable feedback on mywork as well as Nikos and Giannis for the collaboration during the 2012NOMS paper. I would also like to thank Antonis, Giorgos, Nikos, Panagiotis,Lazaros, Laertis, Ioasonas, Aris, Thanasis, Christos and Maria my colleaguesat ICS-FORTH that made the countless working hours in the lab fun andinteresting.
During my time in Heraklion, I have been fortunate to enjoy the friend-ship of a number of special people. I would like to give my appreciation tomy friends, Tasos Papagiannis, Vassilis Papakonstantinou, Gogo Beletsioti,Zafi Tsibouli and Giannis Linardakis for the encouragement and the sup-port during my undergraduate and graduate studies as wll as for the greatmoments we had together during these years. Also, I would like to thankSmaragda Asimaki who has always been there for me, supporting me in allpossible ways.
I need to express my appreciation to my aunt Despoina and my uncleGiorgos for their support and care during all the years in Heraklion.
Last but not least I am grateful to my father Alexandros, my motherMaria as well as my brother Giorgos for the encouragement and the supportin every single aspect of my life.
Antonis Papaioannou


Contents
1 Introduction 11.1 Thesis Contributions . . . . . . . . . . . . . . . . . . . . . . . 31.2 Thesis Organization . . . . . . . . . . . . . . . . . . . . . . . . 3
2 Background 52.1 Cloud computing model . . . . . . . . . . . . . . . . . . . . . 52.2 Heterogeneity of resources . . . . . . . . . . . . . . . . . . . . 62.3 Infrastructure and application Modeling . . . . . . . . . . . . 72.4 Application management . . . . . . . . . . . . . . . . . . . . . 11
3 Design 133.1 Architecture . . . . . . . . . . . . . . . . . . . . . . . . . . . . 133.2 Cloud-independent resource classification . . . . . . . . . . . . 143.3 Metadata model . . . . . . . . . . . . . . . . . . . . . . . . . . 17
3.3.1 Cloud provider properties . . . . . . . . . . . . . . . . 193.3.2 Application . . . . . . . . . . . . . . . . . . . . . . . . 193.3.3 Requirements, Service Level Objectives & Elasticity . . 203.3.4 Execution History . . . . . . . . . . . . . . . . . . . . . 203.3.5 Physical Resources . . . . . . . . . . . . . . . . . . . . 213.3.6 Temporal Aspect . . . . . . . . . . . . . . . . . . . . . 22
4 Evaluation 254.1 Typical use cases . . . . . . . . . . . . . . . . . . . . . . . . . 274.2 Analysis of application elasticity actions . . . . . . . . . . . . 314.3 Discover Physical Infrastructure Topology . . . . . . . . . . . 324.4 Managing database evolution over time . . . . . . . . . . . . . 39
5 Conclusions and Future Work 43
I

A VM instance types 45
II

List of Figures
2.1 Cloud computing layers [16] . . . . . . . . . . . . . . . . . . . 62.2 CloudML Metamodel [23]. . . . . . . . . . . . . . . . . . . . . 82.3 PIM4Cloud Metamodel [24]. . . . . . . . . . . . . . . . . . . . 92.4 The TOSCA service template. Nodes represent the service’s
components, whereas relationships connect and structure nodesinto the topology. Plans capture the operational aspects of thecloud service [6]. . . . . . . . . . . . . . . . . . . . . . . . . . 10
3.1 System architecture . . . . . . . . . . . . . . . . . . . . . . . . 143.2 CPU performance classification of different VM types . . . . . 153.3 Memory size classification of different VM types . . . . . . . . 163.4 Metadata model . . . . . . . . . . . . . . . . . . . . . . . . . . 183.5 Affinity goal of a distributed file system . . . . . . . . . . . . . 203.6 System architecture . . . . . . . . . . . . . . . . . . . . . . . . 22
4.1 Typical configuration of SPEC jEnterprise2010 [42] . . . . . . 264.2 Deployment and execution model of SPEC jEnterprise2010 . . 274.3 Response time of purchase transactions for hourly executions
of jEnterprise2010 over a period of six days . . . . . . . . . . 314.4 SPEC jEnterprise2010 with elasticity [42] . . . . . . . . . . . . 324.5 Successful invocation of elasticity rule . . . . . . . . . . . . . . 334.6 Unsuccessful invocation of elasticity rule . . . . . . . . . . . . 334.7 Integration of management system with HDFS . . . . . . . . . 344.8 HDFS exploiting information about Cloud infrastructure topol-
ogy . . . . . . . . . . . . . . . . . . . . . . . . . . . . . . . . . 354.9 Representation of VM collocations of a Cloud user: 10.10.9.*
are private IP addresses of VMs; 1-4 are identifiers of Cloudnodes hosting those VMs . . . . . . . . . . . . . . . . . . . . . 36
III

4.10 Growth of metadata database size with increasing number ofapplications . . . . . . . . . . . . . . . . . . . . . . . . . . . . 40
IV
List of Tables
3.1 Disk throughput measurements and classification . . . . . . . 163.2 Inter-VM bandwidth measurements . . . . . . . . . . . . . . . 17
4.1 Selected SPEC jEnterprise2010 deployment plans . . . . . . . 284.2 Cost-effectiveness for successful executions (Ratio is price-normalized
performance) . . . . . . . . . . . . . . . . . . . . . . . . . . . 294.3 Inter-VM bandwidth measurements . . . . . . . . . . . . . . . 38
A.1 Instance Type Details . . . . . . . . . . . . . . . . . . . . . . 45
V


Chapter 1
Introduction
Cloud computing [1] has become a dominant model of infrastructural ser-vices replacing or complementing traditional data centers and providing dis-tributed applications with the resources that they need to serve Internet-scaleworkloads. The Cloud computing model is centered on the use of virtualiza-tion technologies (virtual machines (VMs), networks, and disks) to reap thebenefits of statistical multiplexing on a shared infrastructure. However, thesetechnologies also obstruct the details of the infrastructure from applications.Thus is very difficult to select the feasible or even the optimal resources forthe application deployment. The problem of how to systematically explorea large collection of past execution histories of a multitude of real deploy-ments of applications is less well studied. Such a facility has the potentialof answering a variety of key questions about the runtime behavior of dif-ferent deployments of complex applications, such as: which infrastructure(Cloud providers and/or types of resources) works best for certain applica-tions? What are the most cost-effective options between a variety of config-urations I (or my user community) have tried in the past? What rules orpolicies have been effective in achieving goals (or equivalently in addressingruntime issues) during past executions?
Integration of application modeling and deployment/operations environ-ments has been gaining traction recently. For instance, the popular GitHubcode repository supports adding a Cloud provider as a remote applicationrepository, on which applications can be pushed for deployment. An interop-erable Cloud provider (such as Heroku) will accept the push and receive theexpected directories and files, deploying the application. Bringing togetherdeveloper and operation teams is the goal of a new wave of DevOps platforms
1

2 CHAPTER 1. INTRODUCTION
such as Chef [2] and Puppet [3]. What is missing from such environmentsis a well-integrated feedback loop including monitoring information, SLA as-sessments, etc., support for storage and analysis of potentially vast historiesof past executions, and awareness of Multi-Cloud deployments. Support forsuch an integrated loop is a key goal of the architecture presented in thisthesis.
Handling heterogeneity in the infrastructure has been a challenging un-dertaking since the early days of data centers. A variety of hardware vin-tages and suppliers selected to improve cost-efficiency over time complicatesthe resource picture. The state of things in the Cloud space today is notmuch different: heterogeneity is ever present in the form of different typesof resources offered from different Cloud providers. What is more, virtualresources carry nominal or indicative characterizations of their capabilities,making comparison inaccurate. To improve on the current state of affairs,we propose and implement a Cloud-independent classification scheme wherevirtual machine (VM) types are grouped with similarly-rated types acrossCloud providers, according to a specific dimension such as CPU, memory,or I/O capability. The VM ratings are computed using a vector-driven ap-proach taking into account individual micro-benchmarks on the VMs. Ratingis sampled across regions and periodically repeated to capture variations andchanges over time in the underlying hardware of the Cloud provider. Classi-fication may also be repeated at different times to apply different criteria onthe VM ratings (such as how many classes to group VMs into).
The architecture presented here combines a unique set of features notfound in existing systems. It shares the principle of modeling applicationstructure and deployed resources with systems such as SmartFrog [4], CloudML[5], TOSCA [6], models@runtime [7] and Cloudify [8]. It features detailedcomponent-based monitoring of application performance typically found inApplication Performance Management systems [9] and products such as IBMTivoli Composite Application Manager. While addressing important prob-lems in an application’s lifecycle (such as determining problem root-causes)such systems do not offer a way to benefit from a potentially vast past expe-rience in order to improve future deployments. Mining past histories to gainknowledge in the form of determining rules or detecting and ranking anoma-lies has been applied in the case of data center event collections [10, 11], indiscovering configuration errors [12, 13], and in modeling performance char-acteristics of desktop applications [14]. Our approach extends to complex

1.1. THESIS CONTRIBUTIONS 3
distributed applications and covers deployment and lifecycle aspects such aselasticity and resource classification that are relevant to Multi-Cloud setups.
1.1 Thesis Contributions
• A Cloud-independent resource classification scheme that groups Cloudresources based on their benchmarked performance along three dimen-sions (CPU, memory, I/O)
• An information model capturing application development and deploy-ment, requirements and goals, allocated infrastructure resources andruntime monitoring, along with characteristics of application execu-tions over time
• An evaluation of data collected from executions a typical multi-tierdistributed application (SPEC jEnterprise2010) over traditional (singleCloud) and Multi-Cloud setups, for a variety of use-case scenarios
1.2 Thesis Organization
The rest of this thesis is organized as follows: Section 2 provides backgroundand related work that this work is based on. Chapter 3 presents the architec-ture, the design and implementation of the framework. Chapter 4 presentsexperimental analysis and evaluation of this work. Finally, Chapter 5 sum-marizes the work of this thesis and draws conclusions and future work.

4 CHAPTER 1. INTRODUCTION

Chapter 2
Background
2.1 Cloud computing model
Cloud Computing is a quite new term for a long-held dream of computing asa utility [15], which has recently emerged as a commercial reality. A cloudservice has three distinct characteristics that differentiate it from traditionalhosting. It is sold on demand, typically by the minute or the hour; it iselastic – providers supply their resources on-demand from their large poolsinstalled in data center and users can use as much as they need at any giventime; and the service is fully managed by the provider.
Cloud computing providers offer their services according to three fun-damental models: infrastructure as a service (IaaS), platform as a service(PaaS), and software as a service (SaaS). IaaS is the most basic cloud-servicemodel and each higher model abstracts from the details of the lower mod-els as shown is figure 2.1. According to this model providers offer access toresources such as virtual machines (VM) to their clients. PaaS is definedas a set of software and product development tools hosted on the provider’sinfrastructure. It also offers an execution runtime environment where userscan deploy their applications without the need to choose the underlying oper-ating system, the software and the hardware resources. SaaS model providesto users access to application software services. The infrastructure and theplatforms that run the applications.
A cloud can be private or public. The main difference between these twomodels regard the targeted users who can use the offered resources ratherthan technical characteristics. A private cloud infrastructure operates solelywithin single organization. A public cloud is open to anyone and their ser-
5

6 CHAPTER 2. BACKGROUND
Figure 2.1: Cloud computing layers [16]
vices are rendered over a network. A third model is the hybrid cloud whichincludes the composition of at least one private and one public cloud thatremain unique entities but are bound together. This model is useful whenan application is deployed on a private cloud and "bursts" to a public cloudwhen the demand for computing capacity increases. Multi-Cloud deploymentis a more general term and is used to describe that an application is deployedon many different clouds. Is is not necessary to include public and privateclouds.
2.2 Heterogeneity of resources
Cloud computing is having a transformational effect on enterprise IT op-erations, software engineering, service-oriented computing, and society as awhole. Many Cloud computing providers today offer their services accordingto several fundamental models: infrastructure as a service (IaaS), platformas a service (PaaS), and software as a service (SaaS). In addition there areapproaches towards Multi-Cloud [17] which focus on the need to break thecurrent lock-in experienced by application developers on the Cloud providerthey design for and deploy on, and to allow them to simultaneously use (andseamlessly arbitrate between) several Cloud providers. As a result hetero-geneity is ever present in the form of different types of resources offered fromdifferent Cloud providers. In addition the description of the resources usuallyinclude simple properties (such as the number of virtual cores) which doesn’tprovide an insight of the actual performance. A few Cloud providers have
2.3. INFRASTRUCTURE AND APPLICATION MODELING 7
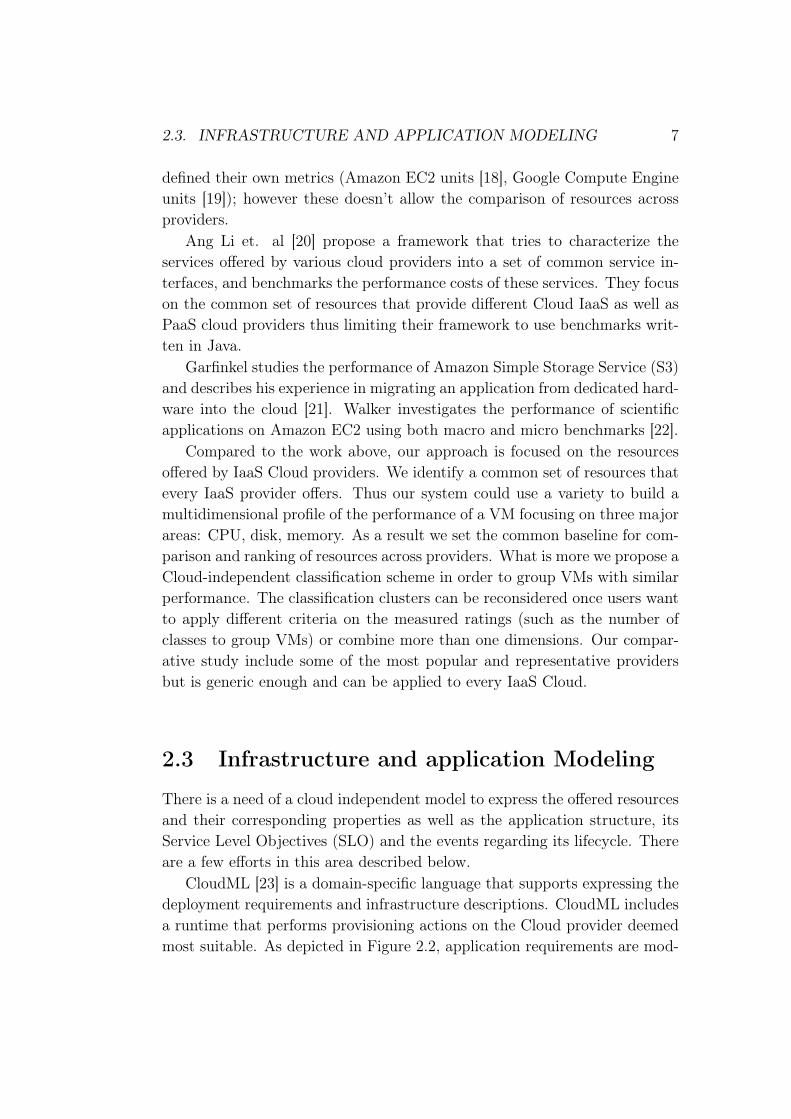
defined their own metrics (Amazon EC2 units [18], Google Compute Engineunits [19]); however these doesn’t allow the comparison of resources acrossproviders.
Ang Li et. al [20] propose a framework that tries to characterize theservices offered by various cloud providers into a set of common service in-terfaces, and benchmarks the performance costs of these services. They focuson the common set of resources that provide different Cloud IaaS as well asPaaS cloud providers thus limiting their framework to use benchmarks writ-ten in Java.
Garfinkel studies the performance of Amazon Simple Storage Service (S3)and describes his experience in migrating an application from dedicated hard-ware into the cloud [21]. Walker investigates the performance of scientificapplications on Amazon EC2 using both macro and micro benchmarks [22].
Compared to the work above, our approach is focused on the resourcesoffered by IaaS Cloud providers. We identify a common set of resources thatevery IaaS provider offers. Thus our system could use a variety to build amultidimensional profile of the performance of a VM focusing on three majorareas: CPU, disk, memory. As a result we set the common baseline for com-parison and ranking of resources across providers. What is more we propose aCloud-independent classification scheme in order to group VMs with similarperformance. The classification clusters can be reconsidered once users wantto apply different criteria on the measured ratings (such as the number ofclasses to group VMs) or combine more than one dimensions. Our compar-ative study include some of the most popular and representative providersbut is generic enough and can be applied to every IaaS Cloud.
2.3 Infrastructure and application Modeling
There is a need of a cloud independent model to express the offered resourcesand their corresponding properties as well as the application structure, itsService Level Objectives (SLO) and the events regarding its lifecycle. Thereare a few efforts in this area described below.
CloudML [23] is a domain-specific language that supports expressing thedeployment requirements and infrastructure descriptions. CloudML includesa runtime that performs provisioning actions on the Cloud provider deemedmost suitable. As depicted in Figure 2.2, application requirements are mod-

8 CHAPTER 2. BACKGROUND
Figure 2.2: CloudML Metamodel [23].
eled as templates consisting of nodes that need to be provisioned in theCloud. During the provisioning process, an engine creates instances for eachnode and attempts to find Cloud resources for each one of them. Runtimeinstances follow the [email protected] [7] approach, which allows the user toquery their status or any other runtime-related information. Once provision-ing is completed and all runtime instances have started, deployment can beperformed. CloudML does not support Multi-Cloud provisioning: a singleapplication cannot be spread across multiple providers. Finally, CloudMLnode models are characterized by simple textual descriptions of RAM, CPU,disk and location properties and thus cannot support advanced reasoning forMulti-Cloud cross-platform provisioning decisions.
PIM4Cloud [24] is another platform independent language devoted to themodeling of both private and public Cloud infrastructures through the de-scription of the resources exposed by these infrastructures and required bya specific application. PIM4Cloud enables the expression of the intent of aservice model without capturing its realization in a runtime framework. Itcan be exploited in discovering a Cloud provider that offers the resourcesrequired by a specific application. A limitation of PIM4Cloud however isthat it ignores other phases of an application’s lifecycle. Moreover, no de-ployment artifacts are associated with Cloud nodes, component dependenciesare not modeled and the language does not support non-functional and QoS

2.3. INFRASTRUCTURE AND APPLICATION MODELING 9
Figure 2.3: PIM4Cloud Metamodel [24].
requirements or capabilities. Additionally, its infrastructure descriptions aretoo low-level (e.g., CPU frequency).
A modeling approach must address the complete Cloud application life-cycle through appropriate processes and plans. TOSCA [6] is such a recentspecification language, derived from a long line of work in software provi-sioning, deployment and management of distributed services. TOSCA is amiddle-level language for the specification of the topology and orchestrationof an IT service in the form of a service template. The language focuseson the semi-automatic creation and management of an IT service indepen-dent of any Cloud providers. The management of an IT service is achievedthrough the specification and execution of process models (BPMN, BPEL),which define an orchestration of services. Three types of plans are envisioned:build and termination plans associated to the deployment and terminationof an IT service as well as modification plans associated to the IT servicemanagement. Each plan comprises tasks which refer to operations of eitherthe interface of Node types or an external interface. The plans can be eitherplaced inside the service specification or a reference to an external plan spec-ification is used. Such plans can be specified by an existing process modelinglanguage, such as BPMN or BPEL. In fact, the exploitation of BPMN plansis already supported in TOSCA. The topology of an IT service, which ex-presses the service structure, is described through the specification of nodesand their relationships. A node is described via various observed properties,

10 CHAPTER 2. BACKGROUND
its requirements and capabilities, its management functions through its in-terface, while it also comprises deployment and implementation artifacts. Italso declares the types of states it can expose and is associated to specificmanagement policies. The implementation artifacts of a node are associatedto the implementation of the node’s interface operations, while the deploy-ment artifacts are required during the node’s instantiation. Relationships areused to denote node dependencies such that the requirements of one nodeare associated to the capabilities of a another node and there is a coupling ofthe nodes’ interfaces. Their information includes the specification of proper-ties and instance states. Figure 2.4 shows the main elements involved in thespecification of a service template and their relationships.
Figure 2.4: The TOSCA service template. Nodes represent the service’s com-ponents, whereas relationships connect and structure nodes into the topology.Plans capture the operational aspects of the cloud service [6].
According to our approach we propose a metamodel that unifies proper-ties of the previously described models and adds some extra features. Our
2.4. APPLICATION MANAGEMENT 11
goal is to capture several aspects of application deployment and executionlifecycle. In more details it includes the application structure, requirements,goals and service-level objectives (SLO) as well as the Cloud provider charac-teristics and resource classification that are relevant to Multi-Cloud setups.In addition it features detailed component-based monitoring of applicationperformance and lifecycle aspects such as elasticity.
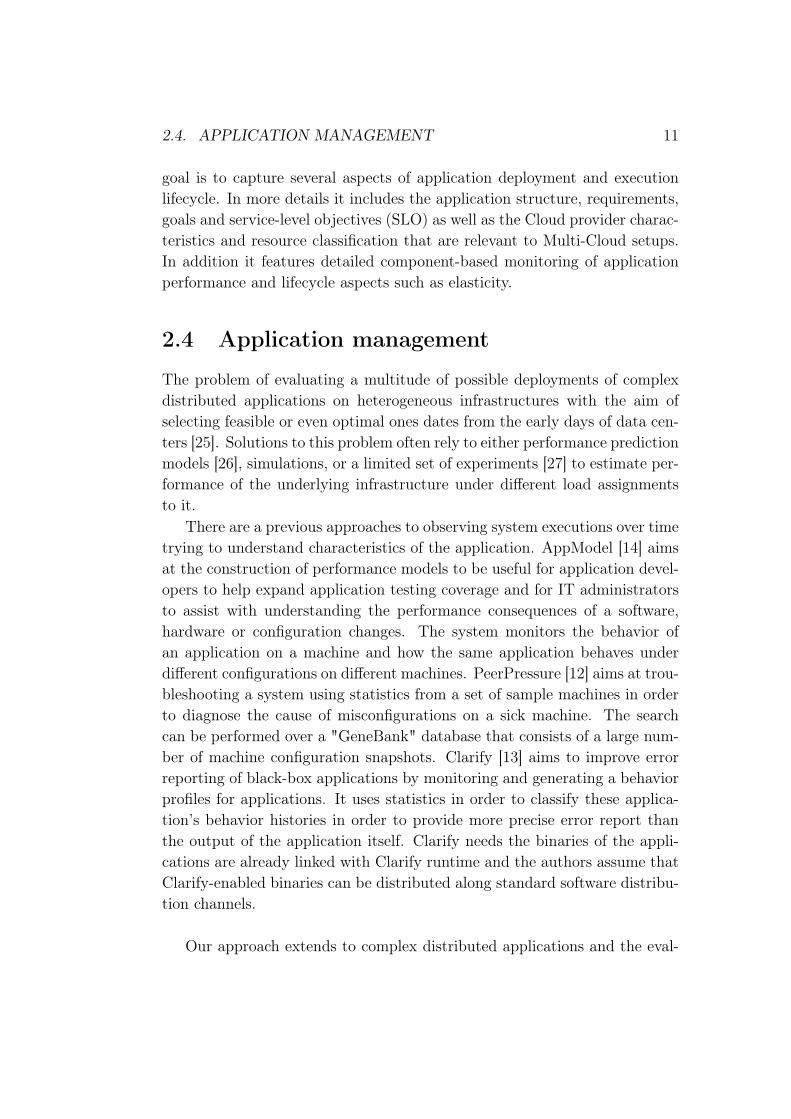
2.4 Application management
The problem of evaluating a multitude of possible deployments of complexdistributed applications on heterogeneous infrastructures with the aim ofselecting feasible or even optimal ones dates from the early days of data cen-ters [25]. Solutions to this problem often rely to either performance predictionmodels [26], simulations, or a limited set of experiments [27] to estimate per-formance of the underlying infrastructure under different load assignmentsto it.
There are a previous approaches to observing system executions over timetrying to understand characteristics of the application. AppModel [14] aimsat the construction of performance models to be useful for application devel-opers to help expand application testing coverage and for IT administratorsto assist with understanding the performance consequences of a software,hardware or configuration changes. The system monitors the behavior ofan application on a machine and how the same application behaves underdifferent configurations on different machines. PeerPressure [12] aims at trou-bleshooting a system using statistics from a set of sample machines in orderto diagnose the cause of misconfigurations on a sick machine. The searchcan be performed over a "GeneBank" database that consists of a large num-ber of machine configuration snapshots. Clarify [13] aims to improve errorreporting of black-box applications by monitoring and generating a behaviorprofiles for applications. It uses statistics in order to classify these applica-tion’s behavior histories in order to provide more precise error report thanthe output of the application itself. Clarify needs the binaries of the appli-cations are already linked with Clarify runtime and the authors assume thatClarify-enabled binaries can be distributed along standard software distribu-tion channels.
Our approach extends to complex distributed applications and the eval-

12 CHAPTER 2. BACKGROUND
uation of their deployments in Multi-Clouds. At the core of the architecturewe use an information metamodel that can model the application structureas well as the allocated infrastructure resources. The application does notrequire any modifications or instrumentation itself or its components as thereis no need to export information regarding its state as most of the previousapproaches. What is more our system supports detailed component-basedmonitoring application performance (e.g throughput) as well as Service LevelObjectives (SLO). In addition it supports monitoring of the underlying re-sources used by the application. It doesn’t make any assumptions of normaland abnormal behavior of the applications or any misconfiguration.
As a result it captures the history and evolution of the application lifecycleoffering a way to benefit from experience in order to improve future deploy-ments. This can be achieved by identifying which configuration settings andon which resources exhibit the best performance. Our system can be used indiscovering cost-effective deployment plans, and in reasoning about elasticitypolicies under different assumptions

Chapter 3
Design
3.1 Architecture
The architecture of our system is depicted in Figure 3.6. It consists of threemain components: the Classifier, the Explorer/Analyzer and the MetadataDatabase. The purpose of the Classifier component (described in detail inSection 3.2) is to assess and classify periodically the resources offered bydifferent Cloud providers in a Cloud-independent manner. It subsequentlyupdates the corresponding information in our metadata model described inSection 3.3. The Explorer/Analyzer component has two major goals. First,to explore the space of application configurations and deployment possibili-ties based on certain criteria. Second, to perform analysis of historical datafrom past executions in order to mine information about performance, cost,etc. The Explorer/Analyzer is aware of the structure of applications. TheExplorer part decides on which VMs the application components should bedeployed, based on certain requirements (e.g the J2EE application servercomponent of the application should be deployed on a VM with CPU capa-bility labeled -generically, and in a provider-independent manner– as large).The Explorer stores these deployment plans as well as the SLA requirementsand the elasticity rules of the application (if any) in the metadata model.
Clearly exploration can be a time-consuming task (since deployment andexecution of each run can take hours or days, or even longer), so we as-sume that the exploration is a background activity that grows the historicaldatabase over time, rather than issued as a response to current time-sensitivequeries. Optionally, part of the input to the historical database can be com-ing from a user community willing to share their deployment histories in
13

14 CHAPTER 3. DESIGN
Explorer/AnalyzerClassifier
Cloud Provider Cloud Provider Cloud Provider
Application
MetadataDB
Figure 3.1: System architecture
open data repositories such as the Stanford Large Network Dataset Collec-tion (SNAP) [28]. The Analyzer part can pose a variety of queries to thedatabase to perform analytics, such as comparing the performance of an ap-plication across different deployments to determine the best performing ormost cost-effective configuration settings.
3.2 Cloud-independent resource classification
To rank Cloud resources in a Cloud-independent manner we first create a pro-file for every VM type offered by various Cloud providers that describes theperformance capabilities of the VM. In this way we can categorize resourcesto different classes of service, such as small, medium, large, etc. The VMprofile is based on a vector of performance metrics focusing on three areas:CPU performance, memory size, I/O throughput. Our rationale in using avector of performance metrics rather than a single benchmark was to simul-taneously take into account multiple aspects of performance in ranking VMs.We use k-means cluster analysis [29] to classify resources based on benchmarkresults for each VM aspect. K-means takes as input the desired number of

3.2. CLOUD-INDEPENDENT RESOURCE CLASSIFICATION 15
1c2m
1c1m
4c4m
6c6m
3c4m
3c6m
c1.medium
azure.small
m2.xlarge
m1.xlarge
m1.sm
all
m1.m
ediumm1.large
c1.xlarge
Figure 3.2: CPU performance classification of different VM types
clusters to group VMs in and performs the classification automatically.Our experience showed that existing benchmark suites such as SPEC
CPU2006 [30] satisfy our objectives, thus we rely on it for CPU performancecharacterization. To factor-in the benefits of core parallelism we use the ratemetric of SPEC CPU2006 that measures aggregate throughput. Classifi-cation can be optionally refined by normalizing by the cost of resources.Figure 3.2 presents the k-means grouping of 14 VM types from three Cloudproviders (Amazon EC2, Azure, Flexiant) based on CPU performance. Weuse the standard naming scheme for Amazon VM types. We developed ourown naming scheme for Flexiant VMs based on two numbers: the first de-notes number of cores and the second memory size (GB); e.g: 3c6m standsfor 3 cores, 6GB memory. Our Azure academic account provided us with ac-cess to a single VM type, which we refer to as azure.small (1 core, 1.75GB).Our k-means analysis classifies the 14 VM types into four groups: xsmall,small, medium, large. Amazon’s c1.xlarge is alone in the large class,whereas the other classes comprise 4-5 VM types each. A common theme inthe xsmall group is that all VMs in it have a single virtual core.
Classifying VM types based on memory size can be performed via the k-means algorithm, just as in the case of CPU performance. Figure 3.3 depictsthree clusters small, medium, and large, created for the 14 VM typesused in the previous case. Notice that the number of clusters created toclassify VMs in each of the dimensions (CPU, memory, I/O) can vary.
Classifying VM types based on storage performance must ensure thatall storage options offer the same consistency semantics. To reflect industrystandard practices, we chose to evaluate VMs with remotely mounted storage(without optimizations) across all providers. We used the hdparm benchmarkto measure average disk throughput and standard deviation over ten trials.We considered storage performance of the Amazon, Azure, and Flexiant FCOVM types shown in Table 3.1. I/O throughput to network storage seems to

16 CHAPTER 3. DESIGN
m1.small
c1.medium
azure.small
1c1m
m1.medium
1c2m
3c4m
c1.xlarge
3c6m
6c6m
m1.large4c4m
m2.xlarge
m1.xlarge
Small Medium Large
Figure 3.3: Memory size classification of different VM types
Provider VM T/put (MB/s) Dev (%) Avg (MB/s) Class
Amazon
c1.medium 109.1 3.0 102 largec1.xlarge 95.8 3.3m1.small 78.7 5.9
73 mediumm1.medium 70.9 10.7m1.large 68.7 22.0
Flexiant
1c1m 38.4 15.3
41 small
1c2m 40.5 13.53c4m 39.1 21.23c6m 41.1 16.74c4m 38.4 14.66c6m 45.0 6.3
Azure small 35.3 4.0 35 small
Table 3.1: Disk throughput measurements and classification
fall into one or two narrow bands within each Cloud provider. It thus seems todepend more on the type of storage rather than type of VM (although smallerVMs spend a higher CPU share to do I/O at full speed). An exception isAmazon EC2 where c1 instances seem to have access to higher-performingstorage compared to m1 instances. Table 3.1 shows the classification of theVMs into small, medium, large.
Finally we note that we consider network performance primarily a char-acteristic of the Cloud provider and to a lower extent a characteristic of aVM type, we thus treat it separately from the other three dimensions (CPU,memory, storage). We use netperf [31] as measurement tool to report net-work bandwidth according to previous work [32]. Table 3.2 summarizes the

3.3. METADATA MODEL 17
Platform Throughput(Mbps)
Flexiscale 750Amazon 550Azure 555
Rackspace 29.8
Table 3.2: Inter-VM bandwidth measurements
results of the evaluation of Cloud providers based on their network perfor-mance. Rackspace seems to limit -through explicit control at the networklevel or at the hypervisor- the VM network bandwidth to a fraction of thepeak bandwidth supported by the network technology.
3.3 Metadata model
In this section we describe the metadata model at the core of our architec-ture (Figure 3.6). The model (whose schema in standard E/R notation isshown in Figure 3.4) is meant to capture the description of an application,its requirements and goals, rules and policies, and its provisioned resources,as well as runtime aspects of its execution histories such as monitoring in-formation at different levels, invocations of rules and policies, and quality ofservice assessments. The model also captures Cloud provider characteristics,platforms, as well as users, roles, and organizations.
The system described in this paper is meant for long-term preservationfor information. It is designed to associate mutations with a wall-clock times-tamp and to trace the identity of the sources of mutations. It thus sharesprinciples with archival systems [33], temporal databases [34], and prove-nance systems [35]. The information schema describes the applications andtheir deployment using principles from specifications such as CloudML [5],PIM4Cloud [24], and TOSCA [6]. The exposition of the metamodel providedhere is necessarily concise and lacking detail, as an exhaustive presentationwould require far more space than we have available in this paper.
3.3.1 Cloud provider properties
Cloud providers are described in cloud_provider object where we storeinformation regarding the name, the geographic location of the data center

18 CHAPTER 3. DESIGN
Figure 3.4: Metadata model

3.3. METADATA MODEL 19
and whether it is a public or private provider. Information about a virtualmachine instance such as the name, IP address, OS as well as its lifetimeperiod is stored in artefact_instance object. Each node instanceis of a particular cd_vm_type and ci_cm_type where cd stands forcloud dependent and ci for cloud independent. A cd_vm_type describes areal-world VM type offered by a Cloud provider. In addition to the tex-tual description of the properties of the VM (name, hardware, location,cost) this object keeps the score of the performance evaluation based onthe benchmarking assessment described in Section 3.2. ci_vm_types arethe result of (periodic) classifications described in Section 3.2. The platformservices offered by a Cloud provider described in platform_as_serviceobject. In addition information about the physical infrastructure and thetopology of the Cloud platform is modeled with the physical_node andvm_to_pm_association objects.
3.3.2 Application
A version of an application is rooted at an application object where westore the application name, its name and the responsible user. An applicationis comprised by software artefact and artefact_instance objects. Anartefact type represents a generic component of the application (e.g. Java EEapplication server or a relational database). The artefact instance refers to aspecific instance of an artefact type. For example the corresponding instanceof the artefact Java EE application server and relational database could beJBoss AS 7 and MySQL 5.5 respectively. In addition applications may usedata_objects (such as JavaBeans). These data_objects are exported(produced) and consumed between artefact_instances. This associationis represented by the object_association object. Finally, users, roles,and organizations connected to the modeled entities are described in users,organization, and roles objects [36].
3.3.3 Requirements, Service Level Objectives & Elas-ticity
root_slo is used to express non-IT constraints such as overall cost, loca-tion, etc. it_slo objects can express a requirement on an IT metric [37].This object can be used to express the objectives of the application or objec-

20 CHAPTER 3. DESIGN
File
VM VM
Replicated �le chunks
(anti-)A�nity Goal: No two replicas on the same VM
Figure 3.5: Affinity goal of a distributed file system
tives per artefact_instance. slo_assessment object can be used toexpress whether the SLO is violated or not. If the application has elasticityfeatures the metadata model provides elasticity_rules and elastic-ity_action objects. In addition affinity_goal expresses dependenciesbetween artifacts. For example suppose that the application is a distributedfile system. When a user wants to store a file, the application usually splitsit to chunks. For each chunk the application stores two replicas concern-ing availability and durability reasons. The application policy requires eachreplica to be stored on a different VM. This kind of goal is modeled as anaffinity_goal of the application (figure 3.5).
3.3.4 Execution History
Information about each execution of an application is rooted at an exe-cution_context with a start and end time. Part of the execution his-tory is the mapping between the software components of the applications(artefacts) and the corresponding resources they use. This correlation isrepresented with deployment_association and object_associationobjects. In addition an execution of the application may include monitoringinformation. appl_monitor object is used to monitor the overall appli-

3.3. METADATA MODEL 21
cation behavior while artefact_monitor concerns monitoring data fora particular artefact instance. On the other hand monitoring informationregarding the resources can be modeled using resource_monitor andresource_coupling_monitor objects. The latter is used to monitorthe communication per VM pairs.
3.3.5 Physical Resources
The Cloud computing model is based on the virtualization technologies wherethe physical resources are shared among many virtual machines exploitingthe benefits of the statistical multiplexing. VMs can end up being collocatedbecause either the allocation policy may in some cases favor this (e.g., whenusing large core-count systems such as Intel’s Single-Chip Cloud (SCC) [38])or because of limited choices available to the allocation algorithm at differenttimes. While collocation may be desirable for the high data throughputavailable between the VMs, it is in general undesirable when an applicationwants to decouple VMs with regards to physical machine or network failurefor the purpose of achieving high availability.
Several distributed applications such as data-intensive applications [39][40] [41] which replicate data onto different system nodes for availabilityrequire the nodes holding replicas of the same data block to have independentfailures. To decide which nodes are thus suitable to hold a given set ofreplicas, an application must have knowledge about data center topology,which is often hidden from applications or provided only in coarse form.
Apart from the virtual resources offered by the Cloud providers ourschema can model the underlying physical nodes and their properties (phys-ical_node object) as well as the as the association between them and VMsthat are hosted on (vm_to_pm_association object). Many applicationsthat require information about the topology of the infrastructure in orderto satisfy their goals. For example assume that the application described insection 3.3.3 requires to store identical replicas to VMs that do not sharethe same physical machine. In this case the application could achieve itsavailability and durability objectives exploiting the information about theinfrastructure topology (figure ???). In section 4.3 we present a case studyof such an application and propose a method which can extract informationabout the topology in public providers. In addition this kind of information isvery useful for administrators of the Cloud infrastructure as they can identify

22 CHAPTER 3. DESIGN
File
VM VM
Physical Server
Replicated�le chunks
(anti-)A�nity Goal:No two replicas shouldbe on VMs sharing a PM
VM-to-PMassociation
Figure 3.6: System architecture
which VMs hosted on the physical nodes. As a result it is straightforward tofind out the applications affected by bad performance of a specific physicalnode or ever schedule VM migrations due to hardware maintenance.
3.3.6 Temporal Aspect
Objects that are related with the lifecycle of the deployed application (suchas execution context, node instances associations objects) have a temporalaspect indicating that they are related with specific fact, an execution of thatapplication. These objects contain data that vary over time as they modelthe history of reality. They are represented by valid-time state tables. Therecords of these tables are specified by two timestamp columns, one specifyingwhen the row became valid and one specifying when the row stopped beingvalid. The intervening time is termed the period of validity of records. On theother hand monitoring objects and elasticity action object use a timestampto capture the point in time when the data are reported. It doesn’t meantto define a period of validity rather a snapshot in time.
The classifier component of our system updates the performance evalu-ation and its corresponding classification data of cd_vm_type objects in

3.3. METADATA MODEL 23
our metadata model periodically. Each update is marked with a timestamp.There is a sequenced constraint which applied at any point in time. Theconstraint requires there is only one performance rating score of each VM atany point in time. As a result we use only one timestamp to define periodsof validity. In particular the timestamp defines the start of a new epoch ofperformance capabilities of the VM and at the same time marks the end timeof its previous epoch.

24 CHAPTER 3. DESIGN

Chapter 4
Evaluation
We evaluate our architecture using the distributed SPEC jEnterprise2010benchmark [42] as a case study. To create a rich history of executions wedeploy SPEC jEnterprise2010 to different Cloud providers under differentdeployment plans. SPEC jEnterprise2010 is a full system benchmark thatallows performance measurement and characterization of Java EE 5.0 serversand supporting infrastructure. The benchmark models supply a chain con-sisting of an automobile manufacturer (referred to as the Manufacturing Do-main) and automobile dealers (referred to as the Dealer Domain). The Web-based interface between the manufacturer and dealers supports browsing acatalog of automobiles, placing orders, and indicating when inventories havebeen sold. The SPEC jEnterprise2010 application requires a Java EE 5.0application server and a relational database management system (RDBMS),which comprise the system under test (SUT). A typical configuration of theapplication is depicted in Figure 4.1.
The primary metric of the SPECjEnterprise2010 benchmark is through-put measured as jEnterprise operations per second (EjOPS). EjOPS are cal-culated by adding the metrics of the Dealership Management Application(Dealer Domain) and the Manufacturing Application (Manufacturing Do-main) as:
SPEC jEnterprise2010 EjOPS = Dealer transactions / sec+Work orders / sec
A load generator (referred to as a Driver) produces a mix of browse,manage, and purchase business transactions at the targeted injection rate (or
25

26 CHAPTER 4. EVALUATION
Figure 4.1: Typical configuration of SPEC jEnterprise2010 [42]
txRate, equal to the number of simulated clients divided by 10), which aims toproduce the targeted EjOPS. The Driver measures and records the responsetime (RT) of the different types of business transactions. The RT refers tothe time elapsed between the first byte the Driver sent in order to request abusiness transaction and the last byte received by the Driver to complete thatbusiness transaction. Failed transactions in the measurement interval are notincluded in the reported results. At least 90% of the business transactionsof each type must have a RT of less than the constraint threshold (set to 2seconds for each transaction type). The average RT of each transaction typemust not exceed the recorded 90th percentile RT by more than 0.1 seconds.This requirement ensures that all users see reasonable response times. Forexample, if the 90th percentile RT of purchase transactions is 1 second, thenthe average cannot be greater than 1.1 seconds. The Driver checks andreports on whether the response time requirements are met during a run.
We model the SPEC jEnterprise2010 application using three artefacts(Section 3.3) corresponding to the business logic of the application, theapplication server, and the RDBMS. These artefacts are instantiated asspecj.ear and emulator.war files, a JBoss 6.0 application server, and a MySQL5.5 and their corresponding node instance are associated via the deploy-ment_instances table, as shown in Figure 4.2. The it_slo on responsetime is set to 2 sec. Our deployment plans consider the deployment of theapplication and database artefact instances on the same node as well as onseparate node instances (i.e., same VM vs. different VMs) on one or moreproviders. The back-end database was populated for a targeted dataset of up

4.1. TYPICAL USE CASES 27
Figure 4.2: Deployment and execution model of SPEC jEnterprise2010
to 800 clients. For every execution of the benchmark we use its EjOPS met-ric and the reported RTs to assess the SLO requirements of the applicationduring the run. Simultaneously, we monitor the resource usage (CPU anddisk I/O) of the node instances used. We store the raw data in a time-seriesdatabase and periodic averages into the metadata database. The latter isimplemented on MySQL 5.1 RDBMS hosted on a Flexiant 2c4m-type VM.
4.1 Typical use cases
Table 4.1 describes selected deployments of SPEC jEnterprise2010 on dif-ferent VM types from Amazon, Flexiant and Azure chosen by the Explorerand/or contributed by the user community. All deployment scenarios consid-ered here use an injection rate of 200 clients (TxRate 20). A specific use-caseof our system is to mine past executions over a user-defined time interval,select those that satisfied their SLOs, and between those select the mostcost-effective configuration options. The set of those configurations can bedetermined by executing the following SQL query to our metadata database.

28 CHAPTER 4. EVALUATION
Deployment ConfigConfiguration Artefact Settings VM type Provider
1 App Server Heap Size 2048MB m1.large AmazonDB Buffer Size 128MB
2 App Server Heap Size 2048MB m1.large AmazonDB Buffer Size 2000MB
3 App Server Heap Size 128MB c1.medium AmazonDB Buffer Size 768MB
4 App Server Heap Size 768MB m1.small AmazonDB Buffer Size 128MB
5 App Server Heap Size 2048MB 3c4m FlexiantDB Buffer Size 1100MB
6 App Server Heap Size 768MB 1c2m FlexiantDB Buffer Size 128MB
7 App Server Heap Size 768MB small AzureDB Buffer Size 128MB
8 App Server Heap Size 6000MB m1.large AmazonDB Buffer Size 2000MB m1.large Amazon
9 App Server Heap Size 768MB c1.medium AmazonDB Buffer Size 2000MB m1.large Amazon
10 App Server Heap Size 768MB m1.small AmazonDB Buffer Size 2000MB m1.large Amazon
11 App Server Heap Size 2048 MB 3c4m FlexiantDB Buffer Size 1100 m1.large Amazon
Table 4.1: Selected SPEC jEnterprise2010 deployment plans

4.1. TYPICAL USE CASES 29
DeploymentConfiguration EjOPS Cost ($) Ratio
3 20.272 0.145 1395 20.228 0.176 1141 20.135 0.24 83.892 20.123 0.24 83.849 20.273 0.385 52.658 20.239 0.48 42.16
Table 4.2: Cost-effectiveness for successful executions (Ratio is price-normalized performance)
Listing 4.1: Identify the most cost-effective configuration options over thesuccessful past executions
SELECT arm . execution_context , arm . value , ec2 . tota l_cost , (arm .value/ ec2 . to ta l_cos t ) AS r a t i o
FROM arte fact_monitor arm , execut ion_context ec2WHERE arm . name=’EjOPS ’ AND ec2 . id=arm . execut ion_context AND arm .
execut ion_context IN(SELECT ec . idFROM execut ion_context ecWHERE app_id=1 AND ec . id NOT IN
(SELECT DISTINCT( a s s e s . execut ion_context )FROM s lo_assessment a s s e sWHERE a s s e s . assessment=FALSE)
)ORDER BY r a t i o DESC
The results of this query are summarized in Table 4.2. The executionoffering the best absolute performance costs $0.385/hour whereas the mostcost-effective deployment costs $0.145/hour (VM time is the only billablemetric in our experiments). By selecting the most cost-effective rather thanthe best-performing selection leads to saving $0.24/hour or about $2,100 peryear while still achieving SLOs.
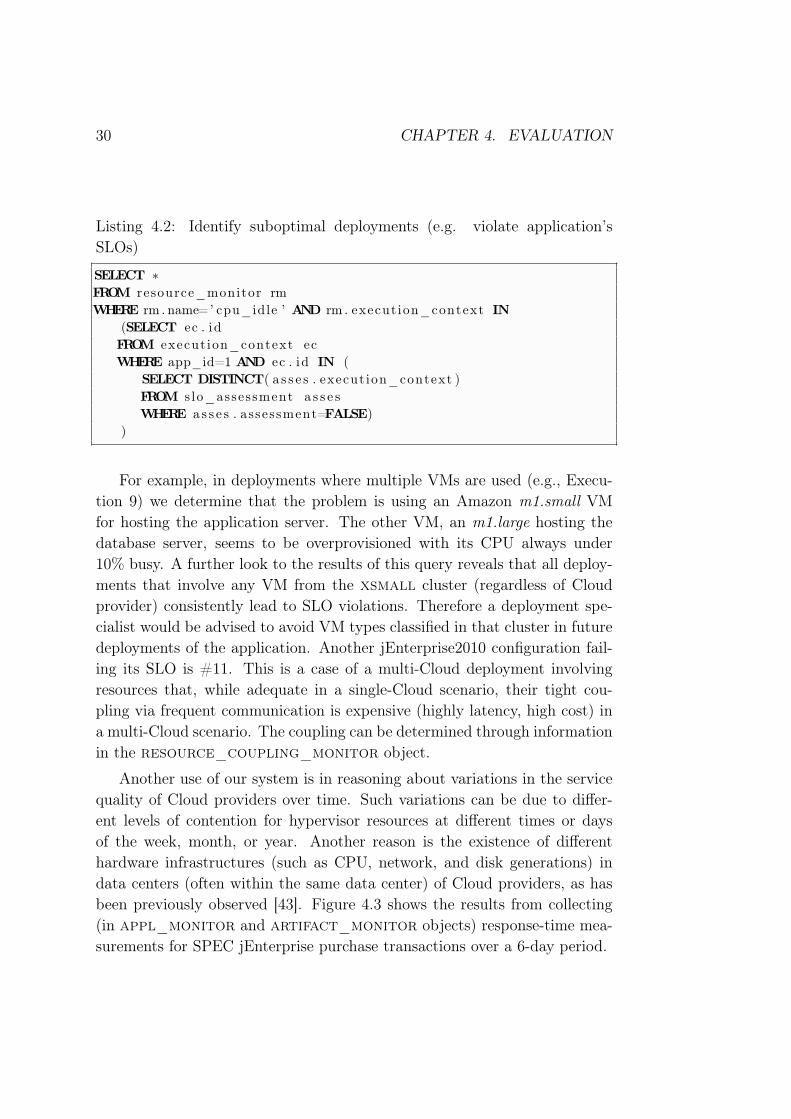
Another use-case of our system is to determine typical causes for sub-optimal performance. For example, in executions whose SLOs are violated,a look into resource usage (e.g., CPU%) may point to the root cause. Forexample the results of the following query reveal that a saturated CPU (un-derprovisioning of some deployable artefact) is often an issue.
30 CHAPTER 4. EVALUATION
Listing 4.2: Identify suboptimal deployments (e.g. violate application’sSLOs)
SELECT ∗FROM resource_monitor rmWHERE rm . name=’ cpu_idle ’ AND rm . execut ion_context IN
(SELECT ec . idFROM execut ion_context ecWHERE app_id=1 AND ec . id IN (
SELECT DISTINCT( a s s e s . execut ion_context )FROM s lo_assessment a s s e sWHERE a s s e s . assessment=FALSE)
)
For example, in deployments where multiple VMs are used (e.g., Execu-tion 9) we determine that the problem is using an Amazon m1.small VMfor hosting the application server. The other VM, an m1.large hosting thedatabase server, seems to be overprovisioned with its CPU always under10% busy. A further look to the results of this query reveals that all deploy-ments that involve any VM from the xsmall cluster (regardless of Cloudprovider) consistently lead to SLO violations. Therefore a deployment spe-cialist would be advised to avoid VM types classified in that cluster in futuredeployments of the application. Another jEnterprise2010 configuration fail-ing its SLO is #11. This is a case of a multi-Cloud deployment involvingresources that, while adequate in a single-Cloud scenario, their tight cou-pling via frequent communication is expensive (highly latency, high cost) ina multi-Cloud scenario. The coupling can be determined through informationin the resource_coupling_monitor object.
Another use of our system is in reasoning about variations in the servicequality of Cloud providers over time. Such variations can be due to differ-ent levels of contention for hypervisor resources at different times or daysof the week, month, or year. Another reason is the existence of differenthardware infrastructures (such as CPU, network, and disk generations) indata centers (often within the same data center) of Cloud providers, as hasbeen previously observed [43]. Figure 4.3 shows the results from collecting(in appl_monitor and artifact_monitor objects) response-time mea-surements for SPEC jEnterprise purchase transactions over a 6-day period.

4.2. ANALYSIS OF APPLICATION ELASTICITY ACTIONS 31
-1
0
1
2
3
4
5
6
7
00 01 02 03 04 05 06 07 08 09 10 11 12 13 14 15 16 17 18 19 20 21 22 23
Tim
e (
sec)
Time of day (UTC)
Purchase
AverageDeviation
SLORaw data
Figure 4.3: Response time of purchase transactions for hourly executions ofjEnterprise2010 over a period of six days
4.2 Analysis of application elasticity actions
In this section we demonstrate how the Explorer can analyze the effectivenessof elasticity rules on application performance under different scenarios. SinceSPEC jEnterprise2010 does not offer elasticity features in its standard setup,we modified it to place a load balancer (LB) frontend for distributing theload between several application servers as shown in Figure 4.4. Initiallythe deployment includes the LB, one VM hosting an application server, andanother VM hosting the back-end database. The elasticity rule is triggeredwhen the (periodically monitored) response time exceeds a SLO threshold(set by the benchmark at 2 sec); the action is to start a new applicationserver VM and add it to the LB list.
During each run of our elastic SPEC jEnterprise2010 we collect all moni-tored information in our metadata database. The artifact and resource mon-itors report response time and CPU utilization every 20 seconds. Figure 4.5shows the results of a run where the response-time SLO is initially violateddue to an overloaded application server CPU. In this run, the load is set to150 clients, the application server is hosted on an EC2 m1.small instance and

32 CHAPTER 4. EVALUATION
Figure 4.4: SPEC jEnterprise2010 with elasticity [42]
the back-end database servers is hosted on a m1.medium VM instance. After60 sec, the elasticity rule triggers an elasticity action (adding a second ap-plication server on a new m1.small VM), eventually reducing response timeto acceptable levels. Looking at CPU figures at the bottom of Figure 4.5we can identify that CPU overload is indeed the cause of the performancebottleneck in this case.
In a different situation, such an elasticity action may not be effective.Figure 4.6 depicts performance of a deployment where an application serveris deployed on a m1.large instance whereas its back-end database is hostedon a m1.small VM. The benchmark simulates the load of 350 clients. Inthis case, response time is unaffected by the elasticity action. A closer lookat resource monitor data shows that CPU utilization was high but not acritical factor at neither the application servers or the database. In thiscase, network and I/O performance of the m1.small VM instance hosting thedatabase back-end is the likely limitation.
4.3 Discover Physical Infrastructure Topology
In this section we describe how an application that requires informationabout the Cloud infrastructure topology could use our metamodel. Sev-eral distributed applications such as data-intensive applications [39] [40] [41]

4.3. DISCOVER PHYSICAL INFRASTRUCTURE TOPOLOGY 33
0
2
4
6
8
109
0th
% R
esp
. T
ime
(sec)
PurchaseManageBrowse
0
20
40
60
80
100
0 200 400 600 800 1000
% C
PU
idle
Time (sec)
App server 1App server 2
DB server
Figure 4.5: Successful invocation of elasticity rule
0
2
4
6
8
10
Re
sp.
Tim
e (
sec)
PurchaseManageBrowse
0
20
40
60
80
100
0 200 400 600 800 1000
% C
PU
idle
Time (sec)
App server 1App server 2
DB server
Figure 4.6: Unsuccessful invocation of elasticity rule

34 CHAPTER 4. EVALUATION
Figure 4.7: Integration of management system with HDFS
which replicate data onto different system nodes for availability require thenodes holding replicas of the same data block to have independent failures.To decide which nodes are thus suitable to hold a given set of replicas, anapplication must have knowledge about data center topology, which is of-ten hidden from applications or provided only in coarse form. We choose theHadoop file system (HDFS) as a case study, a core component of the HadoopMap-Reduce [39] framework. As shown in Figure 4.7, HDFS consists of aname node (NN) and a number of data nodes(DNs). The NN manages themetadata (file and directory namespace and mapping of file blocks to DNs)and is responsible for the block placement and replication policy. The DNsare the nodes where file blocks replicas are stored. The NN and each of theDNs are hosted by a separate VM on a Cloud setup. We assume that DNsuse the local storage resources of their underlying VMs-specifically locally-attached disks. Hadoop tasks perform some computation on blocks of datafiles. The overall principles in the design of Hadoop/HDFS are representa-tive of a number of scalable data-intensive applications using a distributedreplicated storage backend [44] [40] [45].
Cloud providers could export information about the VM collocations. We

4.3. DISCOVER PHYSICAL INFRASTRUCTURE TOPOLOGY 35
Data Node 1 Data Node 2 Data Node 3
DeploymentAssociation 1
DeploymentAssociation 2
DeploymentAssociation 3
VM 1 VM 2 VM 3
Physical
VM-to-PMAssociation 1 Association 2
Machine 1
Association 3
PhysicalMachine 2
NameNode
DeploymentAssociation 4
VM 4
Association 4
PhysicalMachine 3
Primary
VM-to-PM VM-to-PM VM-to-PM
Data Node NameNode
HDFS
MDB
VM-to-PM association
(anti-)A�nity Goal: No two replicas should be on VMs sharing a PM
File
Figure 4.8: HDFS exploiting information about Cloud infrastructure topol-ogy
modify the HDFS namenode functionality taking into account this kind ofinformation. In figure 4.8 we present the modeling of the basic components ofthe application according to our metamodel (for simplicity we omit details).In addition the application obtains information about the platform topologyand thus can adapt its its behavior in order to achieve its affinity goals.
On the other hand most Cloud providers don’t export information abouttheir platform topology. As a result we extended the HDFS NN and DNsource code to embed our manager and stub functionality (gray boxes ofFigure 4.7). According to our approach the manager is a centralized compo-nent that orchestrates the operation of the system. We chose the term stubrather than agent or sensor (which would better fit their functionality) be-cause they are embeddable into distributed components belonging to anothermiddleware system (HDFS). We assume that each component (manager orstub) is deployed on a separate VM hosted by a specific physical machine(node) within the Cloud and that all VMs belonging to a Cloud user arehosting stubs.
The aim of the manager is to have up-to-date collocation information forall VMs and update the metadata schema. It learns about the existence ofapplication VMs either through an explicit call or via starting a stub at thatVM, which then registers with the manager. To maintain up-to-date col-

36 CHAPTER 4. EVALUATION
Figure 4.9: Representation of VM collocations of a Cloud user: 10.10.9.* areprivate IP addresses of VMs; 1-4 are identifiers of Cloud nodes hosting thoseVMs
location information the manager periodically instructs stubs to determinecollocation relationships between themselves and other stubs according to aspecific schedule. Each interaction between the manager and a stub for thispurpose is called a discovery query (DQ). The manager subsystem responsi-ble for scheduling DQs is the discovery query scheduler (DQS). A sequence ofDQs that refreshes knowledge about all stubs in the system is called a scanand results in a representation of collocation relationships depicted in Fig-ure 4.9. Boxes numbered 1-4 represent anonymous Cloud (physical) nodes.Sequences of 10.10.9.* boxes in each row represent VMs that are believed tobe collocated within that Cloud node (we refer to such VMs as a collocationgroup). The typical usage of this management system is to help adaptivedata-intensive applications drive policies such as task/data assignment andmigration.
An important parameter in our system is how often to repeat a scan,which depends on the approach chosen. The manager uses a simple round-robin policy to assign DQs to stubs. Upon receiving a DQ a stub performspair-wise measurements (in sequence) between itself and the set of stubsspecified by the manager. When the measurements have been completed,the stub responds to the manager with the VM collocation relationshipsfound. The manager (DQS) ensures that only a single discovery query isexecuting at a time to avoid interference with the discovery process and toreduce the impact on the executing application. However, external activityoriginating from other Cloud users is beyond the system’s control and mayimpact measurements. Because of such interference the manager may dis-

4.3. DISCOVER PHYSICAL INFRASTRUCTURE TOPOLOGY 37
cover that the information received from a DQ differs from the informationit had previously discovered.
In performing a scan, the DQS chooses between two policies: I) trustcollocation information found in a previous scan; or II) re-consider all collo-cation information. Assume that at the beginning of a scan there are N stubsin C collocation groups. In policy (I) the manager hands DQs to a repre-sentative stub from each collocation group and asks it to run measurementswith representatives from each of the other collocation groups. The time tocomplete a scan is thus proportional to C2. If we find a new collocation rela-tionship between stubs x and y we merge their respective collocation groups.In policy (II) we consider any collocation information as potentially stale andthus schedule DQs with all stubs. For each stub we run measurements withrepresentatives from each collocation group, including its own. The time tocomplete a scan in this case is thus proportional to N*C. We call the formeran incremental scan and the latter a full scan. A special case of the full scanis the initial scan, where stubs are not known in advance but are registeringwith the manager as the scan progresses. In this case, DQS gives priority inscheduling DQs to stubs that have never previously been involved in a DQ.
In our experiments, VMs are reported as collocated if the average band-width between them exceeds 1Gbps. We used netperf [31] as the measure-ment tool to report bandwidth between nodes. We empirically determinedthat a 3-second run of netperf gives us a credible bandwidth estimate betweenany pair of nodes. We execute three such netperf runs and report the aver-age bandwidth in table 4.3. This is a simple and accurate test based on theoverwhelming dominance of 1Gbps Ethernet technology in the public Cloudswe considered. However the more general assumption our system makes isnot tied to a specific technology and is based on the observation that thememory bandwidth between collocated VMs is always greater than networkbandwidth between non-collocated VMs. We believe this assumption holdstrue for the majority of commercial public or private Clouds. Even when con-sidering Clouds using 10Gbit/s links at the node level, a VM will be capableof seeing only a fraction of that peak bandwidth, proportional to the share ofsystem cores allocated to the VM. This is true even for 1Gbps links today, asprevious studies [46] indicate and our results confirm. Additionally, severalCloud providers limit –through explicit control at the network level or at thehypervisor— the VM network bandwidth to a fraction of the peak bandwidthsupported by the network technology. To the best of our knowledge, there

38 CHAPTER 4. EVALUATION
Platform Non-collocated Collocated(Mbps) (Gbps)
Flexiscale 750 4.0Rackspace 29.8 5.2Amazon 550 -
Table 4.3: Inter-VM bandwidth measurements
are no such limitations for the memory bandwidth between collocated VMs.Finally, it is highly unlikely that commercial Cloud providers would choose tomaintain compute nodes whose memory system would be so dated as to vio-late the above assumption. In the rare case that the assumption is violated,use of alternative metrics (such as response time) can help in improving theaccuracy of our results. It is important to note that even when our systemis incorrect (labeling two VMs as collocated when in fact they are not), thisdoes not hurt applications: Our HDFS prototype will allocate replicas of ablock to VMs that are reported collocated if it has no other choice.
Interference with other Cloud activity may cause the miss of collocationrelationships because of bandwidth or CPU sharing between VMs. The oppo-site however is not possible: A collocation relationship cannot be accidentallydetected because of interference with other user workloads. Thus we believethat collocation relationships detected are generally accurate. Scans duringperiods of low Cloud workload will provide better quality results comparedto scans over busy periods. Unfortunately prolonged periods of low loadare rare in Cloud environments serving Internet-scale workloads around theclock. However brief periods of lower utilization are more common and asincremental scans coincide with them, we expect that the DQS will be cor-recting previous noise-induced errors over time (i.e., discover collocated VMsthat were earlier determined to be non-collocated).
Incremental scans can achieve shorter DQ times by not re-consideringpast VM collocation information- this however may lead them to miss collo-cation changes that could have taken place via internal Cloud re-allocationssuch as VM migrations. Policy (II) can detect such changes but results intolonger scan times. As Cloud re-allocations are rare and have typically longturnaround times we believe that the best approach is to use policy (I) inshorter time scales (e.g., hourly or daily) and policy (II) over longer timescales (e.g., weekly).
To conclude our metadata model is designed to hold information about

4.4. MANAGING DATABASE EVOLUTION OVER TIME 39
the mapping between VMs and its underlying physical nodes. This kind ofcorrelation information can be obtained either by applications running in theVMs or coulb be exported by the Cloud provider via a Cloud managementAPI as described in [32]. The metadata model could be updated periodicallyand applications could restore from it in case of a crash or in case of re-deployment using the same VM set. In addition applications’ users canperform analytics concerning the VM collocation association and identifyimpact in its perfomance or functions (such as data migration). What ismore the history of the correlation between VMs and physical nodes canwitness VM migrations.
4.4 Managing database evolution over time
Our metadata schema (Figure 3.4) was designed to avoid redundancy whenrecording time-evolving state. They key to achieving this is to explicitlyrepresent time-dependent associations, for example that of an applicationartefact with the resources used to deploy it in each execution of the ap-plication. If we recorded the time of deployment of every artefact withinthe artefact_instance table, we would need to create a new artefact in-stance for every execution of the application even though no other aspect ofthe artefact instance changed across executions. This design ensures that ourmetadata database grows at the reasonable pace. Similarly, we use the tableartefact_config to correlate the configuration parameters of an artefactinstance within an execution context.
To get a feeling of the rate of growth for the physical size of the metadatadatabase in typical use cases, suppose the Explorer plans to deploy the SPECjEnterprise application on 8 different node instances (VM types) across 3Cloud providers. The Explorer further wants to try combinations of artefactconfiguration settings for each node instance. Examples of important settingsfor the JBoss application server and the MySQL RDBMS are JVM heap sizeand database buffer size. Trying 3 different values for each setting meansthe Explorer needs to execute the application at least 9 times on each VMtype to cover the space of possible combinations. This would result into 72executions of the application.
After the first execution the metadata database takes up 1.25 MB ofstorage, increasing to 1.31 MB after all 72 executions are in. Inserting datafor another set of 72 runs of a second application (similar to the first) increases

40 CHAPTER 4. EVALUATION
the size of the database to 1.64 MB. Repeating for up to 100 applications(similar to the first application) increases the size to 29.3 MB. All applicationsare distinct and therefore they do not share artefacts, deployment instances(VMs), SLAs, monitors etc.
Taking into account the duration of each execution of SPEC jEnter-prise2010 (one hour in our case) means that we will need at least 72 hoursto test the application for the 72 runs we described above. When 100 simi-lar applications simultaneously populate the metadata database, the storagegrowth would be about 30MB every three days. This equals 3.6 GB per yearor 36 GB in 10 years, which is a modest requirement. Figure 4.10 depicts thestorage growth trend as the number of applications increases. The executiontime of queries in the metadata database increases with database size: Thefirst query described previously takes on average 0.036, 0.384 and 3.55 sec-onds as the database size grows from 100, to 1,000 and 10,000 applicationsrespectively.
1
10
100
1000
10000
1 10 100 1000 10000
Siz
e (
MB
)
Applications Num
Database size
DB size
Figure 4.10: Growth of metadata database size with increasing number ofapplications
Note that this analysis does not take into account the raw monitor datathat are typically stored in a time series database (TSDB). Only summaries

4.4. MANAGING DATABASE EVOLUTION OVER TIME 41
(e.g., average values) are periodically stored in the metadata database. In atypical setting, the raw data would be erased over time while the metadatadatabase information would be preserved.

42 CHAPTER 4. EVALUATION
Chapter 5
Conclusions and Future Work
In this thesis outlined an architecture for evaluating distributed applicationdeployments in Multi-Clouds. The information metamodel at the core of thearchitecture captures the history and evolution of distributed application de-ployments and can support a variety of interesting analytics. The proposedclassification scheme is critical in enabling a cross-Cloud categorization of re-sources. Our evaluation using the SPEC jEnterprise2010 application bench-mark exhibits the use of our system in discovering cost-effective deploymentplans, and in reasoning about elasticity policies under different assumptions.We believe that the applicability of the architecture is broader and plan toexhibiting it further in our future work.
43

44 CHAPTER 5. CONCLUSIONS AND FUTURE WORK

Appendix A
VM instance types
In this section we present the nominal characteristics of VM types as de-scribed by the corresponding providers.
Provider VM vCPU Memory (GiB)
Amazon
m1.small 1 1.7m1.medium 1 3.75m1.large 2 7.5m1.xlarge 4 15m2.xlarge 2 17.1c1.medium 2 1.7c1.xlarge 8 7
Flexiant
1c1m 1 11c2m 1 23c4m 3 43c6m 3 64c4m 4 46c6m 6 6
Azure small 1 1.75
Table A.1: Instance Type Details
45

46 APPENDIX A. VM INSTANCE TYPES

Bibliography
[1] M. Armbrust, A. Fox, R. Griffith, A. D. Joseph, R. H. Katz,A. Konwinski, G. Lee, D. A. Patterson, A. Rabkin, I. Stoica,and M. Zaharia, “Above the clouds: A berkeley view of cloudcomputing,” EECS Department, University of California, Berkeley,Tech. Rep. UCB/EECS-2009-28, Feb 2009. [Online]. Available: http://www.eecs.berkeley.edu/Pubs/TechRpts/2009/EECS-2009-28.html
[2] “Opscode Chef Automation Platform,” http://www.opscode.com/chef,Accessed 6/2013.
[3] “Puppet Labs DevOps Platform,” https://puppetlabs.com/solutions/devops/,Accessed 6/2013.
[4] P. Goldsack et al., “The smartfrog configuration management frame-work,” SIGOPS Oper. Syst. Rev., vol. 43, no. 1, pp. 16–25, Jan. 2009.
[5] N. Ferry et al., “Towards model-driven provisioning, deployment, mon-itoring, and adaptation of multi-cloud systems,” in Proceedings of the2013 IEEE Sixth International Conference on Cloud Computing, ser.CLOUD ’13. Washington, DC, USA: IEEE Computer Society, 2013.
[6] T. Binz, G. Breiter, F. Leymann, and T. Spatzier, “Portable CloudServices Using TOSCA,” IEEE Internet Computing, vol. 16, no. 3, pp.80–85, 2012.
[7] U. Aßmann, N. Bencome, B. H. C. Cheng, and R. B. France,“[email protected] (dagstuhl seminar 11481),” Dagstuhl Reports, Tech.Rep. 11, 2011.
[8] “Cloudify,” http://www.cloudifysource.org/.
47

48 BIBLIOGRAPHY
[9] G. Khanna, K. Beaty, G. Kar, and A. Kochut, “Application performancemanagement in virtualized server environments,” in Network Operationsand Management Symposium, NOMS 2006. 10th IEEE/IFIP, 2006.
[10] J. L. Hellerstein, S. Ma, and C.-S. Perng, “Discovering actionable pat-terns in event data,” IBM Systems Journal, vol. 41, no. 3.
[11] K. Viswanathan et al., “Ranking anomalies in data centers,” in NetworkOperations and Management Symposium (NOMS), 2012 IEEE, 2012.
[12] H. J. Wang et al., “Automatic misconfiguration troubleshooting withpeerpressure,” in Proceedings of the 6th conference on Symposium onOpearting Systems Design & Implementation - Volume 6, ser. OSDI’04.Berkeley, CA, USA: USENIX Association, 2004.
[13] J. Ha et al., “Improved error reporting for software that uses black-boxcomponents,” in Proceedings of the 2007 ACM SIGPLAN conference onProgramming language design and implementation, ser. PLDI ’07. NewYork, NY, USA: ACM, 2007.
[14] Eno Thereska, Bjoern Doebel, Alice X. Zheng, Peter Nobel, “PracticalPerformance Models for Complex, Popular Applications,” in SIGMET-RICS’10, June 14-18, 2010.
[15] D. F. Parkhill, The challenge of the computer utility. USA: Addison-Wesley Professional, 1966.
[16] “Cloud computing, Wikipedia,” http://en.wikipedia.org/wiki/Cloud_computing,Accessed 09/2013.
[17] G. Baryannis, P. Garefalakis, K. Kritikos, K. Magoutis, A. Papaioannou,D. Plexousakis, and C. Zeginis, “Lifecycle management of service-basedapplications on multi-clouds: A research roadmap,” in Proceedings of2013 International Workshop on Multi-cloud Applications and FederatedClouds (MultiCloud’13), April 2013.
[18] “Amazon web services ec2,” http://aws.amazon.com/ec2/, accessed:2013-08.
[19] “Google compute engine,” https://cloud.google.com/products/compute-engine, accessed: 2013-08.

BIBLIOGRAPHY 49
[20] A. Li, X. Yang, S. Kandula, and M. Zhang, “Cloudcmp: comparingpublic cloud providers,” in Proceedings of the 10th ACM SIGCOMMconference on Internet measurement, ser. IMC ’10. New York,NY, USA: ACM, 2010, pp. 1–14. [Online]. Available: http://doi.acm.org/10.1145/1879141.1879143
[21] S. L. Garfinkel, “An evaluation of amazon’s grid computing services:Ec2, s3 and sqs,” Center for, Tech. Rep., 2007.
[22] E. Walker, “Benchmarking Amazon EC2 for high-performance scientificcomputing,” LOGIN, vol. 33, no. 5, pp. 18–23, Oct. 2008.
[23] E. Brandtzæg, M. Parastoo, and S. Mosser, “Towards CloudML,a Model-based Approach to Provision Resources in the Clouds,” in8th European Conference on Modelling Foundations and Applications(ECMFA), H. Störrle, Ed., 2012, pp. 18–27.
[24] “REMICS Deliverable D4.1: PIM4Cloud,”http://www.remics.eu/system/files/REMICS_D4.1_V2.0_LowResolution.pdf, 2012.
[25] J. Wolf, “The placement optimization program: a practical solution tothe disk file assignment problem,” in Proceedings of the 1989 ACM SIG-METRICS international conference on Measurement and modeling ofcomputer systems. New York, NY, USA: ACM, 1989.
[26] R. R. Steffen Becker, Heiko Koziolek, “The Palladio component modelfor model-driven performance prediction,” Journal of Systems and Soft-ware, vol. 82, pp. 3–22.
[27] J. Tordsson et al., “Cloud brokering mechanisms for optimized place-ment of virtual machines across multiple providers,” Future GenerationComputer Systems, vol. 28, no. 2, pp. 358–367, Feb. 2012.
[28] “Stanford Large Network Dataset Collection,”http://snap.stanford.edu/data/, Accessed 6/2013.
[29] J. MacQueen, “Some Methods for Classification and Analysis of Mul-tivariate Observation,” in Proc. of 5th Berkeley Symposium on Mathe-matical Statistics and Probability. University of California Press, 1967.

50 BIBLIOGRAPHY
[30] “SPEC CPU2006 Benchmark,” http://www.spec.org/cpu2006/, Ac-cessed 6/2013.
[31] “Netperf,” http://www.netperf.org/netperf/, Accessed 8/2013.
[32] I. Kitsos, A. Papaioannou, N. Tsikoudis, and K. Magoutis, “Adapt-ing data-intensive workloads to generic allocation policies in cloudinfrastructures,” in Network Operations and Management Symposium(NOMS), 2012 IEEE, 2012, pp. 25–33.
[33] S. Quinlan and S. Dorward, “Venti: a new approach to archival stor-age,” in Proceedings of the 1st USENIX conference on File and storagetechnologies, ser. FAST’02. Berkeley, CA, USA: USENIX Association,2002.
[34] R. T. Snodgrass, Developing Time-Oriented Database Applications inSQL. Morgan Kaufmann Series in Data Management Systems.
[35] K.-K. Muniswamy-Reddy, D. A. Holland, U. Braun, and M. Seltzer,“Provenance-aware storage systems,” in Proceedings of the annual con-ference on USENIX ’06 Annual Technical Conference, ser. ATEC ’06.Berkeley, CA, USA: USENIX Association, 2006.
[36] “CERIF metadata model,” Accessed 6/2013. [Online]. Available:http://www.eurocris.org/Index.php?page=featuresCERIF&t=1
[37] P. Bianco, G. Lewis, and P. Merson, “Service level agreements in service-oriented architecture environments,” Software Engineering Institute,Tech. Rep. CMU/SEI-2008-TN-021, September 2008.
[38] J. Howard, S. Dighe, Y. Hoskote, S. Vangal, D. Finan, G. Ruhl, D. Jenk-ins, H. Wilson, N. Borkar, G. Schrom, F. Pailet, S. Jain, T. Ja-cob, S. Yada, S. Marella, P. Salihundam, V. Erraguntla, M. Konow,M. Riepen, G. Droege, J. Lindemann, M. Gries, T. Apel, K. Henriss,T. Lund-Larsen, S. Steibl, S. Borkar, V. De, R. Van der Wijngaart,and T. Mattson, “A 48-core ia-32 message-passing processor with dvfsin 45nm cmos,” in Solid-State Circuits Conference Digest of TechnicalPapers (ISSCC), 2010 IEEE International, 2010, pp. 108–109.
[39] J. Dean and S. Ghemawat, “Mapreduce: simplified data processing onlarge clusters,” Commun. ACM, vol. 51, no. 1, pp. 107–113, Jan. 2008.
BIBLIOGRAPHY 51
[40] G. DeCandia, D. Hastorun, M. Jampani, G. Kakulapati, A. Lakshman,A. Pilchin, S. Sivasubramanian, P. Vosshall, and W. Vogels, “Dynamo:amazon’s highly available key-value store,” in Proceedings of twenty-firstACM SIGOPS symposium on Operating systems principles, ser. SOSP’07. New York, NY, USA: ACM, 2007, pp. 205–220.
[41] L. Koromilas and K. Magoutis, “Cassmail: a scalable, highly-available,and rapidly-prototyped e-mail service,” in Proceedings of the 11th IFIPWG 6.1 international conference on Distributed applications and inter-operable systems, ser. DAIS’11. Berlin, Heidelberg: Springer-Verlag,2011, pp. 278–291.
[42] “SPEC jEnterprise2010 Benchmark,” Accessed 6/2013. [Online].Available: http://www.spec.org/jEnterprise2010/
[43] J. Schad, J. Dittrich, and J.-A. Quiané-Ruiz, “Runtime measurementsin the cloud: observing, analyzing, and reducing variance,” ProceedingsVLDB Endowment, vol. 3, no. 1-2, pp. 460–471, Sep. 2010.
[44] F. Chang, J. Dean, S. Ghemawat, W. C. Hsieh, D. A. Wallach, M. Bur-rows, T. Chandra, A. Fikes, and R. E. Gruber, “Bigtable: a distributedstorage system for structured data,” in Proceedings of the 7th USENIXSymposium on Operating Systems Design and Implementation - Volume7, ser. OSDI ’06. Berkeley, CA, USA: USENIX Association, 2006, pp.15–15.
[45] A. Lakshman and P. Malik, “Cassandra: a decentralized structured stor-age system,” SIGOPS Oper. Syst. Rev., vol. 44, no. 2, pp. 35–40, Apr.2010.
[46] G. Wang and T. S. E. Ng, “The impact of virtualization on network per-formance of amazon ec2 data center,” in Proceedings of the 29th confer-ence on Information communications, ser. INFOCOM’10. Piscataway,NJ, USA: IEEE Press, 2010, pp. 1163–1171.