anul lii 2007 - babeș-bolyai university · anul lii 2007 s t u d i a universitatis babe...
TRANSCRIPT


ANUL LII 2007
S T U D I A
UNIVERSITATIS BABE Ş–BOLYAI
BIOLOGIA
2
Desktop Editing Office: 51st B.P.Hasdeu Street, Cluj-Napoca, Romania, phone + 40 264 405352
SUMAR - SOMMAIRE - CONTENTS - INHALT
GALINA BUSMACHIU, ELENA ZUBCOV, Some Peculiarities of Collembolan Distribution in the Riverside Zones of the Dniester River................................................... 3
IOAN DUMA, On the Ant Eating Spiders (Araneae: Zodariidae) of Romania: New Faunistical Data................................................................................................................... 11
TIBOR HARTEL, COSMIN IOAN MOGA, Population Fluctuations and the Spatial Habitat Use by Amphibians in a Human Modified Landscape ......................................... 19
COSMIN IOAN MOGA, KINGA ÖLLERER, TIBOR HARTEL, The Breeding Avifauna of the “Breite Plateau” Natural Reserve and the Surrounding Forest.....................................33
CRISTINA BERCIU, ALIN DAVID, Carotenoids in Birds’ Life........................................... 45
NICOLETA IANOVICI, Atmospheric Pollen Season of Plantago in Timişoara ................... 63
MANUELA DORDEA, NICOLAE COMAN, Ecological and Genetical Implications of Cline Evolution ................................................................................................................... 69
MARIANA PATIU, GABRIEL LASZLO, Iron Metabolism Disorder Exploration: Classical and Modern Parameters..................................................................................83
ILDIKO-IREN RACKOVY, MIHAIL DR ĂGAN-BULARDA, Antimicrobial Efficiency of Some Disinfectants against Bacteria and Fungi with Surface Test............................... 93
VASILE MUNTEAN, GHEORGHE GROZA, Bacterial and Enzymatic Potential of the Experimental Plots Installed on the Iron Mine Spoils in Iara (Cluj County) .................. 101

VASILE-DANIEL GHERMAN, JEAN-GABRIEL BRÉHERET, MIHAIL-DRĂGAN BULARDA, Microorganism Populations within Gelatinous Formations from Kiesberg Mine in Banat Mountains, Romania ............................................................109
VASILE-DANIEL GHERMAN, JEAN-GABRIEL BRÉHERET, MIHAIL-DRĂGAN BULARDA, Microorganism Associations within a Thin Acid Solution Film from an Old Mine in Banat Mountains.................................................................................................119
RAHELA CARPA, Microbial Communities and Enzymatic Activities in the Mountainous Soils in Parâng.......................................................................................129
All authors are responsible for submitting manuscripts in comprehensible US or UK
English and ensuring scientific accuracy. Original picture on front cover © Alin David

STUDIA UNIVERSITATIS BABEŞ – BOLYAI, BIOLOGIA, LII, 2, 2007 (p.3–10)
SOME PECULIARITIES OF COLLEMBOLAN DISTRIBUTION IN THE RIVERSIDE ZONES OF THE DNIESTER RIVER
GALINA BUSMACHIU1 AND ELENA ZUBCOV1
SUMMARY. The comparative analysis of the state of soil along the banks of Dniester River using collembolan communities’ structure was done. In spite of permanent floodings and transformations, the riverside sectors remain rather attractive places for the soil invertebrates, due to the carry-over and accumulation on their surface of the biogenic elements. It was established high species diversity of Collembola even when the number of individuals was low and the correlation of their density with the soil organic matter and water content. Keywords: bank of river, Collembola, ecology
Introduction The ecological researches of the river banks and floodplains using small
groups of invertebrates present special interest in our days (Khanislamova, 1988; Bulimar, 1992; Čarnogurský, 1998; Sterzynska and Ehrnsberger, 1999; Sterzynska and Pilipiuk, 1999; Russell et al., 2004; Tronstad et al., 2005; Busmachiu, 2004 and 2006). The bank of rivers and floodplains are in a permanent transformation. During the spring river floods or after abundant rains the level of river water increase greatly and transcend the usual bank limit, bringing to the banks biogenic elements such as fine particulate organic matter (Junk, Bayley and Sparks, 1989). It was found that the soil invertebrates’ communities living in the margin on aquatic basins are able to cope with highly variable wet and dry condition depending on the frequency and duration of inundation. Collembola are one of the most significant and important studied groups that can be find in the soil and sand of riverbanks, on wetland, on aquatic vegetation, on the decomposing organic matters, which have an active role in matter cycling and energy transformation in nature. The Collembola remain one of the less studied group of river ecosystems, although it is an important connecting group within the trophic chains. The diagnosis of riverbank status, using soil zoology studies, represents one of the control methods of environment ecological conditions as a whole (Van Straalen, 1991). The life of small invertebrate organisms depends on environmental condition; they quickly respond to habitat disturbances due to their high sensitivity. The structure of collembolan communities, the presence or absence in different proportions of living forms and
1 Institute of Zoology, Academy of Sciences of Moldova, 1 Academiei Str., MD- 2028, Chişinău,
Republic of Moldova

GALINA BUSMACHIU AND ELENA ZUBCOV
4
some bioindicator species reflect the state of aquatic basin. In present the physico-chemical studies of the quality of fresh water are not enough, we must take also into consideration the state of aquatic basin in general.
As the result of our previous research (Busmachiu, 2004),carried out in different types of biotopes adjacent to the Dnister River banks, 42 species of Collembola, belonging to 28 genera and 10 families, were recorded.
This paper presents the results of ecological studies accomplished straight on the water/soil gradient of the Dniester bank, exposed to periodical flooding. The aim of this research is to investigate the collembolan distribution along the river stream and gradually up to 8 m from the bank line, as well as the influence of soil parameters upon the structure of collembolan communities.
Materials and Methods Characteristics of studied localities. Dniester is the biggest river in Moldova, which provides the main water resources in the republic. The river length along the territory of Moldova is of 657 km, the water basin surface constitutes 19.1 thousand km2, which represent about 70% of the republic territory and the velocity of river stream is of 0.5 m/sec. The Dniester riverbed is sinuous in the upper course; it penetrates the calcareous formations of toltre reefs that emerge to the ground surface as cliffs and rocky banks. The middle Dniester banks are argilo-arenaceous and sand-slimy. • Naslavcea village (480 29’21” N, 270 34’ 49” E) is situated at the altitude of 209 m. The water level in the river, during the sample collection, was raised; the bank was partially inundated, covered by herbaceous plants. Furthermore, the rocks (granite) emerge on the surface and the bank is covered here and there by stones and crushed rock. • Otaci village (480 26’49” N, 270 41’ 01” E) is situated at the altitude of 63 m. The bank was smooth, partially flooded, with abundant herbaceous vegetation. • Soroca town (480 08’41” N, 280 17’ 44” E) is situated at the altitude of 42 m. The water level in the river was raised, the bank was partially inundated, roughly covered by debris of decomposing vegetation and the soil is sludgy. The bank line was indistinct. • Camenca town (480 00’50” N, 280 41’ 51” E) is situated at the altitude of 33 m. The water level in the river was raised; the bank was partially inundated, covered by herbaceous plants. • Goieni village (470 22’ 20” N, 290 08’ 57” E) is situated at the altitude of 18 m. The water level in the river was raised; the bank was partially inundated, covered by abundant partially decomposed plants and herbaceous vegetation. The soil temperature was measured at the moment of the sampling; the percentage of water and organic matter content in soil, taken linearly at the distance of 0-2 (I line), 2-4 (II line), 4-6 (III line) and 6-8 (IV line) meters from water edge, as shown in table 1, were determined in laboratory.

SOME PECULIARITIES OF COLLEMBOLAN DISTRIBUTION IN THE RIVERSIDE ZONES …
5
Table 1. The main soil parameters in the studied localities
Soil parameters
Organic matter, % Water content ,% Collection line and distance from bank, in meters Localities Т0С
of soil I 0-2m
II 2-4m
III 4-6m
IV 6-8m
I 0-2m
II 2-4m
III 4-6m
IV 6-8m
Naslavcea 16.0 9.44 6.92 7.54 5.76 28.92 15.85 14.22 11.05
Otaci 16.2 13.12 12.14 11.57 10.79 29.50 26.91 20.14 10.47 Soroca 13.6 16.77 12.44 15.43 13.21 33.40 24.96 28.52 20.39 Camenca 15.2 14.04 12.68 11.19 12.15 31.39 21.06 19.76 17.12 Goieni 16.1 14.19 14.53 16.60 14.91 27.11 27.02 27.32 16.40
Sampling and extraction. The faunistic material was sampled along the
banks of the Dniester River, in the above mentioned sites, at the beginning of May, 2006. The samples were taken from the northern Naslavcea village to Camenca town and Goieni village, where the Dubasari water reservoir begins.
At each locality an area of 8 х 8 m was selected, starting from the water edge and divided into 16 sampling points with 2 х 2 m size. More than 80 soil samples, taken by a square frame with surfaces of 25 cm2 and 5 cm depth, were collected. The microarthropods were extracted from the soil using the flotation method. The specimens of Collembola were fixed in 800 ethylalcohol and identified up to the species level according to keys of Stach (1947-1963), Gisin (1960), Pomorski (1998), Bretfeld (1999), Potapov (2001) and other systematics papers.
Margaleff (Im), Shannon (Ish) and evenness (Magurran, 1991) indices were calculated for the estimation of the diversity of collembolan communities in the studied localities.
The soil analyses were done using methods generally accepted in soil science (Arinushkina, 1961); the statistical processing was realized using EXСEL program. Results and Discussion As a result of investigation, 31 species of Collembola belonging to 23 genera and 10 families were found and 1889 collembolan individuals were registered in the studied localities along the Dniester River. Their density varied between a minimum of 5,825 ind.m-2 near Camenca town and a maximum of 15,700 ind.m-2 near Goieni village on the bank of the aquatic reservoir (Table 2). The minimum of collembolan density and species diversity were recorded at the distance up to 2 m from the water edge in all studied localities. The total number of registered species per site was approximately the same, 15 – 16 species, but near Naslavcea village only 11 species were found. The minimum number of individuals (20) was found up to 2 m distance from the water edge near Naslavcea village and maximum number (267) up to 4 m from the water edge near Camenca town.

GALINA BUSMACHIU AND ELENA ZUBCOV
6
Table 2.
Comparative analysis of collembolan community structure from the soil along the bank of Dniester River
Density ind.m-2
Indexes
Localities
Mean dens. ± SD Min Max
Total species
Ish Im Even-ness
Naslavcea 6,840 ± 4,86 2,000 12,200 11 2.46 1.78 0.71 Оtaci 9,350 ± 4,20 5,400 15,300 15 2.59 2.19 0.68 Soroca 10,500 ± 3,82 6,900 15,400 16 2.43 2.48 0.60 Саmenca 5,825 ± 3,91 2,400 10,100 16 2.28 2.32 0.57 Goieni 15,700 ± 7,22 5,300 21,400 16 2.86 2.75 0.71
In the study of the comparative structure of collembolan communities, it is
very important to take into account the main soil parameters, such as water content, temperature and organic matter content. These parameters represent the main factors of influence upon the number and species diversity of small soil invertebrates. As the data collecting took place at the beginning of May only, there were not any significant differences between the temperature characteristics, but the parameters of soil water content and the organic matter content varied. The mentioned parameters were significantly distinguished not only in different sampled localities, but also at the different distance from the water edge. The main soil parameters were considered linearly up to 8 m towards the river water edge.
The data on the soil water content and the organic matter content emphasized a rather distinctive peculiarity. In all studied localities, the maximum soil water content was recorded on the water/soil gradient and up to 2 m from the water edge: from 33.40% in Soroca to 26.91% in Otaci where the lowest values of collembolan individuals and species diversity were registered. Moving away from the water edge the soil water content decreased gradually, but the collembolan density and species diversity increased. At the distance of 8 m, the longest distance from the water edge, the soil water content had the minimum values from 11.05% in Naslavcea to 10.47 % in Otaci and the species diversity was great.
The gradual decreasing of soil water content observed in the majority of localities was recorded only on smooth, gradually raising bank line. However, near Soroca, the bank line was rough and low; respectively the parameters of humidity varied on the entire studied sector, including the last fourth line up to the distance of 8 m from the water edge (Table1). The same irregularity was registered in the distribution of collembolan number. Two high values up to 4 m (116 ind.) and up to 8 m (154 ind.) from the river water edge were recorded. In other areas, namely near Goieni and Otaci, only one maximum number of individuals was recorded up to 6 m (214 ind. and 153 ind., respectively); near Naslavcea and Camenca, up to 8 m,

SOME PECULIARITIES OF COLLEMBOLAN DISTRIBUTION IN THE RIVERSIDE ZONES …
7
99 and respectively 101 individuals were recorded. The soil water content differences between the first (up to 2 m) and the last lines (up to 8 m) are considerable and fluctuated from 19.03 % in Otaci, 17.87 % in Naslavcea, 14.17 % in Camenca, 13.01% in Soroca and 10.71% in Goieni. Thus, the linear material collection allows to emphasize the linear modification of soil water content, as well as of collembolan number and species diversity distribution at various distances from the water edge.
The content of the organic matter in the soil have also the tendency to decrease as moving away from the water edge. Its maximum quantity was registered in the first lines 16.77% in Soroca and 14.19% in Goieni, while the minimum quantity was registered in the fourth lines 5.76% in Naslavcea and 10.79% in Otaci. The edge of the bank river near Goieni was an exception. Here, at the distance of 4 - 6 m from the water edge, the decomposing algae aggregations were noted and, as a result, a high level of organic matter content– up to 16.60% and the highest value of collembolan number (214 individuals) were recorded.
The greatest collembolan density on square meter was recorded near Soroca town and Goieni village, where the highest level of organic matter content in the soil was noted. Here the organic matter content in the water is also increased.
A positive significance was emphasized between the organic matter content of the soil and the collembolan density in the studied sectors (Fig.1).
Collembolan density, soil organic matter and water content in the studied localities
0
24
68
1012
1416
18
Naslavcea Otaci Soroca Camenca Goieni
x103
ind
.m-2
, OM
, %
0
5
10
15
20
25
30
W,
%
x 10³ ind.m-²
OM, %
W,%
Fig.1. The average density of Collembola (x 103 ind.m-2), soil organic matter (OM %) and water content (W %) in the studied localities

GALINA BUSMACHIU AND ELENA ZUBCOV
8
The study of collembolan species diversity and density at the distances up to 0 - 2, 2 - 4, 4 - 6 and 6 – 8 meters from the water edge allows to emphasize several peculiarities of the species distribution. Thus, at the distance up to 2 m an average of 4 – 5 species were present in number of 20 to 125 individuals. Among them the hydrophilous species such as Cryptopygus thermophilus, Anurida ellipsoides and Folsomia candida were dominant. Moving away from the water edge of river, the collembolan species composition changed. Along with the soil water content decreasing the number of small deep-soil species, as well as of large ecological spectrum species increased, such as Mesaphorura krausbaueri, Protaphorura serbica, Folsomides parvulus, Orthonychiurus rectopapillatus, Isotomodes productus, Lepidocyrtus paradoxus and Sminthurinus elegans.
Our results correspond to those of other researches concerning the development of collembolan communities in areas of increased soil humidity, but not flooded by water. Sterzynska and Pilipiuk (1999) found the highest collembolan number and species diversity in such zones situated at the distance of 4-8 m from the water edge.
The soil up to 6 m from the river water edge was the most populated (abundance), while the highest species number, including large athmobionts, characterized the soil up to 8 m. Here, the following species such as Neanura muscorum, Orchesella albofasciata, Orchesella multifasciata, Orchesella xerothermica, Pseudosinella horaki, Heteromurus major and Sminthurinus bimaculatus were found.
The species Cryptopygus thermophilus, which has an eurytopic distribution and is considered as a thermophilous and nitrophilous species (Potapov, 2001), was the dominant taxon on the bank near Camenca town. Often this species has a high number of individuals in the industrially polluted soils, including soils with increased content of heavy metals.
In Moldova, a high density of this species was observed, mostly in compost and dunghills (unpublished personal observation). It was also found dominating up to 57.15% of the entire collembolan communities near Giurgiulesti village on Prut River bank, at the confluence of Prut with the Danube (Busmachiu, 2006). This fact represents a distinctiveness of unstable, disturbed ecosystems (Van Straalen, 1991).
The highest values of Shannon diversity index – 2.86, of Margaleff species abundance index – 2.75, as well as of evenness index – 0.71 were registered near Goieni village (Table 2), in contrast to Soroca town, where a high density of collembolan population was recorded, while the mentioned indexes values were comparatively low.
Conclusions The comparative analysis of the state of soil along the banks of Dniester
using collembolan communities’ structure of five localities emphasized several peculiarities of collembolan species diversity and distribution in riverside zones. In spite of permanent floodings and transformations, the riverside sectors remain rather attractive places for the soil invertebrates, due to the carry-over and accumulation on their surface of the biogenic elements. Thereby, Collembola

SOME PECULIARITIES OF COLLEMBOLAN DISTRIBUTION IN THE RIVERSIDE ZONES …
9
inhabited all the studied localities from the bank of Dniester River and their species diversity and density are varying and correlate with the soil water content and organic matter content.
The linear sample collection allow to emphasize the gradually decreasing of water content and organic matter content up to minimum values at the distance up to 8 m from the edge of river bank and vice-versa, the increasing of collembolan number and species diversity up to maximum values at the distance of 6-8 m from the water river edge. It is important to mention a rather high species diversity of Collembola, even when the number of individuals was low. In spite of sharp water level fluctuations in the river, in the soil on the riverbank though remain deep-soil collembolan species that are most important for the soil genesis processes.
Acknowledgements. A part of this study was supported by CRDF foundation; project MOBI-2651-CS-05. The
authors expresses the gratitude to dr. Iuliana Popovici for improving English in the manuscript.
REFERENCES
Arinushkina, E.V. (1961) A Guide on the Chemical Analysis of Soils, Nauka, Moscow, pp 492. Busmachiu, G. (2004) Biotopical distribution of Collembola in the riverbank of transboundary
Dniester River, In: Integrated menagenent of natural resources in the transboundary Dniester River basin, Proceedingd of the International Conference, Chisinau, 67-69.
Busmachiu, G. (2006) The structure of collembolan communities in the riverside zone of Lower Prut, Collection of Scientific Articles, Bender, 142 – 146.
Bulimar, F. (1992) CompoziŃia faunistică şi structura comunităŃilor de colembole (Collembola: Insecta) în ecosistemele stuficole din delta Dunării, Analele ŞtiinŃifice ale Institutului Delta Dunării, Tulcea, 95 – 100.
Čarnogurský, J. (1998) Influence of the simulated flood on the collembolan communities in the former seasonally flooded Danubian forest near the Gabčikovo, Soil Zoology in Central Europe, Česke Budĕjovice, 13-17.
Junk, W.J., Bayley, P.B., Sparks, R.E. (1989) The flood pulse concept in river-floodplane systems, In: Proceedings of the International Large River Symposium, 110-127.
Khanislamova, G. (1986) Particularity of Collembolan communities in the condition of floodplain, In: Fauna and ecology of Collembola, Moscow, 78-89.
Magurran, A.E. (1991) Ecological diversity and its measurement. Chapman and Hall. London, pp 179.
Potapov, M. (2001) Synopses on Palaearctic Collembola, Isotomidae, Görlitz, 3, 601 Russell D., Hauth, A., Fox, O. (2004) Community dynamics of soil Collembola in floodplains of
the Upper Rhine Valley, Pedobiologia, 48, 527 – 536. Sterzynska, M., Ehrnsberger, R. (1999) Diversity and structure of Collembola communities in
wetlands, Proceedings of 5th Central European Workshop on Soil Zoology, Ceske Budejovice, 325-334.

GALINA BUSMACHIU AND ELENA ZUBCOV
10
Sterzynska, M, Pilipiuk, I. (1999). Communities of soil fauna (Enchytraeidae, Collembola) in Biebrza river basin, Soil Zoology in Central Europe, Česke Budĕjovice, 335 – 342.
Tronstad, L., Tronstad, B., Benke, A. (2005) Invertebrate seedbanks: rehydration of soil from an unregulated river floodplain in the south –eastern US, Freshwater Biol, 50, 646-655.
Van Straalen, N.M. (1991) Community structure of soil arthropods as bioindicators of soil health. In: Pankhurst C., Doube B.M., Gupta V.S.R. (eds.) Biological indicators of soil health, CA International. – Wallingford, 235-264

STUDIA UNIVERSITATIS BABEŞ – BOLYAI, BIOLOGIA, LII, 2, 2007 (p.11-17)
ON THE ANT EATING SPIDERS (ARANEAE: ZODARIIDAE) OF ROMANIA: NEW FAUNISTICAL DATA
IOAN DUMA1
SUMMARY. Although Romania has 5 biogeographic regions, more than in any neighboring country, till 2006 were recorded only four Zodarion species. This study reveals the existence of Zodarion morosum Denis 1935 and Zodarion cyprium Kulczynski 1908 in Romanian fauna. The biogeography of the Romanian species of Zodarion is discussed and notes of their habitat are given. Keywords: Arachnida, Zodariidae, Zodarion cyprium, Zodarion morosum, habitats, Romania
Introduction From a total of eleven biogeographic regions found in Europe according to the
European Environment Agency, in Romania five are present: continental, alpine, pannonian, pontic and steppic, more than in any other country on the old continent (except Russia). So we would expect to find here a great biodiversity of flora and fauna.
In spite of this potential till 2006 there were only four species of Zodarion recorded in our fauna Weiss and Petrişor (1999). From these Zodarion geticum Weiss, 1987 and Zodarion aurorae Weiss, 1982 were described for the first time from Romania by Weiss (1982), (1987). Recently Duma (2007) added to the list Zodarion rubidum Simon, 1914 but still this number is very small in comparison to the species known from the neighboring countries: Bulgaria has 11 recorded species according to Deltshev (2005), Macedonia (part of the former Yugoslavia) – 10 species, Blagoev (2002), Ukraine - 5 species, Kovblyuk (2003).
This paper adds further two species of the genus Zodarion for the Romania: Zodarion cyprium Kulczynski 1908 and Zodarion morosum Denis 1935.
Also the biogeography of all Zodarion species known from Romania is discussed and notes on their habitat are presented.
Material and Method The spiders were collected in the summers (July) of 2004 and 2007 from
South-Eastern Romania (Dobrogea and Muntenia regions) and then preserved in ethylic alcohol 70%. All specimens of Zodarion were gathered by hand from the vicinity of ant trails or nests. For the determination of the material we used online papers of Nentwig & all. (2003) and Weiss (1982), (1987).
1 West University of Timisoara, Faculty of Chemistry-Biology-Geography, Department of Biology,
Pestalozzi nr 16. Timisoara, Judet Timis, Romania E-mail: [email protected]

IOAN DUMA
12
The geographical coordinates of the collection places were obtained with a Magellan and Yakumo Global Positioning System units or from the maps provided by Google Earth program. The plant associations are according to the Habitats of Romania by Donita & all. (2005). Abbreviations used in the figures.
Abbreviations used for the countries in the Balkan Peninsula: RO – Romania, UKR – Ukraine, BG – Bulgaria, SRB – Serbia, MK –
Macedonia, GR –Greece, T – Turkey, AB – Albania, CR – Croatia, MTN– Monte Negro, BOS – Bosnia and Herzegovina, SL – Slovenia.
Abbreviations used to specify the biogeographical distribution of the Zodarion species found in Romania. EUR – Species with European distribution, BLK – species from Balkan area, P-MED – Ponto-Mediterranean species, STP – species with east European distribution found in Steppic regions.
Material deposition All specimens collected are now deposited in the collection of Department of
Biology, Faculty of Chemistry-Biology-Geography, West University of Timişoara.
Results The spiders collected were identified as: Zodarion cyprium Kulczynski 1908: 1♂ (7 July 2004, Agigea - 44º04′58″N
28º38′28″ E) and 1♀ (13 July 2007, Histria - 44º32′55″N 28º46′09″E). Zodarion morosum Denis 1935 2♂♂ (4 July 2007, Eforie Nord -
44º03′39″N 28º38′20″E) 2♀♀ (one on 5 July 2007 at Agigea -44º05′24″N 28º38′31″E and one on 15 July 2007 in 2 Mai - 43º46′49″N 28º34′24″E) (fig. 1).
Zodarion geticum Weiss 1987 1♂ (27 August 2007, Bujoru 43º42′48″N 25º33′25″E) (these coordinates were taken from the Google earth program).
Zodarion cyprium Kulczynski 1908 and Zodarion morosum Denis 1935 were found on marine sand dunes along the Black Sea coast (fig. 1) in habitats with Atripliceto hastatae - Cakiletum euxinae Sanda & Popescu 1999, Ephedro - Caricetu colchicae (Prodan 1939 n.n. Morariu, 1959) Sanda & Popescu 1973, Secali sylvestri - Alyssetum borzeani (Borza 1931) Morariu 1959, Schoenetum nigricans W. Koch 1926, DoniŃă & all. (2005). Unfortunately these habitats are under constant human pressure and their surface is diminishing year after year due to the development of tourist resorts especially in the southern part of Romanian Black Sea coast. With our new findings the total number of Zodarion spiders known in Romania rises to seven species.

NEW ANT EATING SPIDERS FOR ROMANIA
13
Figure 1. The distribution of Zodarion species in Romania
Zodarion geticum Weiss 1987 described from material gathered near capital Bucureşti by Dumitrescu is another rare species found in our searches (fig. 1). Till now it was recorded in Romania only from the Ceagău forest (Comana Natural Park) by Weiss (1987). From the moment it was described, no other report on this species has been published till present study. Unfortunately like Dumitrescu in 1987 we have collected just a male specimen and so the female remains still unknown to science. Present article adds a new distribution point for this rare species in Romania and brings new data on the habitat of the species. If Dumitrescu found his specimens in Moesian silver lime woods (Natura 2000) with the following plant associations: Ornithogalo-Tilio-Quercetum A. Dihoru 1976, Quercetum pedunculiflorae Borza 1937, Querco pedunculiflorae-Tilietum tomentosae DoniŃă 1970 we have found it in an orchard near the town of Alexandria at Bujoru (Teleorman district).
Discussions The spiders of the Zodariidae family belong to a group of a few specialized
arachnids that feed on ants. Their specialization seems to be so complex that at least some species don’t grow well on any ant diet as shown by Pekar (2004). This

IOAN DUMA
14
may lead to the conclusion that the dispersal of a Zodarion species is conditioned by the presence of certain species of ants. However in the end we believe that both ants and spiders have their distribution conditioned by the climate and habitat conditions and in this context we shall discuss the distribution of the ant eating spiders in Romania.
The presence of Z. cyprium and Z. morosum in Romania shows that the South-Eastern Romania has strong Mediterranean influences being home of many rare species for the country.
Although with present study Z. geticum has one more distribution point on the map of Romania we still know little about this species and the female remains still unknown to the science.
In 2001 it seems that was found also in Bulgaria Tzonev & Lazarov (2001) in the Osogovo Mountain (south-Western Bulgaria) at 950 meters altitude in a glade but this findings are not recognized by Platnick (2007) who still considers Z. geticum as a species limited to the Romanian territory. Zodarion aurorae Weiss 1982 described by Weiss (1982) after material collected at Hanu Conachi reserve (fig. 1), in Galati district, on 5 May – 18 June 1977 by Marcu Aurora & Weiss (1979) remains the rarest species from the Zodariidae family in Romania.
The habitat of this species are sand dunes with Brometum tectori Bojko 1934, Plantaginetum arenariae (Buia et. al. 1960) Popescu Sanda 1987, Mollugietum cervianae Borza 1963, Festucetum beckeri Popescu et Sanda 1997. From its description till now it has never been recorded again by any arachnologist from Romania or abroad. It is the only species that has a present known distribution restricted to the southern Moldova region and till other faunistical data remains a Romanian endemic species. However judging the climate conditions from Hanu Conachi (medium annual rainfall between 500 and 400mm, average sunny days per year between 150-170 days, average temperature in January of -4ºC), and habitats in which Z. aurorae was found it can be inferred that it is a Steppic element and should be present and in nearby Ukraine. Zodarion germanicum C.L. Koch 1837 seems to be the most common species in Romania (fig. 1) being found in Weiss’s collection from Brukenthal Museum in Sibiu, Weiss (1976), in Fuhn’s collection deposited now in the National History Museum “Grigore Antipa” from Bucuresti and also in private collections of other arachnologists: Urák (2002). It is however restricted to those regions that have continental influences (Western, Central and Northern Romania). Zodarion rubidum Simon 1914 found till now just in the Banat region (fig. 1) of Romania by Duma (2007) may be a common and widespread species in all western and northern parts of the country especially along rivers. Our affirmation is based on its European distribution. Zodarion aculeatum Kulczynski 1897 is a species restricted to the southern Romania being found till this day only by Fuhn according to the spider checklist

NEW ANT EATING SPIDERS FOR ROMANIA
15
made by Weiss & Petrisor (1999) (fig. 1). This species seem to be restricted to the northern Balkan Peninsula being cited in the faunas of Serbia, Macedonia, Bulgaria and of course Romania.
From the biogeographical point of view Romania has a great faunistical potential. Its position in the northern Balkan Peninsula and the various climate influences has great repercussions on the fauna (fig. 2). In the western and northern regions where strong continental influences are present, European species are found: Z. germanicum and Z. rubidum. Further other widespread species may also be present.
The South-Eastern Romania has the greatest Zodarion diversity. Here are found ponto-mediteraneean species along the Black Sea coast: Z. cyprium and Z. morosum, then Steppic species: Z. aurorae and also Balkanic ones: Z. aculeatum and Z. geticum.
Conclusions 1. The total number of Zodarion species known from Romania until
present is of seven. 2. Analyzing the geographical distribution of Zodarion species from our
country it can be inferred that the greatest diversity of species is found in the South-Eastern Romania where are present ponto-mediteranean, steppic and balkanic species.
3. Zodarion cyprium and Zodarion morosum are ponto-mediteraneean species and therefore restricted to the Dobrogea region.
4. Zodarion aurorae, remains the rarest species from the genus Zodarion in Romania. Although it was found in a single place: Hanu Conachi reserve (Southern Moldova) it is a Steppic element and might be present in Ukraine also.
5. Zodarion aculeatum and Zodarion geticum are Balkan species with the northernmost distribution in Romania.
6. Due to the rarity of the species: Zodarion geticum and Zodarion aurorae and also because their habitat is under constant pressure we suggest that these species should have a place on a red list of Romanian spiders that must be done in near future.
7. Although with recent findings the number of Zodarion species rose to seven each of these has just a few known distribution points and so further faunistical studies on this family are needed for clarifying their status.

IOAN DUMA
16
Figure 2. The position of Romania in the Balkan Peninsula and the influences on the
Zodarion spider fauna
Acknowledgements. I am indebted to the following persons for helping me identifying the material: dr.
Christo Deltshev and prof. dr. Stano Pekár. Also I thank prof. dr. Gheorghe MustaŃă for allowing me to use the facilities of the Marine Research Center “Ioan Borcea” from Agigea where I stayed during my collecting campaigns in Dobrogea. Thanks goes also to Marina Curt for the material collected from the Bujoru locality.
REFERENCES
Blagoev, G. E., Check List of Macedonian Spiders (Araneae), Acta Zoologica Bulgarica 54 (3), 2002, 9-34,
Brignoli, P.M., Ragni di Grecia XII. Nuovi dati su varie famiglie (Araneae), Revue Suisse de Zoologie 91, 1984, 281-321.
Deltcshev, C., A faunistic and zoogeographical review of the spiders (Araneae) of the Balkan Peninsula, The Journal of Arachnology 27, 1999, 255-261,

NEW ANT EATING SPIDERS FOR ROMANIA
17
Deltcshev, C., Fauna and zoogeography of spiders (Araneae) in Bulgaria, The Journal of Arachnology 33, 2005, 306-312,
DoniŃă, N., Paucă–Comănescu, M., Popescu, A., Mihăilescu, S., Biriş, I. V., Habitatele din România, Editura Tehnică Silvică, Bucureşti, 2005
Duma, I., Notes on the spider (Arachnida: Araneae) fauna from the lower Mureş River valley, with a new mention for Romania, Annals of West University of Timişoara ser. Biology, 9, 2007, 111-117
Kovblyuk, N. M., Spiders of the genus Zodarion (Aranei: Zodariidae) in the fauna of the Crimea. Euroasian entomoligical Journal 1, 2003, 177-183.
Pekár, S Predatory behaviour of two European ant-eating spiders (Araneae: Zodariidae), The Journal of Arachnology, 32, 2004 31-41.
Nentwig W., Hanggi A., Kropf C., Blick T., Spinnen Mitteleuropas – Bestimmungsschlüssel, from: www.Araneae.unibe.ch, 2003
Platnick, N. I., 2007. The world spider catalog, version 8.0 available from: http://research.amnh.org/entomology/spiders/catalog/index.html.
Tzonev, G., Lazarov, S., A contribution to the Study of Spiders (Araneae) in Osogovo Mountain, South-West Bulgaria, Acta Zoologica Bulgarica 53 (2): 67-78, 2001
Urák, I., Study of the spiders (Arachnida: Araneae) in the FânaŃele Clujului Botanical Reservation, Entomologica romanica, 7, 2002, 79-84
Weiss, I., Untersuchungen über die arthropoden fauna xerothermer standorte im südsiebenbürgischen hügelland. Spinen (Araneae, Arachnida), Muzeul Brukenthal Studii şi Comunicări Şt. Nat. 20, 1976, 255-294.
Weiss, I., Marcu, A., Araneae şi opilionidae epigee din rezervaŃia de dune fluviatile de la Hanu Conachi (JudeŃul GalaŃi), Muzeul Brukenthal Studii şi Comunicări Şt. Nat., 25, 1979, 251-254
Weiss, I., Konstruktions und Funktionsanalyse der Kopulationsorgane von Zodarion aurorae n. sp. aus Rumänien Reichenbachia Staadliches Museum für Tierkunde Dresden, 9, 1982, 77-83.
Weiss, I., Zodarion geticum n. sp., eine Spinne mit Duftorganen aus Rumänien, Reichenbachia Staadliches Museum für Tierkunde Dresden, 20, 1987, 103-106.
Weiss, I., Petrişor, A., List of the spiders (Arachnida: Araneae) from Romania. – Trav. Mus. Natl. Hist. Nat. „Grigore Antipa“, 41, 1999, 79-107.

STUDIA UNIVERSITATIS BABEŞ – BOLYAI, BIOLOGIA, LII, 2, 2007 (p.19-32)
POPULATION FLUCTUATIONS AND THE SPATIAL HABITAT USE BY AMPHIBIANS IN A HUMAN MODIFIED LANDSCAPE
TIBOR HARTEL 1,2 AND COSMIN IOAN MOGA 2
SUMMARY. In this study we present the start of the breeding season and the long term population fluctuations of amphibians in a permanent pond and a number of temporary ponds in a human modified landscape in the middle section of the Târnava Mare basin. The start of breeding was strongly influenced by temperature in spring. The populations of Hyla arborea and R. temporaria were in decline whereas Pelobates fuscus and Bufo bufo were stable during this time. Pelobates fuscus is represented by a small population and is probably maintained by immigration from other areas. Bufo bufo and P. fuscus use only the permanent pond for reproduction. More egg masses of R. temporaria were found in the temporary ponds than in the permanent pond. The reproductive success was yearly observed in the temporary ponds but not in the permanent pond. We assume that the permanent pond is a source habitat for B. bufo and represents sink for R. temporaria whereas the temporary ponds from the forest represent source habitats for the last species. This and the previous studies on this community suggest that in this landscape, both the permanent and temporary ponds and the landscape connectivity are crucial for the maintenance of rich amphibian communities. Keywords: amphibian populations, climate, long term fluctuations, landscape Introduction The human domination on the earth ecosystems substantially altered the Earth
systems through several interacting processes (Vitousek et al., 1997). It was recognized that designing protected areas does not guarantee the protection of biodiversity because (i) the protected area covered is still too small (Hoekstra et al., 2005), (ii) human interests are continuously growing (Liu et al., 2001). It is increasingly recognized that there is a significant biodiversity outside of the protected areas that should be also properly managed and protected (Daily et al. 2001, „2010 Biodiversity Indicators Partnership” http://www.twentyten.net/target.htm). Habitat and population based studies in Romania are more important now than ever. Firstly, with the recent EU adhesion new land use practices will be (quickly) adopted, and this will lead to drastic changes in the landscape structure. Secondly, we have (maybe the last) opportunity to study populations in clutural landscapes, thus, to get information about the ways at which human perturbations in the landscape represented by traditional land use practices affect the distribution and persistence of the natural populations. New developements in population /
1 Colegiul Mircea Eliade, Str. 1 Decembrie 1918, nr. 31, 545400, Sighişoara E-mail: [email protected] 2 Mihai Eminescu Trust, Str. Şcolii 2, 545400 Sighişoara. E-mail: [email protected]

TIBOR HARTEL, COSMIN IOAN MOGA
20
metapopulation theory, island biogeography and landscape ecology and their integration in ecology, represent useful modern insights about how hypoheses should be formulated, data gathered and interpreted to achieve this goal (Sandersen et al., 2002; Fischer et al., 2004; Manning et al., 2004; Fischer et al., 2006; Fischer and Lindenmayer, 2007; Lindenmayer et al., 2007; Schneider and Willig, 2007).
Pond breeding amphibians are important focal group for conservation for a number of reasons: (i) They have complex life cycles and need high spatial heterogeneity of the landscape to complete it. These life history traits makes them sensitive to habitat loss and fragmentation. (ii) They often are organized in metapopulations (Alford and Richards, 1991; but see Smith and Green, 2005). Loss of connectivity between local populations may expose them to genetic depletion, this making them susceptible for a number of other natural and anthropogenic stressors (Edenhamn et al., 2000). (iii) Amphibians are in global decline (Stuart et al., 2004) for various and often complexly interacting causes (Beebee and Griffiths, 2005).
Monitoring amphibian populations and the spatial use of the habitats provide information about the factors (natural and anthropogenic) causing long term fluctuations and their potential role as source populations at landscape level. In this paper we present the population fluctuation in 11 years of four amphibian species in the middle section of the Târnava Mare basin. The area is a mosaic patch that has natural – seminatural (ponds, river, grassland, forest) and anthropogenic (railway, arable lands, built areas) origins. The composition and configuration of the above mentioned landscape elements allow the study of the role of spatial arrangement of these landscape elements in determining the spatial extent of habitat use by amphibians. Previous studies have shown that the distribution of the migrating and dispersing Common Toads can be related to these land use types, the grassland between the pond and the forest being of critical importance (Hartel and Demeter, 2005; Hartel upublished results). In a larger scale, both the landscape composition and configuration was found to be important predictors of the Common Toad population sizes (Hartel and Moga, 2007 in press). Moreover, the long term study regarding the temporary habitat use by the Yellow Bellied Toad (a Habitat Directive species) in this area (Hartel et al., 2007a) shows that this species use the most durable ponds for reproduction in dry years. Temporary ponds that act as sink habitats in dry years represent high quality breeding habitats in rainy years. Because of the large and stable populations of some species the area was proposed as Natura 2000 Site of Community Importance (Ministerial Order 776/2007). Yet the whole area where the temporary ponds occur is seriously impacted by the drainage ditches that were made in order to facilitate gas extraction and the movement of heavy vehicles towards and from the gas source stations (2007).
In this study we present: a) aspects of the breeding phenology (start of breeding season) in two species, b) the long term fluctuations in the amphibian populations,

AMPHIBIAN POPULATION FLUCTUATIONS AND HABITAT USE …
21
c) the correlation of the start of breeding period and population fluctuations with a number of climatic variables.
Materials and Methods Study area. The study area is situated in the middle section of the Târnava
Mare Valley, Romania (46º13’47.8’’N; 24º46’47.6’’E, 345 m altitude) and has approximately 3 km² area. A permanent pond and up to 80 temporary ponds were studied in this area (Fig. 1).
The permanent pond has 2.2 ha area with a maximum depth of about 4 m. The reed cover in the pond shows gradual increase during the years in the south eastern part of the pond, probably linked to the changed light condition due to the cutting of the trees along one shore of the pond. In 2007, approximately 35% of the pond was covered by Typha sp. and Phragmites sp. Four fish species, Pseudorasbora parva, Carassus auratus, Cyprinus carpio and Leucaspius delineatus were constantly present during the 11 years. The temporary ponds are situated in the forest to a distance from 800 to 1500 m. Their number varies greatly with the precipitation (Hartel et al., 2007b), the maximum number being generally recorded in spring. The average pond area is 22 m2 (range 1-250), the depth varies between 3 to 100 cm (Hartel and Nemes, 2006).
The terrestrial area surrounding the permanent pond is represented by arable lands, a railway, the Târnava River, and a grassland patch between the pond and the forest (Hartel, 2004) (Fig. 1). We created a database regarding the land use types in this area using maps, aerial and other photographies. The landscape composition (in this case the land use types and their amount in the landscape) and configuration (i.e. the spatial arrangement of these) was not changed significantly during the 11 years.
The studies on the permanent pond were started in 1997 whereas in the temporary ponds in 2002. The methodology used for estimating “size of the populations” was presented in detail in Hartel (2004; 2005). The fieldwork started in the middle of February and lasted until the first part of June. Two aspects of the beginning of the breeding season were considered in R. temporaria and B. bufo: (i) the start of male activity (first day), meaning the first chorus in R. temporaria and the first adult males found in the water in B. bufo and (ii) the first day when deposited eggs were found. Since it is assumed that females lay maximum one egg mass every year, and the egg masses are easy to count, we used the number of egg masses as indicators of population size in the case of R. temporaria. In the case of the Common Toad (Bufo bufo) we counted the active individuals in the water until about 1 m from the water shore on land. This method provided ecological meaningful informations about the pond and landscape characteristics influencing the common toads in the Târnava Mare basin (see Hartel et al. 2007b and the references cited therein for the use of “head count” methods”). The population

TIBOR HARTEL, COSMIN IOAN MOGA
22
sizes of Common Spadefoot Toad (Pelobates fuscus), and Tree Frog Hyla arborea were estimated using the number of calling males.
Fig. 1. The study area, the distribution of the ponds and the land use patterns. Black points represent the most stable temporary ponds that were used most frequently. Temporary
ponds „g1” and „g2” were used by Hyla arborea
We used a number of climatic variables in this study: These variables were: (i) total amount of precipitation (l/mm) in January, and (ii) February in the years when egg masses were counted, (iii) total amount of precipitation during the active season of frogs (April to September) in the year previous to which eggs were counted, (iv) the mean air temperature in January and (v) the mean air temperature in February. These data were measured at the water station from Albeşti, at a distance of about 5 km from the population studied.
Besides the climatic variables (see above), the variables „year” and the number of egg masses recorded for R. dalmatina (in the case of R. temporaria) (Hartel submitted) were used as independent variables in a multipple regression analysis (forward stepwise). The dependent variables in the multipple regression were: the population size estimations (see above), the number of days in the year (using a Julian calendar whereby 1 January is day 1) when the first male called (R.

AMPHIBIAN POPULATION FLUCTUATIONS AND HABITAT USE …
23
temporaria) or was seen (B. bufo) and the Julian date when first egg mass was recorded (both species).
The number of egg masses deposited by R. temporaria in the permanent pond and the temporary ponds from the forest was compared using the nonparametric Mann - Whitney U test. The rate of change of population size was estimated using the ∆N method. According to this formula, changes in population sizes between years are related to each other by ∆N = log(N+1)t - log(N+1)t-1, where N is the population size at time t (Houlahan et al. 2000).
Results and Discussions The start of the breeding period. There was no significant difference
between the start of the vocalization period in the males and the first egg mass deposited (mean: 71.50 days, SD = 11.84) and the first egg mass (74.22, 10.96) in R. temporaria (t = -0.56, df = 20, P = 0.58). In the case of B. bufo the differences were significant (males: 75.88, SD = 13.25; females: 88.44, SD = 8.62; t = -2.51, df = 18, P = 0.02). Although not significant in statistical terms (maybe because of low power of the test), the 2.72 day difference between the start of calling and the first egg mass deposited in R. temporaria may be significant from a biological point of view. As the number of individuals in the permanent pond is very small (see below) we assume that the vocalization in this case may be important in female attraction. Wells (1977) noted that the male mate locating strategies of explosive breeders, such as B. bufo may be dependent on the density. Calling at low density in this species may be advantageous but as the density increases (as more individuals migrate in short time) the calling activity is expected to cease. This was also observed in the population studied by us. In R. temporaria however, males in large / dense populations are expected to be more active in the breeding season than in small / less dense populations (Elmberg and Lundberg, 1991). Bufo bufo start breeding significantly later than R. temporaria (t test, P < 0.05). R. temporaria always finished breeding in 5-6 days, thus, the overlap between the reproduction periods of two species was minimal. Bufo bufo reproduced until the second part of April, active males being found even the first part of May (6th of May). High degree of interspecific spawning was found in the case of R. temporaria and B. bufo in a pond from England (Reading, 1984). Interspecific pairing between the two species was never observed in these two species due to the short overlap of the breeding seasons. However, the interspecific pairing between the B. bufo males and females of R. ridibunda were frequently observed. This may be because R. ridibunda appears in the pond toward the end of the breeding season of B. bufo when the operational sex ratio is strongly skewed toward the males. Size assortative pairing was not observed in B. bufo (Hartel and Demeter, 2005) nor in R. temporaria (Hartel unpublished).
The air temperature in February was the most important variable affecting the start of the reproduction in both species: there was a negative relationship

TIBOR HARTEL, COSMIN IOAN MOGA
24
between the beginning of the reproduction and the air temperature in February (Table 1 and 2), in B. bufo the precipitation in January being important determinant of the start of males activity (Table 2). These results confirm the previous findings on the role of the climatic conditions in the initiation of reproduction of temperate explosive-breeding amphibians (Duellmann and Trueb, 1986; Sofianidou and Kyriakopoulou-Sklavounou, 1986; Reading, 1998), including the population of R. damatina (Hartel 2005, Hartel unpublished). We assume that any long term increase in the air temperature in spring may be reflected by earlier dates at which breeding begins for the populations of these two species. Moreover, the identified climatic variables explains overall a small variation in the begining of thereproduction period of these two species (R2 is small, the largest value being for the beginning of the males activity in B. bufo). This means that other, unrecorded factors may be also important in the start of reproduction of these two species.
Population sizes fluctuations. Bufo bufo, and P. fuscus used only the
permanent pond for reproduction, whereas H. arborea occurred in two sunny temporary ponds (Fig. 1), with longer duration. The temporary ponds from the forest are small, shadowed (thus cold and unproductive relatively to the temporary ponds from the open areas) and have short hydroperiod (Hartel unpublished), these conditions not being preferred by these two species (Laurila, 2000; Pellet and Hoehn, 2004; Nyström et al., 2007).
The average size of the populations of the four species in the permanent pond was: 27.27 (SD = 15.10) egg masses in R. temporaria, 1372.80 (SD = 475.69) individuals in B. bufo, 46.63 (SD = 23.17) calling males in H. arborea and 7.18 (SD = 5.75) calling males in P. fuscus. The fluctuation of the population sizes are presented in Fig. 2, 3 and 4. The ∆N is negative in R. temporaria (-0.07) and H. arborea (-0.07) whereas it is positive in P. fuscus (0.09) and B. bufo (0.01). The number of the calling males in H. arborea and the number of egg masses in R. temporaria shows negative trends during the 11 year period (Table 1 and 2). The number of males of H. arborea show sharp decline from 2004 (Fig. 3). The number of egg masses deposited by R. temporaria was significantly positively associated with the amount of precipitations in January, and negatively associated with the number of the R. dalmatina egg masses (Table 1).
It was showed that the sensitivity of females toward the climatic conditions has increased toward the end of the winter dormancy period due to the depletion of energy reserves (Reading, 2007). In dry springs a certain proportion of females may fail to reproduce or mortality could increase.

AMPHIBIAN POPULATION FLUCTUATIONS AND HABITAT USE …
25
0
20
40
60
80
100
120
140
160
1997
1998
1999
2000
2001
2002
2003
2004
2005
2006
2007
Nu
mb
er o
f eg
g m
asse
s
Permanentponds
Temporaryponds
Rana temporaria
Fig. 2. The fluctuation of the egg mass number in the permanent pond and the temporary
ponds in R. temporaria. Data from all the temporary ponds are pooled
01020304050607080
1997
1998
1999
2000
2001
2002
2003
2004
2005
2006
2007
Nu
mb
er o
f cal
ling
mal
es
Hyla arborea
Pelobates fuscus
Fig. 3. The fluctuation of the number of calling males in P. fuscus and H. arborea

TIBOR HARTEL, COSMIN IOAN MOGA
26
Bufo bufo
0
500
1000
1500
2000
2500
1997
1998
1999
2000
2001
2002
2003
2004
2005
2006
Nu
mb
er o
f act
ive
ind
ivid
ual
s
Fig. 4. The fluctuation of the number of active individuals in B. bufo
Table 1. The summary of the multiple regression analysis on the relationship between the climatic
variables and the start of reproduction and population size in Rana temporaria. The population size of R. dalmatina was used as predictor variable for the number of egg masses. Variable
β (±SE) t p R²
Beginning of calling activity Air temperature in February -0.69 (0.23) -2.93 0.01 0.48 Multiple regression F(1,9) = 8.60, p < 0.01 First egg mass Air temperature in February -0.64 (0.25) -2.51 0.03 0.41 Multiple regression F(1,9) = 6.33, p < 0.03 Number of egg masses Year -0.94 (0.15) -6.14 <0.001 0.85 Population size of R. dalmatina -0.51 (0.15) -3.34 0.001 Precipitations in Ianuary 0.43 (0.25) 2.77 0.02 Multiple regression F(1,10) = 13.77, p < 0.002

AMPHIBIAN POPULATION FLUCTUATIONS AND HABITAT USE …
27
Table 2. The summary of the multiple regression analysis on the relationship between the climatic
variables and the start of reproduction and population size in Bufo bufo Variable
β (±SE) t p R²
Beginning of males activity Air temperature in February -1.05 (0.24) -4.31 0.003 0.72 Precipitation January -0.53 (0.24) -2.16 0.06 Multiple regression F(2,8) = 9.44, p < 0.01 First egg mass Air temperature in February -0.71 (0.25) -2.82 0.02 0.59 Precipitation in previous year 0,57 (0.25) 2.28 0.06 Multiple regression F(1,9) = 4.27, p < 0.05 Number of active individuals No significant effect of climatic variables nor year was
found
Table 3.
The summary of the multiple regression analysis on the relationship between the climatic variables, and the population size in Pelobates fuscus and Hyla arborea
Variable
β (±SE) t p R²
Pelobates fuscus Temperature January -0.58 (0.26) -2.18 0.05 0.34 Multiple regression F(1,9) = 4.77, p < 0.05 Hyla arborea Year -0.75 (0.22) -3.34 0.01 0.67 Precipitation in January 0,70 (0.28) 2.44 0.04 Multiple regression F(2,8) = 4.74, p < 0.04
The number of calling males of P. fuscus was negatively associated with the
temperature in January whereas in the case of H. arborea there was a positive relationship between the number of calling males and the amount of precipitation in January (Table 3). It was suggested that calling in anurans may be energetically demanding behavior the calling intensity of the males being strictly dependent on the energy reserves remained after hibernation (Elmberg and Lundberg, 1991). Thus, what we registered may be the variation of the calling males and not those that survived from year to year. Even in this condition calling may be an indicator of the male’s fitness, influencing the probability for finding a mate (Friedl and Klump, 2005). We mention that the recorded climatic variables explained only a small variance of the number of males in P. fuscus (34%).
The reasons for the decline of R. temporaria and H. arborea (in the last species the decline being sharp in the last years) in the permanent pond are not yet known. Both species are susceptible to predation by fish (Carassus auratus,

TIBOR HARTEL, COSMIN IOAN MOGA
28
Pseudorasbora parva) (Meyer et al., 1998, Teplicky, 2003; Hartel et al., 2007c for local study). We have not recorded the changes of the density of these fish species during the years, but it is possible that changes in this variable affected the two species. In the case of R. temporaria, the population size was negatively associated with the population size of R. dalmatina. Rana dalmatina is represented by a large and stable population in this area, and is not negatively associated with predatory fish. Interspecific competition in larval stages may be a cause of the negative correlation between the population sizes of the two species (Riis, 1988). The observations made in the Târnava Mare basin (Hartel unpublished) suggest that R. dalmatina is more represented in the permanent ponds than R. temporaria whereas R. temporaria is more efficient in temporary ponds than R. dalmatina (Hartel, unpublished).
The spatial distribution of the pond use and the reproductive success of Rana temporaria. The average number of the egg masses of R. temporaria in the temporary ponds for the five years was 61.60 (SD = 42.64). The median value of the R. temporaria egg masses deposited in the temporary ponds were significantly larger (47) than that of those deposited in the permanent pond (22) (Mann – Whitney U test, Z = -2.32, P = 0.02). The reproductive success was more constant in the temporary ponds than in the permanent one. In the permanent pond, reproductive success was recorded only in four years (1997, 1998, 2001 and 2005), these years having larger amount of precipitation in early summer than the other years). In the case of the temporary pond system, the number of the ponds where eggs were deposited varied yearly but metamorphosis occurred in all years (Fig. 5).
0
10
20
30
40
50
60
70
80
90
100
II.
26II
I. 1
3IV
. 25
V.
10V
I. 3
VI.
27
VII
. 6
VII
. 20
II.1
6II
I.23
IV.
15IV
. 25
V.
5V
I. 6
VI.
29
VII
.6V
II.
21
IV.
4.
V.
7V
I.12
VI.
27
VII
.6V
II.8
III.
18
IV.
4IV
. 13
IV.
28V
. 2
VI.
3V
II.
20
III.
16
IV.
4V
. 3
2003 2004 2005 2006 2007
Num
ber
of
tem
por
ary
po
nd
s
2003egg: 10 metamorphosis: 4
2004egg: 12 metamorphosis: 7
2005egg: 7 metamorphosis 7
2006egg: 6 metamorphosis 5
2007egg: 4 metamorphosis 1
Fig. 5. The fluctuation of the number of temporary ponds after the snow melt until the first part of July (the end of metamorphosis in the majority of R. temporaria larvae)

AMPHIBIAN POPULATION FLUCTUATIONS AND HABITAT USE …
29
The reproductive success observed in the permanent pond when the water level was increased suggest that the shallow parts of the pond are important for the larval growth and development, most probably due to the temperature regimes, increased productivity and safe against predatory fish. An other temporary pond breeder, B. variegata also used this pond for reproduction when the precipitation increased the water level (1998 and 2005) (Hartel, 2004; Hartel unpublished results). These results show that the temporary ponds from the forest are more important breeding habitats for R. temporaria (probably acting as sources, sensu Pulliam 1988) than the permanent pond (that is sink in some years, Pulliam 1988). Temporary ponds are fish free but pose the risk of reproductive failure due to drying. Rana temporaria is physiologically adapted to temporary ponds due to its ability to efficiently exploit the resources in temporary ponds and its high phenotypic plasticity (Hartel et al. 2005 and the references cited there).
The number of the temporary ponds with metamorphosis was positively related to the amount of precipitation in May – July (Spearman r = 0.87, P = 0.05). No relationship was found between the total amount of precipitation in spring (January-April) and the number of ponds used for reproduction. These results show the importance of the precipitations that fill the ponds toward the end of the larval period. At this stage, the larval crowding is high, the nutrient necessity is increased (but the resources are depleted) the waste elements are accumulated and the oxygen concentration is also dropped. According to the model of Wilbur and Collins (1973), there is a threshold larval body size/developmental stage that must be attained to be capable for initiating and completing metamorphosis, in response to environmental deterioration. Refilling the ponds toward the end of the larval stage may contribute to the attainance of the critical development stage at which the metamorphosis can occur. An experimental study (Hartel and Nemes, 2007 in press) indicated that under low energy intake, common frog tadpoles from this population fail to adapt to changing environmental conditions decreasing not only the chance of survival until metamorphosis but the post metamorphic fitness as well. The highest mortality was observed between the larvae having 34 - 38 Gossner stage (Gossner, 1960) (Hartel and Nemes, in press).
In conclusion, the climatic variables in spring are good predictors for the number of reproducing adults in R. temporaria, P. fuscus and H. arborea. Rana temporaria and H. arborea shows negative trends. It seems that the aquatic habitats from this landscape do not provide good habitats for P. fuscus and H. arborea the reasons not being known. This and the previous studies (Hartel, 2005; Hartel et al., 2007a) show that maintaining a large variety of aquatic habitats at landscape scale is crucial for amphibian communities. Some species are more represented in the temporary ponds (i.e. B. variegata [Hartel et al., 2007a], R. temporaria [this study]) whereas other species use the permanent pond (i.e. B. bufo). As it was suggested before (Hartel, 2004; Hartel and Demeter, 2005) the maintenance of the
TIBOR HARTEL, COSMIN IOAN MOGA
30
green corridor between the permanent pond and the forest (the grassland in the Fig. 1) is crucial for this amphibian community.
We strongly encourage studies that aim to find how natural populations “behave” in different landscape types in Romania. Further studies will elucidate if the protected status of this landscape will really contribute to the conservation of this amphibian community.
Acknowledgements. The studies in the central part of the Târnava Mare basin were financially
supported by the Declining Amphibian Populations Task Force (DAPTF) and the Mihai Eminescu Trust. Thanks for Dr. Ioan Coroiu for the review of this manuscript and to Ruxandra Coroiu for the correction of the English.
REFERENCES Alford, R. A., Richards, S.J. (1999) Global amphibian declines: a problem in applied
ecology. Annu. Rev. Ecol. Syst., 30, 133-156. Beebee, T. J. C., Griffiths, R.A. (2005) The amphibian decline crisis: a watershed for
Conserv Biol? Biol. Conserv., 125, 271-285. Duellman, W. E. & Trueb, L. (1986) The Biology of Amphibians. Baltimore and London.
John Hopkins Press. Edenhamn, P., Höggren, M., Carlson, A. (2000) Genetic diversity and fitness in peripheral and
central populations of European tree frog Hyla arborea. Hereditas, 133, 115-122. Elmberg, J., Lundberg, P (1991) Intraspecific variation in calling, time allocation and energy
reserves in breeding male common frogs Rana temporaria. Ann. Zool. Fennici., 28, 23-29. Fischer, J., Lindenmayer, D. B. (2007) Landscape modification and habitat fragmentation: a
synthesis. Global. Ecol. Biogeogr., in press. Fisher, D. B., Lindenmayer, D. B., Fazey, I. 2004. Appreciating ecological complexity:
habitat contours as a conceptual landscape model. Conserv. Biol., 18, 1245-1253. Fischer, J. Lindenmayer, D. B., Manning, A. (2007) Biodiversity, ecosystem function and
resilience: ten guiding principles for commodity production landscapes. Front. Ecol. Environ., 4, 80-86.
Friedl, T. W. P., Klump, G. M. (2005) Sexual selection in the lek-breeding European treefrog body size, choeus attendance, random mating and good genes. Anim. Behav., 70, 1141-1154.
Gosner, K. L. (1960) A simplified table for staging anuran embryos and larvae with notes on their identification. Herpetologica, 16, 183–190.
Hartel, T. (2004) The long-term trend and the distribution of amphibian populations in a seminatural pond in the middle section of the Târnava-Mare Valley (Romania). Biota - Journal of Biology and Ecology, 4/1-2, 25-36.
Hartel, T. (2005) Aspects of breeding activity of Rana dalmatina and Rana temporaria reproducing in a seminatural pond. N. West. J. Zool., 1, 5-13.

AMPHIBIAN POPULATION FLUCTUATIONS AND HABITAT USE …
31
Hartel, T., Demeter., L. (2005) The breeding migration and population characteristics of a common toad (Bufo bufo) population in Târnava Valley, Romania. Transylvanian Review of Ecological and Systematical Research, 2, 145-154.
Hartel, T., Nemes, Sz. (2006) Toe clipping and body condition at yellow belied toads, Bombina variageta. Acta. Zool. Acad. Sci. Hung, 52(4), 359-366.
Hartel, T., Moga, C. I., Nemes, Sz. (2005) Use of temporary ponds by amphibians in a wood pasture, Romania. Biota - Journal of Biology and Ecology, 5, 21-28
Hartel, T., Nemes, Sz., Demeter, L., Öllerer, K. (2007a) Pond and landscape characteristics: which are more important for the common toad? A case study from central Romania. Applied Herpetology in press.
Hartel, T., Nemes, Sz., Mara Gy. (2007b). Spatial and temporal dynamic of pond use by a hybrid fire-bellied toad population: the importance of pond availability and duration. Acta Zoologica Lituanica, 17, 56-63.
Hartel, T., Nemes, Sz., Cogălniceanu, D., Öllerer, K., Schweiger, O., Moga, C.I., Demeter, L. (2007c). The effect of fish and habitat complexity on amphibians. Hydrobiologia, 583, 173-182.
Hartel, T., Nemes Sz. Lack of adaptive plasticity in Rana temporaria tadpoles caused by starvation: an experimental study. Acta Hargitensia in press.
Hoekstra, J.M, Boucher, T.M., Ricketts, T.H., and Roberts, C. (2005) Confronting a biome crisis: global disparities of habitat loss and protection. Ecology Letters, 8, 23–29.
Houlahan, J.E., Findlay, C. S., Schmidt, B.R, Meyer, A.H., Kuzmin, S.L., (2000) Quantitative evidence for global amphibian population declines. Nature, 44, 752-755.
Laurila, A. (2000) Competitive ability and coexistence of anuran larvae in freshwater rock pools. Freshwater. Biol., 43, 161-174.
Lindenmayer, D., Hobbs, R.J., Montague-Drake, R. et al. (2007): A checklist for ecological management of landscapes for conservation. Ecology Letters (OnlineEarly Articles), DOI: 10.1111/j.1461-0248.2007.01114.x.
Liu, J.G, Linderman, M., Ouyang, Z.Y., et al. (2001) Ecological degradation in protected areas: the case of Wolong Nature reserve for giant pandas. Science, 292, 98–101.
Manning, A. D., Lindenmeyer, D. B., Nix, H. A. (2004) Continua and Umwelt: novel perspectives on viewing landscapes. Oikos, 104, 621-628.
Meyer, A. H., Schmidt, B. R., & Grossenbacher, K. (1998) Analysis of three amphibian populations with quarter century long time series. Proc. R. Soc. Lond., 265, 523-528
Nyström, P., Hansson, J., Mansson, J., Sundstedt, M., Reslow, C., Broström. A., (2007) A documented amphibian decline over 40 years: Possible causes and implications for species recovery. Biol. Conserv., (Online Early) DOI:10.1016/j.biocon.2007.05.007.
Pellet, J., Hoehn, S. (2004) Characterization of tree frog (Hyla arborea) calling ponds in western Switzerland. Z. f. Feldherpetologie, 5, 1-6.
Pulliam, H. R. (1988). Sources, sinks, and population regulation. Am. Nat., 132, 652-661. Reading, C.J. (1984) Interspecific spawning between common frogs (Rana temporaria) and
Common Toads (Bufo bufo). J. Zool. (Lond.), 225, 201 – 211. Reading, C.J., (1998) The effect of winter temperature on the timing of breeding activity in
the common toad, Bufo bufo. Oecologia, 117, 469-475. Reading, C.J. (2007). Linking global warming to amphibian declines through its effects on
female body condition and survivorship. Oecologia, 151, 125-131.

TIBOR HARTEL, COSMIN IOAN MOGA
32
Riis, N. (1988) The present distribution of Rana dalmatina and Rana temporaria in Southern Scandinavia explained by a theory of competitive exclusion. Mem. Soc. Fauna. Flora. Fennica, 64, 104-106.
Sandersen, E. W., Willig, M. R., Veder, A., Coppolillo, P. B., Ward, S. E. (2002) A conceptual model for conservation planning based on landscape species requirements. Landscape and Urban Planning, 58, 41-56.
Scheiner, S.M., Willig, M. R. (2007) The general theory of ecology. Theor. Ecol., online early, DOI 10.1007/s12080-007-0002-0.
Smith, M. A., Green, D. M. (2005) Dispersal and the metapopulation paradigm in amphibian ecology and conservation: are all amphibian populations metapopulations? Ecography, 38, 110-128.
Sofianidou Th. S., Kyriakopoulou-Sklavounou, P. (1983) Studies on the biology of the frog, Rana dalmatina, Bonap. during the breeding season in Greece. Amphibia- Reptilia, 4, 125-136.
Stuart, S. N., Chanson, I. S., Cox, N.A., Young, B. E., Rodrigues, A. S. L., Fishman, D. L., Waller, R. W. (2004) Status and trends of amphibian declines and extinctions worldwide. Science, 3, 1783-1785.
Teplitsky C., Plénet S., Joly P. (2003) Tadpoles` response to risk of fish introduction. Oecologia, 134, 270-277.
Vitousek, P. M., Mooney, H. A., Lubchenco, J., Melillo, J. (1997) Human domination of Earth`s ecosystems. Science, 277, 494-499.
Wells, K. (1977) The social behaviour of anuran amphibians. Anim. Behav., 25, 666-693. Wilbur, H.M, Collins, J.P. (1973) Ecological aspects of amphibian metamorphosis. Science,
182, 1305–1314.

STUDIA UNIVERSITATIS BABEŞ – BOLYAI, BIOLOGIA, LII, 2, 2007 (p. 33-43)
THE BREEDING AVIFAUNA OF THE “BREITE PLATEAU” NATURAL RESERVE AND THE SURROUNDING FOREST
COSMIN IOAN MOGA 1,3, KINGA ÖLLERER 2 AND TIBOR HARTEL 3
SUMMARY. This paper presents the breeding avifauna of the Breite plateau in comparison with the breeding avifauna of the surrounding forest, accounting for alpha, beta and gamma diversity. The bird species are considered from the perspective of their feeding habits, nest site selection and protective status. 57 breeding bird species were identified, from which 32 species on the plateau, 46 species in the surrounding forest and 21 species were found breeding in both habitats. Due to its small area and elongated shape, the plateau has a large ecotone and the surrounding forest has a great influence on its avifauna. 21 of the bird species that were found in both habitats are forest species. Only 11 species are breeding exclusively on the plateau and all are open habitat species. 25 species nest exclusively in the forest, indicating again the dominance of forest species over the total species number. The bird species from the two studied habitats belong to five trophic categories, the insectivores being dominant in both cases. The several century-old oaks from the plateau represent important feeding habitats for insectivore birds, especially for the bark-feeders. The cavity nesters are the best represented among the species breeding on the plateau. The open nests builders are best represented among the forest-nesting birds. Those that nest on soil are less represented in both habitats. Out of the 32 species that are breeding on the plateau, six are protected according to the Birds Directive (79/409 EEC), Annex I, emphasizing the conservation importance of the Breite reserve. Keywords: breeding avifauna, woodpasture, forest. Introduction. Forests, woodlands and woodpastures are globally threatened habitats especially
because of forestry, lack of regeneration, continuous expansion of agricultural fields and overgrazing (Wilson et al., 1991; Zack et al., 2002; Goldberg et al., 2007). The majority of these habitats still maintained in Europe have small dimensions, up to 50 ha (Opdam et al., 1984; Bellamy et al., 1996; Hansson, 1997; Goldberg et al., 2007).
“Old” habitats of this kind, with secular trees and an undisturbed vegetation cover, are more structurally heterogeneous and more valuable from the perspective of harbored diversity of organisms. The structural heterogeneity of these habitats and their higher biodiversity is a consequence of a small-intensity anthropic impact and of a moderated disturbance regime that characterized the
1 Babeş-Bolyai University, Biology-Geology Faculty, str. Clinicilor nr. 5-7, 400006 Cluj Napoca,
Romania. [email protected] 2 Institute of Biology - Romanian Academy, Spl. IndependenŃei 296, 060031 Bucharest, Romania 3 Mihai Eminescu Trust, Str. Scolii 2, 545400 Sighişoara, Romania

COSMIN IOAN MOGA, KINGA ÖLLERER AND TIBOR HARTEL
34
interactions between nature and humans in the past (Peterken, 1983). The high structural heterogeneity of these woodpastures is also correlated with their size, the species-area relationship having a major influence on the diversity of occurring bird species (Bellamy at al., 1996; Hansson, 1997). Even trees with a dispersed distribution and coverage of six to ten percent are important for the species diversity, being key elements both at the local and at the landscape level (Manning et al., 2006).
In this paper we present: (1) the breeding avifauna of the Breite plateau, in comparison with the breeding avifauna of the surrounding forest, counting for alpha, beta and gamma species diversity (Whittaker, 1972), (2) the trophic analysis of the avifauna, (3) nest site selection of species, (4) data regarding the protective status of the avifauna from the Breite plateau.
Study area The study area is situated nearby the town of Sighişoara, at a distance of
around 2 km and at an altitude of 504 m in the northern part and 530 m in the southern part of the plateau. Its geographical coordinates are 46°13’05 N and 24°45’18 E in the most northern part and 46°11’03 N and 24°45’14 E in the most southern part.
The Breite reserve (Fig. 1) is a woodpasture, where most of the trees are several century-old oaks (Quercus robur and Q. petraea, hybrids in the majority) that cover around 7 % of the total area (133 ha) of the plateau. On a few smaller patches the tree cover is up to 65 %, these areas having a woodland character. The habitat has anthropic origins, being created in the Middle Ages by the inhabiting Saxon community in order to increase the acorn production. The thinning of the original forest has favored the penetration of mesophilous meadows with Alopecurus pratensis and Sanguisorga officinalis, while the relatively recent (starting from the mid ‘80s) desiccation has led to the expansion of Dechampsia caespitosa. Shrubs are more scarcely present, most of them being Salix spp, Rosa canina and Crataegus monogina individuals.
The plateau has an elongated shape in the north-south direction and its structure is influenced by the surrounding mixed deciduous forest (Quercus petraea and Carpinus betulus with Fagus sylvatica individuals). The hornbeam (Carpinus betulus) invasion, from the surrounding mature forest, is frequent on the plateau, covering around 10 % of it.

THE BREEDING AVIFAUNA OF THE “BREITE PLATEAU” …
35
Fig. 1. Localization and aerial photo of the Breite plateau
COSMIN IOAN MOGA, KINGA ÖLLERER AND TIBOR HARTEL
36
Methods The observations on the avifauna were effectuated in the 2003-2007 period.
The line transect was used in combination with point count observations (Bibby 2000), depending on the accessibility in the field. The observations were done in the morning, immediately after sunrise, until 10.30 a.m. The species were identified visually and based on the singing of males. 37 observations were done both on the plateau (woodpasture habitat) and in the surrounding forest.
The inclusion of birds in different trophic categories was based on the obvious adaptations of the bill and legs, considering the basic trophic regime of the species and not the particular feeding situation during the reproduction period, when most species feed upon resources of animal origin, especially insects.
When analyzing the nest site selection of the different species, we considered three situations: nests built on the ground; nests built on herbaceous vegetation, shrubs, trees, mentioned in the text as open nests; and cavity nests, that were built in hollows, scooped by birds (woodpeckers), or built under the bark of trees or in other cavities (tits).
Regarding the protective status, we noted the breeding bird species that are protected according to the Directive 79/409/EEC (Birds Directive), Annex I.
The species breeding on the plateau and in the forest were coded using binary variables (0 for the absence of breeding species, 1 for presence). The two habitats were compared using Cochran Q Test.
Results and Discussions The avifauna of the Breite plateau in comparison with avifauna of the
surrounding forest. In total, on the plateau and in the surrounding forest, we recorded 57 breeding bird species (gamma diversity) (Table 1, Fig. 2,). Out of these, 21 species (36.84 %) were found nesting both on the plateau and in the surrounding forest. The forest has more breeding species (alpha diversity for the forest = 46) in comparison with the plateau (alpha diversity for the plateau = 32) (Fig. 2,), the differences being significant (Q = 5.44, df = 1, p < 0.01).
Out of the total 57, those 32 species that are nesting on the plateau represent 56.14 %. In this percentage both the exclusive breeders and the species that are breeding in both habitats are included. Other studies revealed similar results. Hansson (1997), recorded 34 breeding bird species in several oak-hazel woodland habitats from Sweden, with sizes of 0,2-12 ha. Brawn (2006), in a oak savanna habitat from Illinois (North America), with canopy closure between 10 % and 70 % (similar to our study site), recorded 31 bird species.
Out of the total 57, 11 species (19.29 %) are nesting exclusively on the plateau. These are open habitat species (see Table 1) and their small number can be explained by the relatively small area of the plateau (133 ha) and especially by its elongated shape, with a small area/edge ratio, between the small interior and the large ecotone. For this reason, the surrounding forest has a major influence on the avifauna of the

THE BREEDING AVIFAUNA OF THE “BREITE PLATEAU” …
37
plateau, the species found in both habitats (21 species, see below) being all forest species, especially forest edge species. Out of the 32 species that are nesting on the plateau, those 11 exclusive breeders represent 34.37 %, and those that are breeding in both habitats represent 65.62 %, being an evidence of the dominance of forest species in the composition of the plateau’s avifauna.
Table 1. The identified bird species, their trophic regime and nesting site selection
Species Breeding
exclusively on the plateau
Breeding exclusively in the surrounding forest
Breeding in both habitats
Trophic regime
Nesting site
Ciconia nigra - * - Zooph. Pol Op
Aquila pomarina - * - R Op
Buteo buteo - * - R Op
Pernis apivorus - * - R Op
Accipiter gentilis - * - R Op
Accipiter nisus - * - R Op
Columba oenas - * - Omn Cav
Columba palumbus - * - Omn Op
Cuculus canorus - * - In Op
Bubo bubo - * - R Gr
Strix uralensis - * - R Cav
Asio otus - * - R Op
Strix aluco - * - R Cav
Upupa epops * - - In Cav
Picus viridis - - * In Cav
Picus canus¹ - - * In Cav
Dendrocopos major - - * In Cav
Dendrocopos syriacus¹ - - * In Cav
Dendrocopos medius¹ - - * In Cav
Dendrocopos minor - - * In Cav
Dendrocopos leucotos - * - In Cav
Dryocopus martius¹ - - * In Cav
Jinx torquilla - - * In Cav
Anthus trivialis - - * In Gr
Motacilla alba * - - In Gr
Lanius collurio¹ * - - Zooph. pol Op
Lanius excubitor * - - Zooph. pol Op

COSMIN IOAN MOGA, KINGA ÖLLERER AND TIBOR HARTEL
38
Table 1 (continued)
Oriolus oriolus - - * In Op
Sturnus vulgaris - - * Omn Cav
Garrulus glandarius - * - Omn Op
Corvus corax - * - Omn Op
Troglodytes troglodytes - - * In Op
Sylvia borin - - * In Op
Sylvia atricapilla - * - In Op
Sylvia curruca * - - In Op
Phylloscopus trochilus - * - In Op
Phylloscopus collybita - - * In Op
Phylloscopus sibilatrix - * - In Op
Ficedula albicollis¹ - - * In Cav
Ficedula parva - * - In Cav
Saxicola rubetra * - - In Op
Saxicola torquata * - - In Op
Phoenicurus phoenicurus - * - In Cav
Erithacus rubecula - * - In Op
Turdus merula - * - Omn Op
Turdus philomelos - * - Omn Op
Parus palustris - - * Omn Cav
Parus coeruleus - - * Omn Cav
Parus major - - * Omn Cav
Aegithalos caudatus caudatus * - - Omn Op
Aegithalos caudatus europaeus * - - Omn Op
Sitta europea - - * In Cav
Certhia familiaris - * - In Cav
Passer montanus * - - Omn Op
Fringilla coelebs - - * Veg Op
Coccothraustes coccothraustes - - * Veg Op
Carduelis chloris * - - Veg Op
Total 57 species 11 25 21 Abbreviations: R = raptor, Zooph. pol = zoophagous polyphagous, In = insectivores, Omn = omnivores, Veg = vegetarians; Gr = nest on the ground, Op = open nests, Cav = cavity nests. Species marked with ¹ are protected according to Birds Directive, Annex I.

THE BREEDING AVIFAUNA OF THE “BREITE PLATEAU” …
39
57
32
46
21
11
25
0
10
20
30
40
50
60
Total
no. of s
pecie
s
Total
no. of s
pecies o
n the
platea
u
Total n
o. of s
pecies
in th
e fore
st
No. of s
pecies c
omm
on fo
r both
hab
itats
No. of s
pecies b
reed
ing e
xclusi
vely
on th
e pl
ateau
No. of s
pecies
bre
eding
exclu
sively
in th
e fore
st
Fig. 2. The total species number and their number in the studied habitats
46 out of the 57 species that are nesting in the surrounding forest represent
80.70 %. In this percentage both the species that are nesting exclusively in the forest (see below) and the species that are nesting in both habitats (21 species) are included. At the landscape level, the forest species are more abundant in number because of the large area of the surrounding forest (in comparison with the studied woodpasture) and its heterogeneity. Laiolo (2002) showed that natural, mature forests are habitats that contribute to the maintenance of a high biodiversity level. Out of the total 57, 25 (43.85 %) species are nesting exclusively in the forest; this is a much higher percentage than that of the species that are exclusive breeders on the plateau, which, again, emphasizes the dominance of forest species in the total number of species. From the 46 species that are nesting in the forest, those 25 species that are nesting exclusively in this habitat represent 54.34 % and the 21 species that are breeding in both habitats account for 45.65 %.

COSMIN IOAN MOGA, KINGA ÖLLERER AND TIBOR HARTEL
40
The beta species diversity for the two habitats is 36 (11 species that are exclusive breeders for the plateau + 25 species breeding only in the forest).
Trophic analysis of the avifauna: The bird species from the studied habitats
belong to five trophic categories, the insectivores being dominants in all cases (Table 2). The insectivores are the most abundant (71.42%) among the 21 species that are breeding in both habitats. Among the 32 species that are breeding on the plateau, the insectivores are again well represented (62.5%), while among the 46 species that breed in total in the forest, the insectivores account only for 52.17%. Among the 11 species nesting exclusively on the plateau the insectivores represent 45.45%, while among the 25 exclusive forest nesters they represent only 36%. In a study on the avifauna of several habitats on the Mediaş table-land (1000 Km²), that includes also the Breite plateau, only 16 insectivore bird species were found in the open habitats (Moga 2005), less than in the present study, although the area studied then was much larger. These results are explained by the presence on the Breite plateau of birds that belong to the surrounding forest habitats (see Table 1). Besides the nesting sites they provide, the several century-old oaks represent a food resource for the birds, especially for the insectivores, being key habitats for the maintenance of the bird species diversity in the woodpasture (Manning et al., 2006). Among the insectivores, the best represented are the bark-feeders (see Table 1). Out of the 10 woodpecker species that are nesting in Romania, 9 species were found nesting on the plateau and in the surrounding forest (see Table 1). Only Picoides tridactylus is missing, but this is a mountain spruce forest species. Globally, the insectivores, most of them migratory species, show the largest fluctuations in density and are also the most exposed to extinction risk (Newton, 2004).
Raptors are nesting only in the forest, the area of the plateau being too small and the anthropic disturbance too large (Moga, pers. comm.) in comparison with the nesting necessities of these species. The omnivores are the best represented among those 11 species that are nesting exclusively on the plateau (27.27%). The other trophic categories are more weakly represented in number (see Table 2).
By its setting, being surrounded by mature deciduous forests, the Breite plateau creates spatial heterogeneity at the landscape level, being of interest not only for the bird species nesting on the plateau, but also for the birds with double territory, like the small and medium sized raptors, for which it represents a feeding territory (Moga, 2005). The big raptors, ex. Aquila pomarina, do not use the habitat for feeding, because of its small area. This species can be seen here only accidentally; although it is nesting in the forests that surround the plateau, it prefers the larger, opened areas of the Şaeş Valley, at about 2 km distance from the plateau. At the landscape scale, the support capacity of an area for raptors is given by the existence of two types of resources: feeding and nesting sites. The decrease of one of these two resources results in a decrease of the raptor population (Newton 2002).

THE BREEDING AVIFAUNA OF THE “BREITE PLATEAU” …
41
Table 2. Trophic analysis of the breeding avifauna of the two habitats
Total no. of
species breeding on the plateau
No. of species breeding exclusively on the plateau
Total no. of species breeding in the forest
No. of species breeding exclusively in the forest
No. of species breeding in both habitats
Total no. of species
32 11 46 25 21
Raptors
0 0 9 (19.56%) 9 (36%) 0
Zoophagous polyphagous
2 (6.25%) 2 (18.18%) 1 (2.17%) 1 (4%) 0
Insectivores
20 (62.5%) 5 (45.45%) 24 (52.17%) 9 (36%) 15 (71.42%)
Omnivores
7 (21.87%) 3 (27.27%) 10 (21.73%) 6 (24%) 4 (19.04%)
Vegetarians 3 (9.37) 1 (4.34%) 2 (4.34%) 0 2 (9.52%)
Table 3. Analysis of bird species breeding in the two habitats according to the nest site selection
Total no. of
species breeding on the plateau
No. of species breeding exclusively on the plateau
Total no. of species breeding in the forest
No. of species breeding exclusively in the forest
No. of species breeding in both habitats
Total no. of species
32 11 46 25 21
Nest on the ground
2 (6.25%) 1 (9.09%) 2 (4.34%) 1 (4%) 1 (4.76%)
Open nests 15 (46.87%) 9 (81.81%) 23 (50%) 17 (68%) 6 (28.57%) Cavity nests 15 (46.87%) 1 (9.09%) 21 (45.65%) 7 (28%) 14 (66.66%)
Breeding site selection: Among the 21 species that are nesting in both
habitats, the cavity nesters represent 66.66% (Table 3). Also, these are well represented (46.87%) among the 32 species that are nesting on the plateau. The structural heterogeneity of the surrounding mature forest, together with the several century-old hollowed oaks from the plateau, offer various nesting sites for those in search of cavities. There is a positive correlation between the species diversity, species richness, the number of hollow nesters, the number of species from the forest interiors and the forest age (Laiolo 2002).
The species that build open nests are more abundant (50%) in the forest habitat. Those that are nesting on soil are weakly represented in both habitats (Table 3).
The protective status of the avifauna. Out of the 32 species that are
breeding on the plateau, six are protected according to the Birds Directive (79/409

COSMIN IOAN MOGA, KINGA ÖLLERER AND TIBOR HARTEL
42
EEC), Annex I (see Table 1), representing 3.42 % of the total number of species protected according to this directive at European level. Considering the relatively small area of the plateau, we believe that the species that are categorized as important, based on their protective status, are well represented among the overall avifauna.
Conclusions Because of the small size, elongated shape and large ecotone of the area,
the composition of the plateau’s avifauna is strongly influenced by the surrounding forest, only 11 species (19.29 % out of the total 57 species) being exclusive breeders for the plateau, all of them open habitat species. The 21 species that were found breeding in both habitats represent 36.84 % of the total 57 species; all of them forest habitat species. 25 species (43.85 %) are exclusive breeders for the forest.
The bird species from the two studied habitats belong to five trophic categories, the insectivores being dominant in both cases. The several century-old oaks represent important feeding habitats for the insectivore birds, especially for the bark-feeders.
Cavity-nesters are the best represented as percentage (46.87%) among the 32 species that are nesting on the plateau. The species that build open nests are the best represented (50%) among the forest nesting species. Those that are nesting on the ground are weakly represented in both habitats.
Out of the 32 bird species breeding on the plateau, six are included in the Birds Directive (79/409 EEC), Annex I, the plateau holding a relevant number of species of conservation interest.
Acknowledgments. We are grateful to Mihai Eminescu Trust for the financial support of the present
research and also to Alin David (“Babes-Bolyai” University, Cluj-Napoca) for the useful information provided.
REFERENCES
Bellamy, P. E., Hinsley, A. H., Newton, I. (1996) Factors influencing bird species numbers in small woods in south-east England. J Appl Ecol, 33, 249-262.
Bibby, C. J., Burgess, N. D., Hill, D. A., Mustoe, S. (2000). Bird census techniques. Second Edition, Academic Press, London.
Brawn, J. D. (2006) Effects of restoring oak savannas on bird communities and populations. Conservation Biology, 20, 460-469.
Goldberg, E., Kirby, K., Hall, J., Latham, J. (2007) The ancient woodland concept as a practical conservation tool in Great Britain. J Nature Conservation, 15, 109-119.
Hansson, L. (1997) Environmental determinants of plant and bird diversity in ancient oak-hazel woodland in Sweden. Forest Ecol Management, 91, 137-143.
THE BREEDING AVIFAUNA OF THE “BREITE PLATEAU” …
43
Laiolo P., (2002) Effects of habitat structure, floral composition and diversity on forest bird community in north-western Italy. Folia Zoologica, 51(2), 121-128.
Manning, A. D., Fischer, J., Lindenmayer, D. B. (2006). Scattered trees are keystone structures-Implications for conservation. Biol Conserv., 132, 311-321.
Moga, C. I. (2005) Study of the avifauna of the Medias plateau. Scripta Ornitologica Romaniae, 2, 26-37.
Newton, I. (2002) Population limitation in birds of prey: a comparative approach. In: Perrins C. M., Lebreton J.- D., Hirons G. J. M. (Eds.), Bird Population Studies. Oxford University Press, pp. 3-21, New York.
Newton, I. (2004) Population limitation in migrants. Ibis, 146, 197-226 Opdam, P., van Dorp, D., Ter Braak, D. J. F. (1984) The effect of isolation on the number of
woodland birds in small woods in the Netherlands, J Biogeogr, 11, 473-478. Peterken, G. F. (1983) Woodland conservation in Britain. In A. Warren and F. B.
Goldsmith (Eds), Conservation in perspective. Chichester: Wiley, pp. 83-100. Whittaker, R. H., (1972) Evolution and measurement of species diversity. Taxon, 21, 213-251. Wilson, R. A., Manley, P., Noon, B. R. (1991) Covariance patterns among birds and
vegetation in a California oak woodland. USDA Forest Service General Technical Report PSW 126, 126-135.
Zack, S., Chase, M. K., Geupel, G. R. (2002) The oak woodland bird conservation plan: a strategy for protecting and managing oak woodland habitats and associated birds in California. USDA Forest Service General Technical Report PSW-GTR-184, 845-846.

STUDIA UNIVERSITATIS BABEŞ – BOLYAI, BIOLOGIA, LII, 2, 2007 (p.45-61)
===REVIEW ===
CAROTENOIDS IN BIRDS’ LIFE
CRISTINA BERCIU 1 AND ALIN DAVID 1
SUMMARY. Carotenoid pigments are biologically active, fat-soluble compounds that are responsible for red, orange and yellow secondary sexual coloration in many animal species. Besides, they act as antioxidants and stimulate various aspects of immune function, detain photoprotective activities, enhance motor performance and cognition, and improve intercellular (gap-junctional) communication. Carotenoid availability may be physiologically limiting, because animals cannot synthesize carotenoids de novo, and they must obtain them through diet, but also because there may be trade-offs in the allocation of carotenoids between competing somatic demands such as sexual display and other functions. Unfortunately, all these aspects, and functions, essential for the individuals themselves and their offsprings, too, are insufficient or less known. According to the previous studies, this paper is a review concerning the essential information accumulated over the past years which may catalyze future lines of research on the profile and functions of carotenoids in birds (in different moments of their life and in different structures), and finally, the possibility to use the useful information to the bird’s benefit. Keywords: antioxidant, carotenoids, immunostimulatory, intercellular communication, motor performance, sexual coloration
Introduction Among the various pigments which are involved in ornamental colors in birds,
the carotenoids have a special, major role. Carotenoids are the second most prevalant pigment in the avian integument (melanin being the first). They are an extremely large and diversified group of lipid-soluble hydrocarbons, and are responsable for red, orange and yellow secondary sexual coloration of the plumage, and also of the skin, scales, beaks, combs, wattles, and eyes round out the avian integumentary tissues.
Birds cannot synthetize carotenoids de novo (because they lack the enzyme to manufacture carotenoids from the precursors of these ones), so they have to obtain the necessary carotenoids through their diet (consuming algae, fungi, plant parts, insects, crustaceans, vertebrates which contain these pigments), while some others are produced through the metabolism of certain carotenoids in their diet (Brush, 1990; Moller et al., 2000). Thus, many of the carotenoids found as plumage, leg and beak colorants are not present in the diet. These metabolic processes are thought to factor prominently into information content, signal function and evolutionary history of carotenoid-based ornamental coloration.
1 Faculty of Biology and Geology, “Babeş-Bolyai” University, 400006 Cluj - Napoca, Romania E-mail: [email protected], [email protected]
CRISTINA BERCIU AND ALIN DAVID
46
The mechanisms of the absorbtion from food, circulation and tissue storage of carotenoids are incompletely known, but, so far, it is very well known that the intestinal absorbtion of carotenoids involve some special receptors of the enterocytes at the level of duodenum, jejunum and ileum. Once they are retrieved from food and fractioned with lipids (as micelles) in the intestinal mucosa, carotenoids are packaged into chylomicron fractions and enter the lymphatic system, where they are incorporated into lipoproteins that circulate through the bloodstream (Williams et al., 1998).
Intraspecific differences of the carotenoids in plasm and skin are induced by the geographic and temporally differences concerning the food quality (dietary availability of carotenoids) of populations belonging to a species (Partali et al., 1987; Hill, 1993; Linville and Breitwisch, 1997; Negro and Garrido-Fernandez, 2000).
Sex diferences in carotenoid circulation are not a function of diet, but instead likely come under physiological control, through the action of lipoproteins and such sex-steroid hormones and testosterone, as well as the need for females to shunt carotenoid pigments to egg yolk (Blount et al., 2000; Hill, McGraw, 2006).
Carotenoids accumulate at highly variable concentration in the serum of the wild birds (0,5-75 µg/ml). Thus, in an ecological and evolutionary comparative analysis of 80 species, the best predictors of plasma carotenoid concentration were diet, extend of carotenoid-based plumage, body mass. Species with the highest carotenoid values that fed on predominately plant-based diets, exibited more plumage are that was pigmented with carotenoids and tended to be smaller (Tella, 2004; Hill and McGraw, 2006).
Having absorbed the carotenoids from the intestinal lumen, they will be transported to different tissues and metabolized. Liver is the most important organ involved in the metabolism of these pigments (Brush, 1990), but, also the small intestine, kidneys and lungs. At the level of all these organs, carotenoids are converted to pro-vitamin A (Wiss, 2004). A few data support the idea that birds make their colorful display carotenoids in the liver. But, there are a lot of studies which demonstrated that metabolically derived carotenoids present in the feathers and bare parts are not found in the liver or serum of these birds, they being produced in maturing feather folicles or beak/leg keratinocytes (McGraw, 2004). Very often, birds do not metabolize carotenoids for coloration purposes and, instead, directly deposit dietary and serum carotenoids into feathers and bare parts, because the process of carotenoids’ metabolization needs a lot of energy (Hill and McGraw, 2006). In other cases, only one sex (typically the male) is capable of metabolizing carotenoids (Hill and McGraw, 2006).
Carotenoids procured from the diet will be delivered (metabolized or unmetabolized) by blood circulation to different tissues and organs. But, so far, there are just a few studies concerning the differences between the storage preferences of these pigments and species or type of carotenoid.
Storage of the carotenoids is characteristic especially for the feathers, skin, adipose tissue, liver, egg yolk, retina and ovary (ovaries are said to contain about half of the body’s carotenoid reserves in female). Testes, semen, heart, kidney, breast/leg

CAROTENOIDS IN BIRDS’LIFE
47
muscles, bile and lung also house measurable amounts of carotenoids. Some carotenoids may cross the blood-brain barrier. So, these pigments can be detected at the level of the nervous tissue, where they are involved in very important processes (protect neurons from oxidative damage induced by free radicals which are produced as a consequence of the fat acids’ metabolism, slow the rate of apoptosis of neurons, enhance cellular signaling and transcriptional regulation, improve temporal and spatial memory, enhance motor performance or cognition (Sumien et al., 2004).
So far, there is no evidence that a certain type or types of carotenoid(s) are allocated to one or a few tissues. (Hill and McGraw, 2006). Tissue levels of carotenoids may depend on the amounts of these pigments in diet, and also on total tissue mass. For example the highest concentrations of carotenoids in adipose tissue is correlated with the smallest fat stores (Negro et al., 2001).
Besides, it could be noticed many sex differences in internal-tissue carotenoids (Negro et al., 2001). Many monogam species are characterized by males with a brighter carotenoid-based coloration than do females. There may be other important reasons why individuals and species vary in their ability to endogenously store and retrieve carotenoids from the tissues.
So far, there are many studies which demonstrated the existence of differences between bird species concerning their capacity to accumulate and mobilize tissue carotenoid repositories for self or offspring defense from oxidative damage. The most stable amounts of carotenoids are those in liver. Carotenoids in liver may be a mobilizable, expendable pool of carotenoids for use during infectious challenges, although, usually, they are more stable and required for local cell and tissue maintenance (Koustos et al., 2003b).
Functions of carotenoids. Carotenoid storage (as they are found in food or
metabolized) at the level of different tissues is correlated with the numerous functions which they have: create the ornamental coloration in birds, act as antioxidants, stimulate various aspects of immune function, guarantee a photoprotection, stimulate the cellular diferentiation and communication.
As we already mentioned, carotenoids can be incorporated into several different tissue types to give birds external colour, which are very important in sexual behavior and selection. Besides, recent researches noted that carotenoid-based feathers reflect a substantial amount of ultraviolet light (Hill and McGraw, 2004). In the beginning, it is thought that carotenoids are responsable to give the external color of feathers, skin, scales, beaks, combs, wattles and eyes round out the avian integumentary, but, later, Olson and Owens (2005) showed that carotenoid pigmentation is typical for bird plumage, but the use of these pigments in bare part pigmentation may have a different functional basis and may be more strongly influenced by genetic and physiological mechanisms, which currently remained relatively understudied.

CRISTINA BERCIU AND ALIN DAVID
48
Carotenoids are coloured pigments because of their conjugated double-bound system, known as the “ chromophore”, which absorbs particular wavelengths of light and gives colour to the molecules based on the degree of conjugation in the hydrocarbon chain and end-rings. Molecules with more conjugated double bonds absorb more short wavelengths of light and thus are redder in colour.
Some carotenoids (astaxanthin, cantaxanthin, adonirubin, α-doradexanthin) confere a red colour of the tissues or structures, while others, more exactly: xanthophylls (lutein, zeaxanthin and canary xanthophylls) co-ocur in yellow tissues. Involving of carotenoids in appearance of yellow colour is bigger than in red colour (Olson and Owens, 2005). Always, more than a single carotenoid type typically appears in any given integumentary tissue in birds. For example, red feathers and bare parts often house a collection of 4-oxocarotenoids, and the canary xanthophylls co-occur in yellow tissues. There is some exceptions to this rule, of course. Lutein is the lonely colorant of yellow feathers in songbirds (Hill and McGraw, 2006). Carotenoid colors can not only affected by the types, amounts and ratios of carotenoid pigments that occur in the integument, but also by their co-occurrence with other types of pigments or structural mechanisms and by the nature of their physical interactions with tissues (Hill and McGraw, 2006).
The table bellow (Table 1) reflects the bird species in our country for which carotenoids have been identified from colorful feathers and bare parts.
Table 1.
Bird species also found in Romania for which carotenoids have been identified from colorful feathers and bare parts (modified from Hill and McGraw, 2006)
Order/ Family
Species Trait Major carotenoids
Mallard (Anas platyrhynchos) Orange tarsi 1, 2, 4, 12, 15a Anseriformes Greylag Goose (Anser anser) Orange tarsi 3, 4, 12b
Falconiformes Egyptian Vulture (Neophron percnopterus)
Yellow facial skin 1
Domestic Chicken (Gallus gallus)
Red comb Yellow tarsi
1, 4, 12b
1, 2, 3, 4, 12, 15b Wild Turkey (Meleagris gallopavo)
Red comb Orange-brown tarsi
3, 4, 12b
1, 2, 3, 4b
Grey Partrige (Perdix perdix) Orange-brown tarsi 1, 3, 12, 15 Ring-necked Pheasant (Phasianus colchicus)
Orange-brown tarsi Red facial comb
1, 3, 12, 15 12
Galliformes
Capercaillie (Tetrao urogallus)
Red supraocular comb 1, 2, 12, 14

CAROTENOIDS IN BIRDS’LIFE
49
Table 1 (continued) Order/ Family
Species Trait Major carotenoids
Ciconiiformes White Stork (Ciconia ciconia) Red bill and tarsi 12 Great Spotted Woodpecker (Dendrocopos major)
Red plumage 12, 13, 14
Three-toed Woodpecker (Picoides tridactylus)
Yellow plumage 1, 2
Piciformes
Green Woodpecker (Picus viridis) Yellow plumage Red plumage
1, 2, 22, 24 12, 13, 14, 15
Passeriformes/ Corvidae
Golden Oriole (Oriolus oriolus) Yellow plumage 1, 2
Passeriformes/ Bombycillidae
Bohemian Waxwing (Bombycilla garrulus)
Yellow tail band 6, 7
Passeriformes/ Muscicapidae
Robin (Erithacus rubecula) Orange plumage 1, 10
Passeriformes/ Sittidae
Wallcreeper (Tichodroma muraria) Red plumage 12
Great Tit (Parus major) Yellow plumage 1, 2 Passeriformes/ Paridae Blue Tit (Parus caeruleus) Yellow plumage 1, 2 Passeriformes/ Aegithalidae
Long-tailed Tit (Aegithalos caudatus) Pink plumage 16
Passeriformes/ Regulidae
Goldorest (Regulus regulus) Yellow plumage Red plumage
1, 2 12, 13, 14
Passeriformes/ Passeridae
Yellow Wagtail (Motacilla fiava) Yellow plumage 1, 2
Chaffinch (Fringilla colebs) Yallow plumage 1, 2 Brambling (Fringilla montifringilla) Yellow plumage 1 Eurasian Bullfinch (Pyrrhula pyrrhula)
Red plumage 12, 13, 14, 15, 21
Red Crossbill (Loxia curvirostra) Yellow plumage (f) Red plumage (m)
6, 7 16, 19, 20
Citril Finch (Serinus citrinella) Yellow plumage 6, 7 European Serin (Serinus serinus) Yellow plumage 6, 7 European Greenfinch (Carduelis chloris)
Yellow plumage 1, 6, 7
Common Redpoll (Carduelis flammea)
Red plumage 12, 14, 15, 16
Linnet (Carduelis cannabina) Red plumage 12, 14, 15, 16
Passeriformes/ Fringillidae
Hoary Redpoll (Carduelis bornemanni)
Red plumage 12, 14, 15, 16, 19
Passeriformes/ Emberizidae
Yellowhammer (Emberiza citrinella) Yellow plumage 1, 2
Passeriformes/ Icteridae
Eurasian Blackbird (Turdus merula) Orange-yellow bill 1, 2, 3, 4, 5
Notes: f-female; juv-juvenile;m-male; 1-lutein; 2-zeaxanthin; 3-β-cryptoxanthin; 4-β-carotene; 5-α-carotene; 6-canary xanthophylls A; 7- canary xanthophylls B; 8- canary xanthophylls C; 9- canary xanthophylls D; 10-3’dehydrolutein; 11-2’, 3’-anhydrolutein; 12-astaxanthin; 13- α -doradexanthin; 14-adonirubin (phoenicoxanthin): 15-canthaxanthin; 16-3-

CRISTINA BERCIU AND ALIN DAVID
50
hydroxy-echinenone; 17-echinenon; 18-rhodoxantin; 19-4-oxo-rubixanthin; 20-4-oxo-gazaniaxanthin; 21-papilioerythrinone; 22-7,8-dihydrolutein; 23-7, 8, 7’, 8’-tetrahydro-zeaxanthin; 24-7,8-dehydro-β-cryptoxanthin.
a) Astaxanthin and β-carotene were found in captive birds only. b) Only captive birds were studied. c) Accompanied by an unidentified carotenoid. d) Canary xanthophylls are the naturally occurring yellow feather pigments, but by
adding the berries of an introduced honeysuckle to their diet, waxwings obtain rhodoxanthin that gives feathers their orange coloration.
e) Carotenoids are only found in red feathers. Yellow border is colored by melanin. f) Yellow plumage is not created by the presence of carotenoid or melanin pigments,
but by an as-of-yet unidentified type of pigment. g) Red plumage gets its color from the means by which the canary xanthophylls are
bound to feather keratin.
The process of carotenoid incorporation into the tegument is thought to begin by passive lipid diffusion into maturing cells, such as the skin keratinocytes and feather follicles (Lucas and Stettenheim, 1972). These lipids acumulate in the cell in lipoidal droplets that ultimately provide nourishment as well as lipophilic pigments to the growing feather germ (Menon and Menon, 2000).
There are several physiological parameters that may influence carotenoid accumulation in the body and thus colour intensity. These include: absorbtion of carotenoids in the gut, transport of carotenoids bound to lipoproteins through bloodstream, uptake of circulating carotenoids by maturing feathers, and metabolism of carotenoids at feather follicles. So far, there is evidence in birds that both carotenoid aquisition and certain aspectsof carotenoid utilisation (e.g., lipo-protein production) can regulate color expression among individuals within a given species, but more studies are needed to discern the strength and ubiquity of nutritional and physiological effects on carotenoid colour across bird taxa (Hill and McGraw, 2006).
Concerning the colour differences of the integument or integumentary structures in different regions of the bird’s body, the studies showed that this is the responsability of certain binding proteins that shuttle carotenoids intracellularly to be incorporated into specific tissues, at specific times (Brush, 1990; McGraw et al., 2003).
The mechanism for the colour change has yet to be determined and may involve feather soiling or wear, pigment degradation, or feather degradation by bacteria (Shawkey and Hill, 2004). McGraw et al., (2003b) showed that beyond the spatial and temporal specificity of carotenoid accumulation in avian integumentary tissues, these tissues can also preferentially target certain carotenoids.
The intensity of colour induced by carotenoids in birds (both in males and females) has very deep influences on the vitality and surviving capacity of the individuals, on reproductive behavior (choosing the mate before laying the eggs), and also on the quality, value of the eggs, and finally on some characteristics of the offsprings. Nowadays, it is known that biochemical strategies for developing sexually

CAROTENOIDS IN BIRDS’LIFE
51
selected carotenoid coloration can follow one of two alternate routes: the accumulation of as many types and amounts of carotenoids as possible, or the preferential accumulation of one or a few particularly chromatic forms. But, to understand all these aspects concerning the ornamental colours in birds, first, we have to mention some very important roles of carotenoids, more exactly antioxidant and immune functions.
Carotenoids are known as "sacrificial" antioxidants. In other words,
carotenoid molecules are not regenerated like other antioxidants, and are degraded in the process of neutralizing free radicals or reactive oxygen species. (Tsuchiya et al., 1994). Thus, carotenoids are capable to protect DNA, proteins and lipids from oxididation, and thereby guaranteing antioxidant protection of the cell membranes and antibodies (Edge et al., 1997). These functions can be noticed and are very important both at the level of adults which take these carotenoids from the diet, and at the level of the yolk, and embryonic tissues, where the rapid cell division, and the rate of metabolic events induce a high level of oxidative stress. This oxidative stress continue a rather long time at the level of offspringt, too (Surai et al., 2001). Since the ability of carotenoids to quench singlet oxygen increases with their maximum absorbtion wavelength, redder carotenoids may provide a more efficient antioxidant defence (Edge et al., 1997).
In vitro studies have revealed that free radical trapping activity is most efficient when certain combinations of antioxidants are involved (Bohm et al., 1997) or within certain rangers of carotenoid concentration and partial oxygen pressure (Burton and Ingold, 1984). Domestic hens caracteristically have an antioxidant activity which depends on the type of carotenoids in their diet correlated with their interaction with antioxidant vitamines. But, so far it is not known yet the way in which these interactions affect the levels and proportions of carotenoids, and also their activity in the yolk (Tengerdy et al., 1990).
Transfer of the antioxidant carotenoids from the mother to the yolk and then to the specific embryo tissues are extremely important becauce, finally these carotenoids confer an antioxidant and immune protection to the offsprings (Young and Lowe, 2001; Blount et al., 2002; Surai, 2002). Metabolic activity of the birds’ embryos is very intensive and produce a large number of free radicals. Besides, embryo tissues contain a high level of unsaturated lipids which are extremely susceptible to the oxidative damages. All these aspects request the antioxidant intervention of the carotenoids during this period of life in birds (Surai et al., 2001).
Most of the recent attention to the mechanisms and functions of internal-tissue carotenoids in birds has been placed on developing young, particularly in such precocial species. In their earliest stages of development, embryos are exposed to and assimilate high concentrations of carotenoids in yolk that represent nearly 50% of their mothers’ liver stores. Neonates transfer maternally derived carotenoids from yolk to their tissues during development and retain high levels at and after hatching; the liver is the most carotenoid-enriched tissue of newly hatched individuals (Surai et al., 2001). Liver-carotenoid levels are known to rapidly decline within 2 weeks

CRISTINA BERCIU AND ALIN DAVID
52
post-hatch, but some researches has estimated that nearly one-quarter of all liver carotenoids in a 4-week-old chick are still from the yolk (Koustos et al., 2003a). These maternal carotenoids have been showed to protect cells from oxidative damage. Thus, mothers can adaptively boost offspring protection from free radicals (for a long period of time) by allocating carotenoids to yolk (Blount et al., 2000).
Carotenoids guarantee the antioxidant protection of the ovules, in females, but, high levels of carotenoids at the level of testes and semen, in males, demonstrate that they are also involved in antioxidant protection of the spermatozoa, too.(Blount et al., 2001; Hill and McGraw, 2006).
Comparative studies concerning the effects of carotenoids at the level of the males and females are insufficient, but it seems that the lack of these compounds is more important for the last ones. Maternal supplies of liophilic antioxidants can be limiting for egg production in birds (Lin et al., 2002; Surai, 2002; Blount et al., 2004). The quality of the eggs seems to be seriously affected by the carrotenoid in diet. Antioxidant supply may also limit sperm quality, because sperm are particularly susceptible to oxidative damage (Blount et al., 2001; Peters et al., 2004). But, this aspect requests more studies, because, for example, in Taeniopygia guttata a lack of carotenoids seems not to affect spermatogenesis at all (Birkhead et al., 1999).
Immunostimulatory function is another extremely important function of carotenoids in birds. Most of the attention to the antioxidant role of carotenoids has centred on their protection of the immune system, due to the inactivation of free radicals produced during immune-cell activation and proliferation (Moller et al., 2000; Hughes, 2001). Thymus, bursa and spleen are now recognized as important carotenoid reservoirs in young birds (Koustos et al., 2003a and b). In young chicks, levels of carotenoids in these tissues are differentially sensitive to dietary and/or maternal carotenoid sources. (Koustos et al., 2003a) and to the immune demands of individuals (Kousta, 2003b). For example, thymic carotenoid levels responded to the dietary intake in dose-dependent fashion, whereas bursal carotenoids did not. Instead, bursal carotenoids were proportionally and highest when dietary carotenoids are low, suggesting that bursa receives priority in carotenoid accumulation when dietary provisions are low (Koustos et al., 2003 b).
In Larus fuscus, experimentally, it could be noticed that a dietary carotenoid supply enhances the plasmatic antioxidant activity and immunde defence. These birds have a decreased level of immunoglobulines, which theoretically, could guarantee a better health, which could allow a better feeding which would be better for the individuals themselves, and for their offspring (Blount et al., 2002a).
Lozano (1994) noticed that birds may face a trade-off when allocating carotenoids acquired from the diet to physiological and coloration purposes, and only the highest-quality individuals (those who aquire the most carotenoids or are in the best health-state) can devote more to the integument for advertisement.
One hypothesis for why females, in many bird species, frequently prefer to mate with the most elaborately ornamented males predicts that availability of

CAROTENOIDS IN BIRDS’LIFE
53
carotenoid pigments is a potentially limiting factort for both ornament expression and immune function. An implicit assumption of this hypothesis is that males that can afford to produce more elaborate carotenoid-dependent displays must be healthier individuals, with superior immunocompetence. However, whether variation in circulating carotenoid levels causes variation in both immune function and sexual atractiveness has not been determined in any species, the studies of Blount et al. (2003) showed that manipulation (improving) of dietary carotenoid supply invokes parallel changes in cell-mediated immune function and sexual atractiveness in male zebra finches (Taeniopygia guttata).
Recent correlational and experimental studies provide some support for the notion that carotenoid colours honestly signal immune capacity, but this notion is by no means universally accepted, and more work is needed on free-ranging birds to better understand carotenoid allocation to body maintanance versus sexual ornamentation. Moreover, depending on the type or concentration of carotenoids, these molecules can also have positive gene-regulatory effects on immune function (e.g., via gap-junctional communication) or detrimental pro-oxidant effects on cells and tissues in the body (Hill and McGraw, 2006).
Carotenoid pigments (modified or native) are deposited into egg yolk by female birds, but little is known of the ecological regulation of this process. Some supplies of carotenoids deposited into yolk could have been derived from body stores (body fat, liver, integument) rather than metbolic transformation. However, the generality of this potential mechanism is uncertain, because body stores of carotenoids are insufficient to meet the demands of egg production in domestic hens, and a decline in female integument pigmentation at the time of egg production has been reported in various wild bird species (Burley et al., 1992; Blount et al., 2002a).
Alternatively, the profile of carotenoids deposited into yolk may directly reflect the relative proportions of carotenoids in the maternal diet, although this correlation is not always available (Partali et al., 1987). But, an experimental approach is required to better understand the relatioship between diet and yolk carotenoid composition in wild birds.
Unfortunately, so far, the relative importance of pigment aquisition and utilization at the level of the egg yolk (i.e. physiological discrimination: differential uptake, transport, deposition or metabolic conversions) is poorly understood.
Nowadays, the qualitative differences between the carotenoid profile of egg yolk are intensively investigate (Verboven et al., 2005). Egg development and deposition of different carotenoids at the level of the yolk expend a lot of energy. Aquisition, maternal selective uptake, transport, deposition or metabolic transformation of ingested carotenoids regulate the pattern of yolk enrichment are far less than completely efficient. (Hill, 2000; Blount et al., 2002; 2004; Hill et al., 2002).
At least two proximate sources of between female variation in egg quality can be hypothesised. First, egg quality could be determined by female quality. Maternal age, mass and size generally explain statistically significant, but small

CRISTINA BERCIU AND ALIN DAVID
54
proportions of the variation in egg size (Christian, 2002). The concentration of yolk carotenoids has been shown to be affected by the infection status of the mother (Saino et al., 2002), and to covary with her carotenoid-based integument coloration (Blount et al., 2002). Second, environmental effects such as food supply (Blount et al., 2002) or ambient temperature (Saino et al., 2004) may also influence egg quality, tough results for egg size are inconsistent (Christians, 2002).
There are a lot of significant differences between domestic hens and wild birds concerning the transfer from the diet into the egg yolk. For example, domestic hens characteristically transfer certain carotenoids from the maternal diet into eggs more efficiently than others and can metabolically transform certain carotenoids before deposition into yolk (Hencken, 1992). Domestic hens seemed to asimilate cantaxanthine more efficiently than zeaxanthine (Hencken, 1992), while in Larus fuscus the transfer of beta-carotene into the yolk is extremely efficient (Blount et al., 2002a). This explains partially the differences between proportions of carotenoids in yolk.
Differential allocation in relation to the attractiveness of the male partner may be another very important cause of variation among females in egg quality (Burley, 1986). Males which are more intense carotenoid-based coloration have superior foraging success for carotenoids (Hill, 2002), and work harder to provision mates or nestlings (Linville et al., 1998; Senar et al., 2002). For example, a cross fostering experiment using blue tits (Cyanistes caeruleus), showed that chick growth was related to the plumage yellowness of the foster father but not to that of the genetic parent (Senar et al., 2002). Correlation studies in Cardinalis cardinalis have shown that individuals with greater carotenoid pigmentation work harder at nestlings (Linville et al., 1998). Therefore, it is worth the female investing more in current reproduction if her mate is attractive, because the value of offspring will be higher, although, sometimes it could be notice some exceptions from this rule (Sheldon, 2000).
Studies in Cyanistes caeruleus showed that body size, age and carotenoid-based plumage coloration may also be used by females as indicators of male quality . Indeed, larger and older males have more success in siring extra-pair young. (Delhey et al., 2003). As for carotenoid-based coloration, in Parus species, the main source of carotenoids are caterpillars, thus a brightly carotenoid-coloured individual may signal its ability to find these caterpillars. (Partali et al., 1987).
Besides, at Cyanistes coeruleus, the yolk colour was correlated with laying date and yolk mass. Though the effect of laying date could not be explain by ambient temperature during egg formation, it suggests a proximate constraint of general carotenoid availability on yolk composition (Szigeti et al., 2007).
It seems that factors predicting egg size were different from those predicting yolk colour. Carotenoid content is not necessarly proportionate to egg size, suggests that maternal effects occurring during egg production can not be estimated only by egg size (Royle et al., 2003; Szigeti et al., 2007).
Effects of poor neonatal nutrition on adult reproductive performance were studied by Blount et al. (2006) who noticed that this kind of nutrition is associated with

CAROTENOIDS IN BIRDS’LIFE
55
reduced blood antioxidant levels in adulthood, which could impair reproductive performance. These effects could be a consequence of an alterated uptake and transport of the antioxidants in diet (Blount et al., 2003), or these are known as limiting factors for the fecundity (Surai, 2002; Blount et al., 2003; Blount et al., 2004).
Besides birds fed with a low quality diet took longer to initiate egg-laying, and then laid eggs at a slower rate, aspect correlated with a reduced breeding success owing to increased hatching asiynchrony and therefore chick mortality. In addition, these birds did not show reduced clutch mass or size, or yolk antioxidant levels. All these reproductive perturbations could be correlated with an irreversible alteration of the morphology, physiology and metabolism which appear at the level of any organism which are lack by carotenoids during the critical period of their development (Lindstrom, 1999; Metcalfe and Monagham, 2001).
In birds, experimentally increased egg production can reduce maternal condition, parenting ability and survival, and the quality of the eggs themselves. Such costs probably reflect resource limitation, but the identity of the resource(s) in question remains unclear. Trade-offs in the allocation of limiting carotenoids between somatic maintenance and egg production could therefore be an important factor underlying reproductive costs. However, whether carotenoids are limiting for egg production directly, by stimulating the synthesis or antioxidant protection of yolk precursors, or indirectly, via effects on maternal health, requires futher study. So far, researches demonstrated clearly that carotenoids are antioxidants and immunomodulants of the adult organism (Blount et al., 2003), and also are involved in egg production, maternally derived carotenoids in eggs yolk enhancing egg quality (Blount et al., 2002a and b).
In birds, clutch loss through predation is common, therefore individuals often must face the decision of whether to relay within a short time-scale. Therefore, Blount et al. (2004) tested the capacity of carotenoid-supplemented females to replace a lost clutch in Larus fuscus. These researches demonstrated that carotenoid supplementation increased the capacity of gulls to replace a lost clutch of eggs, one-third more carotenoid-diet females re-laid compared with controls (probably as a consequence of an increased synthesis and/or antioxidant protection of yolk precursors). But, carotenoid supplementation did not influence the latency to re-lay eggs, mass of replacement clutches, clutch size, while the yolk and egg mass covaried proportionately.
If carotenoids enhance the capacity to lay, why then did not carotenoid-diet females lay larger replacement eggs? Carotenoid supplementation clearly influenced replacement egg composition: yolk mass and egg mass covaried proportionately in the carotenoid-diet group, whereas in the control-diet group, yolk mass declined with increasing egg mass. Decreasing yolk size with increasing egg size is typical in seabirds, so variation in egg size largely reflects changes in albumen (i.e. protein and water) content (Williams, 1994). Possibly, therefore, some carotenoid-diet re-layers had relatively low supplies of such macronutrients. This stands to reason because, under natural feeding conditions, carotenoids can only be cosumed with macronutrients

CRISTINA BERCIU AND ALIN DAVID
56
– indeed, tissue carotenoids are often bound to lipids or proteins (Olso and Owens, 1998), so maternal levels of carotenoids and macronutrients should covary.
Analysis of clutch replacement in relation to maternal body condition and plasma carotenoid levels suggested that the latter was a stronger determinant (Blount et al., 2004). It cannot exclude some alternative explanations. If carotenoids enhanced the effiency of immune defences, this could have resulted in an increased availability of other limiting nutrients. It is also conceivable that a healthier individual should have better foraging efficiency. These explanations predict that sustained carotenoid supplementation should result in increased maternal body condition, and possibly larger eggs and better as quality, although sudies of Blount et al. (2002b si 2004) didn not demonstrate these effects. All these results obtained in Larus fuscus species, showed that even for this species which were investigated very intensively to understand better the relative importance of carotenoids requires supplimentary ecophysiological investigations.
So far, no study has been able to clarify whether a greater capacity for work in carotenoid-rich males reflects condition dependence in exercise performance as influenced by carotenoids or alternatively is genetically determined. One possibility is that carotenoid availability may be limiting for exercise performances, because of the role of antioxidants in protecting muscles against oxidative damages (Powers et al., 2004).
Recently, Blount and Matheson (2006) tried to establish in laboratory, whether a diet supplemented with additional carotenoids may improve physical (muscle’s) performances in Taeniopygia guttata. Their results demonstrated that carotenoid supplementation enhanced flight performance, the birds having a shorter flight times than controls, and, besides, less often required a repeat stimulus to elicit escape flight, andemeged sooner from the release chamber after a startle stimulus. Such effects of carotenoids could be ecologically important, since flight take-off performance is thought to be an important determinant of predator evasion and foraging, and thus, of survival probability and the capacity to provide parental care.
Moller et al. (2000) hypothesized that birds may be particularly susceptible to carotenoid limitation compared with other taxa because of a high requirement for and turnover of carotenoids. On average, birds typically have far higher blood concentrations of carotenoids than mammals do (Hill, 1999). This is not simply because of differences in carotenoid levels in diet (Slifka et al., 1999), and therefore suggests that birds have a relatively greater need for carotenoids and hence have efficient carotenoid absorbtion and transport systems. The rate of carotenoid uptake and turnover in birds can be high, bodily levels increasing rapidly in response to dietary supplementation (Blount et al., 2003b; McGraw and Ardia, 2003), and declining rapidly in response to immune sensitization (Faivre et al., 2003; McGraw and Ardia, 2003; Alonso-Alvarez et al., 2004). Therefore, the specialists hypothesize that birds’ flight muscles may be susceptible to antioxidant limitation, with negative consequence for exercise performance.(Blount and Matheson, 2006). To confirm that dietary carotenoid supplementation resulted in enhanced muscle

CAROTENOIDS IN BIRDS’LIFE
57
resistance to oxidative damage would require that birds be killed for in vitro measurement of tissue oxidation products in muscle. (Coombes et al., 2002).
It is very important to know the possibility that the supplemental carotenoid dose in diet elevates blood carotenoid levels above naturally occuring levels. Unfurtunately, so far, the normal range for blood carotenoids in wild birds are unknown at this time, there are just a few data concerning some captive species when they get a basal diet or a carotenoid supplemented diet. For example, one of the most studied species in laboratory conditions is Taeniopygia guttata, in which, it could be noticed that blood carotenoid levels continue to rise in response to increasing dietary carotenoid intake until they reach certain level, after this level of carotenoids in diet, the level of blood carotenoids wouldnt rise at all, but remain constant (McGraw et al., 2003).
Clearly there are several explanations for how carotenoids may influence muscles’ performance. Indeed a combination of antioxidant and nonantioxidant mechanisms could be responsible. It has also consider the possibility that carotenoid supplementation, through effects on immune defences, could have resulted in birds being less debilitated by parasites or diseases and hence more capable of flight.
Clearance of Mycoplasma gallicepticum bacterium after experimental inoculation has been shown to be faster in male house finches (Carpodactus mexicanus) with redder carotenoid-based plumage (Hill and Farmer, 2005). Similary experiments were done in Taeniopygia guttata, too (Blount et al., 2003b; McGraw and Ardia, 2003), obtaining similary results. A correct estimate of the immune defence of carotenoids needs that before starting the experiments, to be able to estimate correctly the fitness and the pathogens, parasites or diseases of every individual we are working on. But this is extremely difficult or, in practical terms, perhaps imposible, but it will be necessary to find a solution.
Recent researches demonstrated another very important role of carotenoids – photoprotection of some tissues, structures. For example, the macular region of retina is enriched with xantophylls (Khachiket et al., 2002), that arguably play an important role in absorbing harmful short-wave light rays, protecting photoreceptors from oxidative damage, and ultimately preventing age-related macular degeneration (Mozaffarich et al., 2003).in birds with carotenoid-colored eyes such as chickens, ducks, birds may be signaling the direct photoprotection they are affording themselves with their retinal pigments. So far, it is unknown wether species of bird with more colorful carotenoid-based integuments deposit more in their eyes, and what consequences this concentration has for the visual system. By definition, based on the light absorbance properties of the pigments, this process would leave the visual systems of carotenoid-coloured species optimally tuned to accept and perceive the light wavelengths that their integuments reflects (Hill and McGraw, 2006).
One last and recently discovered biological property of carotenoids is their role in gap-junctional communication (Tapiero et al., 2004). One method of cell-to-cell signaling (e.g., the exchange of ions, electric currents, or nutrients) is accomplished by the transfer of information via gap junctions – pores that connect the cytosol of two

CRISTINA BERCIU AND ALIN DAVID
58
neighboring cells. Proteins known as “ connexins” are the governing body of gap-junctional comunnication, and recent studies have showed that carotenoids can bind to nuclear receptors in cells and upregulate gene expression and the production of connexins. This aspects is very important for the prevention of different types of cancer, in case of which, the gap-junctional comunnication is involved in the cellular malignant transformation (Livny et al., 2002).
REFERENCES
Alonso-Alvarez, C., Bertrand, S., Devevey, G., Gaillard, M., Prost, J., Faivre, B., Sorci, G. (2004), An experimental test of the dose-dependent effect carotenoids and immune activation on sexual signals and antioxidant activity, Am. Nat, 164, 651-659.
Birkhead, T. R., Langley-Evans, F., Pellatt, E. J. (1999), Nestling diet, secondary sexual traits and fitness in the zebra finch, Proc. R. Soc. Lond., Ser. B 266, 385-390.
Blount, J. D., Houston, D. C., Moller, A. P. (2000), Antioxidants, showy males and sperm quality, Ecol. Lett, 4, 393-396.
Blount, J. D., Surai, P. F., Houston, D. C., Moller, A. P. (2002a), Patterns of yolk enrichment with dietary carotenoids in gulls: te roles of pigment acquisition and utilization, Funct. Ecol., 16, 445-453.
Blount, J. D., Surai, P. F., Nager, R. G., Houston, D. C., Moller, A. P., Trewby, M. L., Kennedy, M. W. (2002b), Carotenoids and egg quality in the lesser black-backed gulls Larus fuscus: a supplemental feeding study of maternal effects, Proc. R. Soc. Lond., Ser. B 269, 29-36.
Blount, J. D., Metcalfe, N. B., Birkhead, T. R., Surai, P. F (2003a), Carotenoid modulation of immune function and sexual attractiveness in zebra finches, Science, 300, 125-127.
Blount, J. D., Metcalfe, N. B., Arnold, K. E., Surai, P. F., Devevey, G. L., Monaghan, P. (2003b), Neonatal nutrition, adult antioxidant defences and sexual attractiveness in the zebra finch, Proc. R. Soc. London, Ser. B 270, 1691-1696.
Blount, J. D., Houston, D. C., Surai, P. F., Moller, A. P. (2004), Egg-laying capacity is limited by carotenoid pigment availability in wild gulls Larus fuscus, Proc. R. Soc. Lond., Ser. B (Suppl.) 271, S79-S81.
Blount, J. D., Matheson, S. M. (2006), Effects of carotenoid supply on escape flight responses in zebra finches, Taeniopygia guttata, Anim. behaviour, 72, 595-601.
Blount, J. D., Metcalfe, N. B., Arnold, K. E., Surai, P. F., Monaghan, P. (2006), Effects of neonatal nutrition on adult reproduction in a passerine bird, Ibis, 148, 509-514.
Bohm, F., Edge, R., Land, E. J., McGarvey, D. J., Truscott, T. G. (1997), Carotenoids enhance vitamin E antioxidant efficiency, J. Am. Chem. Soc., 119, 621-622.
Brush, A. H. (1990), Metabolism of carotenoids in birds, FASEB J, 4, 2969-2977. Burley, N. (1986), Sexual selection for aesthetic traits in species with hiparental care, Am. Nat.,
127, 415-445. Burley, N. T., Priece, , D. K., Zann, R. A. (1992), Bill color, reproduction and condition effects
in wild and domesticated zebra finches, Auk., 109, 13-23.

CAROTENOIDS IN BIRDS’LIFE
59
Burton, G. W., Ingold, K. U. (1984), β-carotene: an unusual type of lipid antioxidant, Science, 224, 569-573.
Christians, J. K. (2002), Avian egg size: variation within species and inflexibility within individuals, Biol. Rev., 77, 1-26.
Coombes, J. S., Rowell, B., Dood, S. L., Demirel, H.A., Naito, H., Shanely, R. A., Powers, S. K (2002), Effects of vitamine E deficiency on fatigue and muscle contractile properties, Eur. J. Applied Physiol., 87, 272-277.
Delhey, K., Johnsen, A., Peters, A., Andesson, S., Kempenaers, B. (2003), Paternity analysis reveals opposing selection pressure on crown coloration in the blue tit (Parus coeruleus), Proc. R. Soc., Series B, 270, 2057-2063.
Edge, R., McGarvey, D. J., Truscott, T. G. (1997), The carotenoids as anti-oxidants – a review, J. Photochem. Photo biol., 41, 189-200.
Faivre, B., Gregoire, A., Preault, M., Cezilly, F., Sorci, G. (2003), Immune activation rapidly mirrored in a secondary sexual trait, Science, 300, 103.
Hencken, H. (1992), Chemical and physiological behavior of feed carotenoids and their effects on pigmentation, Polutry Science, 71, 711-717.
Hill, G. E. (1993) Geographic variation in the carotenoid plumage pigmentation of male house finches (Carpodacus mexicanus), Biological J. of the Linnean Soc., 49, 63—86.
Hill, G. E. (1999), Is there an immunological cost to carotenoid-based ornamental coloration?, Am. Nat, 154, 598-595.
Hill, G. E. (2000) Energetic constraints on expression of carotenoid-based plumage coloration, J. Avian Biol., 31, 559-566.
Hill, G. E., Inouye, C. Y., Montgomerie, R. (2002), Dietary carotenoids predict plumage coloration in wild house finches, Proc. R. Soc, Series B, 269, 1119-1124.
Hill, G. E., McGraw, K. J. (2004), Correlated changes in male plumage coloration and female mate choice in cardueline finches, Anim. Behav., 67, 27-35.
Hill, G. E., Farmer, K. L. (2005), Carotenoid-based plumage coloration predicts resistance to a novel parasite in the house finch, Naturwissenschalten, 92, 30-34.
Hill, G. E., McGraw, K. J. (2006), Bird coloration, Harvard University Press, London. Hughes, D. A. (2001), Dietary carotenoids and human immune function, Nutrition, 17, 823-827. Khachik, F., de Moura, F. F., Zhao, D. Y., Aebischer, C. P., Bernstein, P. S. (2002),
Transformations of selected carotenoids in plasma, liver, and ocular tissues of humans and in nonprimate animal models, Invest. Ophthalmol. Vis. Sci., 43, 3383-3392.
Koutsos, E. A., Clifford, A. J., Calvert, C. C., Klasing, K. C. (2003a), Maternal carotenoid status modifies incorporation of dietary carotenoids into immune tissues of growing chickens (Gallus gallus domesticus), J. Nutr., 133, 1132-1138.
Koutsos, E. A., Calvert, C. C., Klasing, K. C. (2003b), The effect of an acute phase response on tissue carotenoid levels of growing chickens (Gallus gallus domesticus), Comp. Biochem. Physiol., 135, 635-646.
Lin, H., Wang, L. F., Song, J. L., Xie, I. M., Yang, Q. M. (2002) effect of dietary supplemental levels of vitamin A on the egg production and immune responses of heat-stressed layng hens, Poultry Sci., 81, 458-465.
Lindstrom, J. (1999), Early development and fitness in birds and mammals, Trends Ecol., 14, 343-348.
Linville, S. U., Breitwisch, R., Schilling, A. J. (1998), Plumage brightness as an indicator of parental care in northen cardinals, Anim. Behav., 55, 119-127.

CRISTINA BERCIU AND ALIN DAVID
60
Linville, S. U., Breitwisch, R. (1997), Carotenoid availability and plumage coloration in a wild population of northen cardinals, Auk., 114, 796-800.
Livny, O., Kaplan, I., Reifen, R., Polak-Charcon, S., Madar, Z., Schwartz, B. (2002), Lycopene inhibits proliferation and enhances gap-junction communicationof KB-1 human oral tumor cells, J. Nutr., 132, 3754-3759.
Lozano, G. A. (1994), Carotenoids, parasites and sexual selection, Oikos, 70, 309-311. Lucas, A. M., Stettenheim, P. R. (1972), Avian anatomy: Integument, Agriculture handbook,
362, Washington D.C, U.S. Government Printing Office. McGraw, K. J., Ardia, D. R. (2003a), Carotenoids, immunocompetence, and the information
content of sexual colors: an experimental test, Am. Nat, 162, 704-712. McGraw, K. J., Beebee, M. D., Hill, G. E., Parker, R. S. (2003b), Lutein-based plumage
coloration in songbirds is a consequence of selective pigment incorporation into feathers, Comp. Biochem. Physiol., B, 135, 689-696.
McGraw, K. J. (2004), Colorful songbirds metabolize carotenoids at the integument, J. Avian Biol., 35, 471-476.
Menon, G. K., Menon, J. (2000), Avian epidermal lipids: Functional considerations and relationship to feathering, Am. Zool., 40, 540-552.
Metcalfe, N. B., Monaghan, P. (2001), Compensation for a bad start: grow now, pay later?, Trends Ecol. Evol., 17, 254-260.
Moller, A. P., Biard, C., Blount, J. D., Houston, D. C., Ninni, P., Saino, N., Surai, P. F. (2000), Carotenoid-dependent signals: Indicators of foraging efficiency, immunocompetence, or detoxification ability?, Avian Poult. Biol. Rev., 11, 137-159.
Mozaffarich, M., Sacu, S., Wedrich, A. (2003), The role of carotenoids, lutein and zeaxanthin, in protecting against age-related macular degeneration: A review based on controversial evidence, Nutr. J., 2, 20-27.
Negro, J. J., Garrido-Fernandez, J. (2000), Astaxantin in the major carotenoid in tissues of white storks (Ciconia ciconia) feeding on introduced crayfish (Procambarus clarkii), Comp. Biochem and Physiol, B 126, 347-352.
Negro, J. J., Figuerola, J., Garrido, J., Green, A. J. (2001), Fat stores in birds: An overlook sink for carotenoid pigments?, Funct. Ecol., 15, 297-303.
Olson, V. A., Owens, I. P. F. (2005), Interspecific variation in the use of carotenoid-based coloration in birds: diet, life history and phylogeny, J. Evol. Biol., 74(5), 17-22.
Partali, V., Liaaen-Jensen, S., Slagsvold, T., Lifjeld, J. T. (1987), Carotenoids in food chain studies II. The food chain in Parus ssp. Monitored by carotenoid analysis, Comp. Biochem. Physiol., 87, 885-888.
Peters, A., Denk, A.G., Delhey, K., Kempenaers, B. (2004), Carotenoid-based bill colour as an indicator of immunocompetence and sperm performance in male mallards, J. Evol. Biol., 17, 1111-1120.
Powers, S. K., DeRuisseau, K. C., Quindry, J., Hamillton, K. L. (2004), Dietary antioxidants and exercise, J. Sports Sci., 22, 81-94.
Royle, N. J, Surai, P. F., Hartley, J., R. (2003), The effect of variation in dietary intake on maternal deposition of antioxidants in zebra finch eggs, Funct. Ecol., 17, 472-481.
Saino, N., Bertacche, V., Ferrari, R. P., Martinelli, R., Moller, A. P., Stradi, R (2002), Carotenoid concentration in barn swallow eggs in influenced by laying order, maternal infection and paternal ornamentation, Proc. R. Soc, Series B, 269, 1729-1733.

CAROTENOIDS IN BIRDS’LIFE
61
Saino, N., Romano, M., Ambrosini, R., Ferrari, R. P., Moller, A. P. (2004) Timing of reproduction and egg quality covary with temperature in the insecticorous barn swallow Hirundo rustica, Funct. Ecol., 18, 50-57.
Senar, J. C., Figuerola, J., Pascual, J. (2002), Brighter yellow blue tits make better parents, Proc. R. Soc. of London, Series B, 269, 257-261.
Shawkey, M. D., Hill, G. E. (2004), Feathers at a fine scale, Auk., 121, 652-655 Sheldon, B. C. (2000), Differential allocation: tests, mechanisms and implications, Trends Ecol.
Evol., 15, 397-402. Slifka, K. A., Bowen, P. E., Stacewicz-Sapuntzakis, M., Crissey, S. D. (1999), A survey of serum
and dietary carotenoids in captive wild animals, J. Nutrition, 129, 380-390. Sumien, N., Heinrich, K. R., Sohai, R. S., Forster, M. J. (2004), Short-term vitamin E intake
fails to improve cognitive or psycho-motor performance of aged mice, Free Radical Biol. and Med., 36, 1424-1433.
Surai, P. F., Speake, B. K., Wood, N. A. R., Blount, J. D., Bortolotti, G. R., Sparks, N. H. C. (2001), Carotenoid discrimination by the avian embryo: A lesson from wild birds, Comp. Biochem. Physiol., B128, 743-750.
Surai, P. F. (2002), Natural antioxidants in avian nutrition and reproduction, Nottingham: Nottingham University Press.
Szigeti, B., Torok, J., Balazs Rosivall, H., Hargitai, R., Szollosi, E, Michl, G. (2007), Egg quality and parental ornamentation in the blue tit Parus caeruleus, J. Avian Biol., 38, 105-112.
Tapiero, H., Townsend, D. M., Tew, K. D. (2004), The role of carotenoids in the prevention of human pathologies, Biomed. Pharmacother., 58, 100-110.
Tella, J. L., Figuerola, J., Negro, J. J., Blanco, G., Rodriguez-Estrella, R. (2004), Ecological, morphological, and phylogenetic correlates of interspecific variation in plasma carotenoid concentration in birds, J. Evol. Biol., 17, 156-164.
Tengerdy, R. P., Lacetera, N. G., Nockels, C. F. (1990), Effect of beta carotene on disease protection and humoral immunity in chickens, Avian Diseases, 34, 848-854.
Verboven, N., Evans, N. P., D’Alba, L., Nager, R. G., Blount, J. D., Surai, P. F., Monaghan, P. (2005), Intra-specific interactions influence egg composition in the lesser black-backed gull (Larus fuscus), Behav. Ecol. Sociobiol., 57, 357-365.
Williams, T. D. (1994), Intraspecific variations in egg size and egg composition in birds: effects on offspring fitness, Biol. Rev., 68, 35-59.
Williams, A. W., Boileau, T. W. M., Erdman, J. W. jr. (1998), Factors influencing the uptake and absorbtion of carotenoids, Proc. Soc. Exp. Biol. Med., 218, 106-108.
Wiss, A. (2004), Carotene oxygenases: A new family of double bond cleavage enzymes, J. Nutr., 134, 246S-250S.
Young, A. J., Lowe, G. M. (2001), Antioxidant and prooxidant properties of carotenoids, Arch. Biochem. Biophys., 385, 20-27.

STUDIA UNIVERSITATIS BABEŞ – BOLYAI, BIOLOGIA, LII, 2, 2007 (p.63-68)
===SHORT COMMUNICATION===
ATMOSPHERIC POLLEN SEASON OF PLANTAGO IN TIMIŞOARA
NICOLETA IANOVICI1
SUMMARY. The quantitative monitoring of the airborne pollen offers important information regarding the flowering phenophase duration, the possibility of creating pollenic calendars for a certain geographic region and gives hints on the periods when pneumallergens may reach dangerous quantities. This study was planned in order to determine annual dissemination of Plantago pollen grains in the atmosphere of Timişoara in 2000-2004. Pollen belonging to Plantago was sampled during a 5-year atmospheric pollen-monitoring programme in Timişoara, România, using a VPPS 2000 Lanzoni trap. Annual variations in the concentration of pollen in the atmosphere were analysed by the volumetric method. Plantago airpollen constitutes between 0.9% and 3.39% of the annual total of pollen grains. During the studied period, inter-annual variations, concerning the total annual pollen counts and the beginning, peak and ending dates of the Atmospheric Pollen Season (APS), were reported. The daily quantities of pollen are expressed as numbers of pollen grains per cubic meter of air per day (PG/m3).
Keywords: Atmospheric Pollen Season, Plantago Introduction The present study constitutes the first attempt to record Plantago airborne
pollen grains in a qualitative and quantitative way in Timişoara, România. Allergic diseases represent an increasing problem in the western world, with
symptoms that may not be easily distinguished from other disorders (Julge et al., 1998; Bjorksten et al., 1999; Platts-Mills et al., 2000; von Mutius, 2000; Söderström et al., 2003). Furthermore, there are many different allergens, which may trigger the clinical symptoms and it is often not easy to distinguish which allergen that is the most offending one (Yunginger et al., 2000). The study of fluctuations and trends in quantities of pollen in the atmosphere is of importance in various respects. One of the phenomena that might be reflected in the annual totals of daily airborne pollen concentrations is evidence of global change in the climate (Menzel, 2000), the hypothesis being that higher yearly average temperatures will lead to more pollen of some taxa in the atmosphere. Another aspect of interest in quantitative studies of atmospheric pollen is the possible relationship with the observed increase in the prevalence of pollen allergy in the human population in many parts of the world
1 West University of Timişoara, Faculty of Chemistry-Biology-Geography, Department of Biology E-mail: [email protected]

NICOLETA IANOVICI
64
(D’Amato et al. 1998; Crane et al., 2002). Reliable assessment of fluctuations and trends in airborne pollen can only be made by using long-term observations, preferably at several locations (Emberlin et al., 2000). Some authors maintain that the effect of climatic change could cause an increase in the production of airborne allergens, and therefore an increase in the severity of symptoms and in the number of people becoming sensitized (Sánchez-Mesa et al., 2005). Another factor for the increasing sensitization to pollen in recent years might be the worsening of pollution experienced in the city (Cariñanos et al., 2002), mainly as a consequence of the rising number of dieselengined cars. Within the city of Córdoba, the highest incidence of pollen allergy occurs in the eastern and southern zones. These are the areas containing the bulk of the industrial sites. They also constitute the main routes in and out of the city, where there are frequent traffic jams (Sánchez-Mesa et al., 2005). This would support the relationship already observed between pollution and a higher incidence of allergy (Knox et al., 1997).
Pollen of Plantago lanceolata (English plantain, ribwort) is known to be a common cause of pollinosis in the temperate zones of North America, Australia and Europe, where it is widely distributed. Although the clinical importance of this dicotyledon weed has been largely demonstrated in several studies carried out in different countries (Lewis & Imber, 1975; Spieksma et al., 1980; D'Amato & Lobefalo, 1989; Peat, 1991; Subiza et al., 1995; Calabonzo et al., 2001), its role in the aetiology of pollinosis has usually been overlooked in clinical practice. This is probably because plantain pollinates in the same season as other relevant allergenic plants, such as grasses, and monosensitization to plantain pollen is not frequently found among allergic patients. Most authors agree that it is difficult to evaluate the true importance of Plantago in polynosis symptoms due to the low rate of monosensitized patients and the fact that those allergic to Plantago are usually also allergic to Gramineae and other airborne pollen types at the same time of the year. As the peak of pollination occurs in June, the allergic symptoms can be mistakenly associated with grass pollen allergy (Gutierrez et al., 1999).
Materials and Methods
The monitoring station within the Department of Biology of the West University, the only one of this kind in Romania, uses a trap VPPS 2000 Lanzoni to aspirate air. The mashine allows the evaluation of airborne pollen dinamics from the city as well as it’s surroundings. The results are significant for plain zone from west and south-west România. Analysis of the pollen count and pollen fall distribution was performed on the basis of the data collected in Timişoara in the seasons of 2000–2004. Monitoring station is placed in urban area. Vegetation in the town and its surroundings consists of ruderal vegetation, forests, semi-natural community of grasses and antropomorphic habitats. The volumetric measurement point was located in the Timişoara city at an elevation of 20 m above ground level. The pollen count was expressed as the number of pollen grains in 1 m3 per 24 h

ATMOSPHERIC POLLEN SEASON OF PLANTAGO IN TIMIŞOARA
65
(Mandrioli et al., 1998). The trap was calibrated weekly to maintain a flow rate of 10 l/min. Pollen was caught on a 24 mm wide transparent tape coated by a thin film of silicon oil. The tape was mounted on a cylinder rotating at a speed of 2 mm per hour. A complete rotation of the cylinder took seven days. Pollen grains were identified on the surface of 4 horizontal bands. Pollen grains identification was carried out using a ML-4M microscope, magnifying 400X. The numbers of pollen grains found in the cover-glass area were converted to pollen counts. The data for 2002 is not complete because of temporary technical problems with the trap.
In this paper, we determined the APS (Atmospheric Pollen Season) in accordance with the criteria used by the following authors: Nilsson and Persson (corresponding to 90% of the total pollen catch -the 90% method), Andersen and Torben (corresponding to 95% of the total pollen catch- the 95% method) (Jato et al., 2006).
The morphology of genus Plantago pollen suggests that it is stenopalynous; its pollen is spherical, secondarily apolar, small- or medium-sized (D = 19-35 µm), pantoporate, with 5-16 simple operculate pores (D pore = 3-5 µm), which are sometimes surrounded by a 2-2.5 µm ring or annulus. The surface is generally scabrate or verrucate. The main differences at species level are size, greater or lesser number of pores, presence or absence of ring, and the external relief of the exine. Remarkable annulate and non-annulate pollen forms were enumerated for Plantago and successfully utilized in taxonomic clarification of the genus (Ubera et al., 1988).
Results and Discussions It is clear that the Romanian pollen seasons show 3 main parts: tree season
(February–April), grass season (May–July), weed season (July–October) (Ianovici, 2007). Like other summer weeds, Plantago is unlikely to be important, but may contribute to the problems of the pollen sensitive patient under exceptional circumstances (Spieksma et al., 1980).
The pollen shedding time usually occurs from May to the beginning of September. The pollen pattern shows successive peaks taking place from mid May to mid July, but Plantago pollen may frequently be found in air samples even when the flowering season is over. The peaks (2 or 3 or several) alternate with days of low pollen concentrations. Every year shows a different pattern with different numbers and periods of the peaks. The annual sums of the daily pollen concentrations and other aerobiological parameters in the years from 2000 to 2004 are given in table 1. Monthly variations of total pollen grains recorded in the atmosphere of Timişoara during the years 2000-2004 are shown in table 2. The mean value of the annual sums is 435.2 PG, with a lowest total of 148 in 2001, and a highest annual total of 669 in 2002. The percentage of the Plantago annual sum with respect to the total annual sum is rather low, ranging from 0.9% in 2001 to 3.39% in 2002, with a mean value of 2.28 %. The mean annual concentration for 5 years of study was 435.2 PG.

NICOLETA IANOVICI
66
Table 1. Most important data characterizing the Atmospheric Pollen Season of Plantago
2000 2001 2002 2003 2004 The starting data of the Plantago pollen
season 29 May 28May 1 May 1 May 1 May
The ending data of the Plantago pollen season
25 August 2 September 18 August
31 July
13 September
Number of days, when was Plantago pollen in the air
89 97 110 76 136
Atmospheric Pollen Season (Nilsson & Persson, 1981); 90%
73 78 91 54 95
Atmospheric Pollen Season (Andersen & Torben, 1991); 95%
80 89 96 61 109
Pollen Index 1.72% 0.9% 3.39% 2.6% 2.8% Days with pollen concentrations higher
than 30 PG/m3 - - 1 3 -
The peak days in PG/m3 8 6 30 42 22
Table 2. Monthly pattern of Plantago airborne pollen (%), Timişoara, România
Year II III IV V VI VII VIII IX X annual total of pollen grains
2004 0 0 0 28% 28,4% 27% 14,7% 1,9% 0 486
2003 0 0 0 39,73% 55,86% 4,41% 39,73% 0 0 657
2002 0 0 0 51.6% 17% 24.7% 6.7% 0 0 669
2001 0 0 0 4% 26.4% 49.3% 19.6% 0.7% 0 148
2000 0 0 0 2.3% 52.8% 29.6% 15.3% 0 0 216 The months in which maximum pollen concentrations were recorded were the
same in all five years: May, June and July. The longest Atmospheric Pollen Season was observed in the year 2004 (95 days according to Nilsson & Persson, 1981; 109 days according to Andersen and Torben, 1991). Five year average pollen season duration were 78.2 days (the 90% method) and 87 days (the 95% method). From year 2003, the end of season shows a trend towards earlier dates, resulting in a shorter length of APS. The starts of these APS were fairly uniform. The pollen season started between the beginning and end of May and finished by August depending on the year.
The highest daily concentration is 42 PG/m3 in 2003. For Timişoara was characteristic lower average number of days with pollen concentrations higher than 30 PG/m3 (part of season when Plantago pollen reached critical concentrations – one day in 2002 and three days in 2003). Overall, the pollen shedding course of the Plantago in Timişoara corresponds to that already described during the pollen season in other European areas.
Pollen grains registered in the aeroplankton of the measurement site come from the plants growing in the neighbourhood as well as areas several kilometers

ATMOSPHERIC POLLEN SEASON OF PLANTAGO IN TIMIŞOARA
67
distant. Apart from that, in the atmosphere there is the distant transport pollen, which appears prior or following the period of flowering, or occurs at high concentrations at night (Comtois,1997). The determination of the share of the pollen from distant areas in the aeroplankton is difficult, yet one may presume that the high concentrations of Plantago pollen noted in Timişoara on September 2001 and 2004 come from distant transport as they occurred in the pollen season with a significant delay. The concentration of plantain pollen in air reaches low to moderate values (Puc, 2003).
Conclusions Results of this study demonstrate that Plantago seasons occurred at regular
intervals between May and August each year; however, individual daily and seasonal Plantago counts were heterogeneous. The highest concentration of pollen from Plantago taxa occurred in 2002.The length of pollen seasons was calculated by the 95% method and 90% method. Registered data confirm the fact that at least quantitatively Plantago pollen is not an important allergenic factor.
REFERENCES
Bjorksten, B., Naaber, P., Sepp, E., Mikelsaar, M. (1999). The intestinal microflora in allergic Estonion and Swedish 2-yearold children. Clin Exp Allergy, 29, 342–346
Calabozo, B., Barber, D., Polo, F. (2001). Purification and characterization of the main allergen of Plantago lanceolata pollen, Pla l 1. Clin. Exp. Allergy. 31, 322–330
Cariñanos, P., Sánchez-Mesa, J.A., Prieto-Baena, J.C., López, A., Guerra, F., Moreno, C., Domínguez, E., Galán, C. (2002). Pollen allergy related to the area of residence in the city of Córdoba, south-west Spain. J Environ Monit, 4, 734-738
Comtois, P. (1997). Pollen dispersal and long distance transport: the case of thermophilic pollen in subarctic Canada. Aerobiologia, 13, 37-42
Crane, J., Wickens, K., Beasley, R., Fitzharris, P. (2002). Asthma and allergy: a worldwide problem of meanings and management? Allergy 57, 663–672
D'Amato, G., Lobefalo, G. (1989). Allergenic pollens in the southern Mediterranean area. J. Allergy Clin. Immunol. 83, 116–122
D’Amato, G., Spieksma, F.T.M., Liccardi, G., Jäger, S., Russo, M., Kontou-Fili, K., Nikkels, H., Wüthrich, B., Bonini, S. (1998). Pollen-related allergy in Europe. Allergy 53, 567–578
Emberlin, J., Jäger, S., Dominguez-Vilches, E., Galan Soldevilla, C., Hodal, L., Mandrioli, P., Rantio-Lehtimäki, A., Savage, M., Spieksma, F.Th.M., Bartlett, C. (2000). Temporal and geographical variations in grass pollen seasons in areas of western Europe: an analysis of season dates at sites of the European pollen information system. Aerobiologia 16, 373–379
Gutiérrez, A.M., Saenz, C., Cervigón, P., Alcázar, P., Dopazo, A., Ruiz, L., Trigo, M.M., Valencia, R., Vendrell, M. (1999). Comparative study of the presence of aeropollen from Plantago sp. at several locations in Spain, Polen 10, 111-122

NICOLETA IANOVICI
68
Ianovici, N. (2007). Aeropalynologic Analysis Of Timişoara (România) During 2006 Year, International Conference of Fundamental Sciences from Băile Felix, November 9-10th
2007, Analele UniversităŃii din Oradea, Fascicula Biologie, Tom. XIV, 96-100 Jato, V., Rodrıguez-Rajo, F.J., Alcazar, P., De Nuntiis, P., Galan, C., Mandrioli, P., (2006). May
the definition of pollen season influence aerobiological results?, Aerobiologia 22, 13–25 Julge, K., Munir, A.K., Vasar, M., Bjorksten, B. (1998). Indoor allergen levels and other
environmental risk factors for sensitization in Estonion homes. Allergy, 53, 338–393 Knox, R.B., Suphioglu, C., Taylor, P., Desai, R., Watson, H.C., Peng, J.L., Bursill, L.A. (1997).
Major grass pollen allergen Lol p 1 binds to diesel exhaust particles: implications for asthma and air pollution. Clin Exp Allergy, 27, 246-251
Lewis, W.H., Imber, W.E. (1975). Allergy epidemiology in the St. Louis Missouri area. IV. Weeds. Ann. Allergy 35, 180–187
Mandrioli, P., Comtois, P., Dominguez Vilches, E., Galan Soldevilla, C., Isard, S., Syzdek, L. (1998). Sampling: Principles and Techniques in (Mandrioli P., Comtois P., Levizzani V. Eds.) Methods in Aerobiology, Pitagora Editrice, Bologna, pp.47-112
Menzel, A. (2000). Trends in phenological phases in Europe between 1951 and 1996. Int. J. Biometeorol. 44, 76–81
Mutius von E. (2000). The environmental predictors of allergic disease. J Allergy Clin Immunol, 105, 9–19
Peat, J.K., Woolcock, A.J. (1991). Sensitivity to common allergens: relation to respiratory symptoms and bronchial hyper-responsiveness in children from three different climatic areas of Australia. Clin. Exp. Allergy 21, 573–581
Platts-Mills, T.A., Rakes, G., Heyman, P.W. (2000). The relevance of allergen exposure to the development of asthma in childhood. J Allergy Clin Immunol, 105, 503–508
Puc, M. (2003). Characterisation of pollen allergens. Ann Agric Environ Med, 10, 143–149 Sánchez Mesa, J.A., Brandao, R., Lopes, L., Galan, C. (2005). Correlation between pollen counts
and symptoms in Cordoba and Evora, J Invest Allergol Clin Immunol, 15(2): 112-116 Söderström, L., Kober, A., Ahlstedt, S., de Groot, H., Lange, C.E., Paganelli, R., Roovers,
M.H.W.M., Sastre, J. (2003). A further evaluation of the clinical use of specific IgE antibody testing in allergic diseases, Allergy, 58, 921–928
Spieksma, F.T., Charpin, H., Nolard, N., Stix, E. (1980). City spore concentrations in the European Economic Community (EEC) IV. Summer weed pollen (Rumex, Plantago, Chenopodiaceae, Artemisia), 1976 and 1977, Clinical & Experimental Allergy, 10 (3), 319–329
Subiza, J., Jerez, M., Jiménez, J. A., Narganes, M.J., Cabrera, M., Varela, S., Subiza, E. (1995). Clinical aspects of allergic disease. Allergenic pollen and pollinosis in Madrid. J. Allergy Clin. Immunol. 96, 15–23
Ubera, J.L., Galan, C., Guerrero, F.M. (1988). Palynological study of the genus Plantago in the Iberian Peninsula, Grana, 27, 1-15
Yunginger, J.W., Ahlstedt, S., Eggleston, P.A., Homburger, H.A., Nelson, H.S., Ownby, D.R., Platts-Mills, T.A.E., Sampson, H.A., Sicherer, S.H., Weinstein, A.M., Williams, P.B., Wood, R.A., Zeiger, R.S. (2000). Quantitative IgE antibody assays in allergic diseases. J Allergy Clin Immunol, 105, 1077–1084

STUDIA UNIVERSITATIS BABEŞ – BOLYAI, BIOLOGIA, LII, 2, 2007 (p.69-82)
===REVIEW===
ECOLOGICAL AND GENETICAL IMPLICATIONS OF CLINE EVOLUTION
MANUELA DORDEA 1 AND NICOLAE COMAN 1
SUMMARY. As the environment changes permanently, and migrations occur recurrently, natural selection acts powerfully on population gene pools. More often, the gene flow hinders the action of natural selection. However, natural selection and migration are more often in a steady-state, that assure the specificity of local population gene pools, the clines being a result of such equilibrium, thus proving finally the evolution. Keywords: Allen’s rule, Bergmann’s rule, Cope’s rule, cline, gene pool, Gloger’s rule Clines in human populations The human species, Homo sapiens sapiens, consists of many populations.
Some live in grassland areas, while others in mountains over 4000 m high, in tropical forest areas or desert oasis. Each population is largely adapted to the specific conditions of the regions they have lived in for generations. Under similar conditions, natural selection leads frequently to nearly identical modifications. Thus, in the populations from both the Kalahari and Gobi deserts, the fold, a remainder of the third eyelid, is better developed than in other populations. Tuaregs, living in the Saharan desert, have the melting point of myelin higher than populations from temperate areas, ensuring a greater resistance to high temperatures. The Amerindian females from the Anza Mountains are fertile at elevations higher than 4000 m, unlike those living in grassland areas. The females of different Eskimo tribes have no ovulation, menstrual cycle respectively, during the long polar night.
From the wide range of characteristics of human populations, let us examine the intensity of skin pigmentation and the variation of eye color, starting from the African equatorial zone to the frozen waters of the Arctic Ocean.
At the equator, especially in Bantu populations, the skin and eye pigmentation is very strong. The intensity lowers gradually as one moves away from the equator, so that in the Scandinavian populations white skin, less pigmented and light-colored eyes prevail. Under the equatorial sun beans, the great amount of pigments in skin and eyes protect the human body against the high ultraviolet rays, which might cause severe burns of the skin and blindness.
1 Faculty of Biology and Geology, “Babes-Bolyai” University, 400006 Cluj-Napoca, Romania. E-mails: [email protected], [email protected]

MANUELA DORDEA AND NICOLAE COMAN
70
In Scandinavian countries, where the solar radiation is diminished, the low skin pigmentation ensures the penetration of a sufficient amount of UV rays to allow vitamin D synthesis D and prevent ricketts.
In the far north of Europe, snow strongly reflects the solar radiation, which may bring about blinding and skin burning. Consequently, natural selection has favoured a stronger pigmentation of skin and eyes, specific to Eskimo populations.
The old European populations, so-called autochthonous or native populations, have been overlapped in time by other populations coming from Asia and north-western Europe. Migratory populations with other gene frequencies have mixed, more or less, with the autochthonous ones.
Regardless of the intensity of miscellany, natural selection has favoured genes that ensure a better survival capacity. One might practically suppose that hybridization between natives and immigrants occurred in all instances. The modifications of the resulting gene pools depended on the differences of gene frequencies between natives and immigrants, on the proportion of immigrants, the frequency of immigration process and, last but not least, on the intensity with which selection favours or not the varied characters or phenotypes, respectively. The more favoured a phenotype is, the more rapidly the gene frequencies which determine that phenotype rise, and conversely. Thus, each local population is under the pressure of natural selection, which influences gene frequency, gene pool respectively, depending on the environment conditions in which that population lives. There are also phenotypes with a high genetic determination, but less under environmental pressure, such as blood groups’ phenotypes, ABO or MN. In this case, gene frequencies change very slowly. For example, the blood group B allele frequencies across Eurasia have resulted from the Mongol and Tartar invasions during the 5th – 15th centuries AD. Prior to this, the blood group B allele was presumed to be absent in western Europeans before the Mongol-Tartar migrations. The very low frequency of the blood group B allele in native Basques in Spain and other western European populations support this assumption (Fig. 1).
Therefore, if the migration rates are low and selection is strong, there will be local adaptations. Conversely, when migration rates are high and the effect of selection on phenotypes with strong genetic determination (namely with heritability nearly 1) is weak, clines do not form (cline – gradual modifications of gene frequencies depending on different environmental factors).

ECOLOGICAL AND GENETICAL IMPLICATIONS OF CLINE EVOLUTION
71
Fig.1. B group allele frequencies across Eurasia, resulting from the Mongol and Tartar invasions between AD 500 and 1500 (after Mourant et al., 1976)
Clinal evolution in Drosophila When the same selection pressure acts upon deleterious mutations all over the
distribution area, regardless of the environmental conditions of various local populations, their frequency decreases gradually. This is the case of the frequency of inversions in the five longest chromosomes of Drosophila subobscura (Sperlich, 1973). As one can see (fig.2), in the centre of the species distribution area, namely around the Mediterranean Sea, the frequency of the heterozygous inversions is high. It decreases gradually to the borders of the distribution area, so that populations from Iran, Holland, Norway, Scotland have a very low frequency of such inversions. One might conclude that, starting from the centre of the distribution area to the borders, a continuous flow of genetic variability occurs due to migration. By acting in the opposite direction, natural selection maintains the frequency clines.
A lot of latitudinal clines in inversion frequencies in Drosophila melanogaster across different continents have been identified by Knibb et al. (1981). Hoffmann et al. (2004) emphasized that the great chromosomal inversions are involved in the adaptative divergences between conspecific populations.
Studies regarding clines in Drosophilidae reveal that they affect a great number of morpho-physiological traits, namely the body size (James et al., 1995), eggs size (Azevedo et al., 1996), rate of larval development (James and Partridge, 1995), wing shape (Hoffmann and Shirriffs, 2002) etc. The influence of thermal variations and photoperiodicity on the eggs size, the length of the eggs laying and the development rate was also noticed in Drosophila melanogaster (Coman and Stentzer, 1981).
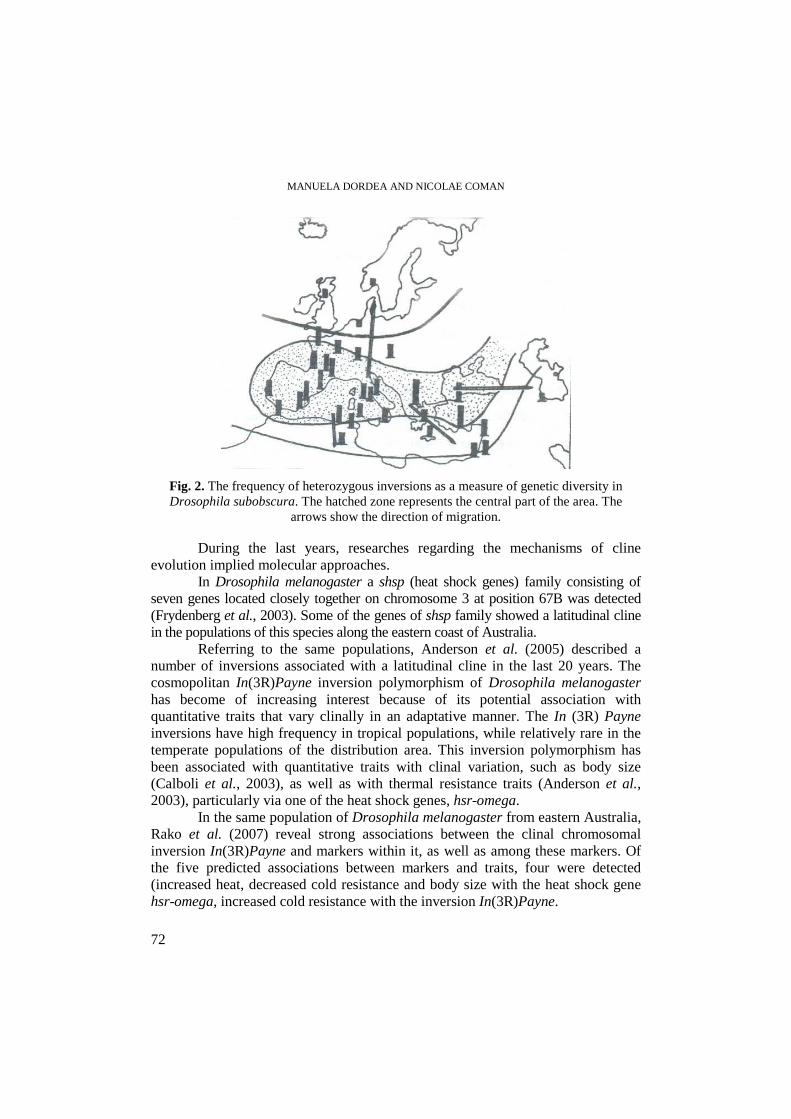
MANUELA DORDEA AND NICOLAE COMAN
72
Fig. 2. The frequency of heterozygous inversions as a measure of genetic diversity in Drosophila subobscura. The hatched zone represents the central part of the area. The
arrows show the direction of migration.
During the last years, researches regarding the mechanisms of cline evolution implied molecular approaches.
In Drosophila melanogaster a shsp (heat shock genes) family consisting of seven genes located closely together on chromosome 3 at position 67B was detected (Frydenberg et al., 2003). Some of the genes of shsp family showed a latitudinal cline in the populations of this species along the eastern coast of Australia.
Referring to the same populations, Anderson et al. (2005) described a number of inversions associated with a latitudinal cline in the last 20 years. The cosmopolitan In(3R)Payne inversion polymorphism of Drosophila melanogaster has become of increasing interest because of its potential association with quantitative traits that vary clinally in an adaptative manner. The In (3R) Payne inversions have high frequency in tropical populations, while relatively rare in the temperate populations of the distribution area. This inversion polymorphism has been associated with quantitative traits with clinal variation, such as body size (Calboli et al., 2003), as well as with thermal resistance traits (Anderson et al., 2003), particularly via one of the heat shock genes, hsr-omega.
In the same population of Drosophila melanogaster from eastern Australia, Rako et al. (2007) reveal strong associations between the clinal chromosomal inversion In(3R)Payne and markers within it, as well as among these markers. Of the five predicted associations between markers and traits, four were detected (increased heat, decreased cold resistance and body size with the heat shock gene hsr-omega, increased cold resistance with the inversion In(3R)Payne.

ECOLOGICAL AND GENETICAL IMPLICATIONS OF CLINE EVOLUTION
73
It is argued that adult size clines, inversion frequency clines, and clines in allele frequency at loci involved in glycolysis and glycogen storage are part of the same adaptative strategy. De Jong and Bochdanovits (2003) stated that at high latitudes, selection on Drosophila melanogaster would favour high larval growth rate at low temperatures, and resource storage in adults to survive winter. On the contrary, at low latitudes selection would favour lower larval critical size to survive crowding, and increased male activity leading to high male reproductive success.
Drosophila melanogaster adults from equatorial Kenya are smaller than flies from Cluj, Romania (personal observations), Denmark or Netherlands (Bochdanovits and De Jong, 2003).
In Australia a cline in body size is present along the coast, from Queensland to Tasmania (James et al., 1995). A similar latitudinal cline in body size was noticed in natural Drosophila melanogaster populations from the Baltic to Central Asia, with larger-sized flies at cooler temperatures (Imasheva et al., 1994).
Temperate populations are also larger than tropical populations in wing/thorax ratio. A larger ratio translates into a better flying capacity implying temperate populations would be better flyers. The larger body size in temperate Drosophila melanogaster populations has various causes, either a cline in cell size, cell number or in development time. Temperate populations often develop faster or grow faster than tropical ones (James and Partridge, 1995).
De Jong and Bochdanovits (2003) stated that larger body size in temperate Drosophila melanogaster populations could be related also with high insulin level, which would lead to relatively high storage of nutrients, which would be necessary for winter survival, higher fecundity and high egg laying in cool spring. A relatively high insulin level would however lead to lower longevity. A relatively low insulin level would lead to lower storage of nutrients, but higher starvation resistance of larvae, and small body size. Low insulin activity promotes longevity rather than fecundity, and male longevity might be important in sexual selection.
Recently, Sambucetti et al. (2006) described a clinal variation of developmental time and several size-related traits in Drosophila buzatii along an altitudinal gradient from northwestern Argentina, spanning more than 2000 m in hight. Several fitness-related traits (developmental time, thorax length, wing length and wing loading) were measured in two laboratory generations (G7 and G33). The authors concluded that developmental time was positively correlated with the altitude of the origin population. Wing loading tended to be larger in highland than in lowland populations, suggesting that flight performance was subject to stronger selection pressure in highland populations.
In Drosophila buzatii latitudinal clines of wing loading in eastern Australia were also noticed (Loeschcke et al., 2000). Geographic variation was also evident in populations of Drosophila serrata along a transect on the eastern coast of Australia. In this species the size and wing shapes show a gradual increase with latitudes (Hoffmann and Schirriffs, 2002).

MANUELA DORDEA AND NICOLAE COMAN
74
Huey et al. (2000) studied the speed of clinal evolution in Drosophila subobscura, a species accidentally introduced from Europe into western North and South America in 1978, which spread rapidly in temperate regions. The introduced species, that colonized large areas, was not followed by migration, so clines could quickly evolve. The fly is native to Europe, where it exhibits a clinal increase in wing size with latitude, especially in females. In North American populations, no wing length cline was detected one decade after its introduction. After two decades, however, a cline has evolved and largely converged on the ancestral clines.
Laws of clinal evoution A typical clinal variation was also evident in Japan, in Emma field cricket
(Teleogryllus emma), regarding the duration of nymphal development and the width of the adult head in males (Fig. 3). Both increase clinally from north to south (Ricklefs and Miller,1997). Similar observations were recorded in many other species. Generalizing all the available observations, zoologists have stated some laws, which rule clinal variability in animals. Thus, Bergmann’s rule states that in vertebrates the individuals living at high latitudes tend to be larger than individuals of close relatives living nearer the equator.
Allen’s rule refers to the size of body extremities like ears, limbs, or tails, which appear to be smaller in animals living in areas near poles, than they are in their relatives living in warm regions.
Gloger’s rule asserts that color intensity diminishes in conspecific populations as one moves away from the equator.
Cope’s rule states that population lineages tend to increase body size over geological time (Coman, 2004).
It is noteworthy that all these rules referring to clinal evolution have come under sustained criticism, on account of many exceptions.
Fig. 3. Clinal geographic variation in duration of nymphal development and the width of the adult head in males from six local strains of the Emma field cricket (Teleogryllus
emma) in Japan (after Ricklefs and Miller, 1999).

ECOLOGICAL AND GENETICAL IMPLICATIONS OF CLINE EVOLUTION
75
The most debated was Bergmann’s rule, dated from 1847, which was thought to be valuable only for warm-blooded vertebrates (birds and mammals). In order to test the validity of Bergmann’s rule in Carnivora, Meiri et al. (2004) examined patterns of correlation between skull length and geographical latitude. Only species for which there were more than 20 specimens of a given sex were analyzed. Meiri et al. (2004) examined 67 species that comprise 27% of the 244 species of wild carnivores in the order (Nowak, 1999). The authors have found a positive correlation in 50% of carnivore species, which means species that follow Bergmann’s rule, significant negative correlation in 11% of species, and not significant correlation in the others.
If warm-blooded animals (birds and mammals) obey Bergmann’s rule with some exceptions, poikilotherm species rarely conform to the rule.
Ashton and Feldman (2003) evaluated the relation between body size and latitude in order to verify if Bergmann’s rule hold true for reptiles: chelonians (turtles) and squamates (lizards and snakes). They have found that in chelonians 19 of 23 species increase in size with latitude, whereas squamates followed the converse to Bergmann’s rule (61 of 83 species decrease in size with latitude). In cooler areas, the lizards and snakes with smaller body size gain heat more rapidly, which means in fact a clinal variation also, which is not conform with Bergmann’s rule.
A general explanation for latitudinal and thermal clines in body size will reside in the context of life-history theory. A relatively large body size in cooler environment might be the result of a decrease of competition or advantage in obtaining food.
Angilletta et al. (2004) consider that in lizards, the mechanism responsible for larger body sizes in colder environments is delayed maturation, which results in a greater fecundity, a lower survival capacity to maturity. Higher survivorship of juveniles in colder environments can favour the evolution of Bergmann’s cline. Therefore, Bergmann’s clines result from interactions between biotic and abiotic factors, which create an equilibrium between costs and benefits (Angilletta et al., 2004).
Laugen et al. (2005) studied the validity of Bergmann’s rule in populations of common frog (Rana temporaria) across a 1600 km long latitudinal gradient in Scandinavia, both for wild collected adults and laboratory-reared individuals. The authors found that in adults, the mean body size increased from south to mid-latitudes, and declined thereafter. This occurred despite the fact that the mean age of adult frogs increased with increasing latitude, and age and body size were positively correlated. Their results suggest that the pattern of body size variation across the latitudinal cline might be at least partly genetically determined, and that although there is a considerable geographic variation in the mean body size of Rana temporaria, this variation does not conform to Bergmann’s rule. The latitudinal pattern of body size variation in individuals reared in laboratory was similar.
Ashton (2002) suggested that precipitation and humidity could be important selective factors behind latitudinal and altitudinal body size trends in

MANUELA DORDEA AND NICOLAE COMAN
76
adult amphibians. Since large individuals have better desiccation tolerance than smaller individuals, this could select for large body sizes in dry environments.
In Bocas del Toro Archipelago of Panama, Summers et al. (2003) quantified the levels of variation in spectral reflectance within and among populations of Dendrobates pumilio, generally confirming Gloger’s rule. The authors suggested the possibility of a sexual selection for clinal variation in coloration among the studied populations.
Similarly to Bergmann’s rule, Cope’s rule, illustrated with the evolution of horse’ families, Equidae, has many exceptions. In order to clarify the mechanisms of clinal evolution illustrated by Bergmann’s rule, Cope’s rule, Rapoports’rule, Ashton (2001) recommended that meta-analytical techniques, a group of statistical methods rarely used in ecology and evolution, need to be incorporated in future tests of general trends.
Clinal variation in plants Clinal variation were also noticed in populations of different species of
grasses (Anthoxanthum odoratum, Festuca ovine) which have heavy metal tolerance, allowing them to colonize polluted slagheaps from old mines in Wales (Briggs and Walters, 1997). Certainly, the heavy metal tolerance is the result of mutations that accidentally appeared in the genofonds of that species. Only species with genes for heavy metal tolerance succeeded in colonizing mine wastes in Great Britain (Briggs and Walters, 1997).
Clausen et al. (1941) noticed a clinal variation in Potentilla glandulosa as early as 1941. They found remarkable morphologic differences in conspecific populations growing at different elevations (30, 1530 and 2330m, respectively). Such morphological differences were also noticed between populations of Edelweiss (Leontopodium alpine), growing on the alpine slopes of the Fagaras and the Bucegi mountains and those at low altitudes at Intregalde, near Aiud. The average size of plants growing at high altitudes is small; the flowers are big and covered with white wooly hairs. The specimens growing on hayfield at Intregalde are two times taller. Their flowers are small and the hairs on flowers and leaves scarce (personal observations).
At Gurahont, near Arad, Ilex aquifolium (holly) has the northern limit of distribution. The species survive against the winter frost of the region protected under the high crown of beech forests. Under such circumstances, its height is nearly 3 m, rarely 5 m. The evergreen leaves are thinner and not so leathery as compared to the specimens growing in the Mediterranean zone (personal observations).
The baobab (Adansonia digitata) also called the monkey-bread tree, a huge tree of tropical Africa, makes fruits annually in Guinea and Sudan savannas. In regions with low rainfalls, such as in Sahel savannas, the trees grow only along temporary rivers (weds). Here, they are more precocious and their fruits much smaller. In very droughty years, even if the trees survive, their fruits do not reach maturity (Coman, 1975).

ECOLOGICAL AND GENETICAL IMPLICATIONS OF CLINE EVOLUTION
77
Campbell and Reece (2005) describe a clinal variation in populations of yarrow plants (Achillea borealis) growing on the slopes of the Sierra Nevada Mountains. The mean height of plants collected from 1000 m altitude was 80 cm. The average plant sizes gradually decrease with increasing elevation, so that at 3500 m altitude, plants were only 20 cm height (Fig. 4).
Fig. 4. Clinal variation in yarrow plants (Achillea borealis) growing on the slopes of the
Sierra Mountains Jolivet and Bernasconi (2007) have recently reported a clinal variation in the
European populations of the white campion (Silene latifolia). The authors investigated six geographically separated European populations of the white campion, both for molecular variation at six newly developed microsatellite loci and for quantitative variation in morphological and life-history traits (age at first flowering, plant size, number of leaves, number of stems, time of germination, etc.). The age at first flowering increased significantly with latitude. Based on the clinal variation for the age at first flowering observed in S, latifolia, the authors suggested that the species is adapted to local environments by its phenology and morphology, having a strong adaptative potential. One of the possible explanations of this clinal variation is the particularly interesting biotic interaction between S. latifolia and the specialist seed predator Hadena bicruris (Jolivet and Bernasconi, 2006; Wolfe et al., 2004).
Mølmann et al. (2006) describe an interesting case of clinal variability in Norway spruce (Picea abies). Seedlings of these trees ceased growth when night-

MANUELA DORDEA AND NICOLAE COMAN
78
lengths become shorter than a critical value, and this critical night-length decreased clinally with increasing latitude of origin. The light quality also appeared to play an important role in clinal variation. Northern populations required higher irradiance of both far-red and red light than southern populations. Far-red and red light were more effective in maintaining growth than blue light. The authors suggested that phytochrome(s) are the primary photoreceptors in high irradiance responses maintaining growth in Norway spruce seedlings.
Similar responses to different light qualities, documenting a clinal increase in requirement for far-red light with increasing latitude were noticed for downy birch (Betula pubescens) and bay willow (Håbjørg, 1972; Juntilla, 1976).
Color pattern variation in island populations Clinal variation was found also in populations of bull trout (Salvelinus
confluentus), native in northwestern North America. There are differences between subpopulations that reside in high mountain streams throughout life, and the ones that reside in large rivers and lakes (Dordea and Coman, 2005). Human activities, especially logging, mining, dam- and road-building have drastically reduced the possibility of migration between subpopulations of bull trout (Campbell et al., 1999).
Clinal evolution of color pattern in the northern water snake Nerodia (Natrix) sipedon was for a long time debated. As we already mentioned in a previous paper (Dordea and Coman, 2006) Camin and Ehrlich (1958) initiated the studies regarding the coloration of these snakes in the area of Lake Erie, United States. Close to the shore of Lake Erie, there are small islands with rocky and sandy beaches. As far back as 1937, Conant and Clay noticed that snakes swim from the shores of the lake to islands for breeding. This assumption was later confirmed by Camin and Ehrlich (1958) who concluded that the effect of migration of banded snakes from mainland to islands reduce the effect of natural selection on islands favouring the unbanded individuals. The genetic mechanism responsible for the coloration pattern in water snake is not yet well clear. However, King (1993a) assumed that a complex of genes are involved in the color pattern, the ones that determine bandation being dominant.
Mainland populations of water snakes consist solely of banded individuals. On islands, the snake populations exhibit a continuous variation in color pattern, ranging from regularly banded to uniformly grey, unbanded individuals, the latter ones prevailing. On the mainland with heavily vegetated marshland, natural selection favours the banded water snakes, which offer more protection against predators, especially sea birds.
On the contrary, on islands the frequency of banded individuals is lowering from young ones to adults. Obviously, the unbanded individuals are better adapted to islands where streams are missing and individuals have to cross the sandy beaches to reach the water sources. Moreover, predators, especially sea birds,

ECOLOGICAL AND GENETICAL IMPLICATIONS OF CLINE EVOLUTION
79
easier hunt the banded individuals. Thus, this cryptic coloration increases snakes survivorship on islands (King, 1993b).
Later on, mark-recapture methods confirmed the selective advantage of unbanded individuals on islands. The camouflage of unbanded forms was efficient especially during the first year of life, when the frequency of banded juveniles was high (46%) (Camin and Ehrlich, 1958). The permanent flow of banded individuals from the mainland to islands, prevent island populations to have only unbanded coloration pattern (King and Lawson, 1995). In conclusion, the color pattern variation in island populations results from a balance between gene flow and natural selection.
The differences of gene frequency between conspecific clines are more evident as the capacity of individuals’ movement is lower (Haliburton, 2004). Such differences were reported in industrial melanic butterflies (Bishop and Cook, 1975).
General conclusions Frankham et al. (2002) consider that plants, which are subjected not only to
climatic changes but also to changes in soil composition, exhibit frequency clines more accentuated than animals. The fact that plants do not move, except for pollination and different techniques of seed dissemination, certainly accounts for this increased cline frequency.
Using simulation models, Kelly (2006) confirmed the former conclusions. As the environment changes permanently, and migrations occur recurrently,
natural selection acts powerfully on population gene pools. More often, the gene flow hinders the action of natural selection. However, natural selection and migration are more often in a steady-state, that assure the specificity of local population gene pools, the clines being a result of such equilibrium, thus proving finally the evolution.
REFERENCES
Anderson, A.R., Collinge, J.E., Hoffmann, A.A., Kellett, M., McKechnie, S.W. (2003). Thermal tolerance trade-offs associated with the right arm of chromosome 3 and marked by the hsr-omega gene in Drosophila melanogaster. Heredity, 90, pp.195-202.
Anderson, A.R., Hoffmann, A.A., McKechnie, S.W., Umina, P.A., Weecks, A.R. (2005). The latitudinal cline in the In(3R) Payne inversion polymorphism has shifted in the last 20 years in Australian Drosophila melanogaster populations. Mol. Ecol., 14, pp. 851-858.
Angiletta, M.J., Niewiarowski, P.H., Dunham, A.E., Leaché, A.D., Porter, W.P. (2004). Bergmann’s clines in ectotherms: illustrating a life history perspective with Sceloporine lizards. American Naturalist, 164, pp.168-183.
Ashton, K.G. (2001). Are ecological and evolutionary rules being dismissed prematurely? Diversity and distributions 7, 289-295.
Ashton, K.G. (2002). Do amphibians follow Bergmann’s rule? Can. J Zool., 80, 708-716.

MANUELA DORDEA AND NICOLAE COMAN
80
Ashton, K.G., Feldman, C.R. (2003). Bergmann’s rule in nonavian reptiles: turtles follow it, lizards and snakes reverse it. Evolution 57, 1151-1163.
Azevedo, R.B.R., French, V., Partridge, L. (1996). Thermal evolution of egg size in Drosophila melanogaster. Evolution, 50, 2338-2345.
Bergman, C. (1847). Über die Verhältnisse der Wärmeökonomie der Thiere zu ihrer Grösse. Gottinger Studien, 3, 595-708.
Bishop, J.A., Cook, L.M. (1975). Moth, melanism and clean air. Sci Amer, 232, 90-99. Bochdanovits, Z., de Jong, G. (2003). Co-viariation of larval gene expression and adult body
size in natural populations of Drosophila melanogaster. Mol. Biol. Evol., 20, 1760-1766. Briggs, D., Walters, S.M. (1997). Plant variation and evolution. 3rd ed., Cambridge Univ.
Press, UK. Camin, H.J., Ehrlich, P.R. (1958). Natural selection in water snakes (Natrix sipedon L.) on
islands in Lake Erie. Evolution, 12, 504-511 Campbell, N.A., Reece, J.B., Mitchell, L.G. (1999). Biology. Addison Wesley Longman Inc., NY. Clausen, J., Keck, D.D., Hiesey, W.M. (1941). Regional differentiation in plant species.
Amer. Natur., 75, 231-250. Coman, N. (1975). De la Atlantic la Oceanul Indian. Însemnările unui biolog din prima
expediŃie românească transafricană (1970-71). Edit. Dacia, Cluj-Napoca. Coman, N., Stentzer, I. (1981). InfluenŃa oscilaŃiilor termice şi a regimului fotoperiodic asupra
capacităŃii reproductive la Drosophila melanogaster (Diptera: Drosophilidae). Studia Univ. “Babeş-Bolyai”, Biol. 26, 2, 64-70.
Coman, N. (2004). Genetică, vol. II. University “Babeş-Bolyai” Press, Cluj-Napoca. Conant, R., Clay, W. (1937). A new subspecies of water snake from the islands of Lake Erie.
Ocassional papers of the Museum of Zoology, Univ. Of Michigan, 346, pp. 1-9. De Jong, G., Bochdanovits, Z. (2003). Latitudinal clines in Drosophila melanogaster: body
size, allozyme frequencies, inversion frequencies, and the insulin-signalling pathway. J. Gen., 82, 207-221.
Dordea, M., Coman, N. (2005). Ecologie umană. Casa CărŃii de ŞtiinŃă, Cluj-Napoca. Dordea., M., Coman, N. (2006). Aspects of the evolutionary process in small populations.
Studia Univ. “Babeş-Bolyai”, Biol. 51, 2, 35-51. Frankham, R., Ballou, J.D., Briscoe, D.A. (2002). Introduction to Conservation Genetics.
Cambridge Univ. Press, UK. Frydenberg, J., Hoffmann, A., Loeschcke, V. (2003). DNA sequence variation and
latitudinal associations in hsp23, hsp26 and hsp27 from natural populations of Drosophila melanogaster. Mol Ecol, 12, 2025-2032.
Håbjørg, A. (1972). Effects of light quality, light intensity and night temperature on growth and development of three latitudinal populations of Betula pubescens. Ehrh. Meldinger Fra Norges Landbrukshøgskole, 51, 1-17.
Haliburton, R. (2004). Introduction to population genetics. Pearson Prentice Hall, NY. Hoffmann, A.A., Anderson, A., Hallas, R. (2002). Opposing clines in high and low
temperature resistance in Drosophila melanogaster. Ecol. Lett., 5, 614-618. Hoffmann, A.A., Shirriffs, J. (2002). Geographic variation for wing shape in Drosophila
serrata. Evolution, 56, 1068-1073. Hoffmann, A.A., Sgrò, C.M., Weeks, A.R. (2004). Chromosomal inversion polymorphism
and adaptation. Trends Ecol. Evol. 19, 482-488.

ECOLOGICAL AND GENETICAL IMPLICATIONS OF CLINE EVOLUTION
81
Huey, R.B., Gilchrist, G.W., Carlson, M.L., Berrigan, D., Serra, L. (2000). Rapid evolution of a geographic cline in an introduced fly. Science, 287, 308-309.
Imasheva, A.G., Bubli, O.A., Lazebny, O.E. (1994). Variation in wing length in Eurasian natural population of Drosophila melanogaster. Heredity, 72, 508-514.
James, A.C., Azevedo, R.B.R., Partridge, L. (1995). Cellular basis and development timing in a size cline of Drosophila melanogaster. Genetics, 140, 659-666.
James, A.C., Partridge, L. (1995). Thermal evolution of rate of larval development in Drosophila melanogaster in laboratory and field populations. J. Evol. Biol., 8, 315-330.
Jolivet, C., Bernasconi, G. (2006). Experimental analysis of constitutive and induced defence in plant-seed predator system. Funct. Ecol., 20, 966-972.
Jolivet, C., Bernasconi, G. (2007). Molecular and quantitative genetic differentiation in European populations of Silene latifolia (Caryophyllaceae). Annals of Botany, 100, 119-127.
Juntilla, O. (1976). Apical growth cessation and shoot tip abscission in Salix. Physiologia Plantarum, 38, 278-286.
Kelly, J.K. (2006). Geographical variation in selection from phenotypes to molecules. Amer. Natur., 167, 481-495.
King, R.B. (1993a). Color-pattern variation in Lake Erie water snakes: inheritance. Can. J. Zool., 71, 1985-1990.
King, R.B. (1993b). Color-pattern in Lake Erie water snakes: prediction and measurement of natural selection. Evolution 47, 1819-1833.
King, R.B., Lawson, R. (1995). Color-pattern variation in Lake Erie water snakes: the role of gene flow. Evolution 49 (5), 885-896.
Knibb, W.R., Oakeshott, J.G., Gibson, J.B. (1981). Chromosome inversion polymorphism in Drosophila melanogaster. I. Latitudinal clines and association between inversions in Australian populations. Genetics, 98, 833-847.
Laugen, A.T., Laurilla, A., Jönsson, K.I., Söderman, Merilä, J. (2005). Do common frogs (Rana temporaria) follow Bergmann’s rule? Evolutionary Ecology Research, 7, 717-731.
Loeschcke, V., Bundgaard, J., Barker, J.S.F. (2000). Variation in body size and life history traits in Drosophila aldrichi and D. buzatii from a latitudinal cline in eastern Australia. Heredity, 85, 423-433.
Meiri, S., Dayan, T., Simberloff, D. (2004). Carnivores, biases and Bergmann’s rule. Biol. J. Linn. Soc., 81, 579-588.
Mølmann, J.A., Juntilla, O., Johnsen, Ǿ., Olsen, J.E. (2006). Effects of red, far-red and blue light in maintaining growth in latitudinal populations of Norway spruce (Picea abies). Plant, Cell Environ., 29, 166-172.
Mourant, A.E., Kopé, C., Domaniewska-Sobczak, K. (1976). The distribution of the human blood groups and other polymorphisms. Oxford Univ. Press, London.
Nowak, R.M. (1999). Walker’s mammals of the world. 6th ed. Baltimore, MD, John Hopkins Univ. Press.
Rako, L., Blacket, M.J., McKechnie,S.W., Hoffmann, A.A. (2007). Candidate genes and thermal phenotypes: identifying ecologically important genetic variation for thermotolerance in the Australian Drosophila melanogaster cline. Mol. Ecol., 16, 2948-2957.
Ricklefs, R.E., Miller, G.L. (1999). Ecology, 4th ed., Freeman, NY. Sambucetti, P., Loeschcke, V., Norry, F.M. (2006). Developmental time and size-related
traits in Drosophila buzzatii along an altitudinal gradient from Argentina. Hereditas, 143, 77-83.

MANUELA DORDEA AND NICOLAE COMAN
82
Sperlich, D. (1973). Populationsgenetik. Gustav Fisher Verlag, Stuttgart. Summers, K., Thomas, C.W., Kennedy, T. (2003). Variation in spectral reflectance among
populations of Dendrobates pumilio, the strawberry poison frog in the Bocas del Toro Archipelago, Panama. J. Biogeogr., 30, 35-53.
Wolfe, L.M., Elzinga, J.A., Biere, A. (2004). Increrased susceptibility to enemies following introduction in the invasive plant Silene latifolia. Ecol. Lett., 7, 813-820.

STUDIA UNIVERSITATIS BABEŞ – BOLYAI, BIOLOGIA, LII, 2, 2007 (p.83-92)
===REVIEW===
IRON METABOLISM DISORDER EXPLORATION: CLASSICAL AND MODERN PARAMETERS
MARIANA PATIU 1 AND GABRIEL LASZLO 1
SUMMARY . The biochemical serum markers commonly used to investigate iron metabolism proved to be effective means in solving many of the diagnostic problems raised by the various clinical settings encountered in practice. However, other investigations – hematological ones, assessing the hemoglobinization of red cells – are needed for real-time differentiation between anemia of chronic disease with and without functional iron deficiency. Combining the biochemical and hematological parameters into a single diagram (the so-called diagnostic&therapeutic plot) provides yet another valuable diagnostic tool, useful also in therapy. The recently discovered liver hormone hepcidin appears to be the central regulator of iron metabolism. Other proteins, as well as certain genes, involved in iron metabolism have also been discovered lately, some of them with diagnostic or therapeutic potential. Keywords: iron metabolism, biochemical markers, functional iron deficiency, reticulocyte hemoglobin content, percentage of hypochromic erythrocytes, diagnostic and therapeutic plot, immature reticulocyte fraction, hepcidin.
Introduction Iron is one of the most widespread elements in nature. It is encountered
everywhere in the living world playing important roles in the living organisms: oxygen and electron transporter participating in respiration and energy production; catalyst of several essential metabolic processes, DNA synthesis and cellular proliferation; detoxifying role by reducing the oxidative stress (Hershko,1995). On the other hand, however, iron is itself capable of producing- because of the easy transition between its oxidation states (ferrous and ferric)-reactive species of oxygen (free radicals), having thus a harmful potential for the body (Hinzmann, 2003). As a result both deficiency and excess of iron can have severe pathological consequences, mainly anemias and iron overload (hemochromatosis), respectively (Brittenham, 1991). Therefore, mechanisms exist that strictly regulate iron metabolism, maintaining the balance of iron in the body (Weiss, 1999). Normally, only minimal losses of iron occur, iron being preserved in the body and reused again and again. There exists an iron cycle in the body that consists , essentially, of the one-way flow of iron from the circulation to the erythrocyte-producing bone marrow, then to the circulating red blood cells and, by the aging of these cells, to the reticuloendothelial system, from where the iron gets back into the circulation and the cycle recommences (Lee and Herbert, 1998). Iron
1 Laboratory of Hematology, “ Prof. Dr. I. Chiricuta” Oncology Institute, 73 “21 Decembrie 1989” Blvd,
Cluj-Napoca; Tel:+40-264- 592766 (extension 20); E-mail: [email protected]

MARIANA PATIU AND GABRIEL LASZLO
84
homeostasis regulation is unipolar, performed exclusively at the level of entry of iron in the body; there is no regulation by loss, losses of greater amounts of iron –through blood loss- occurring only in pathological conditions (Brittenham, 1991).
The intestinal absorption of iron is controlled by at least three independent mechanisms: dietary- a higher iron intake renders the intestinal cells refractory for a while to the absorption of iron; the size of the iron stores in the body; and the level of the marrow erythropoietic activity (Andrews, 1999).
Serum iron measurement. For a long time, serum iron measurement held
a central position in the investigation of iron metabolism (Rymer, 1996) and continues to be used very often even today although its sensitivity in detecting iron deficiency is rather low (Koss, 1998). However, it may still be useful sometimes in differentiating the hypochromic anemias when the other tests are inconclusive. The iron measured is iron bound to serum transferrin and does not include hemoglobin iron. The ferric iron is removed from transferrin, transformed to the ferrous state by the addition of a chromogenic reagent, resulting a colored complex that can be measured spectrophotometrically. The assay is analytically very sensitive. Hemolysis and anticoagulation falsify the results. Morning samples of blood have to be used, fasting for 12 hours and any iron-containing medication not being taken for 12-24 hours preceding the test. Serum iron levels show diurnal variation, being about 25% lower in the evening. The reference range varies with age and sex and also, slightly, with the testing method used. Normal values: 60-175 microg/dL for men, 50-170 microg/dL for women. Low values are encountered in iron deficiency anemia and anemia of chronic diseases, high ones in sideroblastic anemias and hemochromatosis (Koss, 1998 ).
Total iron binding capacity (TIBC) measures the amount of iron that the
circulating transferrin could bind in a fully saturated state (normally only about 30% of transferrin is bound to iron).It is an indirect measure of transferrin concentration, expressed as an iron measurement. In combination with serum iron it serves to calculate transferrin saturation with iron. Serum iron and TIBC are most useful in the evaluation of chronic iron overload states and acute iron poisonings. The TIBC test consists of adding ferric iron to the sample, removing all excess, unbound iron and analyzing the remaining sample for iron content using the serum iron method described above. Specimen requirements are the same as for serum iron determination; however, unlike serum iron, TIBC values are not dependent on the time of day the sample is drawn (Koss, 1998). The TIBC reference range for adults is 250 to 425 microg/dL. Serum transferrin concentration may be calculated from the TIBC by using the formula: serum transferrin (in g/L) = 0,007 x TIBC .
Transferrin saturation may be calculated only if serum iron and TIBC
values are available. It is usually used to diagnose iron deficiency, but with a poor

IRON METABOLISM DISORDER EXPLORATION: CLASSICAL AND MODERN PARAMETERS
85
specificity because a low saturation may also be seen in anemias of chronic disease. More importantly, high saturations may be indicative of iron overload. Saturation (in percents) is equal to the ratio of serum iron to TIBC (both expressed in microg/dL), multiplied by one hundred. The reference range is 20-50% saturation in men and 15-50% saturation in women (Koss, 1998).
Serum ferritin . Ferritin, composed of iron and a protein part called
apoferritin, is the main storage form of iron in the body. The extent of the iron stores is reflected by the ferritin found in the serum (Koss, 1998). It was considered until quite recently that each microgram per liter ferritin in the serum would correspond to about 8 mg tissue storage iron, but actually the ferritin level in the serum offers only a guideline, the serum ferritin – storage iron relationship being linear only in a limited value interval (Rymer, 1996). Serum ferritin measurement is valuable in diagnosing iron deficiency because it is, generally, the first laboratory test to become abnormal when iron stores begin to decrease, and before erythrocyte morphology shows any signs of abnormality. Among the hypochromic anemias (iron deficiency anemia, anemia of chronic disease, sideroblastic anemias, minor thalassemia) only iron deficiency anemia shows decreased serum ferritin values, but even increased (or normal) values do not exclude with certainty the presence of iron deficiency, ferritin being an acute phase reactant that increases during inflammatory processes. Serum ferritin can be measured using radioimmunoassays (RIA), enzyme immuno- assays (EIA) and immunoradiometric assays. The reference range varies with method, age and sex. It is 20-250 microg/L in men and 10-120 microg/L in women. Its level generally increases in women in menopause and children generally have low ferritin levels, except during the first month of life. In contrast to serum iron, serum ferritin does not have diurnal variations, neither is it influenced by exogenous iron ingestion (Koss, 1998).
Almost all of the circulating ferritin is in a glycosylated form, thus the glycosylated ferritin measurement may reveal a pathological cell lysis that releases nonglycosylated ferritin into the circulation and reduces the proportion of glycosylated ferritin in the overall serum ferritin (Rymer, 1996).
The erythrocyte ferritin represents the storage form of iron in the
erythrocyte prior to its use in the synthesis of hemoglobin. It reflects the balance between the iron entering (brought by transferrin) and leaving (through the hemoglobin synthesis) the cells; the increased entry, unjustified by increased needs (as happens in hemochromatosis) or the faulty utilization (hemoglobinopathies) increase the ferritin in the erythrocyte, while a reduced delivery or an accelerated utilization of iron (as in hemolytic anemias) decrease it. Although these changes are late manifestations of an affected equilibrium between in- and outputs, erythrocyte ferritin has the advantage of not being influenced by inflammatory processes. In iron overloads erythrocyte ferritin shows an outstanding

MARIANA PATIU AND GABRIEL LASZLO
86
discriminative capacity, differentiating overload in hemochromatosis from that due to alcohol abuse. Erythrocyte ferritin may be used in the surveillance of treatment through repeated bleedings in hemochromatosis, which must be continued even after the collapse of serum ferritin- the iron overload being still important, until the collapse of the erythrocyte ferritin also takes place, a sign that the treatment has achieved its goal (Rymer, 1996).
To eliminate the influence of red cell volume and packed cell volume (hematocrit), the result obtained at the measurement of erythrocyte ferritin in a hemolysate is divided to the number of erythrocytes present. The normal values are 5-38 attog/erythrocyte for men and 3-24 attog/erythrocyte for women. It is worth mentioning the absence of low values in women of fertile age group, as distinct from serum ferritin (Rymer, 1996).
There exist at present attempts to develop an immunological test for the detection of ring sideroblasts in sideroblastic anemias, more specific and more reliable than the conventional Perls reaction that establishes sometimes with difficulty their presence. The test became possible once it was realized that the iron in the granules encircling the nucleus of the ringed sideroblasts is actually in the form of ferritin (the mitochondrial ferritin ), a protein against which antibodies may be raised, usable thereafter for their detection (Cazzola et al., 2003).
Free erythrocyte protoporphyrin, zinc protoporphyri n. Protoporphyrin IX
is the porphyrin compound forming with ferrous iron the heme needed for hemoglobin synthesis. Normally, red cells produce slightly more protoporphyrin than is needed, but when iron is deficient or cannot be properly coupled, protoporphyrin levels build up to several times the normal level as zinc protoporphyrin (ZPP). Although free erythrocyte protoporphyrin (FEP) generally is a very sensitive and valuable early indicator of an iron metabolism disorder, it is not very specific and cannot be used in differentiating iron deficiency, anemia of chronic diseases and sideroblastic anemias because it may be increased in all these conditions. However, FEP is generally normal in thalassemia, being therefore helpful in differentiating thalassemia from iron deficiency anemia and the anemia of chronic disease.
There is disagreement about which laboratory test is the earliest indicator of the onset of a decrease in iron stores. Some advocate serum ferritin, others the FEP. Anyway, an elevated FEP may draw attention to an abnormal iron utilization and can be used as a screening test.
Using whole blood free erythrocyte porphyrins may be measured by extraction methods. A hematofluorometric method measures only ZPP. ZPP and FEP measurements are not equivalent because extraction methods measure all porphyrins including those bound to zinc, but for practical purposes there is good correlation between them. The reference range depends on the method used. Generally, the range for both FEP and ZPP is 17 to 77 microg/dL erythrocytes. The reference range for ZPP may also be expressed as 30 to 70 micromol ZPP/mol of heme (Koss, 1998).

IRON METABOLISM DISORDER EXPLORATION: CLASSICAL AND MODERN PARAMETERS
87
The soluble transferrin receptor is a truncated form of the tissue transferrin receptor, present on cells that have a need in iron. Over 80% of the cellular receptors is located in the erythroid marrow, so that the concentration of the circulating soluble receptor is primarily determined by the erythropoietic activity of the marrow. Decreased levels are found in erythroid hypoplasias (aplastic or hypoplastic anemia, chronic renal failure), increased levels in erythroid hyperplasia (thalassemia major, sickle cell anemia, chronic hemolytic anemia), but also in iron deficiency, the lack of iron causing increased receptor synthesis, and the receptors are eventually shed into the blood. In the absence of other conditions causing erythroid hyperplasia, an increase in sTfR concentration provides a sensitive, quantitative measure of tissue iron deficiency. Most importantly, the circulating receptor concentration is not increased in infection or inflammation, unlike ferritin. Immunoassays detecting the soluble transferrin receptor are now available (Brittenham et al., 2000). The reference ranges depend on the commercial kit used, being different for the different companies producing it. The main drawback for its widespread use is the lack of standardization, due primarily to rivalry between manufacturers (Cook et al., 2003, Metzgeroth and Hastka, 2004, Brugnara, 2003).
The contribution of the newly recognized transferrin receptor 2 to the circulating receptor pool has not yet been established (Brittenham et al., 2000).
The use of soluble transferrin receptor (sTfR) and serum ferritin (F) can help distinguish among iron deficiency anemia (IDA), anemia of chronic disease (ACD), and the combined presence of these by considering the ferritin values lower than 30 ng/ml to be characteristic of IDA, those higher than 100 ng/ml as typical of ACD, while those between 30 and 100 ng/ml may represent either the ACD or the combined ACD&IDA. Differentiation between them is made using the so-called sTfR/F index –that is, the ratio of sTfR to F or, even better, to logF - , the ratio being lower than 1 in the first case (ACD) and greater than 2 in the other (ACD & IDA). Measurement of circulating cytokines, normal in amount in IDA but increased in ACD&IDA, may once more reinforce the diagnosis established as described above (Weiss and Goodnough, 2005).
Functional iron deficiency in ACD, a term used to describe the incapacity of
full but blocked iron stores to deliver iron to the marrow (thus when both deficient endogenous EPO and full but blocked iron stores exist), but also the impossibility of iron supply to keep pace with the increased demands (Hinzmann, 2003, Weiss, Goodnough, 2005, Thomas andThomas, 2002, Fitzsimons, Brock, 2001) during exogenous EPO therapy, cannot be diagnosed in real time by the usual biochemical tests. This can be achieved only by hemoglobinization (that is, the hemoglobin content) measurements of red cells (Thomas and Thomas, 2005). Hemoglobin concentration and cell volume of reticulocytes and erythrocytes can be measured flow-cytometrically, cell by cell, based on laser light scattering by the cells; from the product of these parameters the analyzer then calculates automatically the Hb content of the cell. Two new parameters thus result: the reticulocyte hemoglobin content (CHr) and the

MARIANA PATIU AND GABRIEL LASZLO
88
percentage of hypochromic erythrocytes (%HYPO). Hypochromic erythrocytes (%HYPO) (that is, the percentage of erythrocytes with a Hb content less than 28 pg), normally below 2.5%, is increased and CHr is decreased in iron deficiency, irrespective of the presence or absence of inflammation (Hinzmann, 2003) (although some studies indicate the opposite) (Metzgeroth and Hastka, 2004, Hackeng et al., 2004). Since erythrocytes have a lifetime of about 120 days, %HYPO represents a long-time average value, whereas the Hb content of reticulocytes, that exist only for a few days before they mature into erythrocytes, acts like a “snapshot” of the acute condition and is therefore a much more useful tool to immediately assess the success or failure of treatment. Both CHr and the reticulocyte count indicate much earlier than other measurements (hemoglobin, red cell count) the response to treatment, but the former has the advantage of referring also to the functional quality (hemoglobinization) of the cells (Hinzmann, 2003, Metzgeroth and Hastka, 2004).
A so-called diagnostic and therapeutic plot (Fig. 1) has been proposed to assess iron status in ACD and also the evolution of iron deficiency in IDA and ACD with and without functional iron deficiency. The therapeutic implications of the plot are to differentiate patients who should be administered oral iron, exogenous EPO or a combination of EPO and iron (Thomas and Thomas, 2005).
- repleted iron stores- normal hemoglobinization- therapy: exogenous EPO
1
-functional iron deficiency- repleted but blocked iron storesor iron stores cannot keep pace
with demand during EPO therapy-decreased hemoglobinization
of red cells-therapy: i.v. iron + exogenous EPO
3
- depleted iron stores- decreased hemoglobinization
-therapy: oral iron
4
-iron stores on the way to become filled or emptied- normal hemoglobinizationalready started or decreased
-hemoglobinization not yet begun
- therapy: oral iron2
sTfR (mg/l) / logF (µg/l)
CHr(pg)
1.5in the absence of inflammation
(or 0.8 when inflammation present)
28
Fig. 1. The diagnostic and therapeutic plot (adapted from Thomas and Thomas, 2002)

IRON METABOLISM DISORDER EXPLORATION: CLASSICAL AND MODERN PARAMETERS
89
The sTfR-F index on the abscissa is plotted against the CHr on the ordinate. Using appropriate cut-off values for both parameters, four areas result: patients in area 1 have full iron stores and show normal hemoglobinization of red cells. Their anemia is due to a deficiency of endogenous erythropoietin (EPO) in chronic disease, cancer, chronic hemodialysis. Treatment is by exogenous, recombinant EPO, but patients may develop functional iron deficiency due to the incapacity of iron delivery to satisfy the needs imposed by therapy, getting thus into area 4. Patients in area 3 have IDA with empty iron stores and decreased hemoglobinization of the reticulocytes, requiring oral iron therapy.
Many patients in area 2 are “coming” from area 3 and are “on the way” to area 1 during iron replenishment. They stay “in transition” in area 2 for four to six weeks. Other patients in area 2 may come from area 1 by developing in the course of their disease a latent iron deficiency with iron stores decreasing but still high enough to ensure normal hemoglobinization of the reticulocytes. Thirdly, those with hyperproliferative erythropoiesis, as after acute hemorrhage, in hemolytic anemia or in late pregnancy, also belong to area 2.
Area 4 (the functional iron deficiency area) represents the patients with chronic disease, cancer or on chronic hemodialysis who have a deficiency of endogenous EPO and full but blocked iron stores, and also the patients in area 1 whose iron needs during therapy with exogenous EPO exceed the iron supply to the marrow. Intravenous iron and exogenous EPO have to be given to them (Hinzmann, 2003, Thomas, Thomas, 2002) .
The beta-thalassemias are, also, predominantly found in area 4(Hinzmann, 2003, Thomas and Thomas, 2002).
The cut-off value for the reticulocyte hemoglobin content is about 28 pg, while that for sTfR/F depends on whether inflammation (which modifies ferritin in the ratio) is present or not: it is 0.8 in the former, 1.5 in the latter case. The C-reactive protein can distinguish between the two situations, being greater than 5 mg/L when inflammation present (Hinzmann, 2003, Metzgeroth Hastka, 2004, Thomas and Thomas, 2002, Brugnara, 2003).
There are other uses of the hematological indices as well: recently developed iron deficiency displays an inverted, that is less than 1, ratio of the hemoglobin content of reticulocytes to hemoglobin content of more mature red cells, as compared with the normal ratio, where the reticulocyte content is greater (Thomas and Thomas, 2002).
Diagnosis of beta-thalassemia trait has been facilitated by determination of the ratio of the percentage of microcytic cells to the percentage of hypochromic red cells, a ratio greater than 0.9 and microcytic red cells more than 20% raising this suspicion. For confirmation, well established methods (electrophoresis, chromatography) may be used (Thomas and Thomas, 2002).
CHr appears to be also in children superior to other markers in predicting iron deficiency and IDA (Hinzmann, 2003).
Using fluorochrome staining and flow cytometry it is possible to quantify the reticulocyte fractions with low-, middle- and high-fluorescence intensity and

MARIANA PATIU AND GABRIEL LASZLO
90
thus to assess reticulocyte maturation and to identify the most immature reticulocytes, which contain more RNA and form therefore the high-fluorescence fraction (Metsgeroth and Hastka, 2004, Dotson, 1993).
Measurement of the immature reticulocyte fraction, also called the “left-shifted” reticulocyte count, has proved its clinical usefulness in following chemotherapy, EPO therapy and marrow failure (Koss, 1998).
Several proteins, but also some genes, involved at different levels in iron homeostasis and metabolism, have recently been identified: iron-regulatory proteins (IRP-1, IRP-2); HFE protein – the product of the HFE gene, mutated in hemochromatosis; divalent metal transporter (DMT 1); transferrin receptor 2; hephaestin; the “Stimulator of Fe Transport “ (SFT); frataxin ; ferroportin 1 (Brittenham et al., 2000) .
HFE protein binds to the cellular transferrin receptor and seems to determine receptor affinity for iron-transporting transferrin. The iron-transferrin – transferrin receptor +/-HFE complex enters the cell by internalization within an endosome, then iron is freed and transported across the endosomal membrane via DMT -1, getting into the cytoplasm. In erythroid cells most of the iron passes to the mitochondria and is used for hemoglobin synthesis. The iron-regulatory proteins control iron availability by controlling, at translational level, the synthesis of transferrin receptor (thereby increasing iron uptake by the cell) and of ferritin (increasing iron storage) in the cell. They bind to “iron-responsive elements” in the transferrin-receptor– and ferritin messenger RNA, in the mRNAs for the erythroid-specific delta-ALA synthase and mitochondrial aconitase, as well as in one of the two isoforms of DMT -1. The IRPs thus connect intracellular iron availability with cellular iron utilization, erythropoiesis, mitochondrial energy metabolism and cellular responses to inflammation and oxidative stress, providing a coordinated regulation of these. For example, shortage in iron causes binding of IRP to IRE that inhibits delta-ALA synthase (the first enzyme in the heme synthesis pathway) and ferritin syntheses and TfR mRNA degradation. Conversely, a high iron level in the cell has the opposite effects.
The SFT enhances both transferrin- and nontransferrin-bound iron transport, while frataxin (a mitochondrial protein), expressed in neuronal and cardiac tissue, seems to be involved in mitochondrial iron homeostasis. DMT -1 also serves as a transporter of iron from the intestinal lumen into the enterocyte and hephaestin facilitates the exit of iron from the enterocyte into the circulation (Brittenham et al., 2000).
The outstandingly important role of the liver in determining the amount of iron absorbed from the intestine and released from the storage sites - thus in the modulation of iron release from the cell - mediated by ferroportin 1, becomes more and more evident. The newly discovered liver hormone, hepcidin, is considered at present the central regulator of iron homeostasis and metabolism. Factors known to influence intestinal iron absorption, such as the body’s iron stores, erythropoietic marrow activity, the blood level of hemoglobin, oxygen and inflammatory cytokines, also regulate liver hepcidin expression. Absorption increases with decreased expression and decreases when expression increases. Enterocytes, the macrophages of the reticuloendothelial
IRON METABOLISM DISORDER EXPLORATION: CLASSICAL AND MODERN PARAMETERS
91
system and liver cells – that is, the cells by which absorption and storage of iron take place – are the cellular targets of hepcidin . Ferroportin accomplishes iron export from these cells, and hepcidin, by binding to ferroportin, causes the internalization and degradation of ferroportin in the cell, thus preventing the exit of iron from the cell. The effects are decreased transfer of iron from enterocytes into the circulation and the increase of iron stores in macrophages and liver cells. Liver cells also possess transferrin receptors of type 2 that may act as a sensor of circulating iron and thereby influence hepcidin expression, hepcidin synthesis being modulated also by HFE protein and the product of a recently discovered gene – hemojuvelin. Iron homeostasis regulation by hepcidin offers a unifying explanation for the diametrically opposed abnormalities in iron metabolism seen in hereditary hemochromatosis and the anemia of chronic disease: hepcidin expression is low in the former and increased in the latter condition, with all the consequences deriving from this (Fleming and Bacon, 2005).
The HFE gene is mutated in most of the patients with hereditary hemochromatosis, although the genes coding for transferrin receptor 2 or hemojuvelin are the genes affected in others. The last one is mutated in most persons with juvenile hereditary hemochromatosis (Fleming and Bacon, 2005).
Conclusions These achievements in the better understanding of the pathophysiological
aspects will also have, without doubt, an impact on the diagnosis and therapy of iron metabolism disorders. In some respects the practical benefits are already present: the discovery, in 1996, of the HFE gene that is mutated in most patients with hereditary hemochromatosis has provided a powerful genetic diagnostic test that has radically transformed the diagnostic strategy and overall management of a disease that, from now on, curiously enough, joins the genetic diagnosis with a therapy (venesection) worthy of the Middle Ages (Brittenham et al., 2000) !
Hepcidin antagonists or, on the contrary, exogenous hepcidin may become, in the future, new therapeutic tools in the anemia of chronic disease and hemochromatosis, respectively, likewise to the use of erythropoiesis-stimulating hormones or cytokines in inflammatory conditions (Fleming and Bacon, 2005).
Iron metabolism exploration, which commenced almost a century ago with the measurement of blood iron concentration, has entered the molecular age (Rymer, 1996).
REFERENCES Andrews, N. (1999) Disorders of iron metabolism, N Engl J Med, 341, 1986-1995. Brittenham, G.M., Disorders of iron metabolism: iron deficiency and overload, In Hematology
Basic Principles and Practice, Hoffman, R., Benz, E.J., Shattil, S.J., Furie, B., Cohen, H.J. (eds), Churchill Livingstone, New York, 1991, p.327-349.

MARIANA PATIU AND GABRIEL LASZLO
92
Brittenham, G.M., Weiss, G., Brissot, P., Laine, F., Guillygomarc’h, A., Guyader, D., Moirand, R., Deuganier, Y. (2000) Clinical consequences of new insights in the pathophysiology of disorders of iron and heme metabolism, Hematology, 1, 39-50.
Brugnara C (2003) Iron deficiency and erythropoiesis: new diagnostic approaches, Clin Chem., 49, 1573-1578.
Cazzola, M., Invernizzi, R., Bergamaschi, G., Levi, S., Corsi, B., Travaglino, E., Rolandi, V., Biasotto, G., Drysdale, J., Arosio, P. (2003) Mitochondrial ferritin expression in erythroid cells from patients with sideroblastic anemia, Blood, 101, 1996-2000.
Cook, J.O., Flowers, C.H., Skikne, B.S. (2003) The quantitative assessment of body iron, Blood, 101, 3359-3363.
Dotson, M.A, Automation in hematology, In: Principles of Laboratory Instruments, Schoeff, L.E., Williams, R.H. (eds), Mosby, St. Louis, 1993, pp.361-378.
Fitzsimons, E.J., Brock, J.H. (2001) The anaemia of chronic disease, Brit. Med. J, 322, 811-812. Fleming, R.E., Bacon, B.R. (2005) Orchestration of iron homeostasis, N Engl J Med, 352 1741-1744. Hackeng, C.M., Beerenhout, C.M., Hermans, M., Van Der Kuy, P.H., Van Der Dussen, H., van
Dieijen-Visser, M.P., Hamulyak, K., Van Der Sande, F.M., Leunissen, K.M., Kooman, J.P (2004) The relationship between reticulocyte hemoglobin content with C-reactive protein and conventional iron parameters in dialysis patients, J Nephrol, 17, 107-111.
Hershko, C. Current thoughts on iron deficiency, In: Progress in Iron Research, Hershko, C., Konijn, A.M., Aisen, P. (eds.), Plenum Publishing Corporation, New York, 1995
Hinzmann, R (2003) Iron metabolism, iron deficiency and anaemia. from diagnosis to treatment and monitoring, Sysmex J. Intl, 13, 65-74.
Koss, W. Anemias of abnormal iron metabolism and hemochromatosis, Laboratory tests useful in differentiating disorders of iron metabolism. In: Clinical Hematology Principles, Procedures, Correlations, 2nd edition, Stiene-Martin, E.A., Lotspeich-Steininger, C.A., Koepke, J.A. (eds), Lippincott, Philadelphia, 1998, pp.176-178.
Lee GR, Herbert V: Nutritional Factors in the Production and Function of Erythrocytes, In: Wintrobe’s Clinical Hematology, 10th edition, Lee, G.R., Foerster, J., Lukens, J., Frixos, P., Greer, J.P., Rodgers, G.M. (eds), Williams &Wilkins, Baltimore, 1998, pp. 228-226
Metzgeroth, G., Hastka, J. (2004) Diagnostic work-up of iron deficiency, J Lab Med, 28, 391-399. Rymer, J.C. (1996) Aspects recents du metabolisme du fer; les outils biochimiques de son
exploration, Hematologie, 2, 45-56. Thomas, C., Thomas, L. (2002) Biochemical markers and hematologic indices in the diagnosis
of functional iron deficiency, Clin. Chem., 48, 1066-1076. Thomas, C., Thomas, L. (2005) Anemia of chronic disease:pathophysiology and laboratory
diagnosis, Lab Hematol, 11, 14-23. Weiss, G. (1999) Iron and anaemia of chronic disease, Kidney International, 55, Suppl. 69,
pp S 12- S 17. Weiss, G., Goodnough, L.T. (2005) Anemia of chronic disease, N Engl J Med, 352, 1011-1023.

STUDIA UNIVERSITATIS BABEŞ - BOLYAI, BIOLOGIA, LII, 2, 2007 (p. 93-99)
ANTIMICROBIAL EFFICIENCY OF SOME DISINFECTANTS AGAINST BACTERIA AND FUNGI WITH SURFACE TEST
ILDIKO-IREN RACKOVY1 AND MIHAIL DRĂGAN-BULARDA2
SUMMARY. The efficiency of seven disinfectants (Terralin, Domestos, Microzid AF, Omnicide, P3-Topax66, Quick javel, Cidex) was tested against Staphylococcus aureus ATCC 25923, Escherichia coli ATCC 25922, Pseudomonas aeruginosa ATCC 27853, Candida albicans ATCC 10231, Bacillus subtilis ATCC 6633, Aspergillus niger ATCC 16404 with surface tests. Surface test were used in order to evaluate the efficiency of disinfectants during the everyday sanitizing practice in the special industrial and hospital surfaces. Test organisms represented pathogen-, spore forming bacteria, yeasts and moulds. Surface test was started with minimal concentration of agents and was not increased above the maximal concentrations which were offered by manufacturers in order not to corrode surfaces or risk the safety of use. Test organisms were inoculated on test areas and after drying inoculated surfaces were treated with disinfectants. Seven disinfectants were tested and four were effective against every test organisms (Omnicide: 0.5 %, P3-Topax66: 5%, Cidex: 100 %, Terralin 0.5 %). Three disinfectants were ineffective against Aspergillus niger (Terralin: 0.2 %, Domestos: 2 %, Topax 0.2) and 1 against Bacillus subrilis and Candida albicans (Microzid AF: 100%). Keywords: disinfectant, sanitation, bacteria, fungi, surface test
Introduction The source of microbial contamination in process systems can be the raw
material, product-contact surfaces, air and manufacturing workers. In hospitals the source of microbial contamination can be the patients, the nurses and those surfaces and objects which are touched by them. Disinfection is the main tool for controlling contamination from equipment surfaces. The overall aim of sanitation is to prevent microbial growth during the interproduction period (Zottola and Sasahara, 1994). Microorganism can adapt to disinfectants therefore the effectiveness of these cleaning agents must be controlled periodically to minimize acquired resistance. Wilson (1986) reported several methods to select proper concentration of disinfectants for effective microbial control of aseptic processing areas. European Suspension Test (Anonymus, 1993) has been developed to investigate the bactericide, fungicide and sporocide efficiency of disinfectant. Suspension tests do not simulate disinfection on product contact surfaces. Surface tests evaluate efficiency of disinfectants on hard surfaces which are common in food industry, hospitals and demonstrate their activity against microorganisms on contaminated surfaces. Impedimetric detection of the effectiveness of disinfectants has been also developed (Holah et al., 1990). This method provides possibility for investigation of sanitation in suspension and on surfaces as well. 1 Public Health Autority, Târgu-Mureş, Romania; E-mail: [email protected] 2 Babeş-Bolyai University, Department of Experimental Biology, Cluj-Napoca, Romania; E-mail:

ILDIKO-IREN RACKOVY AND MIHAIL DR ĂGAN-BULARDA
94
The aim of this work was to investigate the ability of seven commercial disinfectants against different strains of bacteria and fungi in suspension on different industrial and hospital surfaces.
Materials and methods Cultures. Test cultures used for investigations were chosen according to
Wilson, J. D. (1986) and Pharmacopeial Forum (2002): Staphylococcus aureus ATCC 25923, Escherichia coli ATCC 25922, Pseudomonas aeruginosa ATCC 27853, Candida albicans ATCC 10231, Bacillus subtilis ATCC 6633, Aspergillus niger ATCC 16404. They were obtained from CE Remel (England). Strains were stored on agar slants at 4 °C. Staphylococcus aureus, Escherichia coli was grown at 36±2°C for 24-48 hours. Pseudomonas aeruginosa and Bacillus subtilis was incubated at 33±2 °C for 24-48 hours. Candida albicans was grown at 23±2 °C, 48-72 hours while Aspergillus niger was grown at 23±2 °C for 5 days.
Sanitizers. Seven types of sanitizers were tested. They were diluted according to the manufacturer instructions. Dilution was made with tap-water. The active agent and recommended concentration of sanitizers are listed in Table 1.
Sanitizer treatment. In the first step the maximum of recommended dilution of disinfectants (Terralin 0.2-0.5%, P3-Topax66 2-5%, Domestos 1%, Microzid AF 100 %, Omnicide 0.2-0.5 %, Quick javel 1%, Cidex 1%) were used. Dilution was made with tap-water except Cidex and Microzid AF, which were used without dilution. When the results of first test were not acceptable the concentration of disinfectants was increased and the test was repeated. All tests were repeated twice for each test-organism.
The method was elaborated according to Good Manufacturing Practise (GMP) recommendation, to Pharmacopeial Forum (Anonymus, 2002) and to Wilson (1986). 25 cm2 test-areas were determined and designated for each disinfectant and for control in glass, stainless steel, tile, plastic, wood.
A dilution of 104 organisms per ml was made from each test-culture. Phosphate-buffer was used for dilution. Volume of 0.1 ml of test cultures were spot-inoculated on the determined and designated areas after cleaning with detergent, rinsing with tap-water, degreasing and disinfecting with 70 % ethanol. Each test-area was inoculated with approximately 103 test organisms/25 cm2. The surface was air-dried at room temperature for 30 minutes. After drying 0.2 ml of diluted disinfectants were inoculated in each test-area. Exposure time was 30 minute while disinfected surfaces were dried just like in the industrial and hospital practice. Control-areas were not treated with any disinfectant. Sampling was made with contact media by analogy with common hygienic control practice. Contact media contains a range of neutralizing agents to inactivate the disinfectants. After proper incubation (Staphylococcus aureus: 36±2 °C, 24-48 hours; Escherichia coli: 36±2 °C, 24-48 hours; Pseudomonas aeruginosa: 33±2 °C, 24-48 hours; Candida albicans: 23±2 °C, 48-72 hours; Bacillus subtilis: 33±2 °C, 48 hours; Aspergillus niger: 23±2 °C, 5 days) the number of survived cells (CFU/25 cm2) was compared to the control.

ANTIMICROBIAL EFFICIENCY OF SOME DISINFECTANTS …
95
Table 1. Disinfectants tested against test-organisms by surface-test
Disinfectant Recommended concentration Active agents
P3-Topax66 2-5 % Potassium-hydroxide, Sodium-hypochlorite, Non-ionic surfactant
Terralin 0.2-0.5 % Dimethylbenzil – alchil- amoniuclorid, fenoxipropanol, Non-ionic surfactant
Domestos 1-2 % Sodium-hypochlorite, Non-ionic surfactant, Sodium-hydroxide
Microzid AF Undiluted Etanol , Propanol Omnicide 0.2-0.5 % Glutaraldehyde, Dimetilbenzil-coco-amoniumclorid Quick javel 1 % Sodium- diclorizocianurat, Sodium-carbonat, Adipic acid Cidex Undiluted Glutaraldehyde
The efficiency of disinfectants was evaluated by the formula: LRV = log N0/N where LRV is the logarithmic reduction value of CFU, N0 is the initial and N is the final number of organisms (CFU/25 cm2). The efficiency of disinfectants was accepted when: LRV ≥ 2. The data in Tables show the averages of parallel tests. PRV (Percentable reduction value of CFU) was used for statistical evaluation which were carried out with MINITAB 9.2 software (ANOVA).
Results and Discussion Tables 2 and 3 show the effect of Microzid AF on the viability of the six test
organisms. There was no significant difference in the efficiency of Microzid AF on the different test surfaces except for the wood surface but there was on different test organisms (α=0.05). Fisher method showed significant difference in the efficiency of Microzid AF against Bacillus subtilis, Aspergillus niger and Candida albicans ascompared to other test organisms. Similarly, Pasanen et al. (1997) found that the effectiveness of alcohol based products to inhibit fungal growth was relatively low. The lower biocidal effect of alcohols, one of the main components of Microzid AF, was not surprising as alcohols are quite ineffective in destroying bacteria and fungi.
P3-Topax 66 was effective against all test organisms in 5% solution. Non-ionic surfactant compounds provide good penetrating ability into the organic materials on surfaces. Hypo-chlorites provide bactericide, fungicide and virucide effect.
The efficiency of P3-Topax is shown in Tables 2 and 3. According to the result of the surface test the 0.2 of P3-Topax was not effective against Bacillus subtilis and Candida albicans. This fact has to be taken into consideration as this disinfectant is used in food-industry. No significant difference was shown in the efficiency of P3-Topax66 5% on different test surfaces (α=0.05), however, P3-Topax66 5% was significantly more efficient on E. coli, Ps. aeruginosa and S. aureus than B. subtilis, C. albicans and A. niger analysed by Fisher method. Hypo-chlorites are effective against various type of organisms demanding very short contact time (Burge et al. 1989).

ILDIKO-IREN RACKOVY AND MIHAIL DR ĂGAN-BULARDA
96
Pasanen and co-workers (1997) reported that hypo-chlorite based products provided the best biocidal effect, preventing fungal growth on dusty sheet metal.
After cells were exposed to Omnicide in 0.5% solution the number of test organisms was reduced by at least 2 log cycles on every surface (Table 2, 3). No significant difference was observed comparing different test organisms and surfaces. Good bactericide and fungicide properties of Omnicide are the result of strong antimicrobial action of aldehides. They cause protein and enzyme denaturation and membrane damage of microbial cell.
According to the results of surface test (Tables 2 and 3), Domestos was effective in 1% solution against all test organisms except for A. niger. The results of surface test of Borneff et al.(1988) also demonstrate bactericide effect of Domestos. Because Domestos is a chlorine based disinfectant the good sanitizing activity was not surprising. Hypo-chlorites are effective against various types of organisms (Burge et al. 1989). The weak inhibitory effect against A. niger was unexpected. In contrast with our results Pasanen et al.(1997) reported that hypo-chlorite based products provided the best biocidal effect, preventing fungal growth completely on dusty sheet metal. In case of A. niger increased concentration to 2% was not effective either. The concentration of Domestos was not raised above 2% because a higher concentration of chlorine is deleterious on surfaces during everyday disinfection. This indicates that application of Domestos in the recommended concentration may cause microbiological contamination with this fungi. Non-ionic surfactant compounds provide good penetrating ability into the organic materials on surfaces.
Quick javel, similarly to Domestos, was not effective against A. niger (Tables 2 and 3). Results of surface test of P3-Topax66 and Domestos show less effectiveness against C. albicans than did Waltimo et al. (1999). They reported that 5 and 0.5 %-of sodium-hipochlorite was effective against the test organisms.
Quaternary ammonium compounds are considered as bound biocides (Burge et al. 1989). They are attached chemically to the surface providing a permanent effective dose during sanitation (Kemper and White, 1991, Speier and Malek, 1982). In spite of this fact the results of Terralin (Table 2 and 3)- with quaternary ammonium compounds as active agent- are similar to the results of Domestos. Both were ineffective against A. niger in solution of 0.2% and 1%. Fisher method showed significant difference in the efficiency of Terralin 0.2% against S. aureus, B. subtilis, C. albicans, A. niger as compared to other test organisms. In the repeated test increased concentration (0.5) was used, which was effective, the number of test organisms was reduced by at least 2 log cycles on every surface. The investigations of Pasanen et al.(1997) presented similarly low effectiveness of quaterner ammonium compounds against filamentous fungi. Bobichon et al. (1993) demonstrated similar effectiveness of Terralin against C. albicans in surface test.
Cidex was the most effective disinfectant (Tables 2 and 3) as the LRV was more than 2 in every test. Cidex was effective against every test organisms. Similarly to Omnicide, the active agent in Cidex is an aldehidic compound (glutaraldehide). Glutaraldehide react with functional groups of the cell (e.g. –COOH, -CHO, -NH2, -SH2, -OH) causing cytotic effect on microbial cells. There was no significant

ANTIMICROBIAL EFFICIENCY OF SOME DISINFECTANTS …
97
difference in any surface or against any test organisms. The antifungal effect of Cidex on C. albicans were investigated by Yuce et al. (1996) using a rubber germ carrier method. They also observed very good antifungal properties of this sanitizer. Subcultures of C. albicans strains showed no growth after 2 and 7 days of incubation.
Conclusions The results obtained in the present study for the seven studied disinfectants showed that four of them were efficient (Omnicide 0.5%, P3Topax66 5%, Cydex undiluted, Terralin 0.5%) against the studied microorganisms (Staph. aureus, E. coli, Ps. aeruginosa, Bac. subtilis, C. albicans, Asp. niger).
The next three disinfectants (Terralin 0.2%, Domestos 2%, P3Topax66) were inefficient against Asp. niger, while Microzid AF undiluted was inefficient against Bac. subtilis and Candida albicans.
Statistical analysis showed no significant difference in the efficiency of disinfectants on the different test surfaces which means that all surfaces which were tested and common in food plants and hospitals are proper and equally easy to clean and disinfect. Although it has to be mentioned that on wooden surface alcohol based biocides are quite ineffective in destruction of fungi.
Table 2. The logarithmic reduction value of CFU (LRV) using different disinfectants against non-
spore forming test bacteria on different surfaces
E. coli Ps. Aeruginosa Staph. aureus Microorganism
a b c d e a b c d e a b c d e
P3-Topax 66 2 % 2.8 2.3 >2.0 2.0 2.3 >2.0 >2.0 >2.0 2.3 2.2 2.0 >2.0 >2.0
>2.1
7 >2.0
P3-Topax 66 5 % NT NT NT NT NT NT NT NT NT NT >2.0 >2.0 >2.3 >2.8 >2.4
Terralin 0.2 % 2.3 1.8 >2.0 >2.0 2.0 >2.0 >2.0 >2.0 >2.0 >2.0 >2.0 >2.0 1.6 >2.0 1.8
Terralin 0.5 % NT NT >2,0 >2,0 >2,0 NT NT NT NT NT 3,0 3,0 2,6 2,6 2,2
Domestos 1% >2.0 >2.0 >2.0 >2.0 >2.0 >2.0 2.0 >2.0 >2.0 2.5 >2.0 >2.0 >2.0 >2.0 2.7
Domestos 2% NT NT NT NT NT NT NT NT NT NT NT NT NT NT NT
MicrozidAF100
% >2.0 >2.0 >2.0 >2.0 2.3 >2.0 2.3 >2.0 2.3 >2.0 3.0 3.0 >2.0 2.1 >2.0
Omnicide 0.2% >2.0 2.3 2.3 >2.0 >2.0 >2.0 >2.0 >2.0 2.6 2.3 >2.0 2.7 >2.0 >2.0 1.8
Omnicide 0.5% >2.0 2.3 >2.0 >2.0 >2.0 >2.0 >2.0 >2.0 >2.0 >2.0 >2.0 >2.0 >2.0 5.0 >2.0
Quick Javel 1% 2.3 >2.0 2.3 2.6 2.6 5.0 2.6 5.0 5.0 5.0 >2.0 >2.0 >2.0 >2.0 >2.0
Cidex >2.0 >2.0 >2.0 >2.0 >2.0 >2.0 >2.0 >2.0 >2.0 >2.0 2.2 2.7 >2.0 >2.0 2.7
NT means not tested; a= Glass; b= Plastic; c= Stainless steal; d= Tile e= wood

ILDIKO-IREN RACKOVY AND MIHAIL DR ĂGAN-BULARDA
98
Table 3.
The logarithmic reduction value of CFU (LRV) using different disinfectants against test fungi and Bac.subtilis on different surfaces
C. albicans A. niger B. subtilis
Microorganism a b C d e a b c d e a b C d e
P3-Topax66 2 % >2.0 2.0 1.8 >2.0 1.6 1.2 1.4 1.6 1.3 1.4 2.2 2.0 2.0 2.4 2.0
P3-Topax66 5 % 2.3 >2.0 >2.0 2.3 2.6 >2.0 1.9 1.6 1.4 1.6 NT NT NT NT NT
Terralin 0.2 % >2.0 1.8 1.8 >2.0 2.0 1.0 1.0 1.0 1.0 1.0 >2.0 1.8 1.6 2.0 1.8
Terralin 0.5 % NT >2.0 >2.0 NT NT 2.0 2.0 2.0 1.8 1.8 2.3 2.6 2.4 >2.0 >2.0
Domestos 1% >2.0 >2.0 2.0 >2.0 2.1 0.4 0.2 0.2 0.4 0.4 NT NT NT NT NT
Domestos 2% NT NT NT NT NT 1.4 0.7 1.3 1.9 1.0 2.2 2.0 2.0 >2.0 >2.0
Microzid AF >2.0 1.7 1.7 2.0 1.7 1.1 1.9 1.9 1.7 2.3 1.5 1.6 1.8 1.4 1.6
Omnicide 0.2% 1.3 1.5 >2.0 1.8 2.1 2.7 2.7 2.7 2.7 2.4 2.2 1.8 >2.0 2.1 >2.0
Omnicide 0.5 >3.0 >3.0 >3.0 >3.0 2.4 2.7 2.7
>2.>2.0 2.4 2.2 >3.0 3.0 >2.0 3.0
Quick javel 1% >2.0 >2.0 >2.0 >2.0 >2.0 >2.0 NT NT NT NT >2.0 >2.0 >2.0 NT NT
Cidex >2.0 >2.0 >2.0 >2.0 2.4 2.7
>2.2.7 2.7 2.7 >2.0 >2.0 >2.0 2.4 2.0
NT means not tested; a= Glass; b= Plastic; c= Stainless steal; d= Tile; e= Wood,
REFERENCES Bobichon, H., Dufour-Morfaux, F., Pitort, V. (1993) In vitro susceptibility of public indoor
swimming pool fungi to three disinfectants, Mycoses 36, 9-10, 305-311. Borneff, J., Hassinger, R., Witting, J., Edenharder, R. (1988) Untersuchungen zur
Keimverbreitung in Haushaltkuechen. I. Problemstellung, Versuche, Ergebnisse, Zentralblat Bakt. Mikrobiol. Hyg. 186,1-29.
Burge, W. A, Feeley, J. C., Kreiss, K., Milton, D., Morey, P. R., Otten, J. A, Peterson, K., Tulis, J. J. (1989) Guidlines for the assesment of bioaerosols in the environment, Am. Conf. Govern. Ind. Hyg. Cincinatti, Ohio, 1989.
Holah, J.T., Higgs, C., Robinson, S., Worthington, D., Spenceley, H. (1990) A conductance-based surface disinfection test for food hygiene, Let. Appl. Microbiol.. 11, 255-259.

ANTIMICROBIAL EFFICIENCY OF SOME DISINFECTANTS …
99
Kemper, R. A., White, W. C. (1991) Sustained reduction of aerobiological densities in buildings by modification of interior surfaces with silane modified quaterner amines. In: Indoor air pollution . Randon, Bioaerosols, and VOC1s, Lewis Publishers, Chelsea, 1991.
Pasanen, P., Kalliokaski, P., Pasanen, A. L. (1997) The effectiveness of some disinfectans and detergents against microbial activity, Building and environ. 32, 281-287.
Speier, J. L., Malek, J. R. (1982) Destruction of microorganisms by contact with solid surfaces, J. Colloid Interf. Sci. 89, 68-76.
Waltimo, T. M. T. (1999) In vitro susceptibility of Candida albicans to four disinfectants and their combinations, Inter. Endodentic J. 32,421-429.
Wilson, J. D., (1986) Validation of Sanitization. In: Carleton F. J., Agalloco, J. P.: Validation of Aseptic Pharmaceutical Processes., Marcel Dekker, Inc., New York, 387-409.
Zottola, E.A., Sasahara, K.C. (1994) Microbial biofilm in the food processing industry – schould they be concern, Intern. Food Microbiol.. 23, 125-148.
Yuce, A., Yesoy, M., Yulung, N. (1996) The effect of various disinfectants and antiseptics on Candida albicans. Infektion Dergisi-Turkish J.Infec. 10, 361-363.
*** (1993) Chemical antiseptics and Disinfectants-Basic Bactericidal activity Test Method and Requirements, Provisional Europpean Norm, PrEN 1040. London: British Standards Institution.
*** (2002) Disinfectants and antiseptics, Pharmacopeal Forum. 28 (1):143-152.

STUDIA UNIVERSITATIS BABEŞ – BOLYAI, BIOLOGIA, LII, 2, 2007 (p.101-108)
BACTERIAL AND ENZYMATIC POTENTIAL OF THE EXPERIMENTAL PLOTS INSTALLED ON THE IRON MINE
SPOILS IN IARA (CLUJ COUNTY)
VASILE MUNTEAN1 AND GHEORGHE GROZA2
SUMMARY. The paper presents the evolution of the bacterial and enzymatic potential in the soils of the experimental plots installed on the iron mine spoils in Iara, in May 2005, in the frame of a bioremediation experiment. 26 experimental plots were submitted to different treatments, and sowed with herbaceous species belonging to the families Poaceae (Festuca rubra, Festuca arundinacea, Dactylis glomerata, Lolium perenne) and Fabaceae (Onobrychis viciifolia, Trifolium repens, Trifolium pratense, Lotus corniculatus and Medicago sativa). Microbiological and enzymological analyses were carried out after three months since the experiment had been initiated, and after one year of vegetation. The microbial potential was appreciate according to the bacterial indicators of soil quality (BISQ), calculated taking into account the number of bacteria which belong to the following 5 ecophysiological groups: aerobic mesophilic heterotrophs, ammonifiers, denitrifiers, iron-reducers and sulphate reducing bacteria. The enzymatic potential was appreciate by the enzymatic indicators of soil quality (EISQ), calculated on the base of the phosphatase, catalase, actual and potential dehydrogenase activities. The most efficient treatment applied to the experimental plots proved to be the coverage with a 10-cm layer of soil: the plots covered with soil had higher values of both bacterial and enzymatic indicators of soil quality than the uncovered ones. A remarkable increase of both bacterial, and enzymatic potential has been registered in all the experimental plots in the second year of the experiment. According to the values of both the bacterial, and enzymatic indicators of soil quality after one year of vegetation, one can be stated that the most suited species to be used for bioremediation of such spoils is Medicago sativa. Keywords: mine spoils, bacterial and enzymatic indicators of soil quality, bioremediation Introduction The spoils resulted from mining represent an important source of the
environmental pollution. The development of mining and other industries results in increasing amounts of wastes. About 1.6 × 10¹² m3 of mine spoils accumulated on the earth up to 1980. This amount increases yearly by about 40 × 109 m3, approximately three times more than the amount of soil affected yearly by the water erosion (Kiss et al., 1998). According to a report of the Ministry of Waters and Environment Protection, in the year 2000, 251 spoil dumps were registered in Romania, covering a total surface of 5,932 ha. The recultivation of wastelands becomes, first of all a problem of environment protection, as well as a major economic necessity.
1 Babeş-Bolyai University, 1 Kogălniceanu Street, 400084/Cluj-Napoca, Romania, E-mail: [email protected] 2 University of Agricultural Sciences and Veterinary Medicine, 3 Mănăştur Street, 400372/Cluj-Napoca,
Romania, E-mail: [email protected]

VASILE MUNTEAN AND GHEORGHE GROZA
102
The storage of mine waste material in spoil dumps generates different forms of impact on the environment: damage of large surfaces that can no longer be used for other purposes for a very long time period, spoiling of the natural landscape, with the elimination of some vegetal and animal species, entrainment of stored materials by the torrents formed during abundant rains with negative consequences for downstream localities, pollution of soil, underground and surface waters by various compounds solubilized by the action of meteoric waters, air pollution by the entrainment and transport of fine waste particles at considerable distances by air currents etc.
The bioremediation aims to transform the spoils into technogenic soils, proper for agriculture, forestry or other purposes, like fitting out of parks, sports fields etc. Good results were obtained in the last years by Romanian researchers in recultivation of the spoils resulted from the underground mining of lead and zinc ores in Rodna (BistriŃa-Năsăud county): Kiss et al., 1989, 1990, 1992; Cristea et al., 1995; Paşca et al., 1998, 2000; Muntean et al., 2001, 2002).
In this paper we present an experiment for bioremediation of the spoils resulted from the underground mining of iron in Iara (Cluj county). The spoil dump in Iara covers approximately 29 ha and has approximately two millions m3. The evolution of the bacterial and enzymatic potential in the soil of the experimental plots installed on the spoil dump during the first year of experiment is emphasized.
Material and Methods A biological re-cultivation experiment was initiated on the spoil dump in
Iara, in May 2005. Twenty six experimental plots, each of 10 m2, were installed on the spoil dump, submitted to different treatments, and cultivated with the herbaceous species mentioned in Table 1. The odd plots were covered with a 10-cm layer of soil, and the even plots remained uncovered. Both types of plots were fertilized with 300 g NPK 1:1:1 (300 kg × ha-1) and 200 g NH4NO3 (200 kg × ha-1).
The following 5 ecophysiological groups of bacteria have been analyzed: aerobic mesophilic heterotrophs (agar plates) (Atlas, 2004), ammonifiers (peptone medium), denitrifiers (De Barjac culture medium) (Pochon, 1954), iron-reducers (Ottow medium, 1968), and sulphate reducing bacteria (Van Delden medium) (Allen, 1957). Except for the aerobic mesophilic heterotrophs (where the method of successive dilutions, was used), the most probable number of bacteria was calculated according to the statistical table of Alexander (1965). The following four enzymes were studied: phosphatase – activity expressed in mg phenol × 2.5 g-1 dry matter soil (Krámer and Erdei, 1959); catalase – activity expressed in mg splitted H2O2 × 1.5 g-1 dry matter soil (Kappen, 1913); actual and potential dehydrogenase – activities expressed in mg formazan × 2.5 g-1 dry matter soil (Casida et al., 1964).

BACTERIAL AND ENZYMATIC POTENTIAL OF THE EXPERIMENTAL PLOTS INSTALLED …
103
Table 1. Experimental plots installed on the mine spoil dump in Iara
Experimental plot Aspect Terrace Soil Species 1 + 2
II -
Festuca rubra
3 + 4
III -
Onobrychis viciifolia
5 + 6
IV -
Dactylis glomerata
7 + 8
V -
Trifolium repens
9 + 10
V -
Lolium perenne
11 + 12
Surface -
Lolium perenne (55%) + Festuca arundinacea (40%) + Festuca rubra (5%)
13 + 14
South
Surface -
Festuca rubra (50%) + Trifolium pratense (50%)
15 + 16
II -
Dactylis glomerata
17 + 18
III -
Onobrychis viciifolia
19 + 20
IV -
Lolium perenne
21 + 22
East
V -
Lotus corniculatus
23 + 24
V -
Trifolium pratense
25 + 26
North Surface
- Medicago sativa
Results and Discussion Preliminary physico-chemical analyses were carried out on the mine spoils
in the autumn of 2004, in order to establish the toxic charge of the spoils. The decreasing order of the metal concentration in the raw spoils is: Fe (104) > Ca (104) > Mg (103-104) > Cr (103-104) > Pb (102-103) > Zn (102) > Cu (102) > Ni (101) (order of magnitude – ppm – in parentheses) (Muntean et al., 2005). The high level of metal concentration explains the toxicity of the raw spoils, the lack of any vegetation, even on the first terrace of 21-years old. No statistically significant difference was registered either among terraces, or among aspects.
The microbiological and enzymological analyses were carried out in August 2005, after three months since the experiment had been initiated, and in August 2006, after one year of vegetation. We analyzed the soils of the 26 experimental plots comparatively with two controls: the raw spoil and a brown luvic soil sampled from a grassland in the next vicinity of the spoil dump. The sampling depth was 30 cm, and the samples of the odd plots, covered with soil, resulted by mixing the upper soil layer (10 cm) with the covered spoil.

VASILE MUNTEAN AND GHEORGHE GROZA
104
The microbiological analyses showed the lack of the sulphate reducing bacteria in all the plots uncovered with soil, both at the beginning of the experiment, and after one year. The sulphate reducing bacteria were present only in 9 experimental plots at the beginning, and in all the 13 experimental plots covered with soil after one year, but their number was the lowest (101-102 cells × g-1 dry matter soil), as compared to the other bacterial groups.
The aerobic mesophilic heterotrophs, ammonifiers, denitrifiers and iron-reducers were present in all the experimental plots. Their number decreases in the order: aerobic mesophilic heterotrophs (105-106 cells × g-1 dry matter soil) > ammonifiers (102-104 cells × g-1 dry matter soil) > denitrifiers and iron-reducers (102-103 cells × g-1 dry matter soil).
As regard the enzymological analyses, we mention that at the beginning of the experiment no actual or potential dehydrogenase activity was detected in the plots uncovered with soil. The two activities were present in all the plots covered with soil, at a level lower than 0.2 mg formazan × 3 g-1 dry matter soil. In the second year after revegetation, the actual dehydrogenase activity was also detected only in the experimental plots covered with soil, at a higher intensity, but not overpassing 0.4 mg formazan × 3 g-1 dry matter soil. The potential dehydrogenase activity was registered in all the experimental plots, in five of those covered with soil overpassing 1 mg formazan × 3 g-1 dry matter soil.
The catalase and phosphatase activities were registered in all the samples analyzed, at higher values in the plots covered with soil, than in the uncovered ones, both at the beginning of the experiment, and after one year of vegetation. The values of both enzymatic activities were higher after one year of vegetation. The maximum values of the phosphatase activity were 1.406 mg phenol × 2.5 g-1 dry matter soil (2005, plot 13) and 4.556 mg phenol × 2.5 g-1 dry matter soil (2006, plot 23). The most intense catalase activity was 22.436 mg splitted H2O2 × 1.5 g-1 dry matter soil (2005, plot 11) and 26.592 mg splitted H2O2 × 1.5 g-1 dry matter soil (2006, plot 15).
The general bacterial potential of the experimental plots was appreciate on the base of the bacterial indicators of soil quality (BISQ) values, calculated taking into account the number of bacteria belonging to each ecophysiological group (Muntean, 1995-1996). The enzymatic indicators of soil quality (BISQ) were also calculated, on the base of the individual value of each activity (Muntean et al., 1996). A strong positive correlation, statistically very significant (p<0.001) has been established between the bacterial and the enzymatic indicators of soil quality: r = +0.960 in 2005, and r = +0.970 in 2006.
The results of both microbiological, and enzymological analyses are comparable with those obtained in other similar experiments of mine spoil bioremediation: Kiss et al., 1989, 1990, 1992; Cristea et al., 1995; Paşca et al., 1998, 2000; Muntean et al., 2001, 2002).
Fig. 1 presents the evolution of the microbial and enzymatic potential of each experimental plot during the first year of vegetation, as this potential is defined by the values of the bacterial and enzymatic indicator of soil quality.
First of all we can remark the difference between the two controls and the experimental plots, especially after one year of vegetation, as regard the biological

BACTERIAL AND ENZYMATIC POTENTIAL OF THE EXPERIMENTAL PLOTS INSTALLED …
105
potential. Only in the soil sampled from the vicinity of the spoil dump the BISQ values overpass 5, in both years. In the spoil raw the values of the BISQ are lower than 2.6. Between the experimental plots, the highest value of the BISQ (3.799) was registered after one year of vegetation in the experimental plot 25 (covered with soil and sowed with Medicago sativa).
Important differences among the controls and the experimental plots are also registered as regard the enzymatic potential: EISQ = 0.029 – spoil raw in the first year, and EISQ = 0.243 – control soil in the second year. The values of the EISQ can theoretically range from 0 to 1. The highest value of the BISQ (0.137) was registered after one year of vegetation in the experimental plot 15 (covered with soil and sowed with Dactylis glomerata).
2.5
3.0
3.5
4.0
4.5
5.0
5.5
1 2 3 4 5 6 7 8 9 1 0 11 12 1 3 14 1 5 16 17 1 8 19 2 0 2 1 22 23 24 2 5 2 6
Spoi
l
S oi l
Experimental plot
0.00
0.05
0.10
0.15
0.20
0.25
0.30
BISQ2005 BISQ2006 EISQ2005 EISQ2006
BISQ EISQ
Fig. 1. Evolution of the bacterial (BISQ) and enzymatic (EISQ) indicators of soil quality in the experimental plots installed on the mine spoil dump in Iara.
It is also very obvious the zig-zag-like trajectory of both the BISQ, and the EISQ curves: the odd plots (covered with soil) have higher values of the indicators than the even ones (uncovered with soil). In the hierarchy of the experimental plots, based on the values of the two indicators, the odd plots are always situated on the first 13 positions, showing that the most important treatment applied to the experimental plots is the covering with a 10-cm layer of soil. The effect of the vegetal species used for sowing is not as important as the covering with soil is.
The most important remark from the analysis of the fig. 1 is the obvious increase of both bacterial and enzymatic potential in all the experimental plots. This increase certify the efficiency of the applied bioremediation technologies. The hierarchy of the experimental plots after one year from the beginning of the experiment, on the base of the BISQ and EISQ values is presented in tab. 2. Taking into account both the

VASILE MUNTEAN AND GHEORGHE GROZA
106
bacterial, and the enzymatic indicators, we can assert that the best evolution of the general biological potential in the soils of the experimental plots after one year of vegetation was registered in the following plots, all of them covered with soil:
- plot 25: sowed with Medicago sativa; BISQ = 3.799 (the highest value); EISQ = 0.136 (the second value);
- plot 15: sowed with Dactylis glomerata; BISQ = 3.728 (the second value); EISQ = 0.137 (the highest value);
- plot 23: sowed with Trifolium pratense; BISQ = 3.733; EISQ = 0.130; - plot 5: sowed with Trifolium repens; BISQ = 3.742; EISQ = 0.126; - plot 13: sowed with Festuca rubra + Trifolium pratense; BISQ = 3.744;
EISQ = 0.122.
Table 2. Hierarchy of the experimental plot after one year from the beginning of the experiment,
according to the BISQ and EISQ values
Pozition Plot BISQ Plot EISQ 1 25 3.799 15 0.137 2 13 3.744 25 0.136 3 5 3.742 23 0.130 4 19 3.741 5 0.126 5 23 3.733 13 0.122 6 15 3.728 1 0.120 7 11 3.722 3 0.111 8 1 3.716 7 0.106 9 3 3.712 19 0.105 10 17 3.557 21 0.102 11 7 3.459 11 0.101 12 21 3.457 17 0.099 13 9 3.438 9 0.089 14 6 3.019 24 0.087 15 24 3.015 26 0.071 16 14 3.002 12 0.070 17 26 3.001 22 0.066 18 2 2.987 6 0.065 19 16 2.954 14 0.064 20 22 2.898 20 0.063 21 4 2.891 16 0.062 22 10 2.889 18 0.060 23 12 2.886 10 0.060 24 18 2.880 2 0.055 25 8 2.814 8 0.051 26 20 2.789 4 0.045
From this point of view, we notice that after one year of vegetation, the
most suited species to be used for bioremediation of such spoils proved to be Medicago sativa: the plot 25 (covered with soil) was situated on the first position

BACTERIAL AND ENZYMATIC POTENTIAL OF THE EXPERIMENTAL PLOTS INSTALLED …
107
as regard the BISQ, and on the second one, as regard the EISQ; at the same time, the corresponding plot uncovered with soil – 26 – occupies the position 4 (BISQ), and 2 (EISQ), respectively, between the 13 experimental plots uncovered with soil.
We mention that, in parallel with the experimental plots analyzed in the present work, the bioremediation experiment was completed by planting on the slopes of the spoil dump saplings of several ligneous species: Hippophaë rhamnoides, Robinia pseudacacia, Betula pendula, Ailanthus altissima etc. Both the ligneous, and the herbaceous plants used for sowing the experimental plots analyzed here had a good evolution during the first two years of vegetation.
Conclusions The microbiological analyses carried out three months after the initiation of
the recultivation experiment and one year later registered the presence of the aerobic mesophilic heterotrophs, ammonifiers, denitrifiers and iron-reducers in all the experimental plots, and the lack of the sulphate reducing bacteria in all the plots uncovered with soil, both at the beginning of the experiment, and after one year. The sulphate reducing bacteria were present only in 9 experimental plots at the beginning, and in all the 13 experimental plots covered with soil, but their number was the lowest, as compared to the other bacterial groups.
The catalase and phosphatase activities were registered in all the experimental plots, at higher values in the plots covered with soil, than in the uncovered ones, both at the beginning of the experiment, and after one year of vegetation. No actual or potential dehydrogenase activity was detected in the plots uncovered with soil in the first year. After one year of vegetation, the potential dehydrogenase activity was registered in all the experimental plots.
The plots covered with soil have higher values of both bacterial, and enzymatic indicators of soil quality than the plots uncovered with soil, demonstrating that the most important treatment applied to the experimental plots is the covering with a 10-cm layer of soil. A strong positive correlation, statistically very significant (p<0.001) has been established between the bacterial and the enzymatic indicators of soil quality.
A remarkable increase of both bacterial, and enzymatic potential, defined by the BISQ and EISQ values, has been registered in all the experimental plots after the first year of experiment, certifying the efficiency of the applied bioremediation technologies.
The best evolution of the general biological potential in the soils of the experimental plots after one year of vegetation was registered in the plots covered with soil and sowed with Medicago sativa, Dactylis glomerata, Trifolium pratense,Trifolium repens and with a Festuca rubra + Trifolium pratense mixture.
On the base of the values of both the bacterial, and the enzymatic indicators of soil quality after one year of vegetation, one can be stated that the most suited species to be used for bioremediation of such spoils is Medicago sativa.

VASILE MUNTEAN AND GHEORGHE GROZA
108
REFERENCES
Alexander, M. (1965). Most probable-number method for microbial populations. In Black, C.A., Evans, D.D., White, J.L., Ensminger, L.E., Clark, F.E. (eds.), “Methods of Soil Analysis”, Ed. Am. Soc. Agron., Madison.
Allen, O.N. (1957). Experiments in Soil Bacteriology. 3rd edition, Ed. Burgess, Minneapolis. Atlas, R.M. (2004). Handbook of Microbiological Media. 3rd edition, CRC Press, New York.. Casida, L.E.Jr., Klein, D.A., Santoro, T. (1964). Soil dehydrogenase activity. Soil Sci., 98, 371-376. Cristea, V., Kiss, S., Paşca, D., Drăgan-Bularda, M., Crişan, R., Muntean, V. (1995). Dynamics of
the vegetation and evolution of the enzymatic potential of technogenic soils submitted to biological recultivation. Colloq. Phytosociol., 24, Fitodinamica, 169-180.
Kappen, H. (1913). Die katalytische Kraft des Ackerbodens. Fühlings Landw. Ztg., 62, 377-392. Kiss, S., Drăgan-Bularda, M., Paşca, D., Blaga, G., Zborovschi, E., Pintea, H., Crişan, R.,
Muntean, V., Mitroescu, S. (1989). Enzimologia recultivării biologice a solului iazului de decantare de la Exploatarea Minieră Rodna. Publ. Soc. NaŃ. Rom. Şt. Sol., 26A, 211-218.
Kiss, S., Paşca, D., Drăgan-Bularda, M., Cristea, V., Blaga, G., Crişan, R., Muntean, V., Zborovschi, E., Mitroescu, S. (1990). Enzymological analysis of lead and zinc mine spoils submitted to biological recultivation. Stud. Univ. Babeş-Bolyai, Biol., 35 (2), 70-79.
Kiss, S., Paşca, D., Drăgan-Bularda, M., Crişan, R., Muntean, V. (1992). Enzymological evaluation of the efficiency of the measures applied for biological recultivation of lead and zinc mine spoils. Stud. Univ. Babeş-Bolyai, Biol., 37 (2), 103-107.
Kiss, S., Paşca, D., Drăgan-Bularda, M. (1998). Enzymology of disturbed soils. Elsevier, Amsterdam. Krámer, M., Erdei, G. (1959). Primenenie metoda opredeleniya aktivnosti fosfatazy v
agrokhimicheskikh issledovaniyakh. Pochvovedenie, 9, 99-102. Muntean, V. (1995-1996). Bacterial indicator of mud quality. Contrib. Bot., 73-76. Muntean, V., Crişan, R., Paşca, D., Kiss, S., Drăgan-Bularda, M. (1996). Enzymological
classification of salt lakes in Romania. Int. J. Salt Lake Res., 5 (1), 35-44. Muntean, V., Paşca, D., Crişan, R., Kiss, S. (2001). PotenŃialul enzimatic în sterilul de la o mină de zinc
şi plumb supus recultivării biologice. Publ. Soc. NaŃ. Rom. Şt. Sol., 30B, 65-73. Muntean, V., Nicoară, A.,Paşca, D., Crişan, R. (2002). Cercetări microbiologice şi chimice asupra
sterilului de la E.M. Rodna supus recultivării biologice. Stud. Cercet., Biol., 7, 21-27. Muntean, V., Nicoară, A., Groza, G. (2005). Microbiological research on iron mine spoils
submitted to bioremediation. Contrib. Bot., 40, 239-246. Ottow, J.C.G. (1968). Evolution of iron-reducing bacteria in soil and the physiological mechanism
of iron reduction in Aerobacter aerogenes. Z. Allg. Mikrobiol., 8, 441-443. Paşca, D., Crişan, R., Muntean, V., Popovici, I., Kiss, S., Drăgan-Bularda, M. (1998).
Enzymological and microbiological study on the evolution of a technogenic soil submitted to biological recultivation at the lead and zinc mine in Rodna (Romania). Soil & Tillage Research, 47, 163-168.
Paşca, D., Crişan, R., Muntean, V., Kiss, S. (2000). Enzyme activities in biologically recultivated lead and zinc mine spoils as indicators of the recultivation efficiency. 1st International Conference on Soils of Urban, Industrial, Traffic and Mining Areas, Burghardt, W., Dornauf, C. (eds.), Essen, 1039-1043.
Pochon, J. (1954). Manuel technique d'analyse microbiologique du sol. Ed. Masson, Paris.

STUDIA UNIVERSITATIS BABEŞ – BOLYAI, BIOLOGIA, LII, 2, 2007 (p.109-118)
MICROORGANISM POPULATIONS WITHIN GELATINOUS FORMATIONS FROM KIESBERG MINE IN BANAT MOUNTAINS,
ROMANIA
VASILE-DANIEL GHERMAN 1, JEAN-GABRIEL BRÉHERET 2 AND MIHAIL-DR ĂGAN BULARDA 3
SUMMARY. This study concerns the gelatinous formations found in the Kiesberg gallery, part of an old mine located in the South-West of Romania which was dug in the metamorphic rocks of auriferous sulphides from the Policarpus ore. These gelatinous formations are being supplied with a variable flow of infiltration rainwater. Microbiological determinations and numerical estimates have been carried out in years 2004 and 2005, for two hydrological different seasons, a wet one and a dry one. A percentage estimate of different physiological groups has also been realized. The gelatinous formations from the Kiesberg mine represent a complex assemblage formed by (1) chemolitotroph acidophilic microorganisms (water pH 2.8) which dominate during stages of high water supply and (2) by heterotrophic microorganisms rather abundant during stages of low water supply. The ratio between the two kinds of microorganisms is therefore variable depending on the water supply and other environmental factors. Keywords: Acidithiobacillus, Actinomycetes, auriferous sulphides, autotrophs, fungus, gelatinous formations, heterotrophs, old abandoned mine, Policarpus ore.
Introduction. This study refers to an old mine, the Kiesberg Mine, located in the South-
West of Romania, nearby the town of Oravita (Fig. 1). This mine was worked until the end of the XIXth century and it was dug in the auriferous sulphides metamorphic rocks of a Policarpus ore.
In this mine, the presence of some microbiological gelatinous formations was noticed. The microorganisms presence in the gelatinous formations is evidenced by the significant large biomass accumulations (the stalactites and the gelatinous deposits) and also by the particular morphological and structural speleothems.
1 University of Polytechnic, Faculty of Hydrotechnic, 1 George Enescu Street, Timişoara, Romania.E-
mail: [email protected] 2 University of François-Rabelais, GéEAC Laboratory, Science and Technical Faculty, Grandmont
Parc F-37200, Tours, France.E-mail : [email protected] 3 University of Babeş-Bolyai, Department of Plant Physiology, Cluj-Napoca, Romania. E-mail: [email protected]

VASILE-DANIEL GHERMAN, JEAN-GABRIEL BRÉHERET AND MIHAIL-DRĂGAN BULARDA
110
Fig. 1. Study area.
This type of gelatinous formations is not characteristic only for this kind of
cavity, they are also often found in the ferous and sulphurous artificial (mines) or natural cavities (caves).

MICROORGANISM POPULATIONS WITHIN GELATINOUS …
111
According to the specialized literature, the most well known and often found types of gelatinous formations are the ones from the hydrothermal cavities. These types of gelatinous formations are supplied with thermal and mezothermal waters with temperatures that vary between 18 and 500C. Sometimes, these waters come from active volcanic areas that generally contain great quantities of sulphur or sulphuretted hydrogen.
Here are some examples of thermal and mezothermal cavities where the gelatinous formations were found: the Lechuguilla Cave from the Carlsbad National Park, New Mexico, USA (Cunningham et al., 1995); the Cueva de Villa Luz from the Plateau Tabasco in Mexic (Northup et al., 1997); the Frassassi Cave from Italy (Vlăsceanu et al., 2000); the Movile Cave from Dobrogea, Romania (Vlăsceanu et al., 1997).
In Wales, UK, there is an artificial cavity, a pyrite mine, closed more than 70 years ago – the “Cae Coch” Mine (Johnson, 1998; Johnson et al., 1999; Hallberg et al., 2006) – which is similar to Kiesberg Mine that we studied about.
The gelatinous formations of microorganisms’ consortium can be differently formed, depending on several environmental factors: the cavity climate, the temperature of the water in which they are found, the chemical composition of the rock that forms the cavity and the chemical composition of the waters that drain various minerals (Hallberg et al., 2006).
The geological characteristics of the area where the Kiesberg mine is have induced the existence of a particular kind of medium and of microbial associations that form a series of characteristical gelatinous formations. The number of the microorganisms from these microbial associations varies quit a lot, depending on the rain water quantities during the year. In this study, the identification of characteristical gelatinous formations from the microbial associations in the Kiesberg mine is suggested.
The numerical estimations depending on the rainfall quantities (water that supllies the gelatinous formations) are also a part of this study.
Microbiological determinations and numerical estimates have been carried out in years 2004 and 2005, for two hydrological different seasons, a wet one and a dry one. Estimates of populations from different physiological groups have been calculated.
Materials and Methods. The samples for the microbilogical analisys have been taken from a variable
flow water stream found in a partially collapsed gallery from Kiesberg mine. The isolation of acidophilic chemolitotrophic bacteria was performed by
inoculating the growth medium (9K – pH 2.5) (Silverman et al., 1959) for the isolation of Acidithiobacillus ferrooxidans (Kelly et al., 2000) (Thiobacillus ferrooxidans), the Winogradski medium (W6 –pH 6) (Winogradski, 1952) for other ferrous-bacteria, and the Starkey medium (S6 – pH 6) (Starkey et al., 1934,) for Acidithiobacillus thiooxidans (Thiobacillus thiooxidans).

VASILE-DANIEL GHERMAN, JEAN-GABRIEL BRÉHERET AND MIHAIL-DRĂGAN BULARDA
112
The isolation of acidophilic heterotrophic microorganisms has been realized trough enriched growing on the March medium- pH-2.5 (Wood et al., 1983), and on the G.Y.E. at pH 3 (Johnson et al., 1983).
The isolation and identification of fungi has been realized on the solid Czapeck medium (Ramirez, 1982), (Lorinczi et al., 1966), starting from the serial dilutions of the enriched growing realized from samples in the liquid March medium.
The indirect determination of Acidithiobacillus strains by the measurement of pH medium was achieved by seeding the test samples on the 9K, S5 and S6, and also on the W6 medium. The growing was determined by the quantity of oxidized thiosulphate. The Acidithiobacillus is estimated by the final pH value after 28 days (Hutchinson et al., 1966).
The determination of the most probable number of the microorganisms was done by performing decimal or serial dilution, with 3 repetitions/dilution, while the observation of the number of positive tubes, the numerical value, was established from the table (Rodina, 1972). The method of counting the colonies on the solid medium was used also for the numerical estimates.
Results and Discussion In 2004, the measurements were realized in March, when the total rainfall
value was 29,9 mm (the dry season) and in July , when the total rainfall value was 141,8 mm (the rainy season). In 2005, the measurements were realized in November, when the total rainfall value was 37,4 mm (the dry season) and in April, when the total rainfall value was 141,8 mm (the rainy season). (From a hydrological point of view) 2004 was a drier year (875 mm) than 2005 (1202 mm).
The results of the microbiological analysis made on the gelatinous formations from Kiesberg mine are given in Table 1.
The fact that 16 strains of microorganisms were identified in 2004 can be noticed from Table 1. For the next year, 2005, one more strain – Scytalidium (Dematiaceae Family) – was identified beside the 16 ones.
The identified microorganisms strains are intimately associated by extra-cellular mucopolysaccarides, forming an association or a consortium. From all the identified strains, the four Acidithiobacillus together with the actinomycetes represent the bacteria, the rest of the strains represent the fungi. A. neapolitanus, A. thiooxidans and A. thioparus represent acidophilic chemolitotrophic bacteria which realize the oxidation of the reduced sulphur compounds. These compounds stem from the chemical and biological oxidation of pyrite from the Kiesberg gallery walls. In the consortium, the Acidihiobacillus represent the primary organic substance producers. A. intermedius is a strain with a mixotrophic metabolism; it is a facultative heterotroph.

MICROORGANISM POPULATIONS WITHIN GELATINOUS …
113
Table 1. Microorganisms identified in the gelatinous formations in Kiesberg Mine and their most
probable number in the two seasons during the years of 2004 and 2005.
The autochthonous organic substance, from the primary producers (the
Acidothiobacillus), together with allochthonous organic substances stemming with the water from other parts of the cavity, is scavenged by the heterotrophic microorganisms from this consortium. The heterotrophs are represented by actinomycetes, whose strains, unfortunately, haven’t been identified yet, and by the following strains of fungi (Lorinczi et al., 1966): Fam. Moniliaceae: Aspergillus nidulans, Aspergillus thomii, Penicillium steckii, P. expansum, P. verucosum, P. griseo-fulvus, P. implicatum, P. verucosum var. corybiferum ; Fam. Cryptococaceae: Rhodotorula sp.; Fam. Dematiaceae: Cladosporium herbarum. Unidentified Protists in the gelatinous formations were also noticed by microscopy.
The bacterial strains are largely dominating, with 90 % of the population, the fungus strains representing only 10 %.
2004 2005 Strain rainy dry rainy dry
Acidithiobacillus neapolitanus 9500 0 9500 1400
Acidithiobacillus thiooxidans 9500 3000 9500 4500
Acidithiobacillus thioparus 4500 0 7500 2000
Acidithiobacillus intermedius 4500 3000 4500 4500
Actinomicete 45000 4500 9500 4500
Penicillium citreo-viride 200 0 300 200
Penicillium implicatum 600 300 700 0
Penicillium expansum 400 200 600 200
Penicillium veruncosum 300 0 200 0 Penicillium veruncosum var. corimbiferum 2000 200 300 0
Penicillium griseo-fulvus 400 0 700 300
Penicillium steckii 200 0 200 0
Aspergillus nidulans 400 0 600 200
Aspergillus thomii 600 300 700 300
Rhodotorula sp. 400 300 600 400
Cladosporium herbarum 0 300 0 200
Scytalidium sp. 0 0 200 0

VASILE-DANIEL GHERMAN, JEAN-GABRIEL BRÉHERET AND MIHAIL-DRĂGAN BULARDA
114
12%
12%
6%57%
1%
1%3%
1%
1%
1%
1%
0%
0%
4%
1
2
3
4
5
6
7
8
9
10
11
12
13
14
15
16
17
Fig. 2. The percentage of identified microorganisms strains during the rainy season 2004 in
the gelatinous formations.
1. Acidithiobacillus neapolitanus; 2. A. thiooxidans; 3. A. thioparus; 4. A. intermedius; 5. Actinomicete; 6. Penicillium citreo-viride; 7. P. implicatum; 8. P. expansum; 9. P. veruncosum; 10. P. veruncosum var. corimbiferum; 11. P.griseo-fulvus; 12. P. steckii; 13.Aspergillus nidulans; 14. A. thomii; 15. Rhodotorula sp.; 16. Cladosporium herbarum; 17. Scytalidium sp.
0%
25%
0%
25%
37%
0%
2%
2%
0%
2%
0%
0%
0%
2%
2%
0%
3%
1
2
3
4
5
6
7
8
9
10
11
12
13
14
15
16
17
Fig. 3. The percentage of identified microorganisms strains during the dry season 2004 in the gelatinous formations.
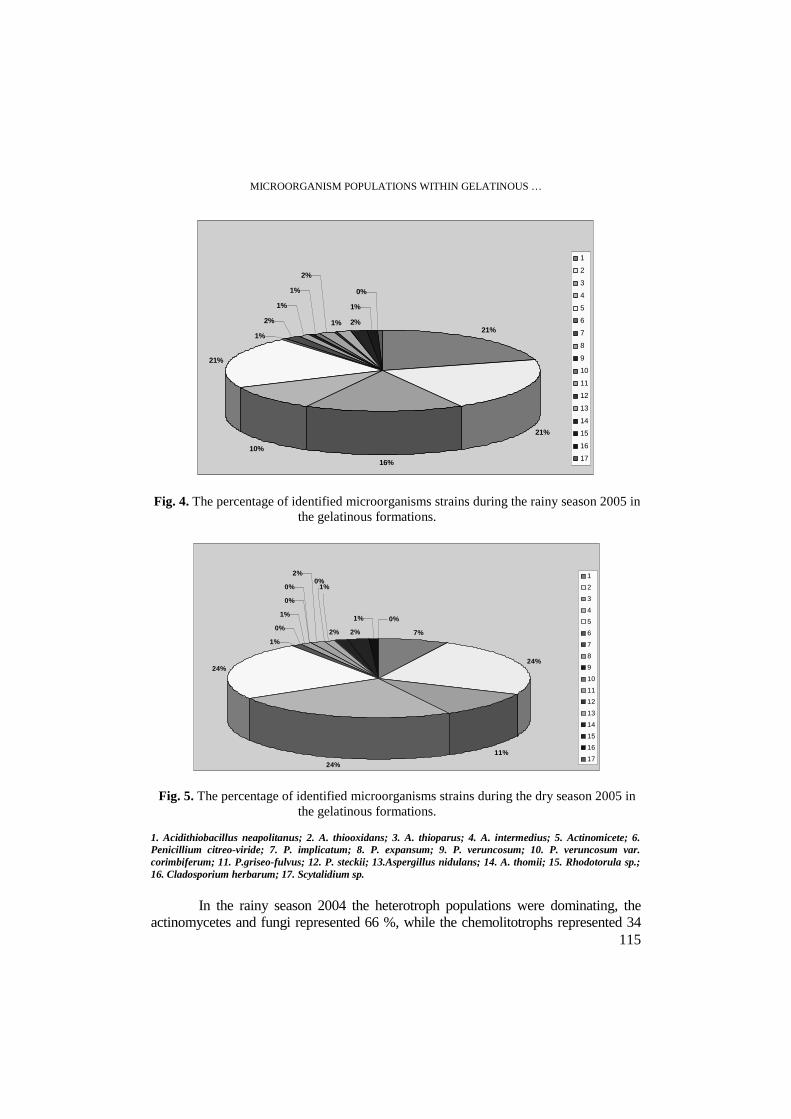
MICROORGANISM POPULATIONS WITHIN GELATINOUS …
115
21%
21%
16%
10%
21%
1%
2%
1%
1%
2%
1% 2%
1%
0%
1
2
3
4
5
6
7
8
9
10
11
12
13
14
15
16
17
Fig. 4. The percentage of identified microorganisms strains during the rainy season 2005 in the gelatinous formations.
7%
24%
11%
24%
24%
1%
0%
1%
0%
0%
2%
2% 2%
1% 0%
1%0%
1
2
3
4
5
6
7
8
9
10
11
12
13
14
15
16
17
Fig. 5. The percentage of identified microorganisms strains during the dry season 2005 in the gelatinous formations.
1. Acidithiobacillus neapolitanus; 2. A. thiooxidans; 3. A. thioparus; 4. A. intermedius; 5. Actinomicete; 6. Penicillium citreo-viride; 7. P. implicatum; 8. P. expansum; 9. P. veruncosum; 10. P. veruncosum var. corimbiferum; 11. P.griseo-fulvus; 12. P. steckii; 13.Aspergillus nidulans; 14. A. thomii; 15. Rhodotorula sp.; 16. Cladosporium herbarum; 17. Scytalidium sp.
In the rainy season 2004 the heterotroph populations were dominating, the
actinomycetes and fungi represented 66 %, while the chemolitotrophs represented 34

VASILE-DANIEL GHERMAN, JEAN-GABRIEL BRÉHERET AND MIHAIL-DRĂGAN BULARDA
116
%. During the dry season 2004, the chemolitotrophs population (50 %) represented as much as the heterotrophs did (50%), with the observation that A. intermedius is part of facultative heterotrophs.
Table 2.
The physiological groups’ ratios of microorganisms from the gelatinous formations, during the wet and dry seasons during 2004 and 2005.
year season autotrophs heterotrophs
2004 Rainy 34% 66%
Dry 50% 50%
2005 Rainy 68% 32%
Dry 66% 34%
34%
50%
68%66%
66%
50%
32%34%
0% 20% 40% 60% 80% 100% 120%
rainy
dry
rainy
dry
2004
2005
autotrophs heterotrophs
Fig. 6. The ratio of physiological groups of microorganisms from the gelatinous formations, during the rainy and dry seasons of 2004 and 2005.
During the rainy season 2005, the dominant strains were the chemolitotrophic
Acidithiobacillus (68 %) among which A. intermedius is 10 %. The heterotrophs represented 32% with 21 % actinomycetes, and 11% of fungus strains (of the total population). During the dry season 2005, as well as during the rainy one, the chemolitotrophic Acidithiobacillus strains were dominant (66 %), among which A. intermedius (24 %). The fungus strains represent 10% of the total population (table 2. Fig. 6.).

MICROORGANISM POPULATIONS WITHIN GELATINOUS …
117
The results of chemical analysis for the water that contains this consortium show an acid pH (2.81) and large quantities of sulphate (2810,5 mg/l). These results prove the existence of an intense oxidation of all reduced sulphate forms that are reduced by the chemolitotrophic bacteria. In 2004 and 2005, we can observe a lower variation of the microorganisms populations, from the rainy season to the dry one, during 2005 as compared with 2004. During 2004 the actinomycetes underwent a very high variation from the rainy season to the dry one however this fact is probably a random and short term situation.
The primary producers, represented by the Acidithiobaccilus strains, oxidize pyrite and other metallic sulphides from Kiesberg mine walls, but they also induce the oxidation of Fe2+ and reduced sulphur compounds which result from the chemical and biological pyrite oxidation. For example, the biological oxidation of pyrite (which is effective at the contact spot of gelatinous formations with the gallery walls) is very intense during the period of high water supply, because this water takes over the oxidation products. The local accumulations of oxidized products are inhibitors for Acidithiobaccilus. The products generated by the pyrite oxidation, during a first stage, are quickly oxidized by the chemolitotroph consortium that are found at a certain distance from the rock. So it can be explained that during the more rainy year of 2005 (1202.2 mm) autotrophic microorganisms (chemolitotrophs) prevailed, while the heterotrophs were rather abundant during the dryer year 2004 (875 mm).
In the Cae Coch Mine from Wales, the same as in the mine that we studied, the development of gelatinous microbial communities is based on the metalic sulphides oxidation from the rock mass (Johnson, 1999). The main chemo-synthesized autotrophs strains from this mine community belong to the Acidithiobacillus type and the specific hetrotrophs are the heterotrophic eubacteria, the actinomycetes, a series of eukaryotes (like Deuteromycetes and Protists strains) and, very rarely, micro-unvertebrated (such as Nematods) (Hallberg et al., 2006).
From the biodiversity point of view, the gelatinous formations from the Kiesberg Mine that we studied, and also the ones from the Cae Coch Mine, are less rich in strains compared to the gelatinous formations from the hydrothermal cavities. Even so, the biomass formed by microorganisms in the mezothermal mines is quite large. In our case, the gelatinous formations biovolume is a few cubic meters, but in the Cae Coch Mine the biovolume is beyond 100m3 (Johnson, 1999; Hallberg et al., 2006).
Conclusions The gelatinous formations represent a complex association formed by
heterotrophic, autotrophic (chemolitotrophs) and acidophilic microorganisms, which interact very closely. The ratio between them varies, mainly depending on the water supply.
VASILE-DANIEL GHERMAN, JEAN-GABRIEL BRÉHERET AND MIHAIL-DRĂGAN BULARDA
118
REFERENCES
Cunningham, K. I., Northup, D. E., Pollastro, R. M., Wright, W. G., LaRock, E. J. (1995) Bacteria, fungi and biokarst in Lechuguilla Cave, Carlsbad Caverns National Park, New Mexico. Environ. Geol., 25, 2-8.
Hallberg, K. B., Coupland, K., Kimura, S., Johnson, D. B. (2006) Macroscopic Streamer Growths in Acidic, Metal-Rich Mine Waters in North Wales Consist of Novel and Remarkably Simple Bacterial Communities. Appl Environ Microbiol., 72, 2022–2030.
Hutchinson, M., Johnstone, K. I., White, D. (1966) Taxonomy of the acidophilic thiobacilli. J. Gen. Microbiol., 44, 373–381.
Johnson, D. B. (1998) Biodiversity and ecology of acidophilic microorganisms. School of Biological Sciences, University of Wales, Bangor LL57 2UW, UK.
Johnson, D. B., Kelso W. I. (1983) Detection of heterotrophic contaminants in cultures of Thiobacillus ferrooxidans and their elimination by subculturing in media containing copper sulfate. J. Gen. Microbiol., 129, 2969-2972.
Johnson, D. B., Bacelar-Nicolau, P. (1999) Leaching of Pyrite by Acidophilic Heterotrophic Iron-Oxidizing Bacteria in Pure and Mixed Cultures. Appl. Environ. Microbiol., 65, 585–590.
Kelly, D. P., Wood, A. P. (2000) Reclassification of some species of Thiobacillus to the newly designated genera Acidithiobacillus gen. nov., Halothiobacillus gen. nov. and Thermithiobacillus gen. nov. Int J Syst Evol Microbiol, 50, 511-516.
Lorinczi Fr., Turcu L. (1966) Micromycete izolate din sol şi peşteri, în Flora şi VegetaŃia rezervaŃiei naturale Defileul Crişului Repede. Contr. bot., Univ. Babeş- Bolyai Cluj, pp 69 – 82.
Northup, D., Reysenbach, A-L,., Pace, N. (1997) Microorganisms and speleothems. in: Hill, C. Forti, P. (Eds.), Cave minerals of the World, 2nd ed., p.261-266, Natl. Speleol. Soc. Inc., Hunsville, Alabama.
Ramirez C., 1982, Manual and Atlas of the Penicillia, Elsevier Biomedical Press. London. Rodina, A., G. (1972) Methods in Aquatic Microbiology. (translated, edited and revised by
Colwell, RR and Zambruski, MS), University Park Press, Baltimore. Silverman, M. P., Lundgren, D. G. (1959) Studies on the chemoautotrophic iron bacterium
Ferrobacillus ferrooxidans. I. An improved medium and a harvesting procedure for securing high cell yields. J. Bacteriol., 77, 642-7.
Starkey, R., L. (1934) Cultivation of Organisms Concerned in the Oxidation of Thiosulfate. J. Bacteriol., 28, 365–386.
Vlăsceanu, L., Popa, R., Kinkle, B. K. (1997) Characterization of Thiobacillus thioparus LV43 and its distributionin a chemoautotrophicaly based groundwater ecosystem. Appl. Environ. Microbiol., 63, 3123-3127.
Vlăsceanu, L., Sârbu, Ş., Engel, A. S. (2000) Acidic cave-wall biofilms located in the Frasassi Gorge, Italy. Geomicrobiol. J., 17, 125-139.
Winogradski, S. M. (1952) Soil microbiology (in Rushian). Probl. Met. Izd. AN SSSR, Moscow, 792 pp.
Wood, A. P., Kelly, D. P. (1983) Autotrophic, mixotrophic and heterotrophic growth with denitrification by Thiobacillus A2 under anaerobic conditions. FEMS Microbiol. Lett., 16, 363-370.

STUDIA UNIVERSITATIS BABEŞ – BOLYAI, BIOLOGIA, LII, 2, 2007 (p.119-127)
MICROORGANISM ASSOCIATIONS WITHIN A THIN ACID SOLUTION FILM FROM AN OLD MINE IN BANAT MOUNTAINS
VASILE-DANIEL GHERMAN 1, JEAN-GABRIEL BRÉHERET 2 AND MIHAIL-DR ĂGAN BULARDA 3
SUMMARY. The rain water slowly crosses the rock layers down to the cavity through micro cracks and it arrives on the cavity wall as a concentrated solution with a high acidity level (pH 1-1.5). This concentrated acid solution was subjected to some microbiological determinations and the identified strains were numerical estimated. These determinations were done in 2004 and 2005, during two hydrological different seasons, rainy and dry. A percentage estimate of the physiological groups has also been done.
The percolating acid solution is crowded by acidophilic microorganisms with a dominating population of Acidithiobacillus ferrooxidans and six strains of Penicillium. The chemolitotrophic bacteria A. ferrooxidans provides the primary organic substance production of the community by oxidation of pyrite from the cavity walls. The six strains of Penicillium represent the heterotrophic organisms that use the organic substance from the primary producer. Between the A. ferrooxidans population and the Penicillium strain populations a close trophic relationship is established and the microorganisms number depends on the acid solution concentration. Keywords: acid solution, auriferous sulphides, autrotrophs, heterotrophs, old mine, Penicillium, Acidithiobacillus ferrooxidans.
Introduction Highly acid medium limit the access of the organisms that are unable to adapt to
this stress, and are considered as “extreme life medium” (Johnson, 1998). The studies on the acid medium have revealed the great diversity of organisms that
are part of three sistematic fields: Eubacteria, Archaea and Eucaria. Between the acidophilic organisms populations there are many interactions (connections), especially trophic kind connections.
The most numerous microbiological studies have been done on the mine drainage waters: in Iron Mountain, California (Schrenk et al., 1998; Edwards et al., 2000); in Scandinavia and the United Kingdom (Banks et al., 1997); Alaskan and Canadian drainages gold mines (Braddock et al., 1984); in Norwegian copper mine (Johnson et al., 2001); these waters represent an important polution source.
This study took place in an old mine (the Kiesberg Mine), abandoned at the end of the XIXth century, located in the South-West of Romania, nearly Oravita town (Fig. 1.).

VASILE-DANIEL GHERMAN, JEAN-GABRIEL BRÉHERET AND MIHAIL-DRĂGAN BULARDA
120
Fig. 1. Study area. This mine is located in the Banat Mountaine and it was dug in the metamorphic
rocks of auriferous sulphides of Policarpus ore. The thickness of the metamorphic rocks above the cavity is at least 8 meters; they are covered by several meters of limestones and marls. The rainwater crosses the overburden through micro-cracks and rises on the cavity wall. The flowing period through micro cracks is of 2 weeks. During this period, the rainwater dissolves a series of minerals: silicates and iron sulfides. As it springs up on the vault of the cavity it is a highly acid solution (pH 1-1,5). Various kinds of speleothems are growing in this context (the snotites and stalactites formations). As organic matter is

MICROORGANISM ASSOCIATIONS WITHIN A THIN ACID SOLUTION FILM …
121
intimately linked to mineral production in these stalactites, so arise the question of the contribution of organisms (1) to the leaching of the minerals from the source rock and (2) to the new mineral deposits.
The extremely particular medium from the Kiesberg cavity induces the presence of characteristical microorganisms associations that are physiologically and ecologically very interesting. In this study, the identification, in two different hydrological seasons, a wet one and a dry one, during the years of 2004 and 2005, of characteristical microorganisms associations which populate the walls of this old mine, was suggested proposed. A percentage estimation of different physiological groups is presented further on.
Materials and Methods These samples have been taken from a continous, permanent acid solution film
which covers the vault of one part from the profound area of Kiesberg mine. The isolation of acidophilic chemolitotrophic bacteria was performed by
inoculating the growth medium (9K – pH 2.5) (Silverman et al., 1959) for the isolation of Acidithiobacillus ferrooxidans (Kelly et al., 2000) (Thiobacillus ferrooxidans), the Winogradski medium (W6 –pH 6) (Winogradski, 1952) for other ferrous-bacteria, and the Starkey medium (S6 – pH 6) (Starkey et al., 1934,) for Acidithiobacillus thiooxidans (Thiobacillus thiooxidans).
The isolation of acidophilic heterotrophic microorganisms has been performed trough enriched growing on the March medium- pH-2.5 (Wood et al., 1983), and on the G.Y.E. at pH 3 (Johnson et al., 1983).
The isolation and identification of fungi has been realized on the solid Czapeck medium (Ramirez, 1982), (Lorinczi et al., 1966), starting from the serial dilutions of the enriched growing realized from samples in the liquid March medium.
The indirect determination of Acidithiobacillus strains by the measurement of pH medium was achieved by seeding the test samples on the 9K, S5 and S6, and also on the W6 medium. The growing was determined by the quantity of oxidized thiosulphate. The Acidithiobacillus is estimated by the final pH value after 28 days (Hutchinson et al., 1966).
The determination of the most probable number of the microorganisms was done by performing decimal or serial dilution, with 3 repetitions/dilution, while the observation of the number of positive tubes, the numerical value, was established from the table (Rodina, 1972). The method of counting the colonies on the solid medium was used also for the numerical estimates.
Results and discussion In 2004, the measurements were realized in March, when the total rainfall
value was 29,9 mm (the dry season) and in July , when the total rainfall was 141,8 mm

VASILE-DANIEL GHERMAN, JEAN-GABRIEL BRÉHERET AND MIHAIL-DRĂGAN BULARDA
122
(the rainy season). In 2005, the measurements were realized in November, when the total rainfall value was 37,4 mm (the dry season) and in April, when the total rainfall was 226,4 mm (the rainy season). (From a hydrological point of view) The year 2004 was drier (875 mm) than 2005 (1202 mm).
The results of the microbiological analysis performed on this acid solution are presented in Table 1.
Table 1.
Microorganisms identified in the acid solution and their most probable number during the two seasons of 2004 and 2005
2004 2005 Strain
wet dry wet dry
Acidithiobacillus ferrooxidans 9500 4500 9500 8000
Penicillium expansum 600 500 600 600
Penicillium cyclopium 200 150 250 150
Penicillium frequentans 300 200 500 300
Penicillium griseo-azureum 0 200 0 200
Penicillium citreo-viride 200 0 300 200
Penicillium lividum 200 200 300 300
As it is indicated on the table 1, seven strains of microorganisms forming a
consortium, and thus functionally interconnected, were determined in the acid solution, both in 2004 and 2005. Acidithiobacillus ferrooxidans (Thiobacillus ferrooxidans) is the only bacterial strain, the rest being represented by six strains of Penicillium fungi, which are a part of Moniliacea Family. Their percentages are depicted on the Fig. 2-5.
In 2004 and 2005, a clear domination of Acidithiobacillus ferrooxidans (80 %) is observed during both seasons; the remaining 20 % correspond to the Penicillium strains. A. ferrooxidans is a chemolitotrophic bacteria that oxidizes the pyrite, the Fe2+ and the sulphur compounds (stemming from the oxidation of pyrite), providing the primary production of organic substance; the six strains of Penicillium represent the heterotrophs that use the organic substance produced by A. ferrooxidans. (Table 2., Fig. 6.).
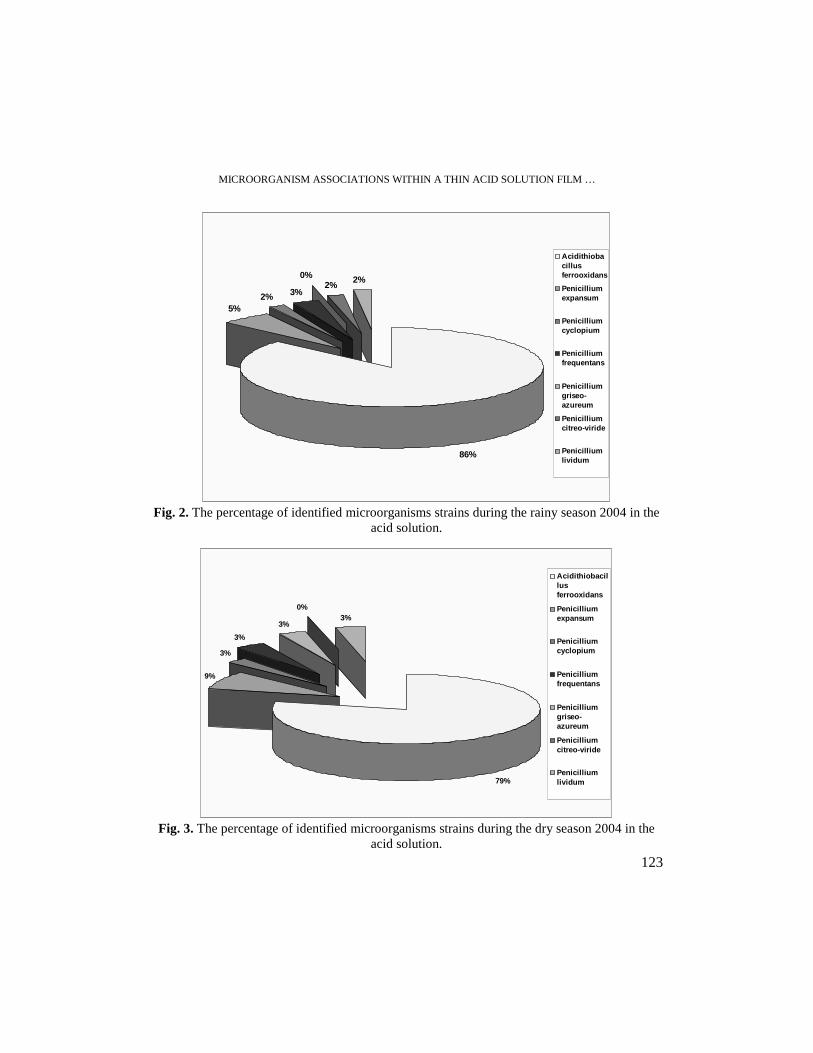
MICROORGANISM ASSOCIATIONS WITHIN A THIN ACID SOLUTION FILM …
123
86%
5%2% 3%
0%2%
2%
Acidithiobacillusferrooxidans
Penicilliumexpansum
Penicilliumcyclopium
Penicilliumfrequentans
Penicilliumgriseo-azureum
Penicilliumcitreo-viride
Penicilliumlividum
Fig. 2. The percentage of identified microorganisms strains during the rainy season 2004 in the
acid solution.
9%
3%
3%
3%
0%3%
79%
Acidithiobacillusferrooxidans
Penicilliumexpansum
Penicilliumcyclopium
Penicilliumfrequentans
Penicilliumgriseo-azureum
Penicilliumcitreo-viride
Penicilliumlividum
Fig. 3. The percentage of identified microorganisms strains during the dry season 2004 in the
acid solution.
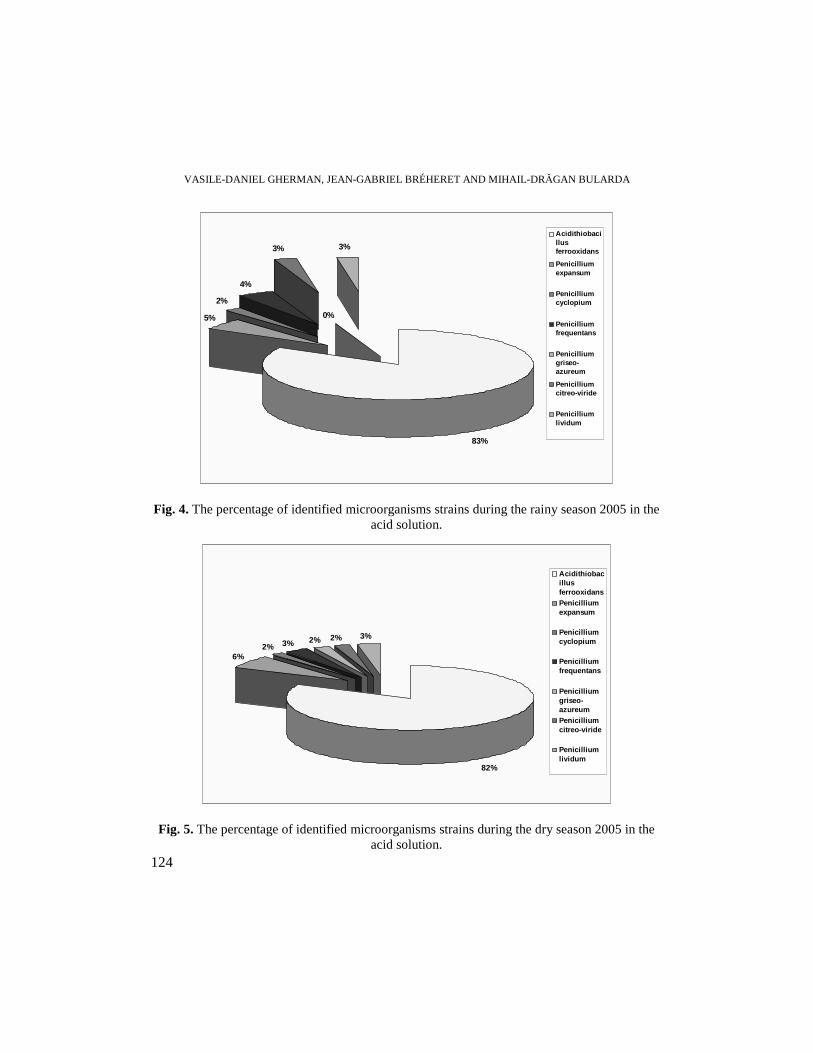
VASILE-DANIEL GHERMAN, JEAN-GABRIEL BRÉHERET AND MIHAIL-DRĂGAN BULARDA
124
83%
5%
2%
4%
0%
3% 3%
Acidithiobacillusferrooxidans
Penicilliumexpansum
Penicilliumcyclopium
Penicilliumfrequentans
Penicilliumgriseo-azureum
Penicilliumcitreo-viride
Penicilliumlividum
Fig. 4. The percentage of identified microorganisms strains during the rainy season 2005 in the acid solution.
82%
6%2% 3% 2% 2% 3%
AcidithiobacillusferrooxidansPenicilliumexpansum
Penicilliumcyclopium
Penicilliumfrequentans
Penicilliumgriseo-azureumPenicilliumcitreo-viride
Penicilliumlividum
Fig. 5. The percentage of identified microorganisms strains during the dry season 2005 in the acid solution.

MICROORGANISM ASSOCIATIONS WITHIN A THIN ACID SOLUTION FILM …
125
Table 2. The ratio of microorganisms physiological groups from the acid solution, during the
wet and dry seasons of 2004 and 2005.
year season autotrophs heterotrophs
rainy 86% 14% 2004
dry 79% 21%
rainy 83% 17% 2005
dry 82% 18%
86%79%
83%82%
14%21%
17%18%
0% 20% 40% 60% 80% 100% 120%
rainy
dry
rainy
dry
2004
2005
autotrophs heterotrophs
Fig. 6. The ratio of physiological groups of microorganisms from the acid solution, during the rainy and dry seasons of 2004 and 2005.
Acidithiobacillus ferrooxidans is usually isolated strain, known since 1950 as a metalic sulpide oxidizer (Colmer et al., 1950; Temple et al., 1951). This strain was found in the mine water drainage, with high acidity. The Penicillium types of fungi are heterotrophs eukaryotes that are often found on the organic substances from the acid waters (Ramirez, 1982; Baker et al., 2004; López-Archilla et al., 2004).
In the acid solution studied by us at the Kiesberg Mine the association of the Acidithiobacillus ferrooxidans with the six strains of Penicillium into a continuous biofilm on the cavity vault is characteristic to this mine. Close trophic type relationships are established between the organisms of this consortium.

VASILE-DANIEL GHERMAN, JEAN-GABRIEL BRÉHERET AND MIHAIL-DRĂGAN BULARDA
126
Conclusions The acid solution (pH 1.21) percolating in the Kiesberg mine overburden,
houses a rich acidophilic community of microorganisms. This community is formed (1) by a numerous population of Acidithiobacillus ferrooxidans (80 %), that represents the primary producer of organic substance which oxidizes the pyrite from the cavity walls and (2) by the populations of six strains of Penicillium (20 %); these heterotrophic organisms use the organic substances provided by the primary producer.
The biological processes that take place in this acid solution from the cavity vault are continuous; they occur during the whole year, the acid solution layer being permanently supplied throughout the fine crack system from the cavity wall.
REFERENCES
Baker, B. J., Lutz, M. A., Dawson, S. C., Bond, P., Banfield, J. (2004) Metabolically Active Eukaryotic Communities in Extremely Acidic Mine Drainage. Appl Environ Microbiol., 70, 6264-6271.
Banks, D., Younger, P. L., Arnesen R-T., Iversen E. R., Banks, S. B. (1997) Mine-water chemistry: the good, the bad and the ugly. Environ. Geology, 32, 157- 174.
Braddock, J. F., Luong, H. V., Brown., E. J. (1984) Growth Kinetics of Thiobacillus ferrooxidans Isolated from Arsenic Mine Drainage. Appl Environ Microbiol., 48, 48–55.
Colmer, A. R., Temple, K. L. (1950) An iron-oxidizing bacterium from the acid drainage of some bituminous coal mines. J. Bacteriol., 59, 317-28.
Edwards, K. J., Bond, P. L., Gihring, T. M., Banfield, J. F. (2000), An Archaeal Iron-Oxidizing Extreme Acidophile Important in Acid Mine Drainage. Science, 287, 1796 – 1799.
Hutchinson, M., Johnstone, K.,I., White, D. (1966) Taxonomy of the acidophilic thiobacilli. J. Gen. Microbiol., 44, 373–381.
Johnson, D. B. (1998) Biodiversity and ecology of acidophilic microorganisms. School of Biological Sciences, University of Wales, Bangor LL57 2UW, UK.
Johnson, D. B., Rolfe, S., Hallberg, K. B., Iversen, E. (2001) Isolation and phylogenetic characterization of acidophilic microorganisms indigenous to acidic drainage waters at an abandoned Norwegian copper mine. Environ. Microbiol., 3, 630-637.
Kelly, D. P., Wood, A. P. (2000) Reclassification of some species of Thiobacillus to the newly designated genera Acidithiobacillus gen. nov., Halothiobacillus gen. nov. and Thermithiobacillus gen. nov. International Journal of Systematic and Evolutionary Microbiology, 50, 511-516.
López-Archilla, A. I., González, A. E., Terrón, M. C., Amils, R. (2004) Ecological study of the fungal populations of the acidic Tinto River in southwestern Spain. Canadian Journal of Microbiology, 50, 923-934(12).
Lorinczi Fr., Turcu L. (1966) Micromycete izolate din sol şi peşteri, în Flora şi VegetaŃia rezervaŃiei naturale Defileul Crişului Repede. Contr. bot., Univ. Babeş- Bolyai Cluj, pp 69 – 82.

MICROORGANISM ASSOCIATIONS WITHIN A THIN ACID SOLUTION FILM …
127
Ramirez C. (1982) Manual and Atlas of the Penicillia, Elsevier Biomedical Press. London. Rodina, A. G. (1972) Methods in Aquatic Microbiology, (translated, edited and revised by Colwell,
RR and Zambruski, MS), University Park Press, Baltimore. Schrenk, M. O., Edwards, K. J., Goodman, R. M., Hamers, R. J., Banfield, J. F. (1998) Distribution
of Thiobacillus ferrooxidans and Leptospirillum ferrooxidans: Implications for Generation of Acid Mine Drainage. Science, 279, 1519 – 1522.
Silverman, M. P., Lundgren, D. G. (1959) Studies on the chemoautotrophic iron bacterium Ferrobacillus ferrooxidans. I. An improved medium and a harvesting procedure for securing high cell yields. J. Bacteriol., 77, 642-7.
Starkey, R. L. (1934), Cultivation of Organisms Concerned in the Oxidation of Thiosulfate. J. Bacteriol., 28, 365–386.
Temple, K. L., Colmer, A. R. (1951) The autotrophic oxidation of iron by a new bacterium, Thiobacillus ferrooxidans. J. Bacteriol., 62, 605-11.
Winogradski, S. M. (1952) Soil microbiology (in Rushian). Probl. Met. Izd. AN SSSR, Moscow, 792 pp. Wood, A. P., Kelly, D. P. (1983) Autotrophic, mixotrophic and heterotrophic growth with denitrification
by Thiobacillus A2 under anaerobic conditions. FEMS Microbiol. Lett., 16, 363-370.

STUDIA UNIVERSITATIS BABEŞ – BOLYAI, BIOLOGIA, LII, 2, 2007 (p.129-136)
MICROBIAL COMMUNITIES AND ENZYMATIC ACTIVITIES IN THE MOUNTAINOUS SOILS IN PARÂNG
RAHELA CARPA 1
SUMMARY. Fifteen soil samples from the Parâng Mountain in the South-Eastern part of the Hunedoara county, from five altitudinal vegetation zones (alpine, subalpine, conifers, beech and flood plain) have been analyzed microbiologically and enzymologically. The microbiological analyses consisted in the study of the abundance, dynamics, diversity and ecological significance of the bacterial groups involved in the biogeochemical cycles of carbon and nitrogen: aerobic mesophilic heterotrophs, ammonifiers, denitrifiers, nitrate and nitrite bacteria. Based on the obtained results, the bacterial indicator of the soil quality (BISQ) was calculated for each type of soil in each altitudinal vegetation zones. In order to have a complete image on the complex microbial processes in these habitats, these analyses have been completed with enzymological researches which make possible the appreciation of evolution of the soil types. The phosphatase, catalase, actual and potential dehydrogenases activities have been studied in all the soil samples. The studied activities were detected in all the 5 altitudinal vegetation zones, with differences noticed only as regard the intensity of the processes. Based on the absolute values of the enzymatic activities, the enzymatic indicator of soil quality (EISQ) was calculated. The EISQ values ranged between 0.314 and 0.430, indicating a moderate intensity of the enzymatic activities. A positive correlation between the bacterial and enzymatic indicators of soil quality (r = + 0.976) was established. Keywords: soil, bacterial communities, enzymatic activities, bacterial and enzymatic indicators of soil quality Introduction The importance of the microbiological and enzymological study of soils
has been frequently underlined by researchers in this field (Zborovschi et al., 1989; Paşca et al., 1993; Drăgan-Bularda et al., 1995). The two kinds of analyses are complementary and offer a general overview on the complex relations between the components of the soil microbiota, as well as on the enzymatic transformations of organic compounds in soils. The present paper aims to establish such relations in soils sampled from five altitudinal vegatation zones in the Parâng Mountain: the alpine zone, the subalpine zone, the conifers zone, beech zone and the flood plain from Maleia river. The microbiological and enzymological analyses pursue the knowledge of the percentage of some bacterial physiological groups and of some enzymes involved in the biogeochemical cycles of the elements and the achievement of an overall image of the biological activity in the soil.
1 Babeş-Bolyai University, 1 Kogălniceanu Street, 400084/Cluj-Napoca, Romania, E-mail: [email protected]

RAHELA CARPA
130
Material and Methods Fifteen soil samples from the Parâng Mountain, as three samples from five
altitudinal vegetation zone (tab. 2), have been analyzed microbiologically and enzymologically. The distance between the sampling points of a altitudinal vegetation zone was 250 m and the depth of sampling was 15 cm.
There was established the number of bacteria belonging to the following ecophysiological groups: aerobic mesophilic heterotrophs, ammonifiers, denitrifiers, nitrate bacteria and nitrite bacteria. All operations connected to the bacteriological determinations were carried out under sterile conditions. There was also established the content of the soil in dry substance, by the drying of some samples at 105oC, for three days. The number of the aerobic mesophilic heterotrophs was determined on a plates bullion agarized medium (Atlas, 2004). After incubation the number of colonies in each Petri dish was read, the average of the parallel sample values was calculated from the most significant dilution and it was multiplied with the reverse value of the respective dilution. The analysis of the ammonifiers was performed on peptone medium. For denitrifiers the De Barjac culture medium (Pochon, 1954), and for nitrate and nitrite – reducing bacteria a selective liquid medium (Drăgan-Bularda, 2000) was used. The most probable number of the bacteria was calculated according to the statistical table of Alexander (1965).
The enzymological analyses consisted in determination of the following enzymatic activities: catalase (Kappen, 1913), phosphatase (Krámer and Erdei, 1959), actual and potential dehydrogenase (Casida et al., 1964).
Results and Discussions The results of the microbiological analyses are presented in tab. 1. One can
notice the presence of all the five ecophysiological groups in all the analyzed samples. It is remarkable the large number of the aerobic mesophilic heterotrophs of
order 106 - 107 cells/g soil of dry substance, in the soil of the alpine altitudinal vegetation zone and in the samples of the Maleia flood plain.
The number of bacteria belonging to the other groups is much smaller. In the order of their abundance, the aerobic mesophilic heterotrophs are followed by the ammonifiers (103 – 105 cells/g soil dry substance), denitrifiers (103 – 104 cells/g soil dry substance), nitrate-reducing (103 – 104 cells/g soil dry substance), the weakest represented are the nitrite-reducing bacteria (103 cells/g soil dry substance).

MICROBIAL COMMUNITIES AND ENZYMATIC ACTIVITIES ...
131
Table 1. The results of the microbiological analyses
Number of the bacteria/ g soil of dry substance
Soil type Aerobic mesophilic
heterotrophs Ammonifiers Denitrifiers
Nitrate bacteria
Nitrite bacteria
BISQ
Alpine 25184772 45287 8444 8096 1925 4.635 Subalpine 18337853 40520 7555 8376 1992 4.594 Conifers 7339027 1350 1243 4739 1127 3.964 Beech 17619239 42675 15378 6740 2164 4.645
Flood plain 30162846 123164 17447 10231 1802 4.815
As in the case of the aerobic mesophilic heterotrophs, in the soil from the alpine and flood plain samples the number of the ammonifiers, denitrifiers, nitrate and nitrite-reducing bacteria is larger than the number registered in the other three sample soils.
On the base of the number of bacteria belonging to each ecophysiological group, the bacterial indicators of the soil quality (BISQ) were calculated, according to Muntean, (1995-1996):
where BISQ = the bacterial indicator of the soil quality; n = the number of the physiological groups considered within the calculation; N = the number of the bacteria belonging to each ecophyisiological group.
As we can notice in fig. 1, the microbial potential of soils, defined by the
values of the bacterial indicators of soil quality is different. Thus, the soil in the alpine altitudinal vegetation zone and in the flood plain has the highest bacterial potential and the soil in the conifers altitudinal vegetation zone has the lowest potential. The differences are not very high. Only the soil in the conifers zone has lower value of the BISQ (3.964).
The results of the enzymological analyses are presented in tab. 2. In all the samples analyzed there was remarked the presence of each of the four studied enzymes, the intensity of the activities varies within larger limits, in the case of the phosphatase and within restricted limits in the case of catalase.
As compared with the data in the literature (Zborovschi et al., 1989; Drăgan-Bularda, et al., 1995), we may consider that the phosphatase and especially catalase activities are intense, while the dehydrogenase activities have lower values.
Nlogn
1 = IBCS 10∑•

RAHELA CARPA
132
110
1001000
10000100000
100000010000000
100000000
Alpine Subalpine Conifers Beech Flood plain
Soil type
Cel
ls/g
soi
l d.s
.
0
1
2
3
4
5
6
HA AM DN NaB NiB BISQ
BISQ
Fig. 1. Bacterial potential of the soil based on the values of the bacterial indicators of the soil quality (BISQ).
HA = aerobic mesophilic heterotrophs; AM = ammonifiers; DN = denitrifiers; NaB = nitrate
bacteria; NiB = nitrite bacteria.
One might notice that the maximum values of each activity were achieved in the soil from the Maleia flood plain. The minimum values for the dehydrogenase activity were registered in the soil of the conifers zone, only the catalase activity registers the minimum value in the soil from the beech altitudinal vegetation zone.
Based on the absolute values of each enzymatic studied activity, the enzymatic indicator of the soil quality (EISQ) was calculated, according to the formula (Muntean et al., 1996):
(i)V
(i)V n
1 = IECS r
n
=1i max∑•
where EISQ = the enzymatic indicator of the soil quality;
n = number of activities; Vr(i) = real individual value; Vmax(i) = maximum theoretical individual value.

MICROBIAL COMMUNITIES AND ENZYMATIC ACTIVITIES ...
133
The maximum theoretical individual value, calculated from the composition of the reaction mixtures are: 21.56 mg phenol (phosphatase activity), 60 mg splitted H2O2 (the catalase activity), and 13.45 mg formazan (dehydrogenase activities).
Table 2.
The results of the enzymological analyses
Dehydrogenase activity Actual Potential Soil type
Phosphatase activity (mg phenol/2,5 g)
Catalase activity (mg splitted H2O2 /1,5 g) mg formazan/2,5 g
EISQ
a 13.346 45.823 1.579 2.970 0.430 b 11.588 43.845 1.392 2.596 0.391 Alpine c 10.060 45.164 1.889 2.868 0.393
Mean value 11.664 44.944 1.620 2.811 0.405 a 20.094 32.637 2.032 3.375 0.469 b 15.379 34.285 2.350 2.149 0.405 Subalpine c 5.258 37.582 0.738 1.642 0.262
Mean value 13.577 34.834 1.707 2.389 0.379 a 9.418 44.175 1.509 1.749 0.354 b 9.693 32.637 0.581 0.726 0.273 Conifers c 10.594 33.296 1.122 1.772 0.315
Mean value 9.902 36.703 1.071 1.416 0.314 a 17.343 30.659 1.364 2.120 0.394 b 11.331 27.032 1.181 0.843 0.282 Beech c 17.914 37.252 2.350 5.401 0.507
Mean value 15.530 31.648 1.632 2.788 0.394 a 16.764 26.703 0.967 1.738 0.356 b 19.262 27.362 1.798 2.919 0.425 Flood plain c 15.501 47.472 3.450 3.639 0.509
Mean value 17.176 33.846 2.072 2.765 0.430
We mention that the enzymatic indicator may have values ranging between 0 (when no real activity of any of the studied enzymes is detected) and 1 (when all the activities have real individual values equal to the maximum theoretic values).
As in the case of the bacterial potential, the enzymatic potential of soils, defined by the values of the quality enzymatic indicators is represented in fig. 2. Only the flood plain soil exceeds the 0.5 value of the EISQ, and the value of soil from the conifers altitudinal vegetation zone is lower than 0.4 of the EISQ.

RAHELA CARPA
134
0.2
0.3
0.3
0.4
0.4
0.5
0.5
0.6E
nzym
atic
indi
cato
r of
soi
l qua
lity
a b c a b c a b c a b c a b c
Soil type
Alpine Subalpine Conifers Beech Flood plain
Fig. 2. The enzymatic potential of soils.
4,8154,635 4,6454,594 3,964
0,4300,405
0,3790,394
0,314
3,5
4,0
4,5
5,0
Alpine Subalpine Conifers Beech Flood plain
0,00
0,05
0,10
0,15
0,20
0,25
0,30
0,35
0,40
0,45
0,50
BISQ EISQ
BISQ EISQ
Fig. 3. The comparison of the microbial and enzymatic potential, on the base of the values of the bacterial (BISQ) and enzymatic (EISQ) indicators of soil quality.

MICROBIAL COMMUNITIES AND ENZYMATIC ACTIVITIES ...
135
Fig. 3 illustrates the bacterial and enzymatic potential of the analyzed soils, based on the quality indicators values. One can observe their parallel route, reflected, in fact by the positive correlation coefficient calculated between the two indicators (r = +0,976).
The bacterial and enzymatic indicators of the analyzed habitats quality offers an overall image on the intensity of the microbial activity and, implicitly, enzymatic, of the general biological activity in the analyzed soils. Based on the results and in comparison with the data in the specialty literature (Paşca et al., 1993; Drăgan-Bularda, et al., 1995), we may consider that the analyzed soils have an appreciable biological potential; only the soil in the conifers altitudinal vegetation zone have lower values of the two quality indicators, bacterial and enzymatic, which set the basis for this appreciation.
Conclusions The presence of all the five studied bacterial ecophysiological groups studied
was noticed in all the soil samples. Their number decreases in the following order: aerobic mesophilic heterotrophs (106 - 107 cells /g soil dry substance) > ammonifiers (103 – 105 cells/g soil dry substance) > denitrifiers (103 – 104 cells/g soil dry substance) ≥ nitrate-reducing bacteria (103 – 104 cells/g soil dry substance) > nitrite-reducing bacteria (103 cells/g soil dry substance).
The microbial potential of soils, defined by the values of the bacterial indicators of soil quality decreases in the following order: flood plain soil > soil from the alpine altitudinal vegetation zone > soil from the subalpine altitudinal vegetation zone > soil from the altitudinal beech zone > soil from the conifers altitudinal vegetation zone. The differences among them are not significant. Only the soil in the conifer forests has a value of the bacterial indicator of quality smaller than four (3.964).
The presence of each of the 4 studied enzymes was detected in all the soils analyzed. The soil enzymatic potential, defined by the values of the enzymatic indicators of quality, decreases in the same order as the microbial potential. A positive correlation, with good statistical significance (p<0.01), was established between the bacterial and the enzymatic indicators of soil quality.
The flood plain soil proved to be a good soil from the enzymological and bacterial point of view. Both the enzymatic and bacterial indicators of soil quality reached the highest values: BISQ = 4.815 and EISQ = 0.430. This values indicate the presence of high enzymatic and bacterial potential in these zones as compared with the other analyzed zones.
Acknowledgements. Part of this research was supported by the PNCDI 2 Grant, type TD, CNCSIS Code
337, Nr. 116/1.10.2007.

RAHELA CARPA
136
REFERENCES
Alexander, M. (1965). Most probable-number method for microbial populations. In Black, C.A., Evans, D.D., White, J.L., Ensminger, L.E., Clark, F.E. (eds.), Methods of Soil Analysis, Ed. Am. Soc. Agron., Madison.
Allen, O.N. (1957). Experiments in Soil Bacteriology. 3rd edition, Ed. Burgess, Minneapolis. Atlas, R.M. (2004). Handbook of Microbiological Media. 3rd edition, CRC Press, New York.. Casida, L.E.Jr., Klein, D.A., Santoro, T. (1964). Soil dehydrogenase activity. Soil Sci., 98, 371-376. Drăgan-Bularda, M. (2000). Microbiologie generală. Lucrări practice, UBB, Cluj-Napoca. Drăgan-Bularda, M., Kiss, S., Paşca, D., Manolache, E., Crişan, R., Marin, G. (1995). Microbial
communities in soils of the Danube Delta Biosphere Reserve, Stud. Univ. ”Babeş-Bolyai”, Biol., 40 (1-2), 130-139.
Kappen, H. (1913). Die katalytische Kraft des Ackerbodens. Fühlings Landw. Ztg., 62, 377-392. Krámer, M., Erdei, G. (1959). Primenenie metoda opredeleniya aktivnosti fosfatazy v
agrokhimicheskikh issledovaniyakh. Pochvovedenie, 9, 99-102. Muntean, V. (1995-1996). Bacterial indicator of mud quality. Contrib. Bot., 73-76. Muntean, V., Crişan, R., Paşca, D., Kiss, S., Drăgan-Bularda, M. (1996). Enzymological
classification of salt lakes in Romania, Int. J. Salt Lake Res., 5 (1), 35-44. Paşca, D., Crişan, R., Muntean, V., Dragan-Bularda, M., Kiss, S., (1993). Enzymatic activity in
soil of the Retezat National Park, The Retezat National Park – Ecological Studies – Popovici, I., (ed.) Ed. West Side, Brasov, 117-129.
Pochon, J. (1954). Manuel technique d'analyse microbiologique du sol, pp.59-60, Masson, Paris. Zborovschi, E., Crişan, R., Muntean, V. (1989). Analiza enzimologică a unor soluri alpine din
Parcul NaŃional Retezat, PublicaŃiile SocietăŃii NaŃionale Române pentru ŞtiinŃa Solului, Bucureşti, 26A, 219-225.