anvik and andreafsky river salmon studies · 14. east fork andreafsky river sumner chum salmon...
TRANSCRIPT

_gt
AYK REGION YUKON SALMON ESCAPEMENT REPORT IJ 20
ANVIK AND ANDREAFSKY RIVER SAU1CN STUDIES 1982
lawrence s Buklis Alaska Department of Fish and Game Divisiat of Catmercial Fisheries
Anchorage Alaska
February 1983
LlST OP ~-middotmiddotbullbullbullbullbullbullbullbullbullbullbullbullbullbullbullbullbullbullbullbullbullbullbullbullbullbullbullbullbullbullbullbullbullbullbullbullbullbullbullbullbullbullbullbullbullbullbullbullbullbullbull iii
LlST OF FDGURESbullbullbullbullbullbullbullbullbullbullbullbullbullbullbullbullbullbullbullbullbullbullbullbullbullbullbullbullbullbullbullbullbullbullbullbullbullbullbullbullbullbullbullbullbullbullbullbullbullbullbullbullbull iv
LIS CJFmiddot ApQl[)ICS bullbullbullbullbullbullbullbullbullbullbullbullbullbullbullbullbullbullbullbullbullbullbullbullbullbullbullbullbullbullbull middotbull bull bull bull bull bull bull bull bull bull bull bull bull bull bull bull bull bull bull vi
~~ONbullbullbullbullbullbullbullbullbullbullbullbullbullbullbullbullbullbullbullbullbullbullbullbullbullbullbullbullbullbullbullbullbullbullbullbullbullbullbullbullbullbullbullbullbullbullbullbullbullbullbullbullbullbullbullbull 1
ANVIK RIVER JUVENILE SALMON STDDfbullbullbullbullbullbullbullbullbullbullbullbullbullbullbullbullbullbullbullbullbullbullbullbullbullbullbullbullbullbullbullbullbullbullbull 3
Methods and Materials 3 Results and Discussion 5
lNliK ~ AD(][T ~ s-moY bullbullbullbullbullbullbullbullbullbullbullbullbullbullbullbullbullbullbullbullbullbullbullbullbullbullbullbullbullbullbullbullbullbullbullbull bullmiddotbull 9
Methods and Materials 10 Results and Discussion 12
~RIVER ADULT SALMeN ~bullbullbullbullbullbullbullbullbullbullbullbullbullbullbullbullbullbullbullbullbullbullbullbullbullbullbullbullbullbullbullbull 25
Method and Materials 25 Results and Discussion 28
CCNCLDSIONS AND ~ONS bullbullbullbullbull ~bullbullbullbullbullbullbullbullbullbullbullbullbullbullbullbullbullbullbullbullbullbullbullbullbullbullbullbullbullbullbull 43
L~ crED bullbullbullbullbullbullbull bull bullbullbullbullbullbullbullbullbullbullbullbullbullbullbullbullbullbullbullbullbullbullbullbullbullbullbullbullbullbullbullbullbullbullbullbull bullmiddotbull bull 45
APPENDICES 46
LIS OF TABLES
Table
l Anvik River chan salmal sonar counts by date 1982 bullbullbullbullbullbullbullbullbullbullbullbullbull 13
2 Visual calibration of salmon sonar counts at the Anvik River east bank site 1982 15
3 Visual calibration of salmon sonar counts at the Anvik River west bank site 1982 16
4 East Fork Andreafsmiddotky River chum and king salmon sonar counts~ date 1982 bullbullbullbullbullbullbullbullbullbullbullbullbullbullbullbullbullbullbullbullbullbullbullbullbullbullbullbullbullbullbullbullbullbullbullbullbull
5 Visual calibration of salmon sonar counts at the East Fork Andreafsky River midStream site 8-16
29
July 1982 34 6 Visual salmal counts at the East Fork Andreafsky
River midstream site 17-20 July 1982 35
bull
-iii-
LIST OF FIGURES
1 Map of the Yukon River showing fishing districts and major sumner chum salmon spawning areas bull bull bull bull bull bull bull bull bull bull bull bull bull bull bull bull bull bull bull 2
2 Map of the ~k River 4
3 Anvik River chiID saJmal fry average weight length and beach seine catch per mit eftort by day 1982 No sampling was ccnducted between 26 May and 21 June 7
4 Anvik River king salmal fry average weight length and beach seine catch per unit effort by day 1982 bullbullbull bull bullbullbull 8
s Anvik River stmner chum salmm escapement 1972-1982 14
6 Daily sumner chum salmon escapement IaSt the Anvik River sonar site 1979-1982 The mean date of nm passage is indicated by dashed line 18
7 Smmer chun salmal escapement past the Anvik River sonar site by hour 1979-1982 19
8 summer clum salmon escapement past the Anvik River middot sonar site by sonar sector 1979-1982 Note that there were 12 sectors for each substrate in 1979-1981 and 16 sectors in 1982 20
9 Water tenperature air temperature (maxmin average) and water depth measured at noon daily at the Anvik Rivet sollilr site 1982 22middot
10 Age and sex caupositioo of Anvik River sumner chum sa] JDCil 1 197 2-1982 bull bullbullbull - bull bull 23
11 Age and sex canpositioo of Anvik River king salmon carcass s~es 1972-1982 24
12 Map of the Andreafsky River 26
13 Map of the East Fork Andreafs~ River 27
14 East Fork Andreafsky River sumner chum salmon escape-ment 1972-1982 30
15 Daily sumner chum salmon escapenent past the Fast Fork Andreafsky River sonar site 1981-1982 The meanmiddot date of run passage is indicated by dashed line bullbullbullbullbullbullbullbullbullbullbull _ 31
-iv-
LIST OF FIGURES (COntinued)
Figure
16 East Fork Andreafsky River sonar count distribution by sonar sector (above) and by hour (below) an 2 July 1982 A total of 32572 sonar counts were registered on this date 18 of the total for the season 32
17 SUmner chtn salmon escapenent past the East Fork Andreafsky River sonar site by hour 1981-1982 36
18 SLmmer chJll salmon escapement past the East Fork Andreafsky River sonar site by sonar sector 1981-1982 Note that sector l was on the west end in 1981 and an the east end in 1982 37
19 Hourly passage rate of chum king and pink saJmm at the East Fork Andreafsky River sonar site based on visual counts_ 1981-1982 bullbullbullbullbullbull bullbull bull bull bull bull bull bull bull bull bull bull bull bullbull bullbull bullbull bull bull bull bull bull bull bull 38
20 Water telrq)erature air temperature (maxmin average) and water depth measured at noon daily at the East FOrk Andreafs~ River sonar site 1982 40
21 Age and sex canpositicn of East Fork Andreafsky River summer chum salmon 1981-1982 41
22 Age and sex canposition of Andreafsky River king salmon 1981-1982 42
middot middot middot
LIST OF APPmDICEs
adjusting daily sonar counts of defective SIUipnent or
at the Anvik River sonar
sitim of Anvik River smmaer
46
ne and carcass sampies 1982 48
-si tim of Anvik River king es 1982 49
king saJmm visual counts at sky River midstream site to
~ement 17-20 July 1982 50
ibnlPOSition of East Fork Andreafsky beach seine and carcass
si tioo of Fast and West Fork 9 salmon beach seine and carcass ~ bullbull -
_
_- ~ - ~
-vi-
51
52
ihe Anvik and Andreafsky Rivers are the two largest producers of sumner chum salmon (Oncorbynchus keta) in the Yukon River drainage (Figure 1) Buklis (1982a) estimated that the Anvik River alone accounts for 35 of the total production Other known major spawning populations occur in the Redo Nulato Gisasa Hogatza Melozitna_ Tozitna Chena and Salcha Rivers (Figure 1) SUmner chum salmon spawn in smaller numbers in a few other tributaries of the Yukon River as well King salmon (Q tshawystcba) and pink salmon (~ gorbuscha) run timing in the Anvik and lmdreafsky Rivers coincides with the mid-June to late July escapement of summer clun salmon while coho salmal (Q kisutcb) occur in small numbers after _this period
A total of 1000021 salmm were camnercially harvested in the Yukon area in 1982 lhe catch was composed of 123658 king salmon 614166 sunaner chum salmon 225021 fall chum salmon and 37176 coho saJmm lbe king and chum salmon catches were below the recent 5 year average while the coho catch was above average Subsistence harvest data has not yet been canpi1ed but is expected to total an additional 25000 kings 200000 swmner chums 100000 fall chIUS and 30000 cohos (Geiger 1982)
Anvik River juvenile salmon were studied for the first tme in 1982 and daily salmon escapement to the Anvik and Andreafsky Rivers was enumerated by side-scanning sonar This report presents the results of these studies
-1-
Hogatza R
334-40
bullbullbull -middotmiddotmiddotmiddot bullbullbullbullbullbullbullbullbullbullbullbullbullbullbullbull bullbullbullbullbullbullbullbullbullbullbullbullbullbullbullbull ~middotmiddotmiddotmiddotmiddotmiddotmiddotmiddotmiddotmiddotmiddot4 bull bull bullbull-middot
Fishing District Boundaries
Major Sumner ChlItl Sahron Spawning Areas
Figure 1 Map of the Yukon River showing fishing distrirts and major summer chum salmon spawning areas
Magnitude of the YUkon River summer chum salmon run is assessed in-season based on catch statistics from test fishing gillnets near Jmnooak and fran the caxmercial fisheey itself An accurate pre-season forecast of run strength would allow management biologists and the fishinq in(ilstry to plan for the season accordingly At the present time only a subjective rating of good fair or poor is projected for the summer Chum salmon tun and is based infonmally on the strength of the ~arent year return Amore rigorous forecast might be developed with a statistical treatment of parent year escapement and return data cl~to1ogica1 factors and juvenile salmon production The feasibility of estimating juvenile salmal productim was studied in 1982 as a first step towards developnent of a forecast model for adult returns The Anvik River was chosen because it is the largest prodlcer of stmmer chum salmon in the Yukon River drainage
The Anvik River (Figure 2) originates at an elevatioo of 1300 feet and flows in a southerly direction 120 miles to its mouth at mile 318 of the Yukon River It is a narrow run-off stream with a sribstrate of gravel and cotble except in the URgter reaches where bedrock is exposed The Yellow River is a major tributary of the Anvik and is stained with tannic acid runoff Downstream of the Yellow River confluence the Anvik River changes from a moderate gradient system confined to a flood plain of 075 to 15 miles wide to a lat~ gradient system meandering through a much broader flood plain Water clarity is reduced downstream of the Yellow River confluence Numerous oxbows old channel cutoffs and sloughs are found throughout the lower river
Sampling methods developed on the Anvik River if successful could be awlied to other major spawning areas in future years ltlljectives of the study were to
1 Detemine feasibility of capturing juvenile chum salmCil by beach seine and tnirulc7t trap in sufficient numbers to accurately index abundance and timing of the outmigration
2 Detetmine feasibility of middotusing dye mark and recapture method to estimate abundance of cluu salmon fry otitmigration Flagg (1981) successfully aggtlied this method to sockeye salmcn (Q nerka) smolt in the Kasilof River
3 Collect length and weight data from juvenile cbtm king pink and coho salmon as well as scale samples fran king and qoho salmon smolt
Methods and Materials A two person crew was flown to the sonar site at mile 48 of the Anvik River on 4 May in a Super CUb on skis Most sumner ch1Jn salmon spawning occurs upriver from this site Equipment was stored there from previous adult salmon studies and the storage cache elevated on 4 foot pilings provided shelter for the crew during breakup flooding of the river
Ten minnow traps with l4 inch square mesh and 2 with fine screen mesh were baited with preserved Arctic char roe and fished through holes augered in the river ice and in open water leads along shore A bea~ seine (40 feet long 4
-3-
bull bullbull bull -r
t
feet deep 18 square mesh dyed green) was fished at the campsite after breakup and occasialBJly at other sites upriver The ends of the beach seine were tied to wooden poles One person held each pole and walked downriver parallel to shore with the inshore end at a water depth of 1 to 2 feet and the offshore end a8 deep as could be walked in bipwaders captured fish were held in buckets of fresll water and counted by species Thirty juvenile salma1 of each species were subsampled fran the catch each day measured for total length (tip of snout to fork of tail) in millimeters and a qroup weight by species was measured to the nearest 01 g on a triple-beam balance Scale smears were taken from king and coho salmCil snolt and mounted between glass microscope slides Scales were subsequently aged with a microfiche reader in the laboratory
A minimum of 300 chum salmon fry were to be transferred from the beach seine catch to a holding tank every second day Oxygen would be supplied from a portable aerator and Bismark Brown Y stain added at the rate of 1 gram per 8 gallons water The tank was to be transported 12 mile upriver and the fish released after 30 minutes Marked fry are a distinct golden color For purposes of the population estimate recoveries are attributed to the most recent fry release The follOHirtg formula (Ricker 1975) is middotused to calculate a population estimate for each 48 hour period
~ (M+l) (C+l) Nbull----
(R+l)
Where M = NEber of fry marked c = Nlmlber of fry captured
during the recovery period R = Nanber of marked fry recaptured
during the recovery period
The 95 confidence interval (CI) is calculated according to the following shyfoiiiUlla (Ricker 1975)
95 CI = ~ plusmn 196 j var (~ 1
Where A
Var (N) = (M+l) 2 (C+l) (C-R)
(R+l) 2 (R+2)
In addition to calculating a population estimate for each 48 hour period the data can be pooled to estimate the total p)pulatioo for the entire period of sampling
Resu1ts and Discussion _ The Anvik River was frozen when the crew a~rived on 4 May River ice w~ about 3 feet thick and covered with 2 feet of snow at the campsite Air temperature ranged between -3degC and l2degC during the first week By 11 May 2 to 3 feet of water overflow covered weakening river ice at the campsite Breakup occurred on 13 May Repeated ice floes fran upriver and ice jams
-5-
downriver caused extensive flooding water level remained high through 1 June when the crew leftdue to the flood stage of the Yukon River at Anvik The crew was forced to set up housekeeping in the elevated storage cache for extended periods tetween 13 May and 1 June dJe to the flooding
Six baited minnow traps were set on 6 May in an open water lead along a cutbank 1200 feet belCM camp iW additional trai=S were set on 8 May through holes augered in the ice at the center of the river in front of camp Traps were fished continuously and checked daily One minnow trap was lost with breakup on 13 May All other traps were removed Four were reset along the cutbank 1200 feet belCM camp and 4 were set in a slough area 2000 feet bela~ camp he latter 4 traps were lost to an ice floe on 19 May
During the period 6 May through 26 May only 1 juvenile chum salmon and no other salmon were captured in minnow traps This fish was captured in _a small mesh trap on 25 May Water temperature was 3degC Other fish captured during this period were as follows
29 sljmy sculpin CCotplusmnus cognatus) 8 Arctic lamprey Ctamletra j apmicagt 2 burbot (IQta Jgta) 2 whitefish (Coregonus and PrOSQPiym spp)
Beach seining was difficult and ineffective dle to high water For most of the period 13 May through 1 June the rive was flooded into the willows and exposed beaches were nonexistent Sane sampling was attempted in the vicinity of the camp and also in an area 30 miles upriver catches averaged less than 10 chum salmon per beach seine set (Figure 3) No other juvenile salmon species was captured
middotThe crew returned on 16 June to enumerate adult salmal escapement Water level had dropped by this time and beaches were exposed Juvenile salmon beach seining was resumed oo a time available basis through 26 July Minnow traps were not reset he first beach seine set during this period on 21 June produced the largest chum salmal catch and first king salmcn catch of the study lbis indicates that a significant portion of the juvenile chum salmon outmigration probably occurred between 26 May and 21 June when no sampling was cmducted (Figure 3) Ninety-three chlllll salmon and 7 king salmon were captured at the campsite in one set oo 21 June water temperature was l0degC Daily catches averaged between 0 and 43 chum salmal per beach seine set during the remainder of the study No chum salmal were captured on 24 and 26 July the last two days of sampling King salmon catches remained low until 8 July when 43 were captured in one set at the campsite (Figure 4) bull The largest catch occurred on 15 July when 230 juvenile king salmon were captured in one set near Robinhood Creek about 40 miles upriver from camp Forty-nine king salmon were captured in one set at the campite on 26 July the last day of sampling Water temperature was 11 degC
A total of 341 chum salmon and 432 king salmon was captured by beach seine during the entire study with 229 (66) of the clum salmon and all of the king saJm6n captured after 16 June Three of the king salmon were Age I (one check) smolt while the remainder were Age 0 fry Parr marks were evident on the fry while less distinct oo smelts All of the chJil salmon were yolmg of the year fry
-6-
Figure 3 Anvik River chum sa1nDn fry average weight length and beach seine catcli per unit effort by day 1982 No sampling was corrlucted between 26 May and 21 June
2 -111 --
111
CD
0
75 -e e so z -Ql c Ill _
25
100
w 1 a 0
I I
21 31 10
May
I I
I~
20 June
-7-
30
I
I I I
10
I
sd
20 July
I
ao
I
Figure 4 Anvik River king salnDn fcy aVerage weight length and beach seine catch per tmit effort by day 1982
5
-ICI --c ICI -bull
0
75 -E E - 50 c 0 c bull
25
100
w )
a u
I I I
I I
10
I
I
20 June
-8-
I I
so middot 10
I
20 -July
I
I
30
I
I
lhe ventral surface of those caught in May showed a line of middotmiddotclear tissue evidence of having recently absorbed their yolk sac Those caught later in ~e sumner showed no such marking and were silvezy sided Only 4 coho salmon fry were captured 2 on 26 June and 1 each en 8 and 26 July ~o pink salmal were captured
Weight and length of chum and king salmoo fry increased steadily cilring the sumner ClltJD saluQn average weight was 0 bull 2g on 22 May and 18g on 21 July while average length was 36mn and 58mn respectively (Figure 3) King salmon fry average weight was 05g on 2l June and 39g on 26 July while average length was 411110 and 72um respectively (Figure 4) The 3 king salma1 snolt caught on 24 Jtme 26 June and 4 July averaged 89g in weight and 93nnn in length The coho salmm fry were 10g and 46nm an 26 June and Slg and 78mn on 26 July
Too few juvenile salmcn were captured to test feasibility of the dye mark and recapture technique to estl1nate populatim size In addition the catch data is not a good index of timing or abundance of the outmigraticn High water made beach seining ineffective in Maymiddot and effort was infrequent fran mid-June through late July Future studies of Anvik River juvenile salmcn should use fyke nets andor inclined plane traps This gear can be operated during high water immediately after ice breakup and is capable of catcbing large numbers of juvenile sa]mon middot providing a more meaningful index of timing and magnitude of the outmigraticn (Seiler Neuhauser and Ackley 1981 Todi 1966)
It is awarent fran this initial study in 1982 that chum and king salJnon fry are found in the Anvik River over 2 mmths after breakup of river ice Olum salmon outmigraticm probably peaks in early June whereas king salmon fry may overwinter in the Anvik River Too few smelts were captured to make any cmclusion regarding timing of the king salmon outmig_raQon
ANVIK RIVER AOOLT SAUol S1UDY
Anvik River salmon escapement was enUmerated from counting towers located above the Yellow Biver coofluence between 1972 and 1978 A site 5-l2 miles above the middot Yellow River was used from 1972 through 1975 and a site at Robinhood Creek 2-12 miles above the Yellow River was used from 1976 through 1978 (Figure 2) Aerial surveys were flown each year (except 197 4) in fixed-wing aircraft to estimate salmoo abtmdance below the tower site High and turbid water often affects the accuracy of visual salmon enumeration from comting towers and aircraft middot
The Electrodynamics Division of the Bendix Corporation developed a side scanning hydroacousticmiddot counter during the 1970s capable of detecting and comtinq salmcm migrating along the banks of tributary streams The side scan sonar counter is designed to transmit a sonic beam along a 60 foot aluminmn pipe or substrate Echoes from fish passing through the beam are reflected to the transducer he system electronics interpret the strength and munber of the echoes and tally salmon counts The counter was tested at the Robinhood Creek tower site from 1976 through 1978 and proved to be both feasible and accurate Salmal escapement was enumerated by sonar beginning in 1979 replacing and proving superior to the tCMer counting method One sonar counter was installed on each bank of the Anvik River at mile 48 near nleodore Creek each year bull
-9-
Distribution of salmon counts fran 1972 through 1978 indicated middot that virtually all of the sUIDIIler chum salmon are found upstream of this site The 1982 season was the fourth consecutive year of successful sonar enumeration and extended the Anvik River data base to 11 years
Methqds and Materials TWo 1981 model side scan sonar counters were installed on 22 June at mile 48 of the Anvik River These units differed fran the 1978 models previously used on the Anvik Rivet in the following w~s _(Menin 1982)
1 he 1978 model divided the counting range into 12 sectors while the new model divides it into 16 This results in less data lost if counts fran cme sector must be excluded due to debris
2 Number of hits required by the 1978 model to register ooe salmon were ~rs 1 to 3-3 sector 4-4 sector s-s sector 6-6 sectors 7 and 8-4 sectors 9 and 10-5 sectors 11 and 12-6 be 1981 model requirements are sectors 1 to 4-4 sectors 5 to 7-5 sector 8-6 sectors 9 and 10-4 sector 11-5 sectors 12 and 13-6 sectors 14 to 16-7 The reason for the step functioo change in hits required is that a 4deg beam covers the first half of the counting range and a 2deg beam the secood half
3 be new system transnits 133 times more frequently
4 The old sytem considered any echo that exceeded a certain target strength a hit ~ new system has the additional criterion that the returned echo pulse width must exceed 120J(sec lhls eliminates most reflections fran the substrate and sane debris
5 The 197 8 model permitted three misses between valid hits The new SyenStem peiDdts only one miss This criterion significantly reduces false counts due to intermittant debris or fish sporadically POking snout or tail into the beam
6 Ihe old systen criterion for debris was 24 counts in any one sector in a 35 secatd period The new system requires 32 counts in a 42 second period This reduces the number of debris flags during a large fish migration
7 A new feature was introduced with the 1981 model to distingiJ$ between king salmon and the other salmon species Any returning echoes exceeding 275t sec are routed to a separate totalizer Salmm coiJilts (large and small salmQn combined) for each sector are printed out hourly as well as the total for all 16 sectors Itle nLllllber of large salmon counts that contributed to the total is listed oot is not broken out by sector
The river is awroximately 200 feet wide at the sonar site The 40 foot east bank substrate was deployed perpendicular fran a cutbank with the transducer housing l foot underwater and 5 feet from shore A small weir was built to prevent fish passage inshore of the transducer The 60 foot west bank substrate was deployed from a gradually sloping gravel bar 150 feet downriver fran the east bank counter 1he transducer housing was 1 foot underwater and 25 feet from shore with a weir cmstructed to prevent fish passage inshore of
-1o-
the transducer
Barton (1982a) and McBride and Mesiar (1982) have documEnted that the large fish counting feature of the 1981 model sonar counter does not provide an accurate count of king salmal escapement Since d11m salmon greatly outnumber king salmon (by more than 250 to 1) in the Anvik River all sonar counts were attributed to chum salmon A separate escapement estimate for king salmm would be obtained by aerial survey The sensitivity and fish ve1oci ty settings on the sonar counters were set such that pink salmal smaller and faster swimning than the other salmon species were generally not counted A small percentage of the pink salmal probably registered sonar counts due to lingering in the beam before moving middotupriver
Sector counts missing due to debris or printer malfuncticn were estimated by averaging the counts for the hour before and after the missing data Sonar counts for the two substrates were added together daily and the total multiplied by 110 (Buklis 1981) to account for midstream escapement not covered by the sonar counters Each sonar Counter wasmiddot calibrated three times middot daily (at 0700 1500 and 2300 hours) with an oscilloscope for a 15 minute period Salmon passing through the sonar beam produce a distinctive oscilloscope trace Sonar and oscilloscope counts for each calibraticn period are related in the follcwing fomula
ss Q=_
sc
where ss = Side scan counts SC = Scope counts
If the difference ~tween the counts was greater than 15 (085 ~ Q ~ 115) then the existing fish velocity setting was multiplied by Q to obtain the correct new setting The system was then recalibrated for 5 minutes at the new setting A record was kept of all adjustments ~o the sonat equipment Whenever water and light conditions allowed fish passage over the substrates was visually enJ1lerated fran a 10 foot counting tower Polaroid sunglasses were worn to reduce water surface glare Visual counts are reJXgtrted as the net upstream passage or the number of fish passing upstream across the substrate minus the ruunber drifting back downstream across the substrate
CLimatological data was collected each day at noon at the campsite A fence stake marked in 1 an increments was set in the river Changes in water depth are presented here as negative or positive from the initial reading of Ocm Water temperature was measured in degC near shore at a depth of about 1 foot Air temperature is the average of the daily maximwn and min~mum in degC Subjective notes were kept by the crew describing wind speed and directioo cloud cover and precipitation
A beach seine 100 feet loog 66 meshes deep 2-12 inch stretch measure mesh) was set near the sonar site to capture salmon for age sex and size measurements captured fish were identified by species while king and chun salmon were further identified by sex measured fran mid-eye to fork of tail in millimeters and three scales taken for age determinatim scales were
-ll-
removed fran an area posterior to the base of the dorsal fin and above the lateral line CJl the left side of the fish The adipose fiil was clipped before release to prevent later sampling of the same individual fish In addition king and chm sallnm carcasses were sampled during late July and early August fran beaches bebreen the sonar site and Robinhood Creek These fish were measured as described above Scale samples were later pressed on acetate cards and the resulting ~ressions viewed on a microfiche reader for age detemlinatim
Results and Discussim The sonar counters were operated from 22 June through 26 July The seasan escapement was 444581 sumner chum sa]mon (Table 1) Buklis (1982a) expanded the season escapement estimates for 1972 through 1978 making it pgtssible to more directly canpare visual count estimates from those years with the more recent sonar count estimates The 1982 escapement was below the previous 10 year average of 544923 sumner clun salmon but similar in magnitude to those of 1972 1974 and 1980 (Figure 5) Water turbidity and weather conditions (wind riilil overcast) made it difficult to obtain an accurate visual check an the accuracy of the sonar counters The degree of accuracy appeared to be erractic for any given calibration period but was acceptable for all periods combined A total of 46 hours of visual counts were obtained over a period of 28 days for the east bank sonar counter and sonar accuracy (sonar countsnet visual counts) averaged 112 (Table 2) Only 38 hours of visual counts were obtained over a similar period for the west bank and sonar accuracy averaged 076 (Table 3) Oscilloscope calibrations were used to monitor the accuracy of the fish velocity settings which were changed as necessary bull
Breakdown of the electronics in the west bank sonar counter at 4 July made it necessaey to estimate daily escapement based em the one operational counter Difficulties with the equipnent persisted until 14 July and derivatioo of salmon escapement estimates for this 11 day period are outlined in Appendix A A problem adjusting the sonar counter was encountered on the west bank (60 foot substrate) but not on the east bank (40 foot substrate) Sane fish would pass over the substrate but not register a sonar count or a spike on the oscilloscope trace lbese fish were apparently swinming over the sonar beam near the water surface or between the bottom of the sonar beam and the surface of the substrate SUch a gap might be created if the substrate was sagging A third pgtssibility is that the substrate was )awed downriver by the current to such a degree that salmal eould swim over the substrate but then drop to the river bottan and pass belcM the sonar beam before encountering it Extensive adjustments were made in the aiming of the transducer fish velocity and system sensitivity settings of the electronics and positiming of the substrate nle problem was eventually resolved A secmd source of colinting error may have been the critericn required by the electronics to register a salmon co1mt Barton (1982a) middotdescribed a similar problem with a 1981 model sonar counter used on the Sheenjek River in 1982 It is difficult to adjust the system electronics to accurately count salmon in all sectors When properly counting in sectors l and 2 then sectors 9 and 10 appear to overcount The problem has not been clearly documented but should be investigated before the 1983 field seaoon
-12-
-13-
Figure 5 AnVik River surmer chum salnDn escapement 1972-1982
-bull c 0 ---~ --middotc bull E bull Q
bull g
bull Ill
c 0 E
bull E
bull E E ~
CD
15 _
bull
bull
bull
-10 middot-
bull
bull
bull
bull
05 ~-bull
bull
bull
00 I -I 1 I I I I I r I
1972 197-4 1976 1978 1980
-14-
I I I l
1982
rable 2 Visual calibration of salmon sonar counts at the Anvik River east bank site 1982
Visual COuntJ
Pink saJJoon Sonar
Date COunt Op
627 2315-2330 0 0 0 628 1510-1525 0 0 0 629 1530-1540 0 0 0 630 1517-1525 0 0 0 73- 1718-1733 29 38 0 79 1600-1615 16 24 2 79 2205-2220 10 19 0 713 1318-1333 37 37 l 713 2252-2303 63 34 0 714 223Q-2245 62 23 1 715 0940-Q955 5 5 0 715 2205-2220 13 ll 0 717 1005-1018 25 26 0 7lB 0807-o822 40 28 1 7lB 1619-1632 5 10 0 719 0855-0906 32 32 l 719 1506-1520 17 16 1 720 0824-0837 14 12 1 720 1614-1625 8 32 1 723 0952-1004 2 2 0 724 l45G-1500 5 2 0
lOTALS 4 60 hours 383 351 9
Net Op
0 0 0 0 0 0 0 0
38 0 22 0 19 0 36 0 34 0 22 3 5 4 ll 1 26 1 27 lS 10 8 31 27 15 16 11 15 31 21
2 2 2 1
342 114
Down Net
0 0 0 0 0 0 0 0 0 0 0 0 0 0 0 0 0 0 0 3 0 4 0 1 0 1 0 15 0 8 0 27 0 16 0 15 0 21 0 2 0 1
0 114
Sonar Accuracy Y
076 073 053 103 185 282 100 118 096 148 oso 103 113 127 026 100 250
112
_y Visual salmon counts are listed as upstream or downstream passage over the sonar substrate With bullnetbull being the differnce between the two No kinq salmon were seen during visual calibration periods
u Sonar accuracy is calculated by dividing the sonar counts for any given period by the net visual count of chum salmon for that period
-15-
~
121ble 3 VisUal calibration of salmon sonar counts at the Anvik River west bank site 1982
Visual Count l
Pink salJDon Sonar
Date
627 230D-2310 628 1445-1500 629 1510-1525 630 1505-1515 73 0950-1005 73 1517-1532 715 0905-D920 7l5 2139-2154 717 092D-0935 718 0833-o848 7lB 1552-1607 719 0823-D838 719 1528-1543 720 0945-1000 720 lSSQ-1605 724 142D-1435
10TALS 383 hours
Sanar Count
1 0 0 0 3 3
24 9
24 17 8
12 3 0
13 5
122middot
Up
0 0 0 1 0 0 0 0 9 0 6 0
27 1 7 0
27 2 27 1 8 2
l8 1 9 2 4 0
34 4 1 3
177 17
Net Up Net Accuracy 2
0 0 0 0 -1 0 0 0 0 0 0 omiddot 0 a 0 0 9 0 0 0 033 6 0 0 0 050
26 4 0 4 092 7 0 0 0 129
25 3 0 3 0 bull 96 26 22 0 22 065 6 9 0 9 133
17 12 0 12 071 7 6 0 6 043 4 3 0 3
30 8 0 8 043 -2 4 0 4
160 71 0 71 076
l Visual salmon counts are listed as upstremu or downstream psssage over the sonar substrate with bullnetbull being the difference between tbe two No kinq salmon were seen during visual calibration periods
2 Sonar accuracy is calculated by dividing the sonar counts for aey given period by by the net visual count of chum salmon for that period
-16-
Milling chum salmon caused false counts on the east bank from 24 to 26 July the last three days of the project Poor visibility made it difficult to visually docmnent the extent of this behavior with any_ accuracy Milling was not a problem on the west bank where water current was faster and fish aSSage remained nomal~ Escapement estimates for this period are based on west bank sonar counts as outlined in Appendix A The first sallncn were counted on 25 June Peak daily counts of 405Z7 and 36197 stmmer chum salmon occurred on 9 cutd 12 July respectively Run timing was similar to that of 1980 with mean date of passage on 11 July (Figure 6) Buklis (1982a) postulated a 20 day lag time for swnmer chum salmon migraticn between the fish~ at ~ and the Anvik River sonar site If correct this would mean that 50 of the Anvik River stock had passedmiddot through the Emnonak area by 21 June The large mesh gillnet season in Y-1 and Y-2 ended by emergency order on 2 July indicating that mce again the majority of the Anvik River stock had passed through the intensive lower Yukon River fishery before mandatory changeover to chlJJl salmon gear
here is ncgt clear diurnal migration pattern apparent in the hourly sonar --- -- - c6UriEs (Figure 7) Fpr the 4 years in which sonar enwneration has been
conducted on the Anvik River only the 1981 run demonstrated a diurnal pattern Passage was lowest at mid-day and greatest at midnight for that year ~e majority of the fish have been counted along the west bank each year The count distribution by sector for the west bank substrate in 1982 shCMs an uncharacteristic pattern (Figure 8) with a sudien increase in counts from sector 8 to sector 9 This PJSSible error in the count criteria of the sonar electronics was mentioned earlier Most of the sonar counts registered by the east bank counter were in sectors 8 through 16 Although the same counting error may have been operating onmiddot the east bank as on the west bank it is also true that mcst of the fish passage was occurring offshore at this site
A total of 185 pink salmon were visually co~mted crossing the east bank (Table 2) and west bank nlble 3) sonar substrate~ between 14 and 26 July During this same period 337 chum salmon were visually counted The total chum salmon escapement estimate for this period was 139907 (Table 1) The ratio of visual ch1m1 salmon counts to total escapenent is 00024 Expansion of the 185 pink salmon visual counts based on this ratio yields a total escapement estimate of 76800 pink salmcn There is no way to evaluate the accuracy of this expansion estimate but it is probably a good awroximation of the actual magnitude Fishermen in Anvik Village replrted that it was the largest pink salmon run they had seen in many years
No aerial survey of the Anvik River was flown to estimate king salmon escapement due to high turbid water conditions and overcast rainy weather during late July and early August No king salmon were visually counted over the sonar substrates during the period 27 June to 26 July There is no data upon which to estimate the Anvik River king salmon escapement in 1982 Based on the 10111 number of king salmon captured by beach seine and encountered during carcass surveys the escapement was probably less than 2000 king saJJnon
-17-
Figure 6 Daily smmer chum salnon esca~t past the Anvik River sonar site 1979-1982 The mean date of run passage is illdicated by dashed line
-c bull 0 liD a
-c bull u liD a
-c bull 0 liD a
-c bull 0 bull a
10
0
10
0
10
0
10
I I I
I
14 24 4 24
June July
-18-
I
Figure 7 Sumner chum saliron escaperent past the Anvik River sonar
= II 0 II a
-= II 0 II g
-
10
5
10
middot5
5 II a
10
~ 5 II a
site by brur 1979-1982 middot
0000 0500 1000 1500 2000
Time of Day
-19-
Figure 8 Sumner cbm sa1non escapement past the Anvik River sonar site by sonar sector 1979-1982 Note that there -were U sectors for each substrate in 1979-1981 and 16 sectors in 1982
-1 CD 0 CD D
-1 bull 0 bull D
-1 CD 0 bull D
-1 CDmiddot u bull ~
25
25
so
0 8 12 12 8
25
0
Shore West Bank Sectors East Bank Sectors
-20-
1
Shore
River water deptJl declined steadily from 18 June (Ocm to 21 JUly when it reached a low for the season of -84 em (Figure 9) Intemtittent to heavy rainfall during the period 20 to 31 July resulted in rapidly rising water levels River water depth increased fran -84 a11 on 21 July to +112 en an 31 July a vertical gain of 196 an (6-5) in 10 days Horizontal gain depended of course on slope of the shoreline but in many places the river was flooded to the willa~s along gravel beaches and near the top of cutbanks Water was extremely turbid Water temperature dropped during the flood period and air temperatures were lClll due to the cloud cover (Figure 9) Water temperature was 14degC on 18 June 9degC on 31 -middotJuly and back up to l3degC on 8 August Air temperature was l5degC an 18 June l0degC on 31 July and l8degC on 8 AUgust
Beach seining was conducted at the sonar site but was not very effective in capturing salmon for age sex and size sampling Thirty-five sets were made between 21 June and 21 July and ally 63 chum salmal 1 king salmcn and 6 pink salmon were captured An additional 325 chum salmon and 137 king salmon were sampled by carcass survey between mid-July and mid-August Chum salmon sampled by beach seine were 61 fenale and evenly divided between age 4 (51) and age 5 (46) while-carcass samples- were-71- fenale and 70 age 4 (A)pendix able l) bull Average length of beach seine samples tended to be slightly larger than carcass samples for a given age and sex group but were well within the range of l standard deviation and the differences are therefore not statistically significant (Appendix Table 1) The small sample size obtained by beach seine makes it difficult to make a rigorous comparison of the two methods and all samples are pooled to compare with the age and sex canposition of carcass samples collected in previous years Greater effort should be made to collect an adequate sample by beach seine in 1983 This may require extensive seining at several locations near the sonar site to locate an effective beach seine site
The pooled SUllins chtB---salmal-sample-was- 69 female with an age breakdcMn of 6 age 3 67 age 4 27 age 5 and 1 age 6 This is similar to the age and sex canpositim of the 1979 escapement but contrasts markedly with 1981 when age 5 was predaninant (Figure 10) Age class 4 or 5 predauinates in any given year but there is no apparent pattern or cycle in the age of the return Strength of the 1971 and 1976 brood years can be traced through all age classes
King salmal carcass sanples were only 28 female with an age breakdown of 35 age 4 38 age 5 and 28 age 6 (Aglendix Table 2) bull Average length ranged from a lowmiddot of 560mn for ag~ 4 males to 840nm for age 6 females No agemiddot 7 king salmon were found in the sample _ The age and sex composition of the 1982 escapement differed greatly from that of the previous year (Figure 11) The 1981 escapement sample was 59 female including fewer of the age 4 and age 5 males that dominated the 1982 escatenent Producticn is expected to be low fran the 1982 escapement due to the small nunber of fanales
cne sockeye salmon and one coho salmon were found while surveying the river by boat for king and chun salmon carcasses be sockeye salmon was moribund when captured on 7 August near the cOnfluence with the Yellow River and was an age 13 male 590mm in length This is the first sockeye salmon documented in the Anvik River he coho salmon carcass was found at mile 25 of the Yellow River on 14 August and was a male with a length of 495mn The scale sample fran this fish was not readable
-21-
Figure 9 Water temperature air tarperature (rraxmin average) and water depth ~ed at noon daily at the Anvik River sonar site 1982
- 20 0 -bull = -bull 10 bull Q
e bull 1- bull - 0 bull 3
- 20 0 -bull ~ -bull
10 bull Q E bull 1- -ltI( 0
amp 200 Q c -Q
~ 0~~~~------------------~~~~--------------- bull -bull 3
-200-t-----r-----r----~r----------
14 24 4 June
14
July
-22-
24 13
Auauat
23
Figure 10 Age and sex composition of Anvfk River summer chum salmon 1972-1982
-c CD 0 -CD Q
-c CD 0 CD Q
-c CD 0 CD Q
-c CD 0 CD Q
2
1973 1975 1977 1979
JRE FBRf Age 3
middot----middot --~ ----middotmiddot-middot -- ~
Age 4
Age 5
Age 8
1981 1983
I Includes 57 (15) beach seine samples in 1982 All other samples were carcasses
-23-
l
-c CD u CD ~
Figure 11 Age and sex composition of Anvik River king salmon carcass samples 1972-198211
50 -fRE FEMILE
Age 4
0
100
Age I(
100 -c CD () CD a Age 6
0
10 -c CD u CD a Age 7
0
1973 1975 1977 1979 1981 1983 -
No samples were collected in 1974
-24-
1HlRFAFSKY RIVER AIIJLT SAIMN SlODY
be Andreafsky River (Figure 12) includes two main branches the Fast and West Forks and is located 100 miles upstream from the mouth of the Yukon River It is secmd to the Anvik River in sumner chum salmon production second to the Salcha River in king salmon production and supports the largest pink salmon run in the Yukon River drainage Salmon escapements were estimated annually by aerial survey from fixed-wing aircraft prior to 1981 when a side-scan sonar counter was installed in the East Fork for the first time Water clarity is generally good but high water rain wind and cloud cover have resulted in poor surveys in sane years Aerial surveys are still flown to estimate escapement to the West Fork of the river and to evaluate the accuracy of the sonar counter on the East Fork
Below the catfluence of the East and West Forks the Andreafsky River is wide and slOW moving not suitable for side-scan sonar operation The East Fork was chosen for the initial feasibility study in 1981 (Buklis 1982b) and the study was continued in 1982
Methods and Matgrial s A sonar site was located at mile 20 of the East Fork Andreafsky River in 1981 One sonar counter and substrate was available for the initial feasibility study and it was placed in the middle of a 100 foot wide channel between the west bank and an island (Figure 13) Weirs prevented fish passage around either end of the substrate which was situated on a gravel shelf awroxmately 3 feet deep on 23 June 1981 ihe channel on the opposite side of the island was not navigable by salmon due to low water and numerous sandbars
A second sonar counter and substrate was brought to the Andreafsky River in 1982 When the crew arrived at the sonar site on 11 June the wate~le~was significantly higher than it had been the previous year Water was flaiing on both sides of the island and was 6 feet deep across the gravel shelf Since two sonar counters were available it was decided not to try to install one substrate in the middle of the channel as in 1981 but instead to put one substrate on the west bank and one on the east bank of the river (Figure 13) The west bank substrate was situated on a gradually sloping gradient in front of the campsite about 800 feet downriver from the 1981 sonar site The transducer housing was 1 foot undetwater and 15 feet from shore with a weir preventing inshore fish passage The offshore end was 7 feet deep ite east bank substrate was situated on a steeper gradient 150 feet dCMnriver from the westmiddot bank substrate The transducer housing was 1 foot underwater and 5 feet fran shore with a weir preventing inshore fish passage The offshore end was middot 7 feet deep The river is 200 feet wide at this site and characterized by a slew water eaJy area along each bank Water flow was only about 2 feetsec even in the center of the channel The west bank substrate was situated at the upper end of a slow water area and the east bank substrate at the lower end thus the substrates were installed as close together as pgtssible while still avoiding the eddies
Sonar counters were the 1978 model~ which divide the counting range into l2 sectors and do not have a large fish counting feature Oscilloscope and visual calibratioos were conducted as described for the Anvik River King and chum salmon were sampled by beach seine and carcass survey for age sex and
-25-
D z MILlS
Figure U
4
Map of the Andreafsky River
-26-
Figure 13
+ Mldatr~middot~ Sit
++ Water Flow
~ bull =~ ~
Weal Bank
middot
I
Sonar
Subbulltrate
Map of the East Fork Andreafsky River sonar site
Eabull1 Bank
size composition (lata as middotdescribed for the Anvik River study Salmon carcasses were also sampled fran the West Fork Andreafsky River
Resu1ts and Discussion The sonar counters were operational on 18 June and the first salma were Q)unted on 25 June The electronics were adjusted such that pink salmon generally were not counted but a small percentage probably did register Q)unts due to milling behavior near the substrate A total of 181352 salmon were counted between 25 June and 20 July (Table 4) bull As will be discussed later it is not possible to accurately estimate the number of king or pink salmon that contributed to the total although both species carilined probably accounted for less than 5 of the sonar counts lberefore all sonar counts are attributed to summer chum salmon for the purpose of comparing to historical escapement trends Escapement estimates prior to 1981 are based on aerial surveys and may not be directly cauparable
he 1982 East Fork Andreafsky River escapement of 181352 summer chum salmon was 16 times greater than the previous 10 year average (1972-1981) of 110963 and seccnd only to the 1975 escapement of 223485 sumner chum salmon (Figure 14) Distribution of daily escapement counts in 1981 (Figure 15) indicated that an early segment of the run may have been missed so that the total escapement count of 147312 summer chlml salmal was a minimlln estimate The actual escapement for 1981 and 1982 was more similar than the sonar estimates indicate because of the two factors mentioned (1 The 1982 estimate was inflated by as much as 5 cile to king and pink salmon counts and (2) the 1981 estimate is lc7N due to not counting an early segnent of the run
Sonar counts ranained low fran 25 June through 1 July averaging 1 017 per day for the 7 day period On 2 July 32572 saJJnm counts were regiStered by the two sonar counters Virtually all of theSe counts occurred in the offshore half of the west bank substrate and between the hours of 1300 to 1700 (Figure 16) Unfortunately the crew was in St Marys PJrchasing supplies during this time and thus no direct ccmfinnaticn of these sonar countsis available lbe crew did observe that there were many more dun salmon above the canqsite upon their return than there had been previously The weather was cloudy and windy and may have triggered the upstream migration of chum salmon milling in the lower Andreafsky River Fish were seen fiming and breaching the water surface as the crew made their way downriver to St Marys in the morning There was no other boat traffic on the river to cause false counts and no debris was near the substrate when the crew returned Transducer aiming and equipment settings were Checked and found to be correct This sudden appearance of such a large number of salmon (18 of season total) seems unprecedented but there is no justification for rejecting the sonar cotmt data
The distriootim of sonar counts on 2 July indicated that a substantial number of chum salmon may have been migrating in midstream between the two sonar substrates Begiming on 3 July slow water current at the east bank site resulted in milling fish behavior and the growth of vegetation on the substrate For these reasons it was decided to move the east bank substrate to the midstream site used in 1981 By this time water depth had dropped about 2 feet making sonar substrate installation more feasible
-28-
Table 4 East Fork Andreafsky River chum and king saJmm sonar counts by date 1982
Total Count Season Total East West Midstream
Date Bank Bank Site teily CUmulative Daily Ctlmulati ve -625 168 382 550 550 03 03 626 317 545 862 1412 05 08 627 174 434 608 2020 03 11 628 334 1905 2239 4259 12 23 629 218 430 648 4907 04 27 630 668 523 1191 6098 07 34 71 338 685 1023 7121 06 39 72 1656 30916 32572 39693 180 219 73 (214)1 1770 1984 41677 11 230 74 (684) 5646 6330 48007 35middot 265 75 (131) 1085 1216 49223 07 271 76 (224) 1853 2077 51300 11 283 77 (528) 4362 4890 56190 27 310 7B 22993 22993 79183 127 437 79 15637 15637 94820 86 -523 710 15575 15575 110395 86 609 711 16268 16268 126663 90 698 712 15017 15017 141680 83 781 713 13172 13172 154852 73 854 714 8118 8118 162970 45 899 715 6952 6952 169922 38 937 716 7999 7999 177921 44 981 717 - 1528 2 1528 179449 08 990 718 1027 1027 180476 06 995 719 646 646 181122 04 999 720 230 230 181352 01 1000
1 Slow water velocity mil1inJ grayling and salJoon and vegetation along the substrate resulted in false counts at the east bank site beginning on 73 Daily east bank counts in parentheses are estimated based on the west bank count for that day The east bank averaged 108 of the daily escapement for the period 625 through 72
2 Milling salmon resulted in false counts at the midstream site beginning on 716 Daily escapement estimates for the period 717 through 720 are based on expansion of visual counts as presented in Appendix Table 3
-29-
Figure 14 East Fork Andreafsky River ~ clnJm sa1mm escapement- 1972-1982
3 - bull -0
0 0 0 0 bull IC
2 --c -bull e bull A bull 0 bull ua c 0
E -bull bull -E 1 II a 0 -~ bull e I II bull -
--
0 I I I I I I I I I I I I I I 1872 1874 1871 1878 1880 1882
-30-
Figure 15 Daily surmer chum sa1nDn escapement past the East Fork Andreafsky River sonar site 1981--1982 The mean date of rtm passage is indicatei by dashed line
-c bull 0 bull a
c
10
s
20
~ 10 bull Q
14
1981
24 4 14 24
June July
-31-
bull a
IJO
west Bank
0000
Figure 16 East Fork Andreafsky River sonar count distribution by sonar sector (above) and by hour (below) an 2 July 1982 A total of 32572 sonar counts were registered on this date 18 of the total for the season
10
Sonar Sector
0500 1000 1500
HOUR
-32-
10 8
2000
East Bank
lhe channel on the other side of the island was blocked to salmon passage by exposed sand bars CBily escapement estimates for the period 3 July through 7 July are derived by expanding the west bank sonar counts (Table 4) Salmon escapement was counted from the midstream site beginning on 8 July until project tezmination on 20 July Weirs prevented fish passage arotmd either end of the substrate Iaily escapement counts were consistently higher at the midstream site than they had been at the two previous sites supporting the hypothesis that some chtDD salmon had been passing uneotmted between the two smsttates -
Water turbidity and weather conditions had prevented visual calibration of sonar counts at the east and west bank sites but ccnditions were occasionally more sui table at the midstream site Between 8 and l6 July a total of 467 hours of visual counting was calducted and sonar accuracy averaged 86 (Table 5) Accuracy for any given period was extremely variable as had been found at the Anvik River Milling sallnon resulted in false counts beginning on 16 July Visual counting was increased and daily escapement estimates for the period 17 through 20 July are based on expanded visual counts not sonar counts A total of 186 hours of visual counting was conducted between 11 and 20 July and a net up~tream total of 10840 pink salmon 475 chtDD salmon and 43 king salmoo were counted (Table 6) Hourly p=1ssage rates were taken to be representative of time blocks within the day and expanded by the number of hours in the time block (Appendix Table 3) Resulting escapement estimates were 1528 sumner chum salmon on 17 July 1027 on 18 July 646 on 19 July and 230 an 20 July
Mean date of rtm passage was 9 July in 1982 and 5 July in 1981 (Figure 15) Peak daily cotmts in 1982 of 32572(18) and 22993 (13) occurred on 2 and 8 July respectively Distribution of sonar counts at the midstream site by hour in 1982 does not demonstrate the diurnal pattern that was apparent in 1981 (Figure 17) Countsmiddot were lCMest at mid~y and highest at midnight in 1981 he distribution of sonar counts by sector was also different between the two years ihe substrate was pgtaitioned in 1981 such that sector 1 was on the west and sector 12 was on the east Positioning was reversed in 1982 with sector l on the east end and sector 12 oo the west Sonar counts were high in the inner and outer sectors in 1981 dropping to a low in the middle sectors (Figure 18) In 1982 sonar counts were lew in the inner and middle sectors building to high counts in the outer sectors (Figure 18) The reason for the difference in count distributioo is not known A change in eydrology of the site or the large number of pink salmon in the 1982 run are two poundX)SSible causes for the shift in the migratioo ~ttern of smller chum salmon
Visual counts were obtained for only a portion of the salmon escapement period and therefore cannot be expanded to accurately determine species canposition (Figure 19) Pink salmon accotmted for 90 of all visual counts chum salmon 95 and king salmon 05 Excluding pink salmcn chum salmon made up 954 and king salmon 46 of the remaining visual counts This is similar to the 1981 percentages (excluding pink salmal) 965 chum salmon and 35 king salmon Hourly passage rates based on visual counts indicate that the chum salmon escapement was similar in magnitude for the two years that king salmon escapenent was lcwer in 1982 and that pink salmon escapement was much greater in 1982 (Figure 19) The pink salmoo escapement may have approached 1 million fish in the Fast Fork Andreafsky River
-33-
labli 5 Visual calibcation of silmcn sonar counts at tbe Fast Fork Andreafsky River midstream site 8-16 July 1982
78 78 78 78 78
1005-1015 l61D-1625 2050-2100 2112-2122 2125-2135
78 092 bours
79 19SD-2000
79 017 bours
710 1540-1545 710 16DD-1610 710 202D-2030
710 042 hours
7ll lll5-ll25 7ll 1127-1137
7ll a33 bouts
712 103D-l040 712 2310-2320
712 033 hours
713 225D-2300
713 017 bcuta
714 100D-10lS 714 1040-1055 714 l85D-l855 714 190D-1910 714 2245-2300
714 100 hours
715 13~1405 715 15~15l5 715 1517-1532 715 1535-1550
715 100 hours
716 1035-1045 716 2240-2250
716 033 hours
Totals 467 hours
Sonar Count
93 71 52 85
l38
Up
30 156 l2B
94 l38
439 546
15 19
15 19
14 88 55 84 ll 12
80 184
1 1 4 8
5 9
3 5 26 35
29 40
10 17
10 17
17 7 6 6
lS 4 78 middot13 30 23
146 53
1 28 16 ll 5 12
l3 ll
35 62
14 8 63 - 20
77 28
836 958
a 0 0 0 0
8
0
0
0 0 0
0
0 0
0
0 0
0
0
0
0 2 0 1 0
3
0 0 0 0
0
0 2
2
l3
22 lS6 l2S
94 138
538
19
19
88 84 12
184
1 8
5 35
40
17
17
7 4 4
12 23
so
28 11 12 11
62
8 lB
26
945
Up
3 9 0 0 0
12
2
2
8 1 0
0 0
0
1 0
1
0
0
1 0 0 0 0
1
0 0 0 0
0
0 0
0
0 0 0 0 0
0
0
a
0 0 0
0
0 0
0
0 0
0
0
0
0 0 0 0 0
0
0 0 0 0
0
0 0
0
0
l 9 0 0 0
50 0 so l55 0 155 190 0 190 186 0 186
not counted
l2 581
2 154
2 154
8 l57 1 125 0 53
9 335
0 86 0 105
0 191
1 lll 0 bull us
1 239
0 53
0 53
1 21 0 16 0 30 0 119 0 118
1 304
0 134 0 136 0 212 0 136
a 618
0 114 0 138
0 252
25 2727
0
0
0
0 0 0
0
0 0
0
0 0
0
0
0
0 0 0 0 0
0
0 0 0 0
0
0 0
0
581
154
154
157 125
53
335
86 105
l9l
lll l28
239
53
53
2l 16 30
119 ll8
304
134 136 212 136
618
114 138
252
0 2727
372 043 041 090 100
080
071
071
015 065 092
041
100 050
056
050 174
71
059
059
212 150 375 650 130
286
004 145 042 118
056
175 350
296
086
~ Visual salua1 counts are listed as upstream or downstream passage over the sonar substrate with netbull being the difference between the twa middot
Y Sonar accuracy is calculated by dividing the sonar counts for arry given period by the sum of the chum and king salmon net visual ~ for that period
-34-
Table 6 Visual salmon counts at the East Fork Andreafsky River midstream site 17-20 July 1982
Qun 5almon King Salmn Pink Salmon
Date Time Op Ccwn Net Up Ocwn Net Op Down Net
717 ll3D-114S 4 2 2 0 0 0 18 0 18 717 1450-1620 57 14 43 5 0 5 746 1 745 717 1855-1935 87 5 82 1 0 1 811 4 807 717 2005-2020 15 1 14 0 0 0 343 1 342 718 0835-0900 2 0 2 1 0 1 219 0 219 718 0900-1000 10 2 8 4 0 4 499 1 498
- 718 1215-1315 27 0 27 3 0 3 502 2 500 718 1510-1610 56 4 52 2 0 2 592 0 592 718 181D-1910 55 2 53 1 0 1 445 0 445 718 2215-2315 73 1 72 6 0 6 1140 2 1138 719 0555-0655 20 0 20 3 0 3 1181 1 1180 719 0910-1010 7 2 5 0 0 0 682 0 682 719 l21D-1310 12 2 10 1 0 1 374 3 371 719 1550-1650 18 2middot 16 3 0 3 344 3 341 719 180Q-1900 27 0 27 4 0 4 513 2 511 719 211D-2210 11 0 11 0 0 0 383 0 383 720 070D-0730 2 0 2 0 0 0 255 4 251 720 0910-1010 2 0 2 0 0 0 421 6 415 720 1300-1400 a 0 8 7 0 7 345 0 345 720 1530-1630 10 5 5 2 0 2 519 4 515 720 1800-1900 15 1 14 0 0 0 545 3 542
Totals 186 hours 518 43 475 43 0 43 10877 37 10840
-35-
c CD u CD D
-
Figure 17 Slmner clnJm salirDn escapement past the East Fork Andreafsky River soriar site bY OOur 1981-1982
10 1881
5
10
1982
5 CD
G
0000 0600 1000 1500 2000
Time of Day
-36-
-c
bull u bull a
-c
Figure 18 SUmner chum salmm escaparent past the East Fork Andreafsky River sonar site by sonar sector 1981-1982 Note that sectOr 1 was on the west end in 1981 and on the east end in 1982
110
30 1981
20
10
West 1 8 12
110
30
middote 20 bull a
10
West 1 2 6 1
Sonar Sectors
-37-
East
East
Figure 19 Hourly passage rate of chum king and pink sa1nDn at the East Fork Andreafsky River sonar site based on visual counts 1981-1982
II 0 ~ bull ~
~
bull -~
II 0 bull Q
-= bull
II 0 bull Q
c bull --
1000
0
25
0
1000
20
June
---- 1981
i702 1882
I Chum middotsalmon
bullbull I I J ~ I I r--1 I _
~ King Salmon
bull I I -
Salman
30 10 20
July
-38-
30
An aerial survey was flam of both the Fast and West Fork of the Andreafsky River on 20 July Under fair cmditians 699 king salmon were counted on the west Fork and 1274 on the Fast Fork Cloud cover and wind reduced accuracy on the East Fork portion of the survey which was the latter fork surveyed 1he large mEber of pink Salmon pro~ ted enumeration of sumner dnnn salmon and probably affected accuracy of the king salmm estimate as well Survey counts should be considered minimum estimates A second survey of the West Fork only on 6 August resulted in a count of 836 live king salmcn and 15 carcasses cncemiddot again survey anditions were only rated fair
Similar to the Anvik River water level at the East Fork Andreafsky River sonar site declined steadily frau the initial 0 an reading on 15 June to -106 em on 13 July (Figure 20) Water level was relatively stable for a 10 day period then rose fran -75 an on 22 July to +15 em on 31 July This was a vertical gain of 90 an (3 feet) in 9 days water temperature ranged between 8degC and 16deg c while average daily air temperature ranged between 8degC and 18degC during the period 15 June to 15 August (Figure 20)
Beach seining was sanewhat more effective on the East Fork Andreafsky River than it was on the Anvik ltiver but catches were lower than anticipated lhirty-two sets were made between 20 June and 17 July and 131 chum salmon 33 king salmon and 81 pink salmm were captured An addi tiooal 330 chum salmon and 296 king salmon were sampled by carcass survey The age sex and size composition of sUDDDer chum salmon sampled by beach seine and carcass survey were very smuar (AIpmdix Table 4) ~ Age 4 fEmales daninated both samples accountinq for 43 of the beach seine catch and 52 of the carcasses Although a larger beach seine sample would be desirable it appears that there is no significant difference between the beach seine and carcass sample cauposition and the data is pooled to canpare with the 1981 escapement The pooled sample is 65 female and has an age breakdown of 2 age 3 73 age 4 23 age 5 and 2 age 6 By canparison 1981 escapement was equally divided between age classes 4 and 5 and was 52 female (Figure 2l) bull Strength of the age 4 return was aggtarent for both the Anvik and Fast Fork Andreafsky Rivers in 1982
Too few king salmon were captured by beach seine to allow for a meaningful canparison with the age sex and size canposition of carcasses Pooling the 29 samples fran the beach seine catch 208 carcasses fran the East Fork and 88 carcasses fran the West Fork results in a total sample of 325 king salmon fran the Andreafsky Ri v~r The pxgtled sample was only 15 female and had an age breakdam of 2 age 3 35 age 4 49 age 5 12 age 6 and 2 age middot 7 (Appendix Table 5) The weak return of females was similar to the sex canpositicn of the Anvik River stock Length ranged fran a low of 38011U11 for age 3 males to 937mm for age 7 females The primary differences between king salmon escapement in 1981 and 1982 is the weak showing of age 6 fish in 1982 the presence of age 3 males which were not found in 1981 and the overall FOQr return of females (Figure 22) bull
-39-
-u -CD = -
Figure 20 Water tatp=rature air taqJerature (maxmin average) and water depth measQred at ooon daily at the East Fork Andreafsky River sonar site 1982
20
middot- 10 bull Q
e bull bull 0 -bull
- 20 u bull = -bull 10 bull Q
e 0 -lt 0
- 200 E u -J -Q
middot ~ o----==-----rr----bull -bull bull
-200-t-----------r--P--r-----r- 14 24 4 14
June
24
July
-40-
3 13
Auouat
23
Figure 21 Age and sex composition of East Fork Andreafsky River summer chum salmons 1981-1982 l
75
so 1981 1982 c bull CJ -
I bull ~ 0 I
25
3 4 6 8 3 4 6 8
Age Age
l Includes 126 (28) beach seine samples in 1982 All other samples were carcasses
Figure 22 Age and sex composition of Andreafsky River kfng salmon 1981-1982
I ~ N C I CD
0 CD a
80
110
4 5
1981
6 7
Age 3 4 6
Age 8
I
1982
7
l Data is pooled for both East and West Forks for each year Includes 29 (9) beach seine samples in 1982 All other samples were carcasses
1) Minnow traps and beach seines were not feasible for capturing large nllDbers of juvenile salmon on the Anvik River High water after river ice breakup flooded beaches and restricted attempts to beach seine Future juvenile salmal studies should test the feasibill ty of fyke nets and inclined plane traps both of which are statimary floating gear which could be operated in high water bull
2) Chum salmon fry are still present in the Anvik River two matths after
breakup of river ice Large catches of king salmon fry oca1rred in late July and suggests that they may overwinter in the Anvik River before moving into the Yukon River the follciiing spring Only 3 king salmon smolt were captured but sampling was ineffective during spring breakup and flooding when most of the snolt may have been oubnigrating
3) Escapement to the Anvik River was estimated by side-scan sonar to be 444581 sunmer ch1111 salmon Age 4 was predaninant accounting for 67 of all samples and female$ outnmnbered males 2 to 1 King salmon escapement was not estimated due to poor aerial surveyen conditions carcass samples indicate that the king salJnal escapement was only 28 female with age classes 4 and 5 accounting for the majority of the fish Low returns from the 1982 brood year may result due to the low pLJDber of female spawners he pink salmon run was one of the largest in recent years according to local fishermen and escapement was estimated to be 76800 tased on expansion of visual counts
4) The- accuracy of the 1981 model sonar counter should be investigated ibis may be better accanplished at the East Fork Andreafsky River where all salmon passage can be directed over the sonar substrate and water conditions are usually better for visual observation of fish passage than at the Anvik River
5) More samples of adult chum and king salmon should be collected tyen beach seine at both the Anvik and East Fork Andreafsky Rivers to test the difference between the age sex and size canposition of beach seine and carcass samples
6) Escapement to the East Fork Andreafsky River in 1982 was estiJnated by side-scan sonar to be 181352 sumner chum salmon King and pink salmon were probably responsible for less than 5 of the sonar counts The chtn salmon escapement was 65 female and 73 age 4 An accurate estimate of the king salmon escapement was not obtained but was lcwer than the 1981 esca-penent of 5 343 King salmon beach seine and carcass samples were only 15 female and age 5 accounted for 49 of the total Pink salmon escapenent was at a record level and approached 1 million fish based on visually observed passage rates
7) Accuracy of salmon escapement data fran the East Fork Andreafsky River can be improved by implementing the following procedures
-43-
a) One sonar substrate should be installed at the midstream site at the start of the season regardless of water conditions Weir fencing should be installed as soon as pgtssible to prevent sa1mon passsage around the ends of the substrate
b) Visual counting periods should be scheduled throughout the day and the crew held responsible for attempting visual counts during those periods This will insure that the equipnent is not left unattended for more than a few hours at any one time which was a problem in 1982 when a large nlJDber of salmm agarently passed over the smar counters while the crew was JUrchasing supplies in the villaqe
c) Species cODp)siticn is an impJrtant factor affecting the accuracy of the sonar data especially in even numbered years when pink salmon can outnumber summer chums bf five to one Increased visual counting may help to improve allocation of sonar counts Fishing a trammel net may be a feasible method of estimating species canposition and also provide an unbiased estimate of age sex and size composition for ch111 and king salmm A trap with funnel opening and weir lead-in made from fence stakes and rectangular fencing may accomplish these same objectives All three methods of estimating species canpostion should be cmducted in 1983
8) The feasibility of installing a full weir across the East Fork Andreafsky River should be investigated in 1983 by locating potential weir sites and monitoring water depth and velocity throughout the season A weir could provide daily salmon escapement data by species age sex and size as opposed to the limited information obtained by side-scan sonar in 1981 and 1982
-44-
-middot
LITERATORE CITED
Barton Louis H 1982a EhlJileraticn of fall chum salmm by side-scanning sonar in the Sheenjek River in 1981 Yukon Salmon Escapenent Report No 13 Alaska Deptmiddotof Fish and Game Commercial Fisheries Division Fairbanks 22 pp
---middot 1982b Side scan sonar (1981-16 sector model) Unpublished memorand1111 dated 8 December Alaska Dept of Fish and Game Conunercial Fisheries Divisim Fairbanks 6 pp
Buklis Lawrence s 1981 Yukon River Salmon Studies Anadromous Fish Conservation Act CcIIpletion report for period July 1 1977 to June 30 1981 Alaska Dept of Fish and Game Juneau 50 pp
---middotbull 1982a Anvik River sumner chum salmon stock biology Infotmational Leaflet No 204 Alaska Dept of Fish and Game Juneau 50 pp
---middot l982b Anvik Andreafsky and Tanana River salmon escapement studies 1981 Yukon Salmon Escapement Report No 15 Alaska Dept of Fish and Game Qmnercial Fisheries Divisicn Anchorage 40 pp
Flagg Loren B 1981 Sockeye salmcn smolt dye_ narking and recovery tests in the Kasilof River Alaska Dept of Fish and Game FRED Division Soldotna 8 pp
Geiger Michael F 1982 Yukon salmon season sunmary repJrt Unpublished memorancbn dated 11 OCtober Alaska Dept of Fish and Game Comnercial Fisheries Divisim Anchorage 19 pp
McBride Doug and David Mesiar 1982 Nushagak sonar enumeration project 1981 Bristol Bay Data Report No 88 Alaska Dept of Fish and Game Catmercial Fisheries Divisicn Anchorage 24 pp
Menin Albert 1982 Letter to Bill Aivey Alaska Dept of Fish and Game
~cial Fisheries Division Anchorage dated 25 February Bendix Oceanics Divisicn Sylmar california 4 pp
Ricker WE 1975 Caupltaticn and interpretaticn of biological statistics of fish populations Department of Environment Fisheries and Marine Bulletin No 191 ottawa canada bull 382 pp
Seiler David Steve Neuhauser and Mike Ackley 1981 Ucentreamdownstream salmonid trapping project 1977-1980 Progress Report No 144 Jept of Fisheries washington 191 pp
Todd IS 1966 A technique for the enwneration of chum salmon fry in the Fraser River British Columbia can Fish Cult 38 3-35
-45-
Appendix A Method of adjusting daily sonar counts for periods of defecti equipoent or milling salmon at the Anvik River middotsonar site 1982
4July East bank sonar counter operational fran 0000 to 1000 west bank sonar counter operational fran 1200 to 2400 Sonar counts expanded to full 24 hour equivalent based on the average passage for that bank and time period during the- preceeding 9 day period
Fast Bank 74 625-73
ifest Bmk
5 July
74_ 625-73
Q000-1000 4230 Actual Count OOOQ-1000 335 Average of Daily East Bank total
126Z7 Estimated East Bank Total for 4 July
120Q-2400 5187 Actual Count 1200-2400 585 Average of Daily west Bank total
8866 Estimated West Bank Total for 4 July
West bank sonar counter operational all day with a total sonar count of 13ll3 Fast bank sonar counter inoperable all day The west bank averaged 584 of the daily total escapement for the period 25 Jur through 3 July Expanding the west bank count to the daily tot escapement and then subtracting the west bank and midstreampu contribution results in an estimated east bank count of 7300 salmon
6 July East bank sonar counter operational from 1700 to 2400 with a total sonar count of 2145 Ibis time period averaged 292 of the daily east bank escapement for the period 25 JlUle through 3 July Expanding the 7 hour count to the full 24 hour equivalent results in an estimated east bank count of 7 346
The west bank sonar counter was inoperable all day The east bank averaged 33 of the total daily escapement for the period 25 June through 3 July Expanding the east bank~ courit (7 346) to the daily total escapement and then subtracting the east bank and midstream contribution results in an estimated west bank count of 12891
-46-
7 July - 12 July East bank sonar counter operational continuously fran 7 July through 12 July while the west bank counter was inoperable The_ east bank averaged 33 of the total daily escapement for the period 25 June throuqh 3 July Expmding the daily east bank count to the daily total escapement and then subtracting the east bank and midstream contribution results in an estimated west bank count for each day as follCMS
13 July
7 July 8 July 9 July 10 July ll July 12 July
8300 15804 23469 14988 11575 20961
East bank sonar counter operational all day West bank sonar counter operational fran 0000 to 1200 This time period averaged 415 of the daily west bank count for the period 25 June through 3 July Expanding the lZ hour count to the full 24 hour equivalent results in an estimated west bank count of 9846 salmon
14 July East bank sonar counter operational all day West bank sonar counter operational fran 1200 to 2400 lhis time period averaged 585 of the daily west bank count for the period 25 June through 3 July Expanding the 12 hour count to the full 24 hour equivalent results in an estmated west bank count of 14 middot280 saJJoon
24 July - 26 July East bank sonar counts were inflated due to milling salmn but west bank counts cmtinued to be accurate due to faster water velocity and normal salmon swimming speeds Poor weather conditions prohibited visual calibration of sonar counts Daily escapement estimates were obtained by expanding west bank sonar cotmts The west bank averaged 534 of total daily escapanent for the period 25 June - 3 July and 15 July - 23 July Expanding the west bank count to the daily total escapement and then subtracting the west bank and midstream contribution results in an estimated east bank count of 2074 salnxm on 24 July 813 on 25 July and 802 on 26middot July
-47- middot
Appendix Table 1 Age sex and size canposition of Anvik River sunmer chum salmon beach seine and carcass samples 1982
Agel Age 4 middot Pge 5 Age6 cntgtined Ages ------ ------1--- ---l------ 1 -- ----------
Length Length Length LeBJth Length N (JIIIl) SD N (JIIIl) SD N (nm) SD N (11111) SD N (IIIII) SD ----------------- --------- -- -----
Beach Seine ------Male 0 ll 23 598 21 16 609 33 0 22 39 602 Z1 Female 2 4 528 11 16 28 540 28 30 568 2S 0 35 61 553 29 - ----- ----------Total 2 4 528 11 29 51 566 38 26 46 582 34 0 57 100 572 37
Carcass Survey -----------Male 4 1 521 19 62 19 580 22 28 9 618 36 1 645 95 29 590 35 Female 15 5 520 23 165 ~1 541 28 48 15 560 26 2 1 5~ 0 230 71 544 ~9 ------------ --------- -------- ---Total 19 6 520 22 227 70 552 31 76 23 581 41 3 1 582 55 325 100 557 37
Combined Gear ----Male 4 1 521 19 75 20 583 22 37 10 615 35 1 645 117 31 592 3t Female 17 4 521 22 181 t7 541 28 65 17 562 26 2 550 0 265 69 545 29 ---------------- -------- ------- ------- --Total 21 6 521 21 256 67 554 32 102 Z1 582 39 3 1 582 55 382 100 559 37 ------------- -------- --------- -- ----------
AilJendix Table 2 Age sex and size canpgtsition of Mvik River king salmon carcass samples 1982 1
Age4 AgeS Age 6 canbined Ages _2 ____ __ _z__ __ ~ ____ _z ___ ----- I Length middotLength Length Length
+gt N (nm) so N (mn) so N (mn) SD N (om) so 10 I ------------ ------------- --------
Male 47 34 560 59 47 34 679 6 4 814 130 100 72 631 97
Female 1 1 660 5 4 792 32 23 840 48 38 28 829 61 -----Total 48 35 562 60 52 38 690 38 28 836 66 138 100 686 125 -----------middot --------- ---- ---- Includes one 1ivesample collected by beach seine bull
-
Appendix Table 3 Expansion of chum and king ~ visual counts at the Fast Fork Andreafsky ~iver midstream site to estimate daily escapement 7-20 July 1982 Jl
~2 ~l
Hourly Passage Rat~ liL 1gt
Time Of Estimated Date Period Chum King Total Hours Fscapement
__
717 oooo-o1oo 108 0 108 7 756 717 0700-1300 8 0 8 6 48 717 1300-1700 29 3 32 4 128 717 1700-2000 123 1 124 --~ 372 717 2000~2400 56 0 56
i -4 224
717 0000-2400 64-8 08 656 24 1528 -------middot-
718 0000-0400 S6 0 56 4 224 718 0400-1100 1 -4 11 7 n 7lB 1100-1400 27 3 30 3 90 7lB 1400-1700 52 2 54 3 162 7lB 1700-2000 53 1 54 3 162 7lB 2000-2400 72 6 78 4
~-312
-
718 0000-2400 445 27 472 24middot 1027
719 oooo-o40o 72 6 78 4 312 719 0400-oBOO 20 3 23 4 92 719 0800-1100 5 0 5 3 15 719 110Q-1400 10 1 11 3 33 719 1400-1700 16 3 19 3 57 719 170Q-2000 27 4 31 3 93 719 200Q-2400 ~middot 11 0 11 4 44 - - _
~~
719 0000-2400 230 24 254 24 ~
646
720 oooo-o4oo 11 0 11 4 44 - 720 0400-D800 4 0 4 4 - - 16 720 0800-1100 2 0 2 3 6
720 1100-1400 8 7 15 3 t 45 720 1400-1700 5 2 7 3 r
21 720 1700-2400 - 14 0 14 7 n 98
720 0000-2400 73 15 8 8 24 ~
230 -~
Jl Hourly passage rates are based on visual counts as presented in Table 6 Passa~e rates listed are the net upStream passage rate and are taken to be rePtesentativf of time~periods of 3 to 7 hours duration depending upon the frequency~of visual counting conducted each day ~ middot
-50-
I 11 I
1middot middot bull I middotmiddot tv middot ~ ~ middotc h middot 0 n h l - (Vr _ bull middot ~ r bull middot- 1 bull lt tmiddotmiddotmiddot lt bull hl ~ l middot a ~ bull l middot 1-t- ~
bullJ rC t r1 _ - ( bull ~ bull middot l J
~~middot ~ It i I t Al1endix Tab~ bull 4~ kJe1 ampeX a~ size cmrosition of rmiddot t Fork Andreafsky River B r dun salmon ~ch ~ine and carcass samples 1982
middot l j middot I I I I lJ bull t bull bull e ~
) ~ J ~ bull bull bull ~ t t ~ - ~~ ~ ~- ~ Age 3 middot middot 1 middot Jl9e 4 t bull t middot Age 5 bull - rmiddot middot middot middot tlt- Age 6 middot I 1 r ~iDea middot ~s
--~lt---- bull] ------------ _____ __l-1 bull --- --1------i t--__~--A----
- Length_ Length Length Length lagth N middot middot ~tt ~1 (m) 5D N (m) BD N i (IIIli) SO N (11111) 5D N lm SO
---------~-~------- ------------- ------------- ------- ------Beach Seine
I I
Hale 0 35 28 569 34 Fmale 3 2
I 545 38 54 43 539 29 --------------- ---------------
Total 3
Carcass Survey
Male 2 1 Female 6 2
Total 8 2 bull middot-Canbined Gear
Male 2 Fmale 9 2
545
l bull 1495 524
517
495 531
38 89
7 73 14 170
18
7 108 24 224
71
22 52
24 49
551
576 526
574 529
34
27 22
29 25
--------------------------- -----------lbtal 11 2 524 26 332 73 543 34 ------------------ ---------------
11 19
30
35 41
46 60
9 15
24
11 12
23
10 13 --------
106 23
-I middot ~ 1-
611 3l 3 2 582 30 49 39 580 37 562 30 1 1 580 77 61 545 31 --- ---------sao 38 4
I
3
598 bull 32 2 _middot 1 544 29 1
581 25 126 100
622 39 112 34 620 J- - 218 66 ------------
569 3
602 32 5 550 30 2
572 40 7
1
1
2
622
598 600
599
28 330
36 161 28 295
32 456 _____ ___
100
35 65
100
559
SB2 530
547
581 534
550
37
33 25
38
34 28
38
I U1 N t
middot I
I J
~ I I
A(tlendix Table 5 hje ampex a~ size ltXJmp)S~tion of East Md Weat Fork Andreafsky Ri~r king ~~l beeCh ~~~ and carcaaa SIIIIPleampr 1982bull i
___ AIJe __ J 41---- Age 4 hje 5 middot __ ~ t Age 12
Le~th Length ~th ~ Lealgth N i (nin) SD N middot t (IIIII) SD N (nm) SD N (maf CJU N l tJIIB) SD
East Fork BeWb
Male i amiddot Fanale o
Total 1 4
Se11l~
355 bull -
355 middot
Ea~t Fork caicae a auivesr --~
11ale 2 l Female 0
Jbtal 2 1 I ~
---Male t 4 Female 0
lbtal 4 4
37Q -370
Survey
391 -391
-middot middot
- 9 g
- 18
35 n middot - 0
35 61
16 33 - 1
16 34
Conbined Gear and Location -------Male 7 2
0
Total 7 2
380 -
380
24 103 - 10 -- 1-middot 24 113 ----
31 492 53 9 31 31 500 sf ~ 4 -
62 496 52 10 ~middot middot
29 551 38 105 50 - - bull 2
29 ss1 38 109 52
l8 549 42 37 42 1 466 - 3 3
39 546 44 4Q 45
32 545 43 151 46 3 497 52 8 2
35 540 46 159 49
-
671 45 0 - - - 0 - - -620 i 0 - - - 0 - - -~
666 45 0 - - - 0 - - - I
=middot SJ I ~ middot-- middot
691 11 5 111 59 i 2 l 868 u 168 41middot 20 10 820 41 middot ~ 1 ~0 46 ~
700 55 31 15 805 51 5 2 gt899 44 i
706 51 2 2 844 4~ 0 - - -773 29 ~ 7 8 832 53 1 1 988 -710 53 9 10 835 49 1 1 188 -
696 53 13 4 788 61 2 1 868 11 751 61 ~7 8 023 43 4 1 937 51
700 54 40 12 812 52 6 2 914 53 -~middot -
19 66 10 35
29 middot100
181 bull87 Z1 middot13
200 100
76 86 12 14
88 100
216 85 49 15
325 100
Length (na)
-
569 ~12
550
middot
651 823
673
624 800
648
638 754
113 63
middot101
97 56
lOi
llQ 126
127
104 147 ----
656 118 -
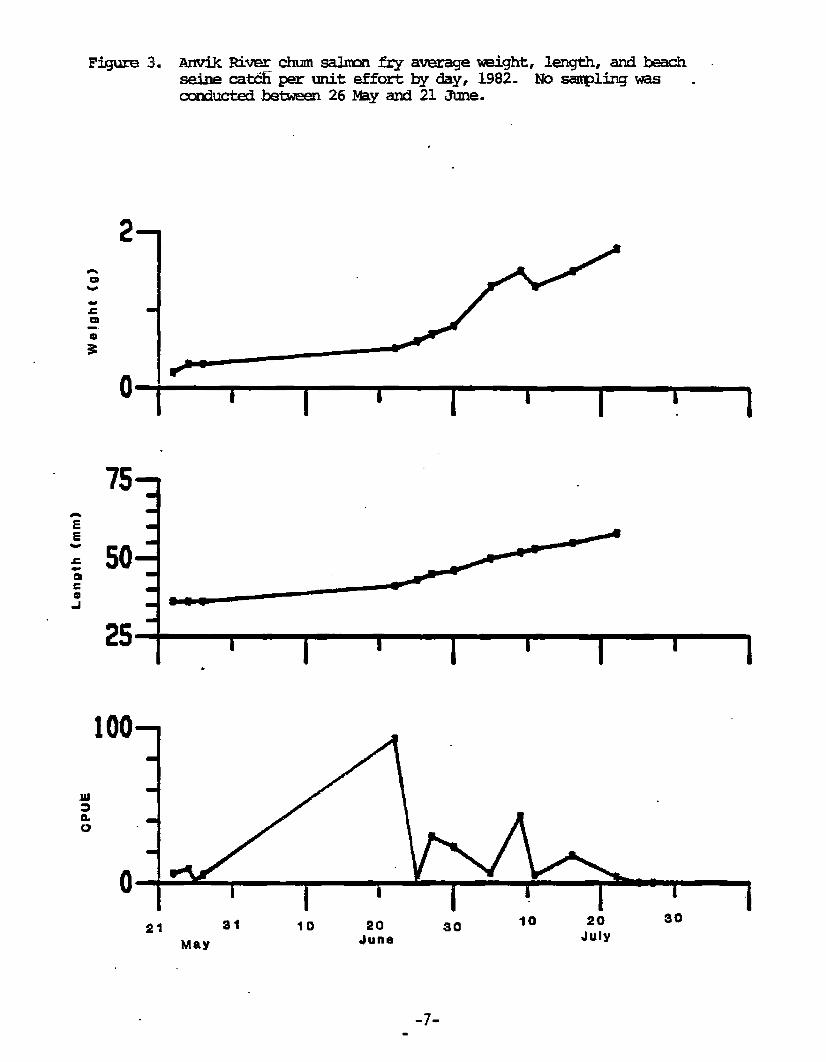

~
121ble 3 VisUal calibration of salmon sonar counts at the Anvik River west bank site 1982
Visual Count l
Pink salJDon Sonar
Date
627 230D-2310 628 1445-1500 629 1510-1525 630 1505-1515 73 0950-1005 73 1517-1532 715 0905-D920 7l5 2139-2154 717 092D-0935 718 0833-o848 7lB 1552-1607 719 0823-D838 719 1528-1543 720 0945-1000 720 lSSQ-1605 724 142D-1435
10TALS 383 hours
Sanar Count
1 0 0 0 3 3
24 9
24 17 8
12 3 0
13 5
122middot
Up
0 0 0 1 0 0 0 0 9 0 6 0
27 1 7 0
27 2 27 1 8 2
l8 1 9 2 4 0
34 4 1 3
177 17
Net Up Net Accuracy 2
0 0 0 0 -1 0 0 0 0 0 0 omiddot 0 a 0 0 9 0 0 0 033 6 0 0 0 050
26 4 0 4 092 7 0 0 0 129
25 3 0 3 0 bull 96 26 22 0 22 065 6 9 0 9 133
17 12 0 12 071 7 6 0 6 043 4 3 0 3
30 8 0 8 043 -2 4 0 4
160 71 0 71 076
l Visual salmon counts are listed as upstremu or downstream psssage over the sonar substrate with bullnetbull being the difference between tbe two No kinq salmon were seen during visual calibration periods
2 Sonar accuracy is calculated by dividing the sonar counts for aey given period by by the net visual count of chum salmon for that period
-16-
Milling chum salmon caused false counts on the east bank from 24 to 26 July the last three days of the project Poor visibility made it difficult to visually docmnent the extent of this behavior with any_ accuracy Milling was not a problem on the west bank where water current was faster and fish aSSage remained nomal~ Escapement estimates for this period are based on west bank sonar counts as outlined in Appendix A The first sallncn were counted on 25 June Peak daily counts of 405Z7 and 36197 stmmer chum salmon occurred on 9 cutd 12 July respectively Run timing was similar to that of 1980 with mean date of passage on 11 July (Figure 6) Buklis (1982a) postulated a 20 day lag time for swnmer chum salmon migraticn between the fish~ at ~ and the Anvik River sonar site If correct this would mean that 50 of the Anvik River stock had passedmiddot through the Emnonak area by 21 June The large mesh gillnet season in Y-1 and Y-2 ended by emergency order on 2 July indicating that mce again the majority of the Anvik River stock had passed through the intensive lower Yukon River fishery before mandatory changeover to chlJJl salmon gear
here is ncgt clear diurnal migration pattern apparent in the hourly sonar --- -- - c6UriEs (Figure 7) Fpr the 4 years in which sonar enwneration has been
conducted on the Anvik River only the 1981 run demonstrated a diurnal pattern Passage was lowest at mid-day and greatest at midnight for that year ~e majority of the fish have been counted along the west bank each year The count distribution by sector for the west bank substrate in 1982 shCMs an uncharacteristic pattern (Figure 8) with a sudien increase in counts from sector 8 to sector 9 This PJSSible error in the count criteria of the sonar electronics was mentioned earlier Most of the sonar counts registered by the east bank counter were in sectors 8 through 16 Although the same counting error may have been operating onmiddot the east bank as on the west bank it is also true that mcst of the fish passage was occurring offshore at this site
A total of 185 pink salmon were visually co~mted crossing the east bank (Table 2) and west bank nlble 3) sonar substrate~ between 14 and 26 July During this same period 337 chum salmon were visually counted The total chum salmon escapement estimate for this period was 139907 (Table 1) The ratio of visual ch1m1 salmon counts to total escapenent is 00024 Expansion of the 185 pink salmon visual counts based on this ratio yields a total escapement estimate of 76800 pink salmcn There is no way to evaluate the accuracy of this expansion estimate but it is probably a good awroximation of the actual magnitude Fishermen in Anvik Village replrted that it was the largest pink salmon run they had seen in many years
No aerial survey of the Anvik River was flown to estimate king salmon escapement due to high turbid water conditions and overcast rainy weather during late July and early August No king salmon were visually counted over the sonar substrates during the period 27 June to 26 July There is no data upon which to estimate the Anvik River king salmon escapement in 1982 Based on the 10111 number of king salmon captured by beach seine and encountered during carcass surveys the escapement was probably less than 2000 king saJJnon
-17-
Figure 6 Daily smmer chum salnon esca~t past the Anvik River sonar site 1979-1982 The mean date of run passage is illdicated by dashed line
-c bull 0 liD a
-c bull u liD a
-c bull 0 liD a
-c bull 0 bull a
10
0
10
0
10
0
10
I I I
I
14 24 4 24
June July
-18-
I
Figure 7 Sumner chum saliron escaperent past the Anvik River sonar
= II 0 II a
-= II 0 II g
-
10
5
10
middot5
5 II a
10
~ 5 II a
site by brur 1979-1982 middot
0000 0500 1000 1500 2000
Time of Day
-19-
Figure 8 Sumner cbm sa1non escapement past the Anvik River sonar site by sonar sector 1979-1982 Note that there -were U sectors for each substrate in 1979-1981 and 16 sectors in 1982
-1 CD 0 CD D
-1 bull 0 bull D
-1 CD 0 bull D
-1 CDmiddot u bull ~
25
25
so
0 8 12 12 8
25
0
Shore West Bank Sectors East Bank Sectors
-20-
1
Shore
River water deptJl declined steadily from 18 June (Ocm to 21 JUly when it reached a low for the season of -84 em (Figure 9) Intemtittent to heavy rainfall during the period 20 to 31 July resulted in rapidly rising water levels River water depth increased fran -84 a11 on 21 July to +112 en an 31 July a vertical gain of 196 an (6-5) in 10 days Horizontal gain depended of course on slope of the shoreline but in many places the river was flooded to the willa~s along gravel beaches and near the top of cutbanks Water was extremely turbid Water temperature dropped during the flood period and air temperatures were lClll due to the cloud cover (Figure 9) Water temperature was 14degC on 18 June 9degC on 31 -middotJuly and back up to l3degC on 8 August Air temperature was l5degC an 18 June l0degC on 31 July and l8degC on 8 AUgust
Beach seining was conducted at the sonar site but was not very effective in capturing salmon for age sex and size sampling Thirty-five sets were made between 21 June and 21 July and ally 63 chum salmal 1 king salmcn and 6 pink salmon were captured An additional 325 chum salmon and 137 king salmon were sampled by carcass survey between mid-July and mid-August Chum salmon sampled by beach seine were 61 fenale and evenly divided between age 4 (51) and age 5 (46) while-carcass samples- were-71- fenale and 70 age 4 (A)pendix able l) bull Average length of beach seine samples tended to be slightly larger than carcass samples for a given age and sex group but were well within the range of l standard deviation and the differences are therefore not statistically significant (Appendix Table 1) The small sample size obtained by beach seine makes it difficult to make a rigorous comparison of the two methods and all samples are pooled to compare with the age and sex canposition of carcass samples collected in previous years Greater effort should be made to collect an adequate sample by beach seine in 1983 This may require extensive seining at several locations near the sonar site to locate an effective beach seine site
The pooled SUllins chtB---salmal-sample-was- 69 female with an age breakdcMn of 6 age 3 67 age 4 27 age 5 and 1 age 6 This is similar to the age and sex canpositim of the 1979 escapement but contrasts markedly with 1981 when age 5 was predaninant (Figure 10) Age class 4 or 5 predauinates in any given year but there is no apparent pattern or cycle in the age of the return Strength of the 1971 and 1976 brood years can be traced through all age classes
King salmal carcass sanples were only 28 female with an age breakdown of 35 age 4 38 age 5 and 28 age 6 (Aglendix Table 2) bull Average length ranged from a lowmiddot of 560mn for ag~ 4 males to 840nm for age 6 females No agemiddot 7 king salmon were found in the sample _ The age and sex composition of the 1982 escapement differed greatly from that of the previous year (Figure 11) The 1981 escapement sample was 59 female including fewer of the age 4 and age 5 males that dominated the 1982 escatenent Producticn is expected to be low fran the 1982 escapement due to the small nunber of fanales
cne sockeye salmon and one coho salmon were found while surveying the river by boat for king and chun salmon carcasses be sockeye salmon was moribund when captured on 7 August near the cOnfluence with the Yellow River and was an age 13 male 590mm in length This is the first sockeye salmon documented in the Anvik River he coho salmon carcass was found at mile 25 of the Yellow River on 14 August and was a male with a length of 495mn The scale sample fran this fish was not readable
-21-
Figure 9 Water temperature air tarperature (rraxmin average) and water depth ~ed at noon daily at the Anvik River sonar site 1982
- 20 0 -bull = -bull 10 bull Q
e bull 1- bull - 0 bull 3
- 20 0 -bull ~ -bull
10 bull Q E bull 1- -ltI( 0
amp 200 Q c -Q
~ 0~~~~------------------~~~~--------------- bull -bull 3
-200-t-----r-----r----~r----------
14 24 4 June
14
July
-22-
24 13
Auauat
23
Figure 10 Age and sex composition of Anvfk River summer chum salmon 1972-1982
-c CD 0 -CD Q
-c CD 0 CD Q
-c CD 0 CD Q
-c CD 0 CD Q
2
1973 1975 1977 1979
JRE FBRf Age 3
middot----middot --~ ----middotmiddot-middot -- ~
Age 4
Age 5
Age 8
1981 1983
I Includes 57 (15) beach seine samples in 1982 All other samples were carcasses
-23-
l
-c CD u CD ~
Figure 11 Age and sex composition of Anvik River king salmon carcass samples 1972-198211
50 -fRE FEMILE
Age 4
0
100
Age I(
100 -c CD () CD a Age 6
0
10 -c CD u CD a Age 7
0
1973 1975 1977 1979 1981 1983 -
No samples were collected in 1974
-24-
1HlRFAFSKY RIVER AIIJLT SAIMN SlODY
be Andreafsky River (Figure 12) includes two main branches the Fast and West Forks and is located 100 miles upstream from the mouth of the Yukon River It is secmd to the Anvik River in sumner chum salmon production second to the Salcha River in king salmon production and supports the largest pink salmon run in the Yukon River drainage Salmon escapements were estimated annually by aerial survey from fixed-wing aircraft prior to 1981 when a side-scan sonar counter was installed in the East Fork for the first time Water clarity is generally good but high water rain wind and cloud cover have resulted in poor surveys in sane years Aerial surveys are still flown to estimate escapement to the West Fork of the river and to evaluate the accuracy of the sonar counter on the East Fork
Below the catfluence of the East and West Forks the Andreafsky River is wide and slOW moving not suitable for side-scan sonar operation The East Fork was chosen for the initial feasibility study in 1981 (Buklis 1982b) and the study was continued in 1982
Methods and Matgrial s A sonar site was located at mile 20 of the East Fork Andreafsky River in 1981 One sonar counter and substrate was available for the initial feasibility study and it was placed in the middle of a 100 foot wide channel between the west bank and an island (Figure 13) Weirs prevented fish passage around either end of the substrate which was situated on a gravel shelf awroxmately 3 feet deep on 23 June 1981 ihe channel on the opposite side of the island was not navigable by salmon due to low water and numerous sandbars
A second sonar counter and substrate was brought to the Andreafsky River in 1982 When the crew arrived at the sonar site on 11 June the wate~le~was significantly higher than it had been the previous year Water was flaiing on both sides of the island and was 6 feet deep across the gravel shelf Since two sonar counters were available it was decided not to try to install one substrate in the middle of the channel as in 1981 but instead to put one substrate on the west bank and one on the east bank of the river (Figure 13) The west bank substrate was situated on a gradually sloping gradient in front of the campsite about 800 feet downriver from the 1981 sonar site The transducer housing was 1 foot undetwater and 15 feet from shore with a weir preventing inshore fish passage The offshore end was 7 feet deep ite east bank substrate was situated on a steeper gradient 150 feet dCMnriver from the westmiddot bank substrate The transducer housing was 1 foot underwater and 5 feet fran shore with a weir preventing inshore fish passage The offshore end was middot 7 feet deep The river is 200 feet wide at this site and characterized by a slew water eaJy area along each bank Water flow was only about 2 feetsec even in the center of the channel The west bank substrate was situated at the upper end of a slow water area and the east bank substrate at the lower end thus the substrates were installed as close together as pgtssible while still avoiding the eddies
Sonar counters were the 1978 model~ which divide the counting range into l2 sectors and do not have a large fish counting feature Oscilloscope and visual calibratioos were conducted as described for the Anvik River King and chum salmon were sampled by beach seine and carcass survey for age sex and
-25-
D z MILlS
Figure U
4
Map of the Andreafsky River
-26-
Figure 13
+ Mldatr~middot~ Sit
++ Water Flow
~ bull =~ ~
Weal Bank
middot
I
Sonar
Subbulltrate
Map of the East Fork Andreafsky River sonar site
Eabull1 Bank
size composition (lata as middotdescribed for the Anvik River study Salmon carcasses were also sampled fran the West Fork Andreafsky River
Resu1ts and Discussion The sonar counters were operational on 18 June and the first salma were Q)unted on 25 June The electronics were adjusted such that pink salmon generally were not counted but a small percentage probably did register Q)unts due to milling behavior near the substrate A total of 181352 salmon were counted between 25 June and 20 July (Table 4) bull As will be discussed later it is not possible to accurately estimate the number of king or pink salmon that contributed to the total although both species carilined probably accounted for less than 5 of the sonar counts lberefore all sonar counts are attributed to summer chum salmon for the purpose of comparing to historical escapement trends Escapement estimates prior to 1981 are based on aerial surveys and may not be directly cauparable
he 1982 East Fork Andreafsky River escapement of 181352 summer chum salmon was 16 times greater than the previous 10 year average (1972-1981) of 110963 and seccnd only to the 1975 escapement of 223485 sumner chum salmon (Figure 14) Distribution of daily escapement counts in 1981 (Figure 15) indicated that an early segment of the run may have been missed so that the total escapement count of 147312 summer chlml salmal was a minimlln estimate The actual escapement for 1981 and 1982 was more similar than the sonar estimates indicate because of the two factors mentioned (1 The 1982 estimate was inflated by as much as 5 cile to king and pink salmon counts and (2) the 1981 estimate is lc7N due to not counting an early segnent of the run
Sonar counts ranained low fran 25 June through 1 July averaging 1 017 per day for the 7 day period On 2 July 32572 saJJnm counts were regiStered by the two sonar counters Virtually all of theSe counts occurred in the offshore half of the west bank substrate and between the hours of 1300 to 1700 (Figure 16) Unfortunately the crew was in St Marys PJrchasing supplies during this time and thus no direct ccmfinnaticn of these sonar countsis available lbe crew did observe that there were many more dun salmon above the canqsite upon their return than there had been previously The weather was cloudy and windy and may have triggered the upstream migration of chum salmon milling in the lower Andreafsky River Fish were seen fiming and breaching the water surface as the crew made their way downriver to St Marys in the morning There was no other boat traffic on the river to cause false counts and no debris was near the substrate when the crew returned Transducer aiming and equipment settings were Checked and found to be correct This sudden appearance of such a large number of salmon (18 of season total) seems unprecedented but there is no justification for rejecting the sonar cotmt data
The distriootim of sonar counts on 2 July indicated that a substantial number of chum salmon may have been migrating in midstream between the two sonar substrates Begiming on 3 July slow water current at the east bank site resulted in milling fish behavior and the growth of vegetation on the substrate For these reasons it was decided to move the east bank substrate to the midstream site used in 1981 By this time water depth had dropped about 2 feet making sonar substrate installation more feasible
-28-
Table 4 East Fork Andreafsky River chum and king saJmm sonar counts by date 1982
Total Count Season Total East West Midstream
Date Bank Bank Site teily CUmulative Daily Ctlmulati ve -625 168 382 550 550 03 03 626 317 545 862 1412 05 08 627 174 434 608 2020 03 11 628 334 1905 2239 4259 12 23 629 218 430 648 4907 04 27 630 668 523 1191 6098 07 34 71 338 685 1023 7121 06 39 72 1656 30916 32572 39693 180 219 73 (214)1 1770 1984 41677 11 230 74 (684) 5646 6330 48007 35middot 265 75 (131) 1085 1216 49223 07 271 76 (224) 1853 2077 51300 11 283 77 (528) 4362 4890 56190 27 310 7B 22993 22993 79183 127 437 79 15637 15637 94820 86 -523 710 15575 15575 110395 86 609 711 16268 16268 126663 90 698 712 15017 15017 141680 83 781 713 13172 13172 154852 73 854 714 8118 8118 162970 45 899 715 6952 6952 169922 38 937 716 7999 7999 177921 44 981 717 - 1528 2 1528 179449 08 990 718 1027 1027 180476 06 995 719 646 646 181122 04 999 720 230 230 181352 01 1000
1 Slow water velocity mil1inJ grayling and salJoon and vegetation along the substrate resulted in false counts at the east bank site beginning on 73 Daily east bank counts in parentheses are estimated based on the west bank count for that day The east bank averaged 108 of the daily escapement for the period 625 through 72
2 Milling salmon resulted in false counts at the midstream site beginning on 716 Daily escapement estimates for the period 717 through 720 are based on expansion of visual counts as presented in Appendix Table 3
-29-
Figure 14 East Fork Andreafsky River ~ clnJm sa1mm escapement- 1972-1982
3 - bull -0
0 0 0 0 bull IC
2 --c -bull e bull A bull 0 bull ua c 0
E -bull bull -E 1 II a 0 -~ bull e I II bull -
--
0 I I I I I I I I I I I I I I 1872 1874 1871 1878 1880 1882
-30-
Figure 15 Daily surmer chum sa1nDn escapement past the East Fork Andreafsky River sonar site 1981--1982 The mean date of rtm passage is indicatei by dashed line
-c bull 0 bull a
c
10
s
20
~ 10 bull Q
14
1981
24 4 14 24
June July
-31-
bull a
IJO
west Bank
0000
Figure 16 East Fork Andreafsky River sonar count distribution by sonar sector (above) and by hour (below) an 2 July 1982 A total of 32572 sonar counts were registered on this date 18 of the total for the season
10
Sonar Sector
0500 1000 1500
HOUR
-32-
10 8
2000
East Bank
lhe channel on the other side of the island was blocked to salmon passage by exposed sand bars CBily escapement estimates for the period 3 July through 7 July are derived by expanding the west bank sonar counts (Table 4) Salmon escapement was counted from the midstream site beginning on 8 July until project tezmination on 20 July Weirs prevented fish passage arotmd either end of the substrate Iaily escapement counts were consistently higher at the midstream site than they had been at the two previous sites supporting the hypothesis that some chtDD salmon had been passing uneotmted between the two smsttates -
Water turbidity and weather conditions had prevented visual calibration of sonar counts at the east and west bank sites but ccnditions were occasionally more sui table at the midstream site Between 8 and l6 July a total of 467 hours of visual counting was calducted and sonar accuracy averaged 86 (Table 5) Accuracy for any given period was extremely variable as had been found at the Anvik River Milling sallnon resulted in false counts beginning on 16 July Visual counting was increased and daily escapement estimates for the period 17 through 20 July are based on expanded visual counts not sonar counts A total of 186 hours of visual counting was conducted between 11 and 20 July and a net up~tream total of 10840 pink salmon 475 chtDD salmon and 43 king salmoo were counted (Table 6) Hourly p=1ssage rates were taken to be representative of time blocks within the day and expanded by the number of hours in the time block (Appendix Table 3) Resulting escapement estimates were 1528 sumner chum salmon on 17 July 1027 on 18 July 646 on 19 July and 230 an 20 July
Mean date of rtm passage was 9 July in 1982 and 5 July in 1981 (Figure 15) Peak daily cotmts in 1982 of 32572(18) and 22993 (13) occurred on 2 and 8 July respectively Distribution of sonar counts at the midstream site by hour in 1982 does not demonstrate the diurnal pattern that was apparent in 1981 (Figure 17) Countsmiddot were lCMest at mid~y and highest at midnight in 1981 he distribution of sonar counts by sector was also different between the two years ihe substrate was pgtaitioned in 1981 such that sector 1 was on the west and sector 12 was on the east Positioning was reversed in 1982 with sector l on the east end and sector 12 oo the west Sonar counts were high in the inner and outer sectors in 1981 dropping to a low in the middle sectors (Figure 18) In 1982 sonar counts were lew in the inner and middle sectors building to high counts in the outer sectors (Figure 18) The reason for the difference in count distributioo is not known A change in eydrology of the site or the large number of pink salmon in the 1982 run are two poundX)SSible causes for the shift in the migratioo ~ttern of smller chum salmon
Visual counts were obtained for only a portion of the salmon escapement period and therefore cannot be expanded to accurately determine species canposition (Figure 19) Pink salmon accotmted for 90 of all visual counts chum salmon 95 and king salmon 05 Excluding pink salmcn chum salmon made up 954 and king salmon 46 of the remaining visual counts This is similar to the 1981 percentages (excluding pink salmal) 965 chum salmon and 35 king salmon Hourly passage rates based on visual counts indicate that the chum salmon escapement was similar in magnitude for the two years that king salmon escapenent was lcwer in 1982 and that pink salmon escapement was much greater in 1982 (Figure 19) The pink salmoo escapement may have approached 1 million fish in the Fast Fork Andreafsky River
-33-
labli 5 Visual calibcation of silmcn sonar counts at tbe Fast Fork Andreafsky River midstream site 8-16 July 1982
78 78 78 78 78
1005-1015 l61D-1625 2050-2100 2112-2122 2125-2135
78 092 bours
79 19SD-2000
79 017 bours
710 1540-1545 710 16DD-1610 710 202D-2030
710 042 hours
7ll lll5-ll25 7ll 1127-1137
7ll a33 bouts
712 103D-l040 712 2310-2320
712 033 hours
713 225D-2300
713 017 bcuta
714 100D-10lS 714 1040-1055 714 l85D-l855 714 190D-1910 714 2245-2300
714 100 hours
715 13~1405 715 15~15l5 715 1517-1532 715 1535-1550
715 100 hours
716 1035-1045 716 2240-2250
716 033 hours
Totals 467 hours
Sonar Count
93 71 52 85
l38
Up
30 156 l2B
94 l38
439 546
15 19
15 19
14 88 55 84 ll 12
80 184
1 1 4 8
5 9
3 5 26 35
29 40
10 17
10 17
17 7 6 6
lS 4 78 middot13 30 23
146 53
1 28 16 ll 5 12
l3 ll
35 62
14 8 63 - 20
77 28
836 958
a 0 0 0 0
8
0
0
0 0 0
0
0 0
0
0 0
0
0
0
0 2 0 1 0
3
0 0 0 0
0
0 2
2
l3
22 lS6 l2S
94 138
538
19
19
88 84 12
184
1 8
5 35
40
17
17
7 4 4
12 23
so
28 11 12 11
62
8 lB
26
945
Up
3 9 0 0 0
12
2
2
8 1 0
0 0
0
1 0
1
0
0
1 0 0 0 0
1
0 0 0 0
0
0 0
0
0 0 0 0 0
0
0
a
0 0 0
0
0 0
0
0 0
0
0
0
0 0 0 0 0
0
0 0 0 0
0
0 0
0
0
l 9 0 0 0
50 0 so l55 0 155 190 0 190 186 0 186
not counted
l2 581
2 154
2 154
8 l57 1 125 0 53
9 335
0 86 0 105
0 191
1 lll 0 bull us
1 239
0 53
0 53
1 21 0 16 0 30 0 119 0 118
1 304
0 134 0 136 0 212 0 136
a 618
0 114 0 138
0 252
25 2727
0
0
0
0 0 0
0
0 0
0
0 0
0
0
0
0 0 0 0 0
0
0 0 0 0
0
0 0
0
581
154
154
157 125
53
335
86 105
l9l
lll l28
239
53
53
2l 16 30
119 ll8
304
134 136 212 136
618
114 138
252
0 2727
372 043 041 090 100
080
071
071
015 065 092
041
100 050
056
050 174
71
059
059
212 150 375 650 130
286
004 145 042 118
056
175 350
296
086
~ Visual salua1 counts are listed as upstream or downstream passage over the sonar substrate with netbull being the difference between the twa middot
Y Sonar accuracy is calculated by dividing the sonar counts for arry given period by the sum of the chum and king salmon net visual ~ for that period
-34-
Table 6 Visual salmon counts at the East Fork Andreafsky River midstream site 17-20 July 1982
Qun 5almon King Salmn Pink Salmon
Date Time Op Ccwn Net Up Ocwn Net Op Down Net
717 ll3D-114S 4 2 2 0 0 0 18 0 18 717 1450-1620 57 14 43 5 0 5 746 1 745 717 1855-1935 87 5 82 1 0 1 811 4 807 717 2005-2020 15 1 14 0 0 0 343 1 342 718 0835-0900 2 0 2 1 0 1 219 0 219 718 0900-1000 10 2 8 4 0 4 499 1 498
- 718 1215-1315 27 0 27 3 0 3 502 2 500 718 1510-1610 56 4 52 2 0 2 592 0 592 718 181D-1910 55 2 53 1 0 1 445 0 445 718 2215-2315 73 1 72 6 0 6 1140 2 1138 719 0555-0655 20 0 20 3 0 3 1181 1 1180 719 0910-1010 7 2 5 0 0 0 682 0 682 719 l21D-1310 12 2 10 1 0 1 374 3 371 719 1550-1650 18 2middot 16 3 0 3 344 3 341 719 180Q-1900 27 0 27 4 0 4 513 2 511 719 211D-2210 11 0 11 0 0 0 383 0 383 720 070D-0730 2 0 2 0 0 0 255 4 251 720 0910-1010 2 0 2 0 0 0 421 6 415 720 1300-1400 a 0 8 7 0 7 345 0 345 720 1530-1630 10 5 5 2 0 2 519 4 515 720 1800-1900 15 1 14 0 0 0 545 3 542
Totals 186 hours 518 43 475 43 0 43 10877 37 10840
-35-
c CD u CD D
-
Figure 17 Slmner clnJm salirDn escapement past the East Fork Andreafsky River soriar site bY OOur 1981-1982
10 1881
5
10
1982
5 CD
G
0000 0600 1000 1500 2000
Time of Day
-36-
-c
bull u bull a
-c
Figure 18 SUmner chum salmm escaparent past the East Fork Andreafsky River sonar site by sonar sector 1981-1982 Note that sectOr 1 was on the west end in 1981 and on the east end in 1982
110
30 1981
20
10
West 1 8 12
110
30
middote 20 bull a
10
West 1 2 6 1
Sonar Sectors
-37-
East
East
Figure 19 Hourly passage rate of chum king and pink sa1nDn at the East Fork Andreafsky River sonar site based on visual counts 1981-1982
II 0 ~ bull ~
~
bull -~
II 0 bull Q
-= bull
II 0 bull Q
c bull --
1000
0
25
0
1000
20
June
---- 1981
i702 1882
I Chum middotsalmon
bullbull I I J ~ I I r--1 I _
~ King Salmon
bull I I -
Salman
30 10 20
July
-38-
30
An aerial survey was flam of both the Fast and West Fork of the Andreafsky River on 20 July Under fair cmditians 699 king salmon were counted on the west Fork and 1274 on the Fast Fork Cloud cover and wind reduced accuracy on the East Fork portion of the survey which was the latter fork surveyed 1he large mEber of pink Salmon pro~ ted enumeration of sumner dnnn salmon and probably affected accuracy of the king salmm estimate as well Survey counts should be considered minimum estimates A second survey of the West Fork only on 6 August resulted in a count of 836 live king salmcn and 15 carcasses cncemiddot again survey anditions were only rated fair
Similar to the Anvik River water level at the East Fork Andreafsky River sonar site declined steadily frau the initial 0 an reading on 15 June to -106 em on 13 July (Figure 20) Water level was relatively stable for a 10 day period then rose fran -75 an on 22 July to +15 em on 31 July This was a vertical gain of 90 an (3 feet) in 9 days water temperature ranged between 8degC and 16deg c while average daily air temperature ranged between 8degC and 18degC during the period 15 June to 15 August (Figure 20)
Beach seining was sanewhat more effective on the East Fork Andreafsky River than it was on the Anvik ltiver but catches were lower than anticipated lhirty-two sets were made between 20 June and 17 July and 131 chum salmon 33 king salmon and 81 pink salmm were captured An addi tiooal 330 chum salmon and 296 king salmon were sampled by carcass survey The age sex and size composition of sUDDDer chum salmon sampled by beach seine and carcass survey were very smuar (AIpmdix Table 4) ~ Age 4 fEmales daninated both samples accountinq for 43 of the beach seine catch and 52 of the carcasses Although a larger beach seine sample would be desirable it appears that there is no significant difference between the beach seine and carcass sample cauposition and the data is pooled to canpare with the 1981 escapement The pooled sample is 65 female and has an age breakdown of 2 age 3 73 age 4 23 age 5 and 2 age 6 By canparison 1981 escapement was equally divided between age classes 4 and 5 and was 52 female (Figure 2l) bull Strength of the age 4 return was aggtarent for both the Anvik and Fast Fork Andreafsky Rivers in 1982
Too few king salmon were captured by beach seine to allow for a meaningful canparison with the age sex and size canposition of carcasses Pooling the 29 samples fran the beach seine catch 208 carcasses fran the East Fork and 88 carcasses fran the West Fork results in a total sample of 325 king salmon fran the Andreafsky Ri v~r The pxgtled sample was only 15 female and had an age breakdam of 2 age 3 35 age 4 49 age 5 12 age 6 and 2 age middot 7 (Appendix Table 5) The weak return of females was similar to the sex canpositicn of the Anvik River stock Length ranged fran a low of 38011U11 for age 3 males to 937mm for age 7 females The primary differences between king salmon escapement in 1981 and 1982 is the weak showing of age 6 fish in 1982 the presence of age 3 males which were not found in 1981 and the overall FOQr return of females (Figure 22) bull
-39-
-u -CD = -
Figure 20 Water tatp=rature air taqJerature (maxmin average) and water depth measQred at ooon daily at the East Fork Andreafsky River sonar site 1982
20
middot- 10 bull Q
e bull bull 0 -bull
- 20 u bull = -bull 10 bull Q
e 0 -lt 0
- 200 E u -J -Q
middot ~ o----==-----rr----bull -bull bull
-200-t-----------r--P--r-----r- 14 24 4 14
June
24
July
-40-
3 13
Auouat
23
Figure 21 Age and sex composition of East Fork Andreafsky River summer chum salmons 1981-1982 l
75
so 1981 1982 c bull CJ -
I bull ~ 0 I
25
3 4 6 8 3 4 6 8
Age Age
l Includes 126 (28) beach seine samples in 1982 All other samples were carcasses
Figure 22 Age and sex composition of Andreafsky River kfng salmon 1981-1982
I ~ N C I CD
0 CD a
80
110
4 5
1981
6 7
Age 3 4 6
Age 8
I
1982
7
l Data is pooled for both East and West Forks for each year Includes 29 (9) beach seine samples in 1982 All other samples were carcasses
1) Minnow traps and beach seines were not feasible for capturing large nllDbers of juvenile salmon on the Anvik River High water after river ice breakup flooded beaches and restricted attempts to beach seine Future juvenile salmal studies should test the feasibill ty of fyke nets and inclined plane traps both of which are statimary floating gear which could be operated in high water bull
2) Chum salmon fry are still present in the Anvik River two matths after
breakup of river ice Large catches of king salmon fry oca1rred in late July and suggests that they may overwinter in the Anvik River before moving into the Yukon River the follciiing spring Only 3 king salmon smolt were captured but sampling was ineffective during spring breakup and flooding when most of the snolt may have been oubnigrating
3) Escapement to the Anvik River was estimated by side-scan sonar to be 444581 sunmer ch1111 salmon Age 4 was predaninant accounting for 67 of all samples and female$ outnmnbered males 2 to 1 King salmon escapement was not estimated due to poor aerial surveyen conditions carcass samples indicate that the king salJnal escapement was only 28 female with age classes 4 and 5 accounting for the majority of the fish Low returns from the 1982 brood year may result due to the low pLJDber of female spawners he pink salmon run was one of the largest in recent years according to local fishermen and escapement was estimated to be 76800 tased on expansion of visual counts
4) The- accuracy of the 1981 model sonar counter should be investigated ibis may be better accanplished at the East Fork Andreafsky River where all salmon passage can be directed over the sonar substrate and water conditions are usually better for visual observation of fish passage than at the Anvik River
5) More samples of adult chum and king salmon should be collected tyen beach seine at both the Anvik and East Fork Andreafsky Rivers to test the difference between the age sex and size canposition of beach seine and carcass samples
6) Escapement to the East Fork Andreafsky River in 1982 was estiJnated by side-scan sonar to be 181352 sumner chum salmon King and pink salmon were probably responsible for less than 5 of the sonar counts The chtn salmon escapement was 65 female and 73 age 4 An accurate estimate of the king salmon escapement was not obtained but was lcwer than the 1981 esca-penent of 5 343 King salmon beach seine and carcass samples were only 15 female and age 5 accounted for 49 of the total Pink salmon escapenent was at a record level and approached 1 million fish based on visually observed passage rates
7) Accuracy of salmon escapement data fran the East Fork Andreafsky River can be improved by implementing the following procedures
-43-
a) One sonar substrate should be installed at the midstream site at the start of the season regardless of water conditions Weir fencing should be installed as soon as pgtssible to prevent sa1mon passsage around the ends of the substrate
b) Visual counting periods should be scheduled throughout the day and the crew held responsible for attempting visual counts during those periods This will insure that the equipnent is not left unattended for more than a few hours at any one time which was a problem in 1982 when a large nlJDber of salmm agarently passed over the smar counters while the crew was JUrchasing supplies in the villaqe
c) Species cODp)siticn is an impJrtant factor affecting the accuracy of the sonar data especially in even numbered years when pink salmon can outnumber summer chums bf five to one Increased visual counting may help to improve allocation of sonar counts Fishing a trammel net may be a feasible method of estimating species canposition and also provide an unbiased estimate of age sex and size composition for ch111 and king salmm A trap with funnel opening and weir lead-in made from fence stakes and rectangular fencing may accomplish these same objectives All three methods of estimating species canpostion should be cmducted in 1983
8) The feasibility of installing a full weir across the East Fork Andreafsky River should be investigated in 1983 by locating potential weir sites and monitoring water depth and velocity throughout the season A weir could provide daily salmon escapement data by species age sex and size as opposed to the limited information obtained by side-scan sonar in 1981 and 1982
-44-
-middot
LITERATORE CITED
Barton Louis H 1982a EhlJileraticn of fall chum salmm by side-scanning sonar in the Sheenjek River in 1981 Yukon Salmon Escapenent Report No 13 Alaska Deptmiddotof Fish and Game Commercial Fisheries Division Fairbanks 22 pp
---middot 1982b Side scan sonar (1981-16 sector model) Unpublished memorand1111 dated 8 December Alaska Dept of Fish and Game Conunercial Fisheries Divisim Fairbanks 6 pp
Buklis Lawrence s 1981 Yukon River Salmon Studies Anadromous Fish Conservation Act CcIIpletion report for period July 1 1977 to June 30 1981 Alaska Dept of Fish and Game Juneau 50 pp
---middotbull 1982a Anvik River sumner chum salmon stock biology Infotmational Leaflet No 204 Alaska Dept of Fish and Game Juneau 50 pp
---middot l982b Anvik Andreafsky and Tanana River salmon escapement studies 1981 Yukon Salmon Escapement Report No 15 Alaska Dept of Fish and Game Qmnercial Fisheries Divisicn Anchorage 40 pp
Flagg Loren B 1981 Sockeye salmcn smolt dye_ narking and recovery tests in the Kasilof River Alaska Dept of Fish and Game FRED Division Soldotna 8 pp
Geiger Michael F 1982 Yukon salmon season sunmary repJrt Unpublished memorancbn dated 11 OCtober Alaska Dept of Fish and Game Comnercial Fisheries Divisim Anchorage 19 pp
McBride Doug and David Mesiar 1982 Nushagak sonar enumeration project 1981 Bristol Bay Data Report No 88 Alaska Dept of Fish and Game Catmercial Fisheries Divisicn Anchorage 24 pp
Menin Albert 1982 Letter to Bill Aivey Alaska Dept of Fish and Game
~cial Fisheries Division Anchorage dated 25 February Bendix Oceanics Divisicn Sylmar california 4 pp
Ricker WE 1975 Caupltaticn and interpretaticn of biological statistics of fish populations Department of Environment Fisheries and Marine Bulletin No 191 ottawa canada bull 382 pp
Seiler David Steve Neuhauser and Mike Ackley 1981 Ucentreamdownstream salmonid trapping project 1977-1980 Progress Report No 144 Jept of Fisheries washington 191 pp
Todd IS 1966 A technique for the enwneration of chum salmon fry in the Fraser River British Columbia can Fish Cult 38 3-35
-45-
Appendix A Method of adjusting daily sonar counts for periods of defecti equipoent or milling salmon at the Anvik River middotsonar site 1982
4July East bank sonar counter operational fran 0000 to 1000 west bank sonar counter operational fran 1200 to 2400 Sonar counts expanded to full 24 hour equivalent based on the average passage for that bank and time period during the- preceeding 9 day period
Fast Bank 74 625-73
ifest Bmk
5 July
74_ 625-73
Q000-1000 4230 Actual Count OOOQ-1000 335 Average of Daily East Bank total
126Z7 Estimated East Bank Total for 4 July
120Q-2400 5187 Actual Count 1200-2400 585 Average of Daily west Bank total
8866 Estimated West Bank Total for 4 July
West bank sonar counter operational all day with a total sonar count of 13ll3 Fast bank sonar counter inoperable all day The west bank averaged 584 of the daily total escapement for the period 25 Jur through 3 July Expanding the west bank count to the daily tot escapement and then subtracting the west bank and midstreampu contribution results in an estimated east bank count of 7300 salmon
6 July East bank sonar counter operational from 1700 to 2400 with a total sonar count of 2145 Ibis time period averaged 292 of the daily east bank escapement for the period 25 JlUle through 3 July Expanding the 7 hour count to the full 24 hour equivalent results in an estimated east bank count of 7 346
The west bank sonar counter was inoperable all day The east bank averaged 33 of the total daily escapement for the period 25 June through 3 July Expanding the east bank~ courit (7 346) to the daily total escapement and then subtracting the east bank and midstream contribution results in an estimated west bank count of 12891
-46-
7 July - 12 July East bank sonar counter operational continuously fran 7 July through 12 July while the west bank counter was inoperable The_ east bank averaged 33 of the total daily escapement for the period 25 June throuqh 3 July Expmding the daily east bank count to the daily total escapement and then subtracting the east bank and midstream contribution results in an estimated west bank count for each day as follCMS
13 July
7 July 8 July 9 July 10 July ll July 12 July
8300 15804 23469 14988 11575 20961
East bank sonar counter operational all day West bank sonar counter operational fran 0000 to 1200 This time period averaged 415 of the daily west bank count for the period 25 June through 3 July Expanding the lZ hour count to the full 24 hour equivalent results in an estimated west bank count of 9846 salmon
14 July East bank sonar counter operational all day West bank sonar counter operational fran 1200 to 2400 lhis time period averaged 585 of the daily west bank count for the period 25 June through 3 July Expanding the 12 hour count to the full 24 hour equivalent results in an estmated west bank count of 14 middot280 saJJoon
24 July - 26 July East bank sonar counts were inflated due to milling salmn but west bank counts cmtinued to be accurate due to faster water velocity and normal salmon swimming speeds Poor weather conditions prohibited visual calibration of sonar counts Daily escapement estimates were obtained by expanding west bank sonar cotmts The west bank averaged 534 of total daily escapanent for the period 25 June - 3 July and 15 July - 23 July Expanding the west bank count to the daily total escapement and then subtracting the west bank and midstream contribution results in an estimated east bank count of 2074 salnxm on 24 July 813 on 25 July and 802 on 26middot July
-47- middot
Appendix Table 1 Age sex and size canposition of Anvik River sunmer chum salmon beach seine and carcass samples 1982
Agel Age 4 middot Pge 5 Age6 cntgtined Ages ------ ------1--- ---l------ 1 -- ----------
Length Length Length LeBJth Length N (JIIIl) SD N (JIIIl) SD N (nm) SD N (11111) SD N (IIIII) SD ----------------- --------- -- -----
Beach Seine ------Male 0 ll 23 598 21 16 609 33 0 22 39 602 Z1 Female 2 4 528 11 16 28 540 28 30 568 2S 0 35 61 553 29 - ----- ----------Total 2 4 528 11 29 51 566 38 26 46 582 34 0 57 100 572 37
Carcass Survey -----------Male 4 1 521 19 62 19 580 22 28 9 618 36 1 645 95 29 590 35 Female 15 5 520 23 165 ~1 541 28 48 15 560 26 2 1 5~ 0 230 71 544 ~9 ------------ --------- -------- ---Total 19 6 520 22 227 70 552 31 76 23 581 41 3 1 582 55 325 100 557 37
Combined Gear ----Male 4 1 521 19 75 20 583 22 37 10 615 35 1 645 117 31 592 3t Female 17 4 521 22 181 t7 541 28 65 17 562 26 2 550 0 265 69 545 29 ---------------- -------- ------- ------- --Total 21 6 521 21 256 67 554 32 102 Z1 582 39 3 1 582 55 382 100 559 37 ------------- -------- --------- -- ----------
AilJendix Table 2 Age sex and size canpgtsition of Mvik River king salmon carcass samples 1982 1
Age4 AgeS Age 6 canbined Ages _2 ____ __ _z__ __ ~ ____ _z ___ ----- I Length middotLength Length Length
+gt N (nm) so N (mn) so N (mn) SD N (om) so 10 I ------------ ------------- --------
Male 47 34 560 59 47 34 679 6 4 814 130 100 72 631 97
Female 1 1 660 5 4 792 32 23 840 48 38 28 829 61 -----Total 48 35 562 60 52 38 690 38 28 836 66 138 100 686 125 -----------middot --------- ---- ---- Includes one 1ivesample collected by beach seine bull
-
Appendix Table 3 Expansion of chum and king ~ visual counts at the Fast Fork Andreafsky ~iver midstream site to estimate daily escapement 7-20 July 1982 Jl
~2 ~l
Hourly Passage Rat~ liL 1gt
Time Of Estimated Date Period Chum King Total Hours Fscapement
__
717 oooo-o1oo 108 0 108 7 756 717 0700-1300 8 0 8 6 48 717 1300-1700 29 3 32 4 128 717 1700-2000 123 1 124 --~ 372 717 2000~2400 56 0 56
i -4 224
717 0000-2400 64-8 08 656 24 1528 -------middot-
718 0000-0400 S6 0 56 4 224 718 0400-1100 1 -4 11 7 n 7lB 1100-1400 27 3 30 3 90 7lB 1400-1700 52 2 54 3 162 7lB 1700-2000 53 1 54 3 162 7lB 2000-2400 72 6 78 4
~-312
-
718 0000-2400 445 27 472 24middot 1027
719 oooo-o40o 72 6 78 4 312 719 0400-oBOO 20 3 23 4 92 719 0800-1100 5 0 5 3 15 719 110Q-1400 10 1 11 3 33 719 1400-1700 16 3 19 3 57 719 170Q-2000 27 4 31 3 93 719 200Q-2400 ~middot 11 0 11 4 44 - - _
~~
719 0000-2400 230 24 254 24 ~
646
720 oooo-o4oo 11 0 11 4 44 - 720 0400-D800 4 0 4 4 - - 16 720 0800-1100 2 0 2 3 6
720 1100-1400 8 7 15 3 t 45 720 1400-1700 5 2 7 3 r
21 720 1700-2400 - 14 0 14 7 n 98
720 0000-2400 73 15 8 8 24 ~
230 -~
Jl Hourly passage rates are based on visual counts as presented in Table 6 Passa~e rates listed are the net upStream passage rate and are taken to be rePtesentativf of time~periods of 3 to 7 hours duration depending upon the frequency~of visual counting conducted each day ~ middot
-50-
I 11 I
1middot middot bull I middotmiddot tv middot ~ ~ middotc h middot 0 n h l - (Vr _ bull middot ~ r bull middot- 1 bull lt tmiddotmiddotmiddot lt bull hl ~ l middot a ~ bull l middot 1-t- ~
bullJ rC t r1 _ - ( bull ~ bull middot l J
~~middot ~ It i I t Al1endix Tab~ bull 4~ kJe1 ampeX a~ size cmrosition of rmiddot t Fork Andreafsky River B r dun salmon ~ch ~ine and carcass samples 1982
middot l j middot I I I I lJ bull t bull bull e ~
) ~ J ~ bull bull bull ~ t t ~ - ~~ ~ ~- ~ Age 3 middot middot 1 middot Jl9e 4 t bull t middot Age 5 bull - rmiddot middot middot middot tlt- Age 6 middot I 1 r ~iDea middot ~s
--~lt---- bull] ------------ _____ __l-1 bull --- --1------i t--__~--A----
- Length_ Length Length Length lagth N middot middot ~tt ~1 (m) 5D N (m) BD N i (IIIli) SO N (11111) 5D N lm SO
---------~-~------- ------------- ------------- ------- ------Beach Seine
I I
Hale 0 35 28 569 34 Fmale 3 2
I 545 38 54 43 539 29 --------------- ---------------
Total 3
Carcass Survey
Male 2 1 Female 6 2
Total 8 2 bull middot-Canbined Gear
Male 2 Fmale 9 2
545
l bull 1495 524
517
495 531
38 89
7 73 14 170
18
7 108 24 224
71
22 52
24 49
551
576 526
574 529
34
27 22
29 25
--------------------------- -----------lbtal 11 2 524 26 332 73 543 34 ------------------ ---------------
11 19
30
35 41
46 60
9 15
24
11 12
23
10 13 --------
106 23
-I middot ~ 1-
611 3l 3 2 582 30 49 39 580 37 562 30 1 1 580 77 61 545 31 --- ---------sao 38 4
I
3
598 bull 32 2 _middot 1 544 29 1
581 25 126 100
622 39 112 34 620 J- - 218 66 ------------
569 3
602 32 5 550 30 2
572 40 7
1
1
2
622
598 600
599
28 330
36 161 28 295
32 456 _____ ___
100
35 65
100
559
SB2 530
547
581 534
550
37
33 25
38
34 28
38
I U1 N t
middot I
I J
~ I I
A(tlendix Table 5 hje ampex a~ size ltXJmp)S~tion of East Md Weat Fork Andreafsky Ri~r king ~~l beeCh ~~~ and carcaaa SIIIIPleampr 1982bull i
___ AIJe __ J 41---- Age 4 hje 5 middot __ ~ t Age 12
Le~th Length ~th ~ Lealgth N i (nin) SD N middot t (IIIII) SD N (nm) SD N (maf CJU N l tJIIB) SD
East Fork BeWb
Male i amiddot Fanale o
Total 1 4
Se11l~
355 bull -
355 middot
Ea~t Fork caicae a auivesr --~
11ale 2 l Female 0
Jbtal 2 1 I ~
---Male t 4 Female 0
lbtal 4 4
37Q -370
Survey
391 -391
-middot middot
- 9 g
- 18
35 n middot - 0
35 61
16 33 - 1
16 34
Conbined Gear and Location -------Male 7 2
0
Total 7 2
380 -
380
24 103 - 10 -- 1-middot 24 113 ----
31 492 53 9 31 31 500 sf ~ 4 -
62 496 52 10 ~middot middot
29 551 38 105 50 - - bull 2
29 ss1 38 109 52
l8 549 42 37 42 1 466 - 3 3
39 546 44 4Q 45
32 545 43 151 46 3 497 52 8 2
35 540 46 159 49
-
671 45 0 - - - 0 - - -620 i 0 - - - 0 - - -~
666 45 0 - - - 0 - - - I
=middot SJ I ~ middot-- middot
691 11 5 111 59 i 2 l 868 u 168 41middot 20 10 820 41 middot ~ 1 ~0 46 ~
700 55 31 15 805 51 5 2 gt899 44 i
706 51 2 2 844 4~ 0 - - -773 29 ~ 7 8 832 53 1 1 988 -710 53 9 10 835 49 1 1 188 -
696 53 13 4 788 61 2 1 868 11 751 61 ~7 8 023 43 4 1 937 51
700 54 40 12 812 52 6 2 914 53 -~middot -
19 66 10 35
29 middot100
181 bull87 Z1 middot13
200 100
76 86 12 14
88 100
216 85 49 15
325 100
Length (na)
-
569 ~12
550
middot
651 823
673
624 800
648
638 754
113 63
middot101
97 56
lOi
llQ 126
127
104 147 ----
656 118 -
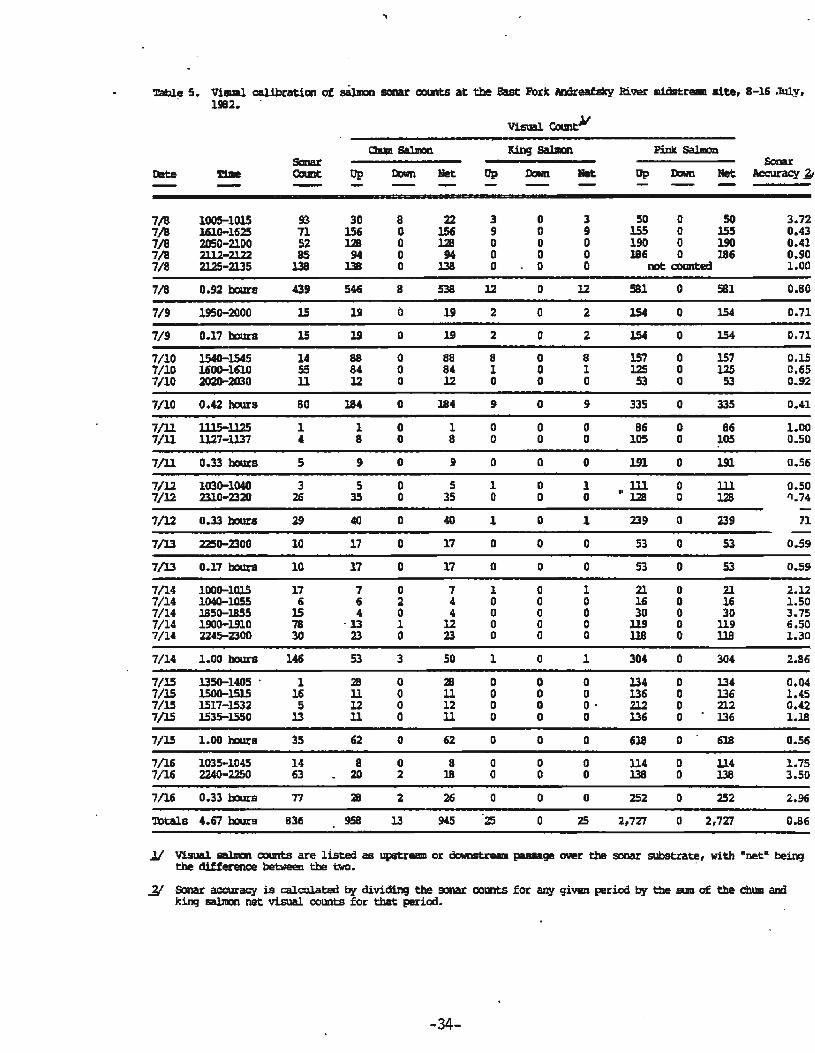

-c
bull u bull a
-c
Figure 18 SUmner chum salmm escaparent past the East Fork Andreafsky River sonar site by sonar sector 1981-1982 Note that sectOr 1 was on the west end in 1981 and on the east end in 1982
110
30 1981
20
10
West 1 8 12
110
30
middote 20 bull a
10
West 1 2 6 1
Sonar Sectors
-37-
East
East
Figure 19 Hourly passage rate of chum king and pink sa1nDn at the East Fork Andreafsky River sonar site based on visual counts 1981-1982
II 0 ~ bull ~
~
bull -~
II 0 bull Q
-= bull
II 0 bull Q
c bull --
1000
0
25
0
1000
20
June
---- 1981
i702 1882
I Chum middotsalmon
bullbull I I J ~ I I r--1 I _
~ King Salmon
bull I I -
Salman
30 10 20
July
-38-
30
An aerial survey was flam of both the Fast and West Fork of the Andreafsky River on 20 July Under fair cmditians 699 king salmon were counted on the west Fork and 1274 on the Fast Fork Cloud cover and wind reduced accuracy on the East Fork portion of the survey which was the latter fork surveyed 1he large mEber of pink Salmon pro~ ted enumeration of sumner dnnn salmon and probably affected accuracy of the king salmm estimate as well Survey counts should be considered minimum estimates A second survey of the West Fork only on 6 August resulted in a count of 836 live king salmcn and 15 carcasses cncemiddot again survey anditions were only rated fair
Similar to the Anvik River water level at the East Fork Andreafsky River sonar site declined steadily frau the initial 0 an reading on 15 June to -106 em on 13 July (Figure 20) Water level was relatively stable for a 10 day period then rose fran -75 an on 22 July to +15 em on 31 July This was a vertical gain of 90 an (3 feet) in 9 days water temperature ranged between 8degC and 16deg c while average daily air temperature ranged between 8degC and 18degC during the period 15 June to 15 August (Figure 20)
Beach seining was sanewhat more effective on the East Fork Andreafsky River than it was on the Anvik ltiver but catches were lower than anticipated lhirty-two sets were made between 20 June and 17 July and 131 chum salmon 33 king salmon and 81 pink salmm were captured An addi tiooal 330 chum salmon and 296 king salmon were sampled by carcass survey The age sex and size composition of sUDDDer chum salmon sampled by beach seine and carcass survey were very smuar (AIpmdix Table 4) ~ Age 4 fEmales daninated both samples accountinq for 43 of the beach seine catch and 52 of the carcasses Although a larger beach seine sample would be desirable it appears that there is no significant difference between the beach seine and carcass sample cauposition and the data is pooled to canpare with the 1981 escapement The pooled sample is 65 female and has an age breakdown of 2 age 3 73 age 4 23 age 5 and 2 age 6 By canparison 1981 escapement was equally divided between age classes 4 and 5 and was 52 female (Figure 2l) bull Strength of the age 4 return was aggtarent for both the Anvik and Fast Fork Andreafsky Rivers in 1982
Too few king salmon were captured by beach seine to allow for a meaningful canparison with the age sex and size canposition of carcasses Pooling the 29 samples fran the beach seine catch 208 carcasses fran the East Fork and 88 carcasses fran the West Fork results in a total sample of 325 king salmon fran the Andreafsky Ri v~r The pxgtled sample was only 15 female and had an age breakdam of 2 age 3 35 age 4 49 age 5 12 age 6 and 2 age middot 7 (Appendix Table 5) The weak return of females was similar to the sex canpositicn of the Anvik River stock Length ranged fran a low of 38011U11 for age 3 males to 937mm for age 7 females The primary differences between king salmon escapement in 1981 and 1982 is the weak showing of age 6 fish in 1982 the presence of age 3 males which were not found in 1981 and the overall FOQr return of females (Figure 22) bull
-39-
-u -CD = -
Figure 20 Water tatp=rature air taqJerature (maxmin average) and water depth measQred at ooon daily at the East Fork Andreafsky River sonar site 1982
20
middot- 10 bull Q
e bull bull 0 -bull
- 20 u bull = -bull 10 bull Q
e 0 -lt 0
- 200 E u -J -Q
middot ~ o----==-----rr----bull -bull bull
-200-t-----------r--P--r-----r- 14 24 4 14
June
24
July
-40-
3 13
Auouat
23
Figure 21 Age and sex composition of East Fork Andreafsky River summer chum salmons 1981-1982 l
75
so 1981 1982 c bull CJ -
I bull ~ 0 I
25
3 4 6 8 3 4 6 8
Age Age
l Includes 126 (28) beach seine samples in 1982 All other samples were carcasses
Figure 22 Age and sex composition of Andreafsky River kfng salmon 1981-1982
I ~ N C I CD
0 CD a
80
110
4 5
1981
6 7
Age 3 4 6
Age 8
I
1982
7
l Data is pooled for both East and West Forks for each year Includes 29 (9) beach seine samples in 1982 All other samples were carcasses
1) Minnow traps and beach seines were not feasible for capturing large nllDbers of juvenile salmon on the Anvik River High water after river ice breakup flooded beaches and restricted attempts to beach seine Future juvenile salmal studies should test the feasibill ty of fyke nets and inclined plane traps both of which are statimary floating gear which could be operated in high water bull
2) Chum salmon fry are still present in the Anvik River two matths after
breakup of river ice Large catches of king salmon fry oca1rred in late July and suggests that they may overwinter in the Anvik River before moving into the Yukon River the follciiing spring Only 3 king salmon smolt were captured but sampling was ineffective during spring breakup and flooding when most of the snolt may have been oubnigrating
3) Escapement to the Anvik River was estimated by side-scan sonar to be 444581 sunmer ch1111 salmon Age 4 was predaninant accounting for 67 of all samples and female$ outnmnbered males 2 to 1 King salmon escapement was not estimated due to poor aerial surveyen conditions carcass samples indicate that the king salJnal escapement was only 28 female with age classes 4 and 5 accounting for the majority of the fish Low returns from the 1982 brood year may result due to the low pLJDber of female spawners he pink salmon run was one of the largest in recent years according to local fishermen and escapement was estimated to be 76800 tased on expansion of visual counts
4) The- accuracy of the 1981 model sonar counter should be investigated ibis may be better accanplished at the East Fork Andreafsky River where all salmon passage can be directed over the sonar substrate and water conditions are usually better for visual observation of fish passage than at the Anvik River
5) More samples of adult chum and king salmon should be collected tyen beach seine at both the Anvik and East Fork Andreafsky Rivers to test the difference between the age sex and size canposition of beach seine and carcass samples
6) Escapement to the East Fork Andreafsky River in 1982 was estiJnated by side-scan sonar to be 181352 sumner chum salmon King and pink salmon were probably responsible for less than 5 of the sonar counts The chtn salmon escapement was 65 female and 73 age 4 An accurate estimate of the king salmon escapement was not obtained but was lcwer than the 1981 esca-penent of 5 343 King salmon beach seine and carcass samples were only 15 female and age 5 accounted for 49 of the total Pink salmon escapenent was at a record level and approached 1 million fish based on visually observed passage rates
7) Accuracy of salmon escapement data fran the East Fork Andreafsky River can be improved by implementing the following procedures
-43-
a) One sonar substrate should be installed at the midstream site at the start of the season regardless of water conditions Weir fencing should be installed as soon as pgtssible to prevent sa1mon passsage around the ends of the substrate
b) Visual counting periods should be scheduled throughout the day and the crew held responsible for attempting visual counts during those periods This will insure that the equipnent is not left unattended for more than a few hours at any one time which was a problem in 1982 when a large nlJDber of salmm agarently passed over the smar counters while the crew was JUrchasing supplies in the villaqe
c) Species cODp)siticn is an impJrtant factor affecting the accuracy of the sonar data especially in even numbered years when pink salmon can outnumber summer chums bf five to one Increased visual counting may help to improve allocation of sonar counts Fishing a trammel net may be a feasible method of estimating species canposition and also provide an unbiased estimate of age sex and size composition for ch111 and king salmm A trap with funnel opening and weir lead-in made from fence stakes and rectangular fencing may accomplish these same objectives All three methods of estimating species canpostion should be cmducted in 1983
8) The feasibility of installing a full weir across the East Fork Andreafsky River should be investigated in 1983 by locating potential weir sites and monitoring water depth and velocity throughout the season A weir could provide daily salmon escapement data by species age sex and size as opposed to the limited information obtained by side-scan sonar in 1981 and 1982
-44-
-middot
LITERATORE CITED
Barton Louis H 1982a EhlJileraticn of fall chum salmm by side-scanning sonar in the Sheenjek River in 1981 Yukon Salmon Escapenent Report No 13 Alaska Deptmiddotof Fish and Game Commercial Fisheries Division Fairbanks 22 pp
---middot 1982b Side scan sonar (1981-16 sector model) Unpublished memorand1111 dated 8 December Alaska Dept of Fish and Game Conunercial Fisheries Divisim Fairbanks 6 pp
Buklis Lawrence s 1981 Yukon River Salmon Studies Anadromous Fish Conservation Act CcIIpletion report for period July 1 1977 to June 30 1981 Alaska Dept of Fish and Game Juneau 50 pp
---middotbull 1982a Anvik River sumner chum salmon stock biology Infotmational Leaflet No 204 Alaska Dept of Fish and Game Juneau 50 pp
---middot l982b Anvik Andreafsky and Tanana River salmon escapement studies 1981 Yukon Salmon Escapement Report No 15 Alaska Dept of Fish and Game Qmnercial Fisheries Divisicn Anchorage 40 pp
Flagg Loren B 1981 Sockeye salmcn smolt dye_ narking and recovery tests in the Kasilof River Alaska Dept of Fish and Game FRED Division Soldotna 8 pp
Geiger Michael F 1982 Yukon salmon season sunmary repJrt Unpublished memorancbn dated 11 OCtober Alaska Dept of Fish and Game Comnercial Fisheries Divisim Anchorage 19 pp
McBride Doug and David Mesiar 1982 Nushagak sonar enumeration project 1981 Bristol Bay Data Report No 88 Alaska Dept of Fish and Game Catmercial Fisheries Divisicn Anchorage 24 pp
Menin Albert 1982 Letter to Bill Aivey Alaska Dept of Fish and Game
~cial Fisheries Division Anchorage dated 25 February Bendix Oceanics Divisicn Sylmar california 4 pp
Ricker WE 1975 Caupltaticn and interpretaticn of biological statistics of fish populations Department of Environment Fisheries and Marine Bulletin No 191 ottawa canada bull 382 pp
Seiler David Steve Neuhauser and Mike Ackley 1981 Ucentreamdownstream salmonid trapping project 1977-1980 Progress Report No 144 Jept of Fisheries washington 191 pp
Todd IS 1966 A technique for the enwneration of chum salmon fry in the Fraser River British Columbia can Fish Cult 38 3-35
-45-
Appendix A Method of adjusting daily sonar counts for periods of defecti equipoent or milling salmon at the Anvik River middotsonar site 1982
4July East bank sonar counter operational fran 0000 to 1000 west bank sonar counter operational fran 1200 to 2400 Sonar counts expanded to full 24 hour equivalent based on the average passage for that bank and time period during the- preceeding 9 day period
Fast Bank 74 625-73
ifest Bmk
5 July
74_ 625-73
Q000-1000 4230 Actual Count OOOQ-1000 335 Average of Daily East Bank total
126Z7 Estimated East Bank Total for 4 July
120Q-2400 5187 Actual Count 1200-2400 585 Average of Daily west Bank total
8866 Estimated West Bank Total for 4 July
West bank sonar counter operational all day with a total sonar count of 13ll3 Fast bank sonar counter inoperable all day The west bank averaged 584 of the daily total escapement for the period 25 Jur through 3 July Expanding the west bank count to the daily tot escapement and then subtracting the west bank and midstreampu contribution results in an estimated east bank count of 7300 salmon
6 July East bank sonar counter operational from 1700 to 2400 with a total sonar count of 2145 Ibis time period averaged 292 of the daily east bank escapement for the period 25 JlUle through 3 July Expanding the 7 hour count to the full 24 hour equivalent results in an estimated east bank count of 7 346
The west bank sonar counter was inoperable all day The east bank averaged 33 of the total daily escapement for the period 25 June through 3 July Expanding the east bank~ courit (7 346) to the daily total escapement and then subtracting the east bank and midstream contribution results in an estimated west bank count of 12891
-46-
7 July - 12 July East bank sonar counter operational continuously fran 7 July through 12 July while the west bank counter was inoperable The_ east bank averaged 33 of the total daily escapement for the period 25 June throuqh 3 July Expmding the daily east bank count to the daily total escapement and then subtracting the east bank and midstream contribution results in an estimated west bank count for each day as follCMS
13 July
7 July 8 July 9 July 10 July ll July 12 July
8300 15804 23469 14988 11575 20961
East bank sonar counter operational all day West bank sonar counter operational fran 0000 to 1200 This time period averaged 415 of the daily west bank count for the period 25 June through 3 July Expanding the lZ hour count to the full 24 hour equivalent results in an estimated west bank count of 9846 salmon
14 July East bank sonar counter operational all day West bank sonar counter operational fran 1200 to 2400 lhis time period averaged 585 of the daily west bank count for the period 25 June through 3 July Expanding the 12 hour count to the full 24 hour equivalent results in an estmated west bank count of 14 middot280 saJJoon
24 July - 26 July East bank sonar counts were inflated due to milling salmn but west bank counts cmtinued to be accurate due to faster water velocity and normal salmon swimming speeds Poor weather conditions prohibited visual calibration of sonar counts Daily escapement estimates were obtained by expanding west bank sonar cotmts The west bank averaged 534 of total daily escapanent for the period 25 June - 3 July and 15 July - 23 July Expanding the west bank count to the daily total escapement and then subtracting the west bank and midstream contribution results in an estimated east bank count of 2074 salnxm on 24 July 813 on 25 July and 802 on 26middot July
-47- middot
Appendix Table 1 Age sex and size canposition of Anvik River sunmer chum salmon beach seine and carcass samples 1982
Agel Age 4 middot Pge 5 Age6 cntgtined Ages ------ ------1--- ---l------ 1 -- ----------
Length Length Length LeBJth Length N (JIIIl) SD N (JIIIl) SD N (nm) SD N (11111) SD N (IIIII) SD ----------------- --------- -- -----
Beach Seine ------Male 0 ll 23 598 21 16 609 33 0 22 39 602 Z1 Female 2 4 528 11 16 28 540 28 30 568 2S 0 35 61 553 29 - ----- ----------Total 2 4 528 11 29 51 566 38 26 46 582 34 0 57 100 572 37
Carcass Survey -----------Male 4 1 521 19 62 19 580 22 28 9 618 36 1 645 95 29 590 35 Female 15 5 520 23 165 ~1 541 28 48 15 560 26 2 1 5~ 0 230 71 544 ~9 ------------ --------- -------- ---Total 19 6 520 22 227 70 552 31 76 23 581 41 3 1 582 55 325 100 557 37
Combined Gear ----Male 4 1 521 19 75 20 583 22 37 10 615 35 1 645 117 31 592 3t Female 17 4 521 22 181 t7 541 28 65 17 562 26 2 550 0 265 69 545 29 ---------------- -------- ------- ------- --Total 21 6 521 21 256 67 554 32 102 Z1 582 39 3 1 582 55 382 100 559 37 ------------- -------- --------- -- ----------
AilJendix Table 2 Age sex and size canpgtsition of Mvik River king salmon carcass samples 1982 1
Age4 AgeS Age 6 canbined Ages _2 ____ __ _z__ __ ~ ____ _z ___ ----- I Length middotLength Length Length
+gt N (nm) so N (mn) so N (mn) SD N (om) so 10 I ------------ ------------- --------
Male 47 34 560 59 47 34 679 6 4 814 130 100 72 631 97
Female 1 1 660 5 4 792 32 23 840 48 38 28 829 61 -----Total 48 35 562 60 52 38 690 38 28 836 66 138 100 686 125 -----------middot --------- ---- ---- Includes one 1ivesample collected by beach seine bull
-
Appendix Table 3 Expansion of chum and king ~ visual counts at the Fast Fork Andreafsky ~iver midstream site to estimate daily escapement 7-20 July 1982 Jl
~2 ~l
Hourly Passage Rat~ liL 1gt
Time Of Estimated Date Period Chum King Total Hours Fscapement
__
717 oooo-o1oo 108 0 108 7 756 717 0700-1300 8 0 8 6 48 717 1300-1700 29 3 32 4 128 717 1700-2000 123 1 124 --~ 372 717 2000~2400 56 0 56
i -4 224
717 0000-2400 64-8 08 656 24 1528 -------middot-
718 0000-0400 S6 0 56 4 224 718 0400-1100 1 -4 11 7 n 7lB 1100-1400 27 3 30 3 90 7lB 1400-1700 52 2 54 3 162 7lB 1700-2000 53 1 54 3 162 7lB 2000-2400 72 6 78 4
~-312
-
718 0000-2400 445 27 472 24middot 1027
719 oooo-o40o 72 6 78 4 312 719 0400-oBOO 20 3 23 4 92 719 0800-1100 5 0 5 3 15 719 110Q-1400 10 1 11 3 33 719 1400-1700 16 3 19 3 57 719 170Q-2000 27 4 31 3 93 719 200Q-2400 ~middot 11 0 11 4 44 - - _
~~
719 0000-2400 230 24 254 24 ~
646
720 oooo-o4oo 11 0 11 4 44 - 720 0400-D800 4 0 4 4 - - 16 720 0800-1100 2 0 2 3 6
720 1100-1400 8 7 15 3 t 45 720 1400-1700 5 2 7 3 r
21 720 1700-2400 - 14 0 14 7 n 98
720 0000-2400 73 15 8 8 24 ~
230 -~
Jl Hourly passage rates are based on visual counts as presented in Table 6 Passa~e rates listed are the net upStream passage rate and are taken to be rePtesentativf of time~periods of 3 to 7 hours duration depending upon the frequency~of visual counting conducted each day ~ middot
-50-
I 11 I
1middot middot bull I middotmiddot tv middot ~ ~ middotc h middot 0 n h l - (Vr _ bull middot ~ r bull middot- 1 bull lt tmiddotmiddotmiddot lt bull hl ~ l middot a ~ bull l middot 1-t- ~
bullJ rC t r1 _ - ( bull ~ bull middot l J
~~middot ~ It i I t Al1endix Tab~ bull 4~ kJe1 ampeX a~ size cmrosition of rmiddot t Fork Andreafsky River B r dun salmon ~ch ~ine and carcass samples 1982
middot l j middot I I I I lJ bull t bull bull e ~
) ~ J ~ bull bull bull ~ t t ~ - ~~ ~ ~- ~ Age 3 middot middot 1 middot Jl9e 4 t bull t middot Age 5 bull - rmiddot middot middot middot tlt- Age 6 middot I 1 r ~iDea middot ~s
--~lt---- bull] ------------ _____ __l-1 bull --- --1------i t--__~--A----
- Length_ Length Length Length lagth N middot middot ~tt ~1 (m) 5D N (m) BD N i (IIIli) SO N (11111) 5D N lm SO
---------~-~------- ------------- ------------- ------- ------Beach Seine
I I
Hale 0 35 28 569 34 Fmale 3 2
I 545 38 54 43 539 29 --------------- ---------------
Total 3
Carcass Survey
Male 2 1 Female 6 2
Total 8 2 bull middot-Canbined Gear
Male 2 Fmale 9 2
545
l bull 1495 524
517
495 531
38 89
7 73 14 170
18
7 108 24 224
71
22 52
24 49
551
576 526
574 529
34
27 22
29 25
--------------------------- -----------lbtal 11 2 524 26 332 73 543 34 ------------------ ---------------
11 19
30
35 41
46 60
9 15
24
11 12
23
10 13 --------
106 23
-I middot ~ 1-
611 3l 3 2 582 30 49 39 580 37 562 30 1 1 580 77 61 545 31 --- ---------sao 38 4
I
3
598 bull 32 2 _middot 1 544 29 1
581 25 126 100
622 39 112 34 620 J- - 218 66 ------------
569 3
602 32 5 550 30 2
572 40 7
1
1
2
622
598 600
599
28 330
36 161 28 295
32 456 _____ ___
100
35 65
100
559
SB2 530
547
581 534
550
37
33 25
38
34 28
38
I U1 N t
middot I
I J
~ I I
A(tlendix Table 5 hje ampex a~ size ltXJmp)S~tion of East Md Weat Fork Andreafsky Ri~r king ~~l beeCh ~~~ and carcaaa SIIIIPleampr 1982bull i
___ AIJe __ J 41---- Age 4 hje 5 middot __ ~ t Age 12
Le~th Length ~th ~ Lealgth N i (nin) SD N middot t (IIIII) SD N (nm) SD N (maf CJU N l tJIIB) SD
East Fork BeWb
Male i amiddot Fanale o
Total 1 4
Se11l~
355 bull -
355 middot
Ea~t Fork caicae a auivesr --~
11ale 2 l Female 0
Jbtal 2 1 I ~
---Male t 4 Female 0
lbtal 4 4
37Q -370
Survey
391 -391
-middot middot
- 9 g
- 18
35 n middot - 0
35 61
16 33 - 1
16 34
Conbined Gear and Location -------Male 7 2
0
Total 7 2
380 -
380
24 103 - 10 -- 1-middot 24 113 ----
31 492 53 9 31 31 500 sf ~ 4 -
62 496 52 10 ~middot middot
29 551 38 105 50 - - bull 2
29 ss1 38 109 52
l8 549 42 37 42 1 466 - 3 3
39 546 44 4Q 45
32 545 43 151 46 3 497 52 8 2
35 540 46 159 49
-
671 45 0 - - - 0 - - -620 i 0 - - - 0 - - -~
666 45 0 - - - 0 - - - I
=middot SJ I ~ middot-- middot
691 11 5 111 59 i 2 l 868 u 168 41middot 20 10 820 41 middot ~ 1 ~0 46 ~
700 55 31 15 805 51 5 2 gt899 44 i
706 51 2 2 844 4~ 0 - - -773 29 ~ 7 8 832 53 1 1 988 -710 53 9 10 835 49 1 1 188 -
696 53 13 4 788 61 2 1 868 11 751 61 ~7 8 023 43 4 1 937 51
700 54 40 12 812 52 6 2 914 53 -~middot -
19 66 10 35
29 middot100
181 bull87 Z1 middot13
200 100
76 86 12 14
88 100
216 85 49 15
325 100
Length (na)
-
569 ~12
550
middot
651 823
673
624 800
648
638 754
113 63
middot101
97 56
lOi
llQ 126
127
104 147 ----
656 118 -

-
Appendix Table 3 Expansion of chum and king ~ visual counts at the Fast Fork Andreafsky ~iver midstream site to estimate daily escapement 7-20 July 1982 Jl
~2 ~l
Hourly Passage Rat~ liL 1gt
Time Of Estimated Date Period Chum King Total Hours Fscapement
__
717 oooo-o1oo 108 0 108 7 756 717 0700-1300 8 0 8 6 48 717 1300-1700 29 3 32 4 128 717 1700-2000 123 1 124 --~ 372 717 2000~2400 56 0 56
i -4 224
717 0000-2400 64-8 08 656 24 1528 -------middot-
718 0000-0400 S6 0 56 4 224 718 0400-1100 1 -4 11 7 n 7lB 1100-1400 27 3 30 3 90 7lB 1400-1700 52 2 54 3 162 7lB 1700-2000 53 1 54 3 162 7lB 2000-2400 72 6 78 4
~-312
-
718 0000-2400 445 27 472 24middot 1027
719 oooo-o40o 72 6 78 4 312 719 0400-oBOO 20 3 23 4 92 719 0800-1100 5 0 5 3 15 719 110Q-1400 10 1 11 3 33 719 1400-1700 16 3 19 3 57 719 170Q-2000 27 4 31 3 93 719 200Q-2400 ~middot 11 0 11 4 44 - - _
~~
719 0000-2400 230 24 254 24 ~
646
720 oooo-o4oo 11 0 11 4 44 - 720 0400-D800 4 0 4 4 - - 16 720 0800-1100 2 0 2 3 6
720 1100-1400 8 7 15 3 t 45 720 1400-1700 5 2 7 3 r
21 720 1700-2400 - 14 0 14 7 n 98
720 0000-2400 73 15 8 8 24 ~
230 -~
Jl Hourly passage rates are based on visual counts as presented in Table 6 Passa~e rates listed are the net upStream passage rate and are taken to be rePtesentativf of time~periods of 3 to 7 hours duration depending upon the frequency~of visual counting conducted each day ~ middot
-50-
I 11 I
1middot middot bull I middotmiddot tv middot ~ ~ middotc h middot 0 n h l - (Vr _ bull middot ~ r bull middot- 1 bull lt tmiddotmiddotmiddot lt bull hl ~ l middot a ~ bull l middot 1-t- ~
bullJ rC t r1 _ - ( bull ~ bull middot l J
~~middot ~ It i I t Al1endix Tab~ bull 4~ kJe1 ampeX a~ size cmrosition of rmiddot t Fork Andreafsky River B r dun salmon ~ch ~ine and carcass samples 1982
middot l j middot I I I I lJ bull t bull bull e ~
) ~ J ~ bull bull bull ~ t t ~ - ~~ ~ ~- ~ Age 3 middot middot 1 middot Jl9e 4 t bull t middot Age 5 bull - rmiddot middot middot middot tlt- Age 6 middot I 1 r ~iDea middot ~s
--~lt---- bull] ------------ _____ __l-1 bull --- --1------i t--__~--A----
- Length_ Length Length Length lagth N middot middot ~tt ~1 (m) 5D N (m) BD N i (IIIli) SO N (11111) 5D N lm SO
---------~-~------- ------------- ------------- ------- ------Beach Seine
I I
Hale 0 35 28 569 34 Fmale 3 2
I 545 38 54 43 539 29 --------------- ---------------
Total 3
Carcass Survey
Male 2 1 Female 6 2
Total 8 2 bull middot-Canbined Gear
Male 2 Fmale 9 2
545
l bull 1495 524
517
495 531
38 89
7 73 14 170
18
7 108 24 224
71
22 52
24 49
551
576 526
574 529
34
27 22
29 25
--------------------------- -----------lbtal 11 2 524 26 332 73 543 34 ------------------ ---------------
11 19
30
35 41
46 60
9 15
24
11 12
23
10 13 --------
106 23
-I middot ~ 1-
611 3l 3 2 582 30 49 39 580 37 562 30 1 1 580 77 61 545 31 --- ---------sao 38 4
I
3
598 bull 32 2 _middot 1 544 29 1
581 25 126 100
622 39 112 34 620 J- - 218 66 ------------
569 3
602 32 5 550 30 2
572 40 7
1
1
2
622
598 600
599
28 330
36 161 28 295
32 456 _____ ___
100
35 65
100
559
SB2 530
547
581 534
550
37
33 25
38
34 28
38
I U1 N t
middot I
I J
~ I I
A(tlendix Table 5 hje ampex a~ size ltXJmp)S~tion of East Md Weat Fork Andreafsky Ri~r king ~~l beeCh ~~~ and carcaaa SIIIIPleampr 1982bull i
___ AIJe __ J 41---- Age 4 hje 5 middot __ ~ t Age 12
Le~th Length ~th ~ Lealgth N i (nin) SD N middot t (IIIII) SD N (nm) SD N (maf CJU N l tJIIB) SD
East Fork BeWb
Male i amiddot Fanale o
Total 1 4
Se11l~
355 bull -
355 middot
Ea~t Fork caicae a auivesr --~
11ale 2 l Female 0
Jbtal 2 1 I ~
---Male t 4 Female 0
lbtal 4 4
37Q -370
Survey
391 -391
-middot middot
- 9 g
- 18
35 n middot - 0
35 61
16 33 - 1
16 34
Conbined Gear and Location -------Male 7 2
0
Total 7 2
380 -
380
24 103 - 10 -- 1-middot 24 113 ----
31 492 53 9 31 31 500 sf ~ 4 -
62 496 52 10 ~middot middot
29 551 38 105 50 - - bull 2
29 ss1 38 109 52
l8 549 42 37 42 1 466 - 3 3
39 546 44 4Q 45
32 545 43 151 46 3 497 52 8 2
35 540 46 159 49
-
671 45 0 - - - 0 - - -620 i 0 - - - 0 - - -~
666 45 0 - - - 0 - - - I
=middot SJ I ~ middot-- middot
691 11 5 111 59 i 2 l 868 u 168 41middot 20 10 820 41 middot ~ 1 ~0 46 ~
700 55 31 15 805 51 5 2 gt899 44 i
706 51 2 2 844 4~ 0 - - -773 29 ~ 7 8 832 53 1 1 988 -710 53 9 10 835 49 1 1 188 -
696 53 13 4 788 61 2 1 868 11 751 61 ~7 8 023 43 4 1 937 51
700 54 40 12 812 52 6 2 914 53 -~middot -
19 66 10 35
29 middot100
181 bull87 Z1 middot13
200 100
76 86 12 14
88 100
216 85 49 15
325 100
Length (na)
-
569 ~12
550
middot
651 823
673
624 800
648
638 754
113 63
middot101
97 56
lOi
llQ 126
127
104 147 ----
656 118 -