anxiety towards mathematics in the … · garcía & mato & muñoz & rodríguez anxiety...
TRANSCRIPT

© RIDHyC, Nº 3.:55-75 (Diciembre, 2016) · ISSN (2386-7795) www.didacticahumanidadesyciencias.com
Recibido: 17/12/2016 Aceptado:21/12/2016
ANXIETY TOWARDS MATHEMATICS IN THE STUDENTS OF THE CONALEP CAMPUS VERACRUZ-1: A COMPARATIVE STUDY OF THE MORNING AND AFTERNOON SHIFTS IN VERACRUZ, MÉXICO Ansiedad hacia las matemáticas en los estudiantes del CONALEP del Campus Veracruz-1: Un estudio comparativo de los grupos de la mañana y de la tarde en Veracruz, México ARTURO GARCÍA-SANTILLÁN Profesor Business School Universidad Cristobal Colón (México) [email protected] DORINDA MATO-VÁZQUEZ Profesora Contratada Doctora de Educación Matemática Universidad de A Coruña [email protected] JESÚS MIGUEL MUÑOZ CANTERO Profesor Titular de Métodos Universidad de A Coruña [email protected] DANIEL RODRÍGUEZ ORTEGA Profesor Business School Universidad Cristobal Colón (México) [email protected] Resumen El presente estudio tuvo el propósito de medir el nivel de ansiedad hacia las matemáticas en alumnos de bachillerato del Colegio de Educación Profesional Técnica del Estado de Veracruz (CONALEP) del plantel Veracruz I (México), en los turnos matutino y vespertino. Para ello se utilizó la escala de Muñoz y Mato-Vázquez (2007) formada por 25 ítems agrupados en cinco dimensiones: ansiedad hacia la evaluación, la temporalidad de los exámenes, la comprensión de problemas matemáticos, los números y las operaciones matemáticas y situaciones matemáticas del mundo real. El estudio se fundamentó además, en los recientes hallazgos empíricos de García-Santillánet al.(2013, 2014, 2015). Se abordó desde el paradigma cuantitativo no experimental de corte transversal, utilizando el análisis factorial exploratorio con extracción de componentes como técnica para la medición de los datos (KMO, X2, α= 0.05). En ambos casos el valor de X2 mostró evidencias suficientes para rechazar la Hipótesis nula (Ho). La consistencia interna del test arrojó, para los datos recolectados de los alumnos del turno matutino α= 0.849 (agrupada) y 0.793 individual, y para el turno vespertino α= 0.849 (agrupada) y 0.793 individual, lo cual es muy aceptable en términos
56 RIDHyC Nº 3.:56-75 (Diciembre, 2016)
teóricos (Hair, Anderson, Tatham and Black, 1999). El resultado nos muestra que el mayor nivel de ansiedad que presentan los alumnos de ambos turnos es parecido en relación a ANSIEV, así como a ANSINOM. En los restantes tres factores difieren, ya que el turno matutino presenta mayor ansiedad en ANSICOPM, seguido de ANSITEM y ANSISIT mientras que el turno vespertino presenta mayor ansiedad en ANSITEM , ANSISIT y ANSICOPM. Palabras clave: Ansiedad a las matemáticas, habilidades matemáticas, temporalidad hacia las matemáticas, evaluación hacia las matemáticas. Abstract The present study had as aim to measure the anxiety level towards mathematics in the students of the College of Technical Professional Study in the State of Veracruz High School (CONALEP for its acronym in Spanish) on Veracruz I campus in the morning and afternoon shifts. For this purpose, the Muñoz and Mato-Vázquez (2007) scale was used; it is formed by 25 items grouped in five dimensions: anxiety towards evaluation, temporality, understanding of mathematical problems, number and mathematical operations and real life situations. The study was also based on the recent empirical findings of García-Santillán, Escalera-Chávez and Venegas-Martínez (2013, 2014, 2015). It was approached from a non-experimental transversal-cut quantitative paradigm using the exploratory factor analysis with component extraction as the technique for data measurement (KMO, X2, α= 0.05). In both cases the value of X2showed enough evidence to reject the null hypothesis (Ho). The internal consistency of the test showed, for the gathered data of the morning shift students α= 0.915 (grouped) and 0.775 individually, and for the afternoon shift α= 0.916 (grouped) and 0.792 individually, which are very acceptable in theoretical terms (Hair, Anderson, Tatham and Black, 1999). The result shows the highest level of anxiety among students in both shifts is similar in relation to ANSIEV as well as ANSINOM. In the remaining three factors, the morning shift shows greater anxiety in ANSICOPM followed by ANSITEM and ANSISIT, while the evening shift presents higher anxiety in ANSITEM, ANSISIT and ANSICOPM. Keywords: Anxiety towards mathematics, mathematical skills, temporality towards mathematics, evaluation towards mathematics. 1. INTRODUCTION In Mexico, the education has been a key point in the country´s agenda. Since the mid-70s, when the first national evaluation of learning took place, the existence of serious problems in the student´s formation at all levels was already glimpsed. In the 2000s there was a strategic turn on the education evaluation with the creation of the National Institute for the Education Evaluation (INEE for its acronym in Spanish). We should remember that the INEE goes together with the country´s restructures and its goal is to evaluate the quality and performance of the national education system at the pre-school, elementary, middle-school and high-
García & Mato & Muñoz & Rodríguez Anxiety towards mathematics 57
school levels, for which it carries out diagnostic type tests with multiple choice items and test items processing procedures (item response theory): ENLACE and EXCALE, whose results showed high index of failure, mainly in mathematics and reading. Recently, the results of the PISA (Program for International Student Assessment) study are mentioned, since they offer a comparison between the education systems of the Organization for Economic-Cooperation and Development (OECD). The results of PISA 2012 showed alarming information for the country because the basic mathematics level achieved by 15-years-old students was 413 points (under Portugal, Spain and Chile), whereas 55% of students did not achieve a basic level. This means that a Mexican student with the highest performance has the same score as a regular one in Japan (which is in the top ten). Also, this study alludes to the inequity in the distribution of educational resources among the schools; Mexico has the highest one in the OECD. Furthermore, the PISA report also shows that 75% of the country´s students are concerned with the difficulty of mathematics. Not in vain, Mexico has the highest anxiety rate of all the members of the OECD towards this knowledge. This factor is determinant in choosing a professional career where complex calculations can be avoided. It is relevant that according to the analysis named “Desertion in high-school. The case of Conalep and the admission process in the metropolitan area of Mexico city”, made by Cuellar (2013), the Conalep is the institution with the highest presence of the technical sector in the country and it is the high-school with the highest desertion index in Mexico with a 21%, meaning that 2 of every 10 students drop out because of low performance and failing subjects, so that the terminal efficiency is 42%, which is equivalent to 18 points below the national average in the 2010-2011period. The question that comes up is: do mathematics cause anxiety that predisposes the student?, that is to say, are panic attacks or fear preventing the students from performing mathematical calculations in public? To this questions Pérez-Tyteca, Castro, Segovia, Castro and Fernández (2007) give a definition of anxiety as a feeling present in the students who are in evaluation situations or when facing subjects that are complex to them, such as the ones where mathematical calculation are made. Along those lines, Richardson and Suinn (1972) define anxiety towards mathematics as the emotional state of tension and angst that affect the correct manipulation of numbers for the solution of mathematical problems in daily and academic activities. Meanwhile, Ashcraft (2002) points out that anxiety towards mathematics is a feeling of tension, apprehension or fear that affects the performance in mathematics. His research is based in the Mathematics Anxiety Ratings Scale (MARS) published by Richardson and Suinn (1972) where anxiety is measured in daily-life situations. This research was pioneer by studying if anxiety influences the mental process during the resolution of problems.
58 RIDHyC Nº 3.:56-75 (Diciembre, 2016)
At the end of the research, they determined that anxiety is present when making calculations with more than one digit. They also managed to prove that the effects of anxiety towards mathematics are linked with the cognitive operations that depend on the work memory capacity or operational memory, which is responsible of the storage and management of information. Thus, Ashcraft (2002) states that people who are highly anxious towards mathematics end with a lesser competence and achievement, since by having a negative motivation (-.47 and -.82) they tend to avoid the subjects and professions that depend on mathematics or quantitative skills. With this idea, Tejedor and Santos (2009) conducted a study in Spain where the correlation of this variable is measured against the performance on a sample of sixth grade kids to determine which factors predict anxiety towards mathematics. For the data gathering they applied a combination of the four instruments mentioned below: 1.- The STAIC scale (State-Trait Anxiety Inventory for Children) made by Spielberger, Gorsuch, Lushene, Vagg, and Jacobs (1983), that measures the state anxiety (caused by a concrete situation) and the trait anxiety (personality trait of the subjects). 2.- TheAMAS (Abbreviated Math Anxiety Scale) developed by Hopko, Mahadevan, Bare and Hunt (2003), to analyze anxiety towards mathematics from a reduced version of the MARS (posed by Richardson and Suinn, 1972). 3.- The Evaluation for Mathematical Performance, for which 36 operations were solved, which were basic sum and multiplication operations of one and two digits with a time limit of 90 seconds. The number of correctly solved operations is considered performance (Tejedor and Santos, 2009). 4.- The Questionnaire of socio-demographic and academic data with the purpose of gathering other kind of relevant information. For this, a questionnaire about age, gender, visual problems, literacy and mathematical self-confidence was applied (Tejedor and Santos, 2009). The results showed a correlation between anxiety and performance; to more anxiety the students had worse performance. It was also detected that students with more anxiety towards mathematics have a negative perception of their mathematical skills. The subjects with higher levels of state-anxiety and trait-anxiety have higher levels of anxiety towards mathematics. With regards to the gender variable, it showed no correlation either with performance or with anxiety. The former leads us to the question: what factors explain the level of anxiety in the students of the CONALEP Veracruz-1 campus?, meaning, what is the structure of latent variables that better explain the level of anxiety towards mathematics? Hence the aim is to identify the structure of latent variables that better explain the level of anxiety towards mathematics. For the study a general hypothesis is posed:
García & Mato & Muñoz & Rodríguez Anxiety towards mathematics 59
Ho: There is not a group of latent variables that explain anxiety towards mathematics H1: There is a group of latent variables that explain anxiety towards mathematics And particularly H2: Anxiety towards mathematics can be explained by at least one factor. To understand from a theoretical point of view the variables involved in this phenomenon, the next step is to make an analysis and discussion of the theoretical and empirical fundaments that explain the object of this research, hence a literature review is presented next. 2. LITERATURE REVIEW Several studies have been made to understand the factors related with a low performance in mathematics. Some focus on the anxiety of the student towards such subjects, among these, the scale of Fennema and Sherman (1976) stands out since it is one of the most known and for that, it has been replicated and taken as a basis for adaptation by several studies around the world. The scale consists of 12 items which consider that when making mathematical operations the person presents feelings of fear, nerves and anxiety. It is subdivided in three scales: anxiety towards the resolution of problems, anxiety towards exams and global anxiety towards mathematics. This research determined that the level of anxiety among men and women is different. Nortes and Nortes (2014) used the anxiety scale of Fennema-Sherman and the Auzmendi (1992) scale of attitude towards statistic for future elementary teachers in the Murcia University. This scale is one of the most popular in the Spanish language and it allows the measurement of anxiety, liking, utility, motivation and thrust that the students perceive towards this subject. Nortes and Nortes (2014) applied the scales to the students of the courses 2012-13 and 2013-14. The results showed that the students do not like mathematics much; however they find it useful. 15% of students have very high anxiety, which can negatively affect the mathematical teaching process and an 80% have medium/high anxiety. By gender, women tend to show higher anxiety than men. Numerous research projects have used the Fennema and Sherman scales; among those are Pérez-Tyteca (2012) that used the previous studies of Pérez-Tyteca et al.(2007) in the study of mathematical anxiety of students that enter the University of Granada. She raised a model where anxiety towards exams, anxiety towards the solving of problems and general anxiety towards mathematics impact by increasing anxiety towards mathematics. In their research, they conclude that a high mathematical anxiety is related with a low self-confidence, also the higher the usefulness of mathematics is to the subject in his daily life, the higher is the selection of mathematics-related careers. Regarding gender, in their study women have higher anxiety than men.
60 RIDHyC Nº 3.:56-75 (Diciembre, 2016)
In another research Pérez-Tyteca and Castro (2011) showed that students with a high performance showed low levels of anxiety, on the contrary, students with higher mathematical anxiety present lower confidence in their mathematical skills and reach a lower performance level in the courses they take. In China, Hoet al.(2000), made a study focused on measuring anxiety and how this affects mathematical performance. To compare affective and cognitive dimensions, they took as basis the studies of Liebert and Morris (1967), which allowed them to identify the level of anxiety, as well as the relation with mathematics in sixthgrade students in China, Taiwan and the United States. It is significant to point out that Liebert and Morris (1967) presented a model that distinguishes two anxiety dimensions: affective and cognitive. The first refers to the emotion of anxiety as nervousness, tension, fear and physiological reactions to the tests. The second dimension is the component of anxiety concern that manifests with suppositions of negative thoughts and self-depreciation. The interest of the study is to value the differences among the students of each country regarding their attitudes, beliefs and emotions about mathematics. Also in Spain, Muñoz and Mato-Vázquez (2007) developed a scale to measure anxiety towards mathematics in private and public middle-schools, for which their sample was 1220 students. The instrument they created has 24 questions grouped in five dimensions: anxiety towards evaluation, anxiety towards temporality, anxiety towards the understanding of mathematical problems, anxiety towards number and mathematical operations and anxiety towards mathematical situations in real life. This instrument has a Cronbach alpha of 0.954, which makes it theoretically acceptable. Making use of the Muñoz and Mato-Vázquez instrument, García-Santillán, Escalera-Chávez, Moreno-García and Santana-Villegas (2016) investigated the factors that explain anxiety in the students of the Industrial and Technological Services Study Center No. 15 in the city of Veracruz. The chosen sample was of 1000 students of the first, third and fifth semesters. The results show that the multiple correlation square of the anxiety towards mathematical situations in real life (ANSISIT) factor is low (27%); which means that it causes very little anxiety in students. The remaining 73% of the variance can be explained by a type 1 error. This variability also affects the anxiety towards evaluation (ANSIEV) and anxiety towards temporality (ANSITEM) factors. On their recommendations, they suggest making a confirmatory factorial analysis of the data gathering instruments in order to determine the group of elements that better adjusts to the data. The results of García-Santillán, Escalera-Chávez, Moreno-García and Santana-Villegas (2016) are consistent with the ones gotten by Gairín, 1990; Schoenfeld, 1992; Mcleod, 1992 and 1994; Miranda, Fortes and Gil, 1998; Gómez-Chacón, 1997, 2000; who proved that anxiety is a factor that prevents students from reaching a good performance in the learning
García & Mato & Muñoz & Rodríguez Anxiety towards mathematics 61
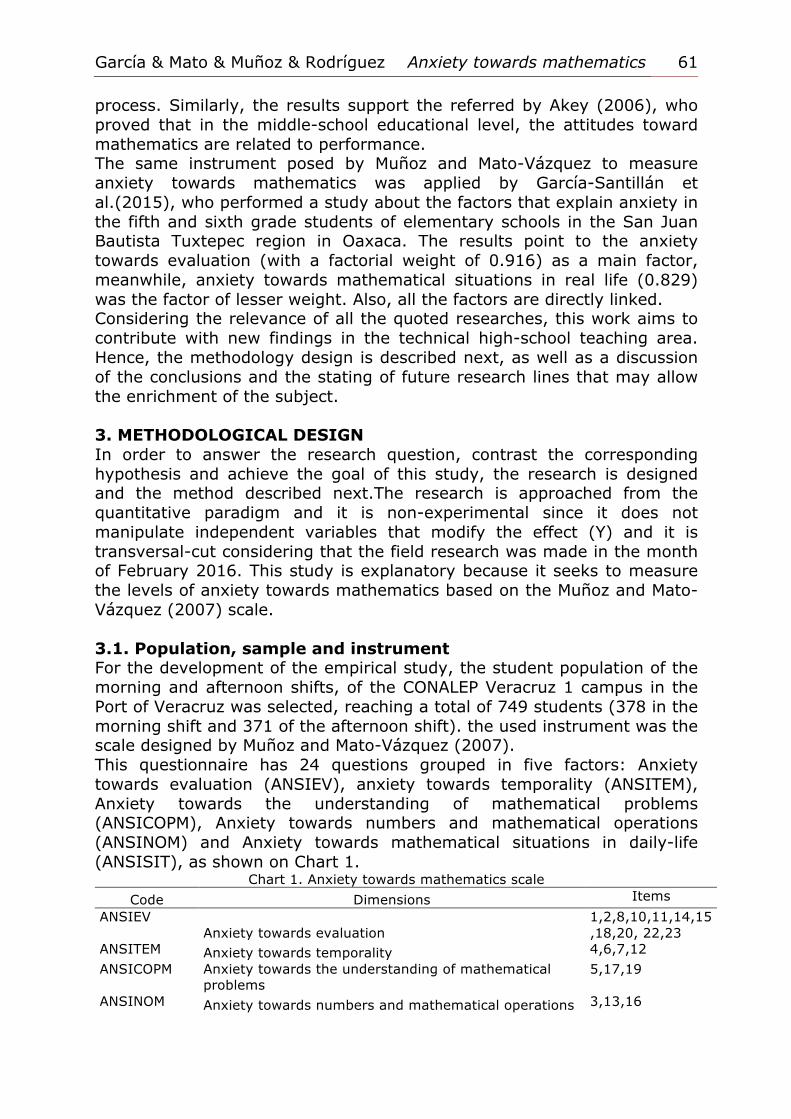
process. Similarly, the results support the referred by Akey (2006), who proved that in the middle-school educational level, the attitudes toward mathematics are related to performance. The same instrument posed by Muñoz and Mato-Vázquez to measure anxiety towards mathematics was applied by García-Santillán et al.(2015), who performed a study about the factors that explain anxiety in the fifth and sixth grade students of elementary schools in the San Juan Bautista Tuxtepec region in Oaxaca. The results point to the anxiety towards evaluation (with a factorial weight of 0.916) as a main factor, meanwhile, anxiety towards mathematical situations in real life (0.829) was the factor of lesser weight. Also, all the factors are directly linked. Considering the relevance of all the quoted researches, this work aims to contribute with new findings in the technical high-school teaching area. Hence, the methodology design is described next, as well as a discussion of the conclusions and the stating of future research lines that may allow the enrichment of the subject. 3. METHODOLOGICAL DESIGN In order to answer the research question, contrast the corresponding hypothesis and achieve the goal of this study, the research is designed and the method described next.The research is approached from the quantitative paradigm and it is non-experimental since it does not manipulate independent variables that modify the effect (Y) and it is transversal-cut considering that the field research was made in the month of February 2016. This study is explanatory because it seeks to measure the levels of anxiety towards mathematics based on the Muñoz and Mato-Vázquez (2007) scale. 3.1. Population, sample and instrument For the development of the empirical study, the student population of the morning and afternoon shifts, of the CONALEP Veracruz 1 campus in the Port of Veracruz was selected, reaching a total of 749 students (378 in the morning shift and 371 of the afternoon shift). the used instrument was the scale designed by Muñoz and Mato-Vázquez (2007). This questionnaire has 24 questions grouped in five factors: Anxiety towards evaluation (ANSIEV), anxiety towards temporality (ANSITEM), Anxiety towards the understanding of mathematical problems (ANSICOPM), Anxiety towards numbers and mathematical operations (ANSINOM) and Anxiety towards mathematical situations in daily-life (ANSISIT), as shown on Chart 1.
Chart 1. Anxiety towards mathematics scale Code Dimensions Items
ANSIEV Anxiety towards evaluation
1,2,8,10,11,14,15,18,20, 22,23
ANSITEM Anxiety towards temporality 4,6,7,12 ANSICOPM Anxiety towards the understanding of mathematical
problems 5,17,19
ANSINOM Anxiety towards numbers and mathematical operations 3,13,16
62 RIDHyC Nº 3.:56-75 (Diciembre, 2016)
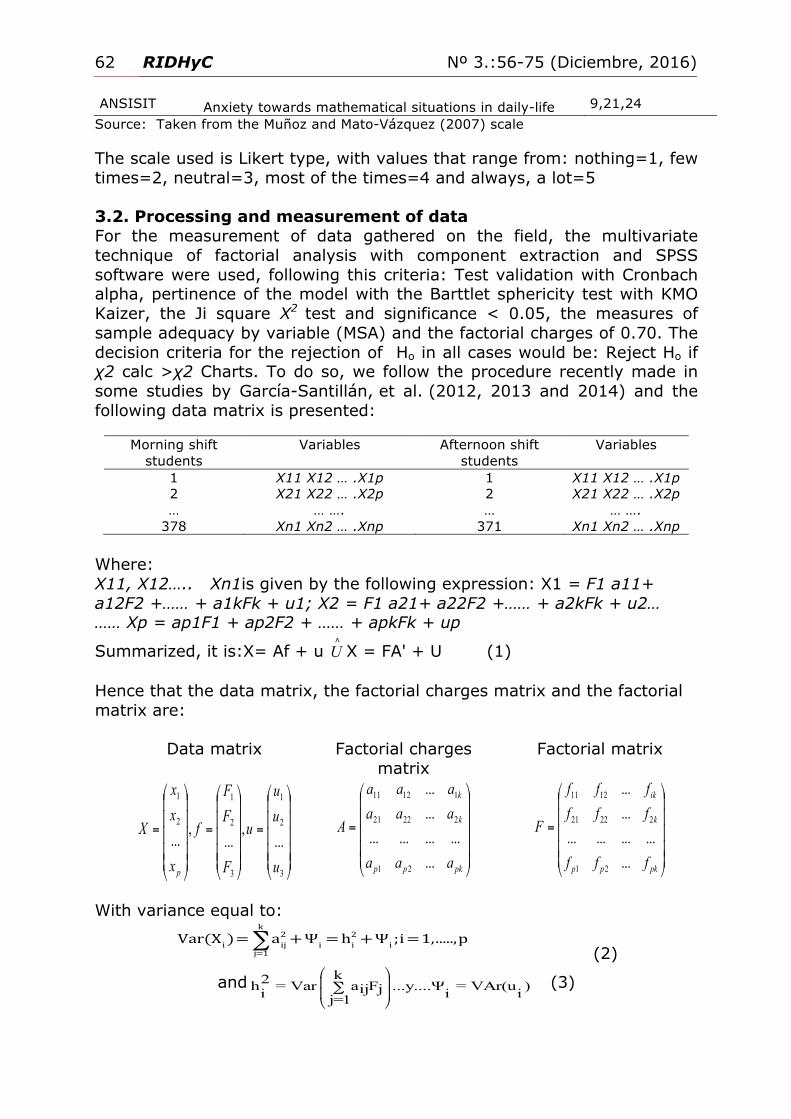
ANSISIT Anxiety towards mathematical situations in daily-life 9,21,24 Source: Taken from the Muñoz and Mato-Vázquez (2007) scale The scale used is Likert type, with values that range from: nothing=1, few times=2, neutral=3, most of the times=4 and always, a lot=5 3.2. Processing and measurement of data For the measurement of data gathered on the field, the multivariate technique of factorial analysis with component extraction and SPSS software were used, following this criteria: Test validation with Cronbach alpha, pertinence of the model with the Barttlet sphericity test with KMO Kaizer, the Ji square X2 test and significance < 0.05, the measures of sample adequacy by variable (MSA) and the factorial charges of 0.70. The decision criteria for the rejection of Ho in all cases would be: Reject Ho if χ2 calc >χ2 Charts. To do so, we follow the procedure recently made in some studies by García-Santillán, et al. (2012, 2013 and 2014) and the following data matrix is presented:
Morning shift students
Variables Afternoon shift students
Variables
1 X11 X12 … .X1p 1 X11 X12 … .X1p 2 X21 X22 … .X2p 2 X21 X22 … .X2p … … …. … … ….
378 Xn1 Xn2 … .Xnp 371 Xn1 Xn2 … .Xnp Where: X11, X12….. Xn1is given by the following expression: X1 = F1 a11+ a12F2 +…… + a1kFk + u1; X2 = F1 a21+ a22F2 +…… + a2kFk + u2… …… Xp = ap1F1 + ap2F2 + …… + apkFk + up
Summarized, it is:X= Af + u ∧
U X = FA' + U (1)
Hence that the data matrix, the factorial charges matrix and the factorial matrix are:
Data matrix Factorial charges matrix
Factorial matrix
⎟⎟⎟⎟⎟
⎠
⎞
⎜⎜⎜⎜⎜
⎝
⎛
=
⎟⎟⎟⎟⎟
⎠
⎞
⎜⎜⎜⎜⎜
⎝
⎛
=
⎟⎟⎟⎟⎟
⎠
⎞
⎜⎜⎜⎜⎜
⎝
⎛
=
3
2
1
3
2
1
2
1
...,
...,
...u
uu
u
F
FF
f
x
xx
X
p
⎟⎟⎟⎟⎟
⎠
⎞
⎜⎜⎜⎜⎜
⎝
⎛
=
pkpp
k
k
aaa
aaaaaa
A
...............
...
...
21
22221
11211
⎟⎟⎟⎟⎟
⎠
⎞
⎜⎜⎜⎜⎜
⎝
⎛
=
pkpp
k
ik
fff
ffffff
F
...............
...
...
21
22221
1211
With variance equal to:
∑k
2 2i ij i i i
j=1Var(X )= a +Ψ =h +Ψ ;i=1,.....,p
(2)
and k2h = Var a F ...y....Ψ = VAr(u )ij ji i ij=1
⎛ ⎞⎜ ⎟⎜ ⎟⎝ ⎠∑ (3)
García & Mato & Muñoz & Rodríguez Anxiety towards mathematics 63
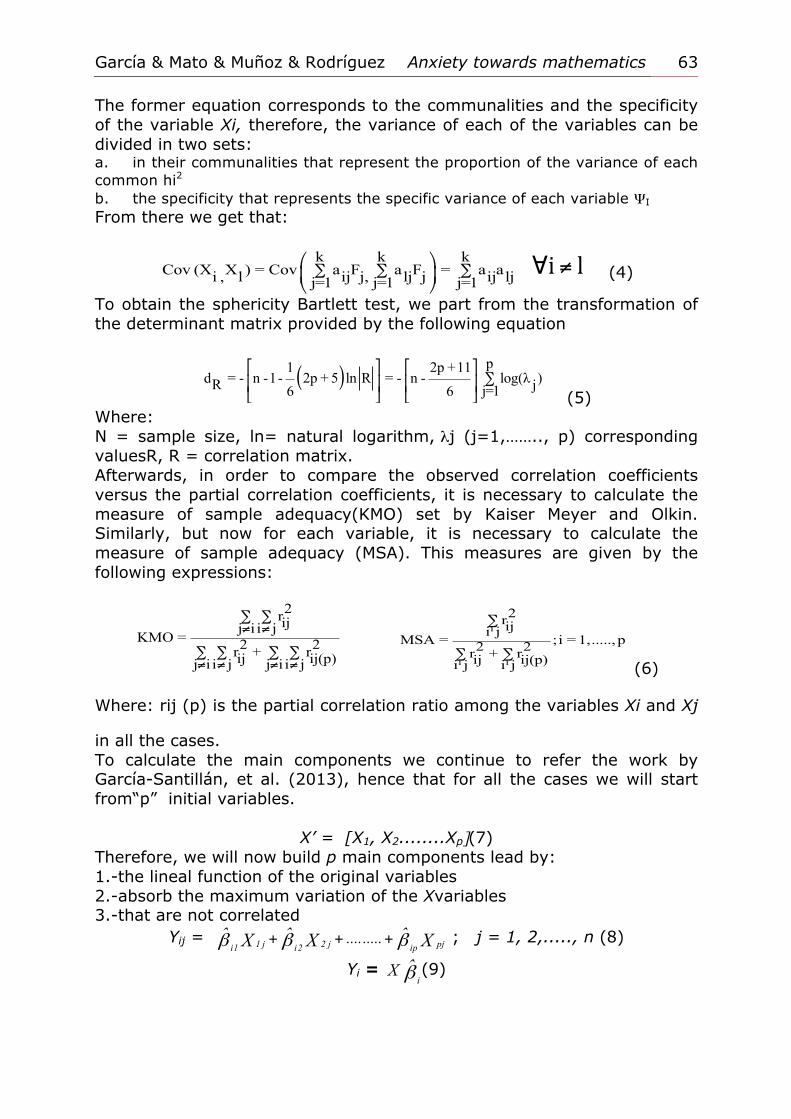
The former equation corresponds to the communalities and the specificity of the variable Xi, therefore, the variance of each of the variables can be divided in two sets: a. in their communalities that represent the proportion of the variance of each common hi2 b. the specificity that represents the specific variance of each variable ΨI From there we get that:
k k kCov (X X ) = Cov a F a F = a ai , l ij j, lj j ij ljj=1 j=1 j=1
∑ ∑ ∑⎛ ⎞⎜ ⎟⎝ ⎠
∀ ≠ li (4)
To obtain the sphericity Bartlett test, we part from the transformation of the determinant matrix provided by the following equation
( )p1 2p +11
d = - n -1- 2p + 5 ln R = - n - log(λ )R jj=16 6∑
⎡ ⎤ ⎡ ⎤⎢ ⎥ ⎢ ⎥⎣ ⎦ ⎣ ⎦ (5)
Where: N = sample size, ln= natural logarithm, λj (j=1,…….., p) corresponding valuesR, R = correlation matrix. Afterwards, in order to compare the observed correlation coefficients versus the partial correlation coefficients, it is necessary to calculate the measure of sample adequacy(KMO) set by Kaiser Meyer and Olkin. Similarly, but now for each variable, it is necessary to calculate the measure of sample adequacy (MSA). This measures are given by the following expressions:
2rijj i i jKMO = 2 2r + rij ij(p)j i i j j i i j
∑ ∑≠ ≠
∑ ∑ ∑ ∑≠ ≠ ≠ ≠
2riji¹jMSA = ;i = 1,....., p2 2r + rij ij(p)i¹j i¹j
∑
∑ ∑ (6)
Where: rij (p) is the partial correlation ratio among the variables Xi and Xj
in all the cases. To calculate the main components we continue to refer the work by García-Santillán, et al. (2013), hence that for all the cases we will start from“p” initial variables.
X’ = [X1, X2........Xp](7) Therefore, we will now build p main components lead by: 1.-the lineal function of the original variables 2.-absorb the maximum variation of the Xvariables 3.-that are not correlated
Yij = XˆXˆXˆ pjipj22ij11i......... βββ +++ ; j = 1, 2,....., n (8)
Yi = β̂ iX (9)

64 RIDHyC Nº 3.:56-75 (Diciembre, 2016)
⎥⎥⎥⎥⎥⎥
⎦
⎤
⎢⎢⎢⎢⎢⎢
⎣
⎡
=
Y in
.
.Y 2i
Y 1i
Y i ;
⎥⎥⎥⎥⎥⎥⎥
⎦
⎤
⎢⎢⎢⎢⎢⎢⎢
⎣
⎡
=
XXX
XXXXXX
pnn2n1
2p2212
1p2111
..................................................................
..............
X ;
⎥⎥⎥⎥⎥⎥⎥⎥
⎦
⎤
⎢⎢⎢⎢⎢⎢⎢⎢
⎣
⎡
=
β
β
β
β
ˆ
ˆˆ
ˆ
ip
2i
1i
i
.
. (10)
The variation of the Yivariable can be:
iiii SˆYY ββ ʹ=ʹ (11) Where: S = X’X To get the first, second and following components we follow this procedure: The first component is 11 β̂XY = and so, we must seek to maximize 1111
ˆSˆYY ββ ʹ=ʹ and to follow the process we require 1ˆ'ˆ 11=ββ ...
Therefore, at the end maximize as:
)1(SZ ˆ'ˆˆˆ'ˆ 11111−−= ββλββ ........ ie:
0)IS(
0S
02S2
ˆˆ
ˆˆˆ
ˆˆˆˆZ
11
111
1111
=−
=−
=−=
βλ
βλβ
βλββ∂
∂
(12)
If we star from 0IS ˆ
1 =−λ we find λ̂ 1 that substitutes as 0ˆ)( 11ˆ =− βλ IS and gives
us β̂ 1 the second component is β̂Y 22 X= . Once more we must seek to
maximize ββ ˆ'ˆY'Y 2222 S= that are once again subject to 1ˆ'ˆ 22=ββ , to which we
add the lack of correlation with the first component Y’2Y1=0..., which is the same as 0S ˆ'ˆ 12
=ββ that can also be written as 0ˆ'ˆ 12=ββ . Hence, the
function to maximize is: )()1( ˆ'ˆˆ'ˆˆˆ'ˆ
12122222 ββµββλββ −−−= SZMax (13)
After finding the first derivate and making a number of reductions we get: 0S ˆˆˆ
222=− βλβ (14)
ie...... 0)IS( ˆˆ22 =− βλ (14.1)
Therefore, it is solved using the same method used for the first component. Now the following empirical results are presented: 4. DATA DISCUSSION The validation of the instrument was made by Cronbach´s alpha (α). As basis, Hairet al.(1999) establish that the reliability coefficients have values that range from 0 to 1 and the closer it is to the unit, the more reliability it has. Hence, the Cronbach´s alpha can be interpreted as a function of the items number and the average of the items correlation, from the following expression:
García & Mato & Muñoz & Rodríguez Anxiety towards mathematics 65
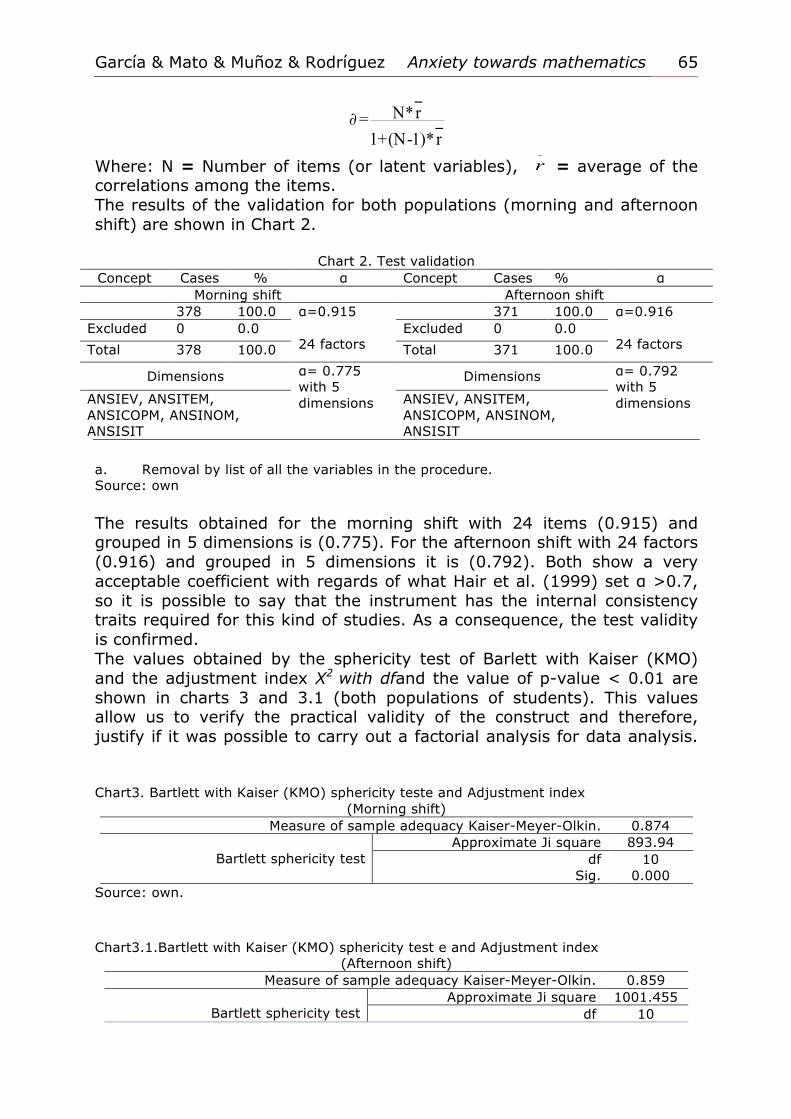
N*r=1+(N-1)*r
−∂ −
Where: N = Number of items (or latent variables), r
−
= average of the correlations among the items. The results of the validation for both populations (morning and afternoon shift) are shown in Chart 2.
Chart 2. Test validation Concept Cases % α Concept Cases % α
Morning shift Afternoon shift 378 100.0 α=0.915
24 factors
371 100.0 α=0.916 24 factors
Excluded 0 0.0 Excluded 0 0.0 Total 378 100.0 Total 371 100.0
Dimensions α= 0.775 with 5 dimensions
Dimensions α= 0.792 with 5 dimensions ANSIEV, ANSITEM,
ANSICOPM, ANSINOM, ANSISIT
ANSIEV, ANSITEM, ANSICOPM, ANSINOM, ANSISIT
a. Removal by list of all the variables in the procedure. Source: own The results obtained for the morning shift with 24 items (0.915) and grouped in 5 dimensions is (0.775). For the afternoon shift with 24 factors (0.916) and grouped in 5 dimensions it is (0.792). Both show a very acceptable coefficient with regards of what Hair et al. (1999) set α >0.7, so it is possible to say that the instrument has the internal consistency traits required for this kind of studies. As a consequence, the test validity is confirmed. The values obtained by the sphericity test of Barlett with Kaiser (KMO) and the adjustment index X2 with dfand the value of p-value < 0.01 are shown in charts 3 and 3.1 (both populations of students). This values allow us to verify the practical validity of the construct and therefore, justify if it was possible to carry out a factorial analysis for data analysis. Chart3. Bartlett with Kaiser (KMO) sphericity teste and Adjustment index
(Morning shift) Measure of sample adequacy Kaiser-Meyer-Olkin. 0.874
Bartlett sphericity test
Approximate Ji square 893.94 df 10
Sig. 0.000 Source: own. Chart3.1.Bartlett with Kaiser (KMO) sphericity test e and Adjustment index
(Afternoon shift) Measure of sample adequacy Kaiser-Meyer-Olkin. 0.859
Bartlett sphericity test
Approximate Ji square 1001.455 df 10
66 RIDHyC Nº 3.:56-75 (Diciembre, 2016)
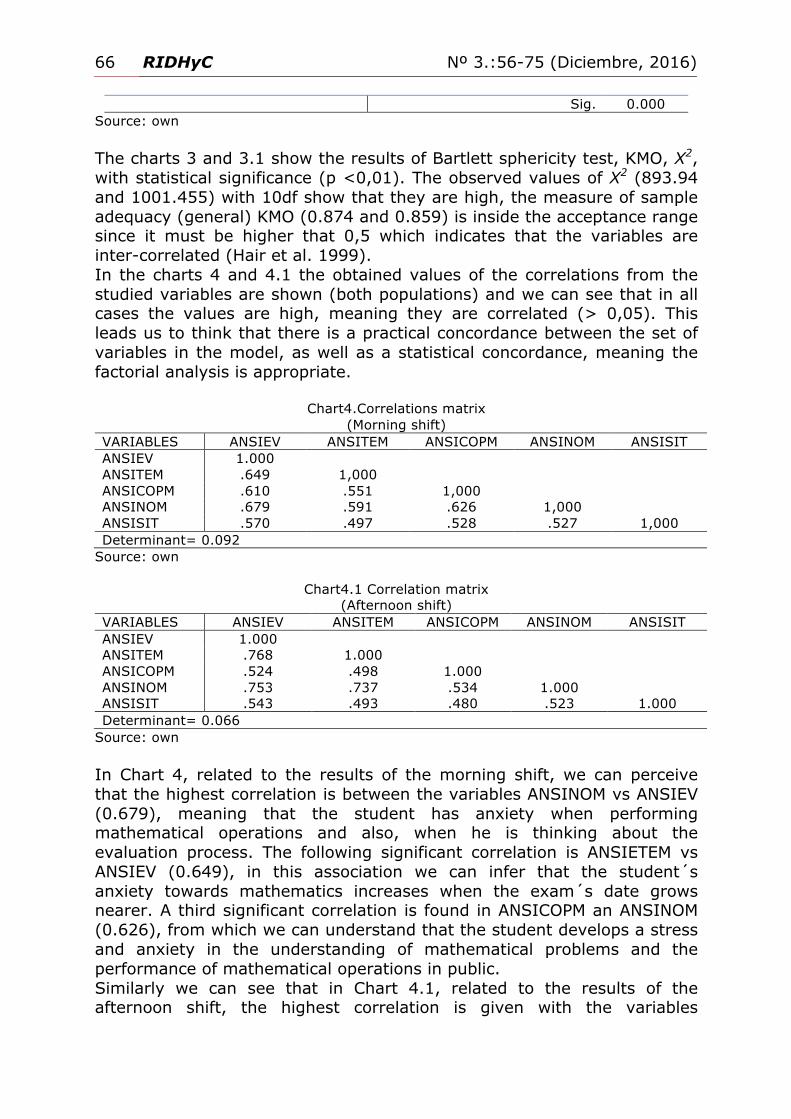
Sig. 0.000 Source: own The charts 3 and 3.1 show the results of Bartlett sphericity test, KMO, X2, with statistical significance (p <0,01). The observed values of X2 (893.94 and 1001.455) with 10df show that they are high, the measure of sample adequacy (general) KMO (0.874 and 0.859) is inside the acceptance range since it must be higher that 0,5 which indicates that the variables are inter-correlated (Hair et al. 1999). In the charts 4 and 4.1 the obtained values of the correlations from the studied variables are shown (both populations) and we can see that in all cases the values are high, meaning they are correlated (> 0,05). This leads us to think that there is a practical concordance between the set of variables in the model, as well as a statistical concordance, meaning the factorial analysis is appropriate.
Chart4.Correlations matrix (Morning shift)
VARIABLES ANSIEV ANSITEM ANSICOPM ANSINOM ANSISIT ANSIEV 1.000 ANSITEM .649 1,000 ANSICOPM .610 .551 1,000 ANSINOM .679 .591 .626 1,000 ANSISIT .570 .497 .528 .527 1,000 Determinant= 0.092
Source: own
Chart4.1 Correlation matrix (Afternoon shift)
VARIABLES ANSIEV ANSITEM ANSICOPM ANSINOM ANSISIT ANSIEV 1.000 ANSITEM .768 1.000 ANSICOPM .524 .498 1.000 ANSINOM .753 .737 .534 1.000 ANSISIT .543 .493 .480 .523 1.000 Determinant= 0.066
Source: own In Chart 4, related to the results of the morning shift, we can perceive that the highest correlation is between the variables ANSINOM vs ANSIEV (0.679), meaning that the student has anxiety when performing mathematical operations and also, when he is thinking about the evaluation process. The following significant correlation is ANSIETEM vs ANSIEV (0.649), in this association we can infer that the student´s anxiety towards mathematics increases when the exam´s date grows nearer. A third significant correlation is found in ANSICOPM an ANSINOM (0.626), from which we can understand that the student develops a stress and anxiety in the understanding of mathematical problems and the performance of mathematical operations in public. Similarly we can see that in Chart 4.1, related to the results of the afternoon shift, the highest correlation is given with the variables
García & Mato & Muñoz & Rodríguez Anxiety towards mathematics 67
ANSIETEM and ANSIEV(0.768) , indicating that the student presents anxiety when thinking about the exam and when the hour of it grows near. In second place is the correlation between ANSINOM and ANSIEV (0.753), meaning the student shows anxiety in performing mathematical operations in public and by thinking about the evaluation. In third place comes the correlation between ANSINOM and ANSIETEM (0.737), which indicates that there is anxiety when making mathematical operations and thinking about the evaluation. The lowest relation of the afternoon shift is ANSISIT and ANSICOPM (0.480), which shows that students get lower anxiety when making mathematical operations in their daily life activities and when understanding mathematical problems presented by the teacher. Regarding this, we must point out what in theory is asked and in this case is that the determinant value must be lower<0.05, which will make higher correlations evident. In the case of both studied populations,, the determinant value was 0.092 and 0.066 respectively. Even though they are not lower that the theoretical desired values, it is clear that all the variables are positively correlated, which provides evidence on the presence of significant correlations in the set of studied variables of the construct posed by Muñoz and Mato-Vázquez (2007). We should remember that with the determinant correlation matrix, the Barlett sphericity test are shown in Charts 3 and 3.1 respectively, which is given by the expression:
( )p1 2p +11
d = - n -1- 2p + 5 ln R = - n - log(λ )R jj=16 6∑
⎡ ⎤ ⎡ ⎤⎢ ⎥ ⎢ ⎥⎣ ⎦ ⎣ ⎦
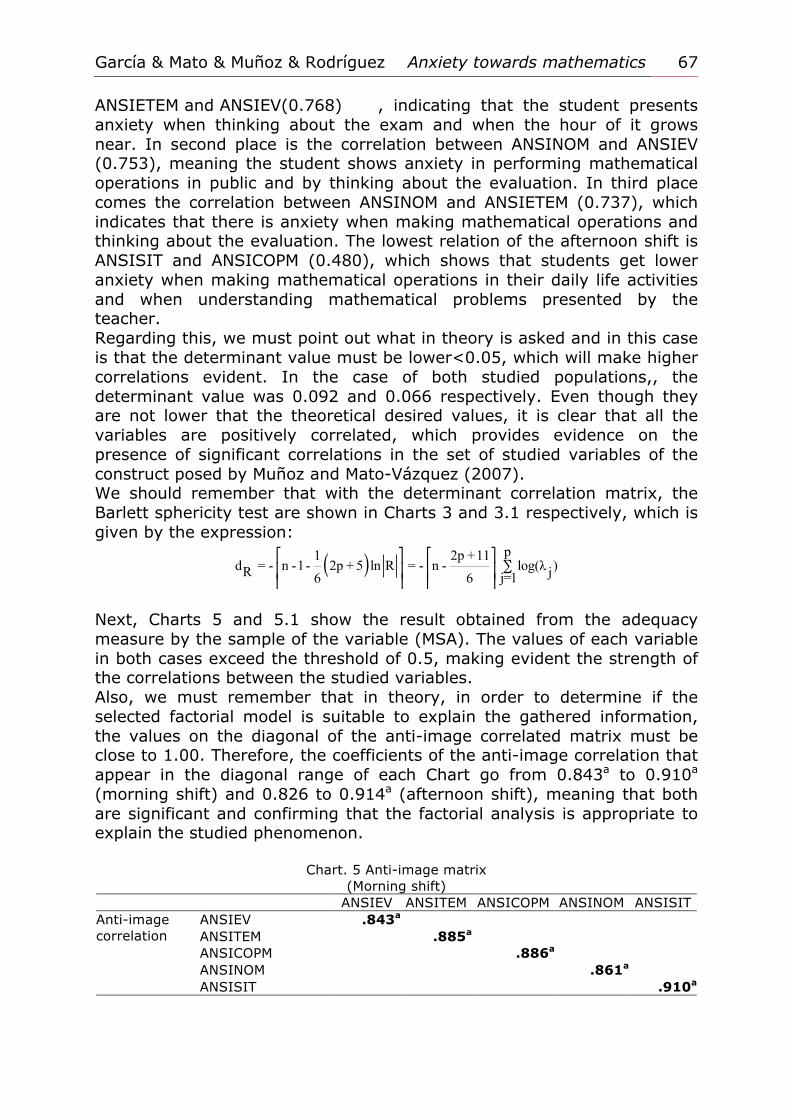
Next, Charts 5 and 5.1 show the result obtained from the adequacy measure by the sample of the variable (MSA). The values of each variable in both cases exceed the threshold of 0.5, making evident the strength of the correlations between the studied variables. Also, we must remember that in theory, in order to determine if the selected factorial model is suitable to explain the gathered information, the values on the diagonal of the anti-image correlated matrix must be close to 1.00. Therefore, the coefficients of the anti-image correlation that appear in the diagonal range of each Chart go from 0.843a to 0.910a (morning shift) and 0.826 to 0.914a (afternoon shift), meaning that both are significant and confirming that the factorial analysis is appropriate to explain the studied phenomenon.
Chart. 5 Anti-image matrix (Morning shift)
ANSIEV ANSITEM ANSICOPM ANSINOM ANSISIT Anti-image correlation
ANSIEV .843a ANSITEM .885a ANSICOPM .886a ANSINOM .861a ANSISIT .910a
68 RIDHyC Nº 3.:56-75 (Diciembre, 2016)
ANSIEV ANSITEM ANSICOPM ANSINOM ANSISIT Anti-image correlation
ANSIEV .843a ANSITEM .885a ANSICOPM .886a ANSINOM .861a ANSISIT .910a
a. Measure of Sample Adequacy Source: own
Chart5.1Anti-image matrix
(Afternoon shift) ANSIEV ANSITEM ANSICOPM ANSINOM ANSISIT
Anti-image correlation
ANSIEV 826a ANSITEM 836a ANSICOPM .914a ANSINOM 854a ANSISIT 912a
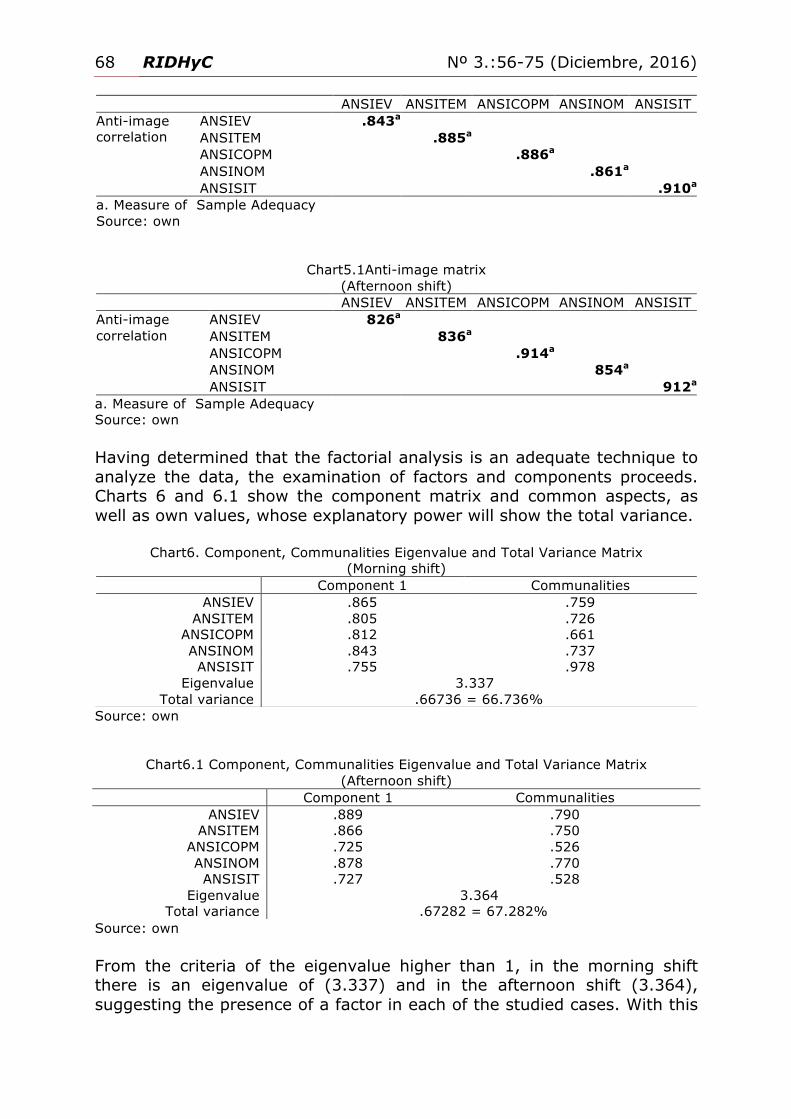
a. Measure of Sample Adequacy Source: own Having determined that the factorial analysis is an adequate technique to analyze the data, the examination of factors and components proceeds. Charts 6 and 6.1 show the component matrix and common aspects, as well as own values, whose explanatory power will show the total variance.
Chart6. Component, Communalities Eigenvalue and Total Variance Matrix (Morning shift)
Source: own
Chart6.1 Component, Communalities Eigenvalue and Total Variance Matrix
(Afternoon shift)
Source: own From the criteria of the eigenvalue higher than 1, in the morning shift there is an eigenvalue of (3.337) and in the afternoon shift (3.364), suggesting the presence of a factor in each of the studied cases. With this
Component 1 Communalities ANSIEV .865 .759
ANSITEM .805 .726 ANSICOPM .812 .661 ANSINOM .843 .737 ANSISIT .755 .978
Eigenvalue 3.337 Total variance .66736 = 66.736%
Component 1 Communalities ANSIEV .889 .790
ANSITEM .866 .750 ANSICOPM .725 .526 ANSINOM .878 .770 ANSISIT .727 .528
Eigenvalue 3.364 Total variance .67282 = 67.282%
García & Mato & Muñoz & Rodríguez Anxiety towards mathematics 69
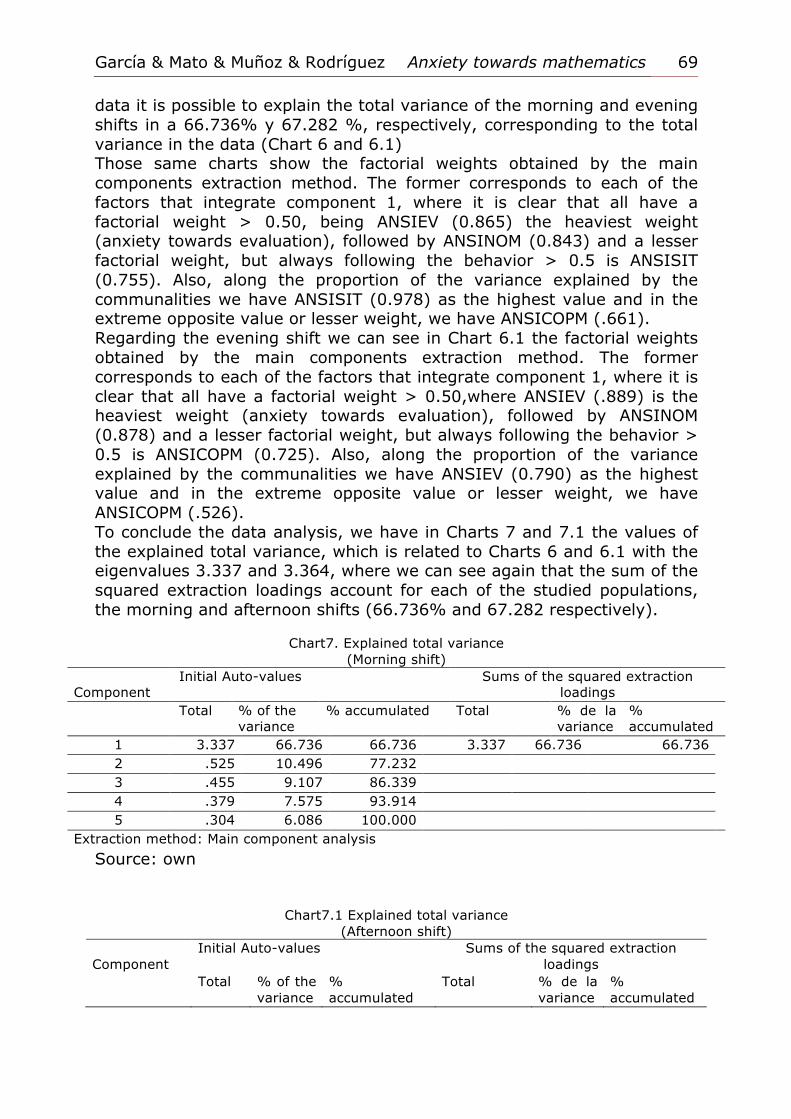
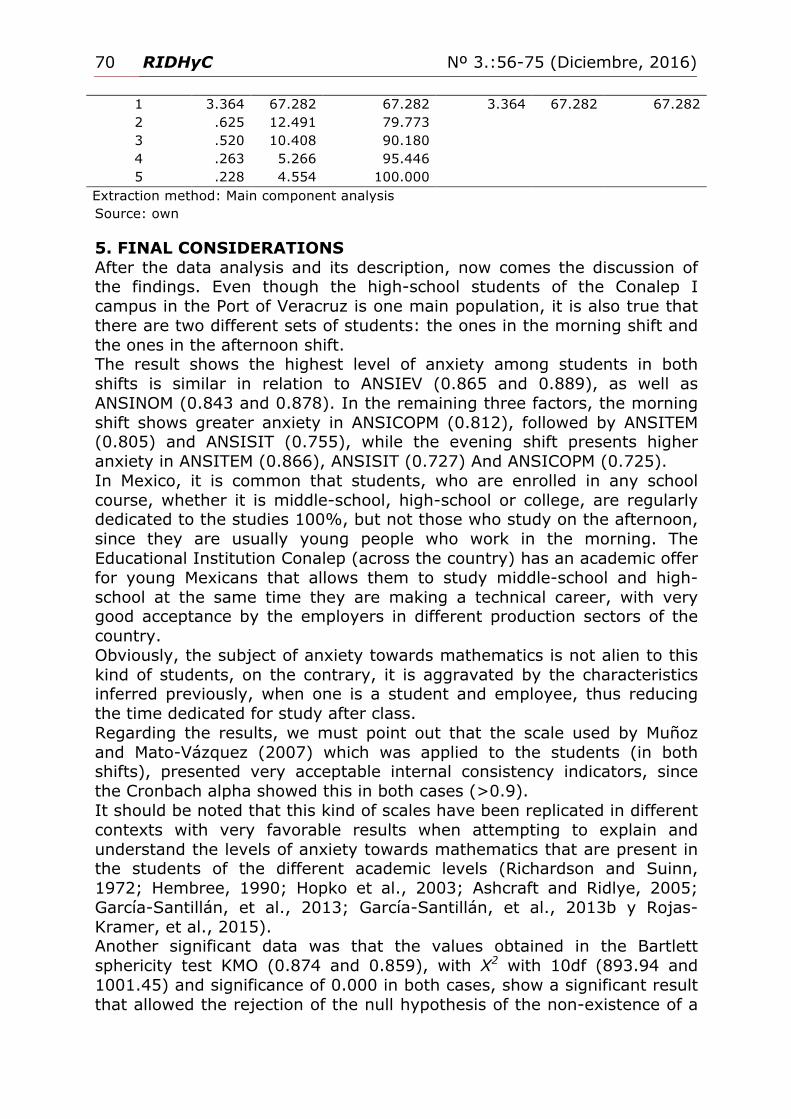
data it is possible to explain the total variance of the morning and evening shifts in a 66.736% y 67.282 %, respectively, corresponding to the total variance in the data (Chart 6 and 6.1) Those same charts show the factorial weights obtained by the main components extraction method. The former corresponds to each of the factors that integrate component 1, where it is clear that all have a factorial weight > 0.50, being ANSIEV (0.865) the heaviest weight (anxiety towards evaluation), followed by ANSINOM (0.843) and a lesser factorial weight, but always following the behavior > 0.5 is ANSISIT (0.755). Also, along the proportion of the variance explained by the communalities we have ANSISIT (0.978) as the highest value and in the extreme opposite value or lesser weight, we have ANSICOPM (.661). Regarding the evening shift we can see in Chart 6.1 the factorial weights obtained by the main components extraction method. The former corresponds to each of the factors that integrate component 1, where it is clear that all have a factorial weight > 0.50,where ANSIEV (.889) is the heaviest weight (anxiety towards evaluation), followed by ANSINOM (0.878) and a lesser factorial weight, but always following the behavior > 0.5 is ANSICOPM (0.725). Also, along the proportion of the variance explained by the communalities we have ANSIEV (0.790) as the highest value and in the extreme opposite value or lesser weight, we have ANSICOPM (.526). To conclude the data analysis, we have in Charts 7 and 7.1 the values of the explained total variance, which is related to Charts 6 and 6.1 with the eigenvalues 3.337 and 3.364, where we can see again that the sum of the squared extraction loadings account for each of the studied populations, the morning and afternoon shifts (66.736% and 67.282 respectively).
Chart7. Explained total variance (Morning shift)
Component
Initial Auto-values Sums of the squared extraction loadings
Total % of the variance
% accumulated Total % de la variance
% accumulated
1 3.337 66.736 66.736 3.337 66.736 66.736 2 .525 10.496 77.232 3 .455 9.107 86.339 4 .379 7.575 93.914 5 .304 6.086 100.000
Extraction method: Main component analysis Source: own
Chart7.1 Explained total variance (Afternoon shift)
Component
Initial Auto-values Sums of the squared extraction loadings
Total % of the variance
% accumulated
Total % de la variance
% accumulated
70 RIDHyC Nº 3.:56-75 (Diciembre, 2016)
1 3.364 67.282 67.282 3.364 67.282 67.282 2 .625 12.491 79.773 3 .520 10.408 90.180 4 .263 5.266 95.446 5 .228 4.554 100.000
Extraction method: Main component analysis Source: own 5. FINAL CONSIDERATIONS After the data analysis and its description, now comes the discussion of the findings. Even though the high-school students of the Conalep I campus in the Port of Veracruz is one main population, it is also true that there are two different sets of students: the ones in the morning shift and the ones in the afternoon shift. The result shows the highest level of anxiety among students in both shifts is similar in relation to ANSIEV (0.865 and 0.889), as well as ANSINOM (0.843 and 0.878). In the remaining three factors, the morning shift shows greater anxiety in ANSICOPM (0.812), followed by ANSITEM (0.805) and ANSISIT (0.755), while the evening shift presents higher anxiety in ANSITEM (0.866), ANSISIT (0.727) And ANSICOPM (0.725). In Mexico, it is common that students, who are enrolled in any school course, whether it is middle-school, high-school or college, are regularly dedicated to the studies 100%, but not those who study on the afternoon, since they are usually young people who work in the morning. The Educational Institution Conalep (across the country) has an academic offer for young Mexicans that allows them to study middle-school and high-school at the same time they are making a technical career, with very good acceptance by the employers in different production sectors of the country. Obviously, the subject of anxiety towards mathematics is not alien to this kind of students, on the contrary, it is aggravated by the characteristics inferred previously, when one is a student and employee, thus reducing the time dedicated for study after class. Regarding the results, we must point out that the scale used by Muñoz and Mato-Vázquez (2007) which was applied to the students (in both shifts), presented very acceptable internal consistency indicators, since the Cronbach alpha showed this in both cases (>0.9). It should be noted that this kind of scales have been replicated in different contexts with very favorable results when attempting to explain and understand the levels of anxiety towards mathematics that are present in the students of the different academic levels (Richardson and Suinn, 1972; Hembree, 1990; Hopko et al., 2003; Ashcraft and Ridlye, 2005; García-Santillán, et al., 2013; García-Santillán, et al., 2013b y Rojas-Kramer, et al., 2015). Another significant data was that the values obtained in the Bartlett sphericity test KMO (0.874 and 0.859), with X2 with 10df (893.94 and 1001.45) and significance of 0.000 in both cases, show a significant result that allowed the rejection of the null hypothesis of the non-existence of a
García & Mato & Muñoz & Rodríguez Anxiety towards mathematics 71
set of latent variables that explain the level of anxiety towards mathematics, confirming that it actually exists. All this process helped validate the pertinence of performing an exploratory factorial analysis. In the particularities of each studied population (in both shifts), it was observed in the data discussion that the variable anxiety towards evaluation correlates significantly with the anxiety the student has towards temporality. In both cases, when time is present in the evaluation, the student has greater anxiety. But, how can we understand this? Usually in each mathematics class an evaluation of the students is carried out by means of writing exams. Between the start of the class and the application of each of the exams there is time, meaning the period that passes from one exam to the other. Here, as the exam approaches, the anxiety levels of the students taking the mathematics class go off, at least that is what the gathered evidence shows. What differences were identified in both populations that may result significant for the profile type of each student on both shifts? The results of the morning shift show a high correlation (0.679) between anxiety when mathematical operations are performed, when they are thinking about the evaluation process and when the date of the exam is near (0.649). The understanding of mathematical problems and the performance of mathematical operations in public (0.626) also causes stress and anxiety. On the other hand, lesser anxiety is caused to students when making mathematical operations in their daily-life activities whenever they are associated to temporality. Meanwhile, the students of the afternoon shift showed significant correlations, even higher than the ones of the morning shift students. For instance, the student presents anxiety when thinking about the exam and as it approaches (0.768). They also show anxiety by performing mathematical operations and thinking about the evaluation (0.753). Similarly, they have anxiety when performing mathematical operations and thinking about the exam (0.737). On the contrary, it causes lesser anxiety to perform mathematical operations in their daily-life activities and understanding mathematical problems presented by the teacher (0.480). This last indicator is very different from the data gathered from the morning shift students. In theory it is known that the closer to zero the value of the determinant is, the higher are the correlations among the studied variables. In the case of both studied populations, the value of the determinant was 0.092 and 0.066 respectively. Even though they are not inferior to the desired theoretical values (< 0.05), it is clear that all the variables correlate positively, which indicates the presence of a significant correlation in the set of studied variables from the construct posed by Muñoz and Mato-Vázquez (2007). The explained total variance in both cases was acceptable (66.736% and 67.282 respectively), meaning that the scale used by Muñoz and Mato-Vázquez is suitable to explain the level of anxiety towards mathematics of

72 RIDHyC Nº 3.:56-75 (Diciembre, 2016)
high-school students in a Latin context, and specifically, in the population where such scale was used. The result has theoretical and practical implications from the following view: The theoretical implications are based on the Muñoz and Mato-Vázquez (2007) multi-mentioned study called “Making and factorial structure of a questionnaire to measure anxiety towards mathematics in students of compulsory secondary education” in which they report the design of a scale that allows to identify the elements that are present in the students and that cause anxiety towards mathematical courses. In their conclusions they claim to have found the correspondence among the factors of the initial structure about the anxiety versus what they found in the theoretic level. They refer that, quoting: “We have found differences among the middle scores of anxiety regarding the factors, being the exams the cause of greater anxiety. We also see that real life problems caused lesser anxiety in the students”. This information is what we intend to contrast with our findings in this research. The aforementioned authors also point out that the dimensions that are more analyzed by other authors are the anxiety towards exams and numerical anxiety. For this purpose they quote the studies by Rounds y Hendel, 1980; Plake y Parquer (1982); Resnick, Viehe y Segal; (1982); Alexyer y Cobb, (1984); Chiu y Henry, 1990), which were verified by this study. Particularly, this work has a very strong relation with the one of Muñoz and Mato (2007), since the findings we managed to identify in the components matrix in both student populations were the high factorial weights and communalities (variance proportion). For example, in the morning shift, they were ANSIEV and ANSINOM (0.865 and 0.759, as well as 0.843 and 0.737), for the afternoon shift they were ANSIEV and ANSINOM (0.889 and 0.790, as well as 0.878 and 0.770). The practical implications that may come from the results of the study can be a starting point to pose some didactic strategies in order to incorporate them to the educational systems in Mexico. These strategies may be aimed to create methods that allow working with the students in order to reduce the aspects that cause anxiety towards mathematics. Also, these strategies must generate indicators that allow the understanding of specific behaviors that affect the mathematics teaching process. It is important to consider that anxiety towards the study of mathematics not only affects the groups of students or schools with low performance; many students with a relatively high performance are slowed down by their negative approach and anxiety towards mathematics. Hence, the actions of the teacher must aim to correct and prevent these situations. It is important to point out that the professional training and improvement of the understanding of the factors that cause anxiety in general and anxiety towards the study of mathematics in particular, are fundamental
García & Mato & Muñoz & Rodríguez Anxiety towards mathematics 73
activities to promote and give emotional contention, needed both in the students as well as the teachers. Within the field of collage education there are other areas of mathematics, such as differential and integral calculus, statistic, arithmetic, geometry, algebra or econometric models, to mention a few and which must be studied in particular, in order to find information that leads us to understand the factors that are most rooted in the student´s mind, which cause anxiety towards mathematics. 7. REFERENCES Alexander, L. y Cobb, R. (1984, November). Identification of the
dimensions y predictors of math anxiety among college students. Paper presented at the annual meeting of the Mid-South Educational., Research Association, New Orleans, LA. Retrieved from ERIC database. (ED251320)
Ashcraft, M. (2002). Math Anxiety: Personal Educational y Cognitive Consequences. Current directions in psychological science, 11(5), 181-185.
Chiu, L. y Henry, L. (1990). Development y validation of the mathematics anxiety scale for children. Measurement y Evaluation in Counselling y Development, 23(3), 121-127.
Cuellar, D. (2011). La deserción de la educación media superior. El caso del CONALEP y el proceso de ingreso en la zona metropolitana de la ciudad de México. Memoria electrónica del XI Congreso Nacional de Investigación Educativa, Ciudad de México: COMIE.
Escalera-Chávez, M.A., García-Santillán, A. y Venegas-Martínez, F. (2014). Modeling attitude toward Statistic with structuralequation (2014). Eurasia Journal of Mathematics, Science y Technology Education. Vol. 10 Issue (1) pp 23-31 ISSN:1305-8223, 2014.
Fennema, E y Sherman, J. (1976) Mathematics Attitudes Scales: Instruments Designed to Measure Attitudes toward the Learning of Mathematics by Females y Males Journal for Research in Mathematics Education, Vol. 7(5), 324-326.
Gairín, J. (1990). Las actitudes en educación. Un estudio sobre la educación matemática. Barcelona: Boixareu Universitaria.
García-Santillán, A. Venegas-Martínez, F. Escalera-Chávez, M.E. y Córdova-Rangel, A. (2013). Attitude towards statistics in engineering college: An empirical study in public university (UPA). Journal of Statistic y Econometric Methods Vol. 2 Issue 1, 3 March pp 43-60.
García-Santillán, A., Edwards, A. y Tejeda-Peña, E. (2015). What factors explain the anxiety level towards the study of mathematics among elementary school students? Mediterranean journal of Social Sciences MCSER publishing, 6(4), 564-572.
García-Santillán, A., Escalera-Chávez, M. y Venegas-Martínez, F (2013). Principal components analysis y Factorial analysis to measure latent variables in a quantitative research: A mathematical theoretical

74 RIDHyC Nº 3.:56-75 (Diciembre, 2016)
approach. Bulletin of Society for Mathematical Service y Styars Vol. 2(3) pp. 03-14.
García-Santillán, A., Escalera-Chávez, M., Moreno-García, E. y Santana-Villegas, J. (2016). Factors that explains student’s anxiety towards mathematics. Eurasia journal of Mathematics, Science y Technology Education, 12(2), 361-372.
García-Santillán, A., Escalera-Chávez, M.E. y Córdova-Rangel, A. (2012). Variables to measure interaction among mathematics y computer through structural equation modeling. Journal of Applied Mathematics y Bioinformatics Vol 2, No. 3 pp 51-67.
García-Santillán, A.; Venegas-Martínez, F y Escalera-Chávez, M.E. (2013). An exploratory factorial analysis to measure attitude toward statistic. Empirical study in undergraduate students. International Journal of Research y Reviews in Applied Sciences Vol 14, issue 2 february 2013 pp. 356-366.
Gómez-Chacón, I. M. (1997). La alfabetización emocional en educación matemática: actitudes, emociones y creencias. Revista Uno, 13, 7-22.
Gómez-Chacón, I. M. (2000). Matemática emocional. Los afectos en el aprendizaje matemático. Madrid: Narcea.
Hair, J. F., Anderson, R. E., Tatham, R. L. y Black, W. C. (1999). Multivariate data analysis, fifth edition. Spain Prentice Hall.
Ho, H., Senturk, D, Lam, A., Zimmer, J., Hong, S., Okamoto, Y., Chiu, S., Nakazawa, Y. y Wang, C. (2000). The affective y cognitive dimmensions of math anxiety: a cross-national Study. Journal for Research in Mathematics Education, 31(3), 362-379.
Instituto Nacional para la Evaluación de la Educación (2013), México en PISA 2012. México: INEE.
Liebert, R. y Morris, L. (1967). Cognitive y emotional components of test anxiety: a distinction y some initial data. Psycological Reports, 20, 975-978
McLeod, D.B. (1992). Research on affect in mathematics education: A reconceptualization. En Douglas A. Grouws (Ed.), Handbook of Research on mathematics Teaching and Learning (pp.575-598). New York: Macmillan.
McLeod, D.B. (1994). Research on affect and mathematics learning in the JRME: 1970 to the present. Journal for Research in Mathematics Education, 25(6), 637-647
Muñoz, M. y Mato-Vázquez, M. (2007). Elaboración y estructura factorial de un cuestionario para medir la “Ansiedad hacia las matemáticas en alumnos de educación secundaria obligatoria”. Revista Gallego-Portuguesta de psicoloxía e educatión, 14(1), 1138-1663.
Nortes, R. y Nortes, A. (2014). Ansiedad hacia las matemáticas, agrado y utilidad en futuros maestros. Investigación en educación matemática, 485-492.
Pérez-Tyteca, P., Castro E., Segovia, I., Castro, E. y Fernández, F. (2007). Ansiedad matemática de los alumnos que ingresan en la universidad
García & Mato & Muñoz & Rodríguez Anxiety towards mathematics 75
de Granada. Simposio en investigación en Educación Matematica XI, 171-180.
Plake, B. S. y Parker, C. S. (1982). The development y validation of a revised version of the Mathematics Anxiety Rating Scale. Educational y Psychological Measurement, 42, 551-557.
Resnick, N., Viehe, J. y Segal, S. (1982) Is Math Anxiety a local phenomenon? A study of prevalence y dimensionality. Journal of Counseling Psychologx (29), 1, 39-47.
Richardson, F.C., y Suinn, R.M. (1972). The Mathematics Anxiety Rating Scale. Journal of Counseling Psychology, 19, 551-554.
Rojas-Kramer, C.A.; García-Santillán, A.; Cordova-Rangel, A; Fuentes-Rosas, L.; Benítez-Moreno, G. (2015) Understying Students’ Perceptions to Improve Teaching of Mathematics. International, Journal., of Humanities y Social., Science Vol. 5, No. 3 pp 166-172.
Rojas-Kramer, C.A.; García-Santillán, A.; Fuentes-Rosas, L; Benítez-Moreno, G. y Cordova-Rangel, A. (2015) Engineering Students’Perceptions of Financial Mathematics. An empirical study based on the EAPH-MF scale. Journal of Mathematics Research Vol 7 (3) pp. 178-190.
Rounds, J. B. y Hendel, D. D. (1980, March). Measurement y Dimensionality of Mathematics Anxiety. Journal of Counseling Psychology, 27(2), 138- 149.
Schoenfeld, A. (1992). Learning to think mathematically: Problem solving, metacognition and sense making in mathematics. In D. A. Grouws (Ed.), Handbook of research on mathematics teaching and learning. A project of the National Council of teachers of mathematics, Nueva York, Estados Unidos, Macmillan.
Spielberger, C., Gorsuch, R., Lushene, T., Vagg, P., y Jacobs, G. (1983). Manual for the State-Trait Anxiety Inventory. Palo Alto (CA): Consulting Psychologists Press.
Tejedor, B., Santos, M., Gacía-Orza, J., Carratalà, P. y Navas, M. (2009). Variables explicativas de la ansiedad frente a las matemáticas: un estudio de una muestra de 6º de primaria. Anuario de Psicología Universitat de Barcelona, 40(3), 345-355.