anxiety, working memory, gender, and math performance
TRANSCRIPT

Personality and Individual Differences 37 (2004) 591–606www.elsevier.com/locate/paid
Anxiety, working memory, gender, and math performance
Heather Miller, Jacqueline Bichsel *
The Pennsylvania State University, Harrisburg Campus, 777 W. Harrisburg Pike, Middletown, PA 17057-4898, USA
Received 17 April 2003; received in revised form 1 August 2003; accepted 29 September 2003
Available online 19 November 2003
Abstract
This investigation evaluated the relations between visual and verbal working memory; state, trait, and
math anxiety; gender; and applied and basic math performance in 100 adults. The design tested predictionsregarding which subsystem of working memory is associated with both math anxiety and math perfor-
mance. The study also tested whether the Processing Efficiency Theory and the Arousal-Performance
Function apply to anxiety and performance in the math domain. In addition, gender differences in the
relations between math anxiety and math performance were explored. Results indicated that math anxiety
was the strongest predictor of both applied and basic math performance. However, this finding was
moderated by the gender of the participants. Both visual and verbal working memory were found to be
significant factors in accounting for the variance in math performance measured broadly, differing from
findings in previous studies. Math anxiety appears to primarily impact visual working memory, con-tradicting previous findings that anxiety is primarily processed in verbal working memory and supporting
the hypothesis that math anxiety does not function similarly to other types of anxiety. In addition, results
supported the Processing Efficiency Theory but did not support the Arousal-Performance Function relating
math anxiety and math performance.
� 2003 Elsevier Ltd. All rights reserved.
1. Introduction
Math performance is considered to be an important aspect of academic achievement tests (e.g.,the Woodcock–Johnson (Woodcock & Johnson, 1990); the Wechsler Individual AchievementTest (Psychological Corporation, 1992); the Iowa Tests of Basic Skills (Hoover, Dunbar, &Frisbie, 2001); the SAT (College Board, 1995); the ACT (American College Testing Program,
* Corresponding author. Tel.: +1-717-948-6065.
E-mail address: [email protected] (J. Bichsel).
0191-8869/$ - see front matter � 2003 Elsevier Ltd. All rights reserved.
doi:10.1016/j.paid.2003.09.029

592 H. Miller, J. Bichsel / Personality and Individual Differences 37 (2004) 591–606
1984); and the GRE (Education Testing Service, 1994)). In addition, math ability is a componentof many intelligence theories (e.g., Gustafsson, 1984; Horn & Cattell, 1966; Thurstone, 1938), andintelligence measures (e.g., the Wechsler Adult Intelligence Scale (Wechsler, 1981), the Stanford–Binet Intelligence Scale (Thorndike, Hagen, & Sattler, 1986); and the Woodcock–Johnson Test ofCognitive Abilities (Woodcock & Johnson, 1990)). Understanding which factors account fordifferences in math performance, then, has important implications for predicting performance onthese measures.
Past research has investigated the underlying cognitive processes that contribute to individualdifferences in math ability, the most investigated of which appears to be working memory. Severalstudies have shown that the processes involved in working memory, namely, temporary retrieval,processing, and storage, explain much of the variance in math ability (e.g., Adams & Hitch, 1998;Ashcraft, 1995; Brainerd, 1983; Geary & Widaman, 1987; Hitch, 1978). Individuals who are moreefficient and adept in carrying out these processes are likely to perform better on tests of mathability.
Another often-researched factor proposed to account for differences in math ability is gender.Theorists have argued about whether findings of an advantage for males over females are theresult of an inherent difference in math ability or the influence of sex-based stereotypes (see Hyde,Fennema, Ryan, Frost, & Hopp, 1990, for a review). It is important to note that the effect sizesreported for the relation between gender and math performance have been small (see Hyde et al.,1990, for a meta-analysis, and Leahey & Guo, 2001, for examination of a large data set).
A third factor that appears to account for differences in math performance is anxiety.Hembree�s (1990) meta-analysis examining math anxiety found that female students consistentlyreported higher levels of math anxiety than their male counterparts. However, this higher level ofanxiety was not found to hinder math performance in females. Rather, math performance in pre-college males was affected more by their levels of math anxiety than math performance in pre-college females. The present study addresses whether gender moderates anxiety�s relation todifferent types of math performance.
1.1. Types of anxiety
There are two general types of anxiety, trait and state. Individuals experiencing trait anxietyhave a characteristic tendency to feel anxious across all types of situations (Sorg & Whitney,1992). In contrast, individuals possessing state anxiety tend to experience it only in specific per-sonally stressful or fearful situations.
The results of several studies demonstrate that both state and trait anxiety affect task perfor-mance (e.g., Leon & Revelle, 1985; MacLeod & Donnellan, 1993; Sorg & Whitney, 1992). Ingeneral, these studies have found that individuals with high trait anxiety show poorer perfor-mance on various tasks than low trait anxiety individuals. This difference tends to be exacerbatedin a high state anxiety condition.
In addition to the two general types of anxiety, there exist more specific types of anxiety,including math and test anxiety. Hembree (1990) found that math anxiety is related to both traitand state anxiety, as well as to test anxiety. Although math anxiety and test anxiety were related,however, the amount of shared variance was moderate ðr2 ¼ 0:27Þ, suggesting that math anxietyis not purely a consequence of anxiety over being tested.

H. Miller, J. Bichsel / Personality and Individual Differences 37 (2004) 591–606 593
2. Anxiety and working memory
2.1. The Arousal-Performance Function
Sorg and Whitney (1992) examined the effects of both trait and state anxiety on workingmemory. Results showed that those individuals with high trait anxiety suffered from workingmemory deficits and poorer performance when placed under the additional stress of a high stateanxiety condition. Of additional interest was that a low level of performance was also observed inlow trait anxiety individuals in the low state anxiety condition. Individuals with intermediatelevels of arousal (low trait anxiety subjects in the high state anxiety condition and high traitanxiety subjects in the low state anxiety condition) experienced the best performance. These re-sults supported the curvilinear function that is often obtained when arousal is plotted with per-formance, termed the Arousal-Performance Function (Sorg & Whitney, 1992). This function wassupported in a subsequent study evaluating reading efficiency (Calvo, Eysenck, Ramos, &Jimenez, 1994).
It is important to note that the Arousal-Performance Function may not be supported withregard to all types of anxiety. Hembree�s (1990) study found that math anxiety was inverselyrelated to the type of anxiety (arousal) found to facilitate performance during testing. Therefore, itmay be the case that the experience of math anxiety does not create a condition of arousal thatfacilitates performance in low trait anxiety subjects. The present study addresses this question.Support for the Arousal-Performance Function may be evidenced in two ways: (a) individuals lowin trait anxiety and high in math anxiety and individuals high in trait anxiety and low in mathanxiety (i.e., intermediate arousal) should experience better math performance than individu-als low in both trait and math anxiety (low arousal) and individuals high in both trait andmath anxiety (high arousal); or (b) individuals with an intermediate level of math anxietyshould experience better performance than those with either a high level or a low level of mathanxiety.
2.2. The Processing Efficiency theory
MacLeod and Donnellan (1993) found that high trait anxiety individuals took longer to per-form a reasoning task than low trait anxiety individuals. Also, subjects in a high-memory-loadcondition performed more slowly than those in a low-memory-load condition. These two effectscombined to produce the slowest decision-making times for the high memory load/high traitanxiety individuals. The authors posited that individuals with high trait anxiety and high memoryload had less working memory available to them.
According to Eysenck and Calvo (1992), the Processing Efficiency Theory states that extraprocessing resources are called upon to improve task performance in situations of high anxiety.This theory predicts that high trait anxiety individuals employ more resources in completing atask in order to maintain the same level of accuracy as low trait anxiety individuals. This strategyincurs poorer performance and longer response times, as the utilization of more resources lowersworking memory capacity. If the Processing Efficiency Theory is supported in regard to mathanxiety in the present study, high math anxiety individuals who have greater working memory

594 H. Miller, J. Bichsel / Personality and Individual Differences 37 (2004) 591–606
capacity should have better math performance scores than high math anxiety individuals whohave less working memory capacity.
2.3. Anxiety and verbal and visual working memory
According to Baddeley and Hitch (1974), the three primary components of working memoryare (a) the central executive, which is responsible for managing tasks in working memory, (b) thephonological loop, which is responsible for verbal information (verbal working memory), and (c)the visuo-spatial scratchpad (VSSP), which is responsible for visual and spatial information (vi-sual working memory). The phonological loop and the VSSP are proposed to be peripheralsubsystems of the central executive. Each has a limited capacity that can influence tasks utilizingthat subsystem.
Research investigating which aspect of working memory is impacted by anxiety has predom-inantly found that anxiety disrupts the verbal component. These studies have found that verbaltasks are better than visual ones in suppressing anxiety (Rapee, 1993), that individuals reportmore verbal than visual memory content during periods of anxiety (Borkovec & Inz, 1990), andthat anxiety interferes more with verbal than with visual task performance, suggesting that anxietyis more disruptive of verbal working memory (Ikeda, Iwanaga, & Seiwa, 1996; Markham &Darke, 1991).
However, not all studies support the notion that anxiety exclusively impacts the verbal workingmemory subsystem. In a study relating measures of visual and verbal working memory to per-formance on a task requiring visual imagery ability, Bichsel and Roskos-Ewoldsen (1999) founddifferent relationships among the measures depending on whether subjects were in a timed (highstate anxiety) or untimed (low state anxiety) condition. In the low state anxiety condition, visualand verbal working memory correlated equivalently with visual imagery performance. However, inthe high state anxiety condition, visual working memory related more strongly to imagery abilitythan did verbal working memory. If the anxiety produced in the high state anxiety condition wasdisruptive of the verbal modality, this would exacerbate the differences between individuals withhigh and low verbal working memory capacity, making verbal working memory a better predictorof task performance. Instead, visual working memory was the better predictor of task performancein the high state anxiety condition. These results suggest that perhaps the subsystem that isimpacted by anxiety may depend on the type of anxiety or the specific task involved.
2.4. Working memory and math performance
A number of influential studies have found that working memory is related to math perfor-mance (Adams & Hitch, 1998; Ashcraft & Kirk, 2001; Hitch, 1978). However, these studies havefocused on only a basic mathematical ability, mental addition. The present study seeks to exploreand compare the relations between working memory and math performance in two spheres: basicand applied math as measured on subtests of math achievement. Adams and Hitch found thatarticulatory suppression interfered with the process of mental addition, implying that, likearticulatory suppression, mental addition is also processed primarily in the verbal subsystem ofworking memory. It is unclear whether this finding applies to other types of calculations andapplied problems such as those found on achievement tests.

H. Miller, J. Bichsel / Personality and Individual Differences 37 (2004) 591–606 595
3. Method
3.1. Subjects
One hundred adults were recruited for this study. A total of 62 females and 38 males comprisedthe subject sample, ranging in age from 18 to 66. The sample consisted of 42 college students, 30college graduates, 2 individuals with less than 2 years of college and no degree, and 26 individualswith no college education. This sample appears to be more representative than those used inprevious studies of adult math performance, most of which have tested college students.
3.2. Measures
Math Performance Assessment. The mathematics subtests of the Woodcock–Johnson Tests ofAchievement (Woodcock & Johnson, 1990) were used to assess basic and applied mathematicsperformance. The first subtest, Calculation (basic math performance), consists of 58 mathematicsquestions presented in a subject response booklet. Items range from simple addition to advancedgeometry, trigonometry, and calculus questions. The second subtest, Applied Problems (appliedmath performance), consists of 60 math problems presented orally by the examiner. Items rangefrom basic counting to lengthy word problems. For example, an applied problem might includeasking how many miles have been traversed given a certain speed and length of time. Otherexamples of applied problems include monetary calculations and the use of geometry to solve litreand cubic feet problems.Math Anxiety Assessment. The Math Anxiety Rating Scale (Richardson & Suinn, 1972) was
used to assess mathematics anxiety. This scale consists of 98 items designed to measure mathanxiety in everyday and academic (including testing) situations.State/Trait Anxiety Assessment. State and trait anxiety were assessed with The State–Trait
Anxiety Inventory (Spielberger, Gorsuch, Lushene, Vagg, & Jacobs, 1984). Half of the scale�s 40items measure state anxiety, and the other half measure trait anxiety. The state anxiety items arecomprised of descriptive statements to which individuals respond by indicating how they feel atthat moment and the intensity of that feeling. The trait anxiety items consist of statements towhich individuals respond by indicating how they generally feel.Verbal Working Memory Assessment. Verbal working memory was assessed via computer. This
task is based on a paradigm created by Daneman and Carpenter (1980) and expanded on byBichsel and Roskos-Ewoldsen (1999). The task consists of sets of sentences ranging in length from9 to 16 words, with each sentence ending in a different, low-imagery word based on nouns rated byPaivio, Yuille, and Madigan (1968). Subjects read groups of sentences aloud and were asked torecall the last words of each sentence at the conclusion of each set of sentences. Sets varied inlength from 2 to 5 sentences. The ability to process larger sets is indicative of greater verbalworking memory capacity.Visual Working Memory Assessment. Visual working memory was assessed via computer using
a paper-folding task (Salthouse, Babcock, Mitchell, Palmon, & Skovronek, 1990). Each of the 56stimuli consists of a piece of paper pictorially represented as a rectangle that is folded on thecomputer screen. The paper is folded either 1, 2, or 3 times, and then a circle appears, representinga holepunch. Subjects determine how the paper will look unfolded, including where the punched

596 H. Miller, J. Bichsel / Personality and Individual Differences 37 (2004) 591–606
holes will be located on the unfolded paper. An unfolded paper then appears, and subjectsindicate whether or not the picture represents how the paper would look with the previousholepunch by striking the appropriate designated key on the keyboard (‘‘/’’ for ‘‘Yes’’ and ‘‘z’’for ‘‘No’’). The ability to process more folds is indicative of greater visual working memorycapacity.
3.3. Procedure
Each subject was administered each of the five measures: math performance, math anxiety,state–trait anxiety, verbal working memory, and visual working memory. The five tasks wereadministered in a predetermined random order using a Latin square procedure.
Subjects were tested individually in sessions that lasted from 1 to 2 h, depending on individualresponse times on each measure. Instructions and stimuli for the working memory measures werepresented on a computer. The State–Trait Anxiety Inventory, the Math Anxiety Rating Scale, andthe Woodcock–Johnson Tests of Achievement math subtests were administered by the examiner,as dictated by the instructions provided with each respective measure.
4. Results
Descriptive statistics for each of the measures are displayed in Table 1. Both of the mathperformance measures were designed to test age ranges from 4 to adult. Therefore, scores on eachof the subtests were expected to fall in the high end of the range given that the sample consistedentirely of adults.
Intercorrelations between each of the measures are displayed in Table 2. Applied math per-formance was correlated with basic math performance, suggesting that the two types of mathperformance are not entirely independent. Visual working memory was not significantly corre-
Table 1
Descriptive statistics for all measures
Measure Range of
scores
Possible
range
Mean SE Reliability estimates
Total Males Females
Applied math
performance
(Applied Problems subtest)
511–580 332–603 537.71 1.22 0.81 0.80 0.82
Basic math performance
(Calculations subtest)
503–573 384–612 541.78 1.49 0.85 0.83 0.88
Visual working memory
(paper-folding task)
23–54 Up to 56 38.97 0.61 0.73 0.78 0.70
Verbal working memory
(reading span task)
20–59 Up to 60 37.82 0.85 0.84 0.82 0.85
State anxiety 20–72 20–80 37.20 1.22 0.94 0.87 0.92
Trait anxiety 21–66 20–80 35.92 0.87 0.90 0.87 0.93
Math anxiety 100–375 98–490 200.22 5.91 0.98 0.97 0.98

Table 2
Intercorrelations between all measures
Measure 1 2 3 4 5 6 7 8
1. Visual working memory – 0.19 0.07 0.06 )0.25� )0.04 0.27�� 0.33��
2. Verbal working memory – )0.03 )0.04 )0.11 0.14 0.23� 0.31��
3. State anxiety – 0.39�� 0.46� 0.27�� )0.17 )0.164. Trait anxiety – 0.29� 0.05 )0.07 )0.105. Math anxiety – 0.26�� )0.32�� )0.41�
6. Gender – )0.09 )0.027. Applied math performance – 0.73��
8. Basic math performance –* p < 0:05.** p < 0:01.
H. Miller, J. Bichsel / Personality and Individual Differences 37 (2004) 591–606 597
lated with verbal working memory, supporting past findings that these are independent processes(e.g. Baddeley & Hitch, 1974; Bichsel & Roskos-Ewoldsen, 1999).
State anxiety, trait anxiety, and math anxiety were all intercorrelated. However, math anxietywas the only type of anxiety that correlated with math performance, relating significantly to bothapplied and basic math performance. This suggests that math performance contains a compo-nent that elicits a specific form of anxiety, one that is not subsumed under either state or traitanxiety.
Gender was not correlated with either measure of math performance, supporting recent re-search indicating that gender differences in math performance are either small or nonexistent(Hyde et al., 1990; Leahey & Guo, 2001). However, gender was correlated with math anxiety, withfemales reporting higher levels of anxiety (M ¼ 212:23, SD¼ 7.86) than males (M ¼ 180:63,SD¼ 7.94). This supports results from previous studies (Dew & Galassi, 1983; Hembree, 1990),which found that females score higher on math anxiety measures than males.
4.1. Regression analyses
To explore which variables were relatively most important in predicting math performance,standard regression analyses were performed by entering the variables that correlated with mathperformance (math anxiety, visual working memory, and verbal working memory) and assessingtheir relative contribution to both applied and basic math performance (see Table 3). Stan-dardized coefficients indicated that math anxiety was the strongest predictor of both applied andbasic math performance. Verbal and visual working memory appeared to be less important thanmath anxiety and approximately equal to each other in the prediction of both types of mathperformance.
4.2. Which of the working memory subsystems is associated with math anxiety?
The intercorrelations in Table 2 reveal that math anxiety appears to be associated with thevisual subsystem of working memory. Specifically, math anxiety had a significant inverse rela-tionship with the visual working memory measure, suggesting these factors have something in
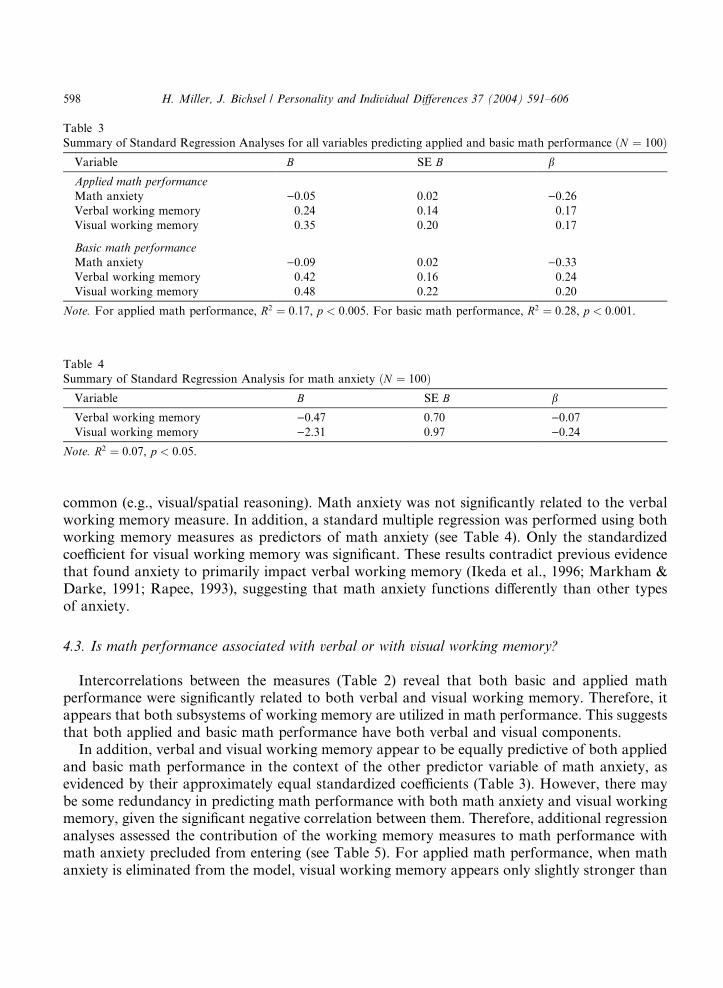
Table 3
Summary of Standard Regression Analyses for all variables predicting applied and basic math performance ðN ¼ 100ÞVariable B SE B b
Applied math performance
Math anxiety )0.05 0.02 )0.26Verbal working memory 0.24 0.14 0.17
Visual working memory 0.35 0.20 0.17
Basic math performance
Math anxiety )0.09 0.02 )0.33Verbal working memory 0.42 0.16 0.24
Visual working memory 0.48 0.22 0.20
Note. For applied math performance, R2 ¼ 0:17, p < 0:005. For basic math performance, R2 ¼ 0:28, p < 0:001.
Table 4
Summary of Standard Regression Analysis for math anxiety ðN ¼ 100ÞVariable B SE B b
Verbal working memory )0.47 0.70 )0.07Visual working memory )2.31 0.97 )0.24
Note. R2 ¼ 0:07, p < 0:05.
598 H. Miller, J. Bichsel / Personality and Individual Differences 37 (2004) 591–606
common (e.g., visual/spatial reasoning). Math anxiety was not significantly related to the verbalworking memory measure. In addition, a standard multiple regression was performed using bothworking memory measures as predictors of math anxiety (see Table 4). Only the standardizedcoefficient for visual working memory was significant. These results contradict previous evidencethat found anxiety to primarily impact verbal working memory (Ikeda et al., 1996; Markham &Darke, 1991; Rapee, 1993), suggesting that math anxiety functions differently than other typesof anxiety.
4.3. Is math performance associated with verbal or with visual working memory?
Intercorrelations between the measures (Table 2) reveal that both basic and applied mathperformance were significantly related to both verbal and visual working memory. Therefore, itappears that both subsystems of working memory are utilized in math performance. This suggeststhat both applied and basic math performance have both verbal and visual components.
In addition, verbal and visual working memory appear to be equally predictive of both appliedand basic math performance in the context of the other predictor variable of math anxiety, asevidenced by their approximately equal standardized coefficients (Table 3). However, there maybe some redundancy in predicting math performance with both math anxiety and visual workingmemory, given the significant negative correlation between them. Therefore, additional regressionanalyses assessed the contribution of the working memory measures to math performance withmath anxiety precluded from entering (see Table 5). For applied math performance, when mathanxiety is eliminated from the model, visual working memory appears only slightly stronger than

Table 5
Summary of Standard Regression Analyses for working memory measures in predicting applied and basic math
performance with math anxiety omitted ðN ¼ 100ÞVariable B SE B b
Applied math performance
Verbal working memory 0.27 0.14 0.19
Visual working memory 0.47 0.20 0.23
Basic math performance
Verbal working memory 0.46 0.17 0.26
Visual working memory 0.68 0.23 0.28
Note. For applied math performance, R2 ¼ 0:11, p < 0:005. For basic math performance, R2 ¼ 0:17, p < 0:001.
H. Miller, J. Bichsel / Personality and Individual Differences 37 (2004) 591–606 599
verbal working memory in terms of their standardized coefficients. For basic math performance,when math anxiety is eliminated from the model, visual working memory and verbal workingmemory again have approximately equal beta coefficients. Therefore, it is concluded that verbaland visual working memory are nearly equally important, but secondary to math anxiety, in theprediction of both applied and basic math performance.
4.4. The Processing Efficiency Theory and math performance
The Processing Efficiency Theory would predict that for individuals high in math anxiety,individuals with higher working memory capacity will outperform individuals with lower workingmemory capacity. Individuals with a math anxiety score above the mean (200.22, n ¼ 43) wereanalyzed for these comparisons. These high math anxiety subjects were further subdivided intothose with higher (above the 60th percentile) and lower (below the 40th percentile) levels of bothverbal and visual working memory. High verbal working memory subjects had a reading spanscore of 38 or above ðn ¼ 15Þ, and low verbal working memory subjects had a reading span scoreof 31 or below ðn ¼ 14Þ. High visual working memory subjects had a paper-folding score of 40 orabove ðn ¼ 17Þ, and low visual working memory subjects were defined as having a paper-foldingscore of 37 or below ðn ¼ 17Þ. These cutoff points assured that the sizes of the comparison groupswere as equivalent as possible.
Results are displayed in Fig. 1. For basic math performance, individuals with high verbalworking memory outperformed those with low verbal working memory, tð27Þ ¼ 2:56, p < 0:01,r2 ¼ 0:44, and individuals with high visual working memory outperformed those with low visualworking memory, tð32Þ ¼ 1:88, p < 0:05, r2 ¼ 0:32. For applied math performance, individualswith high visual working memory outperformed those with low visual working memory,tð32Þ ¼ 1:73, p < 0:05, r2 ¼ 0:29, but there was not a significant difference between the high andlow verbal working memory subjects, tð27Þ ¼ 0:84, p > 0:05. It could be argued that the lack of asignificant difference here could be due to insufficient power attributed to the small sample sizes;however, the effect size was large enough in the other conditions to produce a significant differencebetween the high and low capacity groups. Another explanation is that since math anxiety wasfound to be primarily associated with visual working memory, there was not enough disruption inverbal working memory to produce a difference between high and low working memory capacity

Fig. 1. Mean basic and applied math performance as a function of working memory capacity in individuals with high
math anxiety ðn ¼ 43Þ. Error bars represent standard error.
600 H. Miller, J. Bichsel / Personality and Individual Differences 37 (2004) 591–606
groups; however, this was only the case for applied math performance. It is possible that theproblems in the applied math subtest tax the visual working memory system slightly more thanthe verbal working memory system, and that the basic math problems tax both working memorysystems. Add the conclusion that anxiety primarily impacts visual working memory, and thepattern of results makes sense.
4.5. The Arousal-Performance Function and math performance
The Arousal-Performance Function would predict the poorest performance for those experi-encing the most and the least anxiety and the best performance for those experiencing an inter-mediate level of anxiety. One way the Arousal-Performance Function could be demonstrated is ifindividuals low in trait anxiety and high in math anxiety and individuals high in trait anxiety andlow in math anxiety experience better math performance than individuals low in both trait andmath anxiety and individuals high in both trait and math anxiety. To perform these analyses, wecompared participants who performed above and below the mean levels for both trait anxiety andmath anxiety. This allowed us to compare those experiencing an intermediate level of arousal(high on one type of anxiety and low on another) with those experiencing high levels or low levels
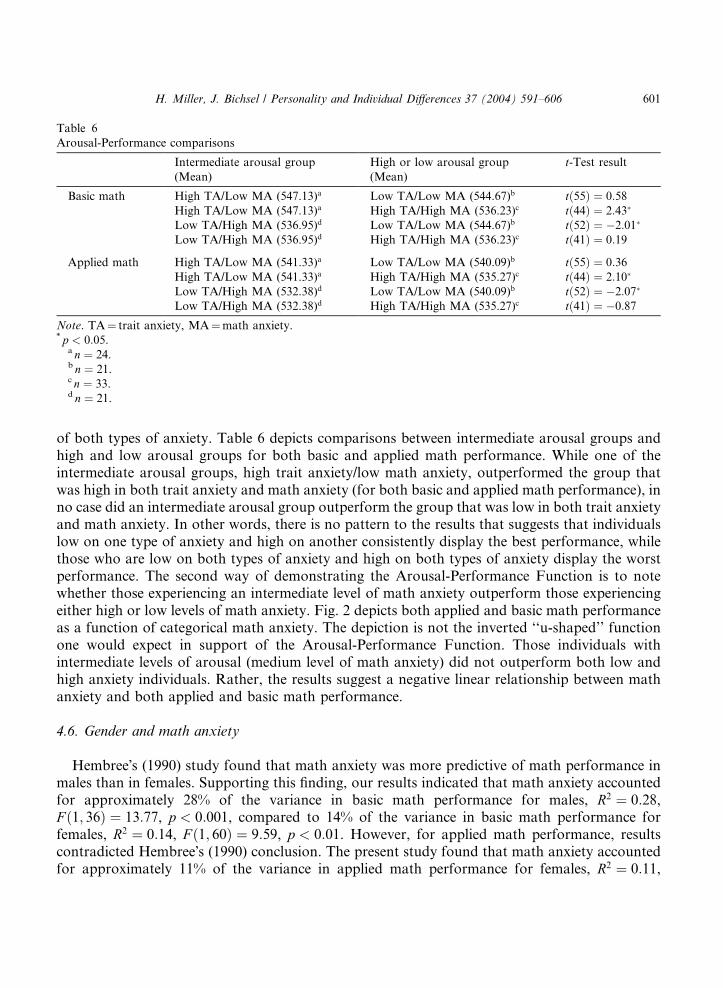
Table 6
Arousal-Performance comparisons
Intermediate arousal group
(Mean)
High or low arousal group
(Mean)
t-Test result
Basic math High TA/Low MA (547.13)a Low TA/Low MA (544.67)b tð55Þ ¼ 0:58High TA/Low MA (547.13)a High TA/High MA (536.23)c tð44Þ ¼ 2:43�
Low TA/High MA (536.95)d Low TA/Low MA (544.67)b tð52Þ ¼ �2:01�
Low TA/High MA (536.95)d High TA/High MA (536.23)c tð41Þ ¼ 0:19
Applied math High TA/Low MA (541.33)a Low TA/Low MA (540.09)b tð55Þ ¼ 0:36High TA/Low MA (541.33)a High TA/High MA (535.27)c tð44Þ ¼ 2:10�
Low TA/High MA (532.38)d Low TA/Low MA (540.09)b tð52Þ ¼ �2:07�
Low TA/High MA (532.38)d High TA/High MA (535.27)c tð41Þ ¼ �0:87
Note. TA¼ trait anxiety, MA¼math anxiety.* p < 0:05.
a n ¼ 24.b n ¼ 21.c n ¼ 33.d n ¼ 21.
H. Miller, J. Bichsel / Personality and Individual Differences 37 (2004) 591–606 601
of both types of anxiety. Table 6 depicts comparisons between intermediate arousal groups andhigh and low arousal groups for both basic and applied math performance. While one of theintermediate arousal groups, high trait anxiety/low math anxiety, outperformed the group thatwas high in both trait anxiety and math anxiety (for both basic and applied math performance), inno case did an intermediate arousal group outperform the group that was low in both trait anxietyand math anxiety. In other words, there is no pattern to the results that suggests that individualslow on one type of anxiety and high on another consistently display the best performance, whilethose who are low on both types of anxiety and high on both types of anxiety display the worstperformance. The second way of demonstrating the Arousal-Performance Function is to notewhether those experiencing an intermediate level of math anxiety outperform those experiencingeither high or low levels of math anxiety. Fig. 2 depicts both applied and basic math performanceas a function of categorical math anxiety. The depiction is not the inverted ‘‘u-shaped’’ functionone would expect in support of the Arousal-Performance Function. Those individuals withintermediate levels of arousal (medium level of math anxiety) did not outperform both low andhigh anxiety individuals. Rather, the results suggest a negative linear relationship between mathanxiety and both applied and basic math performance.
4.6. Gender and math anxiety
Hembree�s (1990) study found that math anxiety was more predictive of math performance inmales than in females. Supporting this finding, our results indicated that math anxiety accountedfor approximately 28% of the variance in basic math performance for males, R2 ¼ 0:28,F ð1; 36Þ ¼ 13:77, p < 0:001, compared to 14% of the variance in basic math performance forfemales, R2 ¼ 0:14, F ð1; 60Þ ¼ 9:59, p < 0:01. However, for applied math performance, resultscontradicted Hembree�s (1990) conclusion. The present study found that math anxiety accountedfor approximately 11% of the variance in applied math performance for females, R2 ¼ 0:11,

333433N =
Math Anxietyhighmediumlow
Mea
n Ba
sic
Mat
h Sc
ore
560
550
540
530
520
333433N =
Math Anxietyhighmediumlow
Mea
n Ap
plie
d M
ath
Scor
e
560
550
540
530
520
Fig. 2. Mean basic and applied math performance as a function of categorical math anxiety. Error bars represent
standard error.
602 H. Miller, J. Bichsel / Personality and Individual Differences 37 (2004) 591–606
F ð1; 60Þ ¼ 7:64, p < 0:01, while math anxiety did not account for a significant portion of thevariance in applied math performance for males.
A moderated regression analysis was performed with gender· anxiety as the predictor variableto see if the nature of the relation between anxiety and math performance was different for menand women. This analysis was significant for basic math, R2 ¼ 0:07, F ð1; 98Þ ¼ 6:79, p < 0:05, andfor applied math, R2 ¼ 0:07, F ð1; 98Þ ¼ 7:21, p < 0:01. Fig. 3 depicts the scatterplots for appliedand basic math performance in males and females. The slope of the regression line is significantlysteeper for males than for females for basic math performance, tð96Þ ¼ 1:68, p < 0:05. However,for applied math performance, the slopes are not significantly different, tð96Þ ¼ 0:09, p > 0:05.These results support the prediction that math anxiety is more predictive of performance in malesthan in females for basic math performance, but not for applied math performance.

Math Anxiety4003002001000
Basi
c M
ath
Perfo
rman
ce
580
560
540
520
500
Math Anxiety4003002001000
Basi
c M
ath
Perfo
rman
ce
580
560
540
520
500
Math Anxiety4003002001000
Appl
ied
Mat
h Pe
rform
ance
580
560
540
520
500
Math Anxiety4003002001000
Appl
ied
Mat
h Pe
rform
ance
580
560
540
520
500
MALES FEMALES
Fig. 3. Scatterplots for math performance as a function of math anxiety in males (left) and females (right).
H. Miller, J. Bichsel / Personality and Individual Differences 37 (2004) 591–606 603
5. Discussion
The results of this study indicate that math anxiety was the most significant factor in predictingvariance in both applied and basic math performance. Individuals with high levels of math anxietyhad lower scores on both the basic and applied math subtests. Additionally, after math anxiety,both verbal working memory (as measured by the reading span task) and visual working memory(as measured by the paper-folding task) appeared to be approximately equally important inpredicting both types of math performance. This was the case whether or not math anxiety wasincluded in the model. These results clarify and add to Adams and Hitch�s (1998) finding thatmental addition was disrupted by articulatory suppression, which disrupts the verbal workingmemory subsystem. Our findings imply that math performance could suffer if either workingmemory subsystem is disrupted. It appears that when a broader scope of math processing ismeasured, such as in our investigation, both the verbal and visual subsystems of working memorymay be involved.

604 H. Miller, J. Bichsel / Personality and Individual Differences 37 (2004) 591–606
Recall that the majority of past studies indicated that anxiety primarily disrupts the verbalworking memory subsystem. According to the present investigation, however, the anxiety re-lated specifically to math primarily impacts visual working memory. One explanation for mathanxiety�s relationship with visual working memory could be the visual/spatial reasoning involvedin both processes. Supporting this explanation, Ashcraft and Kirk (2001) found that a com-putation-based working memory measure was more strongly related to math anxiety than alanguage-based working memory measure. Recall that math anxiety was found to share only27% of its variance with test anxiety, suggesting that some of the variance in math anxiety isspecifically related to mathematics exposure or other factors (Hembree, 1990). When we con-sider the differences between math anxiety and other types of anxiety (e.g., state or trait) interms of the working memory systems that appear to be disrupted by each type, the importanceof this study�s findings is apparent. This investigation supports the idea that math anxiety is aspecial type of anxiety, most likely impacting the visual rather than the verbal working memorysystem.
Overall, the Processing Efficiency Theory was supported in this study. Our results indicate thatin individuals with high math anxiety, individuals with high working memory capacity (bothvisual and verbal) outperformed individuals with low working memory capacity in terms of basicmath. For applied math, high visual working memory subjects outperformed low visual workingmemory subjects, but there was no difference between individuals with high and low verbalworking memory capacity. For the most part, these results indicate that in a high math anxietysituation where more resources would be called upon to complete the math task, those withhigh working memory capacity have more resources available to them to facilitate taskcompletion.
The results of this investigation indicate that the Arousal-Performance Function was notsupported for math anxiety related to math performance. The results directly relating mathanxiety and math performance clearly indicated a negative linear relation between math anxietyand math performance on both the basic and applied math subtests, rather than the inverted u-shaped function one would expect to find in support of the Arousal-Performance Function. Inaddition, math anxiety did not interact with trait anxiety in supporting the Arousal-PerformanceFunction. These results suggest that math anxiety is a special type of anxiety that does notfunction similarly to trait and state anxiety in terms of arousal.
Finally, gender was found to moderate the relation between anxiety and math performance,and this moderating effect differed depending on the type of math performance. Math anxietyaccounted for more of the variance in basic math performance for males than females. Con-versely, math anxiety did not account for a significant amount of variance in applied math per-formance for males, while math anxiety did significantly account for the variance in applied mathperformance for females. Math anxiety appears to be nearly equally predictive of females� basicand applied math performance, consistent with previous findings (Hembree, 1990). The differencesin the influence of math anxiety on basic and applied math performance for males would suggestthat there is something inherent in the basic math subtest that elicits math anxiety in males, moreso than in females. It is suggested that, in line with stereotypical math differences, perhaps malesare more comfortable with completing spatially related math problems, such as those on theapplied math subtest. This level of comfort would most likely ease math anxiety in the completionof such tasks.

H. Miller, J. Bichsel / Personality and Individual Differences 37 (2004) 591–606 605
6. Conclusions
Math anxiety was found to be the most important predictor of math performance, followed byboth verbal and visual working memory. Math anxiety does not function entirely like other typesof anxiety, at least as related to math performance. The finding that math anxiety is primarilyassociated with visual working memory, rather than verbal working memory, contradicts previousresults in which more limited math abilities were tested. In addition, the results of this studysupported the Processing Efficiency Theory, but failed to support the Arousal-PerformanceFunction regarding math anxiety and math performance. Furthermore, it is interesting to notethat males� math anxiety affected their performance on basic math, but not on applied math, andthat math anxiety accounted for more of the variance on basic math performance for males thanfor females. The results of this study may be more representative than previous ones that haveutilized samples of children and educated young adults, since our sample comprised a wide agerange of adults with varying levels of education. Overall, these results add to our knowledge of therelations between task performance, working memory, and anxiety.
Acknowledgements
We thank Barbara Maffett, who tested many of the subjects involved in the study and assistedin data entry. We also thank William Chaplin for his comments and suggested revisions to themanuscript.
References
Adams, J. W., & Hitch, G. J. (1998). Children�s mental arithmetic and working memory. In C. Donlan (Ed.), The
development of mathematical skills (pp. 153–173). East Sussex, UK: Psychology Press Ltd.
American College Testing Program (1984). American College Testing (ACT) Assessment Program. Author.
Ashcraft, M. H. (1995). Cognitive psychology and simple arithmetic: A review and summary of new directions.
Mathematical Cognition, 1, 3–34.
Ashcraft, M. H., & Kirk, E. P. (2001). The relationships among working memory, math anxiety, and performance.
Journal of Experimental Psychology: General, 130, 224–237.
Baddeley, A. D., & Hitch, G. (1974). Working memory. In G. H. Bower (Ed.), The psychology of learning and
motivation (Vol. 8, pp. 47–89). Academic Press: New York.
Bichsel, J., & Roskos-Ewoldsen, B. (1999). Imaginal discovery, working memory, and intelligence. Journal of Mental
Imagery, 231, 17–34.
Borkovec, T. D., & Inz, J. (1990). The nature of worry in generalized anxiety disorder: A predominance of thought
activity. Behaviour, Research, and Therapy, 28, 153–158.
Brainerd, C. J. (1983). Young children�s mental arithmetic errors: A working memory analysis. Child Development, 54,
812–830.
Calvo, M. G., Eysenck, M. W., Ramos, P. M., & Jimenez, A. (1994). Compensatory reading strategies in test anxiety.
Anxiety, Stress, and Coping, 7, 99–116.
College Board (1995). Admission officer’s handbook for the SAT Program. New York: College Entrance Examination
Board.
Daneman, M., & Carpenter, P. A. (1980). Individual differences in working memory and reading. Journal of Verbal
Learning and Verbal Behavior, 19, 450–466.

606 H. Miller, J. Bichsel / Personality and Individual Differences 37 (2004) 591–606
Dew, K. H., & Galassi, J. P. (1983). Mathematics anxiety: Some basic issues. Journal of Counseling Psychology, 30, 443–
446.
Education Testing Service (1994). The graduate record examination––general test. Author.
Eysenck, M. W., & Calvo, M. G. (1992). Anxiety and performance: The processing efficiency theory. Cognition and
Emotion, 6, 409–434.
Geary, D. C., & Widaman, K. F. (1987). Individual differences in cognitive arithmetic. Journal of Experimental
Psychology: General, 116, 154–171.
Gustafsson, J. E. (1984). A unifying model for the structure of intellectual abilities. Intelligence, 8, 179–203.
Hembree, R. (1990). The nature, effects, and relief of mathematics anxiety. Journal for Research in Mathematics
Education, 21, 33–46.
Hitch, G. (1978). The role of short-term working memory in mental arithmetic. Cognitive Psychology, 10, 302–323.
Hoover, H. D., Dunbar, S. B., & Frisbie, D. A. (2001). Iowa Tests of Basic Skills, Form A. Ithasca, IL: The Riverside
Publishing Co.
Horn, J. L., & Cattell, R. B. (1966). Refinement of test of the theory of fluid and crystallized general intelligences.
Journal of Educational Psychology, 57, 253–270.
Hyde, J. S., Fennema, E., Ryan, M., Frost, L. A., & Hopp, C. (1990). Gender comparisons of mathematics attitudes
and affect. Psychology of Women Quarterly, 14, 299–324.
Ikeda, M., Iwanaga, M., & Seiwa, H. (1996). Test anxiety and working memory system. Perceptual and Motor Skills,
82, 1223–1231.
Leahey, E., & Guo, G. (2001). Gender differences in mathematical trajectories. Social Forces, 80, 713–732.
Leon, M. R., & Revelle, W. (1985). The effects of anxiety on analogical reasoning: A test of three theoretical models.
Journal of Personality and Social Psychology, 49, 1302–1315.
MacLeod, C., & Donnellan, A. M. (1993). Individual differences in anxiety and the restriction of working memory
capacity. Personality and Individual Differences, 15, 163–173.
Markham, R., & Darke, S. (1991). The effects of anxiety on verbal and spatial task performance. Australian Journal of
Psychology, 43, 107–111.
Paivio, A., Yuille, J. C., & Madigan, S. A. (1968). Concreteness, imagery, and meaningfulness values for 925 nouns.
Journal of Experimental Psychology Monograph Supplement, 76, 1–25.
Psychological Corporation (1992). Wechsler Individual Achievement Test––WIAT Manual. San Antonio, TX: Author.
Rapee, R. M. (1993). The utilisation of working memory by worry. Behaviour Research Therapy, 31, 617–620.
Richardson, F., & Suinn, R. (1972). The Mathematics Anxiety Rating Scale: Psychonometric data. Journal of
Counseling Psychology, 19, 551–554.
Salthouse, T. A., Babcock, R. L., Mitchell, D. R. D., Palmon, R., & Skovronek, E. (1990). Sources of individual
differences in spatial visualization ability. Intelligence, 14, 187–230.
Sorg, B. A., & Whitney, P. (1992). The effect of trait anxiety and situational stress on working memory capacity. Journal
of Research in Personality, 26, 235–241.
Spielberger, C. D., Gorsuch, R. L., Lushene, R., Vagg, P. R., & Jacobs, G. A. (1984). State–Trait Anxiety Inventory.
Consulting Psychological Press, Inc.
Thorndike, R.L., Hagen, E.P., Sattler, J.M. (1986). The Stanford–Binet Intelligence Scale: Fourth Edition, Technical
Manual. Chicago, IL: Riverside.
Thurstone, L. L. (1938). Primary mental abilities. Psychometric Monographs, 1.
Wechsler, D. (1981). WAIS-R manual: Wechsler Adult Intelligence Scale––revised. San Antonio, TX: Psychological
Corporation.
Woodcock, R.W., Johnson, M.B. (1990). Woodcock–Johnson Psycho-Educational Battery––Revised. DLM Teaching
Resources, Allen, TX.