any questions albuquerque, nm 87131 telephone: 505-277...
TRANSCRIPT

For an electronic version of this book,visit our web site at www.unm.edu/~oir
Telephone: 505-277-5115Fax: 505-277-7655
E-mail: [email protected]
Any questionsconcerning material contained
in this book should be directed to:
The University of New MexicoOffice of Institutional Research
Scholes Hall, Room 306Albuquerque, NM 87131
UNM Fact Book2002-2003
2002-2003 UNM Fact Book - Page ii
Introduction v Enrollment - Branch CampusesI
Facts at a Glance Enrollment by Campus and Degree Status (Fall 1996-2002) 25Enrollment, Gallup Branch (Fall 1998-2002) 26
Historical Enrollment (Fall 1930-2002) 1 Community Outreach Programs, Gallup Branch 27Students (Fall 2002) 2 (1997-1998 to 2001-2002)Total Enrollment - All UNM Units Combined (Fall 1998-2002) 3 Enrollment, Los Alamos Branch (Fall 1998-2002) 28Preparation, Retention, and Graduation Rates, Main Campus 4 Community Outreach Programs, Los Alamos Branch 29Degrees Awarded (2001-2002 Academic Year) 5 (1997-1998 to 2001-2002)UNM Count of Employees (as of October, 2002) 6 Enrollment, Taos Branch (Fall 1998-2002) 30Budget Plan (FY 2003) 7 Community Outreach Programs, Taos Branch 31
(1997-1998 to 2001-2002)Enrollment - Main Campus Enrollment, Valencia Branch (Fall 1998-2002) 32
Community Outreach Programs, Valencia Branch 33Undergraduate Enrollment by Program (Fall 1996-2002) 9 (1997-1998 to 2001-2002)Graduate/Professional Enrollment by Program 10 Student Credit Hours by Course Level (Fall 1996-2002) 34
(Fall 1996-2002) Enrollment by Age (Fall 1998-2002) 35On-Campus and Extended Service Enrollment 11
(Fall 1996-2002) Beginning Freshmen & Transfer Students -Total Enrollment, Main Campus (Fall 1998-2002) 12 Main CampusUndergraduate Students (Fall 1998-2002) 13Graduate Programs & AGSM Students (Fall 1998-2002) 14 Beginning Freshmen Ethnicity (Fall 1998-2002) 37Law Students (Fall 1998-2002) 15 High School Performance Indicators of First-Time 38Medical Students (Fall 1998-2002) 16 Freshmen, (Fall 1993-2002)PharmD. Students (Fall 1998-2002) 17 NM HS Graduates (2001-2002) & UNM Beginning Freshmen 40Non-Degree Students (Fall 1998-2002) 18 (Fall 2002)Student Credit Hours by Course Level (Fall 1996-2002) 19 Residency of First-Time Freshmen by NM County 41Student Credit Hours by College & Course Level 20 (Fall 1998-2002)
(Fall 1996-2002) Residency of First-Time Freshmen by US State 42Enrollment by Age (Fall 1998-2002) 22 (Fall 1998-2002)
Transfer Students to Main Campus (Fall 1998-2002) 43
Table of Contents

2002-2003 UNM Fact Book - Page iii
Degree Programs, Program Accreditation & Valencia Branch Faculty (Fall 1998 to 2002) 78Degrees Awarded & Alumni Faculty by Highest Degree Earned, Main Campus (Fall 2002) 80
Faculty by College, Main Campus (Fall 2002) 82Degree Programs, Main Campus 45 Faculty Diversity - New Hires, Main Campus Faculty (1998-2002) 83Accreditation at UNM, Institutional and Programmatic 49
(as of 12/2002) StaffDegrees Awarded, Main Campus (1992-1993 to 2001-2002) 53Degrees Awarded by Ethnicity, Main Campus 54 UNM Regular Staff by Site (Fall 1998 to 2002) 87
(1997-1998 to 2001-2002) UNM Temporary Staff by Site (Fall 1998 to 2002) 88Retention and Graduation Rates, Main Campus 55 Regular Staff - All UNM (Fall 1998 to 2002) 89
(Fall 1992 to Fall 2002 Freshmen Classes) Regular Staff - Main Campus, Non-Medical 90Degrees Awarded by Ethnicity, Branch Campuses 56 (Fall 1998 to 2002)
(1997-1998 to 2001-2002) Regular Staff - Nursing, Pharmacy, Basic Medical 91UNM Alumni in New Mexico by County 58 Sciences (Fall 1998 to 2002)
Regular Staff - Clinical Health Sciences (Fall 1998 to 2002) 92Regular Staff - Extended University (Fall 1998 to 2002) 93
Faculty Regular Staff - Gallup Branch (Fall 1998 to 2002) 94Regular Staff - Los Alamos Branch (Fall 1998 to 2002) 95
All Faculty Combined and Tenure-Track Faculty by Site 59 Regular Staff - Taos Branch (Fall 1998 to 2002) 96(Fall 1998-2002) Regular Staff - Valencia Branch (Fall 1998 to 2002) 97
Non-Tenure-Track Instructional Faculty by Site (Fall 1998-2002) 60 Student Employees by Site (Fall 1998 to 2002) 98Non-Tenure-Track Research Faculty by Site (Fall 1998-2002) 61All UNM Faculty (Fall 1998 to 2002) 62 Faculty Scholarship, Research & LibrariesMain Campus, Non-Medical Faculty (Fall 1998 to 2002) 64Nursing, Pharmacy & Basic Medical Sciences Faculty 66 Faculty Scholarship (1992-1993 to 2001-2002) 101
(Fall 1998 to 2002) UNM Centers & Institutes Main Campus (2002-2003) 102Clinical Health Sciences Faculty (Fall 1998 to 2002) 68 UNM Centers & Institutes, Health Sciences Center (2002-2003) 103Extended University Faculty (Fall 1998 to 2002) 70 Contract & Grant Awards, UNM Total (FY 2002) 104Gallup Branch Faculty (Fall 1998 to 2002) 72 Contract & Grant Expenditures, UNM Total (FY 1990-FY 2002) 105Los Alamos Branch Faculty (Fall 1998 to 2002) 74 UNM Patents (FY 1997-1998 to FY 2001-2002) 106Taos Branch Faculty (Fall 1998 to 2002) 76
Table of Contents

2002-2003 UNM Fact Book - Page iv
Faculty Scholarship, Research & Libraries Full-Time Tuition & Fees, Branch Campuses 121(continued) (1996-1997 to 2002-2003)
Comparative Faculty Salaries, Main Campus 122Computer and Information Resources and Technology (CIRT) 107 (Fall 1996-2001)
(FY 2001-2002) UNM Peer Institutions 122UNM Main Campus Libraries (2001-2002) 108 Staff Salary Profile - All UNM Campuses Combined 123
(as Reported in Fall 2002)Revenue & Expenditures UNM Endowment Funds (FY 1994-2002) 124
Gift Activity (FY 1998 to 2002) 126Actual Current Fund Revenue - All UNM Units Combined 111 UNM Facilities 127
Combined (FY 1996-1997 to FY 2001-2002) Capital Outlay Projects (2003-2004) 128Actual Current Fund Expenditures - All UNM Units 112
(FY 1996-1997 to FY 2001-2002) UNM Organizational Structure (2002-2003)Actual Current Fund Expenditures, Main Campus 113
(FY 1996-1997 to FY 2001-2002) The University of New Mexico 131Actual Current Fund Expenditures, Health Sciences 114 Provost, VP for Academic Affairs 132 (FY 1996-1997 to FY 2001-2002) Provost, VP for Academic Affairs - Branch Campuses 133Actual Current Fund Expenditures, Branch Campuses 115 Deputy Provost 134
(FY 1996-1997 to FY 2001-2002) Vice Provost Extended University & Dean of Continuing 135Education
Other Finance & Resource Data Vice Provost for Research 136Assoc. Provost, Academic Affairs 137
Financial Aid by Source and Type of Aid 117 VP, Business & Finance 140All UNM UNITS Combined (1999-2000 to 2001-2002) VP, Student Affairs 141Financial Aid Recipients by Ethnicity, Sex & Level (Fall 2001) 118 VP, Institutional Advancement 142Scholarships, All UNM Units Combined 119 VP, Health Sciences 143
(1997-1998 to 2001-2002) UNM Board of Regents 144Full-Time Tuition & Fees, Main Campus 120
(1996-1997 to 2002-2003)
Table of Contents

UNM Facts2002-2003
Introduction
An additional unit of the University of New Mexico is the Division of Continuing Education and Community Services, which serves approximately 33,000 students annually in various non-credit or certificate courses, workshops, and training sessions. The Division serves another 10,600 students and clients in a variety of areas, including testing for placement and certification and evaluation for training and educational services. An additional 9,000 students earning academic credits were served during 2001-2002 through units assigned to Continuing Education, including Non-Degree Advisement, Independent Study, and Extension Services.
In fall 2002, the campuses of the University of New Mexico served 31,795 students; employed 2,963 faculty, 7,460 staff, and 5,086 students (an additional 4,068 staff work at University Hospital); and had a total operating and capital budget of about $1.2 billion. In the previous academic year, UNM awarded 4,398 degrees and certificates.
This fact book presents data for all UNM campuses. UNM consists of a Main Campus located in Albuquerque, which includes the Health Sciences Center; four branch campuses, which have a two-year degree mission: UNM-Gallup, UNM-Los Alamos, UNM-Taos, and UNM-Valencia; and an Extended University which provides access to courses on-site as well as via technologies—including satellite broadcasts, videoconferencing, and on-line instruction— throughout the state. The Extended University also encompasses the Upper Division & Graduate Centers at Los Alamos and Santa Fe and upper division and graduate course delivery at Taos, Gallup, Kirtland Airforce Base, and Rio Rancho. The UNM Health Sciences Center and its programs—which include the School of Medicine, College of Nursing, and College of Pharmacy—are included in the UNM Fact Book, sometimes as part of the Main Campus and sometimes separately. Footnotes and labels should make it clear in each case what is included.
2002-2003 UNM Fact Book - Page v
Los Alamos
Gallup
Taos
Main Campus
Valencia

2002-2003 UNM Fact Book - Page vi
Facts at a Glance
2002-2003 UNM Fact Book - Page 1
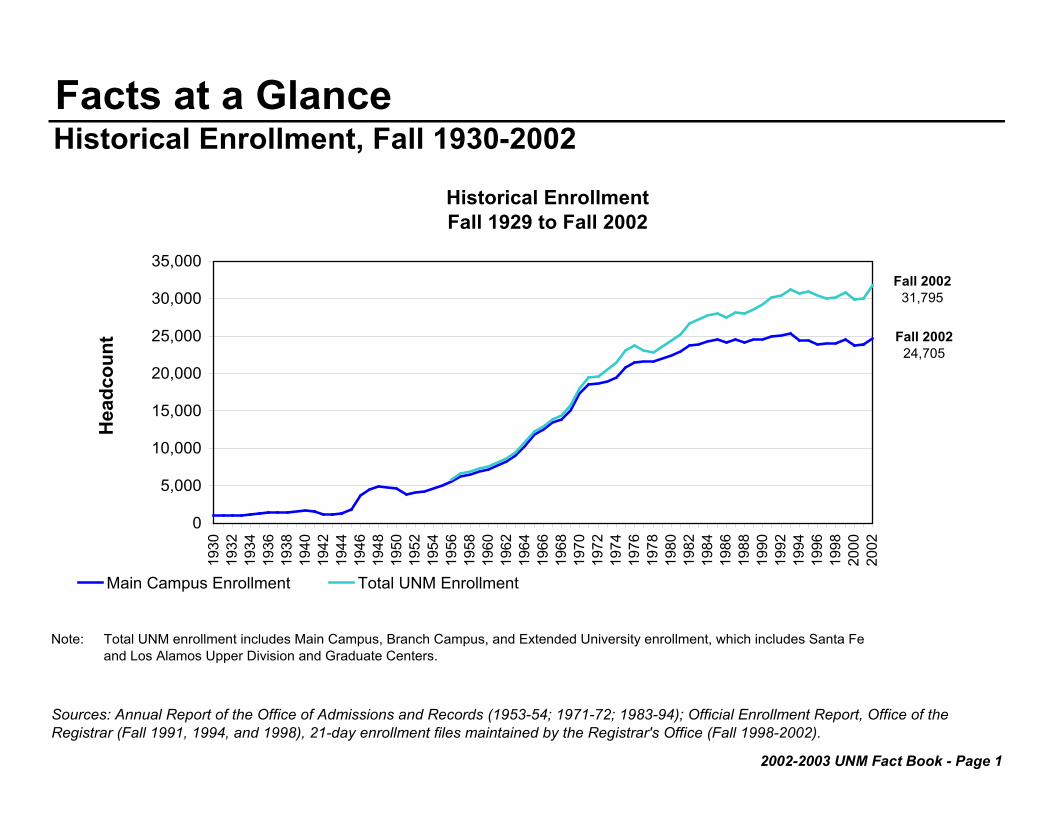
Facts at a GlanceHistorical Enrollment, Fall 1930-2002
Note: Total UNM enrollment includes Main Campus, Branch Campus, and Extended University enrollment, which includes Santa Fe and Los Alamos Upper Division and Graduate Centers.
Sources: Annual Report of the Office of Admissions and Records (1953-54; 1971-72; 1983-94); Official Enrollment Report, Office of the Registrar (Fall 1991, 1994, and 1998), 21-day enrollment files maintained by the Registrar's Office (Fall 1998-2002).
Historical EnrollmentFall 1929 to Fall 2002
0
5,000
10,000
15,000
20,000
25,000
30,000
35,000
1930
1932
1934
1936
1938
1940
1942
1944
1946
1948
1950
1952
1954
1956
1958
1960
1962
1964
1966
1968
1970
1972
1974
1976
1978
1980
1982
1984
1986
1988
1990
1992
1994
1996
1998
2000
2002
Hea
dcou
nt
Main Campus Enrollment Total UNM Enrollment
Fall 200231,795
Fall 200224,705

2002-2003 UNM Fact Book - Page 2
Facts at a GlanceStudents (Fall 2002)
Total Students Females Males Avg. Age FTE**
Main Campus* 24,705 14,140 10,565 28 19,224Branches 7,090 4,645 2,445 30 3,647Total 31,795 18,785 13,010 28 22,871
* Includes Health Sciences Center (HSC) and Extended University** Includes FTE from the developmental courses offered on Main Campus by ATVI.Source: Fall 21-day enrollment files maintained by the Registrar's Office.
Fall 2002 Enrollment
Ethnicity - Main Campus*African
American/Black2.4%
Asian/Pacific Islander
3.5%American Indian5.6%
International3.7%
No Response3.6%
Hispanic28.6%
White, non-Hispanic52.6%
Ethnicity - Total UNM
White, non-Hispanic46.7%
Hispanic29.1%
No Response
4.6%
International3.0%
American Indian11.7%
Asian/Pacific Islander
2.9%
African American/
Black2.1%

2002-2003 UNM Fact Book - Page 3
Facts at a GlanceTotal Enrollment (Fall 1998 to 2002)
1998 1999 2000 2001 2002 1998 1999 2000 2001 2002=Total Headcount 30,150 30,869 29,888 30,048 31,795Full-time 17,279 17,970 17,614 17,963 18,815 57.3 58.2 58.9 59.8 59.2Part-time 12,871 12,899 12,274 12,085 12,980 42.7 41.8 41.1 40.2 40.8Avg. Hrs. per Sem. 10.18 10.30 10.41 10.54 10.50Full-Time Equivalent 20,994 21,749 21,328 21,710 22,869
1998 1999 2000 2001 2002 1998 1999 2000 2001 2002Average Age 29 29 29 29 28Females 17,960 18,399 17,793 17,958 18,785 59.6 59.6 59.5 59.8 59.1Males 12,190 12,470 12,095 12,090 13,010 40.4 40.4 40.5 40.2 40.9African American/Black 622 669 615 602 620 2.1 2.2 2.1 2.0 1.9American Indian 3,299 3,407 3,388 3,322 3,728 10.9 11.0 11.3 11.1 11.7Asian/Pacific Islander 841 883 887 926 935 2.8 2.9 3.0 3.1 2.9Hispanic 8,105 8,552 8,605 8,776 9,254 26.9 27.7 28.8 29.2 29.1White, non-Hispanic 15,764 15,657 14,625 14,486 14,833 52.3 50.7 48.9 48.2 46.7International 616 715 766 836 948 2.0 2.3 2.6 2.8 3.0No Response 903 986 1,002 1,100 1,477 3.0 3.2 3.4 3.7 4.6
Source: Fall 21-day enrollment files maintained by the Registrar's Office.
Percentages
Percentages
Total Fall Enrollment (Main, HSC, Branches, and Extended University
Student Demographics
2002-2003 UNM Fact Book - Page 4
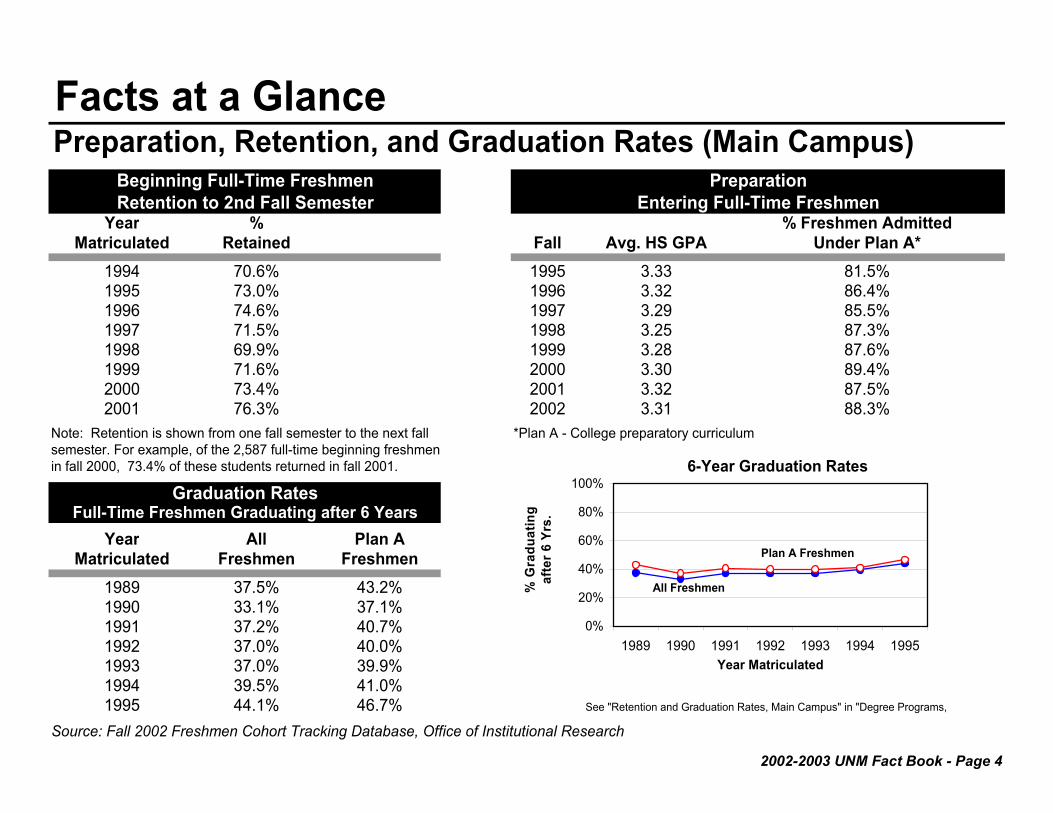
Facts at a GlancePreparation, Retention, and Graduation Rates (Main Campus)
Year % % Freshmen AdmittedMatriculated Retained Fall Avg. HS GPA Under Plan A*
1994 70.6% 1995 3.33 81.5%1995 73.0% 1996 3.32 86.4%1996 74.6% 1997 3.29 85.5%1997 71.5% 1998 3.25 87.3%1998 69.9% 1999 3.28 87.6%1999 71.6% 2000 3.30 89.4%2000 73.4% 2001 3.32 87.5%2001 76.3% 2002 3.31 88.3%
Note: Retention is shown from one fall semester to the next fall *Plan A - College preparatory curriculumsemester. For example, of the 2,587 full-time beginning freshmenin fall 2000, 73.4% of these students returned in fall 2001.
Year All Plan AMatriculated Freshmen Freshmen
1989 37.5% 43.2%1990 33.1% 37.1%1991 37.2% 40.7%1992 37.0% 40.0%1993 37.0% 39.9%1994 39.5% 41.0%1995 44.1% 46.7% See "Retention and Graduation Rates, Main Campus" in "Degree Programs,
Source: Fall 2002 Freshmen Cohort Tracking Database, Office of Institutional Research
PreparationEntering Full-Time Freshmen
Graduation RatesFull-Time Freshmen Graduating after 6 Years
Beginning Full-Time FreshmenRetention to 2nd Fall Semester
6-Year Graduation Rates
0%
20%
40%
60%
80%
100%
1989 1990 1991 1992 1993 1994 1995Year Matriculated
% G
radu
atin
gaf
ter 6
Yrs
.
All Freshmen
Plan A Freshmen

2002-2003 UNM Fact Book - Page 5
Facts at a GlanceDegrees Awarded (2001-2002 Academic Year)
LosDegree Main* Gallup Alamos Valencia Taos TotalCertificates 0 53 8 14 33 108Associate Degrees 3 102 40 76 35 256Bachelors 2,514 – – – – 2,514Masters 1,030 – – – – 1,030Professional 286 – – – – 286Doctorate 189 – – – – 189Post-Masters Certificate 8 – – – – 8Education Specialist 7 – – – – 7
Total 4,037 155 48 90 68 4,398*Includes HSC. Degrees earned at Extended University, which includes Los Alamos and Santa Fe Upper Division and Graduate Centers, are awarded through UNM Main Campus.
Source: Fall 2002 Official Enrollment Report, Office of the Registrar; 2001-2002 IPEDS Completions Survey
Total Degrees Awarded
Bachelors57.2%
Associate Degrees
5.8%
Masters23.4%
Professional6.5%
Doctorate4.3%
Education Specialist
0.2%
Post-Masters Certificate
0.2% Certificates2.5%

2002-2003 UNM Fact Book - Page 6
Facts at a GlanceUNM Count of Employees as of October, 2002
UNM HospitalFaculty Students Staff Total Staff
Employee Totals 2,963 5,086 7,326 15,375 4,068 19,443
Full-Time * 1,824 0 5,023 6,847 2,997 9,844Part-Time 1,139 5,086 2,303 8,528 1,071 9,599
Regular 1,830 0 4,973 6,803 4,039 10,842Temporary 1,133 5,086 2,353 8,572 29 8,601
Main Campus 1,470 3,868 4,433 9,771 0 9,771Extended University ** 140 13 125 278 0 278Health Sciences Center*** 887 942 2,435 4,264 4,068 8,332Branches/Education Center 466 263 333 1,062 0 1,062
* UNM Hospital defines full-time as an FTE of .8 or greater; UNM classfies full-time as an FTE of 1.0 or greater.***** Includes Nursing, Pharmacy, Basic Medical Sciences, and Clinical Health Sciences.
Source: Office of Institutional Research
UNM UNM & UNM Hospital Combined
Includes Continuing Education and Los Alamos and Santa Fe Upper Divison and Graduate Centers.
Category
2002-2003 UNM Fact Book - Page 7
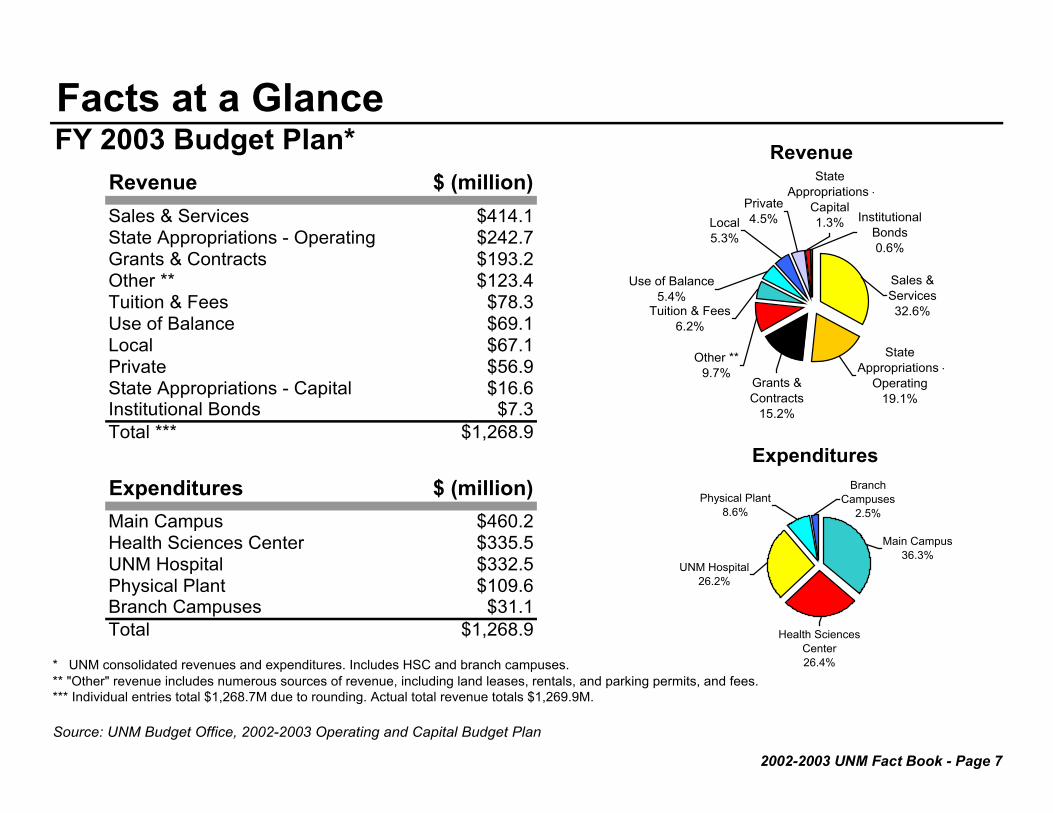
Facts at a GlanceFY 2003 Budget Plan*
Revenue $ (million)Sales & Services $414.1State Appropriations - Operating $242.7Grants & Contracts $193.2Other ** $123.4Tuition & Fees $78.3Use of Balance $69.1Local $67.1Private $56.9State Appropriations - Capital $16.6Institutional Bonds $7.3Total *** $1,268.9
Expenditures $ (million)Main Campus $460.2Health Sciences Center $335.5UNM Hospital $332.5Physical Plant $109.6Branch Campuses $31.1Total $1,268.9
* UNM consolidated revenues and expenditures. Includes HSC and branch campuses.** "Other" revenue includes numerous sources of revenue, including land leases, rentals, and parking permits, and fees.*** Individual entries total $1,268.7M due to rounding. Actual total revenue totals $1,269.9M.
Source: UNM Budget Office, 2002-2003 Operating and Capital Budget Plan
Revenue
Institutional Bonds0.6%
State Appropriations -
Capital1.3%
Private4.5%Local
5.3%
Use of Balance5.4%
Sales & Services32.6%
State Appropriations -
Operating19.1%
Grants & Contracts
15.2%
Other **9.7%
Tuition & Fees6.2%
ExpendituresBranch
Campuses2.5%
Physical Plant8.6%
Main Campus36.3%
UNM Hospital26.2%
Health Sciences Center26.4%
2002-2003 UNM Fact Book - Page 8

Enrollment – Main Campus

2002-2003 UNM Fact Book - Page 9
Undergraduate Enrollment by ProgramMain Campus1 (Fall 1996 to Fall 2002)
1996 1997 1998 1999 2000 2001 2002Undergraduate Studies 5,295 5,432 6,093 6,931 6,904 6,897 7,237Arts & Sciences 4,061 4,138 4,120 4,035 3,866 4,014 4,429Engineering 1,152 1,217 1,212 1,219 1,181 1,111 1,110Education 972 1,014 983 1,007 1,055 1,101 1,064Anderson School of Mgmt. 789 872 866 850 961 974 1,051Fine Arts 480 496 501 504 494 554 562Architecture & Planning 156 141 140 129 114 116 127BUS 1,042 976 866 840 748 765 719Assoc. Programs 67 53 64 65 73 49 63Cert. Programs 25 8 19 10 25 18 20Sub-total 14,039 14,347 14,864 15,590 15,421 15,599 16,382Nursing 501 402 435 422 327 286 281Pharmacy2 322 222 135 36 Dental Programs 73 71 64 63 51 56 55Misc. Allied Health 166 170 197 211 158 101 88Health Sciences Sub-total 1,062 865 831 732 536 443 424Total Undergraduate 15,101 15,212 15,695 16,322 15,957 16,042 16,8061Reported enrollments include all Extended Services enrollments.2With the advent of the graduate PharmD. Program in 1996, the undergraduate Pharmacy Program is being phased out.
Source: Fall 21-day enrollment files maintained by the Registrar's Office.
Main Campus Undergraduate Enrollment by Program

2002-2003 UNM Fact Book - Page 10
Graduate/Professional Enrollment by ProgramMain Campus1 (Fall 1996 to Fall 2002)
1996 1997 1998 1999 2000 2001 2002Arts and Sciences 1,495 1,474 1,408 1,376 1,389 1,359 1,379Engineering 567 521 453 446 491 559 676Education 1,373 1,329 1,158 1,153 1,120 1,159 1,099Public Administration 123 149 166 144 178 154 160Fine Arts 180 174 183 171 166 181 177Architecture & Planning 191 205 179 174 181 195 200Interdisciplinary 27 22 26 27 36 35 46Medical Science 98 92 103 116 146 181 225Nursing 133 117 109 107 133 83 88Pharmacy 18 17 18 14 16 16 20Graduate Programs Sub-total 4,205 4,100 3,803 3,728 3,856 3,922 4,070Anderson Grad. School of Mgmt. 452 461 465 449 428 430 481Law 339 343 332 351 346 339 333Medicine 302 305 303 302 297 302 304PharmD. (new program) 76 192 292 368 362 386 351Total Graduate/Professional 5,374 5,401 5,195 5,198 5,289 5,379 5,539
Undergraduate 15,101 15,212 15,695 16,322 15,957 16,042 16,806Graduate/Professional 5,374 5,401 5,195 5,198 5,289 5,379 5,539Non-Degree 3,415 3,450 3,068 2,984 2,522 2,438 2,360Grand Total 23,890 24,063 23,958 24,504 23,768 23,859 24,7051Reported enrollments include all Extended Services enrollments.Source: Fall 21-day enrollment files maintained by the Registrar's Office.
Main Campus Graduate/Professional Enrollment by Program
Total Main Campus Enrollment

2002-2003 UNM Fact Book - Page 11
On-Campus and Extended Services EnrollmentMain Campus1 (Fall 1996 to Fall 2002)
1996 1997 1998 1999 2000 2001 2002Exclusively On-CampusUndergraduate 14,636 14,704 15,113 15,737 15,397 15,473 16,294Graduate/Professional 5,139 5,210 5,052 5,065 5,170 5,279 5,416Non-Degree 2,988 2,902 2,684 2,668 2,303 2,220 2,185Total 22,763 22,816 22,849 23,470 22,870 22,972 23,895
On-Campus and Extended ServiceUndergraduate 97 125 160 188 215 226 143Graduate/Professional 67 61 69 63 72 45 71Non-Degree 16 29 29 32 24 19 20Total 180 215 258 283 311 290 234
Exclusively Extended ServiceUndergraduate 368 383 422 397 345 343 369Graduate/Professional 168 130 74 70 47 55 52Non-Degree 411 519 355 284 195 199 155Total 947 1,032 851 751 587 597 576
Undergraduate 15,101 15,212 15,695 16,322 15,957 16,042 16,806Graduate/Professional 5,374 5,401 5,195 5,198 5,289 5,379 5,539Non-Degree 3,415 3,450 3,068 2,984 2,522 2,438 2,360Grand Total 23,890 24,063 23,958 24,504 23,768 23,859 24,705
Source: Fall 21-day enrollment files maintained by the Registrar's Office.
Enrollment by Level and On and/or Off Campus
Total Main Campus Enrollment
1Extended Services enrollment does not represent all enrollment in the Extended University; courses in the Albuquerque SMSA and Internet courses are funded as Main Campus enrollments, and as such, they are not reported as Extended Services.
2002-2003 UNM Fact Book - Page 12
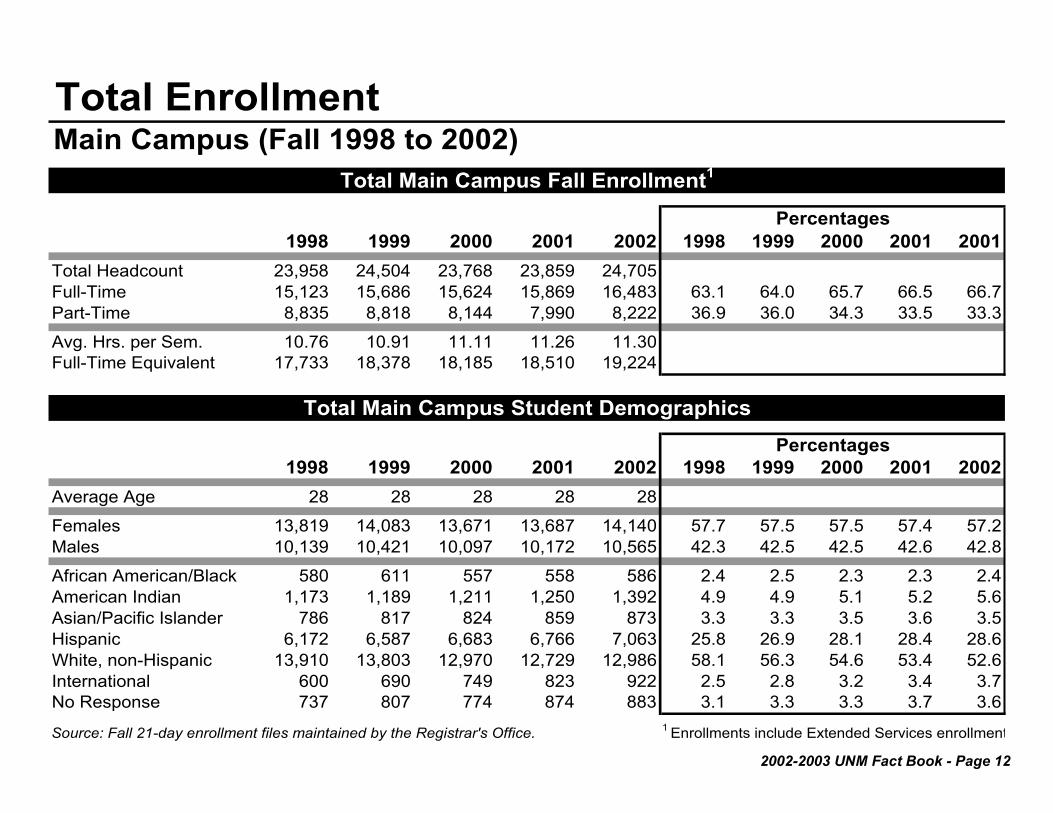
Total EnrollmentMain Campus (Fall 1998 to 2002)
1998 1999 2000 2001 2002 1998 1999 2000 2001 2001Total Headcount 23,958 24,504 23,768 23,859 24,705Full-Time 15,123 15,686 15,624 15,869 16,483 63.1 64.0 65.7 66.5 66.7Part-Time 8,835 8,818 8,144 7,990 8,222 36.9 36.0 34.3 33.5 33.3
Avg. Hrs. per Sem. 10.76 10.91 11.11 11.26 11.30Full-Time Equivalent 17,733 18,378 18,185 18,510 19,224
1998 1999 2000 2001 2002 1998 1999 2000 2001 2002Average Age 28 28 28 28 28
Females 13,819 14,083 13,671 13,687 14,140 57.7 57.5 57.5 57.4 57.2Males 10,139 10,421 10,097 10,172 10,565 42.3 42.5 42.5 42.6 42.8
African American/Black 580 611 557 558 586 2.4 2.5 2.3 2.3 2.4American Indian 1,173 1,189 1,211 1,250 1,392 4.9 4.9 5.1 5.2 5.6Asian/Pacific Islander 786 817 824 859 873 3.3 3.3 3.5 3.6 3.5Hispanic 6,172 6,587 6,683 6,766 7,063 25.8 26.9 28.1 28.4 28.6White, non-Hispanic 13,910 13,803 12,970 12,729 12,986 58.1 56.3 54.6 53.4 52.6International 600 690 749 823 922 2.5 2.8 3.2 3.4 3.7No Response 737 807 774 874 883 3.1 3.3 3.3 3.7 3.6
Source: Fall 21-day enrollment files maintained by the Registrar's Office. 1 Enrollments include Extended Services enrollment
Total Main Campus Fall Enrollment1
Percentages
Total Main Campus Student DemographicsPercentages

2002-2003 UNM Fact Book - Page 13
Undergraduate StudentsMain Campus1 (Fall 1998 to 2002)
1998 1999 2000 2001 2002 1998 1999 2000 2001 2001Total Headcount 15,695 16,322 15,957 16,042 16,806Full-Time 12,049 12,649 12,518 12,655 13,214 76.8 77.5 78.4 78.9 78.6Part-Time 3,646 3,673 3,439 3,387 3,592 23.2 22.5 21.6 21.1 21.4
Avg. Hrs. per Sem. 12.47 12.57 12.73 12.85 12.88Full-Time Equivalent 13,046 13,673 13,538 13,747 14,428
1998 1999 2000 2001 2002 1998 1999 2000 2001 2002Average Age 25 25 25 24 24
Females 9,070 9,377 9,165 9,165 9,622 57.8 57.5 57.4 57.1 57.3Males 6,625 6,945 6,792 6,877 7,184 42.2 42.5 42.6 42.9 42.7
African American/Black 417 445 409 417 455 2.7 2.7 2.6 2.6 2.7American Indian 903 917 940 979 1,130 5.8 5.6 5.9 6.1 6.7Asian/Pacific Islander 543 539 550 553 579 3.5 3.3 3.4 3.4 3.4Hispanic 4,784 5,118 5,255 5,317 5,588 30.5 31.4 32.9 33.1 33.3White, non-Hispanic 8,553 8,728 8,235 8,168 8,461 54.5 53.5 51.6 50.9 50.3International 137 146 129 142 135 0.9 0.9 0.8 0.9 0.8No Response 358 429 439 466 458 2.3 2.6 2.8 2.9 2.7Source: Fall 21-day enrollment files maintained by the Registrar's Office. 1 Enrollments include Extended Services enrollment
Undergraduate Fall EnrollmentPercentages
Undergraduate Student DemographicsPercentages
2002-2003 UNM Fact Book - Page 14
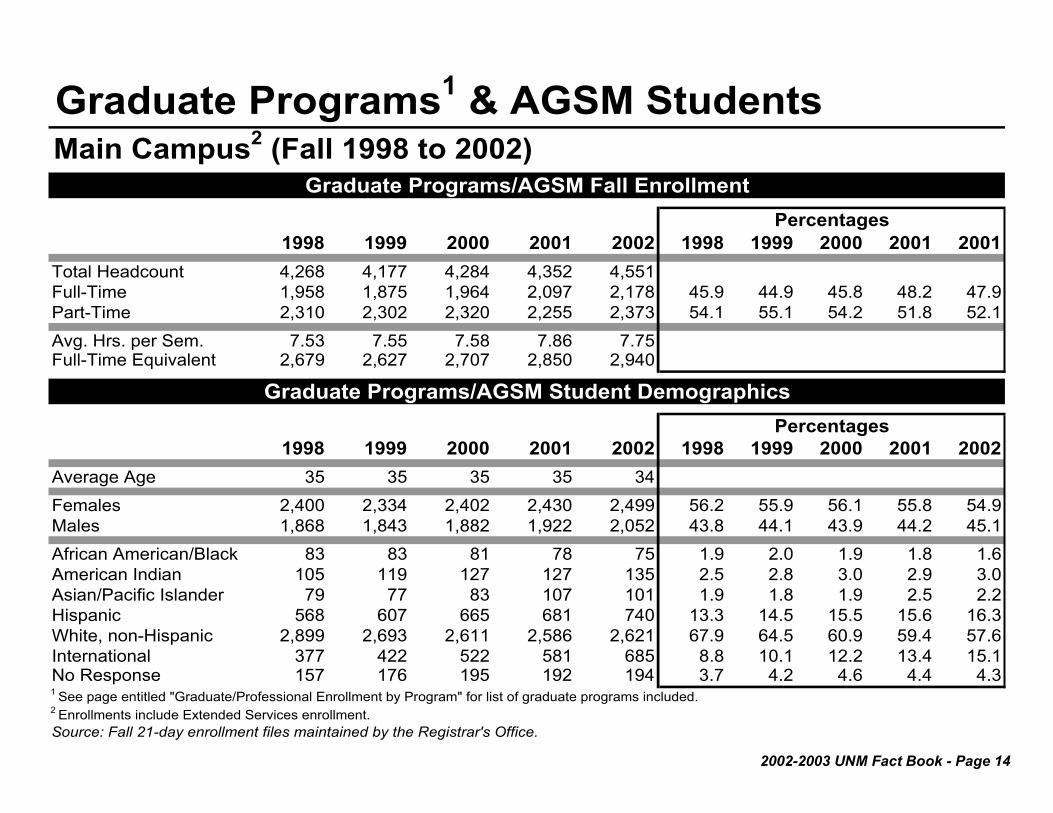
Graduate Programs1 & AGSM StudentsMain Campus2 (Fall 1998 to 2002)
1998 1999 2000 2001 2002 1998 1999 2000 2001 2001Total Headcount 4,268 4,177 4,284 4,352 4,551Full-Time 1,958 1,875 1,964 2,097 2,178 45.9 44.9 45.8 48.2 47.9Part-Time 2,310 2,302 2,320 2,255 2,373 54.1 55.1 54.2 51.8 52.1Avg. Hrs. per Sem. 7.53 7.55 7.58 7.86 7.75Full-Time Equivalent 2,679 2,627 2,707 2,850 2,940
1998 1999 2000 2001 2002 1998 1999 2000 2001 2002Average Age 35 35 35 35 34Females 2,400 2,334 2,402 2,430 2,499 56.2 55.9 56.1 55.8 54.9Males 1,868 1,843 1,882 1,922 2,052 43.8 44.1 43.9 44.2 45.1African American/Black 83 83 81 78 75 1.9 2.0 1.9 1.8 1.6American Indian 105 119 127 127 135 2.5 2.8 3.0 2.9 3.0Asian/Pacific Islander 79 77 83 107 101 1.9 1.8 1.9 2.5 2.2Hispanic 568 607 665 681 740 13.3 14.5 15.5 15.6 16.3White, non-Hispanic 2,899 2,693 2,611 2,586 2,621 67.9 64.5 60.9 59.4 57.6International 377 422 522 581 685 8.8 10.1 12.2 13.4 15.1No Response 157 176 195 192 194 3.7 4.2 4.6 4.4 4.31 See page entitled "Graduate/Professional Enrollment by Program" for list of graduate programs included.2 Enrollments include Extended Services enrollment.Source: Fall 21-day enrollment files maintained by the Registrar's Office.
Graduate Programs/AGSM Fall EnrollmentPercentages
Graduate Programs/AGSM Student DemographicsPercentages

2002-2003 UNM Fact Book - Page 15
Law StudentsMain Campus (Fall 1998 to 2002)
1998 1999 2000 2001 2002 1998 1999 2000 2001 2001Total Headcount 332 351 346 339 333Full-Time 330 349 340 331 325 99.4 99.4 98.3 97.6 97.6Part-Time 2 2 6 8 8 0.6 0.6 1.7 2.4 2.4Avg. Hrs. per Sem. 15.08 14.73 14.63 14.52 14.58Full-Time Equivalent 417 431 422 410 405
1998 1999 2000 2001 2002 1998 1999 2000 2001 2002Average Age 31 31 31 31 31
Females 178 203 206 204 199 53.6 57.8 59.5 60.2 59.8Males 154 148 140 135 134 46.4 42.2 40.5 39.8 40.2
African American/Black 7 9 10 7 8 2.1 2.6 2.9 2.1 2.4American Indian 20 26 24 24 25 6.0 7.4 6.9 7.1 7.5Asian/Pacific Islander 8 7 7 7 5 2.4 2.0 2.0 2.1 1.5Hispanic 83 86 77 77 78 25.0 24.5 22.3 22.7 23.4White, non-Hispanic 196 206 210 207 201 59.0 58.7 60.7 61.1 60.4International 1 3 3 2 1 0.3 0.9 0.9 0.6 0.3No Response 17 14 15 15 15 5.1 4.0 4.3 4.4 4.5
Source: Fall 21-day enrollment files maintained by the Registrar's Office.
Law Fall Enrollment
Percentages
Law Student DemographicsPercentages
2002-2003 UNM Fact Book - Page 16
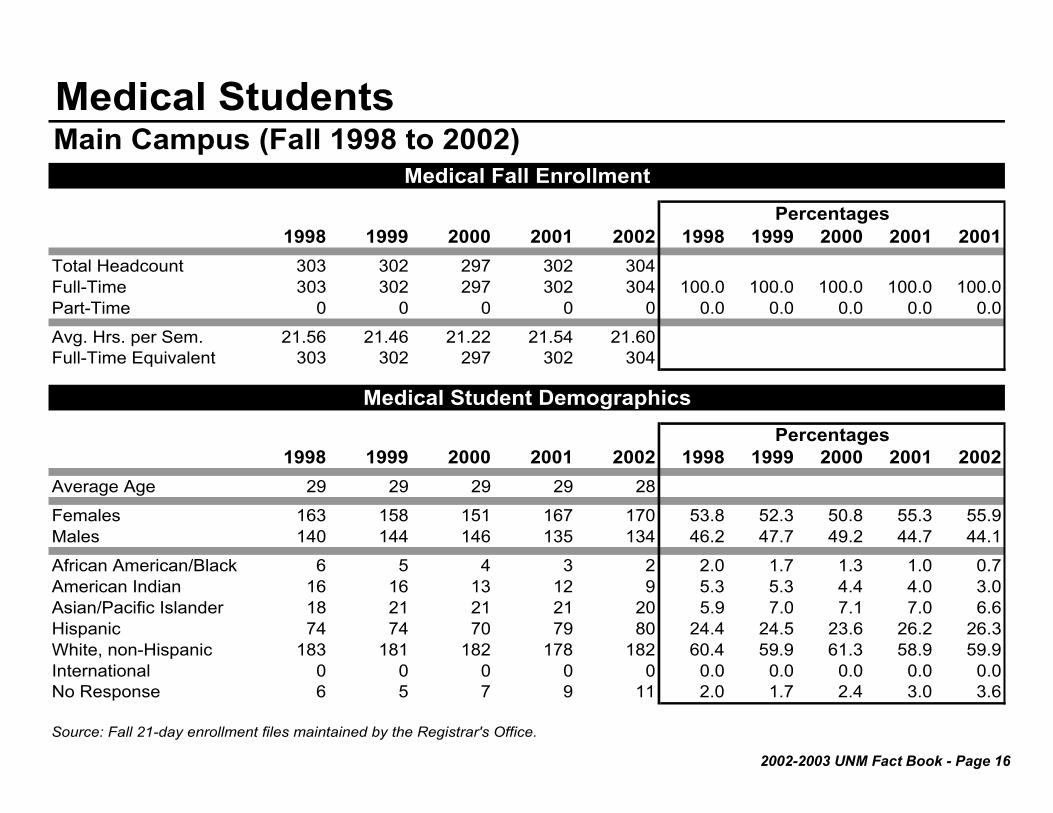
Medical StudentsMain Campus (Fall 1998 to 2002)
1998 1999 2000 2001 2002 1998 1999 2000 2001 2001Total Headcount 303 302 297 302 304Full-Time 303 302 297 302 304 100.0 100.0 100.0 100.0 100.0Part-Time 0 0 0 0 0 0.0 0.0 0.0 0.0 0.0
Avg. Hrs. per Sem. 21.56 21.46 21.22 21.54 21.60Full-Time Equivalent 303 302 297 302 304
1998 1999 2000 2001 2002 1998 1999 2000 2001 2002Average Age 29 29 29 29 28
Females 163 158 151 167 170 53.8 52.3 50.8 55.3 55.9Males 140 144 146 135 134 46.2 47.7 49.2 44.7 44.1
African American/Black 6 5 4 3 2 2.0 1.7 1.3 1.0 0.7American Indian 16 16 13 12 9 5.3 5.3 4.4 4.0 3.0Asian/Pacific Islander 18 21 21 21 20 5.9 7.0 7.1 7.0 6.6Hispanic 74 74 70 79 80 24.4 24.5 23.6 26.2 26.3White, non-Hispanic 183 181 182 178 182 60.4 59.9 61.3 58.9 59.9International 0 0 0 0 0 0.0 0.0 0.0 0.0 0.0No Response 6 5 7 9 11 2.0 1.7 2.4 3.0 3.6
Source: Fall 21-day enrollment files maintained by the Registrar's Office.
Medical Fall EnrollmentPercentages
Medical Student DemographicsPercentages

2002-2003 UNM Fact Book - Page 17
PharmD. StudentsMain Campus (Fall 1998 to 2002)
1998 1999 2000 2001 2002 1998 1999 2000 2001 2001Total Headcount 292 368 362 386 351Full-Time 219 278 314 328 299 75.0 75.5 86.7 85.0 85.2Part-Time 73 90 48 58 52 25.0 24.5 13.3 15.0 14.8Avg. Hrs. per Sem. 11.11 11.53 13.10 13.26 13.03Full-Time Equivalent 270 354 395 426 381
1998 1999 2000 2001 2002 1998 1999 2000 2001 2002Average Age 30 30 30 30 30Females 173 216 218 238 208 59.2 58.7 60.2 61.7 59.3Males 119 152 144 148 143 40.8 41.3 39.8 38.3 40.7African American/Black 5 8 9 8 6 1.7 2.2 2.5 2.1 1.7American Indian 6 6 9 14 14 2.1 1.6 2.5 3.6 4.0Asian/Pacific Islander 62 84 104 98 92 21.2 22.8 28.7 25.4 26.2Hispanic 71 99 97 107 98 24.3 26.9 26.8 27.7 27.9White, non-Hispanic 142 167 139 152 132 48.6 45.4 38.4 39.4 37.6International 2 1 1 2 2 0.7 0.3 0.3 0.5 0.6No Response 4 3 3 5 7 1.4 0.8 0.8 1.3 2.0
* Fall Enrollment Reports combine the data on sex for Grad. Programs, AGSM, and PharmD. OIR calculated the breakdown of the data for sex and average age shown here. Source: Fall 21-day enrollment files maintained by the Registrar's Office.
PharmD. Fall EnrollmentPercentages
PharmD. Student Demographics*Percentages

2002-2003 UNM Fact Book - Page 18
Non-Degree StudentsMain Campus1 (Fall 1998 to 2002)
1998 1999 2000 2001 2002 1998 1999 2000 2001 2001Total Headcount 3,068 2,984 2,522 2,438 2,360Full-Time 264 233 191 156 163 8.6 7.8 7.6 6.4 6.9Part-Time 2,804 2,751 2,331 2,282 2,197 91.4 92.2 92.4 93.6 93.1
Avg. Hrs. per Sem. 4.98 4.98 4.92 4.76 4.87Full-Time Equivalent 1,018 991 827 774 767
1998 1999 2000 2001 2002 1998 1999 2000 2001 2002Average Age 36 37 37 37 37
Females 1,835 1,795 1,529 1,483 1,442 59.8 60.2 60.6 60.8 61.1Males 1,233 1,189 993 955 918 40.2 39.8 39.4 39.2 38.9
African American/Black 62 61 44 45 40 2.0 2.0 1.7 1.8 1.7American Indian 123 105 98 94 79 4.0 3.5 3.9 3.9 3.3Asian/Pacific Islander 76 89 59 73 76 2.5 3.0 2.3 3.0 3.2Hispanic 592 603 519 505 479 19.3 20.2 20.6 20.7 20.3White, non-Hispanic 1,937 1,828 1,593 1,438 1,389 63.1 61.3 63.2 59.0 58.9International 83 118 94 96 99 2.7 4.0 3.7 3.9 4.2No Response 195 180 115 187 198 6.4 6.0 4.6 7.7 8.4
Source: Fall 21-day enrollment files maintained by the Registrar's Office. 1 Enrollments include Extended Services enrollment.
Non-Degree Fall EnrollmentPercentages
Non-Degree Student DemographicsPercentages

2002-2003 UNM Fact Book - Page 19
Student Credit Hours by Course LevelMain Campus (Fall 1996 to Fall 2002)*
Level 1996 1997 1998 1999 2000 2001 2002
Freshman 74714 78412 85396 92159 95224 96588 102,294Sophomore 39517 36715 36317 37984 35937 35323 36,871Junior 52288 54434 51507 54583 51281 52585 55,229Senior 35511 34489 34288 30918 30079 29935 29,850Graduate 34681 34349 32300 32476 32777 34926 36,036Professional 11516 13068 14380 15467 15674 16129 15,474Total 248,227 251,467 254,188 263,587 260,972 265,486 275,754
Freshman = 100 level courses Graduate = 500-600 level coursesSophomore = 200 level courses Professional = courses in Medicine, Law, Junior = 300 level courses and Pharm DSenior = 400 level courses
* Includes Health Sciences Center credit hours.
Source: Student Credit Hours Report (January 2002), Office of Institutional Research
Student Credit Hours by Course Level
Student Credit Hours by Course LevelFall Semesters 1995-2001
0
50,000
100,000
150,000
200,000
250,000
300,000
1996
1997
1998
1999
2000
2001
2002
Tota
l Cre
dit H
ours
Professional
Graduate
Senior
Junior
Sophomore
Freshman

2002-2003 UNM Fact Book - Page 20
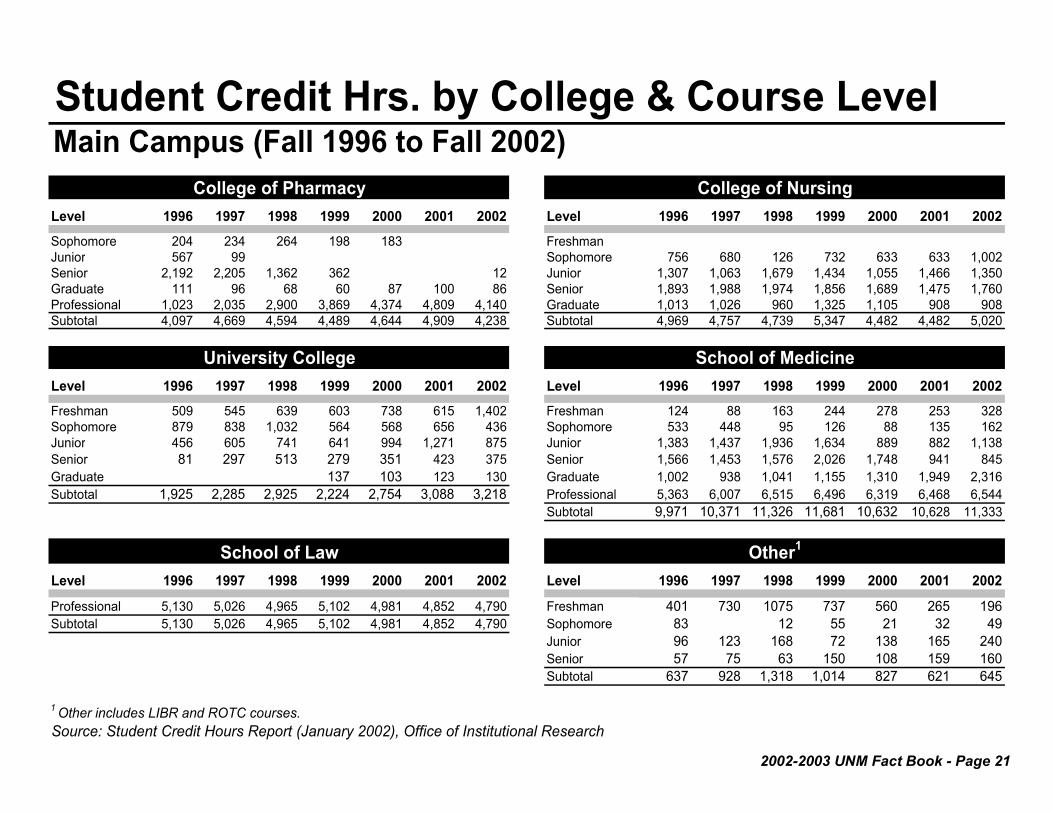
Student Credit Hrs. by College & Course LevelMain Campus (Fall 1996 to Fall 2002)
Level 1996 1997 1998 1999 2000 2001 2002 Level 1996 1997 1998 1999 2000 2001 2002Freshman 58,030 62,736 67,065 72,881 76,259 77,855 81,835 Freshman 5,480 4,408 4,744 4,929 4,778 5,018 5,203Sophomore 26,887 23,873 24,181 25,374 23,704 23,843 24,907 Sophomore 1,866 2,054 2,293 2,270 2,178 1,814 1,873Junior 27,786 29,996 26,596 28,362 25,857 26,665 28,174 Junior 5,256 5,600 5,653 6,263 5,685 5,915 5,938Senior 12,482 11,532 12,084 10,907 10,614 11,027 10,311 Senior 8,241 8,073 7,683 7,123 6,752 6,746 6,833Graduate 10,445 10,443 10,258 10,188 10,483 10,820 10,882 Graduate 11,035 10,626 9,153 9,209 8,761 8,961 8,501Subtotal 135,630 138,580 140,184 147,712 146,917 150,210 156,109 Subtotal 31,878 30,761 29,526 29,794 28,154 28,454 28,348
Level 1996 1997 1998 1999 2000 2001 2002 Level 1996 1997 1998 1999 2000 2001 2002Freshman 2,683 2,676 2,788 3,063 2,964 2,816 2,807 Freshman 6,165 6,149 7,602 8,580 8,588 9,028 9,656Sophomore 2,077 2,079 2,119 2,124 1,969 1,858 1,874 Sophomore 4,165 4,337 4,119 4,228 4,175 3,910 3,970Junior 3,863 3,735 3,462 3,580 3,741 3,500 3,919 Junior 3,266 2,940 3,059 3,430 3,143 3,215 3,415Senior 2,847 3,023 2,780 2,580 2,643 2,813 2,859 Senior 2,542 2,360 2,583 2,294 2,174 1,956 2,039Graduate 3,825 3,686 3,105 3,050 3,288 4,073 4,765 Graduate 1,320 1,239 1,172 1,190 1,252 1,373 1,349Subtotal 15,295 15,199 14,254 14,397 14,605 15,060 16,224 Subtotal 17,458 17,025 18,535 19,722 19,332 19,482 20,429
Level 1996 1997 1998 1999 2000 2001 2002 Level 1996 1997 1998 1999 2000 2001 2002Freshman 786 528 717 516 576 258 177 Freshman 536 552 603 606 483 480 690Sophomore 1,491 1,443 1,479 1,623 1,758 1,731 1,872 Sophomore 576 729 597 690 660 711 726Junior 7,677 8,208 7,641 8,480 9,081 8,909 9,387 Junior 631 628 572 687 698 597 793Senior 2,518 2,668 2,908 2,680 3,401 3,795 4,002 Senior 1,092 815 762 661 599 600 654Graduate 4,634 4,849 5,251 4,732 5,017 4,983 5,307 Graduate 1,296 1,446 1,292 1,430 1,371 1,636 1,792Subtotal 17,106 17,696 17,996 18,031 19,833 19,676 20,745 Subtotal 4,131 4,170 3,826 4,074 3,811 4,024 4,655
Source: Student Credit Hours Report (January 2002), Office of Institutional Research
The Robert O. Anderson Schools of Management School of Architecture and Planning
College of Arts and Sciences College of Education
School of Engineering College of Fine Arts
2002-2003 UNM Fact Book - Page 21
Student Credit Hrs. by College & Course LevelMain Campus (Fall 1996 to Fall 2002)
Level 1996 1997 1998 1999 2000 2001 2002 Level 1996 1997 1998 1999 2000 2001 2002Sophomore 204 234 264 198 183 FreshmanJunior 567 99 Sophomore 756 680 126 732 633 633 1,002Senior 2,192 2,205 1,362 362 12 Junior 1,307 1,063 1,679 1,434 1,055 1,466 1,350Graduate 111 96 68 60 87 100 86 Senior 1,893 1,988 1,974 1,856 1,689 1,475 1,760Professional 1,023 2,035 2,900 3,869 4,374 4,809 4,140 Graduate 1,013 1,026 960 1,325 1,105 908 908Subtotal 4,097 4,669 4,594 4,489 4,644 4,909 4,238 Subtotal 4,969 4,757 4,739 5,347 4,482 4,482 5,020
Level 1996 1997 1998 1999 2000 2001 2002 Level 1996 1997 1998 1999 2000 2001 2002Freshman 509 545 639 603 738 615 1,402 Freshman 124 88 163 244 278 253 328Sophomore 879 838 1,032 564 568 656 436 Sophomore 533 448 95 126 88 135 162Junior 456 605 741 641 994 1,271 875 Junior 1,383 1,437 1,936 1,634 889 882 1,138Senior 81 297 513 279 351 423 375 Senior 1,566 1,453 1,576 2,026 1,748 941 845Graduate 137 103 123 130 Graduate 1,002 938 1,041 1,155 1,310 1,949 2,316Subtotal 1,925 2,285 2,925 2,224 2,754 3,088 3,218 Professional 5,363 6,007 6,515 6,496 6,319 6,468 6,544
Subtotal 9,971 10,371 11,326 11,681 10,632 10,628 11,333
Level 1996 1997 1998 1999 2000 2001 2002 Level 1996 1997 1998 1999 2000 2001 2002
Professional 5,130 5,026 4,965 5,102 4,981 4,852 4,790 Freshman 401 730 1075 737 560 265 196Subtotal 5,130 5,026 4,965 5,102 4,981 4,852 4,790 Sophomore 83 12 55 21 32 49
Junior 96 123 168 72 138 165 240Senior 57 75 63 150 108 159 160Subtotal 637 928 1,318 1,014 827 621 645
1 Other includes LIBR and ROTC courses.Source: Student Credit Hours Report (January 2002), Office of Institutional Research
School of Law Other1
College of Pharmacy College of Nursing
University College School of Medicine

2002-2003 UNM Fact Book - Page 22
Enrollment by Age, Fall 1998-2002First-Time Freshmen & Undergraduates, Main Campus
Age 1998 1999 2000 2001 2002 1998 1999 2000 2001 2002Under 18 206 180 166 165 164 212 189 172 173 177 18 2,206 2,340 2,245 2,052 2,382 2,383 2,551 2,433 2,225 2,558 19 187 178 178 144 206 1,909 2,147 2,267 2,207 2,190 20 20 28 23 19 12 1,661 1,936 2,035 2,165 2,125 21 19 13 4 4 11 1,595 1,678 1,855 1,987 2,061 22 12 11 3 6 16 1,330 1,426 1,374 1,556 1,708 23 3 4 8 4 8 1,014 925 926 899 958 24 4 3 2 4 7 740 717 595 649 629 25 5 1 2 2 2 532 506 474 470 515 26 3 1 1 7 455 447 386 384 444 27 1 3 1 2 436 366 324 307 335 28 1 1 1 333 343 272 271 281 29 2 269 267 275 219 266 30-39 2 3 2 3 1,658 1,586 1,426 1,411 1,423 40-49 1 940 974 846 820 800 50-64 212 249 283 280 318 Over 64 15 15 14 17 16 Unavailable 1 1 2 2
Total 2,665 2,764 2,639 2,406 2,821 15,695 16,322 15,957 16,042 16,806
<= 24 years 99.7% 99.7% 99.6% 99.7% 99.5% 69.1% 70.9% 73.1% 73.9% 73.8%25-29 years 0.3% 0.2% 0.3% 0.2% 0.4% 12.9% 11.8% 10.8% 10.3% 11.0%30-39 years 0.0% 0.1% 0.1% 0.1% 0.1% 10.6% 9.7% 8.9% 8.8% 8.5%40+ years 0.0% 0.0% 0.0% 0.0% 0.0% 7.4% 7.6% 7.2% 7.0% 6.7%Median Age 18.5 18.5 18.5 18.5 18.5 22.1 21.8 21.6 21.6 21.7Mean Age 18.6 18.6 18.6 18.6 18.6 25.0 24.8 24.5 24.5 24.4* Includes first-time freshmen.
Source: Office of Institutional Research
First-Time Freshmen Undergraduates *

2002-2003 UNM Fact Book - Page 23
Enrollment by Age, Fall 1998-2002Graduate/AGSM Students & Professional Students*, Main Campus
Age 1998 1999 2000 2001 2002 1998 1999 2000 2001 2002Under 18 1 18 1 1 19 1 1 3 2 1 20 2 1 3 4 11 8 6 4 9 21 15 24 27 29 28 16 32 17 25 22 22 90 99 100 120 128 39 34 54 41 60 23 141 158 176 200 241 77 72 73 95 77 24 195 192 209 250 280 76 107 100 88 105 25 206 214 223 233 302 98 83 110 97 88 26 233 220 238 253 266 80 95 77 96 93 27 243 215 237 276 269 83 80 69 78 73 28 266 250 202 228 243 49 80 72 56 68 29 206 253 235 203 226 66 57 59 70 48 30-39 1,391 1,318 1,413 1,378 1,424 225 251 260 262 247 40-49 918 854 841 796 755 93 104 85 84 68 50-64 352 365 367 371 375 9 15 21 29 29 Over 64 10 12 13 12 10 1 1 1 1 Unavailable 1 1 1
Total 4,268 4,177 4,284 4,352 4,551 927 1,021 1,005 1,027 988
<= 24 years 10.4% 11.4% 12.0% 13.8% 15.0% 24.1% 25.0% 24.9% 24.7% 27.6%25-29 years 27.0% 27.6% 26.5% 27.4% 28.7% 40.6% 38.7% 38.5% 38.7% 37.4%30-39 years 32.6% 31.6% 33.0% 31.7% 31.3% 24.3% 24.6% 25.9% 25.5% 25.0%40+ years 30.0% 29.5% 28.5% 27.1% 25.0% 11.1% 11.8% 10.6% 11.1% 9.8%Median Age 257.3 239.8 308.1 208.5 244.6 -166.7 -202.2 -249.6 -201.8 -294.4Mean Age 237.7 226.5 301.0 175.5 221.2 -204.1 -247.5 -299.9 -247.2 -348.5* Professional students include those in Law, Medicine, and PharmD.Source: Office of Institutional Research
Graduate & AGSM Students Professional Students*
2002-2003 UNM Fact Book - Page 24
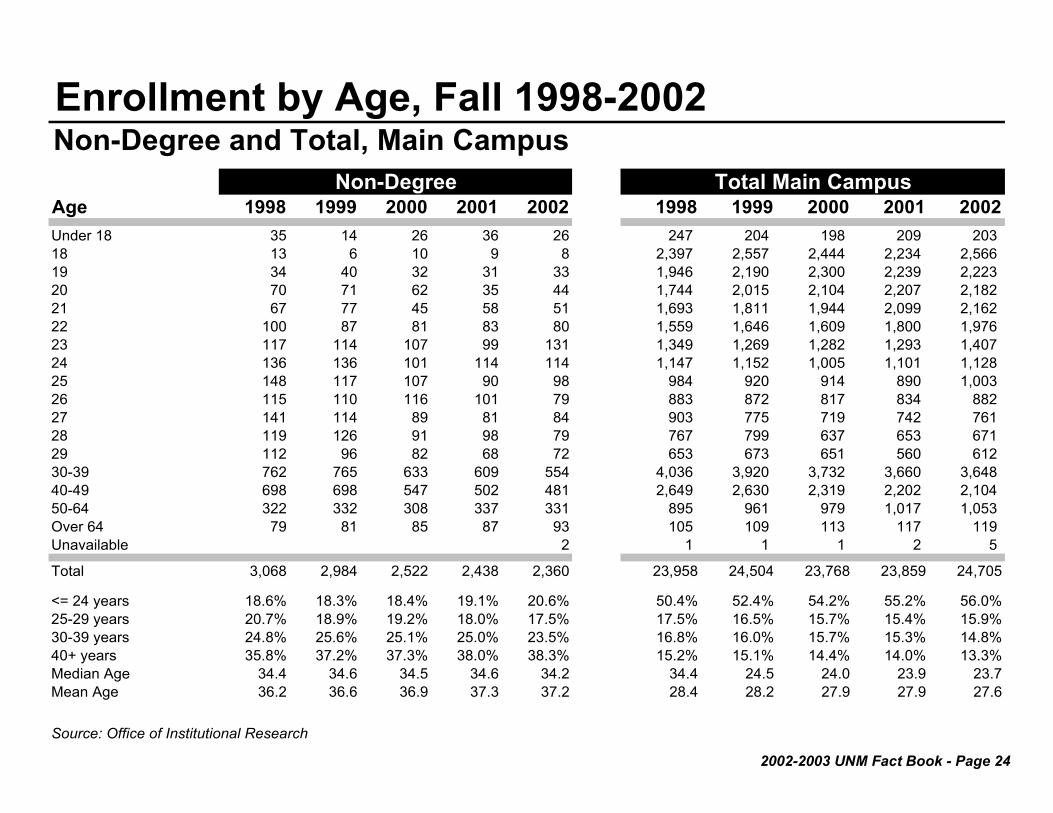
Enrollment by Age, Fall 1998-2002Non-Degree and Total, Main Campus
Age 1998 1999 2000 2001 2002 1998 1999 2000 2001 2002Under 18 35 14 26 36 26 247 204 198 209 203 18 13 6 10 9 8 2,397 2,557 2,444 2,234 2,566 19 34 40 32 31 33 1,946 2,190 2,300 2,239 2,223 20 70 71 62 35 44 1,744 2,015 2,104 2,207 2,182 21 67 77 45 58 51 1,693 1,811 1,944 2,099 2,162 22 100 87 81 83 80 1,559 1,646 1,609 1,800 1,976 23 117 114 107 99 131 1,349 1,269 1,282 1,293 1,407 24 136 136 101 114 114 1,147 1,152 1,005 1,101 1,128 25 148 117 107 90 98 984 920 914 890 1,003 26 115 110 116 101 79 883 872 817 834 882 27 141 114 89 81 84 903 775 719 742 761 28 119 126 91 98 79 767 799 637 653 671 29 112 96 82 68 72 653 673 651 560 612 30-39 762 765 633 609 554 4,036 3,920 3,732 3,660 3,648 40-49 698 698 547 502 481 2,649 2,630 2,319 2,202 2,104 50-64 322 332 308 337 331 895 961 979 1,017 1,053 Over 64 79 81 85 87 93 105 109 113 117 119 Unavailable 2 1 1 1 2 5
Total 3,068 2,984 2,522 2,438 2,360 23,958 24,504 23,768 23,859 24,705
<= 24 years 18.6% 18.3% 18.4% 19.1% 20.6% 50.4% 52.4% 54.2% 55.2% 56.0%25-29 years 20.7% 18.9% 19.2% 18.0% 17.5% 17.5% 16.5% 15.7% 15.4% 15.9%30-39 years 24.8% 25.6% 25.1% 25.0% 23.5% 16.8% 16.0% 15.7% 15.3% 14.8%40+ years 35.8% 37.2% 37.3% 38.0% 38.3% 15.2% 15.1% 14.4% 14.0% 13.3%Median Age 34.4 34.6 34.5 34.6 34.2 34.4 24.5 24.0 23.9 23.7Mean Age 36.2 36.6 36.9 37.3 37.2 28.4 28.2 27.9 27.9 27.6
Source: Office of Institutional Research
Non-Degree Total Main Campus

Enrollment – Branch Campuses &Education Center

2002-2003 UNM Fact Book - Page 25
Branch Campus EnrollmentBy Campus and Degree Status (Fall 1996 to Fall 2002)
1996 1997 1998 1999 2000 2001 2002Gallup Branch CampusUndergraduate 1,814 1,738 1,786 1,861 1,670 1,687 2,004Non-Degree 1,270 874 918 885 968 828 854Total 3,084 2,612 2,704 2,746 2,638 2,515 2,858Los Alamos Branch CampusUndergraduate 490 491 498 527 477 519 569Non-Degree 500 443 383 431 383 364 321Total 990 934 881 958 860 883 890Taos Branch CampusUndergraduate 430 379 499 566 606 587 690Non-Degree 537 508 553 447 442 644 942Total 967 887 1,052 1,013 1,048 1,231 1,632
Valencia Branch CampusUndergraduate 1,158 1,194 1,261 1,339 1,213 1,269 1,347Non-Degree 333 313 294 309 361 291 363Total 1,491 1,507 1,555 1,648 1,574 1,560 1,710
Undergraduate 3,892 3,802 4,044 4,293 3,966 4,062 4,610Non-Degree 2,640 2,138 2,148 2,072 2,154 2,127 2,480Grand Total 6,532 5,940 6,192 6,365 6,120 6,189 7,090
Source: Fall 21-day enrollment files maintained by the Registrar's Office.
Enrollment by Degree-Seeking and Non-Degree Status
Total Branch Campus Enrollment

2002-2003 UNM Fact Book - Page 26
Enrollment, Fall 1998-2002Gallup Branch Campus
1998 1999 2000 2001 2002 1998 1999 2000 2001 2001Total Headcount 2,704 2,746 2,638 2,515 2,858Full-Time 1,071 1,034 845 847 972 39.6 37.7 32.0 33.7 34.0Part-Time 1,633 1,712 1,793 1,668 1,886 60.4 62.3 68.0 66.3 66.0Avg. Hrs. per Sem. 8.53 8.32 7.82 7.85 8.10Full-Time Equivalent 1,537 1,524 1,376 1,316 1,544
1998 1999 2000 2001 2002 1998 1999 2000 2001 2002
Average Age 29 29 30 31 30
Females 1,777 1,853 1,774 1,743 1,913 65.7 67.5 67.2 69.3 66.9Males 927 893 864 772 945 34.3 32.5 32.8 30.7 33.1
African American 11 15 9 12 8 0.4 0.5 0.3 0.5 0.3American Indian 2,010 2,038 2,016 1,890 2,166 74.3 74.2 76.4 75.1 75.8Asian/Pacific Island 11 12 9 19 15 0.4 0.4 0.3 0.8 0.5Hispanic 251 256 240 246 281 9.3 9.3 9.1 9.8 9.8White, non-Hispanic 373 368 311 303 327 13.8 13.4 11.8 12.0 11.4International 2 2 3 2 6 0.1 0.1 0.1 0.1 0.2No Response 46 55 50 43 55 1.7 2.0 1.9 1.7 1.9
Source: Fall 21-day enrollment files maintained by the Registrar's Office.
Students Enrolled in Credit Courses Percentages
Student Demographics
Percentages
2002-2003 UNM Fact Book - Page 27
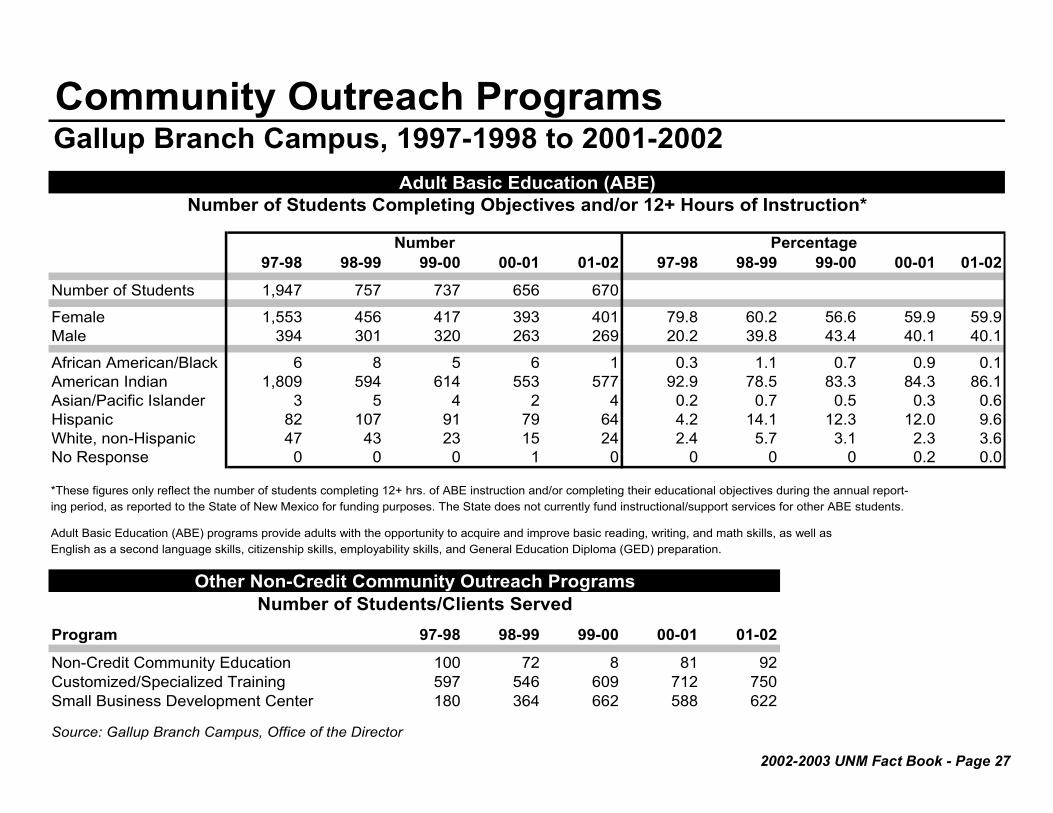
Community Outreach ProgramsGallup Branch Campus, 1997-1998 to 2001-2002
97-98 98-99 99-00 00-01 01-02 97-98 98-99 99-00 00-01 01-02
Number of Students 1,947 757 737 656 670
Female 1,553 456 417 393 401 79.8 60.2 56.6 59.9 59.9Male 394 301 320 263 269 20.2 39.8 43.4 40.1 40.1
African American/Black 6 8 5 6 1 0.3 1.1 0.7 0.9 0.1American Indian 1,809 594 614 553 577 92.9 78.5 83.3 84.3 86.1Asian/Pacific Islander 3 5 4 2 4 0.2 0.7 0.5 0.3 0.6Hispanic 82 107 91 79 64 4.2 14.1 12.3 12.0 9.6White, non-Hispanic 47 43 23 15 24 2.4 5.7 3.1 2.3 3.6No Response 0 0 0 1 0 0 0 0 0.2 0.0
*These figures only reflect the number of students completing 12+ hrs. of ABE instruction and/or completing their educational objectives during the annual report-ing period, as reported to the State of New Mexico for funding purposes. The State does not currently fund instructional/support services for other ABE students.
Adult Basic Education (ABE) programs provide adults with the opportunity to acquire and improve basic reading, writing, and math skills, as well asEnglish as a second language skills, citizenship skills, employability skills, and General Education Diploma (GED) preparation.
Program 97-98 98-99 99-00 00-01 01-02
Non-Credit Community Education 100 72 8 81 92Customized/Specialized Training 597 546 609 712 750Small Business Development Center 180 364 662 588 622
Source: Gallup Branch Campus, Office of the Director
Adult Basic Education (ABE)
Other Non-Credit Community Outreach Programs
Number of Students Completing Objectives and/or 12+ Hours of Instruction*
Number of Students/Clients Served
PercentageNumber

2002-2003 UNM Fact Book - Page 28
Enrollment, Fall 1998-2002Los Alamos Branch Campus
1998 1999 2000 2001 2002 1998 1999 2000 2001 2001
Total Headcount 881 958 860 883 890Full-Time 169 184 159 215 224 19.2 19.2 18.5 24.3 25.2Part-Time 712 774 701 668 666 80.8 80.8 81.5 75.7 74.8
Avg. Hrs. per Sem. 6.00 6.19 6.24 6.80 6.89Full-Time Equivalent 353 395 358 400 409
1998 1999 2000 2001 2002 1998 1999 2000 2001 2002
Average Age 34 34 34 34 32
Females 549 608 521 568 548 62.3 63.5 60.6 64.3 61.6Males 332 350 339 315 342 37.7 36.5 39.4 35.7 38.4
African American 4 10 4 3 6 0.5 1.0 0.5 0.3 0.7American Indian 25 60 22 39 31 2.8 6.3 2.6 4.4 3.5Asian/Pacific Island 27 25 28 31 24 3.1 2.6 3.3 3.5 2.7Hispanic 281 280 310 323 351 31.9 29.2 36.0 36.6 39.4White, non-Hispanic 499 537 468 455 426 56.6 56.1 54.4 51.5 47.9International 11 17 9 5 13 1.2 1.8 1.0 0.6 1.5No Response 34 29 19 27 39 3.9 3.0 2.2 3.1 4.4
Source: Fall 21-day enrollment files maintained by the Registrar's Office.
Students Enrolled in Credit Courses Percentages
Student DemographicsPercentages

2002-2003 UNM Fact Book - Page 29
Community Outreach ProgramsLos Alamos Branch Campus, 1997-1998 to 2001-2002
97-98 98-99 99-00 00-01 01-02 97-98 98-99 99-00 00-01 01-02
Number of Students 477 485 255 209 273
Female 308 197 170 121 183 64.6 40.6 66.7 57.9 67.0Male 169 288 85 88 90 35.4 59.4 33.3 42.1 33.0
African American/Black 3 4 2 2 1 0.6 0.8 0.8 1.0 0.4American Indian 76 92 43 21 27 15.9 19.0 16.9 10.0 9.9Asian/Pacific Islander 81 58 39 33 35 17.0 12.0 15.3 15.8 12.8Hispanic 199 209 114 102 141 41.7 43.1 44.7 48.8 51.6White, non-Hispanic 118 116 57 51 66 24.7 23.9 22.4 24.4 24.2No Response 0 6 0 0 3 0.0 1.2 0.0 0.0 1.1*These figures only reflect the number of students completing 12+ hrs. of ABE instruction and/or completing their educational objectives during the annual report-ing period, as reported to the State of New Mexico for funding purposes. The State does not currently fund instructional/support services for other ABE students.
Adult Basic Education (ABE) programs provide adults with the opportunity to acquire and improve basic reading, writing, and math skills, as well asEnglish as a second language skills, citizenship skills, employability skills, and General Education Diploma (GED) preparation.
Program 97-98 98-99 99-00 00-01 01-02
Non-Credit Community Education 1,576 1,798 1,384 943 1,437 Customized/Specialized Training 1,358 1,286 954 1,269 1,428 Small Business Development Center 144 718 337 326 383
Source: Los Alamos Branch Campus, Office of the Director
Adult Basic Education (ABE)Number of Students Completing Objectives and/or 12+ Hours of Instruction*
Other Non-Credit Community Outreach ProgramsNumber of Students/Clients Served
PercentageNumber
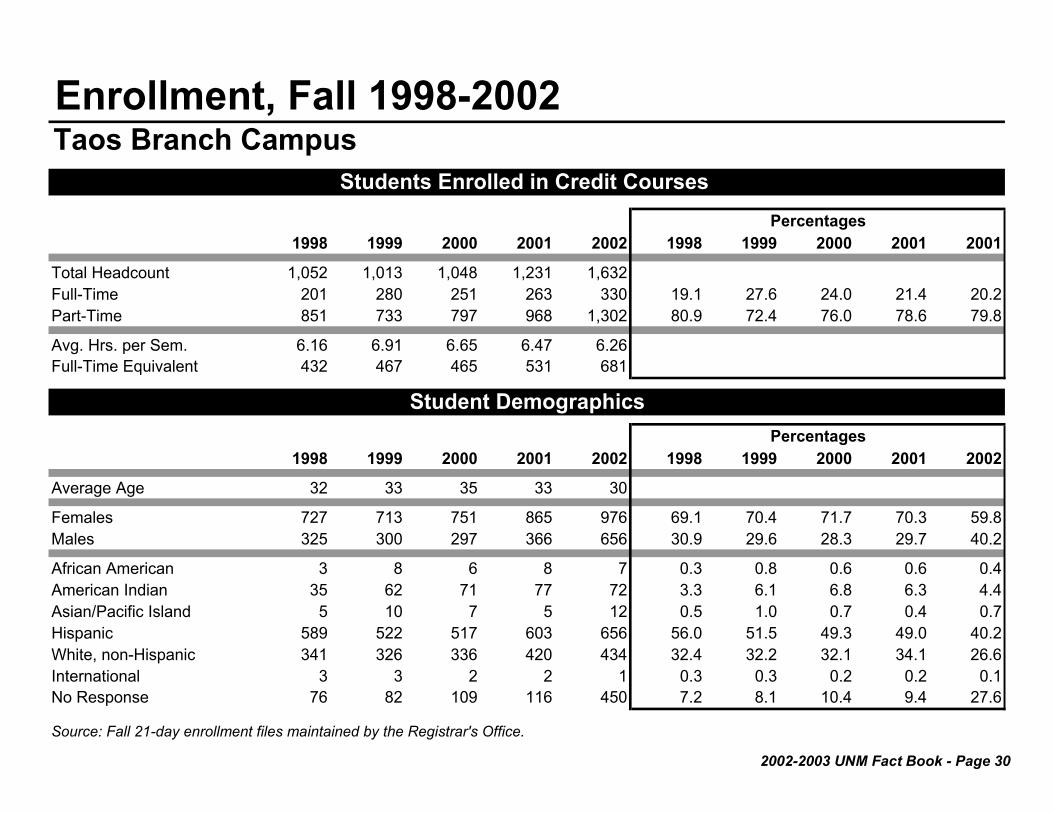
2002-2003 UNM Fact Book - Page 30
Enrollment, Fall 1998-2002Taos Branch Campus
1998 1999 2000 2001 2002 1998 1999 2000 2001 2001
Total Headcount 1,052 1,013 1,048 1,231 1,632Full-Time 201 280 251 263 330 19.1 27.6 24.0 21.4 20.2Part-Time 851 733 797 968 1,302 80.9 72.4 76.0 78.6 79.8
Avg. Hrs. per Sem. 6.16 6.91 6.65 6.47 6.26Full-Time Equivalent 432 467 465 531 681
1998 1999 2000 2001 2002 1998 1999 2000 2001 2002
Average Age 32 33 35 33 30
Females 727 713 751 865 976 69.1 70.4 71.7 70.3 59.8Males 325 300 297 366 656 30.9 29.6 28.3 29.7 40.2
African American 3 8 6 8 7 0.3 0.8 0.6 0.6 0.4American Indian 35 62 71 77 72 3.3 6.1 6.8 6.3 4.4Asian/Pacific Island 5 10 7 5 12 0.5 1.0 0.7 0.4 0.7Hispanic 589 522 517 603 656 56.0 51.5 49.3 49.0 40.2White, non-Hispanic 341 326 336 420 434 32.4 32.2 32.1 34.1 26.6International 3 3 2 2 1 0.3 0.3 0.2 0.2 0.1No Response 76 82 109 116 450 7.2 8.1 10.4 9.4 27.6
Source: Fall 21-day enrollment files maintained by the Registrar's Office.
Students Enrolled in Credit Courses Percentages
Student DemographicsPercentages

2002-2003 UNM Fact Book - Page 31
Community Outreach ProgramsTaos Branch Campus, 1997-1998 to 2001-2002
97-98 98-99 99-00** 00-01 01-02 97-98 98-99 99-00** 00-01 01-02
Number of Students 46 129 138
Female 24 62 60 52.2 48.1 43.5Male 22 67 78 47.8 51.9 56.5
African American/Black 1 1 4 2.2 0.8 2.9American Indian 3 10 12 6.5 7.8 8.7Asian/Pacific Islander 2 0 4 4.3 0.0 2.9Hispanic 31 91 82 67.4 70.5 59.4White, non-Hispanic 9 27 36 19.6 20.9 26.1No Response 0 0 0 0.0 0.0 0.0
**Taos ABE program implemented January 2000.
Program 97-98 98-99 99-01 00-01 01-02
Non-Credit Community Education 516 550 565 117 0Customized/Specialized TrainingSmall Business Development Center
Source: Taos Education Center, Office of the Director
Other Non-Credit Community Outreach ProgramsNumber of Students/Clients Served
Adult Basic Education (ABE)Number of Students Completing Objectives and/or 12+ Hours of Instruction*
Number Percentage
Adult Basic Education (ABE) programs provide adults with the opportunity to acquire and improve basic reading, writing, and math skills, as well as English as a second language skills, citizenship skills, employability skills, and General Education Diploma (GED) preparation.
*These figures only reflect the number of students completing 12+ hrs. of ABE instruction and/or completing their educational objectives during the annual reporting period, as reported to the State of New Mexico for funding purposes. The State does not currently fund instructional/support services for other ABE students.
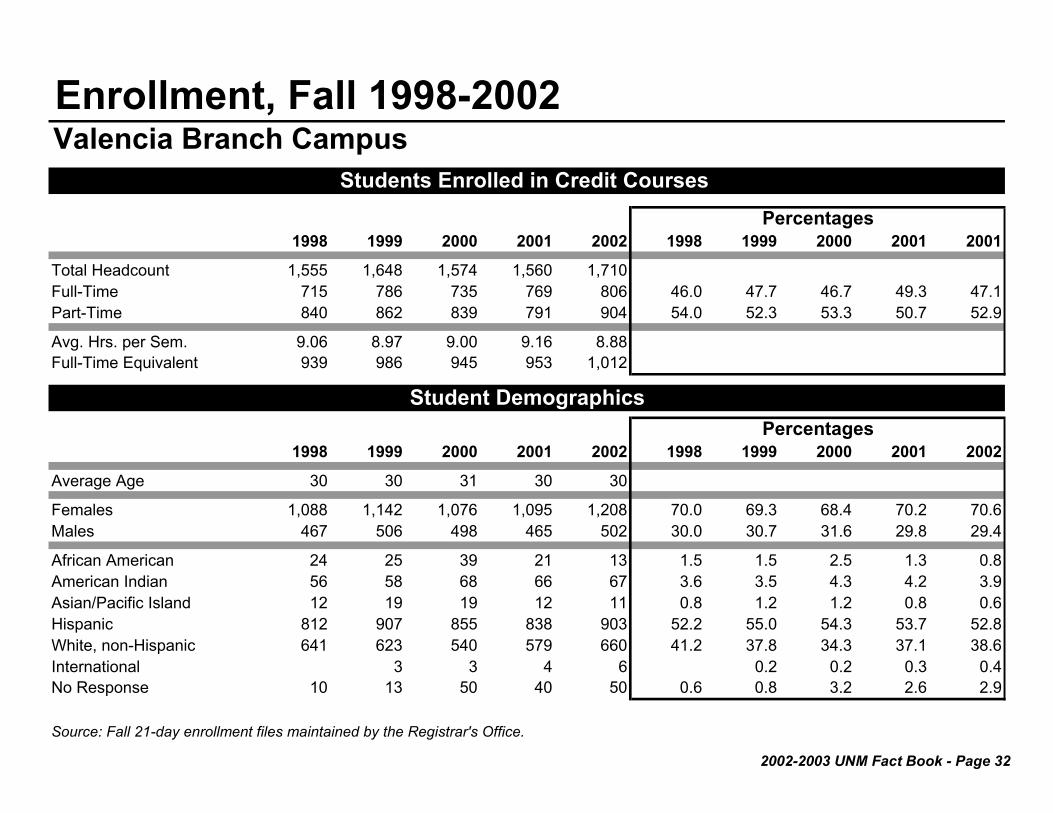
2002-2003 UNM Fact Book - Page 32
Enrollment, Fall 1998-2002Valencia Branch Campus
1998 1999 2000 2001 2002 1998 1999 2000 2001 2001
Total Headcount 1,555 1,648 1,574 1,560 1,710Full-Time 715 786 735 769 806 46.0 47.7 46.7 49.3 47.1Part-Time 840 862 839 791 904 54.0 52.3 53.3 50.7 52.9
Avg. Hrs. per Sem. 9.06 8.97 9.00 9.16 8.88Full-Time Equivalent 939 986 945 953 1,012
1998 1999 2000 2001 2002 1998 1999 2000 2001 2002
Average Age 30 30 31 30 30
Females 1,088 1,142 1,076 1,095 1,208 70.0 69.3 68.4 70.2 70.6Males 467 506 498 465 502 30.0 30.7 31.6 29.8 29.4
African American 24 25 39 21 13 1.5 1.5 2.5 1.3 0.8American Indian 56 58 68 66 67 3.6 3.5 4.3 4.2 3.9Asian/Pacific Island 12 19 19 12 11 0.8 1.2 1.2 0.8 0.6Hispanic 812 907 855 838 903 52.2 55.0 54.3 53.7 52.8White, non-Hispanic 641 623 540 579 660 41.2 37.8 34.3 37.1 38.6International 3 3 4 6 0.2 0.2 0.3 0.4No Response 10 13 50 40 50 0.6 0.8 3.2 2.6 2.9
Source: Fall 21-day enrollment files maintained by the Registrar's Office.
Students Enrolled in Credit Courses Percentages
Student DemographicsPercentages

2002-2003 UNM Fact Book - Page 33
Community Outreach ProgramsValencia Branch Campus, 1997-1998 to 2001-2002
97-98 98-99 99-00 00-01 01-02 97-98 98-99 99-00 00-01 01-02
Number of Students 805 1,001 996 843 788
Female 487 587 663 549 513 60.5 58.6 66.6 65.1 65.1Male 318 414 333 294 275 39.5 41.4 33.4 34.9 34.9
African American/Black 13 23 14 8 8 1.6 2.3 1.4 0.9 1.0American Indian 20 33 13 21 21 2.5 3.3 1.3 2.5 2.7Asian/Pacific Islander 10 8 7 8 6 1.2 0.8 0.7 0.9 0.8Hispanic 537 675 737 618 570 66.7 67.4 74.0 73.3 72.3White, non-Hispanic 225 262 225 188 183 28.0 26.2 22.6 22.3 23.2No Response 0 0 0 0 0 0.0 0.0 0.0 0.0 0.0*These figures only reflect the number of students completing 12+ hrs. of ABE instruction and/or completing their educational objectives during the annual report-ing period, as reported to the State of New Mexico for funding purposes. The State does not currently fund instructional/support services for other ABE students.
Adult Basic Education (ABE) programs provide adults with the opportunity to acquire and improve basic reading, writing, and math skills, as well as Englishas a second language skills, citizenship skills, employability skills, and General Education Diploma (GED) preparation.
Program 97-98 98-99 99-00 00-01 01-02
Non-Credit Community Education 1,645 1,619 1,186 1,541 1,872Customized/Specialized Training ** 1,151 2,636 3,215 3,867 4,538Small Business Development Center ** 413 282 281 352 356
** Duplicated headcount
Source: Valencia Branch Campus, Office of the Director
Adult Basic Education (ABE)Number of Students Completing Objectives and/or 12+ Hours of Instruction*
Other Non-Credit Community Outreach ProgramsNumber of Students/Clients Served
PercentageNumber

2002-2003 UNM Fact Book - Page 34
Student Credit Hours by Course LevelBranch Campuses (Fall 1996 to Fall 2002)
Level 1996 1997 1998 1999 2000 2001 2002 Level 1996 1997 1998 1999 2000 2001 2002Develop. 2,920 2,298 2,658 2,850 2,775 2,754 3,754 Develop. 410 487 555 572 426 602 616Freshman 16,250 15,063 15,433 15,166 13,270 13,277 15,720 Freshman 3,500 3,394 3,727 4,188 4,136 4,200 4,461Sophomore 5,557 5,014 4,963 4,848 4,592 3,711 3,679 Sophomore 1,533 1,486 1,006 1,166 804 1,200 1,051Subtotal 24,727 22,375 23,054 22,864 20,637 19,742 23,153 Subtotal 5,443 5,367 5,288 5,926 5,366 6,002 6,128
Level 1996 1997 1998 1999 2000 2001 2002 Level 1996 1997 1998 1999 2000 2001 2002Develop. 494 377 413 460 586 456 519 Develop. 1,830 1,770 2,225 2,719 2,611 2,431 2,791Freshman 3,432 3,811 4,474 4,624 4,381 4,959 5,401 Freshman 7,939 8,704 9,129 9,207 9,274 9,755 10,494Sophomore 1,647 1,164 1,595 1,916 2,002 2,544 4,290 Sophomore 3,051 2,542 2,741 2,856 2,288 2,108 1,898Subtotal 5,573 5,352 6,482 7,000 6,969 7,959 10,210 Subtotal 12,820 13,016 14,095 14,782 14,173 14,294 15,183
Source: Student Credit Hours Report (January 2002), Office of Institutional Research
Valencia Branch Campus
Gallup Branch Campus Los Alamos Branch Campus
Taos Branch Campus
Development = courses numbered 100 and below, non-college credit coursesFreshman = 100 level coursesSophomore = 200 level courses

2002-2003 UNM Fact Book - Page 35
Enrollment by Age, Fall 1998-2002Gallup & Los Alamos Branch Campuses
Age 1998 1999 2000 2001 2002 1998 1999 2000 2001 2002Under 18 290 299 327 292 331 31 32 19 22 25 18 207 200 201 176 241 85 84 63 99 77 19 201 206 170 139 187 67 70 68 69 78 20 193 143 141 146 135 45 57 43 51 60 21 136 150 90 103 121 39 29 47 29 44 22 111 124 111 82 87 26 31 26 36 39 23 93 96 98 93 80 20 22 27 21 28 24 87 99 80 85 98 11 16 19 20 22 25 82 70 54 75 85 16 17 15 14 28 26 78 63 64 64 82 20 16 12 14 18 27 53 77 63 50 50 11 24 19 10 18 28 64 63 64 57 56 15 21 19 21 15 29 66 61 66 63 66 14 16 11 20 15 30-39 554 574 535 499 590 187 210 168 143 158 40-49 338 359 382 394 419 184 194 187 186 165 50-64 136 148 175 170 211 95 102 100 108 86 Over 64 11 8 17 26 17 15 17 17 20 14 Unavailable 4 6 2 Total 2,704 2,746 2,638 2,514 2,858 881 958 860 883 890<= 24 years 48.7% 48.0% 46.2% 44.4% 44.8% 36.8% 35.6% 36.3% 39.3% 41.9%25-29 years 12.7% 12.2% 11.8% 12.3% 11.9% 8.6% 9.8% 8.8% 8.9% 10.6%30-39 years 20.5% 20.9% 20.3% 19.8% 20.6% 21.2% 21.9% 19.5% 16.2% 17.8%40+ years 17.9% 18.8% 21.8% 23.5% 22.6% 33.4% 32.7% 35.3% 35.6% 29.8%Median Age 25.4 25.8 26.7 27.1 26.8 32.2 31.6 32.9 30.9 28.7Mean Age 29.0 29.2 30.1 30.6 30.3 33.7 33.7 34.2 33.9 32.4
Source: Office of Institutional Research
Gallup Branch Campus Los Alamos Branch Campus

2002-2003 UNM Fact Book - Page 36
Enrollment by Age, Fall 1998-2002Taos & Valencia Branch Campuses
Age 1998 1999 2000 2001 2002 1998 1999 2000 2001 2002Under 18 225 167 166 279 365 46 33 34 40 119 18 67 52 45 55 105 182 215 179 162 185 19 32 47 49 43 105 135 161 158 168 150 20 27 40 37 38 106 126 133 124 125 132 21 27 28 35 37 97 93 116 76 103 97 22 19 27 21 25 75 60 70 53 61 83 23 27 20 21 24 43 58 41 59 55 70 24 19 24 19 23 32 49 57 27 55 57 25 18 19 17 14 27 29 40 46 35 36 26 26 25 18 13 19 45 38 39 35 34 27 21 21 15 22 22 46 30 38 39 34 28 15 18 22 21 26 33 30 40 32 42 29 12 14 18 19 17 30 33 30 32 28 30-39 180 163 171 179 190 319 317 307 276 285 40-49 191 174 186 209 186 207 194 221 189 208 50-64 123 152 179 202 179 74 108 108 132 128 Over 64 18 18 26 28 38 23 32 27 21 22 Unavailable 5 4 3 8 Total 1,052 1,013 1,048 1,231 1,632 1,555 1,648 1,574 1,560 1,710
<= 24 years 42.1% 40.0% 37.5% 42.6% 56.9% 48.2% 50.1% 45.1% 49.3% 52.2%25-29 years 8.7% 9.6% 8.6% 7.2% 6.8% 11.8% 10.4% 12.3% 11.1% 10.2%30-39 years 17.1% 16.1% 16.3% 14.5% 11.6% 20.5% 19.2% 19.5% 17.7% 16.7%40+ years 31.6% 34.0% 37.3% 35.7% 24.7% 19.5% 20.3% 22.6% 21.9% 20.9%Median Age 28.7 30.0 32.7 30.3 22.5 26.0 25.0 26.5 25.2 24.3Mean Age 32.2 33.3 34.7 33.5 29.8 29.9 30.1 30.6 30.4 29.6
Source: Office of Institutional Research
Taos Branch Campus Valencia Branch Campus

Beginning Freshmen & TransferStudents – Main Campus

2002-2003 UNM Fact Book - Page 37
Beginning FreshmenMain Campus (Fall 1998 to Fall 2002)
Percentages1998 1999 2000 2001 2002 1998 1999 2000 2001 2002
African American/Black 84 87 73 73 79 3.2 3.1 2.8 3.0 2.8American Indian 131 96 111 100 149 4.9 3.5 4.2 4.2 5.3Asian/Pacific Islander 106 94 87 93 98 4.0 3.4 3.3 3.9 3.5Hispanic 955 961 971 858 963 35.8 34.8 36.8 35.7 34.1White, non-Hispanic 1,329 1,452 1,322 1,220 1,473 49.9 52.5 50.1 50.7 52.2International 13 16 5 9 22 0.5 0.6 0.2 0.4 0.8No Response 47 58 70 52 37 1.8 2.1 2.7 2.2 1.3Total 2,665 2,764 2,639 2,405 2,821 100.0 100.0 100.0 100.0 100.0
Percentages1998 1999 2000 2001 2002 1998 1999 2000 2001 2002
African American/Black 56 55 58 42 52 2.5 2.4 2.5 2.0 2.2American Indian 115 82 96 85 128 5.1 3.5 4.1 4.1 5.3Asian/Pacific Islander 89 82 80 83 79 4.0 3.5 3.5 4.0 3.3Hispanic 882 871 915 789 887 39.4 37.6 39.5 38.0 36.9White, non-Hispanic 1,058 1,180 1,109 1,032 1,220 47.3 50.9 47.9 49.7 50.7International 4 2 6 0.0 0.2 0.0 0.1 0.2No Response 36 43 58 42 32 1.6 1.9 2.5 2.0 1.3Total 2,236 2,317 2,316 2,075 2,404 100.0 100.0 100.0 100.0 100.0* "Recent High School Graduates" are those students who have graduated within one academic year prior to enrollment at UNM.
Source: Fall 21-day enrollment files maintained by the Registrar's Office.
Ethnicity - UNM All Beginning Freshmen
Beginning Freshmen (Recent Graduates from NM High Schools)*
2002-2003 UNM Fact Book - Page 38
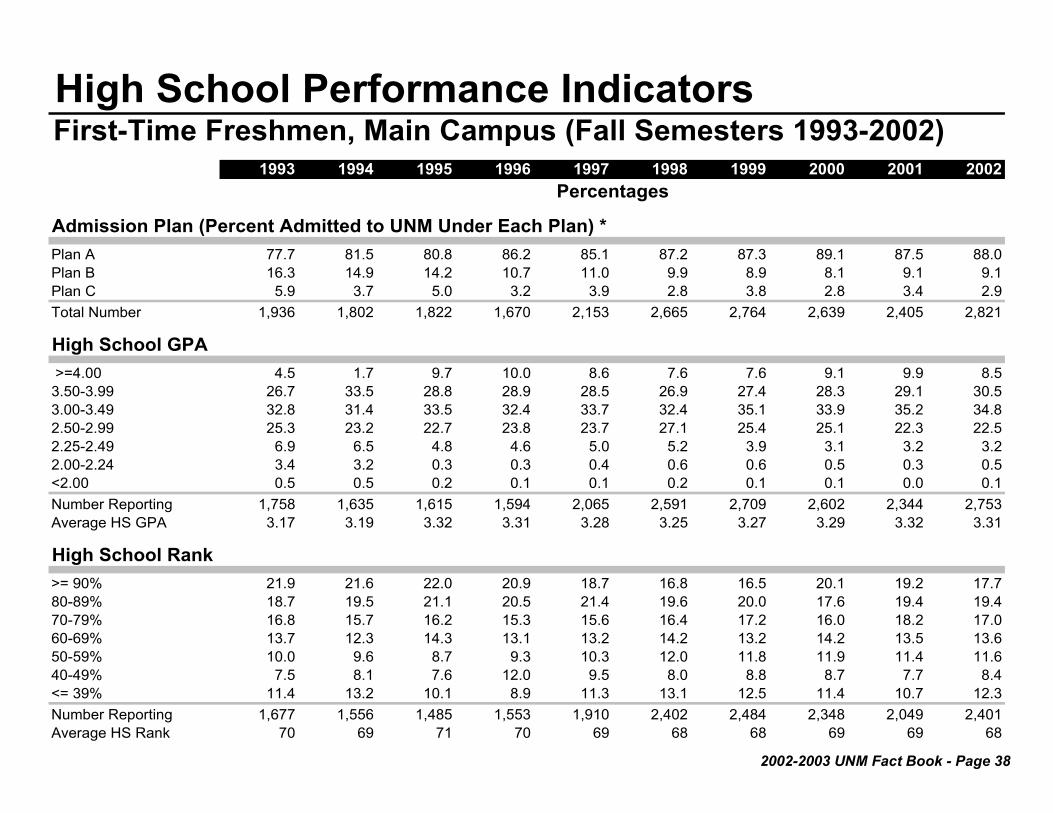
High School Performance IndicatorsFirst-Time Freshmen, Main Campus (Fall Semesters 1993-2002)
1993 1994 1995 1996 1997 1998 1999 2000 2001 2002
Admission Plan (Percent Admitted to UNM Under Each Plan) *Plan A 77.7 81.5 80.8 86.2 85.1 87.2 87.3 89.1 87.5 88.0Plan B 16.3 14.9 14.2 10.7 11.0 9.9 8.9 8.1 9.1 9.1Plan C 5.9 3.7 5.0 3.2 3.9 2.8 3.8 2.8 3.4 2.9Total Number 1,936 1,802 1,822 1,670 2,153 2,665 2,764 2,639 2,405 2,821
High School GPA >=4.00 4.5 1.7 9.7 10.0 8.6 7.6 7.6 9.1 9.9 8.53.50-3.99 26.7 33.5 28.8 28.9 28.5 26.9 27.4 28.3 29.1 30.53.00-3.49 32.8 31.4 33.5 32.4 33.7 32.4 35.1 33.9 35.2 34.82.50-2.99 25.3 23.2 22.7 23.8 23.7 27.1 25.4 25.1 22.3 22.52.25-2.49 6.9 6.5 4.8 4.6 5.0 5.2 3.9 3.1 3.2 3.22.00-2.24 3.4 3.2 0.3 0.3 0.4 0.6 0.6 0.5 0.3 0.5<2.00 0.5 0.5 0.2 0.1 0.1 0.2 0.1 0.1 0.0 0.1Number Reporting 1,758 1,635 1,615 1,594 2,065 2,591 2,709 2,602 2,344 2,753Average HS GPA 3.17 3.19 3.32 3.31 3.28 3.25 3.27 3.29 3.32 3.31
High School Rank>= 90% 21.9 21.6 22.0 20.9 18.7 16.8 16.5 20.1 19.2 17.780-89% 18.7 19.5 21.1 20.5 21.4 19.6 20.0 17.6 19.4 19.470-79% 16.8 15.7 16.2 15.3 15.6 16.4 17.2 16.0 18.2 17.060-69% 13.7 12.3 14.3 13.1 13.2 14.2 13.2 14.2 13.5 13.650-59% 10.0 9.6 8.7 9.3 10.3 12.0 11.8 11.9 11.4 11.640-49% 7.5 8.1 7.6 12.0 9.5 8.0 8.8 8.7 7.7 8.4<= 39% 11.4 13.2 10.1 8.9 11.3 13.1 12.5 11.4 10.7 12.3Number Reporting 1,677 1,556 1,485 1,553 1,910 2,402 2,484 2,348 2,049 2,401Average HS Rank 70 69 71 70 69 68 68 69 69 68
Percentages

2002-2003 UNM Fact Book - Page 39
High School Performance IndicatorsFirst-Time Freshmen, Main Campus (Fall Semesters 1993-2002)
1993 1994 1995 1996 1997 1998 1999 2000 2001 2002
ACT Composite Score27-36 14.2 14.8 17.3 15.3 16.6 14.1 12.6 13.1 12.5 11.125-26 12.7 14.1 13.4 15.6 15.1 13.1 12.7 13.3 11.7 12.323-24 14.0 20.1 17.7 18.4 17.6 16.6 17.1 15.1 15.8 17.221-22 21.3 17.6 19.2 19.8 19.3 20.5 18.8 19.2 19.0 18.019-20 19.8 15.6 17.4 15.1 16.5 16.5 18.2 19.0 18.7 19.21-18 17.9 17.7 15.0 15.8 14.9 19.2 20.6 20.3 22.5 22.2Number Reporting 1,587 1,478 1,511 1,366 1,766 2,346 2,510 2,446 2,192 2,579Average ACT Score 22.1 22.4 22.6 22.6 22.6 22.1 21.9 21.9 21.7 21.6
SAT Total Score1170-1600 16.1 12.2 27.0 31.3 31.7 30.3 27.2 32.5 28.8 37.51090-1160 10.3 13.0 20.2 15.7 18.2 18.2 22.4 18.9 19.9 21.91030-1080 10.7 9.3 12.7 15.4 12.3 16.0 13.1 11.4 10.9 13.1940-1020 15.8 20.0 17.9 20.5 16.3 18.5 19.3 17.5 14.2 14.1860- 930 18.2 19.4 12.2 8.5 12.0 8.0 7.8 11.1 13.5 7.9<= 850 28.9 26.1 10.1 8.7 9.5 9.0 10.2 8.6 12.7 5.5Number Reporting 533 525 526 508 577 600 679 570 577 694Average SAT Score 968 960 1067 1079 1077 1077 1068 1082 1061 1112
** Plan A (college preparatory curriculum with a specified minimum GPA); Plan B (a combination of ACT score and high school rank); Plan C (does not meet ** requirements under Plans A and B, but admitted under special consideration).
Source: Freshman Cohort Tracking Database, Office of Institutional Research
Percentages

2002-2003 UNM Fact Book - Page 40
NM HS Graduates & UNM Beginning Freshmen
African American/Black 442 2.2% African American/Black 52 2.2%American Indian 2,325 11.7% American Indian 128 5.3%Asian/Pacific Islander 272 1.4% Asian/Pacific Islander 79 3.3%Hispanic 8,285 41.8% Hispanic 887 36.9%White, non-Hispanic 8,235 41.6% White, non-Hispanic 1,220 50.8%Unknown 238 1.2% International 6 0.2%
Unknown 31 1.3%Total 19,797 100% Total 2,403 100%
African American/Black 206 1.7%American Indian 1,071 9.1%Asian/Pacific Islander 217 1.8%Hispanic 3,655 31.0%White, non-Hispanic 4,714 40.0%Unknown 1,928 16.4%Total 11,791 100%
Sources: 1 NM Dept. of Education, FY 02 data not available;2 ACT Profile Report;3 UNM Fall 2002 Official Enrollment Report, Office of the Registrar
(2001-2002) Beginning Freshmen - Main Campus (Fall 2002)
New Mexico High School Graduates1 UNM Beginning Freshmen 3
New Mexico ACT Test Takers 2 Top Feeder High Schools to UNM 3
From NM High SchoolsMain Campus (Fall 2002)
from Public and Private Schools Combined(2000-2001)
La Cueva High SchoolRio Rancho High SchoolEldorado High SchoolCibola High SchoolSandia High School Manzano High SchoolSt. Pius X High SchoolValley High SchoolDel Norte High SchoolWest Mesa High SchoolHighland High School Albuquerque High School Moriarty High SchoolSanta Fe Senior High School Rio Grande High School
19316515613513112011910182787769575149

2002-2003 UNM Fact Book - Page 41
Residency of First-Time FreshmenCounty of Origin of Recent HS Graduates from NM High SchoolsMain Campus, Average Number of Freshmen (Fall 1998-2002)
Bernalillo 1,379 Dona Ana 42 Lincoln 15 Rio Arriba 29 Socorro 8Catron 1 Eddy 21 Los Alamos 38 Roosevelt 2 Taos 36Chaves 36 Grant 14 Luna 6 San Juan 55 Torrance 51Cibola 21 Guadalupe 4 Mckinley 48 San Miguel 30 Union 1Colfax 9 Harding 1 Mora 5 Sandoval 132 Valencia 63Curry 13 Hidalgo 1 Otero 19 Santa Fe 144 Unknown 29De Baca 1 Lea 7 Quay 5 Sierra 5
Source: Office of Institutional Research, Freshmen Cohort Tracking Database
5-Year Average Total: 2,271
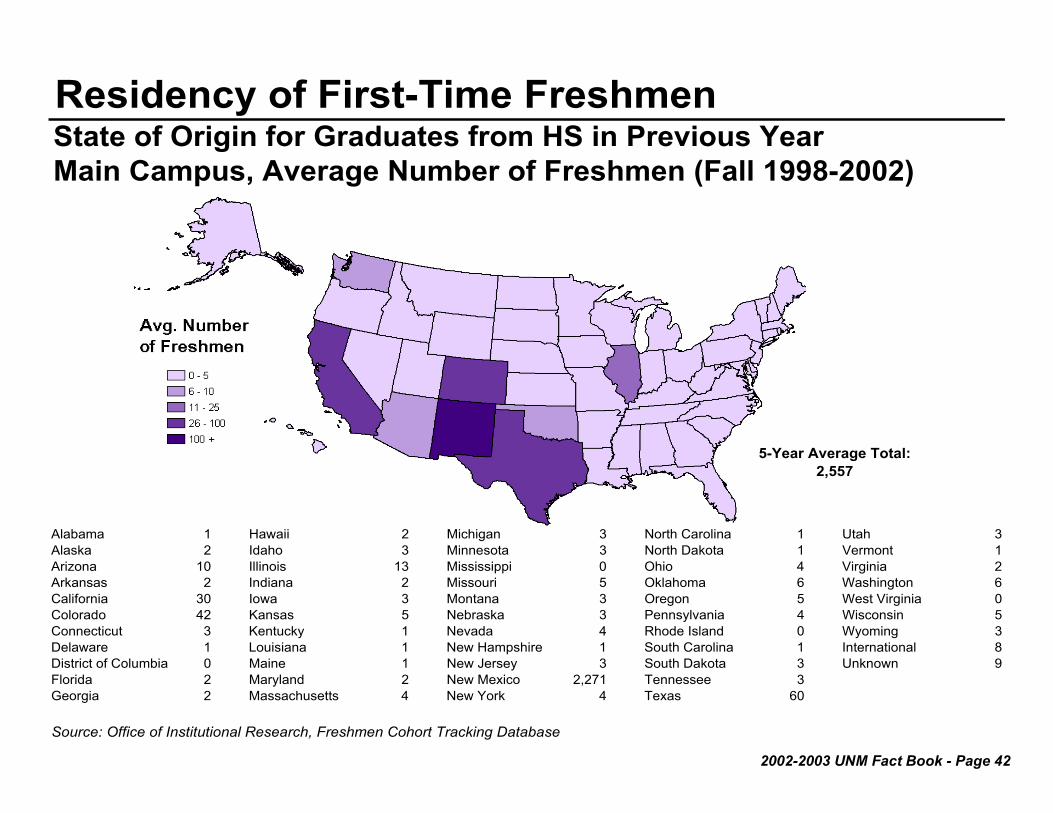
2002-2003 UNM Fact Book - Page 42
Residency of First-Time FreshmenState of Origin for Graduates from HS in Previous YearMain Campus, Average Number of Freshmen (Fall 1998-2002)
Alabama 1 Hawaii 2 Michigan 3 North Carolina 1 Utah 3Alaska 2 Idaho 3 Minnesota 3 North Dakota 1 Vermont 1Arizona 10 Illinois 13 Mississippi 0 Ohio 4 Virginia 2Arkansas 2 Indiana 2 Missouri 5 Oklahoma 6 Washington 6California 30 Iowa 3 Montana 3 Oregon 5 West Virginia 0Colorado 42 Kansas 5 Nebraska 3 Pennsylvania 4 Wisconsin 5Connecticut 3 Kentucky 1 Nevada 4 Rhode Island 0 Wyoming 3Delaware 1 Louisiana 1 New Hampshire 1 South Carolina 1 International 8District of Columbia 0 Maine 1 New Jersey 3 South Dakota 3 Unknown 9Florida 2 Maryland 2 New Mexico 2,271 Tennessee 3Georgia 2 Massachusetts 4 New York 4 Texas 60
Source: Office of Institutional Research, Freshmen Cohort Tracking Database
5-Year Average Total: 2,557

2002-2003 UNM Fact Book - Page 43
Transfer Students to Main CampusFall Semester 1998-2002Transfers to UNM Main CampusUndergraduate, Degree-Seeking Only*
Transferred From 1998 1999 2000 2001 2002 1998 1999 2000 2001 2002Albuquerque T-VI 308 236 250 265 333 29.4 23.2 30.0 29.0 34.8Other NM 2-year 180 190 153 155 131 17.2 18.6 18.4 17.0 13.7NM 4-year 136 161 94 142 121 13.0 15.8 11.3 15.5 12.7Other States 412 416 327 337 361 39.3 40.8 39.3 36.9 37.8International 13 16 9 15 10 1.2 1.6 1.1 1.6 1.0Total 1,049 1,019 833 914 956 100.0 100.0 100.0 100.0 100.0
*Does not include undergraduate transfers from UNM branch campuses.
UNM Branch Campus Transfers to UNM Main Campus
Branch Campus 1998 1999 2000 2001 2002 1998 1999 2000 2001 2002Gallup 49 57 45 38 35 30.8 35.0 28.5 24.2 25.2Los Alamos 36 31 26 32 30 22.6 19.0 16.5 20.4 21.6Taos 18 25 18 18 23 11.3 15.3 11.4 11.5 16.5Valencia 56 50 69 69 51 35.2 30.7 43.7 43.9 36.7Total from Branches 159 163 158 157 139 100.0 100.0 100.0 100.0 100.0
Source: Native/Transfer/Branch Transfer Database, Office of Institutional Research
Percentages
Undergraduate, Degree-Seeking Only Percentages

2002-2003 UNM Fact Book - Page 44

Degree Programs, Program Accreditation,Degrees Awarded & Alumni
2002-2003 UNM Fact Book - Page 45
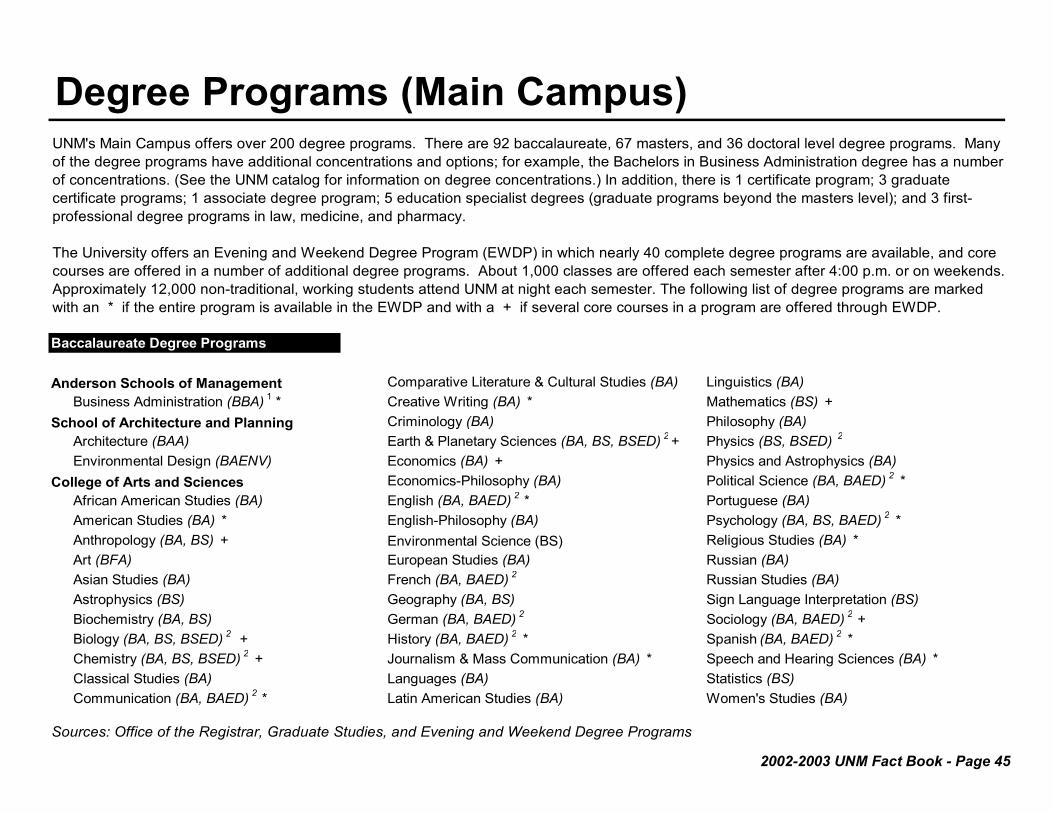
Degree Programs (Main Campus)
Baccalaureate Degree Programs
Anderson Schools of Management Comparative Literature & Cultural Studies (BA) Linguistics (BA) Business Administration (BBA) 1 * Creative Writing (BA) * Mathematics (BS) +
School of Architecture and Planning Criminology (BA) Philosophy (BA) Architecture (BAA) Earth & Planetary Sciences (BA, BS, BSED) 2 + Physics (BS, BSED) 2
Environmental Design (BAENV) Economics (BA) + Physics and Astrophysics (BA)College of Arts and Sciences Economics-Philosophy (BA) Political Science (BA, BAED) 2 *
African American Studies (BA) English (BA, BAED) 2 * Portuguese (BA) American Studies (BA) * English-Philosophy (BA) Psychology (BA, BS, BAED) 2 *Anthropology (BA, BS) + Environmental Science (BS) Religious Studies (BA) *Art (BFA) European Studies (BA) Russian (BA) Asian Studies (BA) French (BA, BAED) 2 Russian Studies (BA) Astrophysics (BS) Geography (BA, BS) Sign Language Interpretation (BS) Biochemistry (BA, BS) German (BA, BAED) 2 Sociology (BA, BAED) 2 +Biology (BA, BS, BSED) 2 + History (BA, BAED) 2 * Spanish (BA, BAED) 2 *Chemistry (BA, BS, BSED) 2 + Journalism & Mass Communication (BA) * Speech and Hearing Sciences (BA) *Classical Studies (BA) Languages (BA) Statistics (BS)Communication (BA, BAED) 2 * Latin American Studies (BA) Women's Studies (BA)
Sources: Office of the Registrar, Graduate Studies, and Evening and Weekend Degree Programs
UNM's Main Campus offers over 200 degree programs. There are 92 baccalaureate, 67 masters, and 36 doctoral level degree programs. Many of the degree programs have additional concentrations and options; for example, the Bachelors in Business Administration degree has a number of concentrations. (See the UNM catalog for information on degree concentrations.) In addition, there is 1 certificate program; 3 graduate certificate programs; 1 associate degree program; 5 education specialist degrees (graduate programs beyond the masters level); and 3 first-professional degree programs in law, medicine, and pharmacy.
The University offers an Evening and Weekend Degree Program (EWDP) in which nearly 40 complete degree programs are available, and core courses are offered in a number of additional degree programs. About 1,000 classes are offered each semester after 4:00 p.m. or on weekends. Approximately 12,000 non-traditional, working students attend UNM at night each semester. The following list of degree programs are marked with an * if the entire program is available in the EWDP and with a + if several core courses in a program are offered through EWDP.

2002-2003 UNM Fact Book - Page 46
Degree Programs (Main Campus)College of Education Electrical Engineering (BSEE) * School of Architecture and Planning
Art Education (BAED) + Mechanical Engineering (BSME) Architecture (MARCH) *Athletic Training (BS) Nuclear Engineering (BSNE) Community & Regional Planning (MCRP) +Bilingual Education (BAED) + College of Fine Arts Landscape Architecture (MLA) +Child Development & Family Relations (BS) Art History (BFA, BAFA) + College of Arts and SciencesCommunicative Arts Education (BAED) + Art Studio (BFA, BAFA) * American Studies (MA)Early Childhood Multicultural Education (BS) Dance (BA) + Anthropology (MA, MS)Earth Science Education (BSED) Design for Performance (BA) Biology (MS)Elementary Education (BSED) + Media Arts (BA) * Chemistry (MS)Exercise Science (BS) Music (BA, BM) + Communication (MA)Family Studies (BS) Theatre (BA, BAED) 2 + Comparative Lit. & Cultural Studies (MA)Health Education (BSED) College of Nursing Earth & Planetary Sciences (MS)Life Science Education (BSED) Nursing (BSN) Economics (MA)Mathematics Education (BSED) + University College English (MA) *Music Education (BAED) University Studies (BUS) + French (MA)Nutrition and Dietetics (BS) Health Sciences Geography (MS)Physical Education (BSED) Dental Hygiene (BSDH) German Studies (MA)Physical Science Education (BSED) Emergency Medical Services (BS) History (MA)Social Studies Education (BAED) Medical Laboratory Sciences (BSML) Latin American Studies (MA)Special Education (BSED) + Physician Assistant (BS) Linguistics (MA)Teaching English as a Second Lang (BAED) + Radiologic Sciences (BS) Mathematics (MS)Technology and Training (BS) + Optical Sciences and Engineering (MS) 3
School of Engineering Master Degree Programs Philosophy (MA)Chemical Engineering (BSCHE) Physics (MS)Civil Engineering (BSCE) Anderson Schools of Management Political Science (MA)Computer Engineering (BSCPE) Accounting (MACCT) Portuguese (MA)Computer Science (BSCS) Business Administration (MBA) 1+ Psychology (MS)Construction Engineering (BSCNE) Public Administration (MPA) * Sociology (MA)Construction Management (BS) Spanish (MA)
Sources: Office of the Registrar, Graduate Studies, and Evening and Weekend Degree Programs
2002-2003 UNM Fact Book - Page 47
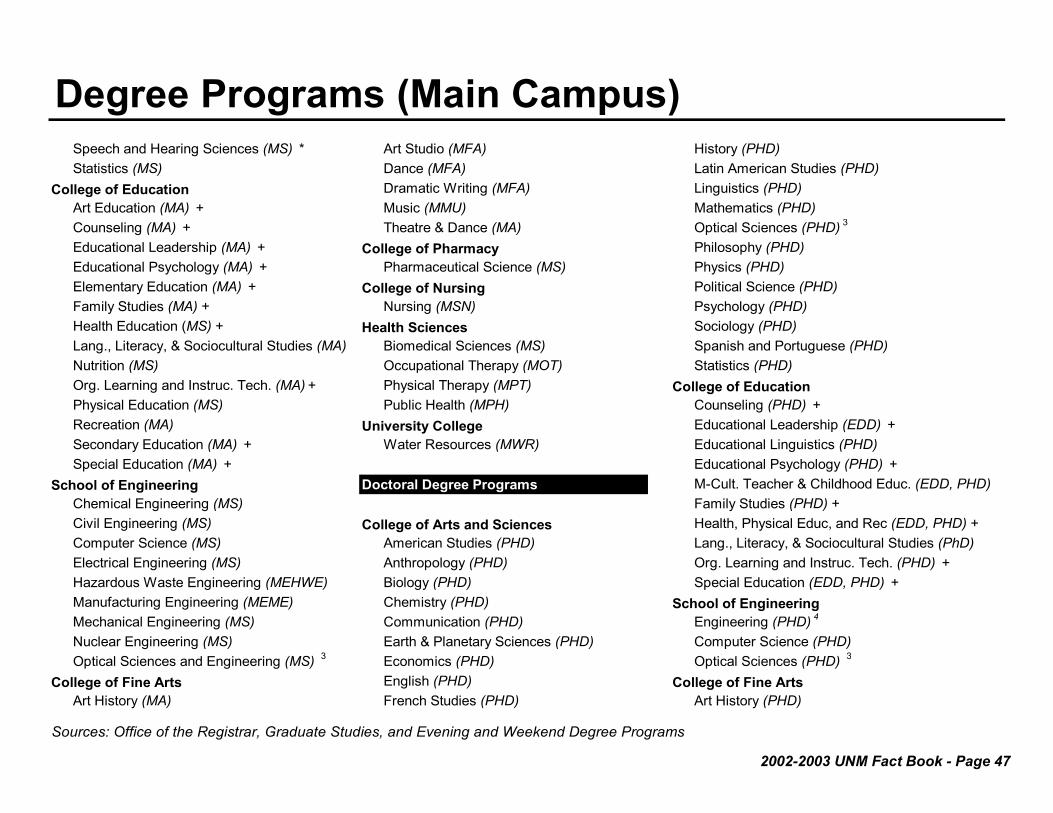
Degree Programs (Main Campus)Speech and Hearing Sciences (MS) * Art Studio (MFA) History (PHD)Statistics (MS) Dance (MFA) Latin American Studies (PHD)
College of Education Dramatic Writing (MFA) Linguistics (PHD)Art Education (MA) + Music (MMU) Mathematics (PHD)Counseling (MA) + Theatre & Dance (MA) Optical Sciences (PHD) 3
Educational Leadership (MA) + College of Pharmacy Philosophy (PHD)Educational Psychology (MA) + Pharmaceutical Science (MS) Physics (PHD)Elementary Education (MA) + College of Nursing Political Science (PHD)Family Studies (MA) + Nursing (MSN) Psychology (PHD)Health Education (MS) + Health Sciences Sociology (PHD)Lang., Literacy, & Sociocultural Studies (MA) Biomedical Sciences (MS) Spanish and Portuguese (PHD)Nutrition (MS) Occupational Therapy (MOT) Statistics (PHD)Org. Learning and Instruc. Tech. (MA) + Physical Therapy (MPT) College of EducationPhysical Education (MS) Public Health (MPH) Counseling (PHD) +Recreation (MA) University College Educational Leadership (EDD) +Secondary Education (MA) + Water Resources (MWR) Educational Linguistics (PHD)Special Education (MA) + Educational Psychology (PHD) +
School of Engineering Doctoral Degree Programs M-Cult. Teacher & Childhood Educ. (EDD, PHD)Chemical Engineering (MS) Family Studies (PHD) +Civil Engineering (MS) College of Arts and Sciences Health, Physical Educ, and Rec (EDD, PHD) +Computer Science (MS) American Studies (PHD) Lang., Literacy, & Sociocultural Studies (PhD)Electrical Engineering (MS) Anthropology (PHD) Org. Learning and Instruc. Tech. (PHD) +Hazardous Waste Engineering (MEHWE) Biology (PHD) Special Education (EDD, PHD) +Manufacturing Engineering (MEME) Chemistry (PHD) School of EngineeringMechanical Engineering (MS) Communication (PHD) Engineering (PHD) 4
Nuclear Engineering (MS) Earth & Planetary Sciences (PHD) Computer Science (PHD)Optical Sciences and Engineering (MS) 3 Economics (PHD) Optical Sciences (PHD) 3
College of Fine Arts English (PHD) College of Fine ArtsArt History (MA) French Studies (PHD) Art History (PHD)
Sources: Office of the Registrar, Graduate Studies, and Evening and Weekend Degree Programs

2002-2003 UNM Fact Book - Page 48
Degree Programs (Main Campus)College of Pharmacy Certificate Programs
Pharmaceutical Science (PHD) Nuclear Medicine Imaging (CERT)Health Sciences
Biomedical Sciences (PHD) Grad. & Post-Grad. Certificate ProgramsPost-MBA Certificate Programs (MGTCP) 1
First-Professional Degree Programs Post-Masters Certificate in Nursing (NURCP)Scientific and Engineering Computation (PDCERT)
School of LawLaw (JD) Educational Specialist
Medical School Curriculum & Instruction (EDSPC) +Medicine (DM) Educational Leadership (EDSPC)
College of Pharmacy Org. Learning and Instruc. Tech. (EDSPC)Doctor of Pharmacy (PHARD) Recreation (EDSPC) +
Special Education (EDSPC)Other Award and Degree Programs
Associate ProgramsSpec. Ed. Paraprofessional Training (AASEP)
1
2 Education students can earn a BSED or BAED in a content area outside the College of Education as part of their secondary teaching licensure program.3
4
Sources: Office of the Registrar, Graduate Studies, and Evening and Weekend Degree Programs
NOTE: Degree programs are marked with an * if the entire program is available in the Evening and Weekend Degree Program (EWDP) and with a + if several core courses in a program are offered through EWDP.
Anderson Schools of Management offers a BBA, an MBA, and a Post-MBA Certificate in several degree concentrations. See the current UNM catalog or ASM's web page for details on these degree concentrations.
The School of Engineering offers a PhD in Engineering; students can concentrate in Chemical, Civil, Electrical, Mechanical, or Nuclear Engineering. See the UNM catalog for details.
A MS in Optical Sciences and Engineering and a PhD in Optical Sciences are offered by the Department of Physics and Astronomy in the College of Arts and Sciences and by the Department of Electrical and Computing Engineering in the School of Engineering.

2002-2003 UNM Fact Book - Page 49
Accreditation at UNMInstitutional and Programmatic (as of 12/2002)Department Program or Major Accreditation Body Latest Review Next Review
Institutional North Central Association 1999 2009
ASM B.B.A., M.B.A., E.M.B.A., & American Assembly of 1995 2005Masters of Accountancy Collegiate Schools of Business
Department of Accounting Accounting, undergraduate 1995 2005& graduate programs
School of Public Masters in Public National Association of Schools of 1998 2003Administration Administration Public Affairs & Administration
Architecture Program Master of Architecture National Architectural 2000 2006Accrediting Board
Community & Regional Master of Community & Planning Accreditation Board 1997 2002Planning Program Regional PlanningLandscape Architecture Master of Landscape Landscape Architectural Accreditation 2003
Architecture Board
Chemistry Undergraduate Program American Chemical Society 1999 2004
Psychology Ph.D. Clinical Psychology American Psychological 1997 Fall 2004Association
Speech and Hearing Speech/Language Pathology, American Speech Language 1996 Fall 2003Sciences M.S. & Audiology, M.S. Hearing Association
Educational Leadership & M.A., Ed.S. Certificate, Ed.D National Council for Accreditation of 2000 2005Organizational Learning and Professional Preparation for Teacher Education (NCATE)(ELOL) Administrative Licensure
State of New Mexico 2000 2005
University Council for Educational 1996 2003Administration (UCEA)
Source: Office of Institutional Research
College of Arts and Sciences
College of Education
University of New Mexico
Anderson Schools of Management
School of Architecture and Planning
New Program
2002-2003 UNM Fact Book - Page 50
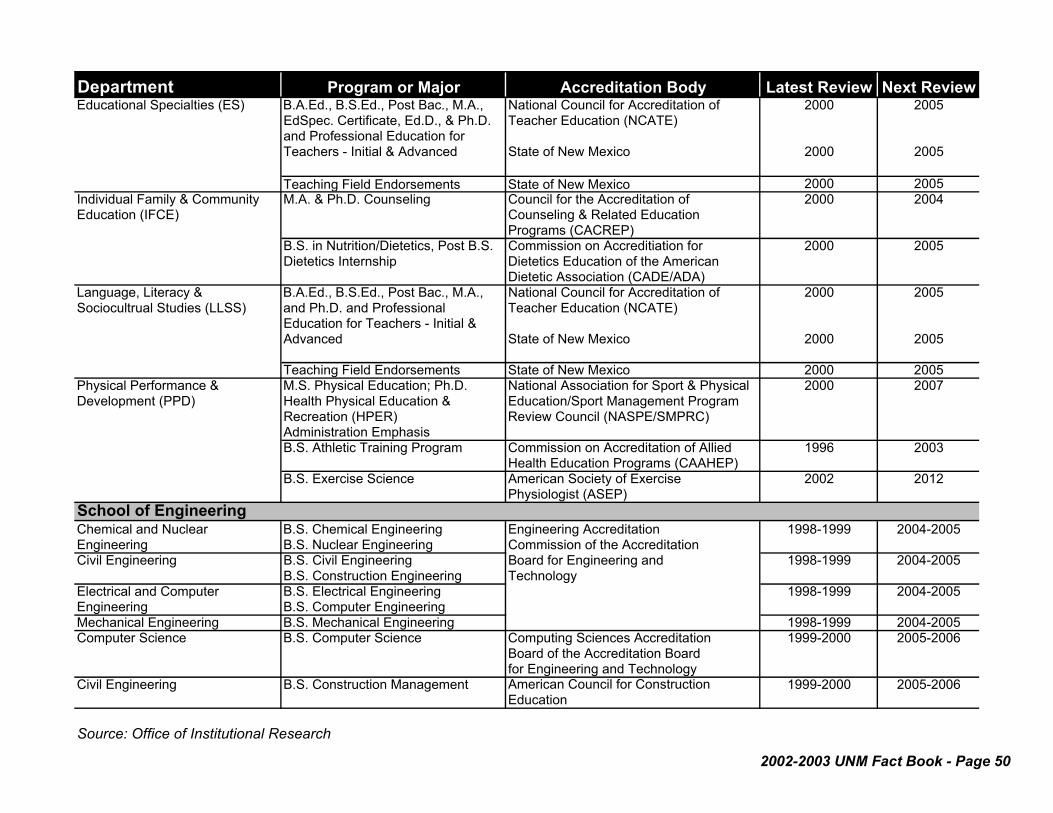
Department Program or Major Accreditation Body Latest Review Next ReviewEducational Specialties (ES) B.A.Ed., B.S.Ed., Post Bac., M.A., National Council for Accreditation of 2000 2005
EdSpec. Certificate, Ed.D., & Ph.D. Teacher Education (NCATE)and Professional Education for Teachers - Initial & Advanced State of New Mexico 2000 2005
Teaching Field Endorsements State of New Mexico 2000 2005Individual Family & Community M.A. & Ph.D. Counseling Council for the Accreditation of 2000 2004Education (IFCE) Counseling & Related Education
Programs (CACREP)B.S. in Nutrition/Dietetics, Post B.S. Commission on Accreditiation for 2000 2005Dietetics Internship Dietetics Education of the American
Dietetic Association (CADE/ADA)Language, Literacy & B.A.Ed., B.S.Ed., Post Bac., M.A., National Council for Accreditation of 2000 2005Sociocultrual Studies (LLSS) and Ph.D. and Professional Teacher Education (NCATE)
Education for Teachers - Initial & Advanced State of New Mexico 2000 2005
Teaching Field Endorsements State of New Mexico 2000 2005Physical Performance & M.S. Physical Education; Ph.D. National Association for Sport & Physical 2000 2007Development (PPD) Health Physical Education & Education/Sport Management Program
Recreation (HPER) Review Council (NASPE/SMPRC)Administration EmphasisB.S. Athletic Training Program Commission on Accreditation of Allied 1996 2003
Health Education Programs (CAAHEP)B.S. Exercise Science American Society of Exercise 2002 2012
Physiologist (ASEP)School of EngineeringChemical and Nuclear B.S. Chemical Engineering Engineering Accreditation 1998-1999 2004-2005Engineering B.S. Nuclear Engineering Commission of the AccreditationCivil Engineering B.S. Civil Engineering Board for Engineering and 1998-1999 2004-2005
B.S. Construction Engineering TechnologyElectrical and Computer B.S. Electrical Engineering 1998-1999 2004-2005Engineering B.S. Computer EngineeringMechanical Engineering B.S. Mechanical Engineering 1998-1999 2004-2005Computer Science B.S. Computer Science Computing Sciences Accreditation 1999-2000 2005-2006
Board of the Accreditation Boardfor Engineering and Technology
Civil Engineering B.S. Construction Management American Council for Construction 1999-2000 2005-2006Education
Source: Office of Institutional Research

2002-2003 UNM Fact Book - Page 51
Department Program or Major Accreditation Body Latest Review Next ReviewMusic B.M., B.A., B.M.E. & M.M. Music National Association of Schools 1991 2002
of MusicTheatre and Dance B.A., B.F.A. & M.A. Theatre National Association of Schools 1991 2002
of TheatreB.A. and M.A. Dance National Association of Schools of 1991 2002
DanceHealth Sciences Center - College of NursingCollege of Nursing Nursing Commission on Collegiate 2002 2012
Nursing EducationCollege of Nursing M.S.N. with a concentration in American College of Nurse- 1998 2006Graduate Program Nurse Midwifery Midwives, Division of AccreditationHealth Sciences Center - College of PharmacyCollege of Pharmacy Pharm.D. American Council on 1996-1997 2002-2003
Pharmaceutical EducationHealth Sciences Center - School of MedicineSchool of Medicine M.D. Medicine Undergraduate Liaison Committee on Medical Educ. 1996 2002-2003
Medical Education Curriculum representing the Assoc. of AmericanMedical Colleges & the AmericanMedical AssociationCommission for Accreditation of Health 2000 2005Education Programs, Committee on
Paramedic Course. Accreditation of Emergency Medicine Prog.Dept. of Family & Community B.S. and certification of Commission on Accreditation of 2000 2003Medicine, Physician Assistant completion Physician Assistant Allied Health Education ProgramsProgram EducationDept. of Family & Community Masters in Public Health in Council on Education for Public 1996 2001Medicine, Masters in Public Community Health & Preventive HealthHealth Program Medicine, through Biomedical
Sciences Graduate ProgramDept. of Orthopaedics Masters of Occupational Therapy Accreditation Council for 1994 2001Occupational Therapy Program Occupational Therapy EducationDept. of Orthopaedics Masters of Physical Therapy Commission on Accreditation in 2003Division of Physical Therapy Physical Therapy Education
Dept. of Pathology, Medical B.S. or certificate for those with a National Accrediting Agency for 2000 2007Laboratory Sciences Program Degree, Med. Laboratory ScienceClinical Laboratory Sciences
Source: Office of Institutional Research
Dept. of Emergency Medicine, Emergency Medical Services Academy
"Part of a B.S. degree program & also a certificate program."
Interim Accreditation for new Masters
prog. 2000
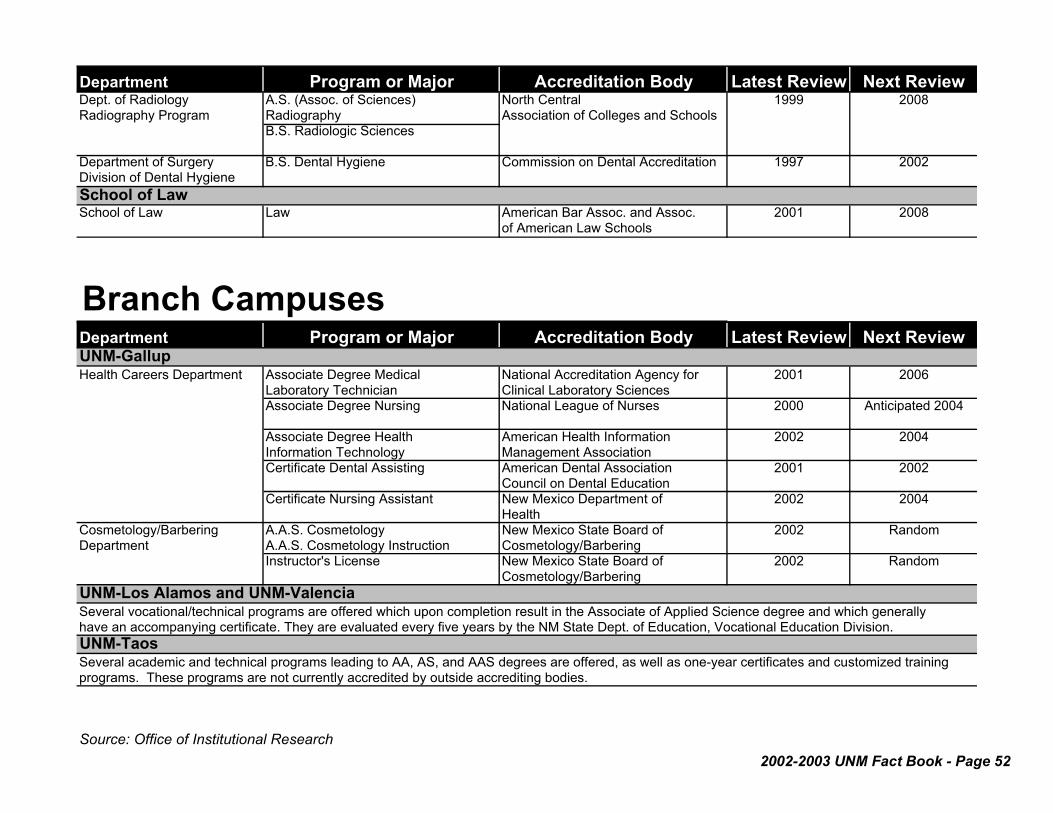
2002-2003 UNM Fact Book - Page 52
Department Program or Major Accreditation Body Latest Review Next ReviewDept. of Radiology A.S. (Assoc. of Sciences) North Central 1999 2008Radiography Program Radiography Association of Colleges and Schools
B.S. Radiologic Sciences
Department of Surgery B.S. Dental Hygiene Commission on Dental Accreditation 1997 2002Division of Dental HygieneSchool of LawSchool of Law Law American Bar Assoc. and Assoc. 2001 2008
of American Law Schools
Branch Campuses Department Program or Major Accreditation Body Latest Review Next ReviewUNM-GallupHealth Careers Department Associate Degree Medical National Accreditation Agency for 2001 2006
Laboratory Technician Clinical Laboratory SciencesAssociate Degree Nursing National League of Nurses 2000 Anticipated 2004
Associate Degree Health American Health Information 2002 2004Information Technology Management AssociationCertificate Dental Assisting American Dental Association 2001 2002
Council on Dental EducationCertificate Nursing Assistant New Mexico Department of 2002 2004
HealthCosmetology/Barbering A.A.S. Cosmetology New Mexico State Board of 2002 RandomDepartment A.A.S. Cosmetology Instruction Cosmetology/Barbering
Instructor's License New Mexico State Board of 2002 RandomCosmetology/Barbering
UNM-Los Alamos and UNM-Valencia
UNM-Taos
Source: Office of Institutional Research
Several vocational/technical programs are offered which upon completion result in the Associate of Applied Science degree and which generallyhave an accompanying certificate. They are evaluated every five years by the NM State Dept. of Education, Vocational Education Division.
Several academic and technical programs leading to AA, AS, and AAS degrees are offered, as well as one-year certificates and customized training programs. These programs are not currently accredited by outside accrediting bodies.

2002-2003 UNM Fact Book - Page 53
Degrees Awarded, 1992-1993 to 2001-2002Main Campus*
92-93 93-94 94-95 95-96 96-97 97-98 98-99 99-00 00-01 01-02Bachelors 2,487 2,554 2,479 2,509 2,607 2,733 2,780 2,723 2,548 2,513Masters 962 1,069 1,144 1,242 1,159 1,083 1,026 976 1,035 1,030Professional 177 193 172 186 174 185 167 226 249 286Doctorate 165 165 198 210 166 204 190 184 174 189Post-Masters Certificate 2 1 0 7 4 6 5 5 10 8Education Specialist 48 28 51 27 24 35 33 22 20 7Associate/Certificate 88 66 62 48 44 36 30 7 8 3Total 3,929 4,076 4,106 4,229 4,178 4,282 4,231 4,143 4,044 4,036*Includes HSC degrees
Source: Fall 2002 Official Enrollment Report, Office of the Registrar
Degrees Awarded
Degrees Awarded1992-1993 to 2001-2002
0
1,000
2,000
3,000
4,000
5,000
92-93 93-94 94-95 95-96 96-97 97-98 98-99 99-00 00-01 01-02
Year
Num
ber o
f Deg
rees Doctorate
Professional
Masters
Bachelors

2002-2003 UNM Fact Book - Page 54
Degrees Awarded, by EthnicityMain Campus (1997-1998 to 2001-2002)1
97-98 98-99 99-00 00-01 01-02 97-98 98-99 99-00 00-01 01-02African American/Black 58 64 59 62 49 13 17 20 15 18American Indian 131 153 135 132 114 23 18 22 29 34Asian/Pacific Islander 64 97 70 77 80 26 18 18 22 18Hispanic 711 739 706 746 774 177 158 145 181 203White, non-Hispanic 1,705 1,629 1,662 1,446 1,399 739 673 648 644 588International 25 34 24 20 26 80 84 72 86 116No Response 39 64 67 65 72 25 58 51 58 53Total 2,733 2,780 2,723 2,548 2,514 1,083 1,026 976 1,035 1,030
97-98 98-99 99-00 00-01 01-02African American/Black 5 0 1 3 0American Indian 20 18 17 20 16Asian/Pacific Islander 1 3 0 4 4Hispanic 1 3 6 1 3White, non-Hispanic 138 135 138 123 130International 37 31 20 23 33No Response 2 0 2 0 3Total 204 190 184 174 189
1Includes HSC degrees.
Source: 1997-1998 through 2001-2002 IPEDS Completions Surveys
Bachelors Masters
Doctorate
2Also includes Certificates, Assoc., Educ. Specialist, Post-Masters Certif., and Professional Degrees.
Total Degrees 2001-20022
(by Ethnicity)
American Indian4.2%
African American/Black 1.8%
No Response3.2%
International4.4%
White, non-Hispanic56.8%
Asian/Pacific Islander
3.3%
Hispanic26.3%

2002-2003 UNM Fact Book - Page 55
Retention and Graduation Rates1
Main Campus2
FreshmanClass
1 Yr. 2 Yrs. 3 Yrs. 4 Yrs. 5 Yrs. 6 Yrs. 7 Yrs. 8 Yrs. 9 Yrs. 10 Yrs.1992 73.7 60.6 55.0 8.7 27.5 37.0 42.5 44.5 45.8 46.41993 70.8 59.2 53.1 9.1 27.5 37.0 41.8 43.8 45.0 .1994 70.6 59.4 52.8 10.5 30.4 39.5 43.4 45.6 . .1995 73.0 69.0 57.4 13.0 34.9 44.1 47.9 . . .1996 74.6 65.9 59.9 13.2 35.1 42.6 . . . .1997 71.5 63.2 56.1 11.9 32.0 . . . . .1998 69.9 59.3 53.7 9.1 . . . . . .1999 71.6 61.3 55.0 . . . . . . .2000 73.4 62.4 . . . . . . . .2001 76.3 . . . . . . . . .
1Graduation rates only include baccalaureate degrees. 2Includes HSC undergraduate students. 3Registered for 12 or more credit hrs. in 1st semester.Source: Freshman Cohort Tracking Database, Office of Institutional Research
After By
Retention and Graduation Rates of First-Time, Full-Time3 Freshmen
Retention Rate Cumulative Graduation Rate(Fall 1992 to Fall 2001 Freshman Classes)
Fall 1992 Freshman Class1 to 10 Year Retention and
Cumulative Graduation Rates
0
20
40
60
80
100
1 2 3 4 5 6 7 8 9 10Years Following Initial Year
Perc
ent % Retained
% Graduated

2002-2003 UNM Fact Book - Page 56
Degrees Awarded, by EthnicityBranch Campuses (1997-1998 to 2001-2002)
97-98 98-99 99-00 00-01 01-02 97-98 98-99 99-00 00-01 01-02African American/Black - - 1 - - 1 2 2 2 -American Indian 48 52 58 55 45 112 82 122 116 91Asian/Pacific Islander 1 1 - 2 - 1 - 1 0 -Hispanic 3 2 3 15 2 15 10 12 22 4White, non-Hispanic 1 2 5 7 6 19 13 13 14 7International - - - - - - - - 1 -No Response - - 2 1 - - - 1 2 -Total 53 57 69 80 53 148 107 151 157 102
97-98 98-99 99-00 00-01 01-02 97-98 98-99 99-00 00-01 01-02African American/Black - - - - - - - - - -American Indian - 1 - - - 2 1 2 3 1Asian/Pacific Islander - - - - 1 - - - 1 -Hispanic 3 6 3 - 4 8 16 10 11 16White, non-Hispanic 2 7 6 1 3 15 16 13 21 23International - - - - - - - - - -No Response - - - - - - 1 - - -Total 5 14 9 1 8 25 34 25 36 40
Source: Integrated Postsecondary Education Data System Completions Survey, 1997-98 to 2001-2002
Gallup Branch Campus
Los Alamos Branch CampusCertificates Associate Degrees
Certificates Associate Degrees
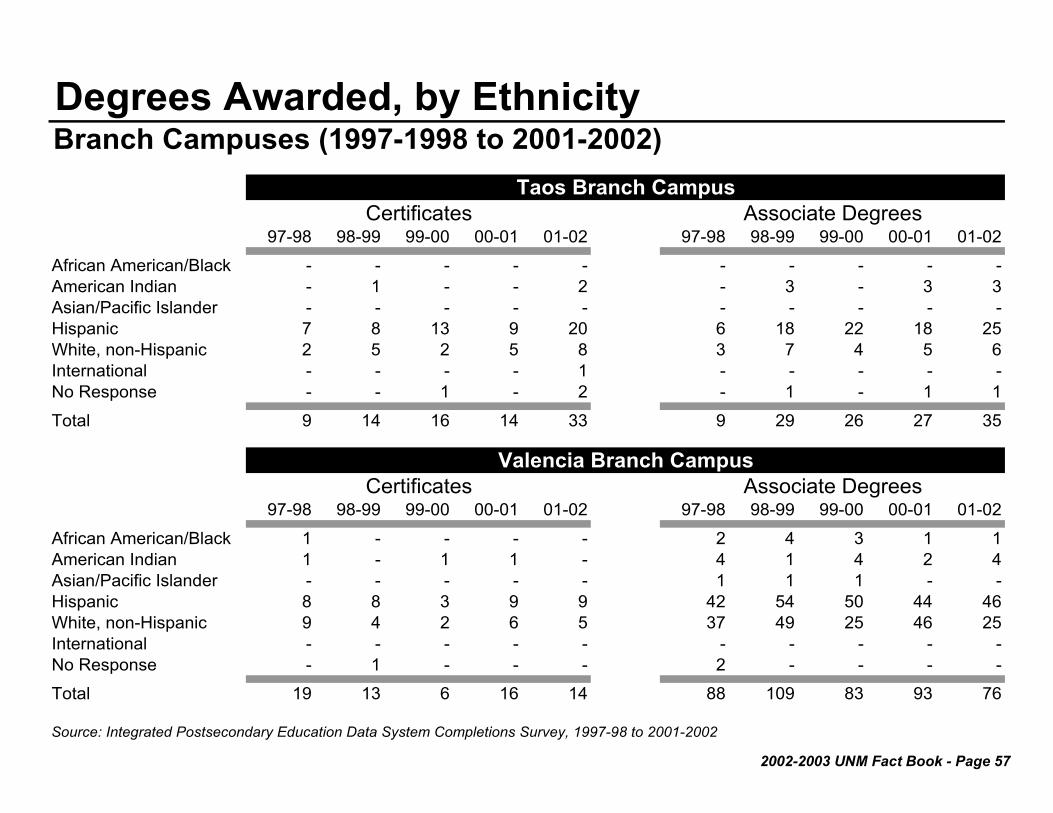
2002-2003 UNM Fact Book - Page 57
Degrees Awarded, by EthnicityBranch Campuses (1997-1998 to 2001-2002)
97-98 98-99 99-00 00-01 01-02 97-98 98-99 99-00 00-01 01-02African American/Black - - - - - - - - - -American Indian - 1 - - 2 - 3 - 3 3Asian/Pacific Islander - - - - - - - - - -Hispanic 7 8 13 9 20 6 18 22 18 25White, non-Hispanic 2 5 2 5 8 3 7 4 5 6International - - - - 1 - - - - -No Response - - 1 - 2 - 1 - 1 1Total 9 14 16 14 33 9 29 26 27 35
97-98 98-99 99-00 00-01 01-02 97-98 98-99 99-00 00-01 01-02African American/Black 1 - - - - 2 4 3 1 1American Indian 1 - 1 1 - 4 1 4 2 4Asian/Pacific Islander - - - - - 1 1 1 - -Hispanic 8 8 3 9 9 42 54 50 44 46White, non-Hispanic 9 4 2 6 5 37 49 25 46 25International - - - - - - - - - -No Response - 1 - - - 2 - - - -Total 19 13 6 16 14 88 109 83 93 76
Source: Integrated Postsecondary Education Data System Completions Survey, 1997-98 to 2001-2002
Certificates Associate Degrees
Taos Branch CampusCertificates Associate Degrees
Valencia Branch Campus
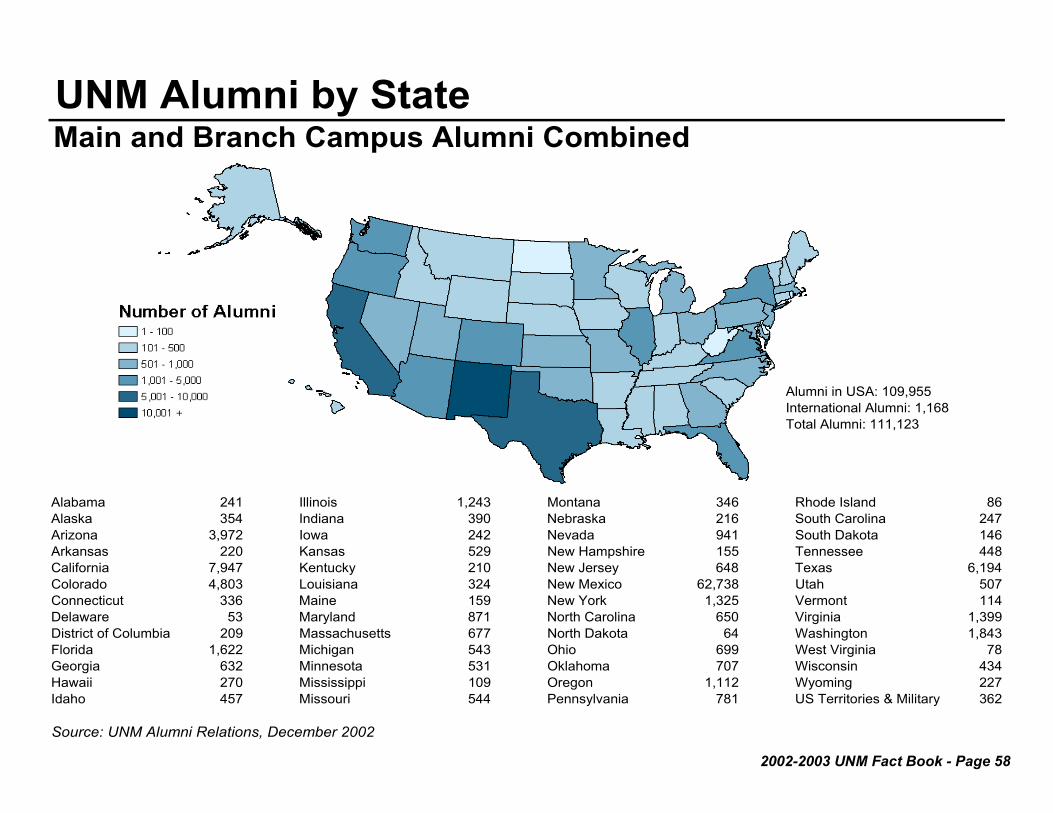
2002-2003 UNM Fact Book - Page 58
UNM Alumni by StateMain and Branch Campus Alumni Combined
Alabama 241 Illinois 1,243 Montana 346 Rhode Island 86Alaska 354 Indiana 390 Nebraska 216 South Carolina 247Arizona 3,972 Iowa 242 Nevada 941 South Dakota 146Arkansas 220 Kansas 529 New Hampshire 155 Tennessee 448California 7,947 Kentucky 210 New Jersey 648 Texas 6,194Colorado 4,803 Louisiana 324 New Mexico 62,738 Utah 507Connecticut 336 Maine 159 New York 1,325 Vermont 114Delaware 53 Maryland 871 North Carolina 650 Virginia 1,399District of Columbia 209 Massachusetts 677 North Dakota 64 Washington 1,843Florida 1,622 Michigan 543 Ohio 699 West Virginia 78Georgia 632 Minnesota 531 Oklahoma 707 Wisconsin 434Hawaii 270 Mississippi 109 Oregon 1,112 Wyoming 227Idaho 457 Missouri 544 Pennsylvania 781 US Territories & Military 362
Source: UNM Alumni Relations, December 2002
Alumni in USA: 109,955International Alumni: 1,168Total Alumni: 111,123

Faculty
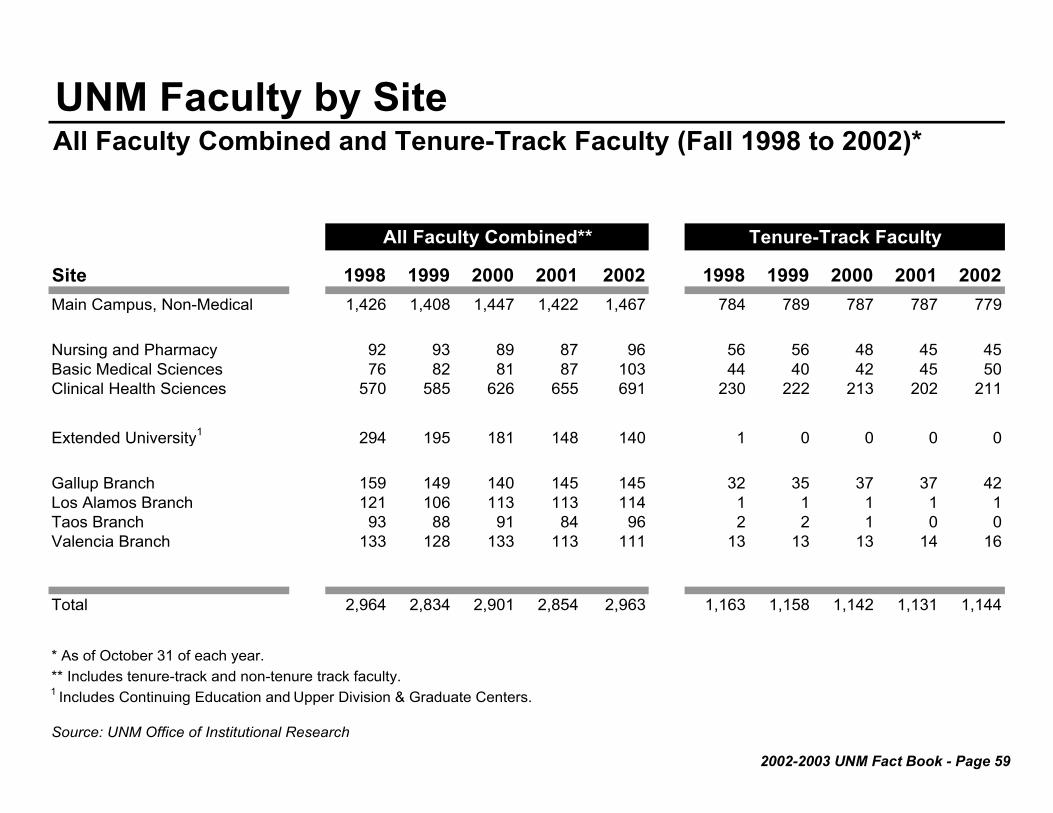
2002-2003 UNM Fact Book - Page 59
UNM Faculty by Site All Faculty Combined and Tenure-Track Faculty (Fall 1998 to 2002)*
Site 1998 1999 2000 2001 2002 1998 1999 2000 2001 2002Main Campus, Non-Medical 1,426 1,408 1,447 1,422 1,467 784 789 787 787 779
Nursing and Pharmacy 92 93 89 87 96 56 56 48 45 45Basic Medical Sciences 76 82 81 87 103 44 40 42 45 50Clinical Health Sciences 570 585 626 655 691 230 222 213 202 211
Extended University1 294 195 181 148 140 1 0 0 0 0
Gallup Branch 159 149 140 145 145 32 35 37 37 42Los Alamos Branch 121 106 113 113 114 1 1 1 1 1Taos Branch 93 88 91 84 96 2 2 1 0 0Valencia Branch 133 128 133 113 111 13 13 13 14 16
Total 2,964 2,834 2,901 2,854 2,963 1,163 1,158 1,142 1,131 1,144
* As of October 31 of each year.** Includes tenure-track and non-tenure track faculty.1 Includes Continuing Education and Upper Division & Graduate Centers.
Source: UNM Office of Institutional Research
All Faculty Combined** Tenure-Track Faculty

2002-2003 UNM Fact Book - Page 60
UNM Faculty by SiteNon-Tenure-Track Instructional Faculty (Fall 1998 to 2002)*
Site 1998 1999 2000 2001 2002 1998 1999 2000 2001 2002Main Campus, Non-Medical 106 104 113 120 118 415 398 419 390 434
Nursing and Pharmacy 18 18 20 27 26 13 13 13 7 16Basic Medical Sciences 9 9 6 5 4 7 8 7 7 6Clinical Health Sciences 283 300 331 357 371 31 32 40 47 54
Extended University1 2 2 1 2 2 291 193 179 146 138
Gallup Branch 44 38 37 35 31 83 76 66 73 71Los Alamos Branch 8 10 13 13 11 112 95 99 99 102Taos Branch 1 0 1 4 5 90 86 89 80 90Valencia Branch 10 13 16 14 13 110 102 104 85 82
Total 481 494 538 577 581 1,152 1,003 1,016 934 993
* As of October 31 of each year.1 Includes Continuing Education and Upper Division & Graduate Centers.
Source: UNM Office of Institutional Research
Regular Temporary
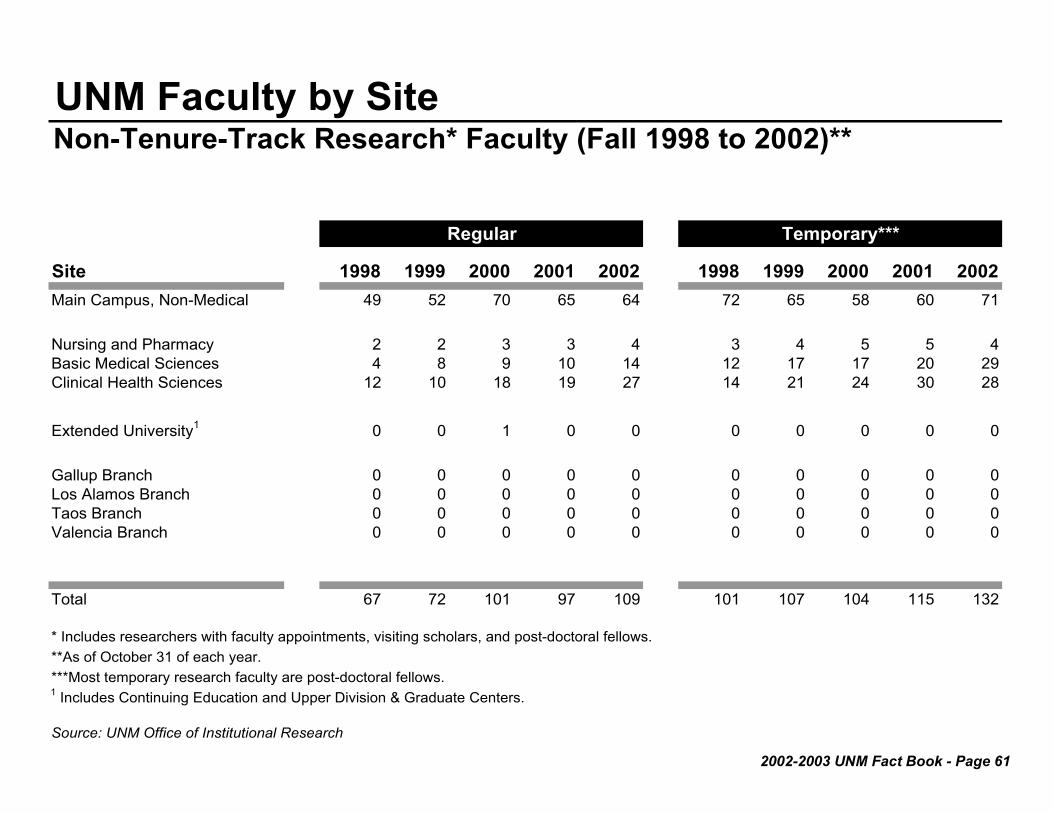
2002-2003 UNM Fact Book - Page 61
UNM Faculty by SiteNon-Tenure-Track Research* Faculty (Fall 1998 to 2002)**
Site 1998 1999 2000 2001 2002 1998 1999 2000 2001 2002Main Campus, Non-Medical 49 52 70 65 64 72 65 58 60 71
Nursing and Pharmacy 2 2 3 3 4 3 4 5 5 4Basic Medical Sciences 4 8 9 10 14 12 17 17 20 29Clinical Health Sciences 12 10 18 19 27 14 21 24 30 28
Extended University1 0 0 1 0 0 0 0 0 0 0
Gallup Branch 0 0 0 0 0 0 0 0 0 0Los Alamos Branch 0 0 0 0 0 0 0 0 0 0Taos Branch 0 0 0 0 0 0 0 0 0 0Valencia Branch 0 0 0 0 0 0 0 0 0 0
Total 67 72 101 97 109 101 107 104 115 132
* Includes researchers with faculty appointments, visiting scholars, and post-doctoral fellows.**As of October 31 of each year.***Most temporary research faculty are post-doctoral fellows.1 Includes Continuing Education and Upper Division & Graduate Centers.
Source: UNM Office of Institutional Research
Regular Temporary***

2002-2003 UNM Fact Book - Page 62
FacultyAll UNM (Fall 1998 to 2002 )*
1998 1999 2000 2001 2002 1998 1999 2000 2001 2002Tenure Track Faculty: Professor 469 478 467 464 482 15.8 16.9 16.1 16.3 16.3 Assoc. Professor 377 371 364 363 357 12.7 13.1 12.5 12.7 12.0 Asst. Professor 307 296 307 301 299 10.4 10.4 10.6 10.5 10.1 Instructor/Lecturer 10 13 4 3 6 0.3 0.5 0.1 0.1 0.2Non-Ten. Track Instructional Fac. 1,633 1,497 1,554 1,511 1,574 55.1 52.8 53.6 52.9 53.1Non-Ten. Track Research Fac.1 168 179 205 212 241 5.7 6.3 7.1 7.4 8.1Total Faculty 2,964 2,834 2,901 2,854 2,963 100.0 100.0 100.0 100.0 99.9
1998 1999 2000 2001 2002 1998 1999 2000 2001 2002Total Tenure Track Faculty 1,163 1,158 1,142 1,131 1,144Females 397 407 410 417 433 34.1 35.1 35.9 36.9 37.8Males 766 751 732 714 711 65.9 64.9 64.1 63.1 62.2African American/Black 7 8 7 9 10 0.6 0.7 0.6 0.8 0.9American Indian 18 20 20 18 23 1.5 1.7 1.8 1.6 2.0Asian/Pacific Islander 51 53 60 64 66 4.4 4.6 5.3 5.7 5.8Hispanic 112 110 108 102 110 9.6 9.5 9.5 9.0 9.6White, non-Hispanic 967 959 942 932 928 83.1 82.8 82.5 82.4 81.1No Response 8 8 5 6 7 0.7 0.7 0.4 0.5 0.6*As of October 31 of each year. 1Includes researchers with faculty appointments, visiting scholars, and post-doctoral fellows.
Source: UNM Office of Institutional Research
Percentages
Percentages
All Faculty
Tenure-Track Faculty Demographics
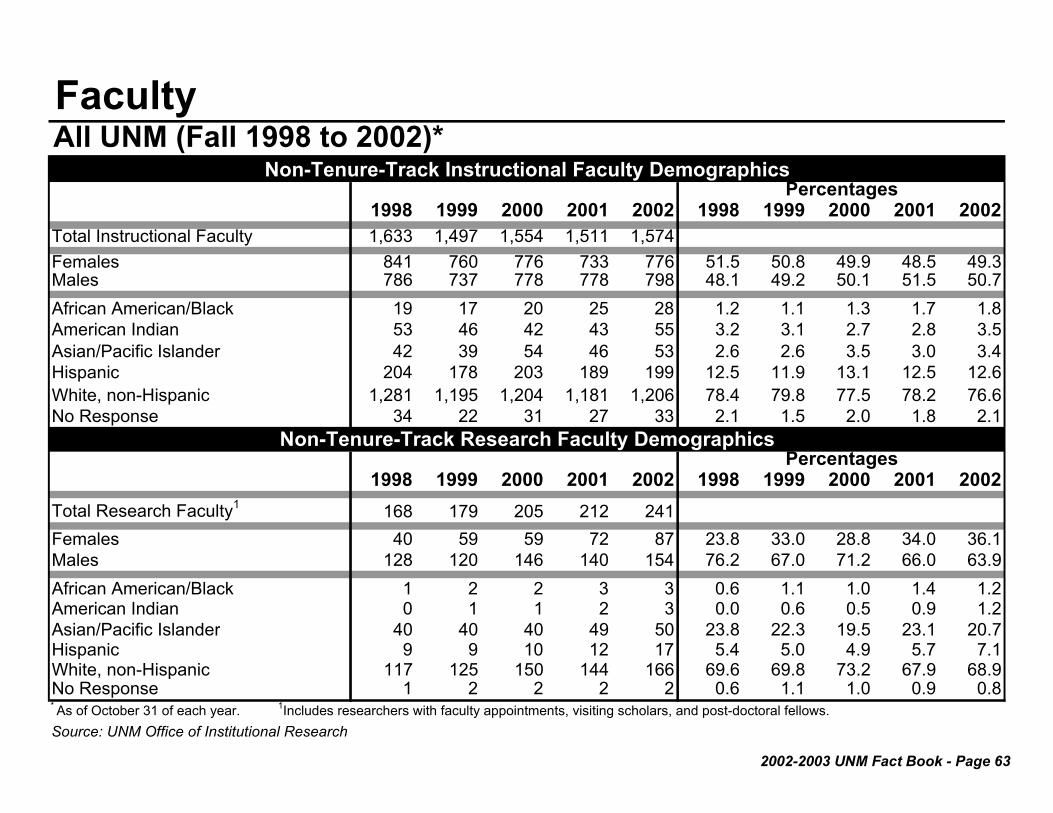
2002-2003 UNM Fact Book - Page 63
FacultyAll UNM (Fall 1998 to 2002)*
1998 1999 2000 2001 2002 1998 1999 2000 2001 2002Total Instructional Faculty 1,633 1,497 1,554 1,511 1,574Females 841 760 776 733 776 51.5 50.8 49.9 48.5 49.3Males 786 737 778 778 798 48.1 49.2 50.1 51.5 50.7African American/Black 19 17 20 25 28 1.2 1.1 1.3 1.7 1.8American Indian 53 46 42 43 55 3.2 3.1 2.7 2.8 3.5Asian/Pacific Islander 42 39 54 46 53 2.6 2.6 3.5 3.0 3.4Hispanic 204 178 203 189 199 12.5 11.9 13.1 12.5 12.6White, non-Hispanic 1,281 1,195 1,204 1,181 1,206 78.4 79.8 77.5 78.2 76.6No Response 34 22 31 27 33 2.1 1.5 2.0 1.8 2.1
1998 1999 2000 2001 2002 1998 1999 2000 2001 2002Total Research Faculty1 168 179 205 212 241Females 40 59 59 72 87 23.8 33.0 28.8 34.0 36.1Males 128 120 146 140 154 76.2 67.0 71.2 66.0 63.9African American/Black 1 2 2 3 3 0.6 1.1 1.0 1.4 1.2American Indian 0 1 1 2 3 0.0 0.6 0.5 0.9 1.2Asian/Pacific Islander 40 40 40 49 50 23.8 22.3 19.5 23.1 20.7Hispanic 9 9 10 12 17 5.4 5.0 4.9 5.7 7.1White, non-Hispanic 117 125 150 144 166 69.6 69.8 73.2 67.9 68.9No Response 1 2 2 2 2 0.6 1.1 1.0 0.9 0.8* As of October 31 of each year. 1Includes researchers with faculty appointments, visiting scholars, and post-doctoral fellows. Source: UNM Office of Institutional Research
Percentages
Non-Tenure-Track Instructional Faculty Demographics
Non-Tenure-Track Research Faculty Demographics
Percentages

2002-2003 UNM Fact Book - Page 64
FacultyMain Campus, Non-Medical (Fall 1998 to 2002 )*
1998 1999 2000 2001 2002 1998 1999 2000 2001 2002Tenure Track Faculty: Professor 343 355 351 341 341 24.1 25.2 24.3 24.0 23.2 Assoc. Professor 259 250 245 255 247 18.2 17.8 16.9 17.9 16.8 Asst. Professor 182 182 191 191 191 12.8 12.9 13.2 13.4 13.0 Instructor/Lecturer 0 2 0 0 0 0.0 0.1 0.0 0.0 0.0Non-Ten. Track Instructional Fac. 521 502 532 510 552 36.5 35.7 36.8 35.9 37.6Non-Ten. Track Research Fac.1 121 117 128 125 135 8.5 8.3 8.8 8.8 9.2Total Faculty 1,426 1,408 1,447 1,422 1,467 100.0 100.0 100.0 100.0 99.9
1998 1999 2000 2001 2002 1998 1999 2000 2001 2002Total Tenure Track Faculty 784 789 787 787 779Females 264 276 282 290 294 33.7 35.0 35.8 36.8 37.7Males 520 513 505 497 485 66.3 65.0 64.2 63.2 62.3African American/Black 5 7 7 8 8 0.6 0.9 0.9 1.0 1.0American Indian 12 13 11 10 15 1.5 1.6 1.4 1.3 1.9Asian/Pacific Islander 35 36 42 44 45 4.5 4.6 5.3 5.6 5.8Hispanic 81 80 79 77 83 10.3 10.1 10.0 9.8 10.7White, non-Hispanic 650 651 646 645 624 82.9 82.5 82.1 82.0 80.1No Response 1 2 2 3 4 0.1 0.3 0.3 0.4 0.5*As of October 31 of each year. 1Includes researchers with faculty appointments, visiting scholars, and post-doctoral fellows.
Source: UNM Office of Institutional Research
PercentagesTenure-Track Faculty Demographics
PercentagesAll Faculty
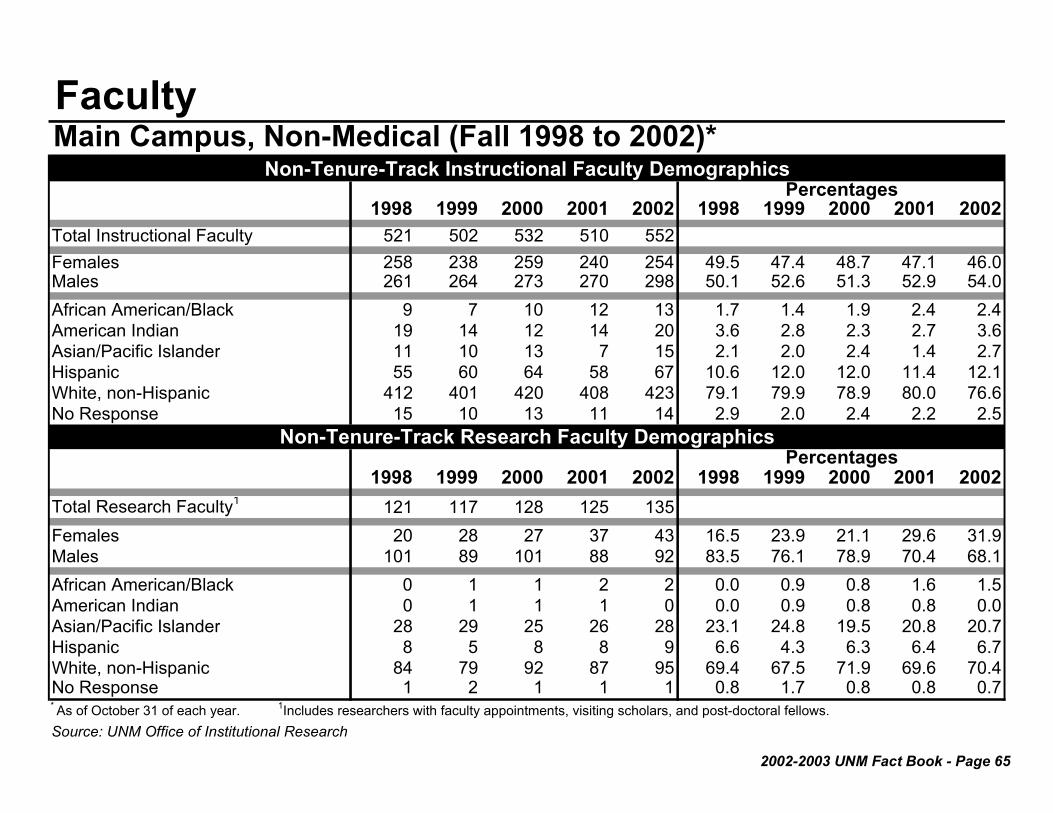
2002-2003 UNM Fact Book - Page 65
FacultyMain Campus, Non-Medical (Fall 1998 to 2002)*
1998 1999 2000 2001 2002 1998 1999 2000 2001 2002Total Instructional Faculty 521 502 532 510 552Females 258 238 259 240 254 49.5 47.4 48.7 47.1 46.0Males 261 264 273 270 298 50.1 52.6 51.3 52.9 54.0African American/Black 9 7 10 12 13 1.7 1.4 1.9 2.4 2.4American Indian 19 14 12 14 20 3.6 2.8 2.3 2.7 3.6Asian/Pacific Islander 11 10 13 7 15 2.1 2.0 2.4 1.4 2.7Hispanic 55 60 64 58 67 10.6 12.0 12.0 11.4 12.1White, non-Hispanic 412 401 420 408 423 79.1 79.9 78.9 80.0 76.6No Response 15 10 13 11 14 2.9 2.0 2.4 2.2 2.5
1998 1999 2000 2001 2002 1998 1999 2000 2001 2002Total Research Faculty1 121 117 128 125 135Females 20 28 27 37 43 16.5 23.9 21.1 29.6 31.9Males 101 89 101 88 92 83.5 76.1 78.9 70.4 68.1African American/Black 0 1 1 2 2 0.0 0.9 0.8 1.6 1.5American Indian 0 1 1 1 0 0.0 0.9 0.8 0.8 0.0Asian/Pacific Islander 28 29 25 26 28 23.1 24.8 19.5 20.8 20.7Hispanic 8 5 8 8 9 6.6 4.3 6.3 6.4 6.7White, non-Hispanic 84 79 92 87 95 69.4 67.5 71.9 69.6 70.4No Response 1 2 1 1 1 0.8 1.7 0.8 0.8 0.7* As of October 31 of each year. 1Includes researchers with faculty appointments, visiting scholars, and post-doctoral fellows. Source: UNM Office of Institutional Research
Percentages
Non-Tenure-Track Instructional Faculty Demographics
Non-Tenure-Track Research Faculty Demographics
Percentages
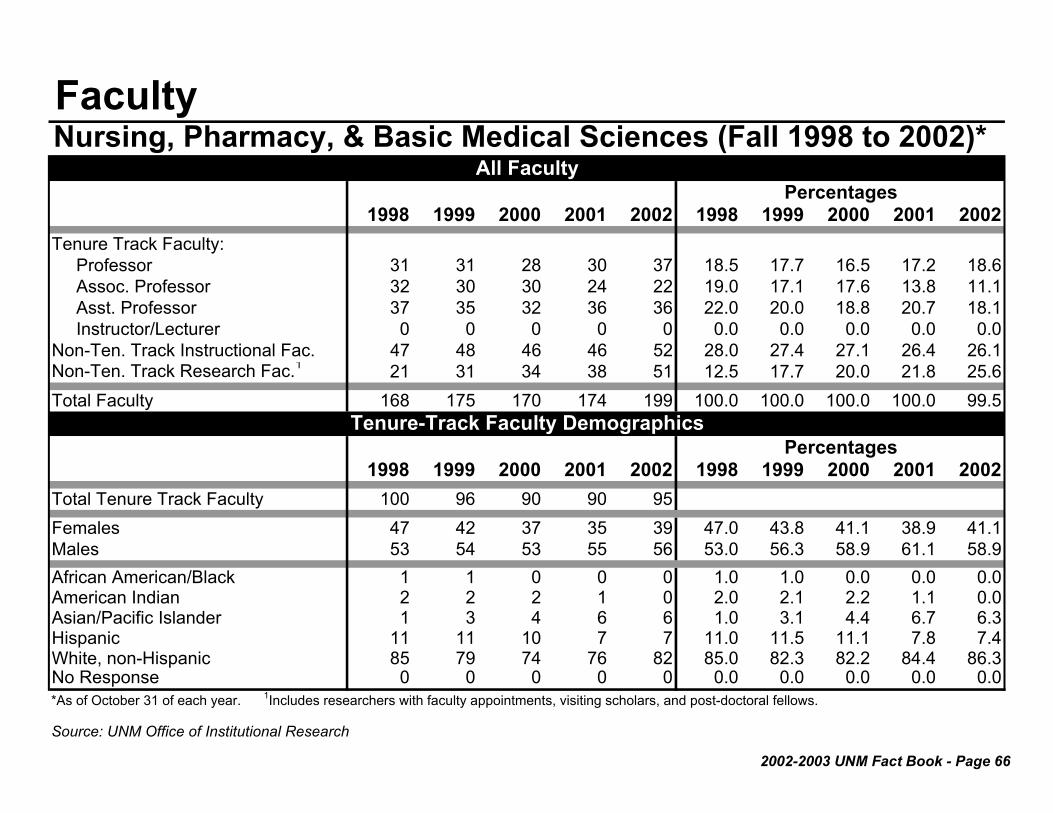
2002-2003 UNM Fact Book - Page 66
FacultyNursing, Pharmacy, & Basic Medical Sciences (Fall 1998 to 2002)*
1998 1999 2000 2001 2002 1998 1999 2000 2001 2002Tenure Track Faculty: Professor 31 31 28 30 37 18.5 17.7 16.5 17.2 18.6 Assoc. Professor 32 30 30 24 22 19.0 17.1 17.6 13.8 11.1 Asst. Professor 37 35 32 36 36 22.0 20.0 18.8 20.7 18.1 Instructor/Lecturer 0 0 0 0 0 0.0 0.0 0.0 0.0 0.0Non-Ten. Track Instructional Fac. 47 48 46 46 52 28.0 27.4 27.1 26.4 26.1Non-Ten. Track Research Fac.1 21 31 34 38 51 12.5 17.7 20.0 21.8 25.6Total Faculty 168 175 170 174 199 100.0 100.0 100.0 100.0 99.5
1998 1999 2000 2001 2002 1998 1999 2000 2001 2002Total Tenure Track Faculty 100 96 90 90 95Females 47 42 37 35 39 47.0 43.8 41.1 38.9 41.1Males 53 54 53 55 56 53.0 56.3 58.9 61.1 58.9African American/Black 1 1 0 0 0 1.0 1.0 0.0 0.0 0.0American Indian 2 2 2 1 0 2.0 2.1 2.2 1.1 0.0Asian/Pacific Islander 1 3 4 6 6 1.0 3.1 4.4 6.7 6.3Hispanic 11 11 10 7 7 11.0 11.5 11.1 7.8 7.4White, non-Hispanic 85 79 74 76 82 85.0 82.3 82.2 84.4 86.3No Response 0 0 0 0 0 0.0 0.0 0.0 0.0 0.0*As of October 31 of each year. 1Includes researchers with faculty appointments, visiting scholars, and post-doctoral fellows.
Source: UNM Office of Institutional Research
Percentages
All Faculty
Tenure-Track Faculty Demographics
Percentages

2002-2003 UNM Fact Book - Page 67
FacultyNursing, Pharmacy, & Basic Medical Sciences (Fall 1998 to 2002)*
1998 1999 2000 2001 2002 1998 1999 2000 2001 2002Total Instructional Faculty 47 48 46 46 52Females 29 30 30 31 39 61.7 62.5 65.2 67.4 75.0Males 18 18 16 15 13 38.3 37.5 34.8 32.6 25.0African American/Black 1 1 1 1 1 2.1 2.1 2.2 2.2 1.9American Indian 0 0 0 0 1 0.0 0.0 0.0 0.0 1.9Asian/Pacific Islander 0 0 1 0 0 0.0 0.0 2.2 0.0 0.0Hispanic 3 3 4 3 4 6.4 6.3 8.7 6.5 7.7White, non-Hispanic 43 44 39 41 45 91.5 91.7 84.8 89.1 86.5No Response 0 0 1 1 1 0.0 0.0 2.2 2.2 1.9
1998 1999 2000 2001 2002 1998 1999 2000 2001 2002Total Research Faculty1 21 31 34 38 51Females 5 16 15 16 17 23.8 51.6 44.1 42.1 33.3Males 16 15 19 22 34 76.2 48.4 55.9 57.9 66.7African American/Black 0 0 0 0 0 0.0 0.0 0.0 0.0 0.0American Indian 0 0 0 0 0 0.0 0.0 0.0 0.0 0.0Asian/Pacific Islander 5 5 8 14 13 23.8 16.1 23.5 36.8 25.5Hispanic 0 3 2 2 4 0.0 9.7 5.9 5.3 7.8White, non-Hispanic 16 23 23 22 34 76.2 74.2 67.6 57.9 66.7No Response 0 0 1 0 0 0.0 0.0 2.9 0.0 0.0* As of October 31 of each year. 1 Includes researchers with faculty appointments, visiting scholars, and post-doctoral fellows.
Source: UNM Office of Institutional Research
Percentages
Non-Tenure-Track Instructional Faculty Demographics
Non-Tenure-Track Research Faculty Demographics
Percentages

2002-2003 UNM Fact Book - Page 68
FacultyClinical Health Sciences (Fall 1998 to 2002)*
1998 1999 2000 2001 2002 1998 1999 2000 2001 2002Tenure Track Faculty: Professor 91 87 83 88 97 16.0 14.9 13.3 13.4 14.0 Assoc. Professor 76 81 78 73 78 13.3 13.8 12.5 11.1 11.3 Asst. Professor 63 54 52 41 36 11.1 9.2 8.3 6.3 5.2 Instructor/Lecturer 0 0 0 0 0 0.0 0.0 0.0 0.0 0.0Non-Ten.Track Instructional Fac. 314 332 371 404 425 55.1 56.8 59.3 61.7 61.5Non-Ten.Track Research Fac.1 26 31 42 49 55 4.6 5.3 6.7 7.5 8.0Total Faculty 570 585 626 655 691 100.0 100.0 100.0 100.0 100.0
1998 1999 2000 2001 2002 1998 1999 2000 2001 2002Total Tenure Track Faculty 230 222 213 202 211Females 61 63 62 64 66 26.5 28.4 29.1 31.7 31.3Males 169 159 151 138 145 73.5 71.6 70.9 68.3 68.7African American/Black 1 0 0 1 2 0.4 0.0 0.0 0.5 0.9American Indian 2 2 2 2 2 0.9 0.9 0.9 1.0 0.9Asian/Pacific Islander 14 13 12 12 13 6.1 5.9 5.6 5.9 6.2Hispanic 16 15 14 13 13 7.0 6.8 6.6 6.4 6.2White, non-Hispanic 191 187 183 172 179 83.0 84.2 85.9 85.1 84.8No Response 6 5 2 2 2 2.6 2.3 0.9 1.0 0.9*As of October 31 of each year. 1Includes researchers with faculty appointments, visiting scholars, and post-doctoral fellows.
Source: UNM Office of Institutional Research
Percentages
All Faculty
Tenure-Track Faculty Demographics
Percentages

2002-2003 UNM Fact Book - Page 69
FacultyClinical Health Sciences (Fall 1998 to 2002)*
1998 1999 2000 2001 2002 1998 1999 2000 2001 2002Total Instructional Faculty 314 332 371 404 425Females 155 160 168 174 190 49.4 48.2 45.3 43.1 44.7Males 159 172 203 230 235 50.6 51.8 54.7 56.9 55.3African American/Black 1 1 2 5 6 0.3 0.3 0.5 1.2 1.4American Indian 0 3 2 3 3 0.0 0.9 0.5 0.7 0.7Asian/Pacific Islander 21 21 33 33 33 6.7 6.3 8.9 8.2 7.8Hispanic 23 23 28 38 38 7.3 6.9 7.5 9.4 8.9White, non-Hispanic 262 281 301 318 336 83.4 84.6 81.1 78.7 79.1No Response 7 3 5 7 9 2.2 0.9 1.3 1.7 2.1
1998 1999 2000 2001 2002 1998 1999 2000 2001 2002Total Research Faculty1 26 31 42 49 55Females 15 15 17 19 27 57.7 48.4 40.5 38.8 49.1Males 11 16 25 30 28 42.3 51.6 59.5 61.2 50.9African American/Black 1 1 1 1 1 3.8 3.2 2.4 2.0 1.8American Indian 0 0 0 1 3 0.0 0.0 0.0 2.0 5.5Asian/Pacific Islander 7 6 7 9 9 26.9 19.4 16.7 18.4 16.4Hispanic 1 1 0 2 4 3.8 3.2 0.0 4.1 7.3White, non-Hispanic 17 23 34 35 37 65.4 74.2 81.0 71.4 67.3No Response 0 0 0 1 1 0.0 0.0 0.0 2.0 1.8* As of October 31 of each year. 1 Includes researchers with faculty appointments, visiting scholars, and post-doctoral fellows.
Source: UNM Office of Institutional Research
Percentages
Non-Tenure-Track Instructional Faculty Demographics
Non-Tenure-Track Research Faculty Demographics
Percentages
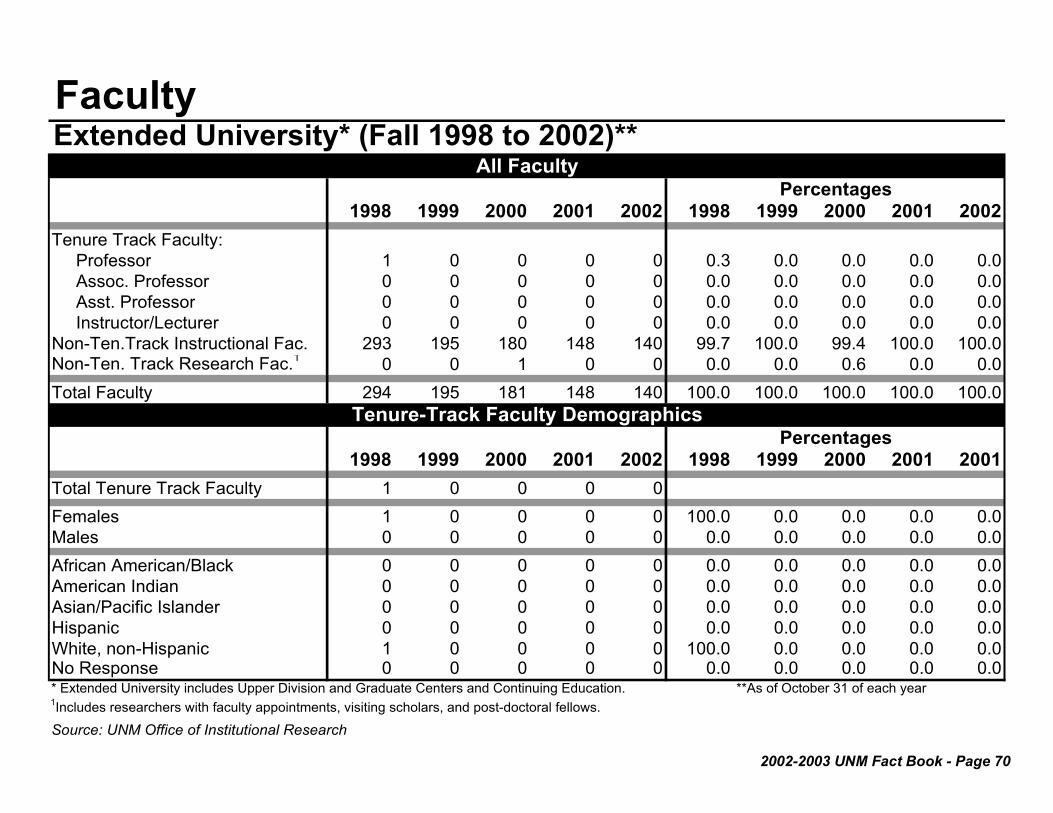
2002-2003 UNM Fact Book - Page 70
FacultyExtended University* (Fall 1998 to 2002)**
1998 1999 2000 2001 2002 1998 1999 2000 2001 2002Tenure Track Faculty: Professor 1 0 0 0 0 0.3 0.0 0.0 0.0 0.0 Assoc. Professor 0 0 0 0 0 0.0 0.0 0.0 0.0 0.0 Asst. Professor 0 0 0 0 0 0.0 0.0 0.0 0.0 0.0 Instructor/Lecturer 0 0 0 0 0 0.0 0.0 0.0 0.0 0.0Non-Ten.Track Instructional Fac. 293 195 180 148 140 99.7 100.0 99.4 100.0 100.0Non-Ten. Track Research Fac.1 0 0 1 0 0 0.0 0.0 0.6 0.0 0.0Total Faculty 294 195 181 148 140 100.0 100.0 100.0 100.0 100.0
1998 1999 2000 2001 2002 1998 1999 2000 2001 2001Total Tenure Track Faculty 1 0 0 0 0Females 1 0 0 0 0 100.0 0.0 0.0 0.0 0.0Males 0 0 0 0 0 0.0 0.0 0.0 0.0 0.0African American/Black 0 0 0 0 0 0.0 0.0 0.0 0.0 0.0American Indian 0 0 0 0 0 0.0 0.0 0.0 0.0 0.0Asian/Pacific Islander 0 0 0 0 0 0.0 0.0 0.0 0.0 0.0Hispanic 0 0 0 0 0 0.0 0.0 0.0 0.0 0.0White, non-Hispanic 1 0 0 0 0 100.0 0.0 0.0 0.0 0.0No Response 0 0 0 0 0 0.0 0.0 0.0 0.0 0.0* Extended University includes Upper Division and Graduate Centers and Continuing Education. **As of October 31 of each year1Includes researchers with faculty appointments, visiting scholars, and post-doctoral fellows.
Source: UNM Office of Institutional Research
All Faculty
Tenure-Track Faculty Demographics
Percentages
Percentages
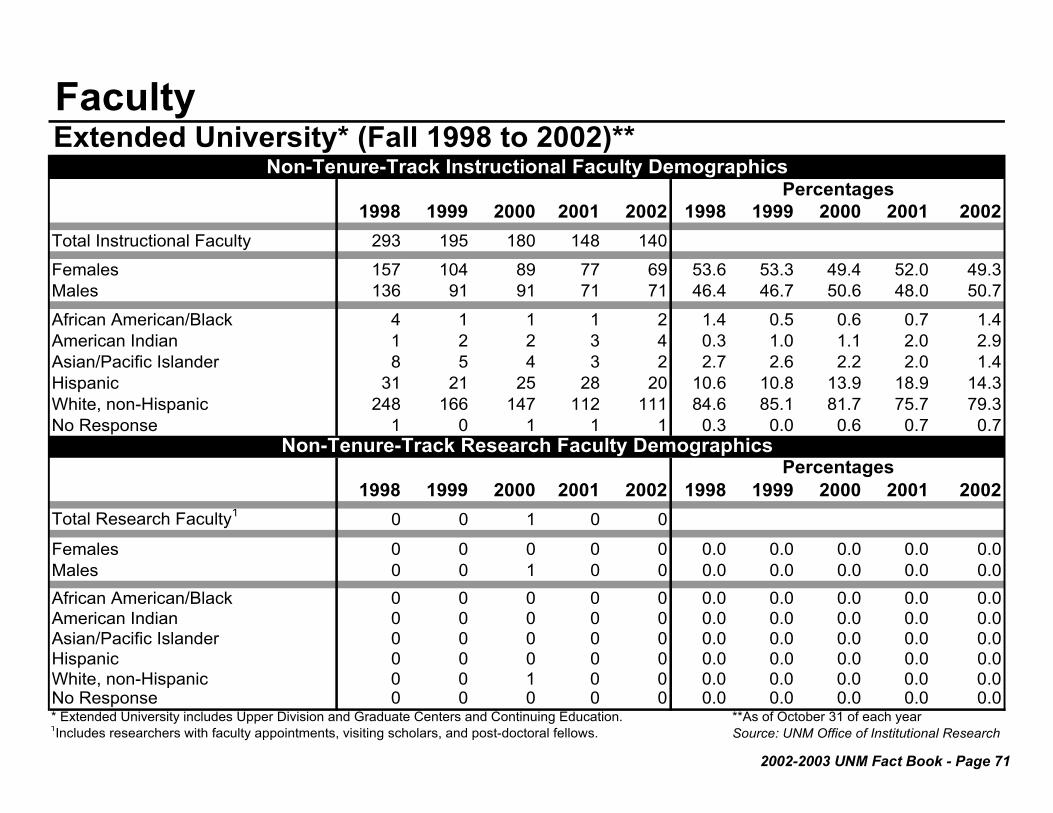
2002-2003 UNM Fact Book - Page 71
FacultyExtended University* (Fall 1998 to 2002)**
1998 1999 2000 2001 2002 1998 1999 2000 2001 2002Total Instructional Faculty 293 195 180 148 140Females 157 104 89 77 69 53.6 53.3 49.4 52.0 49.3Males 136 91 91 71 71 46.4 46.7 50.6 48.0 50.7African American/Black 4 1 1 1 2 1.4 0.5 0.6 0.7 1.4American Indian 1 2 2 3 4 0.3 1.0 1.1 2.0 2.9Asian/Pacific Islander 8 5 4 3 2 2.7 2.6 2.2 2.0 1.4Hispanic 31 21 25 28 20 10.6 10.8 13.9 18.9 14.3White, non-Hispanic 248 166 147 112 111 84.6 85.1 81.7 75.7 79.3No Response 1 0 1 1 1 0.3 0.0 0.6 0.7 0.7
1998 1999 2000 2001 2002 1998 1999 2000 2001 2002Total Research Faculty1 0 0 1 0 0
Females 0 0 0 0 0 0.0 0.0 0.0 0.0 0.0Males 0 0 1 0 0 0.0 0.0 0.0 0.0 0.0African American/Black 0 0 0 0 0 0.0 0.0 0.0 0.0 0.0American Indian 0 0 0 0 0 0.0 0.0 0.0 0.0 0.0Asian/Pacific Islander 0 0 0 0 0 0.0 0.0 0.0 0.0 0.0Hispanic 0 0 0 0 0 0.0 0.0 0.0 0.0 0.0White, non-Hispanic 0 0 1 0 0 0.0 0.0 0.0 0.0 0.0No Response 0 0 0 0 0 0.0 0.0 0.0 0.0 0.0* Extended University includes Upper Division and Graduate Centers and Continuing Education. **As of October 31 of each year1Includes researchers with faculty appointments, visiting scholars, and post-doctoral fellows. Source: UNM Office of Institutional Research
Percentages
Non-Tenure-Track Instructional Faculty Demographics
Non-Tenure-Track Research Faculty Demographics
Percentages
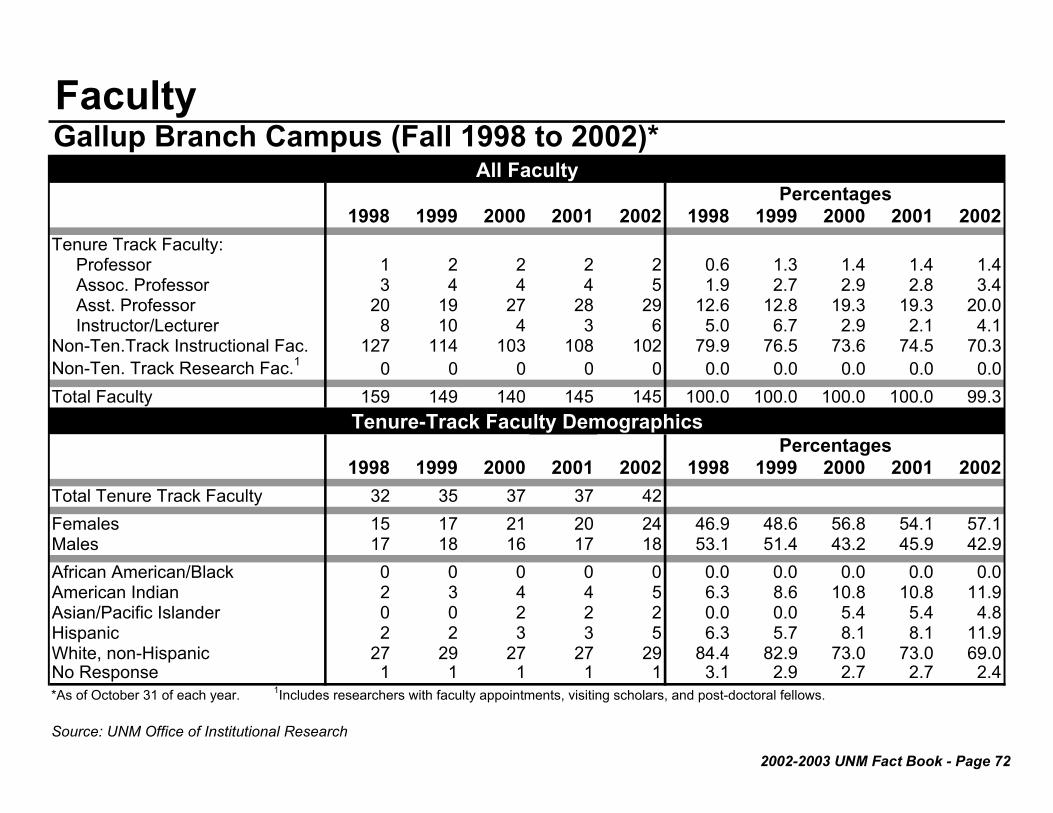
2002-2003 UNM Fact Book - Page 72
FacultyGallup Branch Campus (Fall 1998 to 2002)*
1998 1999 2000 2001 2002 1998 1999 2000 2001 2002Tenure Track Faculty: Professor 1 2 2 2 2 0.6 1.3 1.4 1.4 1.4 Assoc. Professor 3 4 4 4 5 1.9 2.7 2.9 2.8 3.4 Asst. Professor 20 19 27 28 29 12.6 12.8 19.3 19.3 20.0 Instructor/Lecturer 8 10 4 3 6 5.0 6.7 2.9 2.1 4.1Non-Ten.Track Instructional Fac. 127 114 103 108 102 79.9 76.5 73.6 74.5 70.3Non-Ten. Track Research Fac.1 0 0 0 0 0 0.0 0.0 0.0 0.0 0.0Total Faculty 159 149 140 145 145 100.0 100.0 100.0 100.0 99.3
1998 1999 2000 2001 2002 1998 1999 2000 2001 2002Total Tenure Track Faculty 32 35 37 37 42Females 15 17 21 20 24 46.9 48.6 56.8 54.1 57.1Males 17 18 16 17 18 53.1 51.4 43.2 45.9 42.9African American/Black 0 0 0 0 0 0.0 0.0 0.0 0.0 0.0American Indian 2 3 4 4 5 6.3 8.6 10.8 10.8 11.9Asian/Pacific Islander 0 0 2 2 2 0.0 0.0 5.4 5.4 4.8Hispanic 2 2 3 3 5 6.3 5.7 8.1 8.1 11.9White, non-Hispanic 27 29 27 27 29 84.4 82.9 73.0 73.0 69.0No Response 1 1 1 1 1 3.1 2.9 2.7 2.7 2.4*As of October 31 of each year. 1Includes researchers with faculty appointments, visiting scholars, and post-doctoral fellows.
Source: UNM Office of Institutional Research
Percentages
All Faculty
Tenure-Track Faculty Demographics
Percentages

2002-2003 UNM Fact Book - Page 73
FacultyGallup Branch Campus (Fall 1998 to 2002)*
1998 1999 2000 2001 2002 1998 1999 2000 2001 2002Total Instructional Faculty 127 114 103 108 102Females 64 60 53 53 53 50.4 52.6 51.5 49.1 52.0Males 63 54 50 55 49 49.6 47.4 48.5 50.9 48.0African American/Black 1 2 2 4 3 0.8 1.8 1.9 3.7 2.9American Indian 28 26 19 20 21 22.0 22.8 18.4 18.5 20.6Asian/Pacific Islander 1 2 1 1 1 0.8 1.8 1.0 0.9 1.0Hispanic 13 9 7 9 9 10.2 7.9 6.8 8.3 8.8White, non-Hispanic 82 72 73 74 67 64.6 63.2 70.9 68.5 65.7No Response 2 3 1 0 1 1.6 2.6 1.0 0.0 1.0
1998 1999 2000 2001 2002 1998 1999 2000 2001 2002Total Research Faculty1 0 0 0 0 0Females 0 0 0 0 0 0.0 0.0 0.0 0.0 0.0Males 0 0 0 0 0 0.0 0.0 0.0 0.0 0.0African American/Black 0 0 0 0 0 0.0 0.0 0.0 0.0 0.0American Indian 0 0 0 0 0 0.0 0.0 0.0 0.0 0.0Asian/Pacific Islander 0 0 0 0 0 0.0 0.0 0.0 0.0 0.0Hispanic 0 0 0 0 0 0.0 0.0 0.0 0.0 0.0White, non-Hispanic 0 0 0 0 0 0.0 0.0 0.0 0.0 0.0No Response 0 0 0 0 0 0.0 0.0 0.0 0.0 0.0* As of October 31 of each year. 1 Includes researchers with faculty appointments, visiting scholars, and post-doctoral fellows.
Source: UNM Office of Institutional Research
Percentages
Non-Tenure-Track Instructional Faculty Demographics
Non-Tenure-Track Research Faculty Demographics
Percentages

2002-2003 UNM Fact Book - Page 74
FacultyLos Alamos Branch Campus (Fall 1998 to 2002)*
1998 1999 2000 2001 2002 1998 1999 2000 2001 2002Tenure Track Faculty: Professor 0 0 0 0 0 0.0 0.0 0.0 0.0 0.0 Assoc. Professor 0 0 0 0 0 0.0 0.0 0.0 0.0 0.0 Asst. Professor 1 1 1 1 1 0.8 0.9 0.9 0.9 0.9 Instructor/Lecturer 0 0 0 0 0 0.0 0.0 0.0 0.0 0.0Non-Ten.Track Instructional Fac. 120 105 112 112 113 99.2 99.1 99.1 99.1 99.1Non-Ten. Track Research Fac.1 0 0 0 0 0 0.0 0.0 0.0 0.0 0.0Total Faculty 121 106 113 113 114 100.0 100.0 100.0 100.0 100.0
1998 1999 2000 2001 2002 1998 1999 2000 2001 2002Total Tenure Track Faculty 1 1 1 1 1Females 1 1 1 1 1 100.0 100.0 100.0 100.0 100.0Males 0 0 0 0 0 0.0 0.0 0.0 0.0 0.0African American/Black 0 0 0 0 0 0.0 0.0 0.0 0.0 0.0American Indian 0 0 0 0 0 0.0 0.0 0.0 0.0 0.0Asian/Pacific Islander 0 0 0 0 0 0.0 0.0 0.0 0.0 0.0Hispanic 0 0 0 0 0 0.0 0.0 0.0 0.0 0.0White, non-Hispanic 1 1 1 1 1 100.0 100.0 100.0 100.0 100.0No Response 0 0 0 0 0 0.0 0.0 0.0 0.0 0.0*As of October 31 of each year. 1Includes researchers with faculty appointments, visiting scholars, and post-doctoral fellows.
Source: UNM Office of Institutional Research
Percentages
All Faculty
Tenure-Track Faculty Demographics
Percentages

2002-2003 UNM Fact Book - Page 75
FacultyLos Alamos Branch Campus (Fall 1998 to 2002)*
1998 1999 2000 2001 2002 1998 1999 2000 2001 2002Total Instructional Faculty 120 105 112 112 113Females 66 58 58 64 67 55.0 55.2 51.8 57.1 59.3Males 54 47 54 48 46 45.0 44.8 48.2 42.9 40.7African American/Black 1 1 1 0 1 0.8 1.0 0.9 0.0 0.9American Indian 0 0 5 1 4 0.0 0.0 4.5 0.9 3.5Asian/Pacific Islander 1 0 1 0 0 0.8 0.0 0.9 0.0 0.0Hispanic 16 10 14 10 10 13.3 9.5 12.5 8.9 8.8White, non-Hispanic 100 92 86 97 96 83.3 87.6 76.8 86.6 85.0No Response 2 2 5 4 2 1.7 1.9 4.5 3.6 1.8
1998 1999 2000 2001 2002 1998 1999 2000 2001 2002Total Research Faculty1 0 0 0 0 0Females 0 0 0 0 0 0.0 0.0 0.0 0.0 0.0Males 0 0 0 0 0 0.0 0.0 0.0 0.0 0.0African American/Black 0 0 0 0 0 0.0 0.0 0.0 0.0 0.0American Indian 0 0 0 0 0 0.0 0.0 0.0 0.0 0.0Asian/Pacific Islander 0 0 0 0 0 0.0 0.0 0.0 0.0 0.0Hispanic 0 0 0 0 0 0.0 0.0 0.0 0.0 0.0White, non-Hispanic 0 0 0 0 0 0.0 0.0 0.0 0.0 0.0No Response 0 0 0 0 0 0.0 0.0 0.0 0.0 0.0* As of October 31 of each year. 1 Includes researchers with faculty appointments, visiting scholars, and post-doctoral fellows.Source: UNM Office of Institutional Research
Percentages
Non-Tenure-Track Instructional Faculty Demographics
Non-Tenure-Track Research Faculty Demographics
Percentages

2002-2003 UNM Fact Book - Page 76
FacultyTaos Branch Campus (Fall 1998 to 2002)*
1998 1999 2000 2001 2002 1998 1999 2000 2001 2002Tenure Track Faculty: Professor 0 0 0 0 0 0.0 0.0 0.0 0.0 0.0 Assoc. Professor 0 0 0 0 0 0.0 0.0 0.0 0.0 0.0 Asst. Professor 0 1 1 0 0 0.0 1.1 1.1 0.0 0.0 Instructor/Lecturer 2 1 0 0 0 2.2 1.1 0.0 0.0 0.0Non-Ten.Track Instructional Fac. 91 86 90 84 95 97.8 97.7 98.9 100.0 100.0Non-Ten. Track Research Fac.1 0 0 0 0 0 0.0 0.0 0.0 0.0 0.0Total Faculty 93 88 91 84 95 100.0 100.0 100.0 100.0 100.0
1998 1999 2000 2001 2002 1998 1999 2000 2001 2002Total Tenure Track Faculty 2 2 1 0 0Females 1 1 0 0 0 50.0 50.0 0.0 0.0 0.0Males 1 1 1 0 0 50.0 50.0 100.0 0.0 0.0African American/Black 0 0 0 0 0 0.0 0.0 0.0 0.0 0.0American Indian 0 0 0 0 0 0.0 0.0 0.0 0.0 0.0Asian/Pacific Islander 0 0 0 0 0 0.0 0.0 0.0 0.0 0.0Hispanic 0 0 0 0 0 0.0 0.0 0.0 0.0 0.0White, non-Hispanic 2 2 1 0 0 100.0 100.0 100.0 0.0 0.0No Response 0 0 0 0 0 0.0 0.0 0.0 0.0 0.0*As of October 31 of each year. 1Includes researchers with faculty appointments, visiting scholars, and post-doctoral fellows.Source: UNM Office of Institutional Research
Percentages
PercentagesAll Faculty
Tenure-Track Faculty Demographics

2002-2003 UNM Fact Book - Page 77
FacultyTaos Branch Campus (Fall 1998 to 2002)*
1998 1999 2000 2001 2002 1998 1999 2000 2001 2002Total Instructional Faculty 91 86 90 84 95Females 39 36 47 37 45 42.9 41.9 52.2 44.0 47.4Males 52 50 43 47 50 57.1 58.1 47.8 56.0 52.6African American/Black 1 2 1 1 2 1.1 2.3 1.1 1.2 2.1American Indian 3 0 1 1 2 3.3 0.0 1.1 1.2 2.1Asian/Pacific Islander 0 0 0 1 2 0.0 0.0 0.0 1.2 2.1Hispanic 29 26 28 23 32 31.9 30.2 31.1 27.4 33.7White, non-Hispanic 56 55 59 58 56 61.5 64.0 65.6 69.0 58.9No Response 2 3 1 0 1 2.2 3.5 1.1 0.0 1.1
1998 1999 2000 2001 2002 1998 1999 2000 2001 2002Total Research Faculty1 0 0 0 0 0Females 0 0 0 0 0 0.0 0.0 0.0 0.0 0.0Males 0 0 0 0 0 0.0 0.0 0.0 0.0 0.0African American/Black 0 0 0 0 0 0.0 0.0 0.0 0.0 0.0American Indian 0 0 0 0 0 0.0 0.0 0.0 0.0 0.0Asian/Pacific Islander 0 0 0 0 0 0.0 0.0 0.0 0.0 0.0Hispanic 0 0 0 0 0 0.0 0.0 0.0 0.0 0.0White, non-Hispanic 0 0 0 0 0 0.0 0.0 0.0 0.0 0.0No Response 0 0 0 0 0 0.0 0.0 0.0 0.0 0.0* As of October 31 of each year. 1 Includes researchers with faculty appointments, visiting scholars, and post-doctoral fellows.
Source: UNM Office of Institutional Research
Percentages
PercentagesNon-Tenure-Track Instructional Faculty Demographics
Non-Tenure-Track Research Faculty Demographics

2002-2003 UNM Fact Book - Page 78
FacultyValencia Branch Campus (Fall 1998 to 2002)*
1998 1999 2000 2001 2002 1998 1999 2000 2001 2002Tenure Track Faculty: Professor 2 3 3 3 5 1.5 2.3 2.3 2.7 4.5 Assoc. Professor 7 6 7 7 5 5.3 4.7 5.3 6.2 4.5 Asst. Professor 4 4 3 4 6 3.0 3.1 2.3 3.5 5.4 Instructor/Lecturer 0 0 0 0 0 0.0 0.0 0.0 0.0 0.0Non-Ten.Track Instructional Fac. 120 115 120 99 95 90.2 89.8 90.2 87.6 85.6Non-Ten. Track Research Fac.1 0 0 0 0 0 0.0 0.0 0.0 0.0 0.0Total Faculty 133 128 133 113 111 100.0 100.0 100.0 100.0 100.0
1998 1999 2000 2001 2002 1998 1999 2000 2001 2002Total Tenure Track Faculty 13 13 13 14 16Females 7 7 7 7 9 53.8 53.8 53.8 50.0 56.3Males 6 6 6 7 7 46.2 46.2 46.2 50.0 43.8African American/Black 0 0 0 0 0 0.0 0.0 0.0 0.0 0.0American Indian 0 0 1 1 1 0.0 0.0 7.7 7.1 6.3Asian/Pacific Islander 1 1 0 0 0 7.7 7.7 0.0 0.0 0.0Hispanic 2 2 2 2 2 15.4 15.4 15.4 14.3 12.5White, non-Hispanic 10 10 10 11 13 76.9 76.9 76.9 78.6 81.3No Response 0 0 0 0 0 0.0 0.0 0.0 0.0 0.0*As of October 31 of each year. 1Includes researchers with faculty appointments, visiting scholars, and post-doctoral fellows.
Source: UNM Office of Institutional Research
Percentages
All Faculty
Tenure-Track Faculty Demographics
Percentages

2002-2003 UNM Fact Book - Page 79
FacultyValencia Branch Campus (Fall 1998 to 2002)*
1998 1999 2000 2001 2002 1998 1999 2000 2001 2002Total Instructional Faculty 120 115 120 99 95Females 73 74 72 57 59 60.8 64.3 60.0 57.6 62.1Males 43 41 48 42 36 35.8 35.7 40.0 42.4 37.9African American/Black 1 2 2 1 0 0.8 1.7 1.7 1.0 0.0American Indian 2 1 1 1 0 1.7 0.9 0.8 1.0 0.0Asian/Pacific Islander 0 1 1 1 0 0.0 0.9 0.8 1.0 0.0Hispanic 34 26 33 20 19 28.3 22.6 27.5 20.2 20.0White, non-Hispanic 78 84 79 73 72 65.0 73.0 65.8 73.7 75.8No Response 5 1 4 3 4 4.2 0.9 3.3 3.0 4.2
1998 1999 2000 2001 2002 1998 1999 2000 2001 2002Total Research Faculty1 0 0 0 0 0Females 0 0 0 0 0 0.0 0.0 0.0 0.0 0.0Males 0 0 0 0 0 0.0 0.0 0.0 0.0 0.0African American/Black 0 0 0 0 0 0.0 0.0 0.0 0.0 0.0American Indian 0 0 0 0 0 0.0 0.0 0.0 0.0 0.0Asian/Pacific Islander 0 0 0 0 0 0.0 0.0 0.0 0.0 0.0Hispanic 0 0 0 0 0 0.0 0.0 0.0 0.0 0.0White, non-Hispanic 0 0 0 0 0 0.0 0.0 0.0 0.0 0.0No Response 0 0 0 0 0 0.0 0.0 0.0 0.0 0.0* As of October 31 of each year. 1 Includes researchers with faculty appointments, visiting scholars, and post-doctoral fellows.
Source: UNM Office of Institutional Research
Percentages
PercentagesNon-Tenure-Track Instructional Faculty Demographics
Non-Tenure-Track Research Faculty Demographics

2002-2003 UNM Fact Book - Page 80
Faculty by Highest Degree EarnedTotal Main Campus (Fall 2002)1
Total Asst. Assoc. Prof.Highest Degree Earned Prof. Prof.
Doctorate 626 151 188 287 184 115Prof. Doctorate Degree 42 3 11 28 32 3Other Terminal Degree* 35 14 11 10 21 1Master's Degree 71 22 35 14 223 10Other 5 1 2 2 92 6Total 779 191 247 341 552 135
Doctorate 36 17 9 10 8 7Prof. Doctorate Degree 5 3 1 1 4 1Other Terminal Degree* 0 0 0 0 0 0Master's Degree 4 3 1 0 28 0Other 0 0 0 0 2 0Total 45 23 11 11 42 8
Doctorate 46 10 11 25 8 35Prof. Doctorate Degree 3 2 0 1 0 5Other Terminal Degree* 0 0 0 0 0 0Master's Degree 0 0 0 0 1 2Other 1 1 0 0 1 1Total 50 13 11 26 10 431Faculty from the following units are excluded: Extended University and Branch Campuses. * "Other Terminal Degrees" include MFA's and Education Specialists. Source: Office of Institutional Research
Tenure-Track Faculty
Main Campus, Non-Medical
Nursing and Pharmacy
Basic Medical Sciences
Non-Tenure-Track Instructional
Faculty
Non-Tenure-Track Research Faculty

2002-2003 UNM Fact Book - Page 81
Faculty by Highest Degree EarnedTotal Main Campus (Fall 2002)1
Total Asst. Assoc. Prof.Highest Degree Earned Prof. Prof.
Doctorate 28 8 8 12 39 41Prof. Doctorate Degree 172 22 65 85 336 5Other Terminal Degree* 0 0 0 0 2 0Master's Degree 9 5 4 0 20 7Other 2 1 1 0 28 2Total 211 36 78 97 425 55
Doctorate 736 186 216 334 239 198Prof. Doctorate Degree 222 30 77 115 372 14Other Terminal Degree* 35 14 11 10 23 1Master's Degree 84 30 40 14 272 19Other 8 3 3 2 123 9Total 1,085 263 347 475 1,029 241
1Faculty from the following units are excluded: Extended University and Branch Campuses. * "Other Terminal Degrees" include MFA's and Education Specialists.
Source: Office of Institutional Research
Tenure-Track Faculty
Clinical Health Sciences
Total Main Campus
Non-Tenure-Track Instructional
Faculty
Non-Tenure-Track Research Faculty
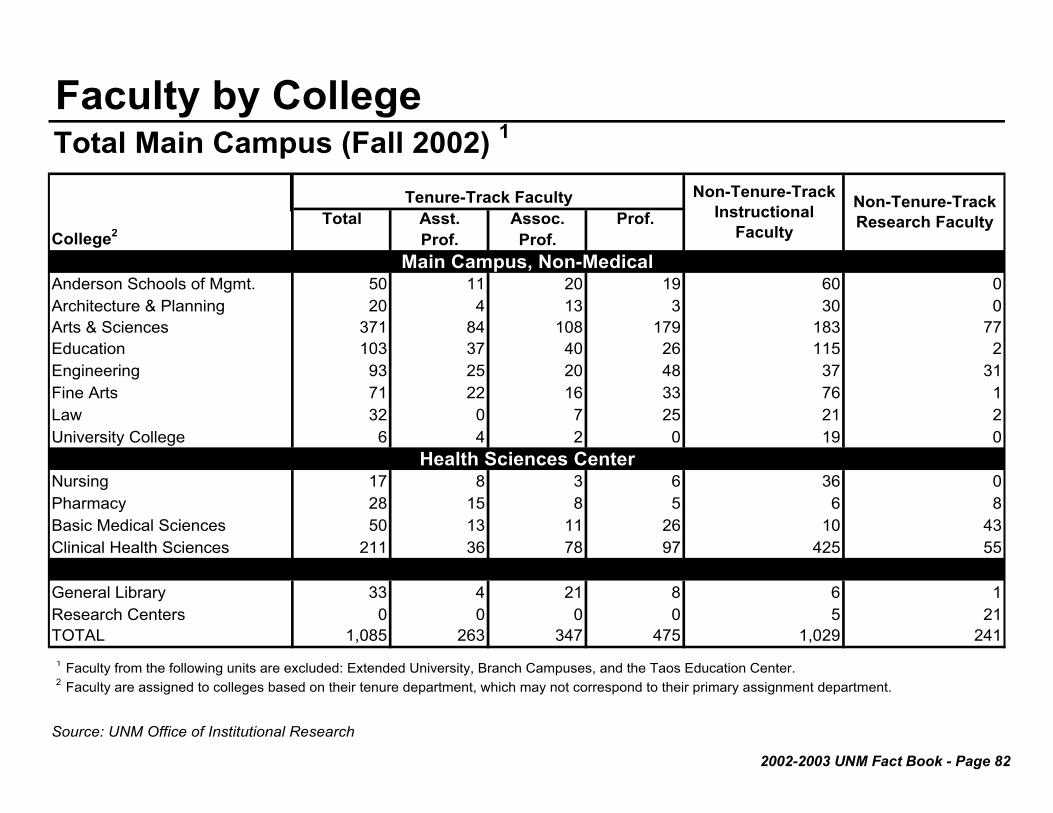
2002-2003 UNM Fact Book - Page 82
Faculty by CollegeTotal Main Campus (Fall 2002) 1
Total Asst. Assoc. Prof.College2 Prof. Prof.
Anderson Schools of Mgmt. 50 11 20 19 60 0Architecture & Planning 20 4 13 3 30 0Arts & Sciences 371 84 108 179 183 77Education 103 37 40 26 115 2Engineering 93 25 20 48 37 31Fine Arts 71 22 16 33 76 1Law 32 0 7 25 21 2University College 6 4 2 0 19 0
Nursing 17 8 3 6 36 0Pharmacy 28 15 8 5 6 8Basic Medical Sciences 50 13 11 26 10 43Clinical Health Sciences 211 36 78 97 425 55
General Library 33 4 21 8 6 1Research Centers 0 0 0 0 5 21TOTAL 1,085 263 347 475 1,029 2411 Faculty from the following units are excluded: Extended University, Branch Campuses, and the Taos Education Center. 2 Faculty are assigned to colleges based on their tenure department, which may not correspond to their primary assignment department.
Source: UNM Office of Institutional Research
Health Sciences Center
Main Campus, Non-Medical
Non-Tenure-Track Instructional
Faculty
Non-Tenure-Track Research Faculty
Tenure-Track Faculty

2002-2003 UNM Fact Book - Page 83
Faculty Diversity - New HiresMain Campus Faculty* (1998 to 2002)
1998 1999 2000 2001 2002 1998 1999 2000 2001 2002Total New Hires 58 43 43 60 56
Females 22 16 19 29 21 37.9 37.2 44.2 48.3 37.5Males 36 27 24 31 35 62.1 62.8 55.8 51.7 62.5
African American/Black 1 2 0 4 1 1.7 4.7 0.0 6.7 1.8American Indian 0 0 0 0 2 0.0 0.0 0.0 0.0 3.6Asian/Pacific Islander 3 5 8 6 2 5.2 11.6 18.6 10.0 3.6Hispanic 5 4 2 4 12 8.6 9.3 4.7 6.7 21.4White, non-Hispanic 48 31 33 46 39 82.8 72.1 76.7 76.7 69.6No Response 1 1 0 0 0 1.7 2.3 0.0 0.0 0.0Total Minority New Hires 9 11 10 14 17 15.5 25.6 23.3 23.3 30.4
Total Faculty 1,114 1,107 1,090 1,079 1,085 Total Minority Faculty 181 183 183 181 194 16.2 16.5 16.8 16.8 17.9Total Female Faculty 372 381 381 389 399 33.4 34.4 35.0 36.1 36.8* Includes Main, Nursing & Pharm., Basic Medical Sciences, and Clinical Health Sciences. Excludes Branches and Extended University.
Source: UNM Office of Institutional Research
Tenure and Tenure-Track Faculty New Hires - 1998 to 2002
Tenure and Tenure-Track - All Faculty - 1998 to 2002
Percentages
Minority Faculty
0.010.020.030.040.050.060.070.0
1998 1999 2000 2001 2002
Perc
ent
% of Total Faculty % of New HiresFemale Faculty
0.010.020.030.040.050.060.070.0
1998 1999 2000 2001 2002
Perc
ent
% of Total Faculty % of New Hires
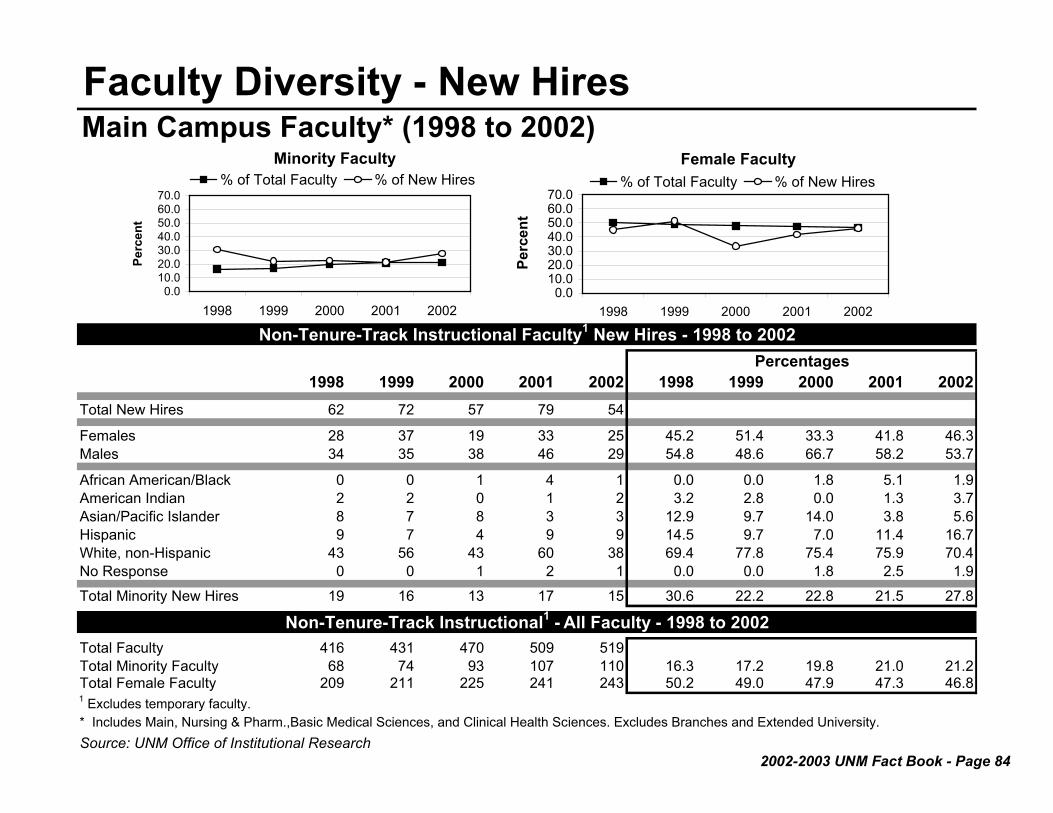
2002-2003 UNM Fact Book - Page 84
Faculty Diversity - New Hires Main Campus Faculty* (1998 to 2002)
1998 1999 2000 2001 2002 1998 1999 2000 2001 2002Total New Hires 62 72 57 79 54
Females 28 37 19 33 25 45.2 51.4 33.3 41.8 46.3Males 34 35 38 46 29 54.8 48.6 66.7 58.2 53.7
African American/Black 0 0 1 4 1 0.0 0.0 1.8 5.1 1.9American Indian 2 2 0 1 2 3.2 2.8 0.0 1.3 3.7Asian/Pacific Islander 8 7 8 3 3 12.9 9.7 14.0 3.8 5.6Hispanic 9 7 4 9 9 14.5 9.7 7.0 11.4 16.7White, non-Hispanic 43 56 43 60 38 69.4 77.8 75.4 75.9 70.4No Response 0 0 1 2 1 0.0 0.0 1.8 2.5 1.9Total Minority New Hires 19 16 13 17 15 30.6 22.2 22.8 21.5 27.8
Total Faculty 416 431 470 509 519Total Minority Faculty 68 74 93 107 110 16.3 17.2 19.8 21.0 21.2Total Female Faculty 209 211 225 241 243 50.2 49.0 47.9 47.3 46.81 Excludes temporary faculty.* Includes Main, Nursing & Pharm.,Basic Medical Sciences, and Clinical Health Sciences. Excludes Branches and Extended University.Source: UNM Office of Institutional Research
Non-Tenure-Track Instructional Faculty1 New Hires - 1998 to 2002
Non-Tenure-Track Instructional1 - All Faculty - 1998 to 2002
Percentages
Minority Faculty
0.010.020.030.040.050.060.070.0
1998 1999 2000 2001 2002
Perc
ent
% of Total Faculty % of New HiresFemale Faculty
0.010.020.030.040.050.060.070.0
1998 1999 2000 2001 2002
Perc
ent
% of Total Faculty % of New Hires

2002-2003 UNM Fact Book - Page 85
Faculty Diversity - New Hires Main Campus Faculty* (1998 to 2002)
1998 1999 2000 2001 2002 1998 1999 2000 2001 2002Total New Hires 4 8 15 7 15
Females 1 1 1 5 6 25.0 12.5 6.7 71.4 40.0Males 3 7 14 2 9 75.0 87.5 93.3 28.6 60.0
African American/Black 0 0 0 0 0 0.0 0.0 0.0 0.0 0.0American Indian 0 1 0 0 2 0.0 12.5 0.0 0.0 13.3Asian/Pacific Islander 1 2 2 0 3 25.0 25.0 13.3 0.0 20.0Hispanic 0 0 0 0 0 0.0 0.0 0.0 0.0 0.0White, non-Hispanic 3 5 13 7 10 75.0 62.5 86.7 100.0 66.7No Response 0 0 0 0 0 0.0 0.0 0.0 0.0 0.0Total Minority New Hires 1 3 2 0 5 25.0 37.5 13.3 0.0 33.3
Total Faculty 67 72 100 97 109Total Minority Faculty 10 12 15 12 20 14.9 16.7 15.0 12.4 18.3Total Female Faculty 14 17 23 30 38 20.9 23.6 23.0 30.9 34.91 Excludes temporary faculty and post-doctoral fellows.* Includes Main, Nursing & Pharm., Basic Medical Sciences, and Clinical Health Sciences. Excludes Branches and Extended University.Source: UNM Office of Institutional Research
Non-Tenure-Track Research Faculty1 New Hires - 1998 to 2002
Non-Tenure-Track Research1 - All Faculty - 1998 to 2002
Percentages
Minority Faculty
0.010.020.030.040.050.060.070.0
1998 1999 2000 2001 2002
Perc
ent
% of Total Faculty % of New HiresFemale Faculty
0.010.020.030.040.050.060.070.0
1998 1999 2000 2001 2002
Perc
ent
% of Total Faculty % of New Hires

2002-2003 UNM Fact Book - Page 86

Staff
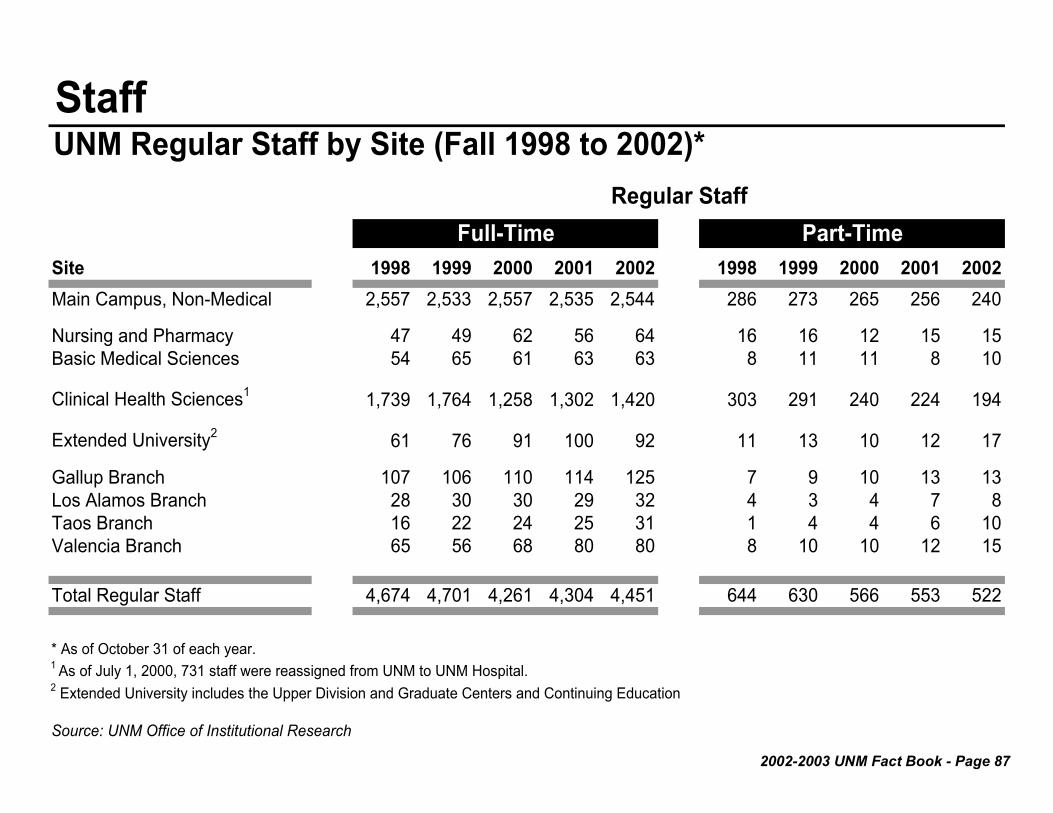
2002-2003 UNM Fact Book - Page 87
StaffUNM Regular Staff by Site (Fall 1998 to 2002)*
Site 1998 1999 2000 2001 2002 1998 1999 2000 2001 2002Main Campus, Non-Medical 2,557 2,533 2,557 2,535 2,544 286 273 265 256 240
Nursing and Pharmacy 47 49 62 56 64 16 16 12 15 15Basic Medical Sciences 54 65 61 63 63 8 11 11 8 10
Clinical Health Sciences1 1,739 1,764 1,258 1,302 1,420 303 291 240 224 194
Extended University2 61 76 91 100 92 11 13 10 12 17
Gallup Branch 107 106 110 114 125 7 9 10 13 13Los Alamos Branch 28 30 30 29 32 4 3 4 7 8Taos Branch 16 22 24 25 31 1 4 4 6 10Valencia Branch 65 56 68 80 80 8 10 10 12 15
Total Regular Staff 4,674 4,701 4,261 4,304 4,451 644 630 566 553 522
* As of October 31 of each year.1 As of July 1, 2000, 731 staff were reassigned from UNM to UNM Hospital.2 Extended University includes the Upper Division and Graduate Centers and Continuing Education
Source: UNM Office of Institutional Research
Regular StaffFull-Time Part-Time

2002-2003 UNM Fact Book - Page 88
StaffUNM Temporary Staff by Site (Fall 1998 to 2002)*
Site 1998 1999 2000 2001 2002 1998 1999 2000 2001 2002Main Campus, Non-Medical 597 771 841 943 565 884 883 1,005 961 1,084
Nursing and Pharmacy 0 0 0 0 0 8 11 23 15 12Basic Medical Sciences 0 0 0 0 0 2 4 7 7 8
Clinical Health Sciences1 6 4 9 6 7 756 807 609 614 642
Extended University2 1 0 0 0 0 20 16 14 18 16
Gallup Branch 0 1 1 2 0 1 1 0 0 1Los Alamos Branch 0 0 1 0 0 14 17 13 13 14Taos Branch 0 0 0 0 0 6 22 22 20 3Valencia Branch 0 0 0 0 0 3 5 7 4 1
Total Temporary Staff 604 776 852 951 572 1,694 1,766 1,700 1,652 1,781
Grand Total (Reg. & Temp) 5,278 5,477 5,113 5,255 5,023 2,338 2,396 2,266 2,205 2,303UNM Hospital (Reg. & Temp.)1, 3 1,929 1,923 3,114 2,860 2,997 980 1,088 763 1,090 1,071
* As of October 31 of each year1 As of July 1, 2000, 731 staff were reassigned from UNM to UNM Hospital.2 Extended University includes the Upper Division and Graduate Centers and Continuing Education3 Regular/temporary status not available for UNM Hospital staff.
Source: UNM Office of Institutional Research
Temporary StaffFull-Time Part-Time

2002-2003 UNM Fact Book - Page 89
Regular StaffAll UNM (Fall 1998 to 2002)*
1998 1999 2000 2001 2002 1998 1999 2000 2001 2002Full-Time Total1 4,674 4,701 4,261 4,304 4,451Females 2,928 2,964 2,678 2,752 2,857 62.6 63.1 62.8 63.9 64.2Males 1,746 1,735 1,583 1,552 1,594 37.4 36.9 37.2 36.1 35.8African American/Black 111 107 84 95 97 2.4 2.3 2.0 2.2 2.2American Indian 224 235 241 244 263 4.8 5.0 5.7 5.7 5.9Asian/Pacific Islander 84 97 96 77 84 1.8 2.1 2.3 1.8 1.9Hispanic 1,579 1,616 1,437 1,481 1,515 33.8 34.4 33.7 34.4 34.0White, non-Hispanic 2,610 2,577 2,331 2,340 2,426 55.8 54.8 54.7 54.4 54.5No Response 66 69 72 67 66 1.4 1.5 1.7 1.6 1.5
1998 1999 2000 2001 2002 1998 1999 2000 2001 2002Part-Time Total 644 630 566 553 522Females 503 489 446 431 413 78.1 77.6 78.8 77.9 79.1Males 141 141 120 122 109 21.9 22.4 21.2 22.1 20.9African American/Black 18 13 11 9 7 2.8 2.1 1.9 1.6 1.3American Indian 17 20 19 24 23 2.6 3.2 3.4 4.3 4.4Asian/Pacific Islander 24 17 14 17 17 3.7 2.7 2.5 3.1 3.3Hispanic 136 141 134 130 140 21.1 22.4 23.7 23.5 26.8White, non-Hispanic 439 428 373 361 326 68.2 67.9 65.9 65.3 62.5No Response 10 11 15 12 9 1.6 1.7 2.7 2.2 1.7* As of October 31 of each year1 As of July 1, 2000, 731 staff were reassigned from UNM to UNM Hospital.Source: UNM Office of Institutional Research
Percentages
Full-Time StaffPercentages
Part-Time Staff

2002-2003 UNM Fact Book - Page 90
Regular Staff Main Campus, Non-Medical (Fall 1998 to 2002)*
1998 1999 2000 2001 2002 1998 1999 2000 2001 2002Full-Time Total 2,557 2,533 2,557 2,535 2,544Females 1,358 1,350 1,388 1,408 1,401 53.1 53.3 54.3 55.5 55.1Males 1,199 1,183 1,169 1,127 1,143 46.9 46.7 45.7 44.5 44.9
African American/Black 60 58 50 51 56 2.3 2.3 2.0 2.0 2.2American Indian 94 93 110 107 111 3.7 3.7 4.3 4.2 4.4Asian/Pacific Islander 54 52 60 44 42 2.1 2.1 2.3 1.7 1.7Hispanic 883 886 865 883 899 34.5 35.0 33.8 34.8 35.3White, non-Hispanic 1,431 1,401 1,425 1,409 1,398 56.0 55.3 55.7 55.6 55.0No Response 35 43 47 41 38 1.4 1.7 1.8 1.6 1.5
1998 1999 2000 2001 2002 1998 1999 2000 2001 2002Part-Time Total 286 273 265 256 240Females 203 188 196 189 175 71.0 68.9 74.0 73.8 72.9Males 83 85 69 67 65 29.0 31.1 26.0 26.2 27.1African American/Black 10 7 8 7 4 3.5 2.6 3.0 2.7 1.7American Indian 5 4 6 8 9 1.7 1.5 2.3 3.1 3.8Asian/Pacific Islander 12 11 8 10 11 4.2 4.0 3.0 3.9 4.6Hispanic 68 69 73 73 65 23.8 25.3 27.5 28.5 27.1White, non-Hispanic 187 181 168 154 149 65.4 66.3 63.4 60.2 62.1No Response 4 1 2 4 2 1.4 0.4 0.8 1.6 0.8*As of October 31 of each yearSource: UNM Office of Institutional Research
Part-Time Staff Percentages
Full-Time StaffPercentages

2002-2003 UNM Fact Book - Page 91
Regular StaffNursing, Pharmacy, Basic Medical Sciences (Fall 1998 to 2002)*
1998 1999 2000 2001 2002 1998 1999 2000 2001 2002Full-Time Total 101 114 123 119 127Females 78 88 97 98 98 77.2 77.2 78.9 82.4 77.2Males 23 26 26 21 29 22.8 22.8 21.1 17.6 22.8
African American/Black 1 2 3 4 4 1.0 1.8 2.4 3.4 3.1American Indian 3 4 5 4 5 3.0 3.5 4.1 3.4 3.9Asian/Pacific Islander 7 10 10 5 8 6.9 8.8 8.1 4.2 6.3Hispanic 31 34 36 42 36 30.7 29.8 29.3 35.3 28.3White, non-Hispanic 59 64 69 63 71 58.4 56.1 56.1 52.9 55.9No Response 0 0 0 1 3 0.0 0.0 0.0 0.8 2.4
1998 1999 2000 2001 2002 1998 1999 2000 2001 2002Part-Time Total 24 27 23 23 25Females 22 23 20 20 22 91.7 85.2 87.0 87.0 88.0Males 2 4 3 3 3 8.3 14.8 13.0 13.0 12.0African American/Black 0 0 0 0 1 0.0 0.0 0.0 0.0 4.0American Indian 1 0 0 0 1 4.2 0.0 0.0 0.0 4.0Asian/Pacific Islander 2 1 0 0 0 8.3 3.7 0.0 0.0 0.0Hispanic 1 2 8 5 5 4.2 7.4 34.8 21.7 20.0White, non-Hispanic 20 24 15 18 18 83.3 88.9 65.2 78.3 72.0No Response 0 0 0 0 0 0.0 0.0 0.0 0.0 0.0*As of October 31 of each yearSource: UNM Office of Institutional Research
Part-Time Staff Percentages
Full-Time StaffPercentages

2002-2003 UNM Fact Book - Page 92
Regular StaffClinical Health Sciences (Fall 1998 to 2002)*
1998 1999 2000 2001 2002 1998 1999 2000 2001 2002Full-Time Total1 1,739 1,764 1,258 1,302 1,420Females 1,306 1,321 969 1,005 1,110 75.1 74.9 77.0 77.2 78.2Males 433 441 289 297 310 24.9 25.0 23.0 22.8 21.8
African American/Black 46 43 25 35 34 2.6 2.4 2.0 2.7 2.4American Indian 74 78 64 70 80 4.3 4.4 5.1 5.4 5.6Asian/Pacific Islander 23 34 25 26 33 1.3 1.9 2.0 2.0 2.3Hispanic 554 582 402 417 432 31.9 33.0 32.0 32.0 30.4White, non-Hispanic 1,015 1,003 720 731 819 58.4 56.9 57.2 56.1 57.7No Response 27 24 22 23 22 1.6 1.4 1.7 1.8 1.5
1998 1999 2000 2001 2002 1998 1999 2000 2001 2002Part-Time Total 303 291 240 224 194Females 255 249 205 183 169 84.2 85.6 85.4 81.7 87.1Males 48 42 35 41 25 15.8 14.4 14.6 18.3 12.9African American/Black 6 5 2 1 1 2.0 1.7 0.8 0.4 0.5American Indian 9 13 8 10 6 3.0 4.5 3.3 4.5 3.1Asian/Pacific Islander 9 4 5 6 4 3.0 1.4 2.1 2.7 2.1Hispanic 62 58 42 34 49 20.5 19.9 17.5 15.2 25.3White, non-Hispanic 211 201 173 167 131 69.6 69.1 72.1 74.6 67.5No Response 6 10 10 6 3 2.0 3.4 4.2 2.7 1.5*As of October 31 of each year1 As of July 1, 2000, 731 staff were reassigned from UNM to UNM Hospital.Source: UNM Office of Institutional Research
Full-Time StaffPercentages
Part-Time StaffPercentages

2002-2003 UNM Fact Book - Page 93
Regular StaffExtended University* (Fall 1998 to 2002)**
1998 1999 2000 2001 2002 1998 1999 2000 2001 2002Full-Time Total 61 76 91 100 92Females 47 58 63 69 68 77.0 76.3 69.2 69.0 73.9Males 14 18 28 31 24 23.0 23.7 30.8 31.0 26.1
African American/Black 2 2 5 4 2 3.3 2.6 5.5 4.0 2.2American Indian 1 3 2 3 2 1.6 3.9 2.2 3.0 2.2Asian/Pacific Islander 0 0 0 0 0 0.0 0.0 0.0 0.0 0.0Hispanic 31 36 45 48 49 50.8 47.4 49.5 48.0 53.3White, non-Hispanic 26 35 38 45 39 42.6 46.1 41.8 45.0 42.4No Response 1 0 1 0 0 1.6 0.0 1.1 0.0 0.0
1998 1999 2000 2001 2002 1998 1999 2000 2001 2002Part-Time Total 11 13 10 12 17Females 7 9 7 9 14 63.6 69.2 70.0 75.0 82.4Males 4 4 3 3 3 36.4 30.8 30.0 25.0 17.6African American/Black 1 0 0 0 0 9.1 0.0 0.0 0.0 0.0American Indian 0 0 0 0 0 0.0 0.0 0.0 0.0 0.0Asian/Pacific Islander 0 0 0 0 0 0.0 0.0 0.0 0.0 0.0Hispanic 2 2 2 3 4 18.2 15.4 20.0 25.0 23.5White, non-Hispanic 8 11 8 9 13 72.7 84.6 80.0 75.0 76.5No Response 0 0 0 0 0 0.0 0.0 0.0 0.0 0.0* Extended University includes Upper Division and Graduate Centers and Continuing Education. **As of October 31 of each yearSource: UNM Office of Institutional Research
Full-Time StaffPercentages
Part-Time Staff Percentages

2002-2003 UNM Fact Book - Page 94
Regular StaffGallup Branch Campus (Fall 1998 to 2002)*
1998 1999 2000 2001 2002 1998 1999 2000 2001 2002Full-Time Total 107 106 110 114 125Females 68 71 73 76 82 63.6 67.0 66.4 66.7 65.6Males 39 35 37 38 43 36.4 33.0 33.6 33.3 34.4
African American/Black 0 0 0 0 0 0.0 0.0 0.0 0.0 0.0American Indian 49 53 55 55 59 45.8 50.0 50.0 48.2 47.2Asian/Pacific Islander 0 1 1 1 0 0.0 0.9 0.9 0.9 0.0Hispanic 24 21 26 25 27 22.4 19.8 23.6 21.9 21.6White, non-Hispanic 33 30 27 32 38 30.8 28.3 24.5 28.1 30.4No Response 1 1 1 1 1 0.9 0.9 0.9 0.9 0.8
1998 1999 2000 2001 2002 1998 1999 2000 2001 2002Part-Time Total 7 9 10 13 13Females 5 5 6 8 8 71.4 55.6 60.0 61.5 61.5Males 2 4 4 5 5 28.6 44.4 40.0 38.5 38.5African American/Black 1 1 1 1 1 14.3 11.1 10.0 7.7 7.7American Indian 2 3 5 6 6 28.6 33.3 50.0 46.2 46.2Asian/Pacific Islander 0 0 0 0 0 0.0 0.0 0.0 0.0 0.0Hispanic 0 2 0 1 1 0.0 22.2 0.0 7.7 7.7White, non-Hispanic 4 3 3 4 4 57.1 33.3 30.0 30.8 30.8No Response 0 0 1 1 1 0.0 0.0 10.0 7.7 7.7*As of October 31 of each yearSource: UNM Office of Institutional Research
Full-Time StaffPercentages
Part-Time StaffPercentages

2002-2003 UNM Fact Book - Page 95
Regular StaffLos Alamos Branch Campus (Fall 1998 to 2002)*
1998 1999 2000 2001 2002 1998 1999 2000 2001 2002Full-Time Total 28 30 30 29 32Females 16 19 19 20 21 57.1 63.3 63.3 69.0 65.6Males 12 11 11 9 11 42.9 36.7 36.7 31.0 34.4
African American/Black 0 0 0 0 0 0.0 0.0 0.0 0.0 0.0American Indian 3 3 3 3 2 10.7 10.0 10.0 10.3 6.3Asian/Pacific Islander 0 0 0 0 0 0.0 0.0 0.0 0.0 0.0Hispanic 12 15 14 16 18 42.9 50.0 46.7 55.2 56.3White, non-Hispanic 12 12 13 10 12 42.9 40.0 43.3 34.5 37.5No Response 1 0 0 0 0 3.6 0.0 0.0 0.0 0.0
1998 1999 2000 2001 2002 1998 1999 2000 2001 2002Part-Time Total 4 3 4 7 8Females 3 3 3 7 7 75.0 100.0 75.0 100.0 87.5Males 1 0 1 0 1 25.0 0.0 25.0 0.0 12.5African American/Black 0 0 0 0 0 0.0 0.0 0.0 0.0 0.0American Indian 0 0 0 0 0 0.0 0.0 0.0 0.0 0.0Asian/Pacific Islander 1 1 1 1 1 25.0 33.3 25.0 14.3 12.5Hispanic 1 0 2 4 4 25.0 0.0 50.0 57.1 50.0White, non-Hispanic 2 2 1 2 3 50.0 66.7 25.0 28.6 37.5No Response 0 0 0 0 0 0.0 0.0 0.0 0.0 0.0*As of October 31 of each yearSource: UNM Office of Institutional Research
Full-Time StaffPercentages
Part-Time Staff Percentages

2002-2003 UNM Fact Book - Page 96
Regular StaffTaos Branch Campus (Fall 1998 to 2002)*
1998 1999 2000 2001 2002 1998 1999 2000 2001 2002Full-Time Total 16 22 24 25 31Females 10 14 16 16 21 62.5 63.6 66.7 64.0 67.7Males 6 8 8 9 10 37.5 36.4 33.3 36.0 32.3
African American/Black 0 0 0 0 0 0.0 0.0 0.0 0.0 0.0American Indian 0 1 1 1 2 0.0 4.5 4.2 4.0 6.5Asian/Pacific Islander 0 0 0 0 0 0.0 0.0 0.0 0.0 0.0Hispanic 11 14 16 17 20 68.8 63.6 66.7 68.0 64.5White, non-Hispanic 5 6 6 6 8 31.3 27.3 25.0 24.0 25.8No Response 0 1 1 1 1 0.0 4.5 4.2 4.0 3.2
1998 1999 2000 2001 2002 1998 1999 2000 2001 2002Part-Time Total 1 4 4 6 10Females 1 3 2 5 6 0.0 75.0 50.0 83.3 60.0Males 0 1 2 1 4 0.0 25.0 50.0 16.7 40.0African American/Black 0 0 0 0 0 0.0 0.0 0.0 0.0 0.0American Indian 0 0 0 0 0 0.0 0.0 0.0 0.0 0.0Asian/Pacific Islander 0 0 0 0 1 0.0 0.0 0.0 0.0 10.0Hispanic 1 3 1 2 5 0.0 75.0 25.0 33.3 50.0White, non-Hispanic 0 1 1 3 1 0.0 25.0 25.0 50.0 10.0No Response 0 0 2 1 3 0.0 0.0 50.0 16.7 30.0*As of October 31 of each yearSource: UNM Office of Institutional Research
Full-Time StaffPercentages
Part-Time Staff Percentages

2002-2003 UNM Fact Book - Page 97
Regular StaffValencia Branch Campus (Fall 1998 to 2002)*
1998 1999 2000 2001 2002 1998 1999 2000 2001 2002Full-Time Total 65 56 68 80 80Females 45 43 53 60 56 69.2 76.8 77.9 75.0 70.0Males 20 13 15 20 24 30.8 23.2 22.1 25.0 30.0
African American/Black 2 2 1 1 1 3.1 3.6 1.5 1.3 1.3American Indian 0 0 1 1 2 0.0 0.0 1.5 1.3 2.5Asian/Pacific Islander 0 0 0 1 1 0.0 0.0 0.0 1.3 1.3Hispanic 33 28 33 33 34 50.8 50.0 48.5 41.3 42.5White, non-Hispanic 29 26 33 44 41 44.6 46.4 48.5 55.0 51.3No Response 1 0 0 0 1 1.5 0.0 0.0 0.0 1.3
1998 1999 2000 2001 2002 1998 1999 2000 2001 2002Part-Time Total 8 10 10 12 15Females 7 9 7 10 12 87.5 90.0 70.0 83.3 80.0Males 1 1 3 2 3 12.5 10.0 30.0 16.7 20.0African American/Black 0 0 0 0 0 0.0 0.0 0.0 0.0 0.0American Indian 0 0 0 0 1 0.0 0.0 0.0 0.0 6.7Asian/Pacific Islander 0 0 0 0 0 0.0 0.0 0.0 0.0 0.0Hispanic 1 5 6 8 7 12.5 50.0 60.0 66.7 46.7White, non-Hispanic 7 5 4 4 7 87.5 50.0 40.0 33.3 46.7No Response 0 0 0 0 0 0.0 0.0 0.0 0.0 0.0*As of October 31 of each yearSource: UNM Office of Institutional Research
Full-Time StaffPercentages
Part-Time StaffPercentages

2002-2003 UNM Fact Book - Page 98
Student EmployeesBy Site (Fall 1998 to 2002)*
Site 1998 1999 2000 2001 2002 1998 1999 2000 2001 2002Main Campus, Non-Medical 3,821 4,030 4,021 3,964 3,868 2,680 2,872 2,781 2,673 2,513
Nursing and Pharmacy 38 44 50 41 56 30 35 35 27 31Basic Medical Sciences 33 47 63 69 68 19 23 32 32 33
Clinical Health Sciences 736 780 768 772 818 251 267 262 245 246
Extended University1 9 19 8 14 13 9 17 6 9 8
Gallup Branch 104 100 113 116 124 104 100 113 116 124Los Alamos Branch 24 24 20 17 21 24 23 20 17 21Taos Branch 20 21 29 24 30 20 21 29 24 29Valencia Branch 110 101 87 96 88 108 99 83 92 86
Total 4,895 5,166 5,159 5,113 5,086 3,245 3,457 3,361 3,235 3,091
* As of October 31 of each year.1Extended University includes the Upper Division and Graduate Centers and Continuing Education
Source: UNM Office of Institutional Research
All Student Employees Work Study & Student Employees

2002-2003 UNM Fact Book - Page 99
Student EmployeesBy Site (Fall 1998 to 2002)*
Site 1998 1999 2000 2001 2002 1998 1999 2000 2001 2002Main Campus, Non-Medical 794 770 802 805 809 347 388 438 486 546
Nursing and Pharmacy 8 9 14 11 20 0 0 1 3 5Basic Medical Sciences 0 0 0 0 1 14 24 31 37 34
Clinical Health Sciences1 6 2 2 5 4 479 511 504 522 568
Extended University2 0 2 2 2 0 0 0 0 3 5
Gallup Branch 0 0 0 0 0 0 0 0 0 0Los Alamos Branch 0 1 0 0 0 0 0 0 0 0Taos Branch 0 0 0 0 1 0 0 0 0 0Valencia Branch 2 2 4 4 2 0 0 0 0 0
Total 810 786 824 827 837 840 923 974 1,051 1,158
*As of October 31 of each year.1Resident physicians account for the majority of Research/Project Assistants in Clinical Health Sciences (472 in 2002).2Extended University includes the Upper Division and Graduate Centers and Continuing Education
Source: UNM Office of Institutional Research
Graduate & Teaching Assistants Research & Project Assistants

2002-2003 UNM Fact Book - Page 100
Faculty Scholarship, Research & Libraries

2002-2003 UNM Fact Book - Page 101
Faculty ScholarshipUNM (Including HSC and Branches), 1992-1993 to 2001-2002
Number of Number Average FulbrightAcademic Faculty with of Award Scholars
Year Sponsored Awards 1 Awards 1 Amount 1 from UNM 2
1992-1993 608 1,517 $75,514 51993-1994 618 1,845 $90,292 81994-1995 631 1,484 $124,228 61995-1996 526 1,283 $128,059 41996-1997 563 1,283 $124,474 31997-1998 687 1,279 $137,451 41998-1999 653 1,330 $164,361 31999-2000 691 1,500 $144,933 32000-2001 702 1,502 $154,460 42001-2002 654 1,507 $164,322 3
Scholarly Papers and Articles 1,918Books 86Book Chapters 95Reviews 162Creative Works 124Patented Works 12
Sources: 1 Office of Research Services; 2 International Programs & Studies
Faculty Research and Scholarship
Publications and Creative Works (2000) 1

2002-2003 UNM Fact Book - Page 102
UNM Centers & Institutes* 2002-2003
School of EngineeringSchool of Architecture & Planning Alliance for Transportation Research Institute (ATR) 246-6410Design & Planning Assistance Center (DPAC) 277-5059 Center for Intelligent System Engineering (CISE) 277-0319Institute for Environmental Education (IEE) 277-1199 Institute for Space & Nuclear Power Studies (ISNPS) 277-5442Resource Center for Raza Planning (RCRP) 277-8526 Manufacturing Training & Technology Center (MTTC) 272-7150
Preparation for University Research of Students in 277-0372College of Arts & Sciences Undergraduate Education (PURSUE)Albuquerque Teachers' Institute 277-2794 Training and Research Institute for Plastics (TRIP) 277-3947Center for Advanced Studies 277-8602Center for the Southwest 277-7688 College of Fine ArtsConsortium of the Americas for Interdisciplinary Science 277-0848 Tamarind Institute 277-3901Earth Data Analysis Center (EDAC) 277-3622 Arts of the Americas Institute (AAI) 277-2286Feminist Research Institute 277-1198 Arts Technology Center (ATC) 277-2744Institute for Astrophysics 277-2616Institute for Medieval Studies 277-2252 School of LawInstitute for Public Policy 277-1099 American Indian Law Center, Inc. (an independent corporation 277-5462Institute for Social Research 277-4257 with close ties to the School of Law)Institute of Meteoritics 277-1644 Institute of Public Law: 277-5006Museum of Southwestern Biology 277-4225 Aging and Intergenerational ProgramsNew Mexico Center for Particle Physics 277-2616 Center for Arts in SocietyOffice of Contract Archeology 277-5853 Center for Health Law and EthicsResource Geographic Information System (RGIS) 277-3622 Center for Wildlife LawSevilleta LTER 277-2850 Children's Law CenterU.S. Long Term Ecological Research Network 272-7278 Environmental Law and Policy
Government CenterCollege of Education Judicial Education CenterCenter for Teacher Education 277-9439 Project Change Fair Lending CenterCenter for Family and Community Partnership 277-9648 Traffic Safety CenterCenter for Technology & Education 277-0462 U.S. - Mexico Law Institute 277-0080Multicultural Education Center 277-7768 Utton International Transboundary Resources Center 277-7809New Mexico Research and Study Council 277-2621
Main Campus
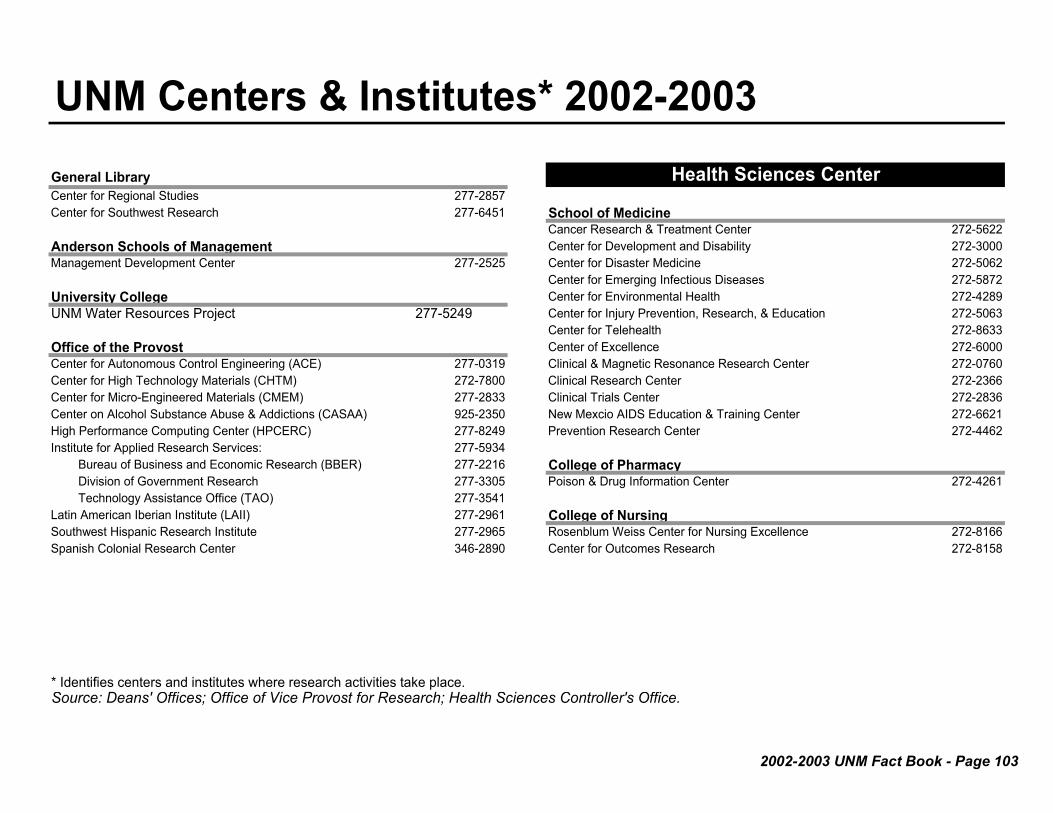
2002-2003 UNM Fact Book - Page 103
UNM Centers & Institutes* 2002-2003General LibraryCenter for Regional Studies 277-2857Center for Southwest Research 277-6451 School of Medicine
Cancer Research & Treatment Center 272-5622Anderson Schools of Management Center for Development and Disability 272-3000Management Development Center 277-2525 Center for Disaster Medicine 272-5062
Center for Emerging Infectious Diseases 272-5872University College Center for Environmental Health 272-4289UNM Water Resources Project 277-5249 Center for Injury Prevention, Research, & Education 272-5063
Center for Telehealth 272-8633Office of the Provost Center of Excellence 272-6000Center for Autonomous Control Engineering (ACE) 277-0319 Clinical & Magnetic Resonance Research Center 272-0760Center for High Technology Materials (CHTM) 272-7800 Clinical Research Center 272-2366Center for Micro-Engineered Materials (CMEM) 277-2833 Clinical Trials Center 272-2836Center on Alcohol Substance Abuse & Addictions (CASAA) 925-2350 New Mexcio AIDS Education & Training Center 272-6621High Performance Computing Center (HPCERC) 277-8249 Prevention Research Center 272-4462Institute for Applied Research Services: 277-5934
Bureau of Business and Economic Research (BBER) 277-2216 College of PharmacyDivision of Government Research 277-3305 Poison & Drug Information Center 272-4261Technology Assistance Office (TAO) 277-3541
Latin American Iberian Institute (LAII) 277-2961 College of NursingSouthwest Hispanic Research Institute 277-2965 Rosenblum Weiss Center for Nursing Excellence 272-8166Spanish Colonial Research Center 346-2890 Center for Outcomes Research 272-8158
* Identifies centers and institutes where research activities take place.Source: Deans' Offices; Office of Vice Provost for Research; Health Sciences Controller's Office.
Health Sciences Center

2002-2003 UNM Fact Book - Page 104
Contract & Grant AwardsUNM Total* (FY 2002)
Source of Funds Amt. (in mil.)Foundations $4.1National Labs $5.6Industry $14.1Other $32.5State of New Mexico $42.7Federal Agencies $148.6Total ** $247.6
Units Awarded Amt. (in mil.)School of Law $0.9UNM Centers (Category II) $1.7Continuing Education $3.8Branches $7.2Other $8.5College of Education $16.7UNM Centers (Category III) $18.2School of Engineering $18.3College of Arts & Sciences $28.4Financial Aid $37.1HSC $106.8Total ** $247.6
Source: UNM Office of Research Services
Contract & Grant Awards
Source of Funds
Foundations1.7%
Other13.1%
Industry5.7%
State of New Mexico17.2%
Federal Agencies60.0%
National Labs2.3%
Awards by Unit
HSC43.1%
Continuing Education
1.5%
UNM Centers (Category II)
0.7%
Branches2.9%
Other3.4%
School of Law0.4% College of
Education6.7%
UNM Centers (Category III)
7.4%
School of Engineering
7.4%
College of Arts & Sciences
11.5%Financial Aid
15.0%*Includes Main, HSC, Branches, and Extended University.** Totals do not match due to rounding.

2002-2003 UNM Fact Book - Page 105
Contract & Grant Expenditures*UNM Total** (FY 1990 to FY 2002)
PublicFY Research Service Instruction
1990 $32.6 $31.2 $7.51991 $37.1 $34.6 $9.11992 $46.8 $30.4 $9.41993 $48.0 $34.9 $11.81994 $54.9 $41.3 $10.31995 $84.4 $62.5 $11.51996 $69.2 $68.7 $10.71997 $67.8 $71.7 $9.91998 $74.3 $68.1 $10.01999 $73.5 $73.9 $11.42000 $86.8 $61.8 $11.52001 $96.5 $83.0 $13.22002 $88.1 $73.5 $14.5
* Direct costs only. Does not include state or federal student financial aid.**Includes Main, HSC, Branches, and Extended University.
Source: UNM Office of Research Services
Contract & Grant Expenditures(In millions)
Contract & Grant ExpendituresFY 1989 to FY 2002
$0$20$40$60$80
$100$120$140$160$180$200
1990
1991
1992
1993
1994
1995
1996
1997
1998
1999
2000
2001
2002
Year
Expe
nditu
res
(in
mill
ions
)
Research Public Service Instruction

2002-2003 UNM Fact Book - Page 106
UNM Patents*Fiscal Years 1997-1998 to 2001-2002
HSCMain
Campus HSCMain
Campus HSCMain
Campus HSCMain
Campus HSCMain
Campus
Patent Disclosures Received 20 28 21 24 15 23 26 44 19 21U.S. Provisional and Utility Applications FiledForeign Applications Filed 12 11 8 16 18 13 11 4 6 11U.S. Patents Issued 4 8 13 7 5 8 11 12 2 4Foreign Patents Issued 3 0 7 4 1 1 0 1 0 1Active U.S. Patents 32 106 44 87 30 88 26 98 37 104
* Divisional applications (sub-parts of an invention) are not included.
Source: Science & Technology Corporation @ UNM
1620 23 33 21 15 21
1997-1998 1998-1999 1999-2000 2001-20022000-2001
7 3417
Active U.S. Patents
020406080
100120
1997-1998 1998-1999 1999-2000 2000-2001 2001-2002
Year
Num
ber o
f Act
ive
U.S
. Pat
ents
Main Campus
Health SciencesCenter

Computer and Information Resources and Technology
• Support and manage the UNM network, including CPU and storage resources.• Support and manage academic systems such as UNIX, WebCT, and other servers.•• Provide UNM NetID authentication to access the above systems.
Mission
Network Connections: 19,050Campus Computing Facilities: Six pods and nine classrooms (545 Windows and Macintosh computers)CIRT Support Center Client Contact: 45,716 telephone calls, 1,451 voice mail, 9,143 walk-ins, and 16,774 Support Center web page hitsTotal Computer Accounts: 66,366Total Computer Sessions: 8,603,532 on shared systemsConnect Time (Hours): 7,068,258 on shared systemsCentral Processing Unit Hours Used: 26,088,092 VAX equivalent CPU hours (normalized)Mail Messages/day: 165,000 averageWeb Hits/day: 162,286 averageDisk space provided (GB/day): 1,713Employee FTE: 145.2 (full-time); 29.2 (part-time); 174.4 (total)CIRT's Base Budget: $10,820,000
Source: Computer and Information Resources and Technology (CIRT)
CIRT Resources - Fiscal Year 2001-2002
CIRT
Computer and Information Resources and Technology (CIRT) is responsible for the University of New Mexico’s enterprise computer systems used by all students, staff, and faculty. This includes the student computer labs (called pods ), and the hardware and software to:
Support administrative systems such as student admissions and registration, payroll, and the financial resources system.
CIRT’s mission is to provide leadership for the effective use of information technologies to achieve the University of New Mexico’s vision and mission in education, research, and public service, and to provide support for the effective management and administration of those functions.
CIRT Web Site:
www.unm.edu/cirt www.unm.edu/cirt/support
2002-2003 UNM Fact Book - Page 107

2002-2003 UNM Fact Book - Page 108
Collections General Law Health Sciences Other Total
Volumes added during 2001-02 48,201 8,146 4,286 1,041 61,674Volumes in Library 2,024,133 232,940 175,998 40,999 2,474,070Serials Received 12,447 3,040 1,988 132 17,607Electronic Books 68,845 Not Avail 232 0 69,077Electronic Journals 16,124 Not Avail 1,139 0 17,263Microform Units 3,789,701 838,702 249 0 4,628,652Government Documents 307,321 0 0 163 307,484Manuscripts and Archives (linear ft.) 17,077 0 1,200 401 18,678Cartographic 227,154 0 0 60 227,214Audio, Film and Video 51,635 429 1,644 1,722 55,430
Source: UNM Libraries
UNM Main Campus Libraries
2001-2002 Library Statistics
UNM Main Campus libraries include the UNM General Library (UNMGL), the Health Sciences Library and Informatics Center (HSLIC), and the UNM Law Library (LL), representing three administratively distinct organizations. The UNM General Library encompasses Zimmerman Library (the University's main library), Centennial Science and Engineering Library, Parish Memorial Library, the Fine Arts Library, the Center for Regional Studies (CRS), and the Center for Southwest Research (CSWR). Other libraries (Other) include the following main campus libraries:
Bainbridge Bunting Memorial Slide Library, Multicultural Education Center(MEC)/Equity Library, Tireman Learning Materials Library, and the Native American Studies Center Library. UNMGL is comparable to a non-departmentalized college within the University and is administered by the Dean of Library Services who reports to the Provost and Vice President for Academic Affairs. HSLIC reports to the Vice President for Health Sciences. LL reports to the Dean of the School of Law.

2002-2003 UNM Fact Book - Page 109
Services General LawHealth
Sciences Other Total
Service hours (number of hours library is open per week) 100 104 91 49 104Gate count (number of persons entering/exiting library) 1,346,147 Not Avail 356,249 36,482 1,738,878Number of Reference Transactions 51,594 8,375 17,072 2,036 79,077Total Number of Circulations 302,645 11,264 20,045 75,343 409,297Interlibrary Loan Requests Received from other Libraries 15,334 314 4,723 6 20,377Interlibrary Loan Requests Sent to other Libraries 17,990 227 3,478 31 21,726
FacilitiesNumber of patron PC workstations 145 19 67 7 238Network ports available to patrons 850 127 92 32 1,101
YearUNM
RankingTotal
Ranked
1990 60 107
1996 47 1091997 49 1101998 54 1111999 55 1112000 57 1122001 58 113
Source: UNM Libraries
UNM Main Campus Libraries
ARL Library Ranking
The UNM main campus libraries represent the largest academic collections in the state. They provide a large body of information in print and electronic sources accessible through computer workstations and the internet. In addition to providing access to resources, the libraries provide instructional opportunities for faculty, students, and staff through formal classes and one-on-one instruction. In 2001, the main campus libraries ranked 58 out of 113 academic libraries in the Association of Research Libraries (ARL). UNM holds membership in the largest information scientific and technology consortium in America--the Alliance for Innovation in Science and Technology Information. The General Library hosts the online catalog for the state serving 25 academic and special library collections in New Mexico. The libraries' lending network includes the OCLC (41,000 libraries); the Greater Western Library Alliance, formerly Big 12+ Consortium (32 libraries); and the National Network of Libraries of Medicine (more than 5,000 libraries), a program of the National Library of Medicine; and the Amigos network (750 libraries).

2002-2003 UNM Fact Book - Page 110

Revenue & Expenditures
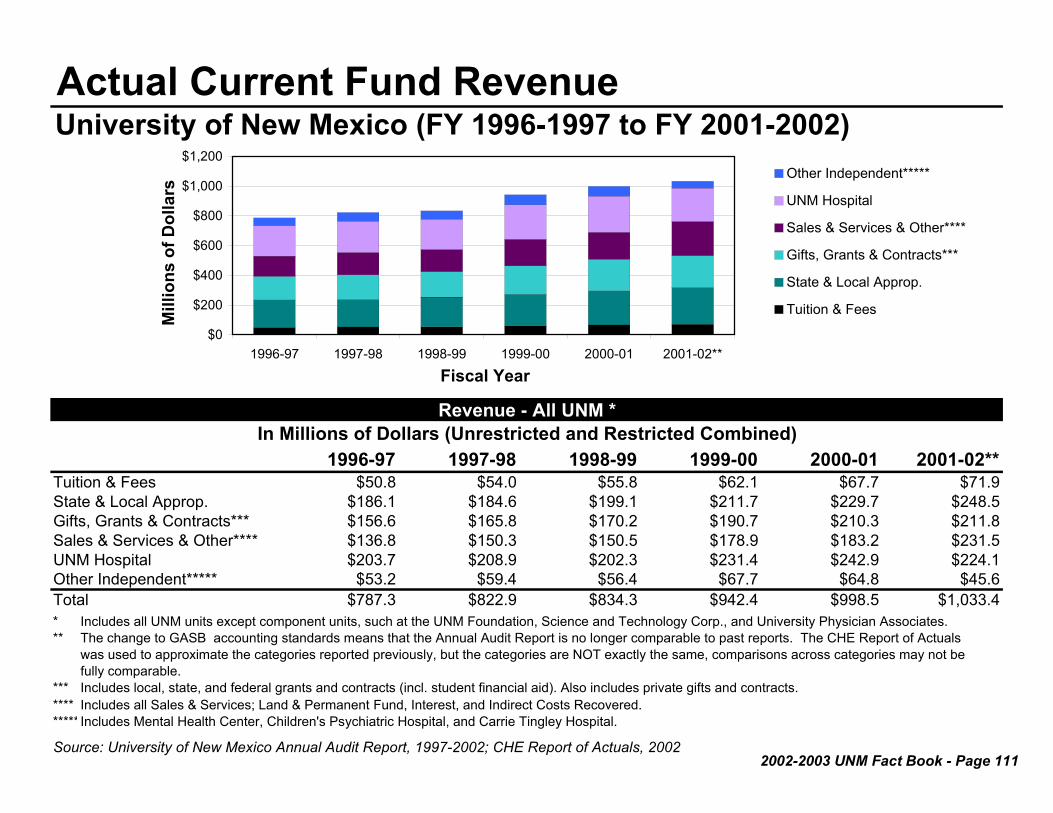
Actual Current Fund RevenueUniversity of New Mexico (FY 1996-1997 to FY 2001-2002)
1996-97 1997-98 1998-99 1999-00 2000-01 2001-02**Tuition & Fees $50.8 $54.0 $55.8 $62.1 $67.7 $71.9State & Local Approp. $186.1 $184.6 $199.1 $211.7 $229.7 $248.5Gifts, Grants & Contracts*** $156.6 $165.8 $170.2 $190.7 $210.3 $211.8Sales & Services & Other**** $136.8 $150.3 $150.5 $178.9 $183.2 $231.5UNM Hospital $203.7 $208.9 $202.3 $231.4 $242.9 $224.1Other Independent***** $53.2 $59.4 $56.4 $67.7 $64.8 $45.6Total $787.3 $822.9 $834.3 $942.4 $998.5 $1,033.4*** The change to GASB accounting standards means that the Annual Audit Report is no longer comparable to past reports. The CHE Report of Actuals
was used to approximate the categories reported previously, but the categories are NOT exactly the same, comparisons across categories may not befully comparable.
******* Includes all Sales & Services; Land & Permanent Fund, Interest, and Indirect Costs Recovered.***** Includes Mental Health Center, Children's Psychiatric Hospital, and Carrie Tingley Hospital.
Source: University of New Mexico Annual Audit Report, 1997-2002; CHE Report of Actuals, 2002
Revenue - All UNM *In Millions of Dollars (Unrestricted and Restricted Combined)
Includes all UNM units except component units, such at the UNM Foundation, Science and Technology Corp., and University Physician Associates.
Includes local, state, and federal grants and contracts (incl. student financial aid). Also includes private gifts and contracts.
$0
$200
$400
$600
$800
$1,000
$1,200
1996-97 1997-98 1998-99 1999-00 2000-01 2001-02**
Fiscal Year
Mill
ions
of D
olla
rsOther Independent*****
UNM Hospital
Sales & Services & Other****
Gifts, Grants & Contracts***
State & Local Approp.
Tuition & Fees
2002-2003 UNM Fact Book - Page 111

Actual Current Fund ExpendituresUniversity of New Mexico (FY 1996-1997 to FY 2001-2002)
1996-97 1997-98 1998-99 1999-00 2000-01 2001-02**Instuction & General*** $220.1 $224.8 $237.9 $247.8 $263.8 $282.4Research $94.0 $103.2 $106.7 $124.0 $140.9 $131.5Public Service $117.5 $118.2 $121.8 $137.6 $150.9 $168.1Student Aid $31.8 $35.4 $39.0 $44.0 $47.1 $53.7Other University**** $52.1 $56.9 $52.8 $59.4 $65.5 $62.7UNM Hospital $198.3 $212.2 $210.0 $232.0 $245.7 $221.9Other Independent***** $55.7 $55.8 $60.7 $62.6 $64.5 $75.5Total $769.5 $806.5 $828.9 $907.4 $978.5 $995.8*** The change to GASB accounting standards means that the Annual Audit Report is no longer comparable to past reports. The CHE Report of Actuals
was used to approximate the categories reported previously, but the categories are NOT exactly the same, comparisons across categories may not befully comparable.
*** Includes Instruction and Instructional Support from previous year's reports through FY01, includes Instruction and General from CHE Report of Actualsfor FY02.
**** Includes Internal Service, Auxiliaries, Athletics, and Student Social & Cultural.***** Includes Mental Health Center, Children's Psychiatric Hospital, and Carrie Tingley Hospital.Source: University of New Mexico Annual Audit Report, 1997-2002; CHE Report of Actuals, 2002
Expenditures - All UNM *In Millions of Dollars (Unrestricted and Restricted Combined)
Includes all UNM units except component units, such at the UNM Foundation, Science and Technology Corp., and University Physician Associates.
$0
$200
$400
$600
$800
$1,000
$1,200
1996-97 1997-98 1998-99 1999-00 2000-01 2001-02**
Fiscal Year
Mill
ions
of D
olla
rs Other Independent*****
UNM Hospital
Other University****
Student Aid
Public Service
Research
Instuction & General***
2002-2003 UNM Fact Book - Page 112
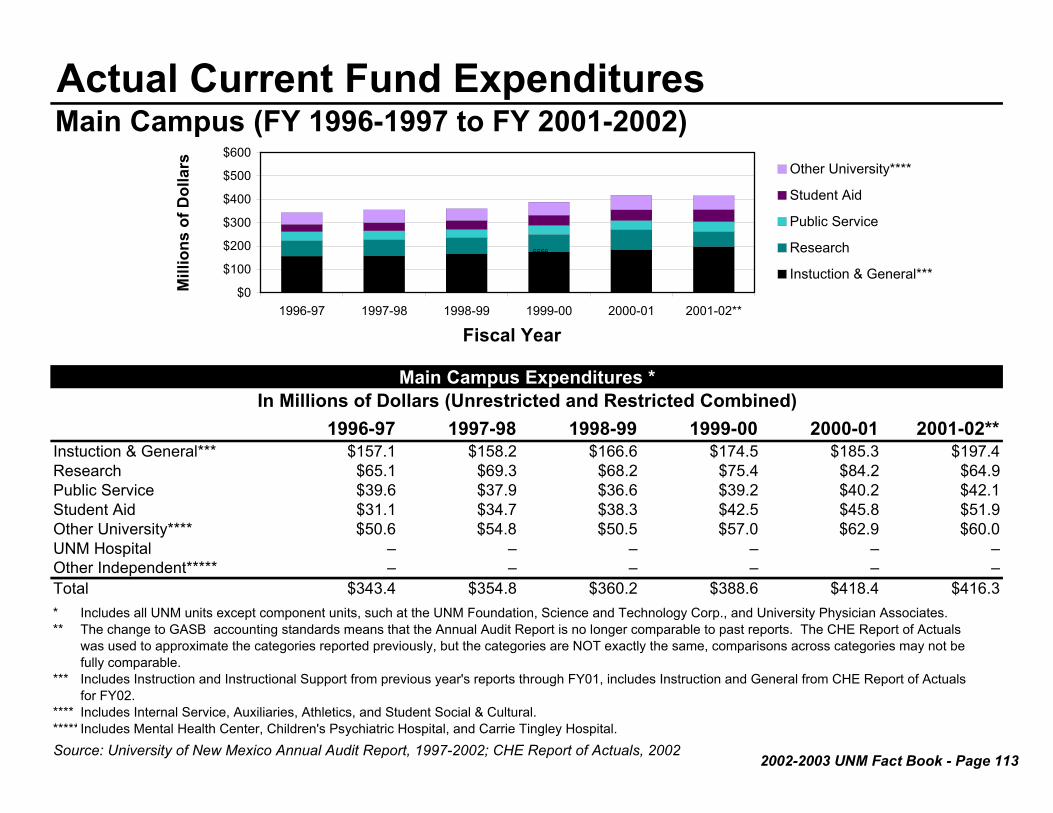
Actual Current Fund ExpendituresMain Campus (FY 1996-1997 to FY 2001-2002)
1996-97 1997-98 1998-99 1999-00 2000-01 2001-02**Instuction & General*** $157.1 $158.2 $166.6 $174.5 $185.3 $197.4Research $65.1 $69.3 $68.2 $75.4 $84.2 $64.9Public Service $39.6 $37.9 $36.6 $39.2 $40.2 $42.1Student Aid $31.1 $34.7 $38.3 $42.5 $45.8 $51.9Other University**** $50.6 $54.8 $50.5 $57.0 $62.9 $60.0UNM Hospital – – – – – –Other Independent***** – – – – – –Total $343.4 $354.8 $360.2 $388.6 $418.4 $416.3*** The change to GASB accounting standards means that the Annual Audit Report is no longer comparable to past reports. The CHE Report of Actuals
was used to approximate the categories reported previously, but the categories are NOT exactly the same, comparisons across categories may not befully comparable.
*** Includes Instruction and Instructional Support from previous year's reports through FY01, includes Instruction and General from CHE Report of Actualsfor FY02.
**** Includes Internal Service, Auxiliaries, Athletics, and Student Social & Cultural.***** Includes Mental Health Center, Children's Psychiatric Hospital, and Carrie Tingley Hospital.Source: University of New Mexico Annual Audit Report, 1997-2002; CHE Report of Actuals, 2002
Main Campus Expenditures *In Millions of Dollars (Unrestricted and Restricted Combined)
Includes all UNM units except component units, such at the UNM Foundation, Science and Technology Corp., and University Physician Associates.
$0
$100
$200
$300
$400
$500
$600
1996-97 1997-98 1998-99 1999-00 2000-01 2001-02**
Fiscal Year
Mill
ions
of D
olla
rs Other University****
Student Aid
Public Service
Research
Instuction & General***
6666
2002-2003 UNM Fact Book - Page 113

Actual Current Fund Expenditures UNM Health Sciences Center (FY 1996-1997 to FY 2001-2002)
1996-97 1997-98 1998-99 1999-00 2000-01 2001-02**Instuction & General*** $48.2 $48.4 $51.0 $51.8 $56.0 $59.8Research $28.9 $33.9 $37.5 $48.7 $56.7 $66.6Public Service $76.4 $78.5 $83.5 $96.4 $107.7 $122.7Student Aid $0.6 $0.6 $0.5 $1.1 $1.1 $1.4Other University**** – $0.2 $1.4 $0.4 $0.5 $0.4UNM Hospital $198.3 $212.2 $210.0 $232.0 $245.7 $221.9Other Independent***** $55.7 $55.8 $60.7 $62.6 $64.5 $75.5Total $408.1 $429.6 $444.7 $493.0 $532.3 $548.3*** The change to GASB accounting standards means that the Annual Audit Report is no longer comparable to past reports. The CHE Report of Actuals
was used to approximate the categories reported previously, but the categories are NOT exactly the same, comparisons across categories may not befully comparable.
*** Includes Instruction and Instructional Support from previous year's reports through FY01, includes Instruction and General from CHE Report of Actualsfor FY02.
**** Includes Internal Service, Auxiliaries, Athletics, and Student Social & Cultural.***** Includes Mental Health Center, Children's Psychiatric Hospital, and Carrie Tingley Hospital.Source: University of New Mexico Annual Audit Report, 1997-2002; CHE Report of Actuals, 2002
UNM Health Sciences Center Expenditures *In Millions of Dollars (Unrestricted and Restricted Combined)
Includes all UNM units except component units, such at the UNM Foundation, Science and Technology Corp., and University Physician Associates.
$0
$100
$200
$300
$400
$500
$600
1996-97 1997-98 1998-99 1999-00 2000-01 2001-02**
Fiscal Year
Mill
ions
of D
olla
rs Other Independent*****UNM HospitalOther University****Student Aid Public Service Research Instuction & General***
2002-2003 UNM Fact Book - Page 114

2002-2003 UNM Fact Book - Page 115
Actual Current Fund ExpendituresUNM Branch Campuses (FY 1996-1997 to FY 2001-2002)
1996-97 1997-98 1998-99 1999-00 2000-01 2001-02**Instuction & General*** $14.8 $18.3 $20.2 $21.6 $22.5 $25.3Research – – – – $0.0 –Public Service $1.4 $1.8 $1.7 $1.9 $3.0 $3.2Student Aid $0.1 $0.1 $0.2 $0.4 $0.2 $0.3Other University**** $1.6 $1.8 $1.9 $1.9 $2.1 $2.3UNM Hospital – – – – – –Other Independent***** – – – – – –Total $17.9 $22.0 $24.0 $25.8 $27.7 $31.1*** The change to GASB accounting standards means that the Annual Audit Report is no longer comparable to past reports. The CHE Report of Actuals
was used to approximate the categories reported previously, but the categories are NOT exactly the same, comparisons across categories may not befully comparable.
*** Includes Instruction and Instructional Support from previous year's reports through FY01, includes Instruction and General from CHE Report of Actualsfor FY02.
**** Includes Internal Service, Auxiliaries, Athletics, and Student Social & Cultural.***** Includes Mental Health Center, Children's Psychiatric Hospital, and Carrie Tingley Hospital.Source: University of New Mexico Annual Audit Report, 1997-2002; CHE Report of Actuals, 2002
Includes all UNM units except component units, such at the UNM Foundation, Science and Technology Corp., and University Physician Associates.
UNM Branch Campus Expenditures *In Millions of Dollars (Unrestricted and Restricted Combined)
$0$5
$10$15$20$25$30$35
1996-97 1997-98 1998-99 1999-00 2000-01 2001-02**
Fiscal Year
Mill
ions
of D
olla
rs Other University****
Student Aid
Public Service
Research
Instuction & General***

2002-2003 UNM Fact Book - Page 116

Other Finance & Resource Data
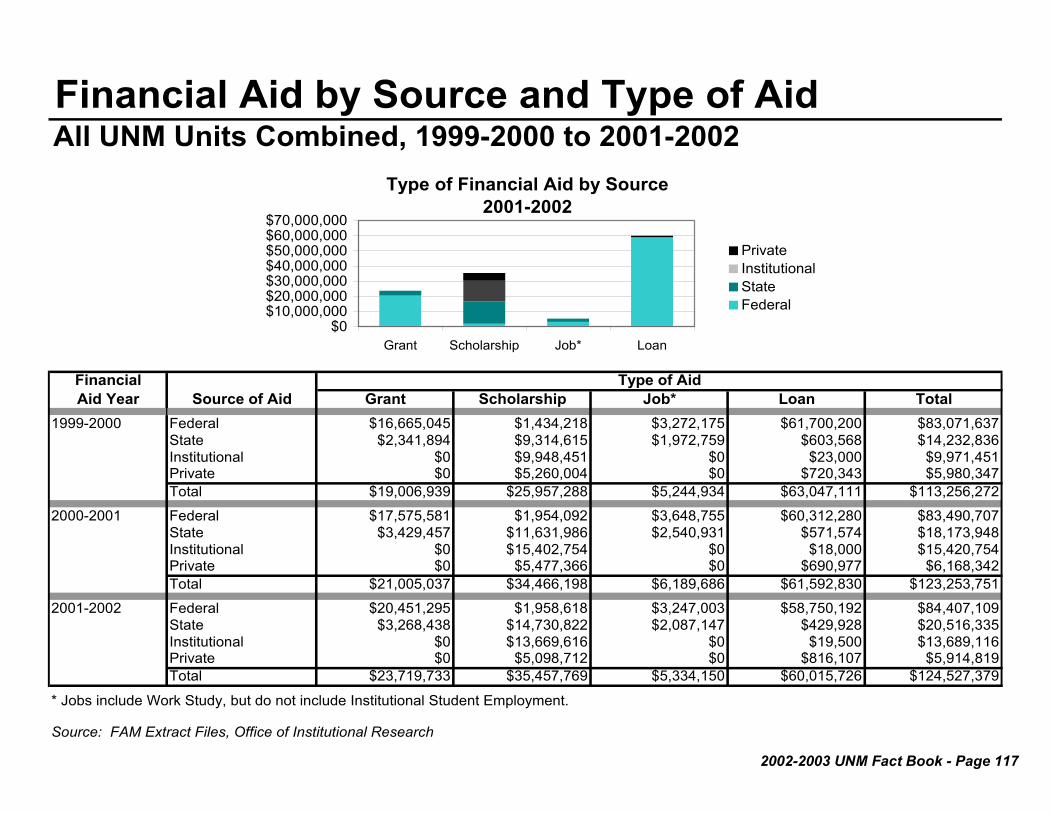
2002-2003 UNM Fact Book - Page 117
Financial Aid by Source and Type of AidAll UNM Units Combined, 1999-2000 to 2001-2002
FinancialAid Year Source of Aid Grant Scholarship Job* Loan Total
1999-2000 Federal $16,665,045 $1,434,218 $3,272,175 $61,700,200 $83,071,637State $2,341,894 $9,314,615 $1,972,759 $603,568 $14,232,836Institutional $0 $9,948,451 $0 $23,000 $9,971,451Private $0 $5,260,004 $0 $720,343 $5,980,347Total $19,006,939 $25,957,288 $5,244,934 $63,047,111 $113,256,272
2000-2001 Federal $17,575,581 $1,954,092 $3,648,755 $60,312,280 $83,490,707State $3,429,457 $11,631,986 $2,540,931 $571,574 $18,173,948Institutional $0 $15,402,754 $0 $18,000 $15,420,754Private $0 $5,477,366 $0 $690,977 $6,168,342Total $21,005,037 $34,466,198 $6,189,686 $61,592,830 $123,253,751
2001-2002 Federal $20,451,295 $1,958,618 $3,247,003 $58,750,192 $84,407,109State $3,268,438 $14,730,822 $2,087,147 $429,928 $20,516,335Institutional $0 $13,669,616 $0 $19,500 $13,689,116Private $0 $5,098,712 $0 $816,107 $5,914,819Total $23,719,733 $35,457,769 $5,334,150 $60,015,726 $124,527,379
* Jobs include Work Study, but do not include Institutional Student Employment.
Source: FAM Extract Files, Office of Institutional Research
Type of Aid
Type of Financial Aid by Source2001-2002
$0$10,000,000$20,000,000$30,000,000$40,000,000$50,000,000$60,000,000$70,000,000
Grant Scholarship Job* Loan
PrivateInstitutionalStateFederal

2002-2003 UNM Fact Book - Page 118
Financial AidFall 2001 Financial Aid Recipients
Gallup Los Alamos Taos ValenciaEthnicity Main Campus* Branch Campus Branch Campus Branch Campus Branch CampusAfrican American/Black 67.9% 33.3% 33.3% 62.5% 66.7%American Indian 73.4% 54.4% 30.8% 51.9% 77.3%Asian/Pacific Islander 60.4% 10.5% 12.9% 20.0% 41.7%Hispanic 65.4% 43.5% 43.0% 44.4% 58.2%White, non-Hispanic 55.2% 22.8% 22.6% 20.2% 50.8%International 39.0% 50.0% 0.0% 0.0% 0.0%No Response 48.3% 27.9% 29.6% 19.8% 50.0%Total 58.7% 48.6% 30.2% 34.3% 55.9%
SexFemale 60.5% 55.0% 29.2% 37.7% 58.9%Male 56.3% 34.3% 32.1% 26.2% 48.8%Total 58.7% 48.6% 30.2% 34.3% 55.9%
LevelYear 1: Freshman 69.3% 66.7% 57.0% 68.8% 65.4%Year 2: Sophomore 73.9% 71.9% 36.0% 73.9% 68.1%Year 3: Junior 70.6% – – – –Year 4: Senior 64.1% – – – –Non-Degree 5.3% 6.0% 6.0% 0.9% 8.9%Masters 45.3% – – – –Professional/Doctoral 63.5% – – – –Total 58.7% 48.6% 30.2% 34.3% 55.9%
* Includes School of Medicine and Extended University.Source: CHE DEAR Student Enrollment File for Fall 2001 and UNM FAM Financial Aid Data for 2001-2002
Financial Aid by Ethnicity, Sex, and LevelPercentage of Students Receiving Financial Aid

2002-2003 UNM Fact Book - Page 119
ScholarshipsAll UNM Units Combined, 1997-1998 to 2001-2002 Academic Years
Scholarship 97-98 98-99 99-00 00-01 01-02 97-98 98-99 99-00 00-01 01-02
Regents Scholars $7,240 $7,365 $8,071 $8,281 $8,999 54 52 48 57 59Presidential $2,873 $2,840 $3,119 $3,380 $3,705 496 480 462 461 411UNM Scholars $2,301 $2,251 $2,288 $2,402 $2,992 577 508 487 490 534NM Scholars $2,685 $2,615 $2,748 $3,302 $3,630 192 141 147 138 113Amigo 2 $187 $180 $182 $470 $643 314 316 398 388 372Bridge to Success 3 $814 $876 $970 $849 $999 1,370 2,001 1,930 1,861 914Success (Lottery) Scholarships $1,044 $1,225 $1,455 $1,560 $1,823 1,777 3,116 4,374 5,146 5,481Other Scholarships 4 $1,965 $1,767 $2,056 $2,787 $2,844 6,481 7,505 7,602 7,858 7,7261 Average award is less than the typical full-year award due to some attrition in the spring semester.2 The Amigo Award is for non-residents, and also provides in-state instead of out-of-state tuition rates.3 The drop in the number of Bridge to Success recipients in 2001-2002 was due to a one-time change in scholarship requirements for fall 2001.4 The other Scholarship category includes athletic awards, departmental awards, and third-party awards from outside of UNM.
Scholarship 97-98 98-99 99-00 00-01 01-02 97-98 98-99 99-00 00-01 01-02
Regents Scholars 28.7 30.0 30.6 29.4 30.1 4.0 4.0 4.0 4.0 4.0Presidential 26.8 27.4 27.3 27.7 27.6 3.9 3.9 3.9 3.9 3.9UNM Scholars 24.2 24.7 26.1 26.2 26.0 3.7 3.8 3.8 3.8 3.7NM Scholars 26.7 25.9 25.6 25.3 25.2 3.5 3.6 3.5 3.6 3.7Amigo 25.7 26.4 26.2 26.1 25.5 3.6 3.7 3.7 3.7 3.7Bridge to Success 21.5 21.5 21.1 20.9 21.0 3.1 3.2 3.2 3.2 3.4Success (Lottery) Scholarships 23.2 22.6 22.2 22.4 22.2 3.5 3.4 3.4 3.4 3.4Other Scholarships 22.5 21.9 21.8 22.3 21.6 3.4 3.4 3.4 3.4 3.4
Source: FAM Data Extracts and the Office of Institutional Research's Freshman Cohort Tracking Database
Average Entering ACT Score Average Entering High School GPA
Scholarship Awards - All Recipients CombinedAverage Amount of Award Paid1 Number of Scholarship Recipients
Preparation of Incoming Freshman Scholarship Recipients
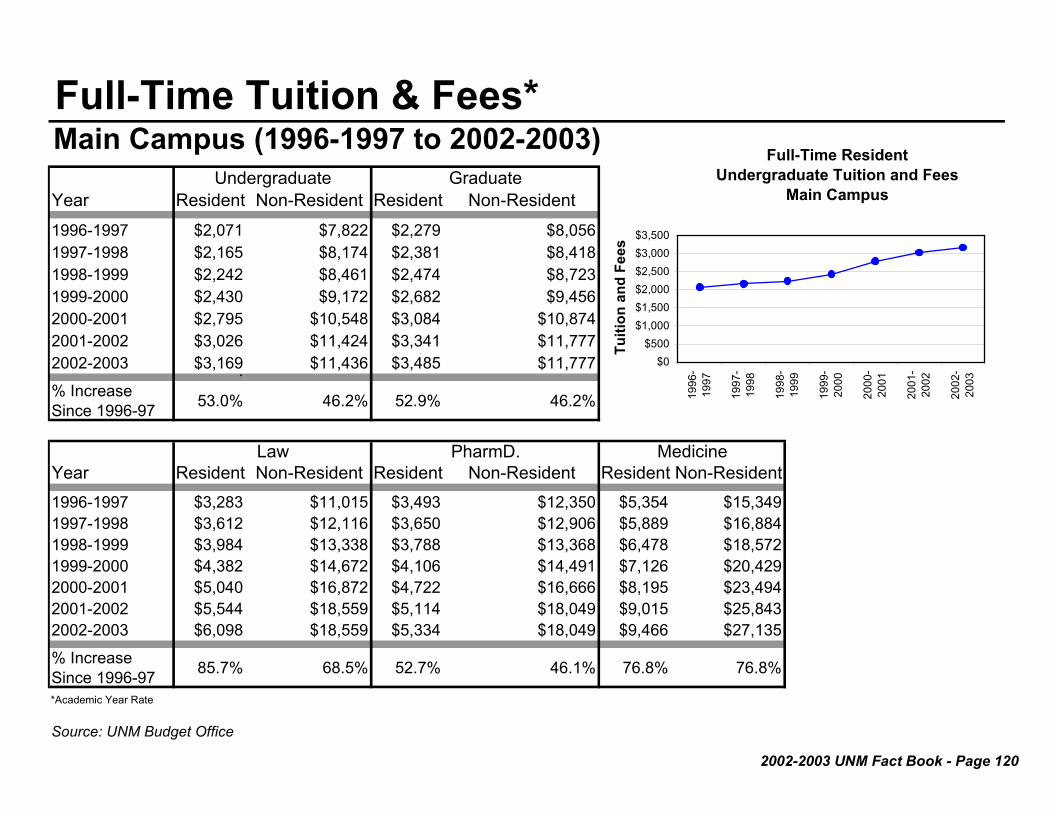
2002-2003 UNM Fact Book - Page 120
Full-Time Tuition & Fees* Main Campus (1996-1997 to 2002-2003)
Year Resident Non-Resident Resident Non-Resident1996-1997 $2,071 $7,822 $2,279 $8,0561997-1998 $2,165 $8,174 $2,381 $8,4181998-1999 $2,242 $8,461 $2,474 $8,7231999-2000 $2,430 $9,172 $2,682 $9,4562000-2001 $2,795 $10,548 $3,084 $10,8742001-2002 $3,026 $11,424 $3,341 $11,7772002-2003 $3,169 $11,436 $3,485 $11,777.% Increase Since 1996-97 53.0% 46.2% 52.9% 46.2%
Year Resident Non-Resident Resident Non-Resident Resident Non-Resident1996-1997 $3,283 $11,015 $3,493 $12,350 $5,354 $15,3491997-1998 $3,612 $12,116 $3,650 $12,906 $5,889 $16,8841998-1999 $3,984 $13,338 $3,788 $13,368 $6,478 $18,5721999-2000 $4,382 $14,672 $4,106 $14,491 $7,126 $20,4292000-2001 $5,040 $16,872 $4,722 $16,666 $8,195 $23,4942001-2002 $5,544 $18,559 $5,114 $18,049 $9,015 $25,8432002-2003 $6,098 $18,559 $5,334 $18,049 $9,466 $27,135
% Increase Since 1996-97 85.7% 68.5% 52.7% 46.1% 76.8% 76.8%
*Academic Year Rate
Source: UNM Budget Office
Medicine
Undergraduate Graduate
Law PharmD.
Full-Time ResidentUndergraduate Tuition and Fees
Main Campus
$0$500
$1,000$1,500$2,000$2,500$3,000$3,500
1996
-19
97
1997
-19
98
1998
-19
99
1999
-20
00
2000
-20
01
2001
-20
02
2002
-20
03
Tuiti
on a
nd F
ees

2002-2003 UNM Fact Book - Page 121
Full-Time Tuition & Fees* Branch Campuses (1996-1997 to 2002-2003)
Non- Non- In- Out of Non- Non-Year Resident Resident Resident Resident District District Resident Resident Resident
1996-1997 $720 $1,584 $672 $1,848 $552 $672 $1,728 $720 $1,8001997-1998 $720 $1,584 $672 $1,848 $624 $744 $1,800 $720 $1,8001998-1999 $720 $1,584 $720 $1,992 $696 $816 $1,848 $720 $1,7761999-2000 $840 $1,584 $720 $1,992 $816 $816 $1,968 $816 $1,9922000-2001 $840 $1,584 $768 $2,136 $888 $888 $1,992 $864 $2,1122001-2002 $960 $1,608 $816 $2,280 $912 $912 $2,016 $912 $2,2562002-2003 $960 $1,608 $816 $2,280 $912 $912 $2,016 $912 $2,256
% Increase Since 1995-96 33.3% 1.5% 21.4% 23.4% 65.2% 35.7% NA 26.7% 25.3%
Source: UNM Budget Office
Valencia BranchTaos Branch
*Academic Year Rate
Gallup Branch Los Alamos Branch
Full-Time Resident UndergraduateTuition and Fees Per Academic Year
$500
$600
$700
$800
$900
$1,000
1996-1997
1997-1998
1998-1999
1999-2000
2000-2001
2001-2002
2002-2003
Tuiti
on a
nd F
ees
Gallup Branch
Los Alamos Branch
Taos Branch
Valencia Branch
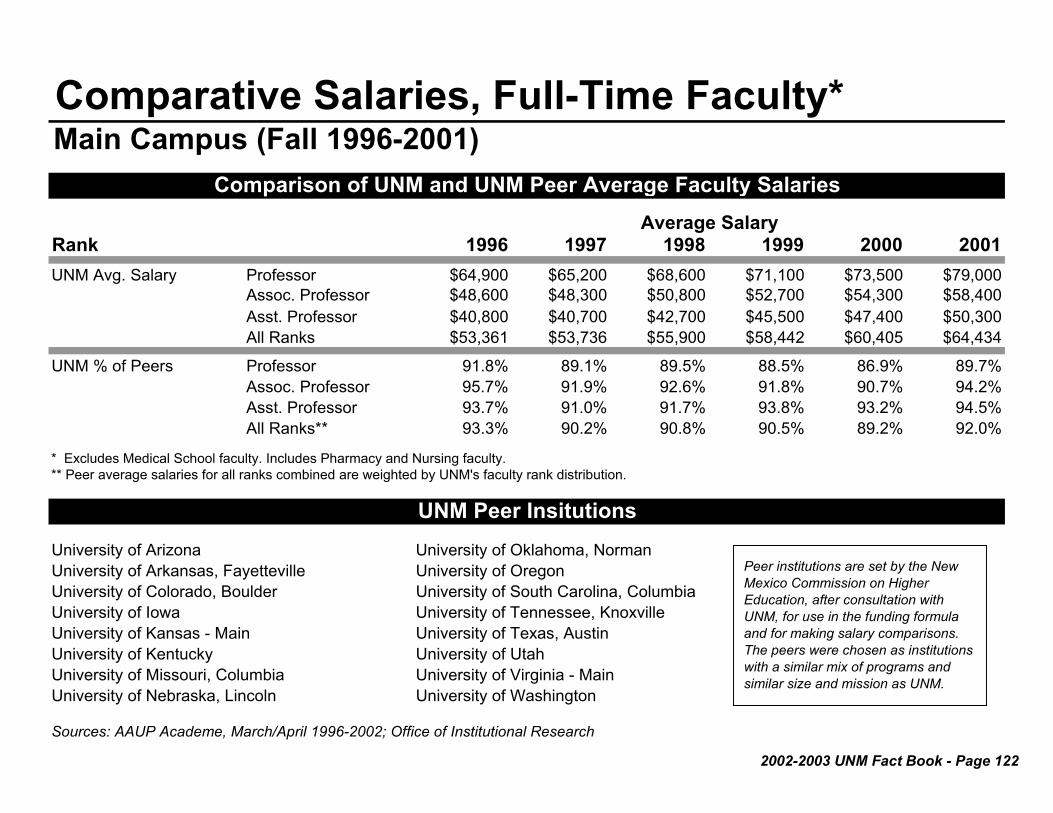
2002-2003 UNM Fact Book - Page 122
Comparative Salaries, Full-Time Faculty*Main Campus (Fall 1996-2001)
Rank 1996 1997 1998 1999 2000 2001UNM Avg. Salary Professor $64,900 $65,200 $68,600 $71,100 $73,500 $79,000
Assoc. Professor $48,600 $48,300 $50,800 $52,700 $54,300 $58,400Asst. Professor $40,800 $40,700 $42,700 $45,500 $47,400 $50,300All Ranks $53,361 $53,736 $55,900 $58,442 $60,405 $64,434
UNM % of Peers Professor 91.8% 89.1% 89.5% 88.5% 86.9% 89.7%Assoc. Professor 95.7% 91.9% 92.6% 91.8% 90.7% 94.2%Asst. Professor 93.7% 91.0% 91.7% 93.8% 93.2% 94.5%All Ranks** 93.3% 90.2% 90.8% 90.5% 89.2% 92.0%
* Excludes Medical School faculty. Includes Pharmacy and Nursing faculty.** Peer average salaries for all ranks combined are weighted by UNM's faculty rank distribution.
University of Arizona University of Oklahoma, NormanUniversity of Arkansas, Fayetteville University of OregonUniversity of Colorado, Boulder University of South Carolina, ColumbiaUniversity of Iowa University of Tennessee, KnoxvilleUniversity of Kansas - Main University of Texas, AustinUniversity of Kentucky University of UtahUniversity of Missouri, Columbia University of Virginia - MainUniversity of Nebraska, Lincoln University of Washington
Sources: AAUP Academe, March/April 1996-2002; Office of Institutional Research
Average Salary
Comparison of UNM and UNM Peer Average Faculty Salaries
UNM Peer Insitutions
Peer institutions are set by the New Mexico Commission on Higher Education, after consultation with UNM, for use in the funding formula and for making salary comparisons. The peers were chosen as institutions with a similar mix of programs and similar size and mission as UNM.

2002-2003 UNM Fact Book - Page 123
Staff Salary ProfileAll UNM Campuses Combined (as Reported in Fall 2002) *
Number Averageof UNM FTE Compa
Grade Employees Base Pay Minimum Midpoint** Maximum Ratio***19 2 $165,002 $99,063 $144,394 $183,768 1.1418 4 135,191 83,030 120,328 152,630 1.1217 79 97,028 69,586 100,277 126,776 0.9716 38 87,240 58,314 83,554 105,290 1.0415 241 66,735 48,864 69,638 87,464 0.9614 294 55,004 40,941 58,032 72,654 0.9513 366 46,891 34,301 48,360 60,341 0.9712 455 41,622 31,347 43,950 54,683 0.9511 357 37,304 28,644 39,957 49,566 0.9310 625 33,494 26,173 35,651 44,075 0.949 354 31,056 23,912 32,406 39,936 0.968 644 27,641 21,846 29,453 36,192 0.947 630 25,040 19,957 26,790 32,802 0.936 123 23,246 18,230 24,336 29,723 0.965 272 20,939 16,650 21,715 26,436 0.964 137 19,722 15,206 19,739 23,961 1.003 261 17,050 13,885 17,930 21,715 0.952 13 16,995 12,950 16,307 18,762 1.041 17 14,676 12,480 14,830 17,846 0.99
Average 0.95Grade Descriptions: 18-19, Executive; 15-17, Directors & Associate VP's; 13-14, Managerial; 10-12, Professional; 8-9, Technical/Paraprofessional; 5-8, Clerical/Secretarial; 7-9, Skilled Crafts; 3-7, Service/Maintenance; 1-2, Helpers.* Regular staff only. Does not include temporary or on-call employees. Does not include University of New Mexico Hospital staff.
Does not include administrative employees with faculty appointments.** The midpoint corresponds to the median salary in the outside market of like positions clustered in a grade.*** Compa Ratio = The ratio of the average UNM FTE base pay in a grade to the midpoint of that grade.
Source: Human Resources, Compensation for most current "Pay Ratio by Structure Report"
Grade Pay Range

2002-2003 UNM Fact Book - Page 124
UNM Endowment FundsFiscal Years 1993 to 2002
Source: UNM Foundation
8196
112126
149
178188
197181
167
0
20
40
60
80
100
120
140
160
180
200
220
1993 1994 1995 1996 1997 1998 1999 2000 2001 2002
Fiscal Year
Valu
e in
Mill
ions
* Includes combined UNM & UNM Foundation endowment funds, exclusive of the University's share of the State Permanent Fund.
Consolidated Investment Fund (CIF)*(Long-term Permanent Endowment Investments)
Growth in ValueFY 1993 to 2002

2002-2003 UNM Fact Book - Page 125
UNM Endowment FundsFY 2002
Institutional $62,473,387Colleges/Schools/Academic Units $46,579,724Health Science Center (HSC) $43,792,728Non-Academic Units $6,188,954Athletics $3,994,717Presidential Scholarship Program (PSP) $3,914,178Total $166,943,688
Student Financial Assist. (Scholarships) $4,126,260Faculty Support $1,509,872Research $1,155,804Program Support $1,143,329Library $175,714Equipment/Bldg. Maintenance $40,198Total $8,151,177
Source: Finance & Facilities Committee Annual Report to UNM Board of Regents, Fall 2002
CIF Disbursements by Purpose(FY 2002)
CIF Market Value by Donor-Designated Recipient(Value as of June 30, 2002)
Consolidated Investment Fund (CIF)Market Value by Donor-Designated by Recipient
(Value as of June 20, 2002)
Presidential Scholarship
Program (PSP)2.3%
Institutional37.4%
Colleges/Schools/Academic Units
27.9%
Health Science Center (HSC)
26.2%
Non-Academic Units3.7%
Athletics2.4%
Consolidated Investment Fund (CIF)Disbursements by Purpose
(FY 2002)
Library2.2%
Program Support14.0%
Research14.2%
Faculty Support18.5%
Student Financial Assist.
(Scholarships)50.6%
Equipment/Bldg. Maintenance
0.5%

2002-2003 UNM Fact Book - Page 126
Gift Activity*Fiscal Years 1998 to 2002
1998 1999 2000 2001 2002Foundation Gifts $10,075,378 $10,533,089 $12,847,182 $15,047,104 $17,271,563Bequests Received $6,069,988 $4,582,508 $6,021,500 $3,378,676 $4,386,355Department Reported Gifts** $14,953,509 $10,169,544 $12,533,426 $16,873,547 $18,455,064Total Private Support $31,098,875 $25,285,141 $31,402,108 $35,299,327 $40,112,982
* Includes gifts and bequests made to UNM Main, Branches, and the HSC** Gifts received directly by UNM departments (other than the Foundation) and subsequently reported to the Foundation for record keeping.
Source: UNM Foundation
Gift Activity by Fiscal YearUniversity of New Mexico Foundation, Inc.
$0$5,000,000
$10,000,000$15,000,000$20,000,000$25,000,000$30,000,000$35,000,000$40,000,000$45,000,000
1998 1999 2000 2001 2002
Fiscal Year
Tota
l Gift
s
Foundation Gifts Bequests Received Department Reported Gifts**

2002-2003 UNM Fact Book - Page 127
UNM FacilitiesAs of September 2002
Campus AcreageNumber of Buildings
Total Square Footage1
Central Campus (Albuquerque)2 211 acres3 194 5,064,569North Campus (Albuquerque) 269 acres3 45 1,181,965South Campus (Albuquerque) 289 acres3 77 1,255,058Gallup Campus 80 acres3 17 326,093Los Alamos Campus All land is leased 8 73,036Valencia Campus 124 acres3 9 140,861Taos Campus 80 acres 2 20,178
1 Excludes parking structures.2 The Central Campus includes buildings and acreage between Lomas and the south side of Central Avenue; the North Campus includes buildings and acreage north of Lomas; and the South Campus includes the UNM Research Park and the Sports Complex.3 Approximation.
Source: UNM Department of Facility Planning
UNM Facilities by Campus
Zimmerman Library

2002-2003 UNM Fact Book - Page 128
Capital Outlay ProjectsCurrent Year Request (2003-2004)
Estimated Project Cost
2003 State Appropriation
RequestPrevious
Appropriation Other Funds
Institution WideADA Compliance** $6,197,000 $1,000,000 $3,645,000 $0Core Building Renewal (Five Year Plan)** $42,024,000 $7,205,000 $6,000,000 $0Library - Off Site Compact Storage Facility* $8,116,000 $250,000 $0 $0NM Public Television - Phase II Digital Conversion $2,300,000 $2,300,000 $0 $0 Datacasing/Multicasing Technology***
Central CampusCentennial Engineering Center - Replacement $29,630,000 $9,485,000 $660,250 $10,000,000 of Wagner Hall - Phase IComplete Old Bookstore & Renovate $14,048,200 $7,525,000 $1,650,000 $4,873,200 Existing Biology BasementChemistry/Earth/Planetary Sciences Building* $15,234,000 $500,000 $0 $0College of Fine Arts Replacement Library $5,500,000 $0 $0 $5,500,000Student Services Center Renovation $6,902,000 $6,902,000 $0 $0
North CampusCollege of Nursing Classroom Renovation $565,000 $56,500 $0 $0Patient Care Equipment $2,000,000 $2,000,000 $0 $0Research Building $38,100,000 $6,000,000 $0 $32,100,000Education Building $40,800,000 $0 $5,000,000 $35,800,000UNMH Children's Hospital and Critical Care Pavilion $163,000,000 $0 $0 $163,000,000Clinical & Magnetic Resonance Research Center $13,000,000 $0 $0 $13,000,000

2002-2003 UNM Fact Book - Page 129
Capital Outlay ProjectsCurrent Year Request (2003-2004)
Estimated Project Cost
2003 State Appropriation
RequestPrevious
Appropriation Other Funds
Branch Campuses and Education CenterGallup - Infrastructure Inprovements $1,530,000 $780,000 $750,000 $0Los Alamos - Maintenance Plant Operations Building $459,000 $344,250 $0 $114,750Taos - Instructional Building - Phase III* $3,152,000 $0 $2,000,000 $1,152,000 - Library/Student Center/Trades Fac. - Phase IV $4,743,120 $2,000,000 $0 $2,743,120Valencia - Instructional Facility* $3,631,000 $0 $1,000,000 $2,631,000 - Site and Facility Renewal/Replacement* $620,800 $0 $200,000 $420,800 - Student Services/Administration Addition $800,000 $0 $0 $800,000
Auxilary/OtherKNME Building Renovation & Addition* $7,907,200 $100,000 $0 $0University Stadium Expansion - Phase V $16,850,000 $0 $5,175,000 $11,675,000
Total All Campuses $427,109,320 $45,547,750 $26,080,250 $283,809,870
* Planning Funds**Previous Appropriation column includes funds from and assumes passage of FY 02 Statewide GOB Issue***The request for NM Public Television - Phase II Digital Conversion is a statewide request. It is made on behalf of KNME TV, KRWG TV and KENW TV to be shared euqually.
Source: UNM Department of Facility Planning
2002-2003 UNM Fact Book - Page 130

UNM Organizational Structure

The University of New Mexico2002-2003 Organizational Structure*
*As of December 2002Source: UNM Office of the President
PRESIDENT F. Chris Garcia
BOARD OFREGENTS
UNIVERSITYCOUNSEL
Charles E. "Nick" Estes
INTERNALAUDIT
Susan Mullins
OFFICE OFEQUAL
OPPORTUNITYDori Martinez Freudiger
PROVOST,VP FOR
ACADEMIC AFFAIRSBrian Foster
VP FOR STUDENT AFFAIRS
Eliseo Torres
VP FOR HEALTH SCIENCES
Philip Eaton
VP FOR BUSINESS& FINANCE
Julie Weaks Gutierrez
VP FOR INSTITUTIONAL ADVANCEMENT
Judy Jones
EXECUTIVE AFFAIRS OFFICER
Ricardo Maestas
EXECUTIVE ASSISTANT TO THE PRESIDENT
Diane GwinnSPEC ADVISORON ECON DEV.
SPEC ASST FOR DIVERSITY
Roberto Ibarra
2002-2003 UNM Fact Book - Page 131
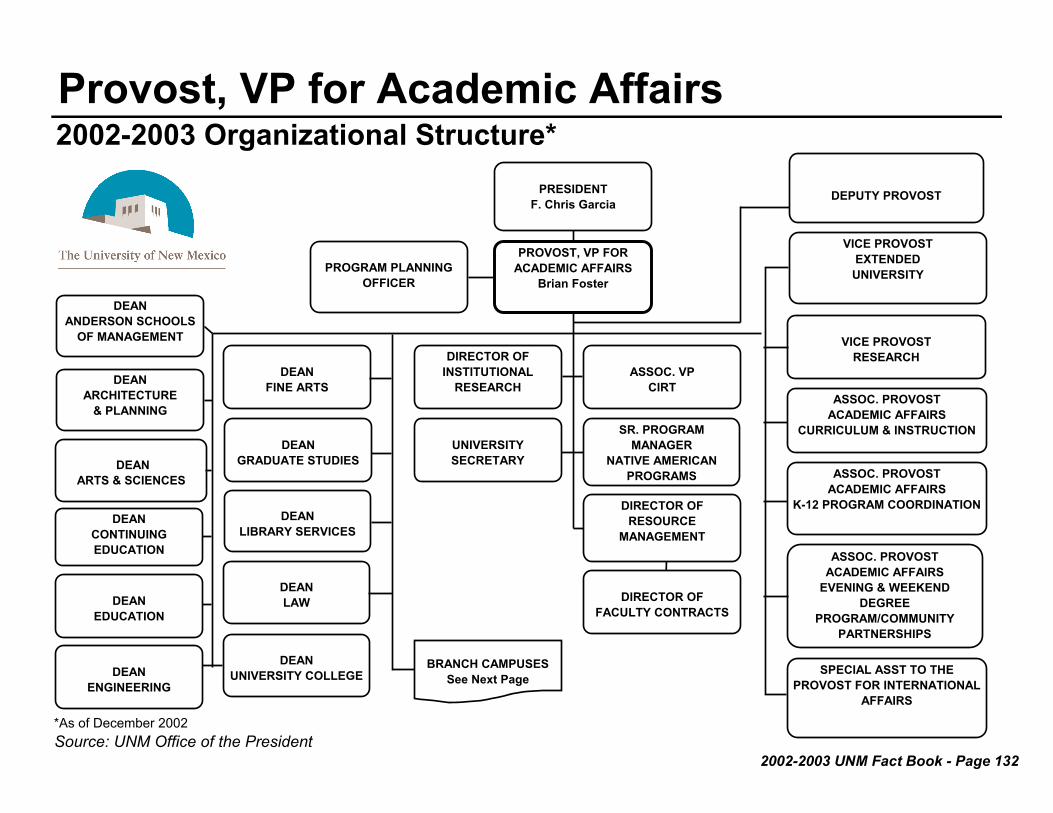
Provost, VP for Academic Affairs2002-2003 Organizational Structure*
*As of December 2002Source: UNM Office of the President
PROVOST, VP FOR ACADEMIC AFFAIRS
Brian Foster
PRESIDENT F. Chris Garcia
PROGRAM PLANNING OFFICER
DEANLAW
DEANLIBRARY SERVICES
DEANFINE ARTS
DEANGRADUATE STUDIES
DEANEDUCATION
DEANANDERSON SCHOOLS
OF MANAGEMENT
DEANARCHITECTURE
& PLANNING
DEANCONTINUINGEDUCATION
VICE PROVOSTRESEARCH
ASSOC. PROVOSTACADEMIC AFFAIRS
CURRICULUM & INSTRUCTION
ASSOC. PROVOSTACADEMIC AFFAIRS
K-12 PROGRAM COORDINATION
VICE PROVOST EXTENDED UNIVERSITY
ASSOC. PROVOSTACADEMIC AFFAIRS
EVENING & WEEKEND DEGREE
PROGRAM/COMMUNITY PARTNERSHIPS
DEPUTY PROVOST
ASSOC. VPCIRT
SR. PROGRAM MANAGER
NATIVE AMERICAN PROGRAMS
DIRECTOR OF RESOURCE
MANAGEMENT
DIRECTOR OFFACULTY CONTRACTS
DIRECTOR OF INSTITUTIONAL
RESEARCH
UNIVERSITYSECRETARY
DEANUNIVERSITY COLLEGEDEAN
ENGINEERING
BRANCH CAMPUSESSee Next Page
SPECIAL ASST TO THE PROVOST FOR INTERNATIONAL
AFFAIRS
DEANARTS & SCIENCES
2002-2003 UNM Fact Book - Page 132

Provost, VP for Academic Affairs: Branch Campuses2002-2003 Organizational Structure
*As of December 2002
Source: UNM Office of the President
VALENCIABRANCH DIRECTOR
Alice Letteney
LOS ALAMOSBRANCH DIRECTOR
Carlos Ramirez
GALLUPBRANCH DIRECTORBeth Miller (Interim)
TAOS BRANCH DIRECTOR
Alicia Chavez
VALENCIABRANCH
ADVISORY BOARD
LOS ALAMOSBRANCH
ADVISORY BOARDTAOS BRANCH
ADVISORY BOARD
PRESIDENT F. Chris Garcia
PROVOST, VPACADEMIC AFFAIRS
Brian Foster
GALLUPBRANCH
ADVISORY BOARD
2002-2003 UNM Fact Book - Page 133

Deputy Provost2002-2003 Organizational Structure*
*As of December 2002
Source: UNM Office of the President
DEPUTY PROVOSTRichard Holder
PROVOST, VP FORACADEMIC AFFAIRS
Brian Foster
PRESIDENTF. Chris Garcia
AIR FORCE ROTC
NAVY ROTC
INTERNATIONALPROGRAMS
• Ibero-Amer. Science Tech. Educ. Consortium (ISTEC)
LATIN AMERICAN AND IBERIAN INSTITUTE
SPANISH COLONIAL RESEARCH INSTITUTE
CARS
ARMY ROTC
2002-2003 UNM Fact Book - Page 134

Vice Provost Extended University2002-2003 Organizational Structure*
* * ** * KAFB
* * Los Alamos* Rio Rancho
* * Santa Fe* Taos
*
*As of December 2002Source: UNM Office of the President
Testing Center
GallupSpecial Projects / GrantsCurriculum Management
New Media & Extended LearningMedia TechnologyServicesNon-DegreeAdvisement
PRESIDENT F. Chris Garcia
VICE PROVOST EXTENDED UNIVERSITY
Jeronimo Dominguez
PROVOST, VPACADEMIC AFFAIRS
Brian Foster
SUPPORTSERVICES
FIELD CENTERS
OPERATIONS
2002-2003 UNM Fact Book - Page 135
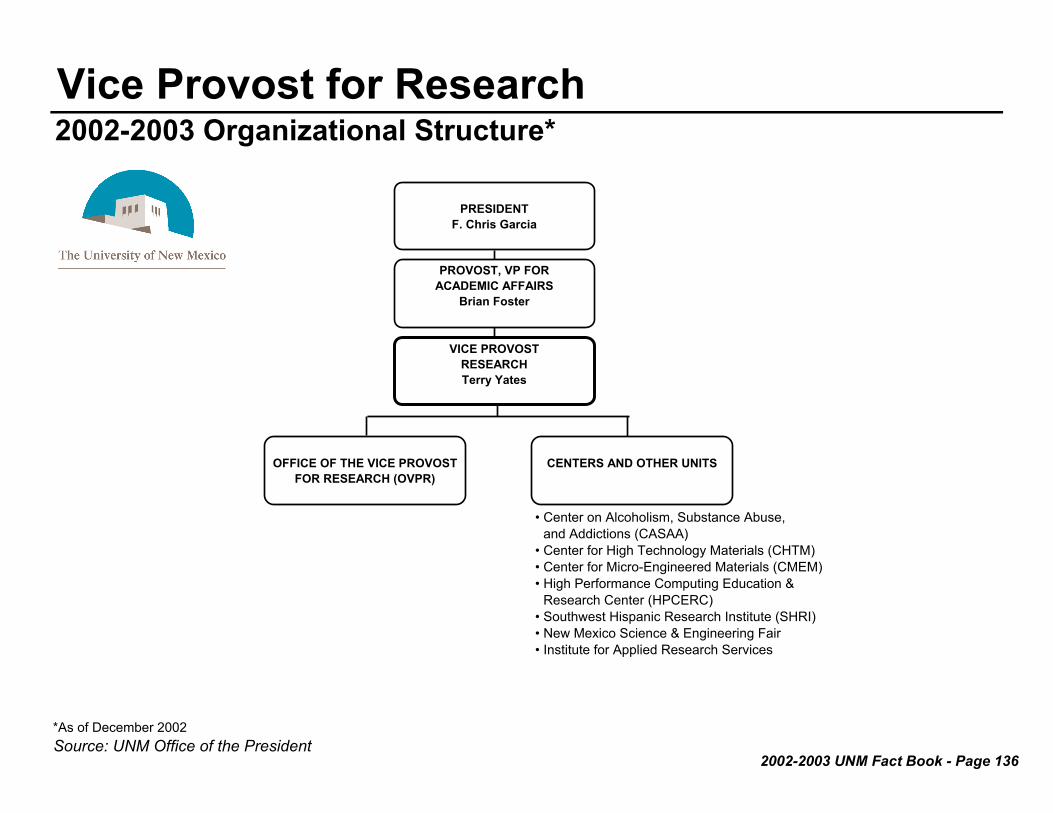
Vice Provost for Research 2002-2003 Organizational Structure*
*As of December 2002Source: UNM Office of the President
VICE PROVOSTRESEARCHTerry Yates
OFFICE OF THE VICE PROVOST FOR RESEARCH (OVPR)
• Center on Alcoholism, Substance Abuse, • and Addictions (CASAA)• Center for High Technology Materials (CHTM)• Center for Micro-Engineered Materials (CMEM)• High Performance Computing Education &• Research Center (HPCERC)• Southwest Hispanic Research Institute (SHRI)• New Mexico Science & Engineering Fair• Institute for Applied Research Services
PROVOST, VP FORACADEMIC AFFAIRS
Brian Foster
PRESIDENTF. Chris Garcia
CENTERS AND OTHER UNITS
2002-2003 UNM Fact Book - Page 136

Assoc. Provost, Academic Affairs2002-2003 Organizational Structure
*As of December 2002Source: UNM Office of the President
ASSOC. PROVOSTACADEMIC AFFAIRSCURRICULUM AND
INSTRUCTIONNancy Uscher
PROVOST, VP FORACADEMIC AFFAIRS
Brian Foster
PRESIDENTF. Chris Garcia
OFFICE OF THEREGISTRAR
OUTCOMESASSESSMENT
I-TEL PROJECT(STUDENT NEED DRIVEN
CURRICULUM MANAGEMENT)
HEWLETT PROGRAM
VETERANSOFFICE
CENTER FOR THE ADVANCEMENT OF
SCHOLARSHIP IN TEACHING AND LEARNING (CASTL)
TEACHING ASSISTANTRESOURCE CENTER
TEACHING AWARDS
CENTER FOR ACADEMIC PROGRAM SUPPORT (CAPS)
2002-2003 UNM Fact Book - Page 137
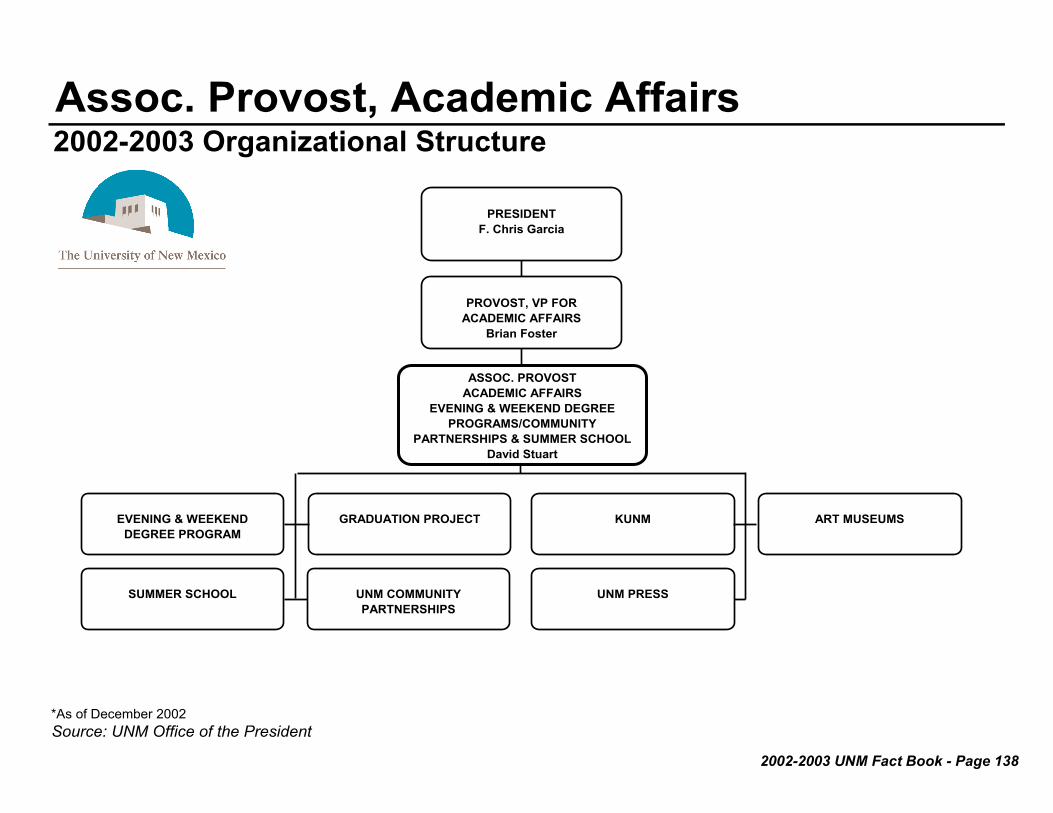
Assoc. Provost, Academic Affairs2002-2003 Organizational Structure
*As of December 2002Source: UNM Office of the President
ASSOC. PROVOSTACADEMIC AFFAIRS
EVENING & WEEKEND DEGREE PROGRAMS/COMMUNITY
PARTNERSHIPS & SUMMER SCHOOLDavid Stuart
PROVOST, VP FORACADEMIC AFFAIRS
Brian Foster
PRESIDENTF. Chris Garcia
UNM COMMUNITY PARTNERSHIPS
EVENING & WEEKENDDEGREE PROGRAM
UNM PRESS
KUNMGRADUATION PROJECT
SUMMER SCHOOL
ART MUSEUMS
2002-2003 UNM Fact Book - Page 138

Associate Provost, Academic Affairs2002-2003 Organizational Structure
*As of December 2002
Source: UNM Office of the President
ASSOC. PROVOSTACADEMIC AFFAIRS
K-12 PROGRAM COORDINATIONIgnacio Cordova
PRESIDENTF. Chris Garcia
NCA OFFICER FORK-12 SCHOOLS
PROVOST, VP FOR ACADEMIC AFFAIRS
Brian Foster
2 YEAR COLLEGELIASON
K-12 SCHOOLSLIASON
2002-2003 UNM Fact Book - Page 139

VP, Business & Finance2002-2003 Organizational Structure*
*As of December 2002Source: UNM Office of the President
PRESIDENT F. Chris Garcia
VP BUSINESS & FINANCE
Julie Weaks Gutierrez
ASSOC. VP FORFINANCE & ADMIN.,
HSC
ASSOC. VPAUXILIARY
ENTERPRISESPHYSICAL PLANT
UNIV. BUSINESS POLICIES
ASSOC. VP HUMAN RESOURCES
RISK MANAGEMENTFACILITY PLANNINGBUDGET
REAL ESTATEELECTRONIC
MANAGEMENT INFORMATION
PROJECT
BRANCH CAMPUSES FISCAL OVERSIGHT
ATHLETICS ASSOC. VP CONTROLLER
PUBLIC EVENT MANAGEMENT GROUP
PARKING & TRANSPORTATION
TICKETING SERVICES
GOLF COURSES
BUSINESS SERVICES
BOOKSTORES
ASSISTANT TO THE VICE-PRESIDENT
STAFF COUNCIL
LODESTARASTRONOMY
CENTER
TRANSPORTATION/INFORMATION PROJECT
COORDINATOR
2002-2003 UNM Fact Book - Page 140
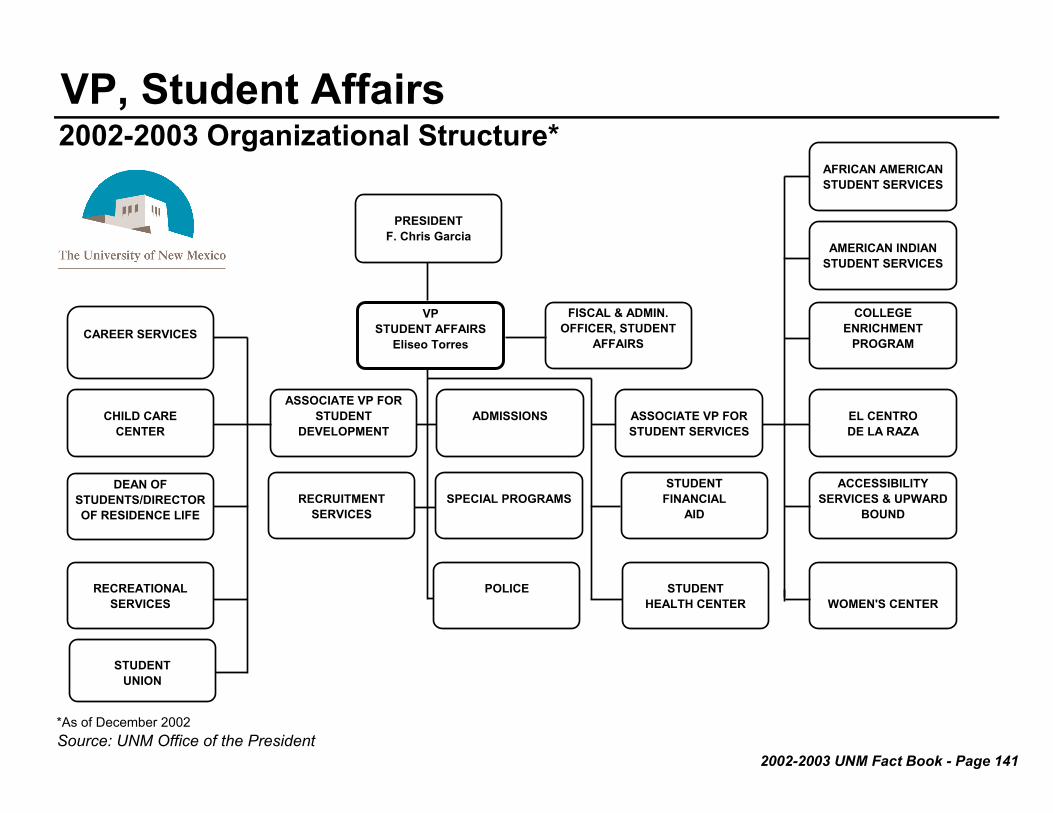
VP, Student Affairs2002-2003 Organizational Structure*
*As of December 2002Source: UNM Office of the President
PRESIDENTF. Chris Garcia
VPSTUDENT AFFAIRS
Eliseo Torres
FISCAL & ADMIN. OFFICER, STUDENT
AFFAIRS
RECRUITMENTSERVICES
STUDENTUNION
DEAN OF STUDENTS/DIRECTOR OF RESIDENCE LIFE
ASSOCIATE VP FOR STUDENT
DEVELOPMENT
RECREATIONALSERVICES
STUDENTHEALTH CENTER
STUDENTFINANCIAL
AIDSPECIAL PROGRAMS
POLICE
ADMISSIONS ASSOCIATE VP FOR STUDENT SERVICES
AFRICAN AMERICAN STUDENT SERVICES
AMERICAN INDIAN STUDENT SERVICES
COLLEGE ENRICHMENT
PROGRAM
EL CENTRO DE LA RAZA
ACCESSIBILITY SERVICES & UPWARD
BOUND
WOMEN'S CENTER
CHILD CARECENTER
CAREER SERVICES
2002-2003 UNM Fact Book - Page 141

VP, Institutional Advancement2002-2003 Organizational Structure*
*As of December 2002
Source: UNM Office of the President
PRESIDENTF. Chris Garcia
VP ADVANCEMENT Judy Jones
ALUMNIASSOCIATION
ALUMNIRELATIONS
UNMFOUNDATION INC.
DEVELOPMENTOFFICE
KNMETV
COMMUNICATIONS/ MARKETING
PUBLICAFFAIRS
2002-2003 UNM Fact Book - Page 142
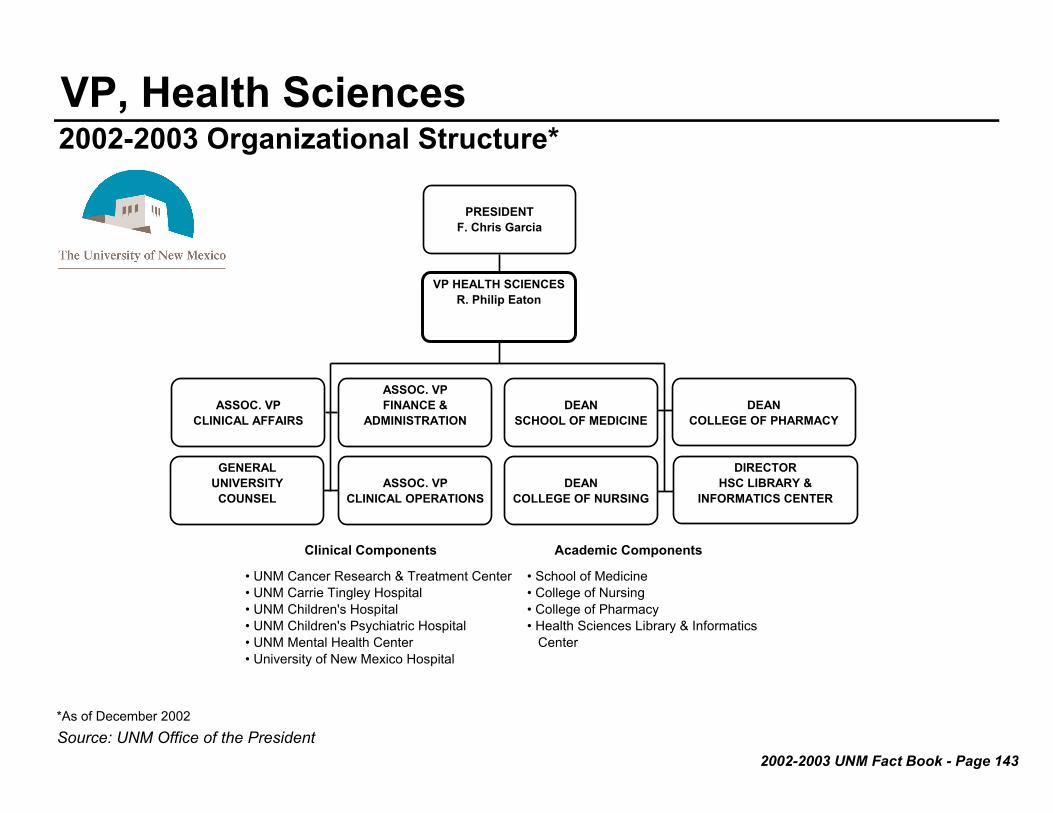
VP, Health Sciences2002-2003 Organizational Structure*
*As of December 2002Source: UNM Office of the President
ASSOC. VPCLINICAL OPERATIONS
DEANSCHOOL OF MEDICINE
DEANCOLLEGE OF NURSING
DEANCOLLEGE OF PHARMACY
DIRECTORHSC LIBRARY &
INFORMATICS CENTER
GENERALUNIVERSITY
COUNSEL
ASSOC. VP CLINICAL AFFAIRS
ASSOC. VPFINANCE &
ADMINISTRATION
PRESIDENTF. Chris Garcia
VP HEALTH SCIENCESR. Philip Eaton
Clinical Components Academic Components
• UNM Cancer Research & Treatment Center• UNM Carrie Tingley Hospital• UNM Children's Hospital • UNM Children's Psychiatric Hospital• UNM Mental Health Center• University of New Mexico Hospital
• School of Medicine• College of Nursing• College of Pharmacy• Health Sciences Library & Informatics Center
2002-2003 UNM Fact Book - Page 143

UNM Board of Regents2002-2003 Organizational Structure
*As of December 2002Source: UNM Office of the President
UNM BOARDOF
REGENTS
• Anderson Schools of Management• Foundation• Biological Society of NM• Friends of Art of UNM Museum, Inc.• Friends of UNM Library, Inc.• Friends of UNM Music, Inc.• Law School Foundation• Maxwell Museum Foundation• NM Technological Innovation• Center• Branch Advisory Groups• KUNM Board• KNME Board• Harwood Museum Foundation
• HSC Clinical Operations Board• University Physician Associates• Khatali Alumni Club
• UNM Lobo Club• UNM Foundation• Science & Technology • Corporation @ UNM• Lobo Energy, Inc.
Organizations Reporting to UNM Board of Regentsthrough Regents' Subcommittees
ACADEMIC/STUDENTAFFAIRS COMMITTEE
FINANCE & FACILITIESCOMMITTEE
HEALTH SCIENCESCOMMITTEE
2002-2003 UNM Fact Book - Page 144