aoe 3054 - dept.aoe.vt.eduaborgolt/aoe3054/manual/inst3/aoe3054_session...• all operations will be...
TRANSCRIPT
AOE 3054
Digital Measurements:
Data Acquisition with LabView
1
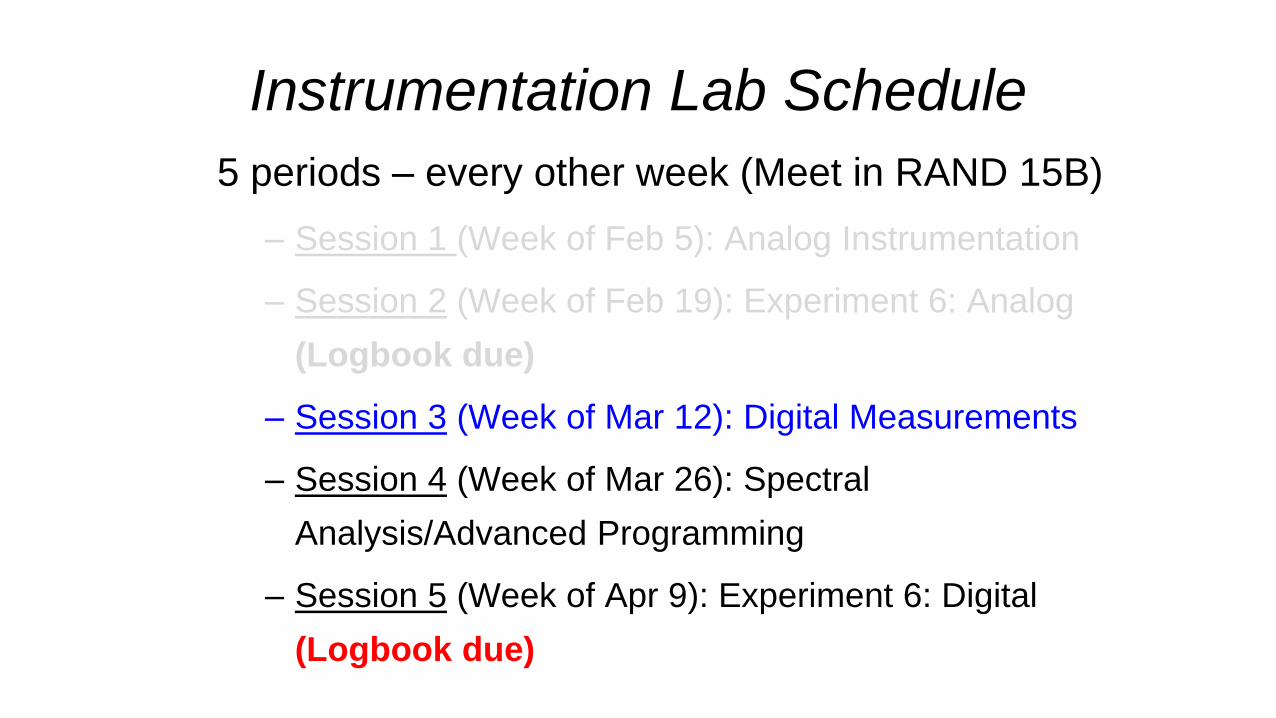
Instrumentation Lab Schedule
5 periods – every other week (Meet in RAND 15B)
– Session 1 (Week of Feb 5): Analog Instrumentation
– Session 2 (Week of Feb 19): Experiment 6: Analog
(Logbook due)
– Session 3 (Week of Mar 12): Digital Measurements
– Session 4 (Week of Mar 26): Spectral
Analysis/Advanced Programming
– Session 5 (Week of Apr 9): Experiment 6: Digital
(Logbook due)
Goals of the session
• Understand the basics of making the NI myDAQ work for
controlling an experiment
• Build the data acquisition and control techniques needed
to digitally run Experiment 6 in LabVIEW
– Basic scope
– Aliasing
– Calibrating and ultimately controlling the function generator
• IT IS STRONGLY SUGGESTED TO SAVE THE CODES
YOU ARE DEVELOPING/MODIFYING AS OFTEN AS
POSSIBLE 3

Digital Measurements Lab Agenda
1. Experiment 6 Digital introduction
2. Measuring function generator input and beam response
using myDAQ
3. Calibrating function generators
4. Find natural frequency of beam using myDAQ
5. myDAQ Resolution Example
6. Modify Homework codes
4
Experiment 6 Digital Introduction
• In the second Instrumentation Lab (Experiment 6a),
you manually controlled a function generator to
excite a beam and used an oscilloscope to
measure the response of that beam.
• Week 5’s Instrumentation Lab is essentially a redo
of the first Experiment 6, but will incorporate new
digital measurement techniques to automate most
of the data taking.
5

Experiment 6 Digital Introduction
• Specifically, you will be using the myDAQ to
output a voltage signal that will control the function
generator. The myDAQ will also measure the
function generator output as well as the output
from the proximeter.
• All operations will be controlled via Labview, using
a code that builds off of the homework
assignments and will be completed in
Instrumentation Lab 4.
• Further details of Experiment 6 Digital can be
found on the course website. 6

Digital Measurements Lab Agenda
1. Experiment 6 Digital introduction
2. Measuring function generator input and beam response
using myDAQ
3. Calibrating function generators
4. Find natural frequency of beam using myDAQ
5. myDAQ Resolution Example
6. Modify Homework codes
7

Homework 3 VI
• Your Homework 3 VI’s utilized the 2 analog input
channels on the myDAQ to measure two signals.
• We will use this code again to measure and display two
signals- an excitation signal (function generator) and
response signal (proximeter)
8
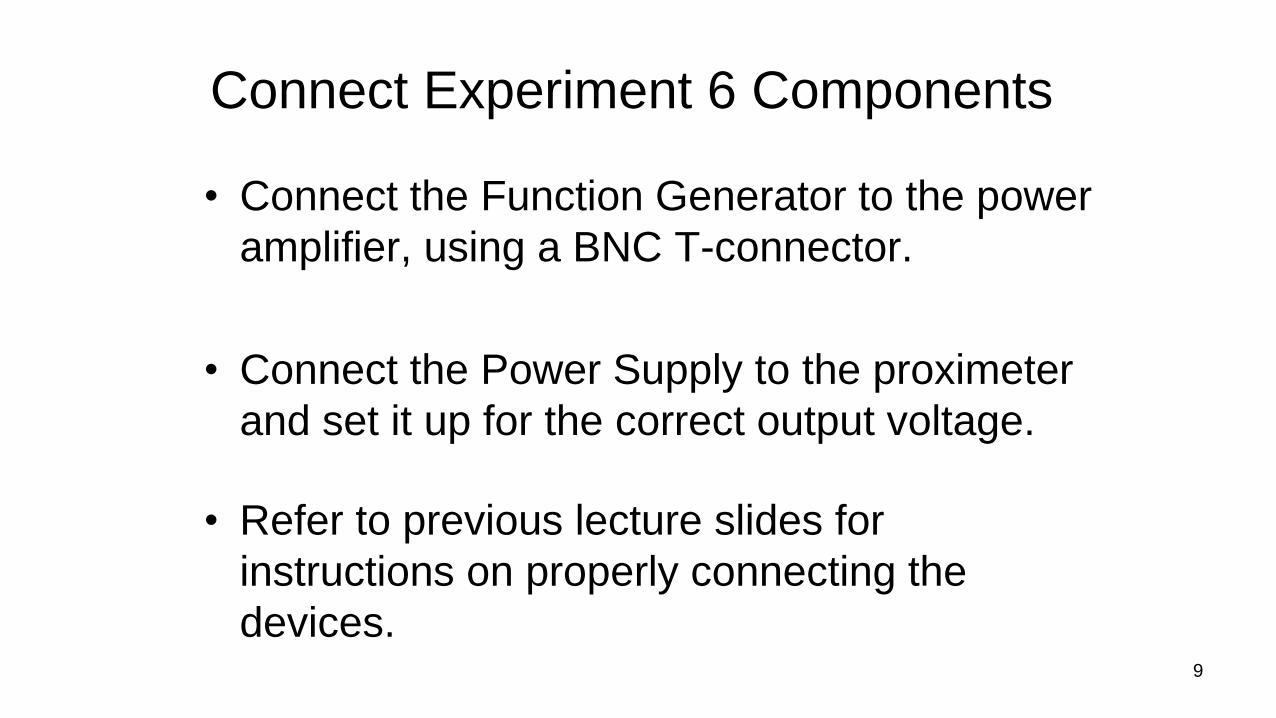
Connect Experiment 6 Components
• Connect the Function Generator to the power
amplifier, using a BNC T-connector.
• Connect the Power Supply to the proximeter
and set it up for the correct output voltage.
• Refer to previous lecture slides for
instructions on properly connecting the
devices.9
myDAQ Connections
• Connect your myDAQ to your computer using the USB
port.
• Open LabView and your functional Homework 3 VI (use
the solution if your program had errors)
10
myDAQ Connections
• BEFORE turning any of the equipment on, make
sure that you do not supply more than 20V to
the myDAQ through its analog inputs (myDAQ
Overvoltage protection: +/-30V, 20 Vrms)
• This will require connecting the excitation and
response signals to the oscilloscope and
measuring amplitudes before connecting the
myDAQ.
• A good first step is to turn the function
generator amplitude control all the way down
and ensure the amplitude control is pulled
out to produce voltage between 0 and 2V. 11
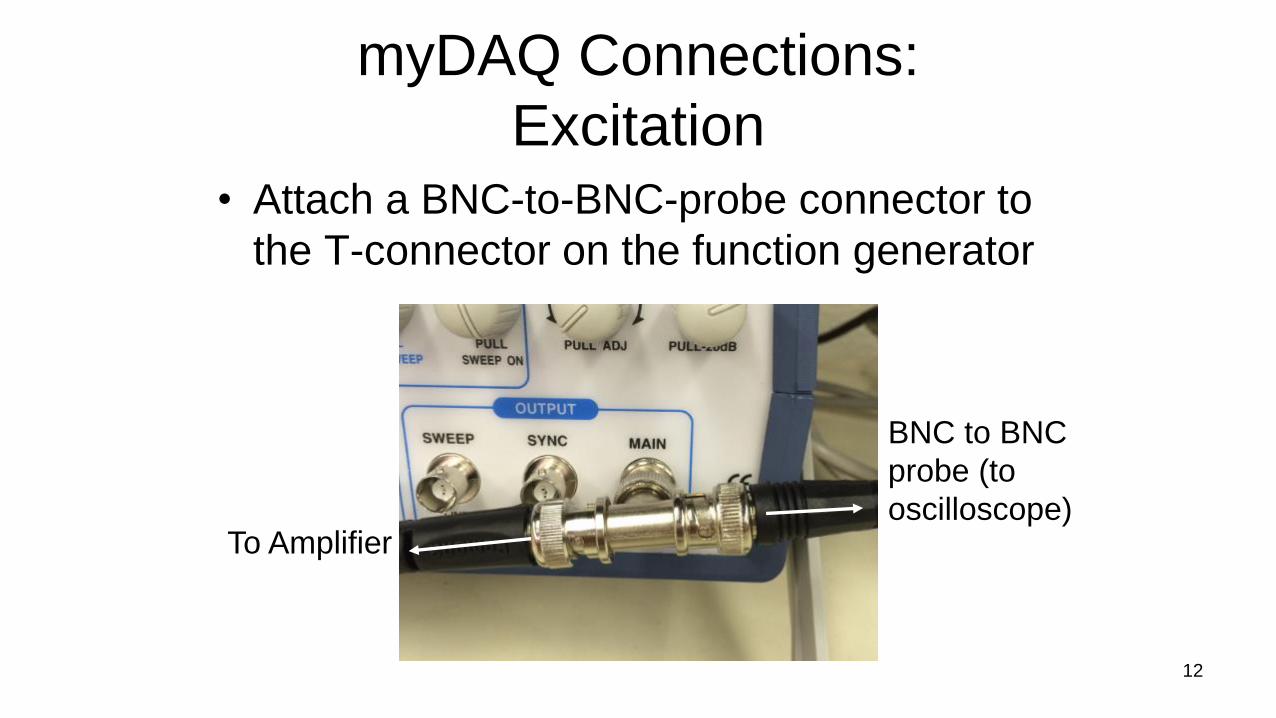
myDAQ Connections:
Excitation• Attach a BNC-to-BNC-probe connector to
the T-connector on the function generator
12
To Amplifier
BNC to BNC
probe (to
oscilloscope)
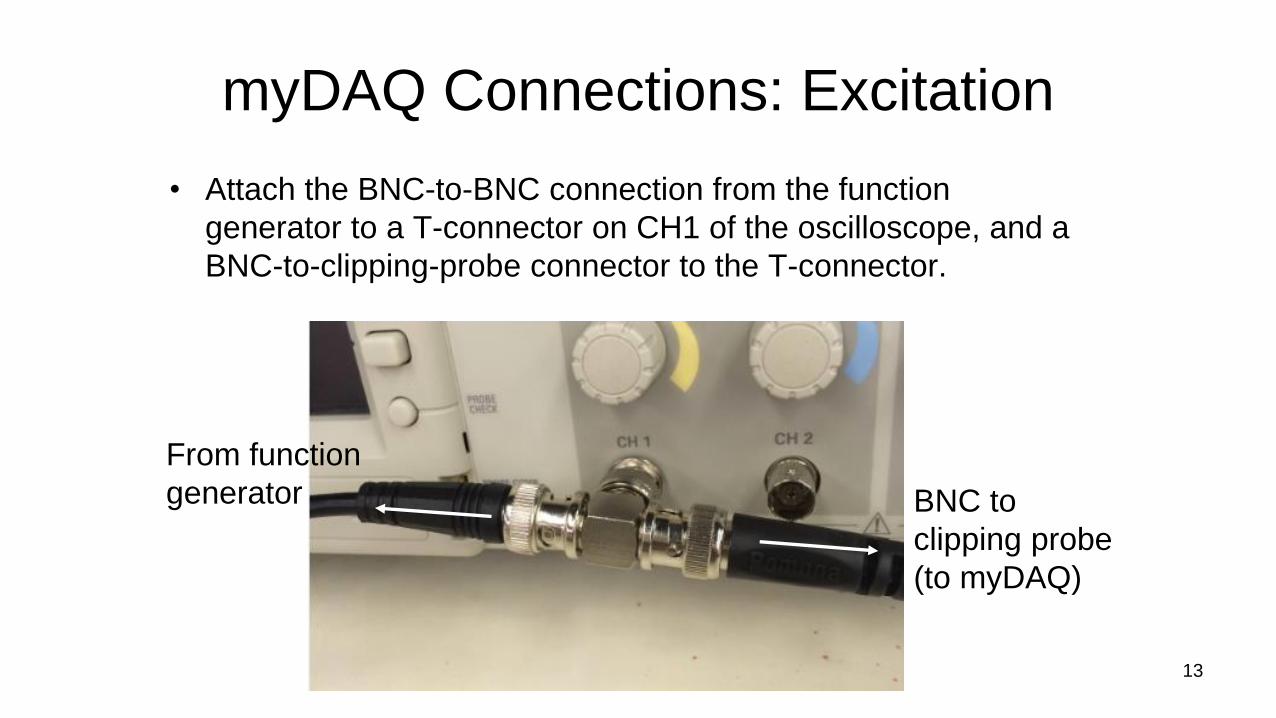
myDAQ Connections: Excitation
• Attach the BNC-to-BNC connection from the function
generator to a T-connector on CH1 of the oscilloscope, and a
BNC-to-clipping-probe connector to the T-connector.
13
From function
generator BNC to
clipping probe
(to myDAQ)

myDAQ Connections:
Excitation• Clip the two ends of
the probe to wires
and attach to the
myDAQ AI0 channel.
Make sure the red
clip goes to the 0+
channel, and black to
the 0-.
14
AI0+ AI0-
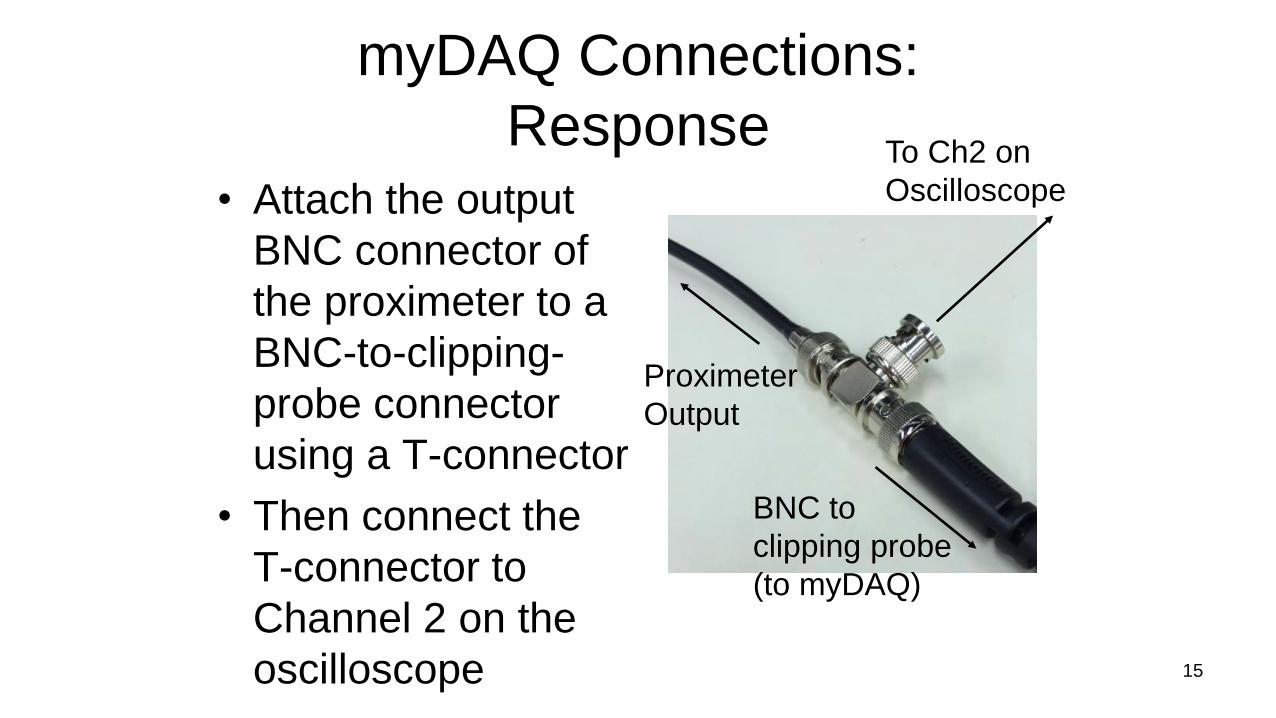
myDAQ Connections:
Response• Attach the output
BNC connector of
the proximeter to a
BNC-to-clipping-
probe connector
using a T-connector
• Then connect the
T-connector to
Channel 2 on the
oscilloscope 15
Proximeter
Output
BNC to
clipping probe
(to myDAQ)
To Ch2 on
Oscilloscope

myDAQ Connections:
Response• Clip the two ends of the clipping probe coming from the
proximeter to wires and attach them to the myDAQ AI1
channel. Make sure the red clip goes to the 1+ channel,
and black to the 1-.
16
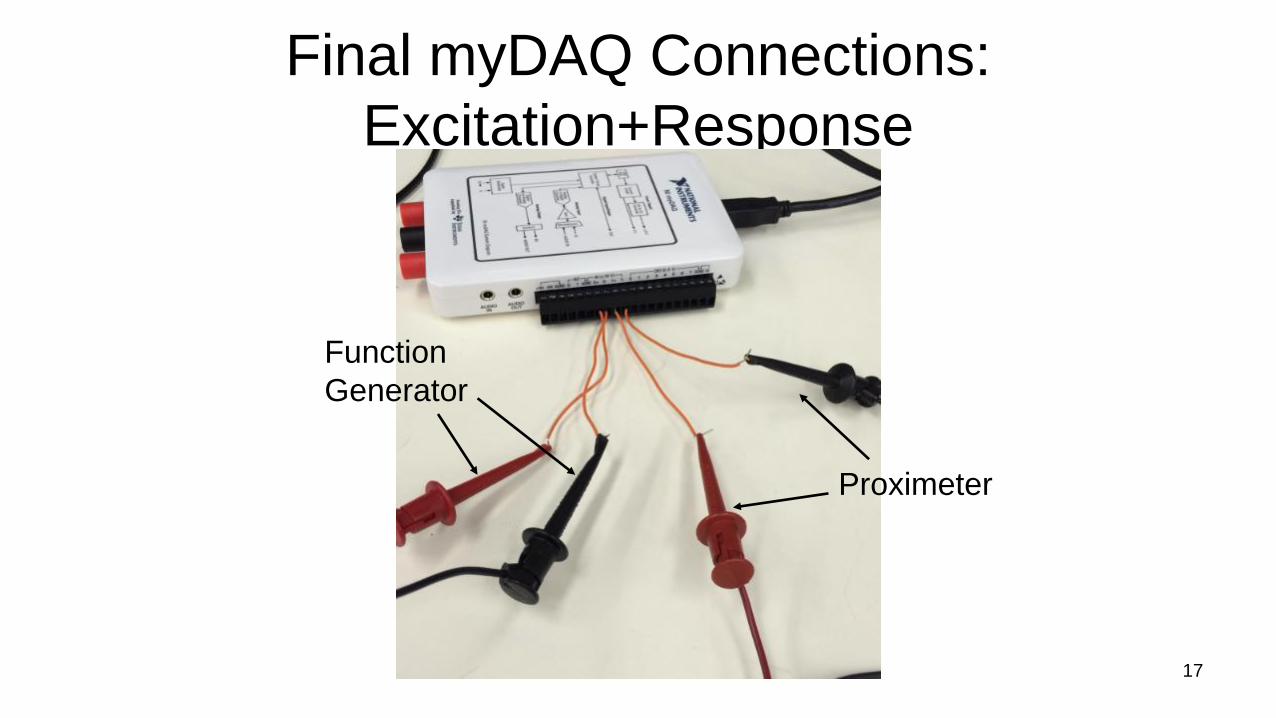
Final myDAQ Connections:
Excitation+Response
17
Function
Generator
Proximeter

Verify Connections
• Before turning equipment on, verify all of
your connections are correct and set to the
correct voltage. Ask your TA if you have
any questions.
• Then disconnect the four clip-ons
connecting the myDAQ.
• Verify that the function generator is set
to output no more than 2 V.
18

Turn on Equipment
• Once the setup is verified, turn on the function generator,
amplifier, multimeter, and power supply.
• Verify that the signals look good and within range on the
oscilloscope.
• Once you established that both excitation and response are under
20V amplitude, turn all the equipment off.
• Reconnect the myDAQ.
• You can now turn the equipment back on, your myDAQ is ready
for acquisition!
19

Using Homework 3 VI• The Homework 3 VI and subVI should already be
configured to read the correct channels on the
myDAQ.
• Verify this by opening your subVI block diagram.
20
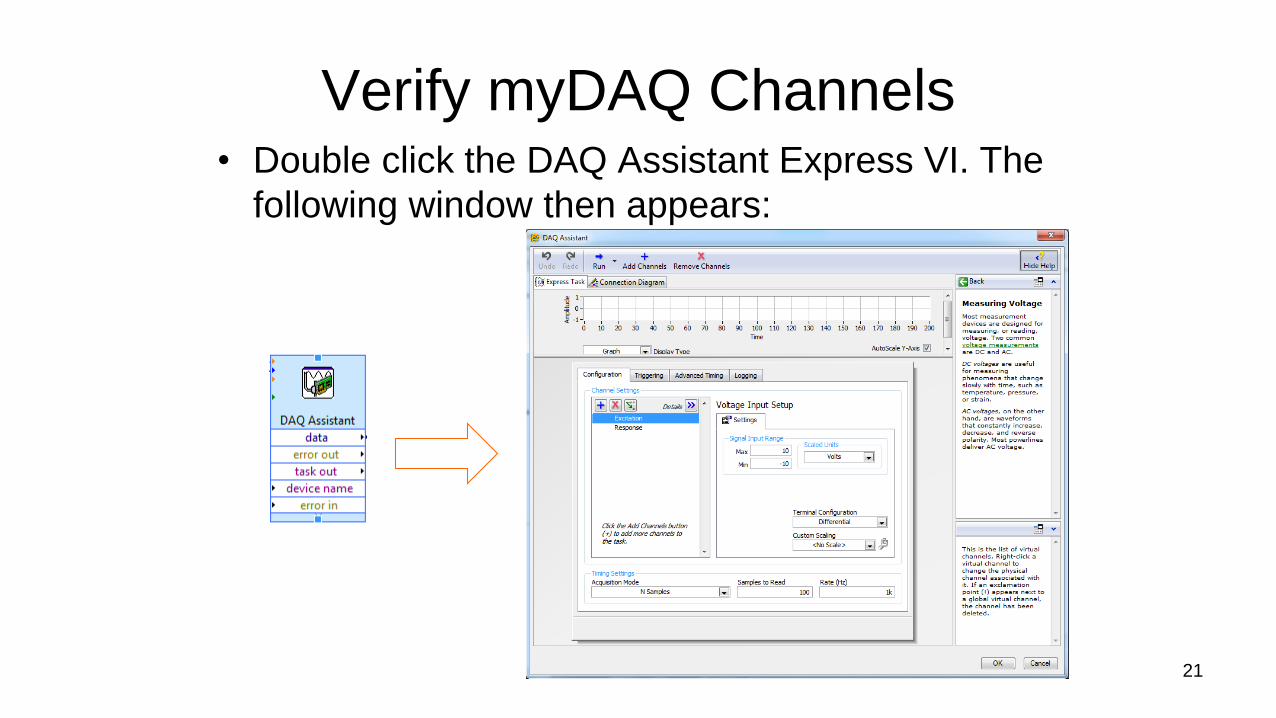
Verify myDAQ Channels• Double click the DAQ Assistant Express VI. The
following window then appears:
21
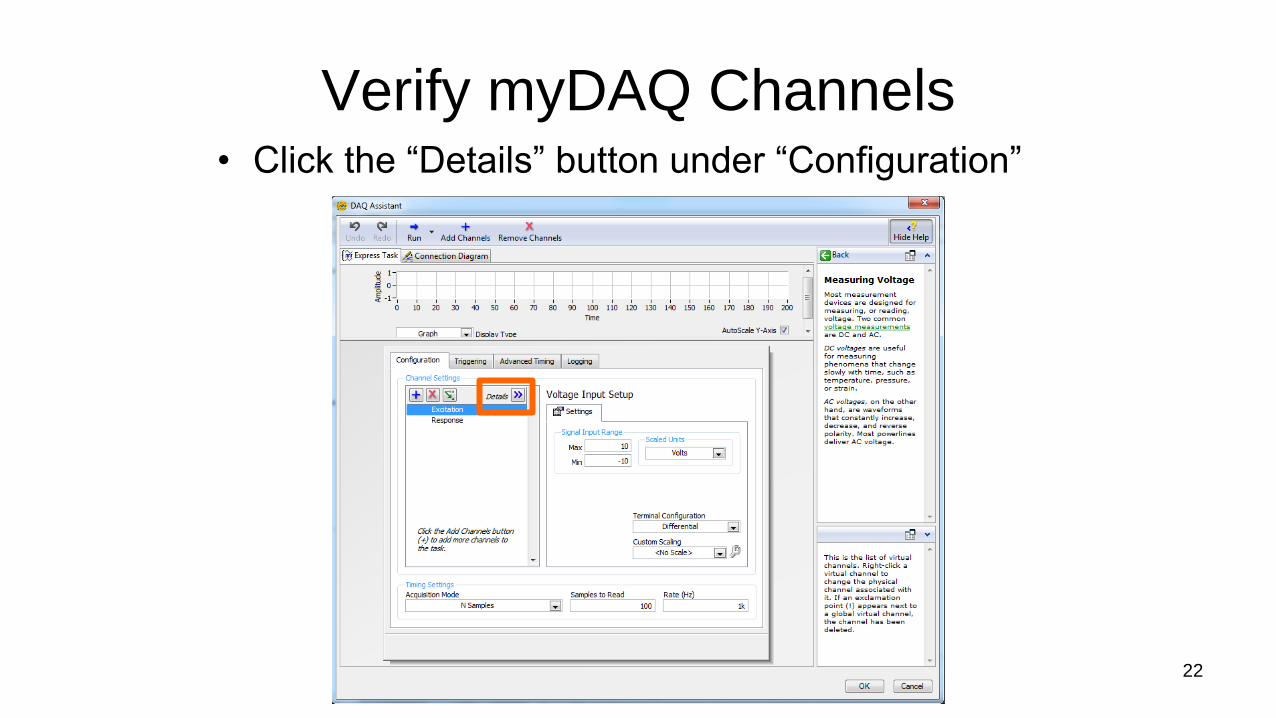
Verify myDAQ Channels• Click the “Details” button under “Configuration”
22
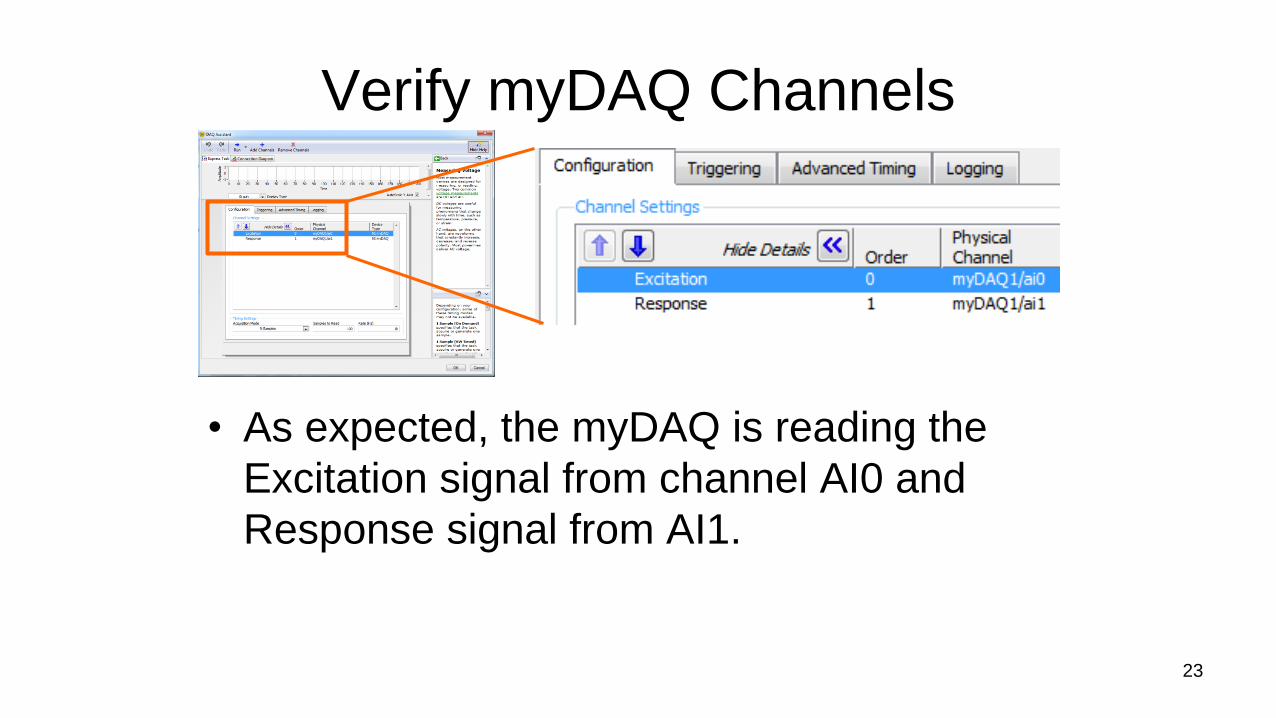
Verify myDAQ Channels
23
• As expected, the myDAQ is reading the
Excitation signal from channel AI0 and
Response signal from AI1.
Set Test Conditions
24
• Close out of the DAQ Assistant screen and return to the
Main VI front panel.
• Set the amplitude of the function generator signal up to
about 2 V using the “AMPL” knob. Make sure it is pulled
out (because when it is pushed in, it supplies a voltage up
to 20 V).
• Set the frequency of the function generator to about 12
Hz.
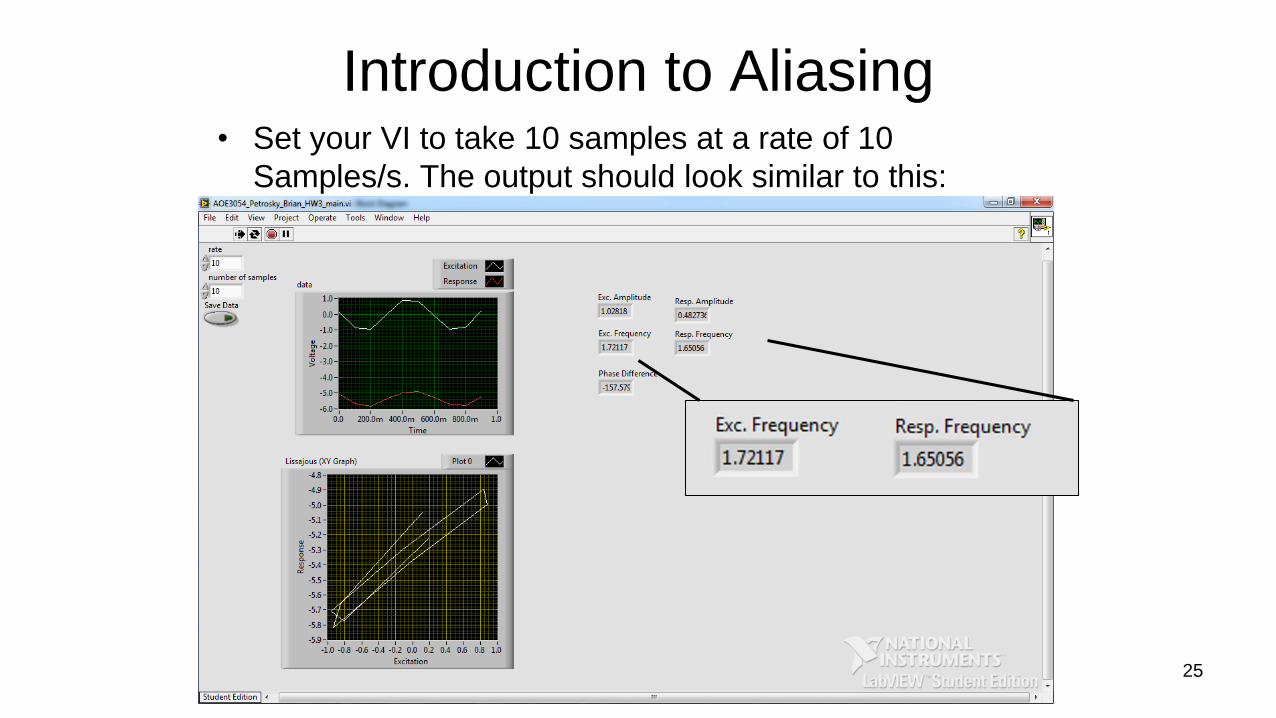
Introduction to Aliasing• Set your VI to take 10 samples at a rate of 10
Samples/s. The output should look similar to this:
25

Introduction to Aliasing• Note that even though the excitation signal is set to 12 Hz, the
sampling rate in LabView is too low to accurately resolve this
signal.
• Likewise, the response cannot be accurately characterized either.
• This is known as aliasing, and was introduced in the previous
homework. It will be discussed extensively in the next lecture and
the 4th Instrumentation Lab, and is a major concern in signal
analysis.
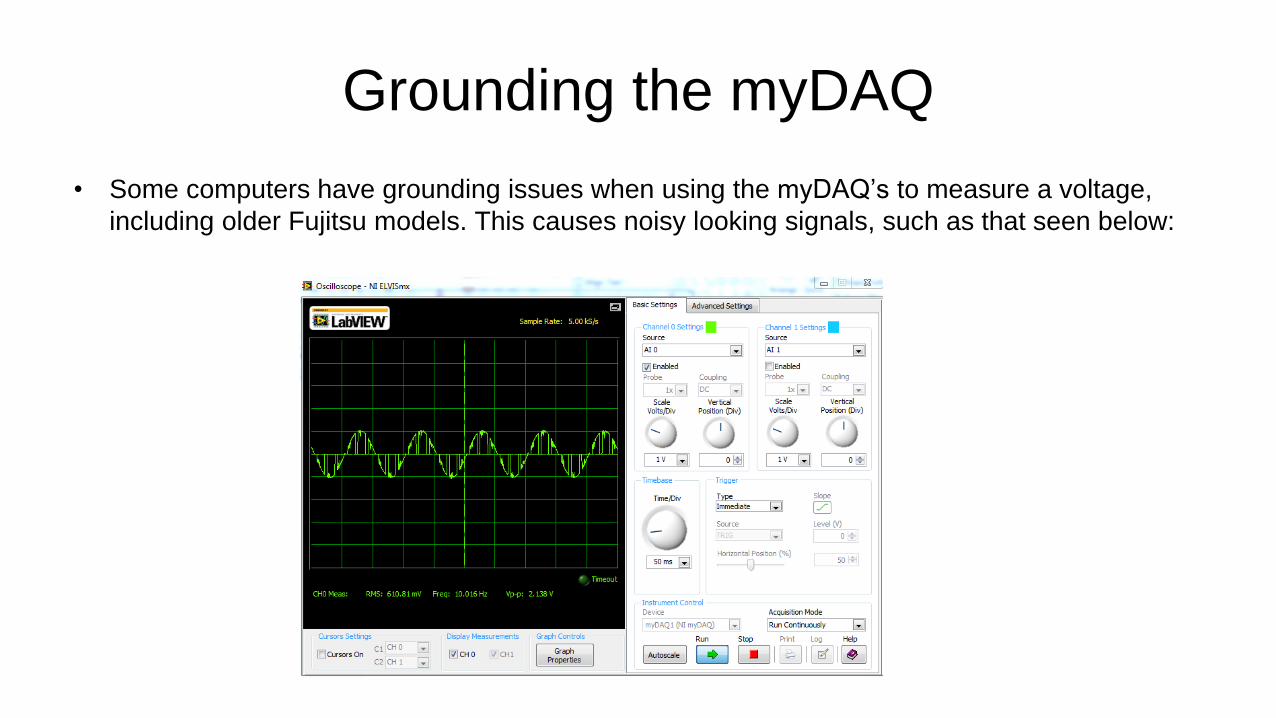
Grounding the myDAQ
• Some computers have grounding issues when using the myDAQ’s to measure a voltage,
including older Fujitsu models. This causes noisy looking signals, such as that seen below:
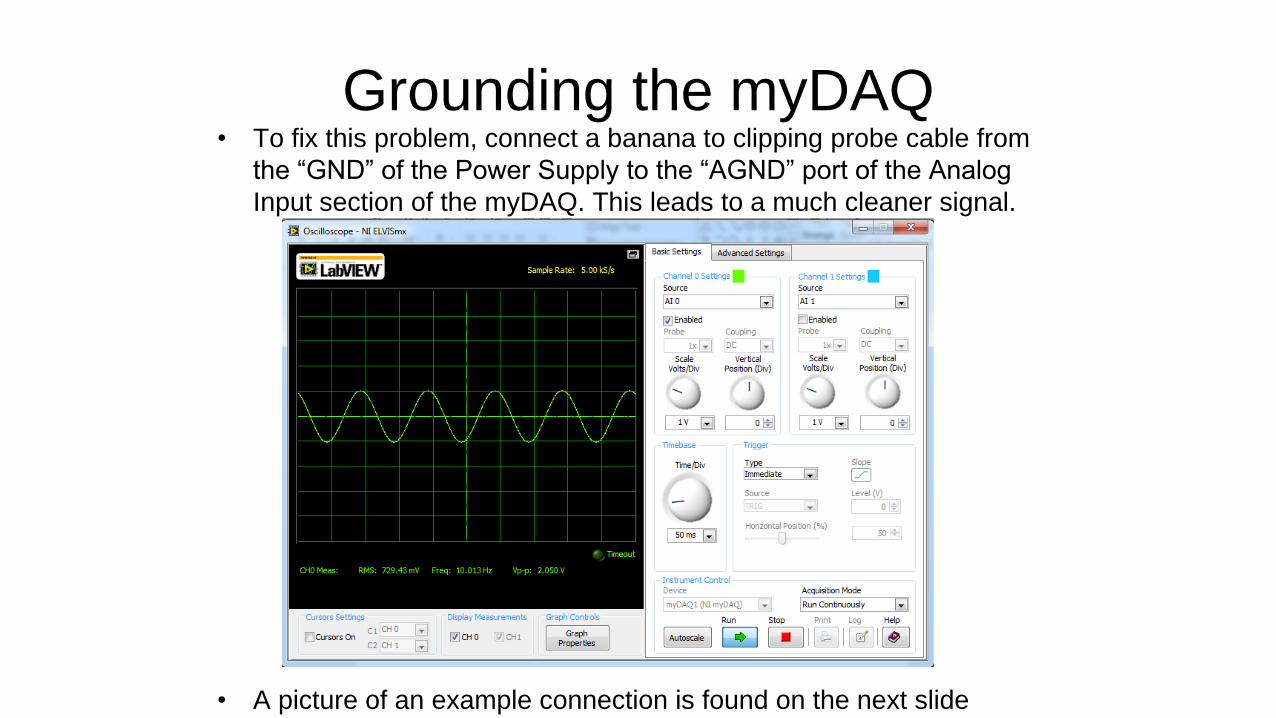
Grounding the myDAQ• To fix this problem, connect a banana to clipping probe cable from
the “GND” of the Power Supply to the “AGND” port of the Analog
Input section of the myDAQ. This leads to a much cleaner signal.
• A picture of an example connection is found on the next slide
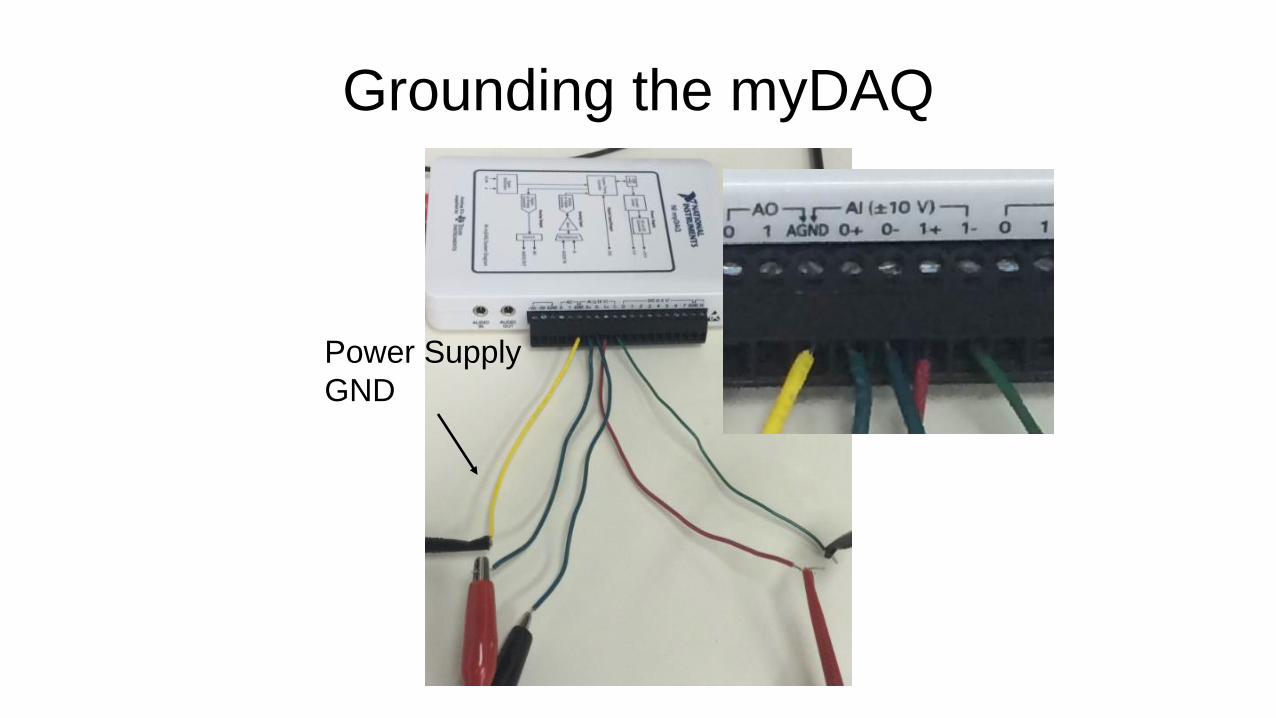
Grounding the myDAQ
Power Supply
GND

Increase Sampling Rate
• Stop the program and increase the sampling rate to 1000
Samples/S, and increase the number of samples to 1000.
• Now, at this higher sampling rate, the correct signals can
be determined (see front panel screenshot on next slide).
30

Increased Sampling Rate
31
Find Approximate Natural Frequency
• Adjust the function generator frequency until it reaches near the
natural frequency.
– Note: It will be challenging to settle on the exact frequency. The function
generators are sensitive. As you approach natural frequency, make small
adjustments and let the beam settle for a few seconds after each
adjustment.
• In this scenario, it is easiest to spot the natural frequency using
the Lissajous plot.
• At the natural frequency, the Lissajous plot forms an ellipse with
vertical and horizontal axes.
• Write down the frequency you settled on; we will come back to
this later.32
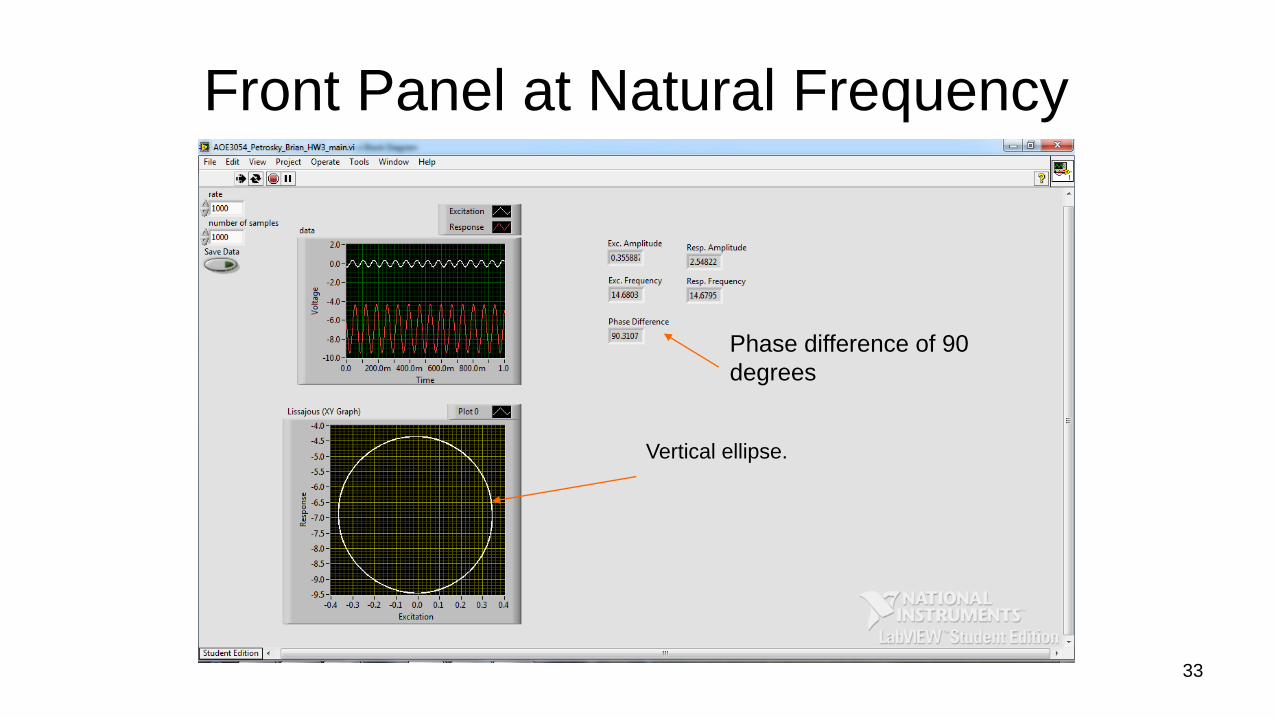
Front Panel at Natural Frequency
33
Phase difference of 90
degrees
Vertical ellipse.

Turn Off Equipment
• Shut off all of the equipment to prepare for the next
phase of today’s lab.
34
Applications to Dynamic Beam
• Two inputs allow force and displacement voltages to be
measured.
• Voltages converted to force and distance (through coil
and proximeter calibrations).
• Dynamic flexibility and spring constants measured at low
frequencies and the result displayed.
• Data file saved and analyzed (see Homework 3 guide).
35
Digital Measurements Lab Agenda
1. Experiment 6 Digital introduction
2. Measuring function generator input and beam response
using myDAQ
3. Calibrating function generators
4. Find natural frequency of beam using myDAQ
5. myDAQ Resolution Example
6. Modify Homework codes
36

What else is needed for Exp 6?• We want to write a program that will automatically and systematically
determine some parameters of the vibrating beam system like:
– Finding the stiffness k
– Finding the natural frequency
– Finding the resonant frequency
• This will require the code to vary the excitation frequency and record the
beam response.
• Therefore, we need to find a way to control the function generator from
LabVIEW (we will see later we can use the myDAQ as a function generator
as well).
• The output frequency of the function generator can be controlled by providing
a DC voltage to the generator. The output frequency is linearly proportional to
the DC voltage level.
37

Varying Function Generator Frequency
• The function generator frequency can be varied by sending a DC
voltage to the VCF (Voltage Controlled Frequency) BNC connector on
the front of the function generator.
• The DC voltage signal will be produced by the Analog Output of the
myDAQ.
– Note: the myDAQ can output +-2V or +-10V
• Varying the myDAQ voltage will vary the output frequency of the
function generator.
• To produce a given frequency, we need to know the relationship
between myDAQ DC ouput voltage and the generator output frequency
i.e. we need to calibrate the function generator.
• First, we need to set up the DAQ Assistant to Output an analog signal.
38

Rename Labview VI
• We will now build off of the code used so far in the lab.
• Save your current VI-the main VI from Homework 3-as a
new file (i.e. Name_InstrumentationLab3, etc.)
• We will then add a second DAQ assistant, this time to
generate a DC signal to be fed to the function generator.
39

Configuring the DAQ for Analog Output
From the Block Diagram of your VI, Right click and select Input, DAQ Assistant.40

Place VI on the Diagram
41
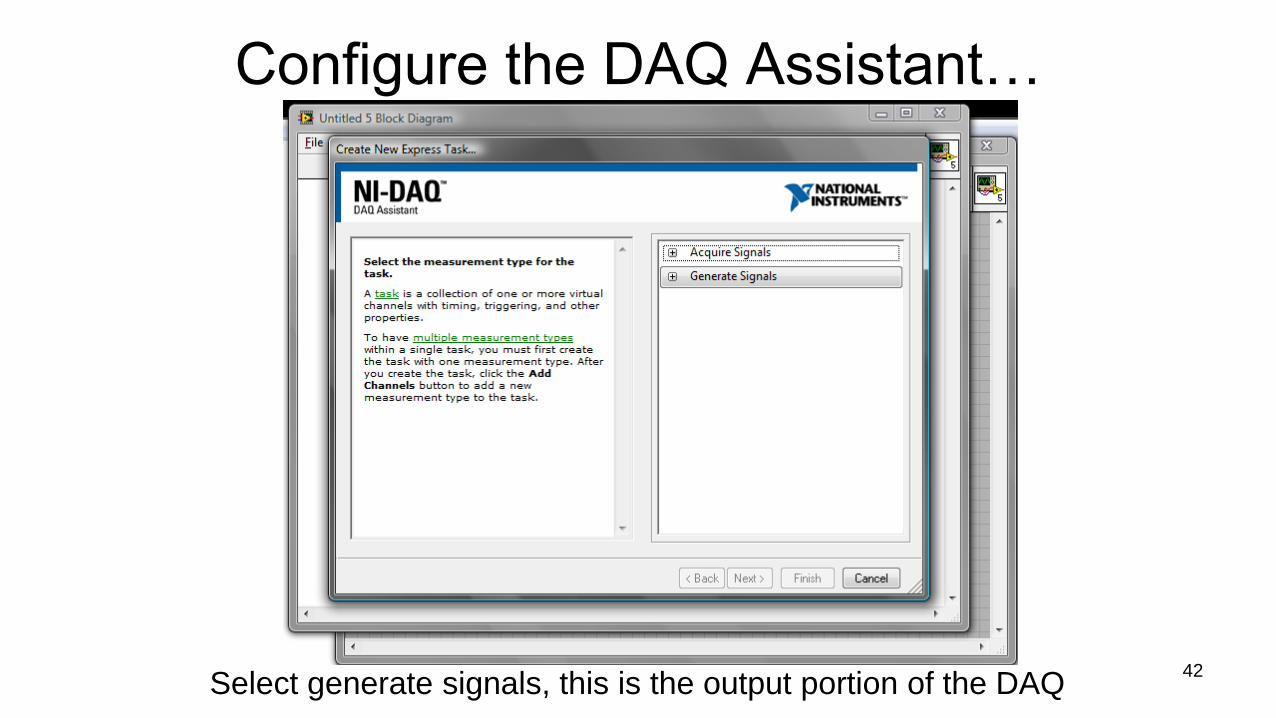
Configure the DAQ Assistant…
Select generate signals, this is the output portion of the DAQ42

Configure the DAQ Assistant…
Select Analog output43
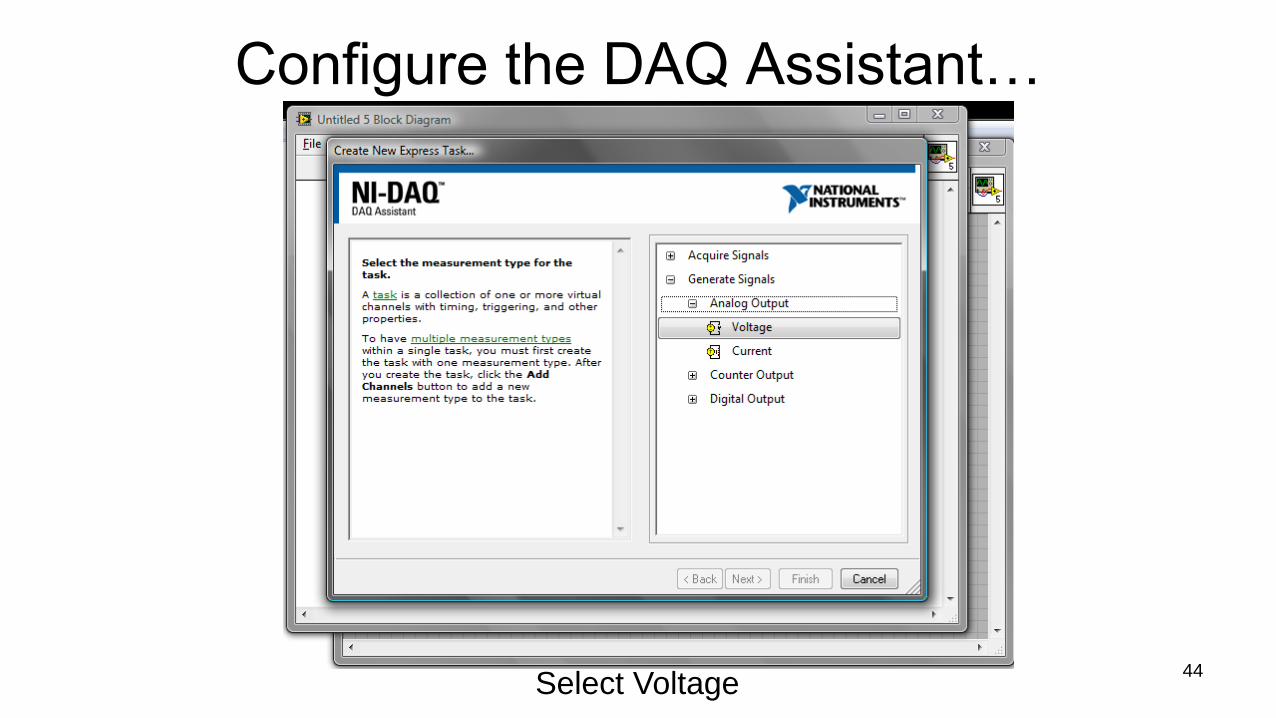
Configure the DAQ Assistant…
Select Voltage44
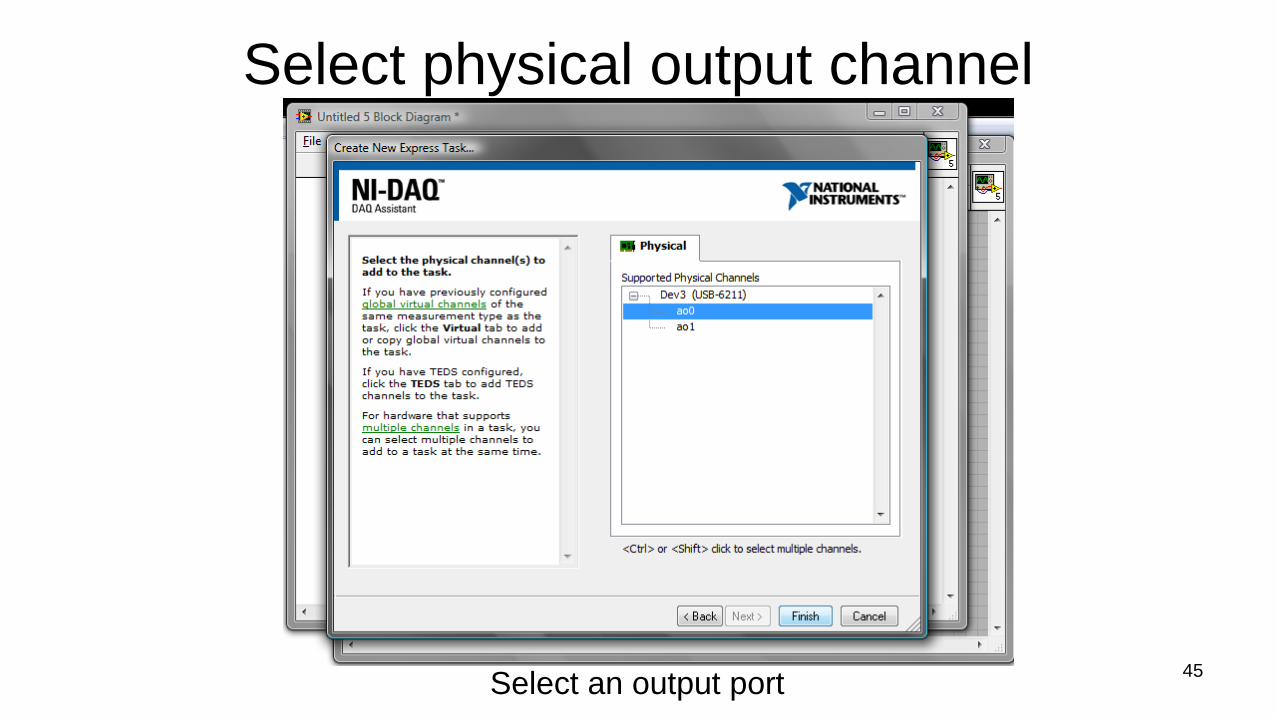
Select physical output channel
Select an output port45
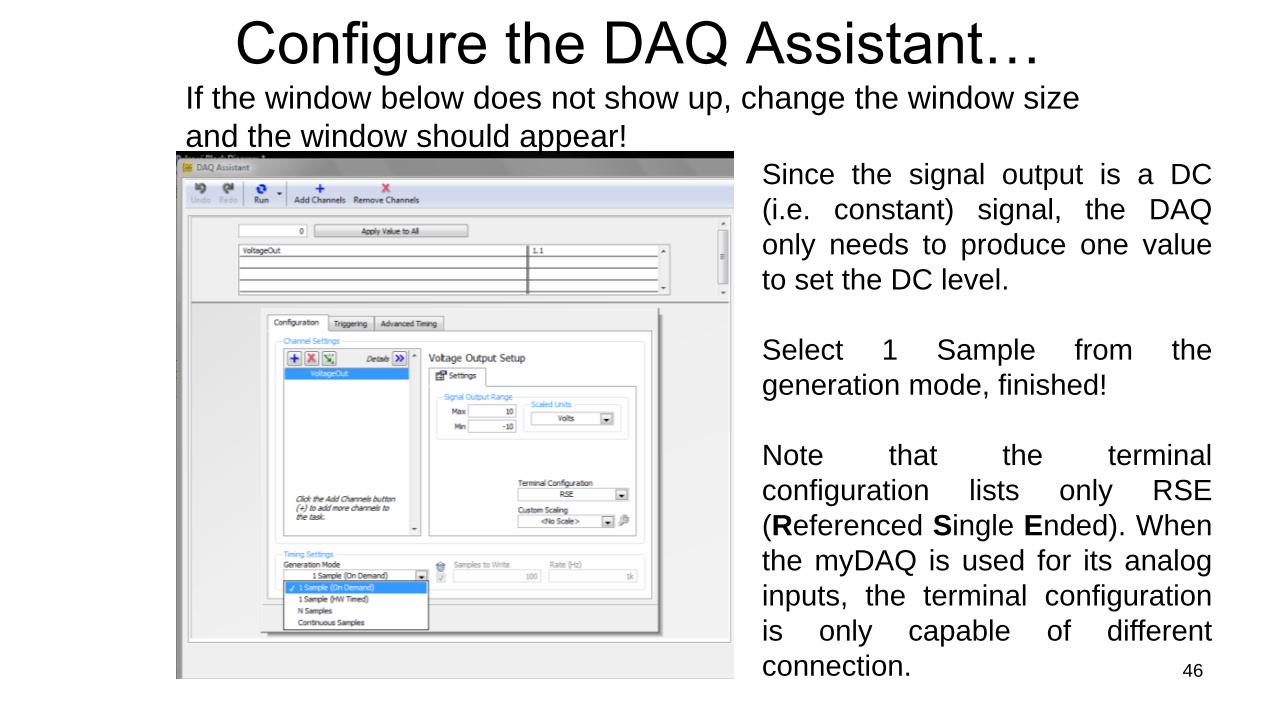
Configure the DAQ Assistant…
Since the signal output is a DC
(i.e. constant) signal, the DAQ
only needs to produce one value
to set the DC level.
Select 1 Sample from the
generation mode, finished!
Note that the terminal
configuration lists only RSE
(Referenced Single Ended). When
the myDAQ is used for its analog
inputs, the terminal configuration
is only capable of different
connection.
If the window below does not show up, change the window size
and the window should appear!
46

Analog Output Terminals
• Connect bare wires to the A0 0 and AGND terminals on the DAQ by
inserting the bare ends of the leads into the appropriate terminals and
tightening the screw with the included screwdriver.
• Connect a BNC-to-clipping-probe connector to the DAQ (RED clip to
the lead for A0 0 and a BLACK clip to the lead for AGND).
• Note that for all of these connections discussed today, either a BNC to
alligator clip or BNC-to-clipping-probe connector will work
47
• Single ended connection implies
that the signal will be produced
between one analog output port
channel and the ground (the
“reference” in RSE)
• The ground channel on the DAQ
is labelled AGND (Analog
GrouND)
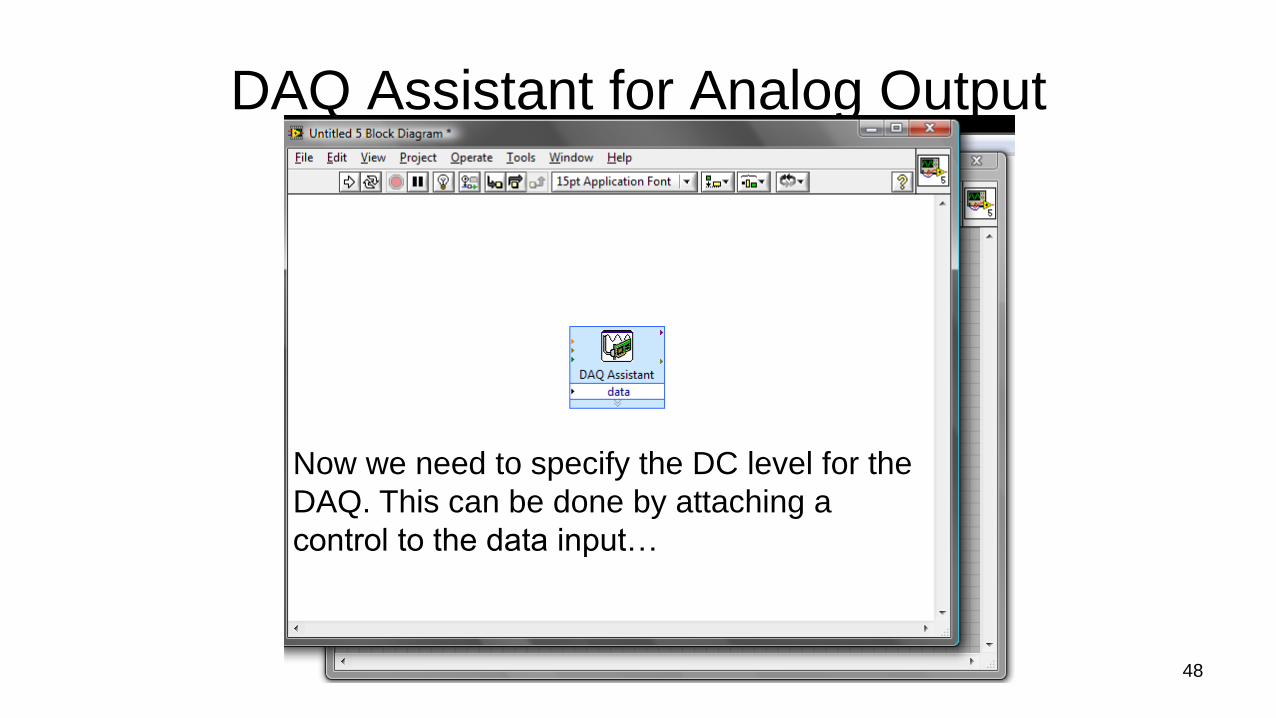
DAQ Assistant for Analog Output
Now we need to specify the DC level for the
DAQ. This can be done by attaching a
control to the data input…
48
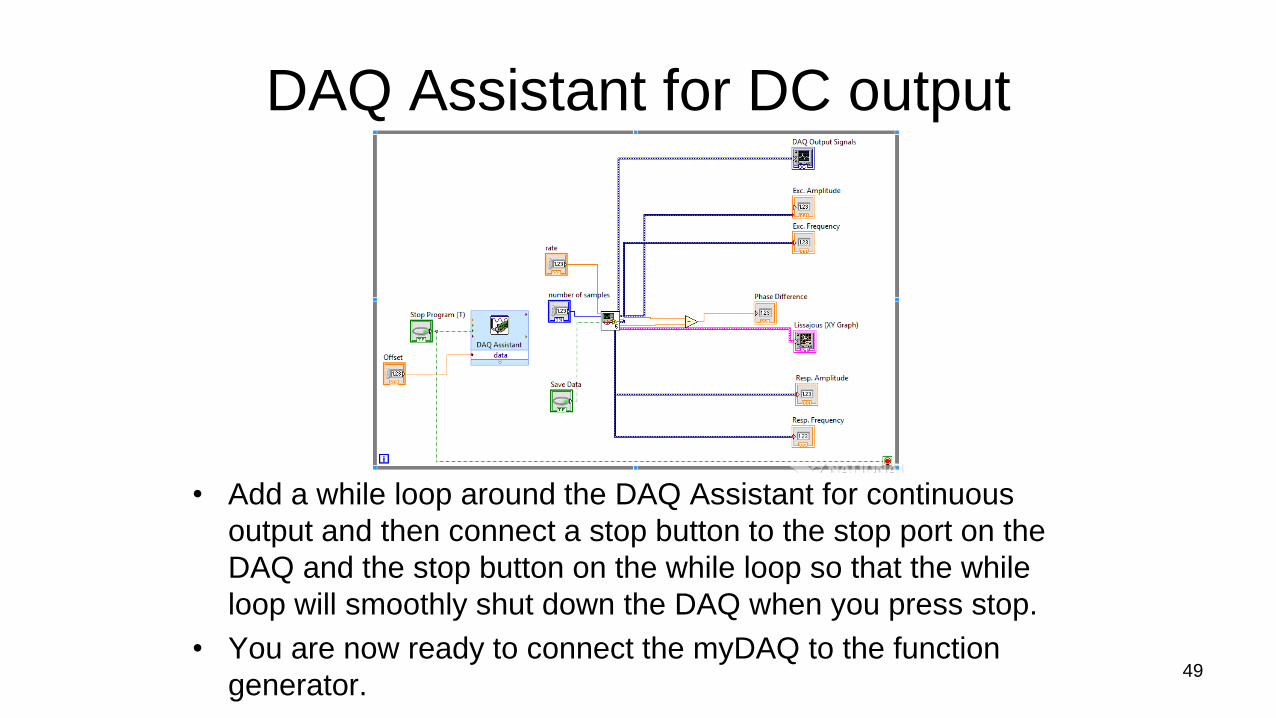
DAQ Assistant for DC output
• Add a while loop around the DAQ Assistant for continuous
output and then connect a stop button to the stop port on the
DAQ and the stop button on the while loop so that the while
loop will smoothly shut down the DAQ when you press stop.
• You are now ready to connect the myDAQ to the function
generator.49

Process: How to control the function generator?
1. You will use the DAQ DC output to determine the relationship
between the voltage supplied to the function generator and the
frequency output by the generator. This relationship is called
the gain or calibration.
2. To do so, you will connect the DAQ analog output to the function
generator input (VCF port) and use the calibration to control the
generator with the DAQ.
50
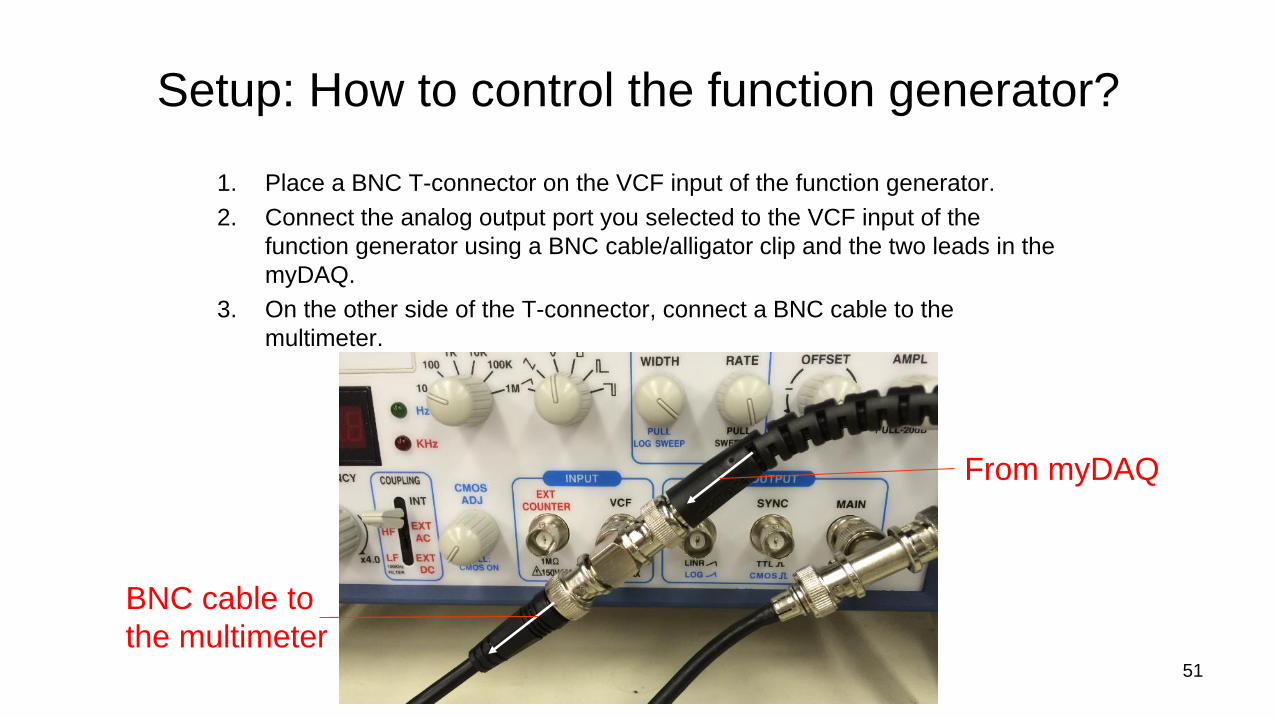
Setup: How to control the function generator?
1. Place a BNC T-connector on the VCF input of the function generator.
2. Connect the analog output port you selected to the VCF input of the
function generator using a BNC cable/alligator clip and the two leads in the
myDAQ.
3. On the other side of the T-connector, connect a BNC cable to the
multimeter.
51
BNC cable to
the multimeter
From myDAQ

Setup: How to control the function generator?
4. You will want to connect your voltmeter to the DAQ
as well. Disconnect the banana plug currently in the
multimeter, which connected the power supply
voltage to the proximeter. Insert a new banana plug
to BNC connector and connect the BNC coming
from the function generator VCF input to the
multimeter.
5. Using the LabView VI, vary the DC voltage output
and see how the function generator frequency
responds. Verify that the multimeter voltage
matches the output voltage specified in LabView,
and also specify that the frequency displayed on
the function generators matches the frequency
measured by the AI0 channel in the myDAQ
(displayed as the “Excitation Frequency” on the VI
front panel). 52
From function
generator
VCF input
Power supply
to proximeter
connection

Exercise: Calibrating the function generator
• The frequency of the function generator can be
commanded based upon voltage provided to the VCF
port.
• You will open an Excel file to store information on the
calibration (i.e. record voltage input and frequency output)
• Use the DAQ to control the function generator
53

Calibrating the function generator
• To determine this relationship, you need to do a
calibration.
• You need to record the frequency output for different
voltage inputs:– Make sure your function generator is set to sine wave, with the RANGE
knob set to a 10 Hz order of magnitude.
– Adjust the FREQUENCY knob to output a 14 Hz sine wave before
beginning calibration. This is important as the exact calibration depends
on how close to 14Hz you are at the start.
– Run the DAQ VI and record the output frequency and DC voltage values
from the DAQ for ~10-20 voltages. Adjust the input voltages between +/-
2 V. This should lead to function generator frequencies from about .5 Hz
up to about 27.5 Hz
– You will have to adjust your sampling scheme to obtain accurate
readings.
– Record and plot the resulting data in excel and obtain the linear
relationship, i.e. the calibration.
54
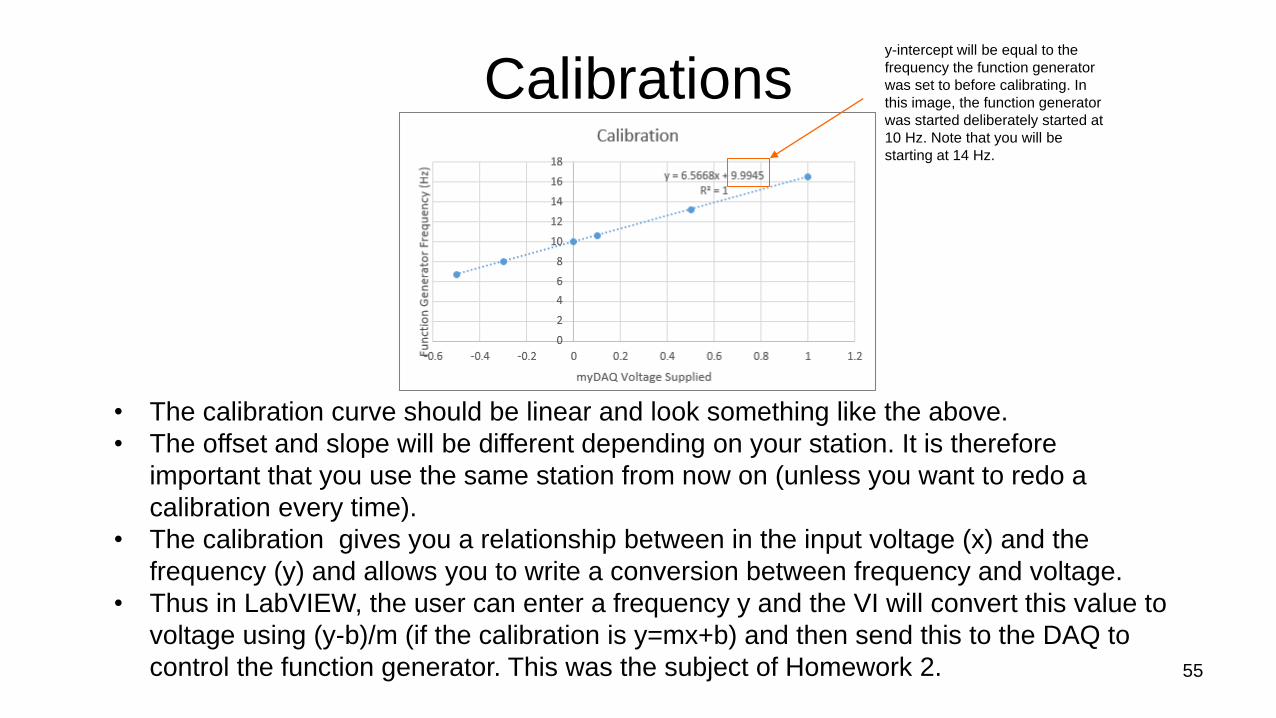
Calibrations
• The calibration curve should be linear and look something like the above.
• The offset and slope will be different depending on your station. It is therefore
important that you use the same station from now on (unless you want to redo a
calibration every time).
• The calibration gives you a relationship between in the input voltage (x) and the
frequency (y) and allows you to write a conversion between frequency and voltage.
• Thus in LabVIEW, the user can enter a frequency y and the VI will convert this value to
voltage using (y-b)/m (if the calibration is y=mx+b) and then send this to the DAQ to
control the function generator. This was the subject of Homework 2. 55
y-intercept will be equal to the
frequency the function generator
was set to before calibrating. In
this image, the function generator
was started deliberately started at
10 Hz. Note that you will be
starting at 14 Hz.
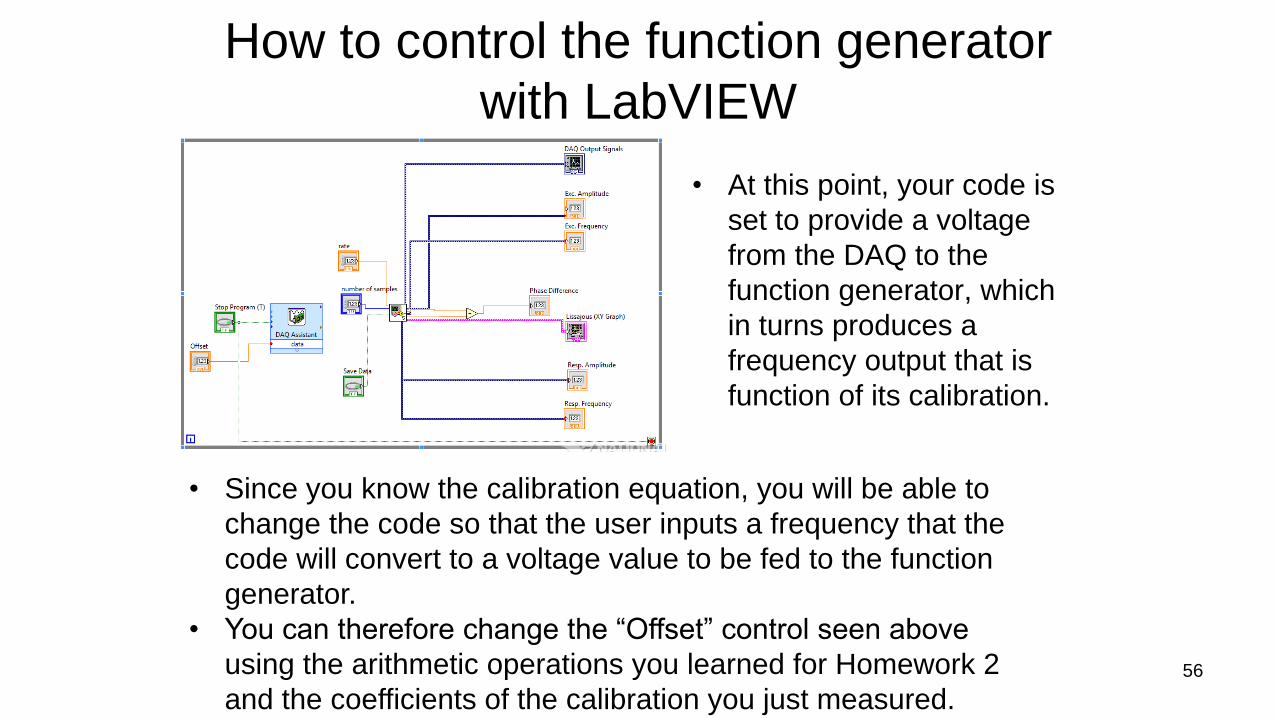
How to control the function generator
with LabVIEW
• At this point, your code is
set to provide a voltage
from the DAQ to the
function generator, which
in turns produces a
frequency output that is
function of its calibration.
56
• Since you know the calibration equation, you will be able to
change the code so that the user inputs a frequency that the
code will convert to a voltage value to be fed to the function
generator.
• You can therefore change the “Offset” control seen above
using the arithmetic operations you learned for Homework 2
and the coefficients of the calibration you just measured.
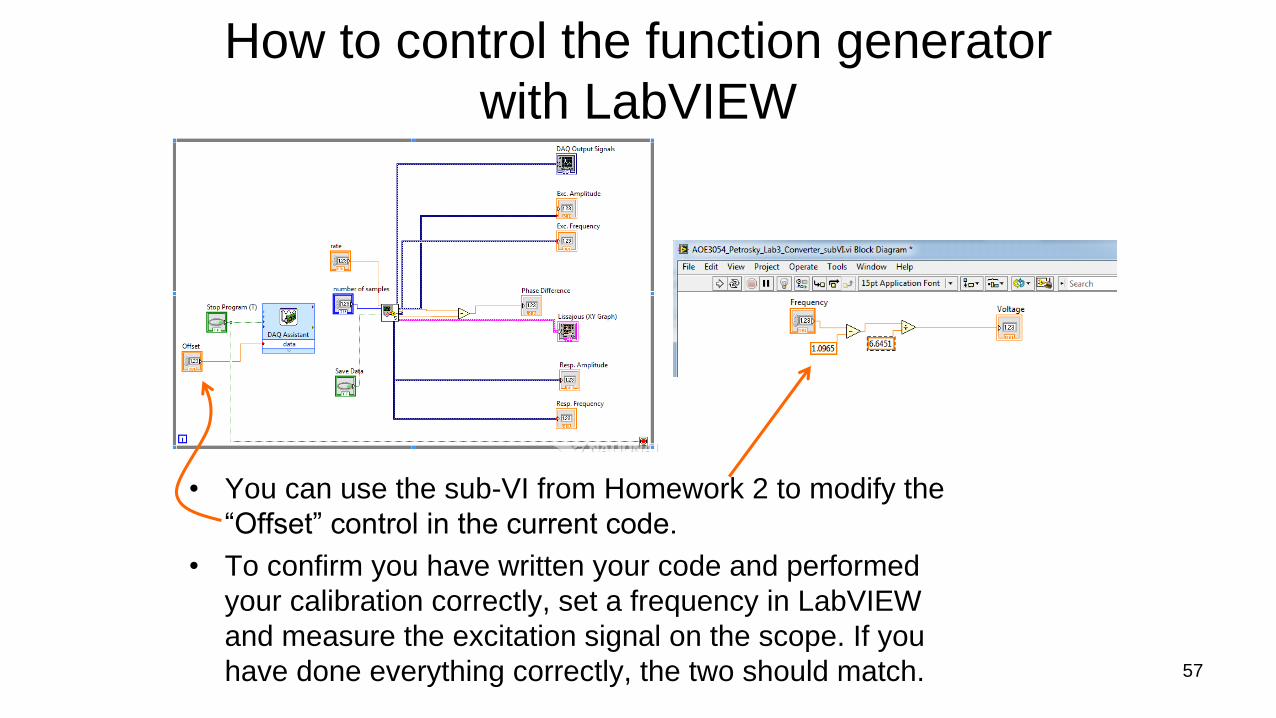
How to control the function generator
with LabVIEW
• You can use the sub-VI from Homework 2 to modify the
“Offset” control in the current code.
• To confirm you have written your code and performed
your calibration correctly, set a frequency in LabVIEW
and measure the excitation signal on the scope. If you
have done everything correctly, the two should match. 57
Digital Measurements Lab Agenda
1. Experiment 6 Digital introduction
2. Measuring function generator input and beam response
using myDAQ
3. Calibrating function generators
4. Find natural frequency of beam using myDAQ
5. myDAQ Resolution Example
6. Modify Homework codes
58
Reconnect Equipment
• The myDAQ output voltage can control the output frequency of the function
generator much more precisely than manually adjusting the knob.
• We will now try to more accurately measure the natural beam frequency.
• Disconnect the banana plug and BNC to BNC cable in the multimeter from
the function generator calibration, and reconnect the banana plug linking the
power supply to the proximeter input.
• Return the BNC to BNC cable to the wall rack.
59

Turn on Equipment
• Turn on the power supply and amplifier
• Using the LabView VI, adjust the desired frequency of the
function generator until you obtain a vertical ellipse on the
Lissajou plot.
• See how much closer to a phase of 90 degrees you can
get now that you can dial in a precise value compared to
manually adjusting the frequency knob on the function
generator.
60

Power Down Equipment
• Next, turn off all equipment, disconnect all cables and
wires, and return all equipment to their respective storage
locations.
• Leave two wires, a BNC-to-clipping-probe connector, and
a BNC to BNC connector at your table.
61
Digital Measurements Lab Agenda
1. Experiment 6 Digital introduction
2. Measuring function generator input and beam response
using myDAQ
3. Calibrating function generators
4. Find natural frequency of beam using myDAQ
5. myDAQ Resolution Example
6. Modify Homework codes
62

Generate Sine Wave with myDAQ
• Next we will go through an example showing the limitations of a
digital signal.
• You have seen that the myDAQ is capable of producing an analog
signal through its analog output.
• So what if we were to try to replace the function generator
altogether with the myDAQ?
• We will have the myDAQ generate a sine wave, and compare that
to a sine wave generated by the function generator
63
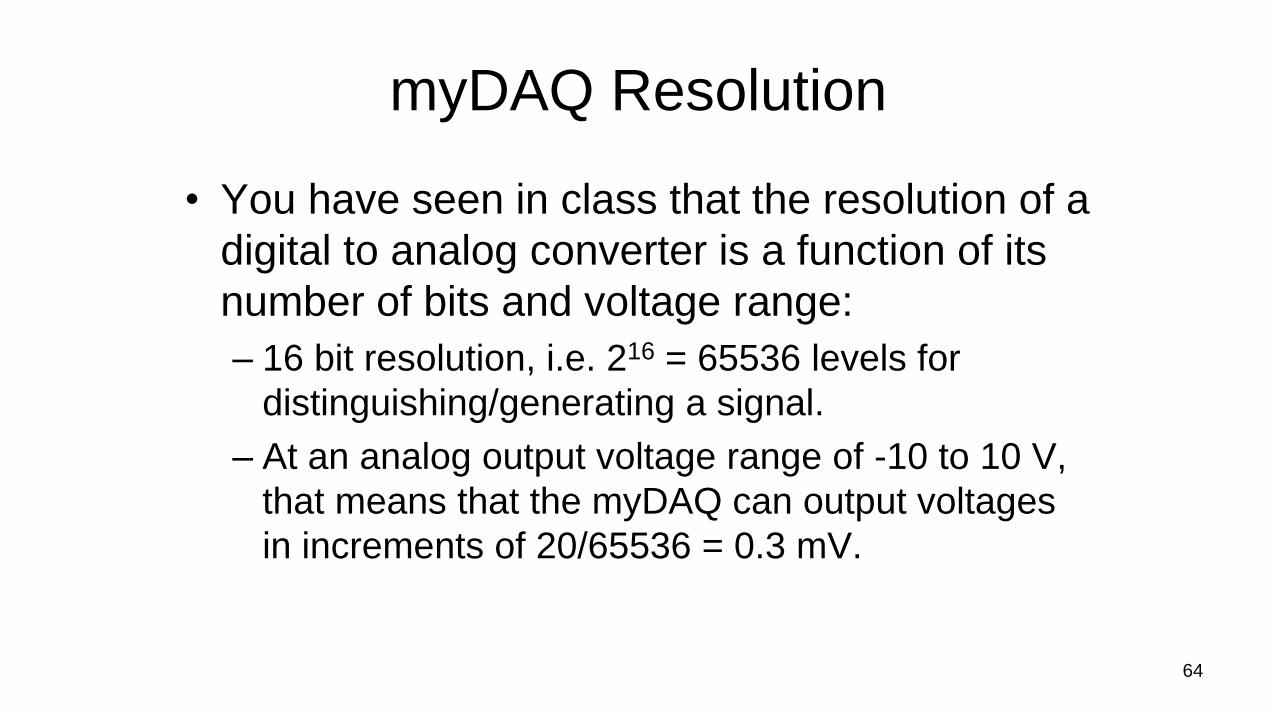
myDAQ Resolution
• You have seen in class that the resolution of a
digital to analog converter is a function of its
number of bits and voltage range:
– 16 bit resolution, i.e. 216 = 65536 levels for
distinguishing/generating a signal.
– At an analog output voltage range of -10 to 10 V,
that means that the myDAQ can output voltages
in increments of 20/65536 = 0.3 mV.
64

Download Code
• Download the
OutputSineWave.vi from this
link
• This simple VI uses the
“Simulate Signal” function to
create a sine wave and the
DAQ assistant to output this
sine wave through the analog
AO0 port.65
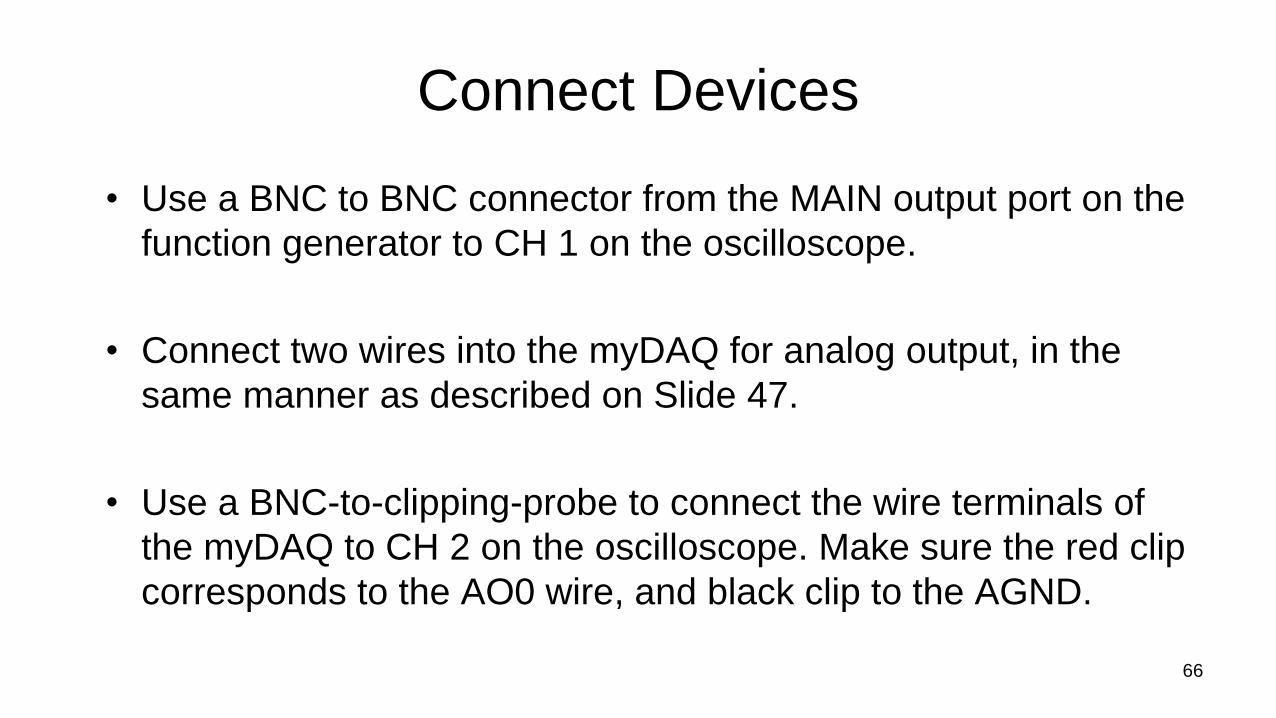
Connect Devices
• Use a BNC to BNC connector from the MAIN output port on the
function generator to CH 1 on the oscilloscope.
• Connect two wires into the myDAQ for analog output, in the
same manner as described on Slide 47.
• Use a BNC-to-clipping-probe to connect the wire terminals of
the myDAQ to CH 2 on the oscilloscope. Make sure the red clip
corresponds to the AO0 wire, and black clip to the AGND.
66

Device Connections
67

Run VI
• Turn on the oscilloscope and function generator. Set the
function generator to an output frequency of about 4 Hz
with a very low amplitude (always keep in mind the
voltage limit on your DAQ).
• In the VI front panel, set the frequency at 4 Hz and
amplitude to 0.02 V.
• Run the code, and adjust the oscilloscope screen to
accommodate the signals.
68

Oscilloscope Display
69
Function Generator
Signal
myDAQ Signal

Digital Resolution Limitations
• As you can see, the blue myDAQ signal is much choppier and noisier
than the function generator signal.
• While the function generator can output a smooth sine wave, the
myDAQ can only output voltages in increments of 0.3 mV.
• For a low amplitude signal such as this, the 0.3 mV resolution of the
myDAQ can be a significant limitation.
• For higher amplitudes, the myDAQ analog output could actually be
used to directly drive the beam vibration. However, this would require
close synchronization between the myDAQ analog inputs and outputs
which is beyond your current programming capabilities. We will see
more of that in the 4th instrumentation session.70
Digital Measurements Lab Agenda
1. Experiment 6 Digital introduction
2. Measuring function generator input and beam response
using myDAQ
3. Calibrating function generators
4. Find natural frequency of beam using myDAQ
5. myDAQ Resolution Example
6. Modify Homework codes
71

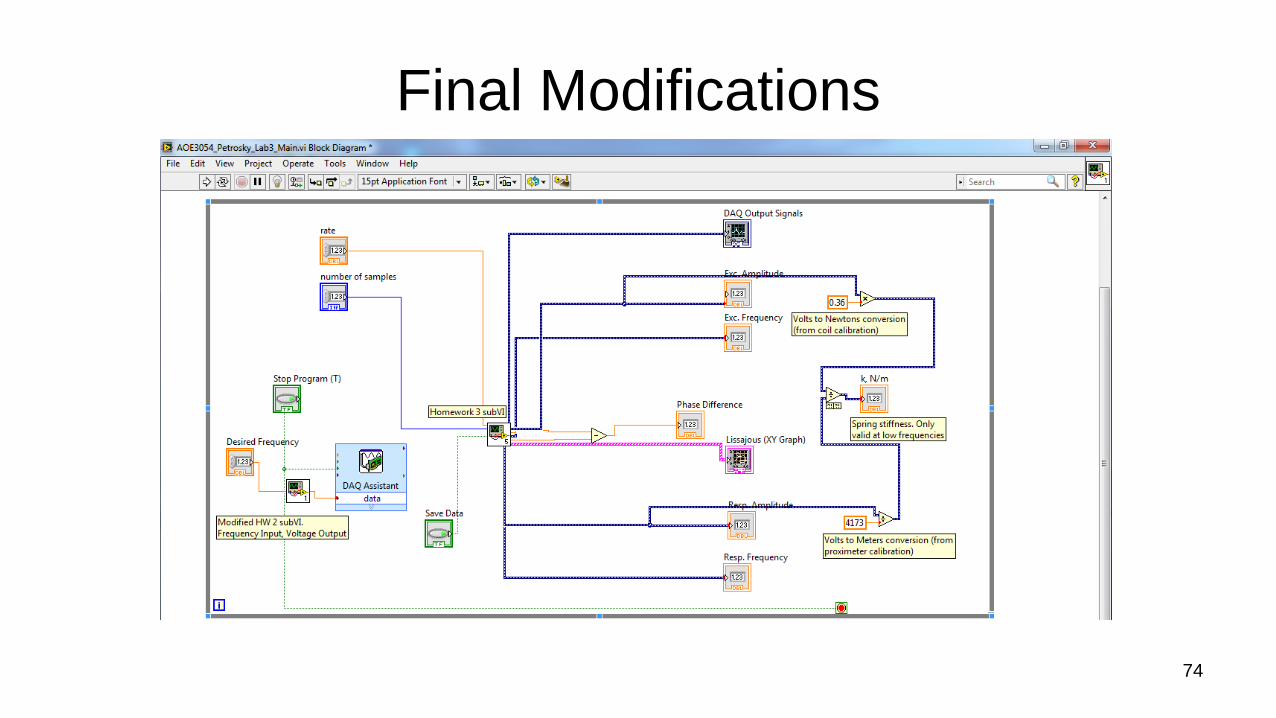
Modify Homework/Lab 3 Code• Modify today’s code to calculate the spring stiffness as well,
using beam theory.
• You will multiply the excitation signal amplitude by the coil
calibration constant.
• Similarly, you will divide the response signal amplitude by the
proximeter calibration constant.
• You can then divide the forcing amplitude (in Newtons) by the
response amplitude (in meters). At low frequencies, this ratio
is the inverse of the static flexibility and therefore corresponds
to the stiffness k.
• See slide 74 for block diagram screenshot. 72

Note: for those using the station with the -24VDC
supply to the proximeter:
1) There is a voltage divider on the proximeter
drive that divides the output by 2 before you get
to measure it. It is therefore required to multiply
the response signal by 2 to recover the true
displacement voltage.
2) The proximeter calibration is 200mV/mils (as
opposed to 106mV/mils for the older
proximeters).
73
Final Modifications
74

Wrapping Up• You can run your code for various frequencies and find if the
values of k you obtain are consistent with Experiment 6a.
• We now have most of the building blocks for digitally
controlling and measuring the beam response.
• Next lab, we will write code to fully automate the process
and find the resonant frequency of the beam.
• To do this, we’ll have to learn about for loops and advanced
programming techniques (Session 4)
• Make sure you turn off all your equipment, disconnect all the
cables and return them to their original location on the wall.
75