“broadband technology roadmap for rural areas in the andes ... · “broadband technology roadmap...
TRANSCRIPT

“Broadband Technology Roadmap for RuralAreas in the Andes and Amazon Regions in
Peru”
PhD Candidate: David EspinozaResearch Advisor: David Reed
Interdisciplinary Telecommunications ProgramUniversity of Colorado at Boulder
1
Agenda
1. Introduction2. Research methodology3. Technical analysis results4. Engineering cost analysis results5. Policy implications & technology roadmap6. Conclusions
2

1. Introduction
3

Research Question
• Research Question“What is the technology roadmap for introducing broadbandservices to underserved and unserved areas in the Andes andAmazon Regions of Peru?”
4

Research Hypotheses
• Hypothesis 1Deploying wireless access networks in the Andes and Amazonregions of Peru using the Wi-Fi technology and unlicensedspectrum has the lowest deployment and operating cost in a 10-year period.
• Hypothesis 2Wireless access networks using stratospheric platforms in theAndes and Amazon regions of Peru has the lowest deployment andoperating cost for the initial years but are not able to scale for a10-year period to serve forecasted customer and speed growth.
• Hypothesis 3Spectrum management and regulation have a quantifiabletechnology and economic impact in the deployment and operationof wireless access networks in the Andes and Amazon regions ofPeru and are important to define the best technology fit tointroduce broadband services in these regions.
5

2. Research Methodology
6
Research Methodology
Technical Analysis
Network Design & Simulations
Engineering Cost Analysis
Deployment & Operations
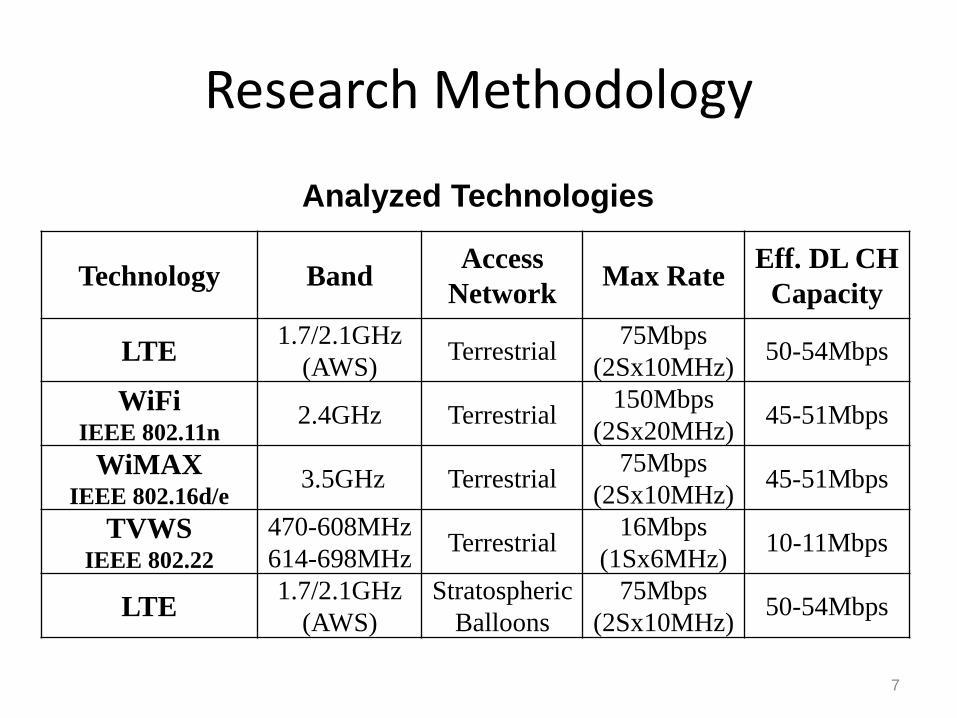
Technology Band AccessNetwork Max Rate Eff. DL CH
Capacity
LTE 1.7/2.1GHz(AWS) Terrestrial 75Mbps
(2Sx10MHz) 50-54Mbps
WiFiIEEE 802.11n
2.4GHz Terrestrial 150Mbps(2Sx20MHz) 45-51Mbps
WiMAXIEEE 802.16d/e
3.5GHz Terrestrial 75Mbps(2Sx10MHz) 45-51Mbps
TVWSIEEE 802.22
470-608MHz614-698MHz Terrestrial 16Mbps
(1Sx6MHz) 10-11Mbps
LTE 1.7/2.1GHz(AWS)
StratosphericBalloons
75Mbps(2Sx10MHz) 50-54Mbps
Analyzed Technologies
7

StudyAreas
CustomerDemand
Speed Demand
Terrain Data
RF TechSpecs
FITELSpecs
Spectrum
NetworkCost
CPE Cost
Tower Cost
Civ. Eng. Cost
Energy Cost
Operating Cost
Technical Analysis
Network Design & Simulations
Engineering Cost Analysis
Deployment & Operations
Research Methodology
Technology OperationFrequency
ChannelWidth
AvailableChannels
RegulatoryCap
LTE 1.7/2.1GHz(AWS) 10+10MHz 2 20+20MHz
per operator
WiFiIEEE 802.11g/n 2.4GHz 20MHz 3 -
WiMAXIEEE 802.16d/e 3.5GHz 10MHz 5 50MHz per
operator
TVWSIEEE 802.22
470-608MHz614-698MHz 6MHz 15 -
Pampahuasi TownYauli County
(Andes Region)
Palmapampa TownSamugari County(Amazon Region)
27 Towns 29 Towns
0.0
5.0
10.0
15.0
20.0
25.0
30.0
35.0
40.0
45.0
50.0
2.0 3.0 4.0 5.0 6.0 7.0 8.0 9.0
Resi
dent
ial P
enet
ratio
n (%
of h
ouse
hold
s)
% (Monthly Internet Rate/Average Monthly Income)
Residential Internet Penetration 2014
2015 2016 2017 2018 2019 2020 2021 2022 2023 2024Samugari 9.1 12.0 14.9 17.8 20.7 23.6 26.5 29.4 32.3 35.2Yauli 4.7 7.4 10.1 12.8 15.5 18.2 20.9 23.6 26.3 29.0
0.0
5.0
10.0
15.0
20.0
25.0
30.0
35.0
40.0
Hou
seho
lds P
enet
ratio
n (%
)
Fixed Broadband Demand Penetration
2.9%
2.7%
1368 Users
205 Users
413 Users
1675 UsersFITEL or universal service agency’s design specifications for the
access networks:
• Network service availability (at least 98% per year)
• Broadband speed per user (minimum of 2Mbps)
• Type of nodes (district, intermediate and terminal)
• Energy system equipment (equipment and specs)
• Civil engineering and node construction and tower specifications
• Interconnection with the fiber optic backbone
8

Stratospheric Balloons: Project Loon
• Project Loon (Google X): Delivering wireless Internetservices using super-pressure balloons traveling in the lowerstratosphere (65,000ft to 80,000 ft).
• Super-pressure balloons: Envelope size (49ftx39ft),longevity (up to 6 months).
• Active payload systems (from U.S. Patent 8967533 BalloonPower Sources with a Buoyancy Trade-off):– Computational: Processor and on-board data storage.– Energy: Solar panels, rechargeable battery, fuel cells.– Navigation: Station-keeping or move to a position.– Telecommunications: FSO and RF (LTE for customer access).– Sensing: Video cameras, motion & environmental data sensors.– Altitude control: Components to vary the buoyancy of the vehicle.
9
Source: https://x.company/loon/

Stratospheric Balloons: Project Loon
Estimated cost per balloon system
Computational Subsystem $320.00Solar Energy Subsystem $6,972.00Navigation subsystem $8,325.00Sensing Subsystem $119.20Altitude Control Subsystem $493.40Payload case $795.60Envelope, Gas & Parachute $9,100.00Other Accessories (15%) $3,918.00Telecom Subsystem 2: RF Access Link To Client Devices (approx. 10Mbps) $23,076.77Telecom Subsystem 3: RF Access Link To Backbone (approx. 10Mbps) $3,982.38UAS Assembly & Integration (15%) $8,565
Total Cost $65,668.60
10

Flight Configuration: Single Balloon
11

Flight Configuration: Balloon Constellation
12
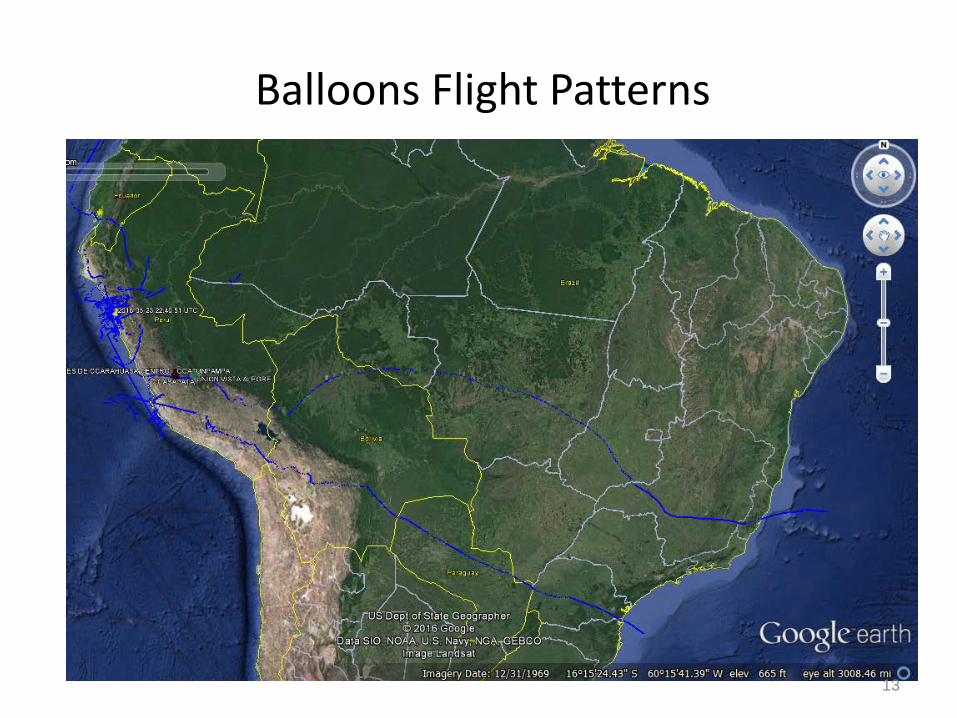
Balloons Flight Patterns
13

3. Technical Analysis Results
14
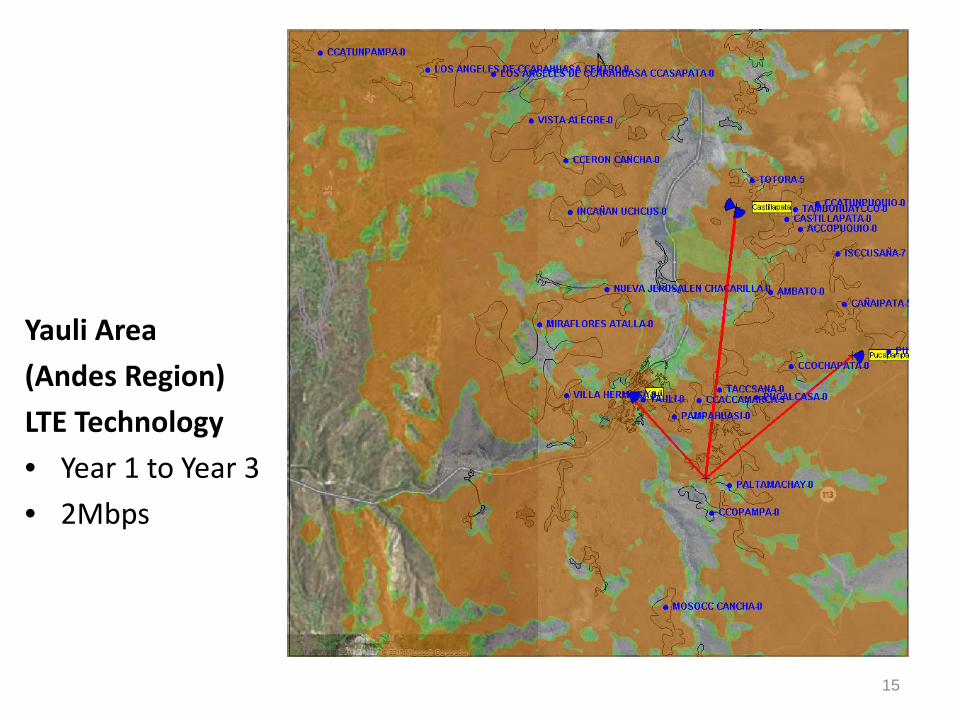
Yauli Area(Andes Region)LTE Technology• Year 1 to Year 3• 2Mbps
15

Yauli Area(Andes Region)LTE Technology• Year 1 to Year 3• 2Mbps
16

17

Yauli Area(Andes Region)LTE Technology• Year 4 to Year 7• 4Mbps
18

Yauli Area(Andes Region)LTE Technology• Year 8 to Year 9• 8Mbps
19

Yauli Area(Andes Region)LTE Technology• Year 10• 12Mbps
20

Yauli Area(Andes Region)Balloons-LTE• Year 1 to
Year 3• 2Mbps
21

Wi-Fi WiMAX TVWS LTE Balloons
Y12Mbps
Nodes and Towers 9 4 2 4 1Base Stations/Access Points 12 4 5 4 1
Backhaul Radio Links 8 3 1 3 1Customer Premise Equipment 205 205 205 205 205
Y44Mbps
Nodes and Towers 9 5 5 5Base Stations/Access Points 12 9 23 7
Backhaul Radio Links 8 4 4 4Customer Premise Equipment 532 532 532 532
Y88Mbps
Nodes and Towers 11 8 8 12Base Stations/Access Points 26 28 85 23
Backhaul Radio Links 12 10 9 14Customer Premise Equipment 1064 1064 1064 1064
Y1012Mbps
Nodes and Towers 18 12 12 16Base Stations/Access Points 46 50 158 31
Backhaul Radio Links 23 19 18 23Customer Premise Equipment 1368 1368 1368 1368
Wi-Fi WiMAX TVWS LTE Balloons
Y12Mbps
Nodes and Towers 9 4 2 4 1Base Stations/Access Points 12 4 5 4 1
Backhaul Radio Links 8 3 1 3 1Customer Premise Equipment 205 205 205 205 205
Y44Mbps
Nodes and Towers 9 5 5 5Base Stations/Access Points 12 9 23 7
Backhaul Radio Links 8 4 4 4Customer Premise Equipment 532 532 532 532
Y88Mbps
Nodes and Towers 11 8 8 12Base Stations/Access Points 26 28 85 23
Backhaul Radio Links 12 10 9 14Customer Premise Equipment 1064 1064 1064 1064
Wi-Fi WiMAX TVWS LTE Balloons
Y12Mbps
Nodes and Towers 9 4 2 4 1Base Stations/Access Points 12 4 5 4 1
Backhaul Radio Links 8 3 1 3 1Customer Premise Equipment 205 205 205 205 205
Y44Mbps
Nodes and Towers 9 5 5 5Base Stations/Access Points 12 9 23 7
Backhaul Radio Links 8 4 4 4Customer Premise Equipment 532 532 532 532
22
Wi-Fi WiMAX TVWS LTE Balloons
Y12Mbps
Nodes and Towers 9 4 2 4 1Base Stations/Access Points 12 4 5 4 1
Backhaul Radio Links 8 3 1 3 1Customer Premise Equipment 205 205 205 205 205
23
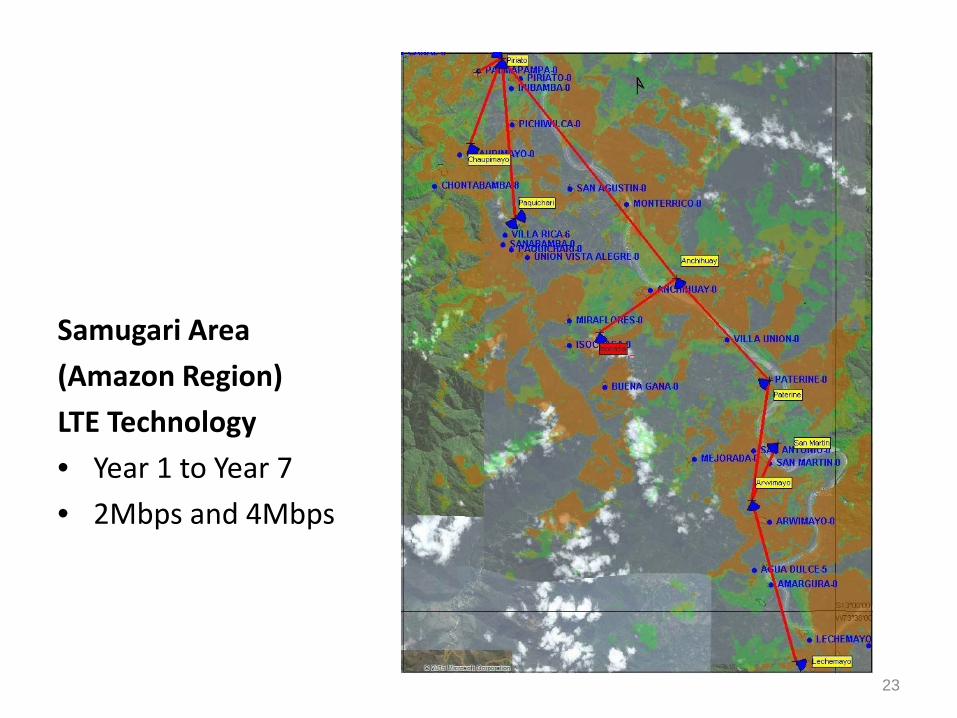
Samugari Area(Amazon Region)LTE Technology• Year 1 to Year 7• 2Mbps and 4Mbps

Samugari Area(Amazon Region)LTE Technology• Year 8 to Year 9• 8Mbps
24

Samugari Area(Amazon Region)LTE Technology• Year 10• 12Mbps
25

Samugari Area(Amazon Region)Ballooons-LTE• Year 1 to Year 3• 2Mbps
26

Wi-Fi WiMAX TVWS LTE Balloons
Y12Mbps
Nodes and Towers 18 10 9 10 1Base Stations/Access Points 18 14 13 11 1
Backhaul Radio Links 17 9 8 9 1Customer Premise Equipment 413 413 413 413 413
Y44Mbps
Nodes and Towers 18 10 9 10Base Stations/Access Points 18 15 32 11
Backhaul Radio Links 18 10 9 10Customer Premise Equipment 803 803 803 803
Y88Mbps
Nodes and Towers 18 12 12 14Base Stations/Access Points 27 34 111 18
Backhaul Radio Links 25 19 19 21Customer Premise Equipment 1368 1368 1368 1368
Y1012Mbps
Nodes and Towers 22 18 17 22Base Stations/Access Points 46 62 170 27
Backhaul Radio Links 38 34 33 38Customer Premise Equipment 1675 1675 1675 1675
Wi-Fi WiMAX TVWS LTE Balloons
Y12Mbps
Nodes and Towers 18 10 9 10 1Base Stations/Access Points 18 14 13 11 1
Backhaul Radio Links 17 9 8 9 1Customer Premise Equipment 413 413 413 413 413
Y44Mbps
Nodes and Towers 18 10 9 10Base Stations/Access Points 18 15 32 11
Backhaul Radio Links 18 10 9 10Customer Premise Equipment 803 803 803 803
Y88Mbps
Nodes and Towers 18 12 12 14Base Stations/Access Points 27 34 111 18
Backhaul Radio Links 25 19 19 21Customer Premise Equipment 1368 1368 1368 1368
Wi-Fi WiMAX TVWS LTE Balloons
Y12Mbps
Nodes and Towers 18 10 9 10 1Base Stations/Access Points 18 14 13 11 1
Backhaul Radio Links 17 9 8 9 1Customer Premise Equipment 413 413 413 413 413
Y44Mbps
Nodes and Towers 18 10 9 10Base Stations/Access Points 18 15 32 11
Backhaul Radio Links 18 10 9 10Customer Premise Equipment 803 803 803 803
27
Wi-Fi WiMAX TVWS LTE Balloons
Y12Mbps
Nodes and Towers 18 10 9 10 1Base Stations/Access Points 18 14 13 11 1
Backhaul Radio Links 17 9 8 9 1Customer Premise Equipment 413 413 413 413 413

4. Engineering Cost Analysis Results
28

29
900K
3.7M

30

31
WiFi WiMAX TVWS LTE WiFi WiMAX TVWS LTEOPEX $718,377 $724,389 $832,960 $731,365 $1,056,1 $1,181,4 $1,167,1 $1,115,5CAPEX $1,143,5 $1,396,4 $1,686,3 $1,521,1 $2,137,1 $2,445,1 $2,557,3 $2,449,7
$0
$500,000
$1,000,000
$1,500,000
$2,000,000
$2,500,000
$3,000,000
$3,500,000
$4,000,000
CAPE
X +
OPE
X N
PV (U
SD)
Yauli (Andes Region) & Samugari (Amazon Region) CAPEX+OPEX NPV
Yauli Area Samugari Area
72% 71% 48% 58%
14% 21%35%
12%14% 17%
66% 67% 68%61%
67%67% 69% 69%

32

33

34
NPVWiMAX $230.0 LTE $231.6 TVWS $242.0 WiFi $251.9

35
NPVLTE $289.1 TVWS $293.5 WiMAX $299.1 WiFi $313.2

36
NPVTVWS $76.09 LTE $77.43 WiMAX $77.89 WiFi $91.8

37
NPVTVWS $96.6 LTE $99.8 WiMAX $102.3 WiFi $111.9

5. Policy Implications & Broadband Technology Roadmap
38

Policy Implications – LTE Spectrum• 1.7/2.1GHz Band (AWS) LTE spectrum cap: 20MHz+20MHz• Allowing 40MHz+40MHz spectrum per operator:
– Less expensive than Wi-Fi (NPV reduction 6% in Yauli and 11% In Samugari)– Less expensive than LTE (NPV reduction 22% in Yauli and 20% In Samugari)
39

Overbooking Analysis
40
• Current regulator recommendation for residential service in rural areas is an overbooking of 10:1.
• Variations in the overbooking in rural areas have significant impact on cost:– Overbooking 5:1 (LTE NPV increase 54% in Yauli and 24% In Samugari)– Overbooking 20:1 (LTE NPV decrease 25% in Yauli and 29% In Samugari)
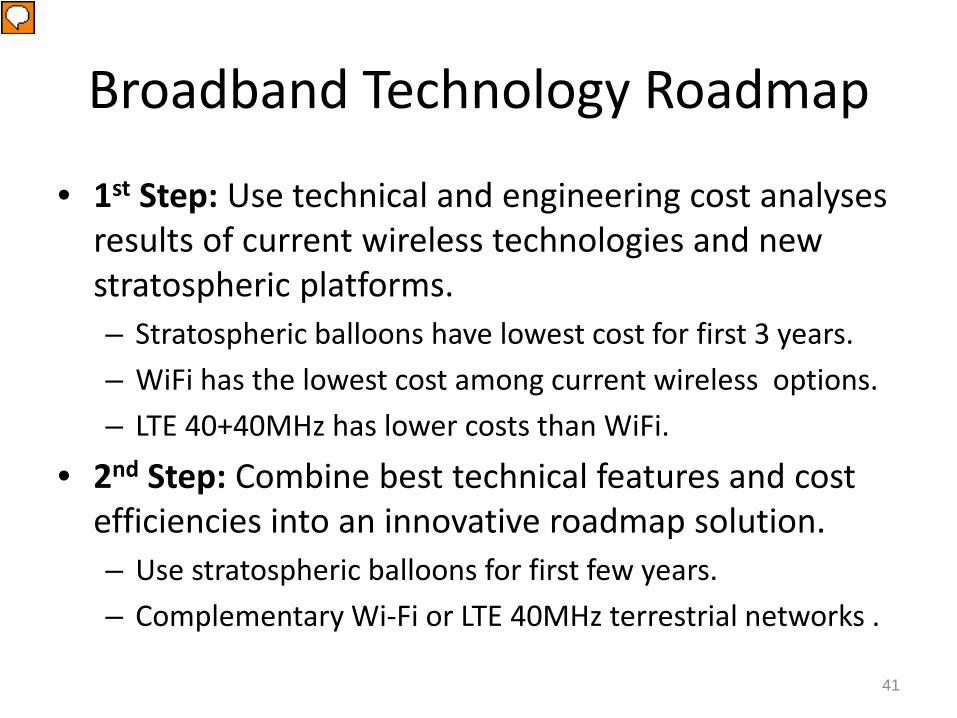
Broadband Technology Roadmap
• 1st Step: Use technical and engineering cost analyses results of current wireless technologies and new stratospheric platforms.– Stratospheric balloons have lowest cost for first 3 years.– WiFi has the lowest cost among current wireless options.– LTE 40+40MHz has lower costs than WiFi.
• 2nd Step: Combine best technical features and cost efficiencies into an innovative roadmap solution.– Use stratospheric balloons for first few years.– Complementary Wi-Fi or LTE 40MHz terrestrial networks .
41

42

43

44

Broadband Technology Roadmap
The two selected roadmap solutions:• Stratospheric constellation balloons (LTE 20MHz)
complemented with terrestrial LTE 40MHz.• Stratospheric constellation balloons (LTE 40MHz)
complemented with terrestrial LTE 40MHz.
45

6. Conclusions
46

Research Hypotheses
• Hypothesis 1Deploying wireless access networks in the Andes andAmazon regions of Peru using the Wi-Fi technology andunlicensed spectrum has the lowest deployment andoperating cost in a 10-year period.– This hypothesis is true
– Andes Region (Yauli): Lowest NPV (WiMAX, LTE and TVWS are 14%,21% and 35% more expensive).
– Amazon Region (Samugari): Lowest NPV (LTE, WiMAX and TVWSare 12%, 14% and 17% more expensive).
47

Research Hypotheses
• Hypothesis 2Wireless access networks using stratospheric platformsin the Andes and Amazon regions of Peru has the lowestdeployment and operating cost for the initial years butare not able to scale for a 10-year period to serveforecasted customer and speed growth.– This hypothesis is true
– Under current spectrum regulations, balloons can provide servicefor first 3 years at the lowest cost.
– Allowing LTE 40+40MHz, balloons can provide service for 4 years inYauli and for 6 years in Samugari.
48

Research Hypotheses
• Hypothesis 3Spectrum management and regulation have aquantifiable technology and economic impact in thedeployment and operation of wireless access networks inthe Andes and Amazon regions of Peru and areimportant to define the best technology fit to introducebroadband services in these regions.– This hypothesis is true
– Spectrum regulations have an impact on the available spectrumresources used in the technical analysis.
– Technical design has a direct impact of the network costs.– Lifting the LTE spectrum cap allows LTE to become the lowest cost
option.
49

Research Question
• Research Question“What is the technology roadmap for introducing broadband services to underserved and unserved areas in the Andes and Amazon Regions of Peru?”– The two broadband roadmap selected solutions:
• Stratospheric constellation balloons (LTE 20MHz) complemented with terrestrial LTE 40MHz.
• Stratospheric constellation balloons (LTE 40MHz) complemented with terrestrial LTE 40MHz.
50

Acknowledgements
• Dr. David Reed• Dissertation committee• Dr. Harvey Gates• FITEL• Google and ITP• My wife Sarah, family and friends
51

Thank you!
Q & A
52

Subsidy AnalysisCost per user per
month in Yauli (USD)Subsidy per user per
month in Huancavelica (USD)
Wi-Fi $ 31.6 $ 44.3WiMAX $ 36.0 $ 44.3TVWS $ 42.8 $ 44.3LTE $ 38.2 $ 44.3
53
Cost per user permonth in Samugari (USD)
Subsidy per user permonth in Ayacucho (USD)
Wi-Fi $ 38.8 $ 27.2WiMAX $ 44.0 $ 27.2TVWS $ 45.2 $ 27.2LTE $ 43.3 $ 27.2

Network Radio Links Summary
YAULI SAMUGARIWiFi WiMAX TVWS LTE WiFi WiMAX TVWS LTE
AverageDistance from
Towns to Nodes(km)
Year 1 1.3 3.6 4.4 3.5 0.8 2.4 3.4 2.2Year 4 1.3 1.8 2.3 1.8 0.8 2.4 3.4 2.2Year 8 1.0 1.3 1.3 1.1 0.8 1.9 1.7 1.9
Year 10 0.7 1.1 1.0 0.9 0.7 1.5 1.4 1.0Average
Number of Towns per
Nodes
Year 1 3.0 9.0 13.5 9.0 1.6 3.2 4.1 3.2Year 4 3.0 5.4 5.4 5.4 1.6 3.2 4.1 3.2Year 8 2.5 3.4 3.4 2.2 1.6 2.4 2.2 2.1
Year 10 1.5 2.2 2.2 1.7 1.4 1.5 1.7 1.3Average
BackhaulRadio LinkDistances
Year 1 4.0 3.8 3.4 3.8 5.5 6.0 5.7 6.0Year 4 4.0 3.9 4.5 3.9 5.5 6.0 5.7 6.0Year 8 3.6 3.2 3.9 2.8 5.5 5.6 5.8 4.8
Year 10 2.7 2.7 2.8 2.3 4.7 4.7 4.8 4.3
54

55
8 mi
Yauli County (Andes) Samugari County (Amazon)
8 mi
18 mi
13 mi• 29 towns and 3,884 households• Fixed BB demand: 9.1% of households
(2.9% annual increase)• Customers: 413 (Y1) to 1675 (Y10)
• 27 towns and 3,511 households• Fixed BB demand: 4.7% of households
(2.7% annual increase)• Customers: 205 (Y1) to 1368 (Y10)
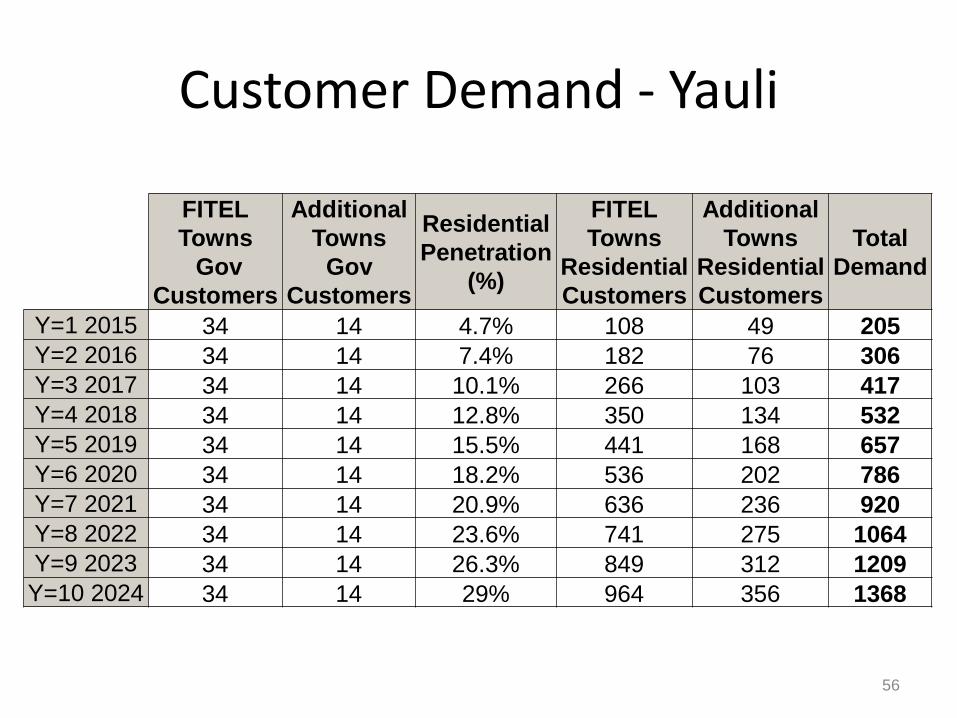
Customer Demand - Yauli
FITELTowns
GovCustomers
AdditionalTowns
GovCustomers
ResidentialPenetration
(%)
FITELTowns
ResidentialCustomers
AdditionalTowns
ResidentialCustomers
TotalDemand
Y=1 2015 34 14 4.7% 108 49 205Y=2 2016 34 14 7.4% 182 76 306Y=3 2017 34 14 10.1% 266 103 417Y=4 2018 34 14 12.8% 350 134 532Y=5 2019 34 14 15.5% 441 168 657Y=6 2020 34 14 18.2% 536 202 786Y=7 2021 34 14 20.9% 636 236 920Y=8 2022 34 14 23.6% 741 275 1064Y=9 2023 34 14 26.3% 849 312 1209
Y=10 2024 34 14 29% 964 356 1368
56

Customer Demand - Samugari
57
FITELTowns
GovCustomers
AdditionalTowns
GovCustomers
ResidentialPenetration
(%)
FITELTowns
ResidentialCustomers
AdditionalTowns
ResidentialCustomers
TotalDemand
Y=1 2015 33 13 9.1% 266 101 413Y=2 2016 33 13 12% 361 132 539Y=3 2017 33 13 14.9% 458 166 670Y=4 2018 33 13 17.8% 559 198 803Y=5 2019 33 13 20.7% 660 234 940Y=6 2020 33 13 23.6% 766 270 1082Y=7 2021 33 13 26.5% 875 304 1225Y=8 2022 33 13 29.4% 981 341 1368Y=9 2023 33 13 32.3% 1098 378 1522
Y=10 2024 33 13 35.2% 1211 418 1675