“contractors or collectives?” earmarked funding of ......bill & melinda gates foundation in...
TRANSCRIPT

CGD Policy Paper 153 July 2019
“Contractors or Collectives?” Earmarked Funding of Multilaterals, Donor Needs, and Institutional Integrity: The World Bank as a Case Study
www.cgdev.org
Center for Global Development2055 L Street NWFifth FloorWashington DC 20036202-416-4000 www.cgdev.org
This work is made available under the terms of the Creative Commons Attribution-NonCommercial 4.0 license.
We revisit the policy dilemmas thrown up by so-called Multi-bi funding (earmarked bilateral aid routed via multilateral channels), based on a case study of World Bank trust funds, given their industry-leading overall size and relative transparency. We update patterns of sources and uses of Multi-bi using the 2019 Trust Funds Directory and use this to derive a new Index of Responsible Multi-bi Donorship. We consider complementary donor motivations for Multi-bi, highlighting their perceived need to shift the focus of a multilateral institution faster than they believe possible through its core systems. We examine potential negative effects of Multi-bi on the distortion of funding choices available to client countries, and above all on the risk of “hollowing out” of the multilateral itself, as the locus of power and accountability shifts from the wider collective toward a narrower set of contracting relationships.
We find that current trust fund reform efforts can at best partly address these dynamics, while the growing trend toward creation of sub-windows within the main core funding instrument could potentially make things worse. Instead, we offer a pragmatic two-track solution that could significantly reduce tensions between funder needs and institutional integrity. This involves (a) developing an improved battery of output indicators mapped to donor core contributions, to enhance visibility and results reporting and (b) routing new Multi-bi proposals increasingly through core governance processes, focusing initially on greater transparency and on demonstrating their additionality to donors’ core funding.
Abstract
Owen Barder, Euan Ritchie, and Andrew Rogerson

Center for Global Development2055 L Street NW
Washington, DC 20036
202.416.4000(f) 202.416.4050
www.cgdev.org
The Center for Global Development works to reduce global poverty and improve lives through innovative economic research that drives better policy and practice by the world’s top decision makers. Use and dissemination of this Policy Paper is encouraged; however, reproduced copies may not be used for commercial purposes. Further usage is permitted under the terms of the Creative Commons License.
The views expressed in CGD Policy Papers are those of the authors and should not be attributed to the board of directors, funders of the Center for Global Development, or the authors’ respective organizations.
“Contractors or Collectives?” Earmarked Funding of Multilaterals, Donor Needs, and Institutional Integrity: The World Bank as a Case
Study
Owen Barder, Euan Ritchie, and Andrew RogersonCenter for Global Development
The Center for Global Development is grateful for contributions from the Bill & Melinda Gates Foundation in support of this work.
Owen Barder, Euan Ritchie, and Andrew Rogerson 2019. “‘Contractors or Collectives?’ Earmarked Funding of Multilaterals, Donor Needs, and Institutional Integrity: The World Bank as a Case Study” CGD Policy Paper 153. Washington, DC: Center for Global Development. https://www.cgdev.org/publication/contractors-or-collectives-earmarked-funding-multilaterals-donor-needs-and
Contents
Abbreviations .................................................................................................................................... 1
Executive Summary ......................................................................................................................... 2
Introduction ...................................................................................................................................... 4
The World Bank Group (WB) as a Case Study of Multi-bi Financing .................................... 5
Motivations for Multi-bi Support on the Part of Bilateral Donors ........................................ 11
Risks and Costs of Multi-bi for Client Countries and the Institution.................................... 13
Some Useful but Insufficient, and Some Potentially Damaging, Policy Responses ............ 17
Two Better and More Sustainable Solution Tracks .................................................................. 19
Responsible Multi-bi Donor Index: Preliminary Results ......................................................... 21
Summary of Recommendations ................................................................................................... 23
References ........................................................................................................................................ 24
Appendix 1. Stylised facts on World Bank Trust Funds .......................................................... 26
Appendix 2. Data used in constructing Multi-bi index ............................................................ 30

1
Abbreviations
AIIB: Asian Infrastructure Investment Bank ARTF: Afghanistan Reconstruction Trust Fund BE: Bank-Executed CDI: Commitment to Development Index CFF: Concessional Financing Facility DAC: Development Assistance Committee DFi: Development Finance (Vice-Presidency of WB) FIF: Financial Intermediary Fund GFATM: Global Fund to Fight Aids, Tuberculosis and Malaria GPE: Global Partnership for Education IBRD: International Bank for Reconstruction and Development IDA: International Development Association IEG: Independent Evaluation Group LAC: Latin America and Caribbean MB: Multi-bi MDTF: Multi-Donor Trust Fund NDB: New Development Bank OECD: Organisation for Economic Co-operation and Development PBA: Performance-Based Allocation RE: Recipient-Executed SDTF: Single-Donor Trust Fund TF: Trust Fund WB: World Bank

2
Executive Summary
This paper, intended mainly for development finance experts, aid agency managers and policymakers, revisits earlier analyses of the pros and cons of so-called “Multi-bi” funding, or earmarked bilateral funding channelled through a multilateral development institution like the World Bank. It analyses patterns of Multi-bi finance using the 2019 World Bank Trust Fund Directory (World Bank 2019), the single largest repository of such information for any development finance institution and develops actionable proposals which could help reconcile funders’ needs and institutional integrity.
Multi-bi funding speaks to donors’ need to drive the focus of an institution toward their own priorities faster than they feel they can through its core systems. In some cases, like rising to failed states’ needs and global commons challenges despite the limitations of the World Bank’s sovereign country loan instrument, this concern reflects known gaps in the core design. They should ideally be addressed head-on, not through a mosaic of ad hoc workarounds. In many more cases, it reflects disparate instances of bottom-up “intrapreneurship” within both the host and its sponsoring agencies, often operating well below political radars. This dynamic is understandable and valuable in some ways but can still lead to unsatisfactory outcomes in aggregate.
The real danger in taking the Multi-bi route is not just one of distorting the choices offered to the institution’s client countries, though that remains a problem for those who still have limited capacity to neutralise donor earmarks. A bigger potential risk is a “hollowing out” of the institution itself, in two related ways. First, staff and management attention and capacity are pulled away from core activities. Second, the locus of power and accountability shifts progressively away from the broader collective, with its wider purposes and legitimacy, and toward a narrower set of contracting relationships with its wealthier members.
Well-intentioned and labour-intensive administrative responses, like re-grouping trust funds into fewer clusters, are positive steps but not likely to be sufficient to roll back this threat decisively. Targeted financial incentives against tight earmarks (like the recent UN Development System 1% levy decision) are worth exploring but not likely to be effective in the current World Bank context. Creating and perpetuating additional earmarked “windows” within the core funding mechanism itself-in this case IDA- could actually make things worse, by further distorting country demand and reducing the coverage of performance-based country allocations.
Win-win solutions are more likely to lie in finding pragmatic ways to (a) map core activities more closely to specific outcomes that are championed by donors and (b) bring new funding initiatives into the institution’s main decision fora, and thence progressively into core funding. This could potentially increase the latter by nearly 40%. If DAC members gave no more than does the current median donor to World Bank trust funds, this could unlock an increase in IDA contributions of around 30%. Innovative proposals sponsored by member minorities could and should still be adopted, providing they are judged consistent with the priorities of the collective and are demonstrably additional to core allocations.

3
To complement this analysis, we present a new index of “Responsible Multi-bi Donorship”, ranking bilateral donors to the Bank’s trust funds, derived from its recently updated Trust Funds Directory, and potentially adaptable to other multilaterals. We also assess, and recommend improvement in, the transparency of information available on Multi-bi, as against core, funding, taking the Bank as an exemplar.

4
Introduction
This paper is aimed at development finance experts advising or influencing policymakers and senior managers in aid agencies. It assumes little previous familiarity with the microcosm of “Multi-bi” aid, that is, the fast-growing pool of earmarked bilateral aid channelled through multilateral agencies. It relies mainly on the World Bank’s recently published (2019) Trust Funds Directory (“Directory of Programs Supported by Trust Funds”, World Bank 2019), as well as annual reports (World Bank 2013, 2018), as the main quantitative basis for an updated analysis. The Bank is the largest single repository of Multi-bi in the (non-humanitarian) development system and despite some significant deficiencies we discuss, its reporting of funds is among the most complete and detailed available anywhere, with ongoing efforts to improve further.
Our main purpose is to identify practical ways to reconcile two genuine sets of needs which are in constant tension: those of fund contributors (mostly bilateral aid agencies), for influence and attribution, and those of the institution they negotiate with, for coherence and legitimacy.
Recent literature on Multi-bi aid (e.g. Barakat 2009, Reinsberg et al 2015, OECD 2015, Gulrajani 2016, Reinsberg 2017, Winters and Sridhar 2017) assesses its collateral costs, particularly in terms of fragmentation and substitution between funding channels and the dangers of high levels of financial dependency on Multi-bi . It also considers its key benefits to potential funders such as greater visibility, attribution and (perceived or actual) control. Also often mentioned are the relatively low transparency of Multi-bi reporting and the risk of “politicisation” of multilateral institutions through excessive earmarking pressure. We focus here particularly on this last risk and what drives it and make specific proposals for how it might be mitigated, while acknowledging and preserving some of the real benefits of Multi-bi for donors and the wider development system.
We hypothesize that these donors, whether at strategic/political or, more often, tactical/technical level, choose Multi-bi as an unashamedly second-best but pragmatic alternative to core funding. This is partly in response to perceived systemic rigidities and intractable collective action problems in the “core” funding and governance mechanism, such as IDA (the International Development Association, or “soft” window of the World Bank) and its Board. It also results from more opportunistic engagement between specialised staff on both sides of the Bank and its would-be bilateral sponsors, to make joint progress in a particular country or thematic context. In these contexts, the objective is to leverage up and/or contract out a part of bilateral aid. It also reflects an unwillingness on the part of some donors to increase their core contributions faster than other donors, so increasing their “burden share” in a way which they find difficult to defend politically. In this case, the purpose of Multi-bi is to provide extra support to the multilateral below-the-radar, by counting it as bilateral aid.
We focus on the World Bank case, especially its so-called “Recipient Executed” (RE) trust funds, which tend to be more relevant than so-called Bank-executed (BE) ones, and so-called Financial Intermediary Funds (FIFs, accounting for funds mostly substantively

5
decided within other autonomous agencies) from a systemic perspective. The Bank has both a very large Multi-bi portfolio - the single largest among non-humanitarian multilaterals, at over $3b of the total $22b “routed through” all multilaterals - but also at the same time a more robust core funding platform than do most multilaterals. It is therefore financially better able than they are to withstand any corrosive Multi-bi effects. Conversely, other multilaterals are likely to be even more vulnerable to some of the phenomena discussed below.
The Bank also produces several publications which facilitate analysis of trust funds, notably the “Directory of Programs Supported by Trust Funds” (World Bank 2019), and the trust fund annual reports. There are still significant limitations to these data sources: the latter give broad trends but only for aggregates, and are published, so far, only in cumbersome PDF format. The former does not separate contributions and disbursements by year or by donor, only giving totals over the lifetime of the funds. They are sufficient to extract some clear patterns of how they have been used; but there is much more to be done to reach full transparency, as we discuss later.
We also use this WB dataset to construct a simple three-dimensional index of “Responsible Multi-bi donorship” for bilateral funders, combining their non-core: core funding proportions with the range of funding partners they each work with. There are some unexpected outliers, good and bad.
The World Bank Group (WB) as a Case Study of Multi-bi Financing
The WB, by design a lender, has also increasingly proved successful as a large multi-purpose grant platform and as a convenor for a wide array of single-country and thematic initiatives and partnerships that access to large grant pools help makes possible (IEG, 2011). A key part of this success relates to its strong fiduciary “safe pair of hands” reputation, even as compared to other multilaterals. Another part relates to its sheer depth and breadth of technical expertise, offering to many like-minded bilaterals the prospect of creative joint-ventures and new policy amplification mechanisms, often mediated at specialised staff levels by like-minded staff on both sides.
In what follows we use the shorthand of comparing IDA, as exemplifying core concessional funding, to Recipient-Executed WB Trust funds (RETF), as exemplifying “Multi-bi”. However, many Trust Funds are deliberately set up as devices to channel concessional funding to middle-income countries (IBRD and “Blend” countries) which may otherwise lack access to such terms. For example, almost half of RETF grants were going to fragile states (middle as well as low-income countries) by 2016, providing highly concessional resources in contexts where IBRD and IDA are often constrained. And over the life of currently active Trust Funds, nearly half of total contributions were to those with a single-country (as opposed to a thematic, or global) focus, and of these, Afghanistan and Palestine account for around two-thirds (Fig 1).

6
Figure 1. Value of contributions to trust funds by area served (% of total)
Source: World Bank (2019) Notes: Value of all contributions from inception, for all active TFs
It is therefore hardly surprising to find that Multi-bi is on average less focused on low-income countries than is IDA: however, the resulting dilution of the poverty- focus of the combined (Multi-bi and IDA) concessional funding pool remains a valid policy concern.

7
Figure 2. Disbursements from World Bank RETFs
Source: IEG 2011, World Bank Trust Fund Annual Reports (2013b, 2017a), World Bank Annual Reports (World Bank 2007, 2013a, 2018a)
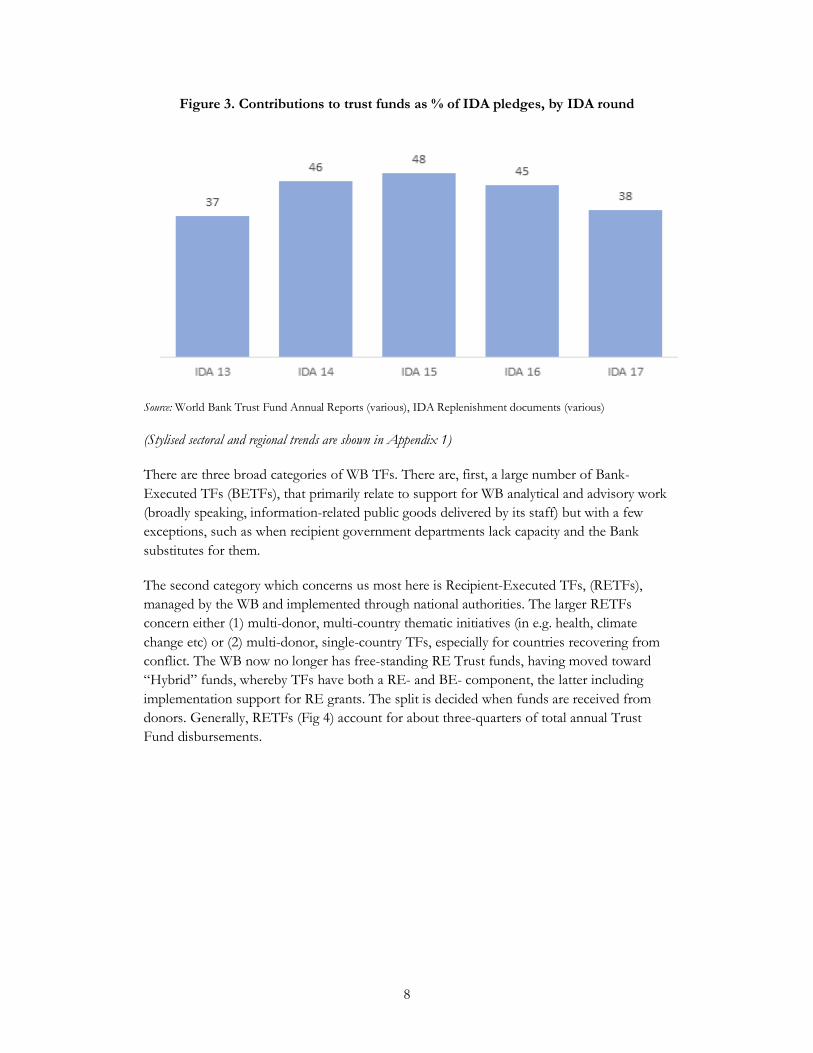
There appears to be a recent plateauing of RETF (Fig 2) both in absolute terms and relative to core windows-but this effect is artificially enhanced by the rise in other (non-donor-grant) resources available to the latter. Direct contributions by donors to IDA have not increased in its most recent replenishment, for example, while other resources (including the innovation of IDA borrowing from financial markets) have increased markedly. A more relevant comparison, between direct donor contributions to RETF and to IDA, produces significantly higher proportions (Fig 3), though these are also declining now. Contributions to trust funds have fallen more than disbursements in recent years, as over previous decades the former has outpaced the latter, meaning that funds accumulated (see Fig A1 in the appendix) . The relative flatness of trust fund disbursements therefore partly reflects prior donor behaviour.
8
Figure 3. Contributions to trust funds as % of IDA pledges, by IDA round
Source: World Bank Trust Fund Annual Reports (various), IDA Replenishment documents (various)
(Stylised sectoral and regional trends are shown in Appendix 1)
There are three broad categories of WB TFs. There are, first, a large number of Bank-Executed TFs (BETFs), that primarily relate to support for WB analytical and advisory work (broadly speaking, information-related public goods delivered by its staff) but with a few exceptions, such as when recipient government departments lack capacity and the Bank substitutes for them.
The second category which concerns us most here is Recipient-Executed TFs, (RETFs), managed by the WB and implemented through national authorities. The larger RETFs concern either (1) multi-donor, multi-country thematic initiatives (in e.g. health, climate change etc) or (2) multi-donor, single-country TFs, especially for countries recovering from conflict. The WB now no longer has free-standing RE Trust funds, having moved toward “Hybrid” funds, whereby TFs have both a RE- and BE- component, the latter including implementation support for RE grants. The split is decided when funds are received from donors. Generally, RETFs (Fig 4) account for about three-quarters of total annual Trust Fund disbursements.

9
Figure 4. Proportion of trust fund disbursements from BETFs and RETFs, 2017
Source: WB Trust Fund Annual Report 2017 (World Bank 2017a)
The third, very large in absolute terms but for present purposes least relevant category, are Financial Intermediary Funds (FIF), which involve the WB administering funds as a trustee and paying agent on behalf of several autonomous institutions, by far the largest being the Global Fund to fight AIDS, Tuberculosis, and Malaria (GFATM). Over three quarters of all FIF disbursements are on behalf of external agencies with their own secretariats, and nearly half (43%) concern GFATM itself. In most cases like this, the WB has no substantive say over the underlying spending allocations, and usually only observer (nonvoting) status on the Board. In others it may also act as an implementing agent downstream, as it does for example for many Global Partnership for Education (GPE) activities. This type of spend is on the whole best analysed at the level of those other international organisations and their policies.
Data on the country and sector allocation of RETFs is not easily matched to that on IDA and IBRD spending, to detect plausible evidence of overlaps and/or possible substitution effects. This is, firstly, because for RETFs, data is not currently reported at a sufficiently disaggregated level. The WB Directory reports total disbursements over the life time of funds, but not the actual years in which disbursements are made. Similarly, although the country of operation is listed for single-country funds, most funds are listed as “global”, with no information about where funds are disbursed. The Trust Fund Annual Reports give regional breakdowns, but not by specific countries.
Second, even if this information were fully trackable in like-for-like form alongside relevant core funding, we could still not identify the full counter-factual, of what spending through IDA in (mostly) loan form would have been, in areas for which TF grants are also available, absent that grant funding. (A limited exception would be those situations where no core-funded operations at all would have been possible due to an absolute prohibition on using

10
IDA, so the Multi-bi grants there are by definition 100% additional, for a transition period anyway).
This substitution problem arises because, money being fungible, both sides of the relationship-the World Bank country staff and the national authorities-will rationally try to optimise the broader available funding basket and switch within it away from harder to softer funds where possible, reallocating savings to what they see as previously un- or under-funded areas/sectors. (Or indeed, sub-sectors. Thus, if TF-funded grants become available for basic education, demand for education loans may be “steered” toward higher education, and so on). So observed funding patterns already build in multiple political adjustments to shifting constraints, for good or bad.
Fungibility is, nonetheless, limited in practice by the different funding cycles and negotiation timings applying to IDA and trust funds, a problem the Bank’s new Trust Fund reforms are trying to mitigate by bringing the cycles closer together. If successful, the trade-offs will become more apparent, and accessible, to client countries.
Another important nuance relates to the fee structure used by the World Bank to recover staff costs related to RETFs. The fee starts at 5% for the first $50 million committed, after which it slowly declines, as set out in table 1 below. (BETFs charge a 17% indirect rate on the cost of personnel).
Table 1. “Indirect” cost of administering trust funds, per funds committed
Range Fee
Up to $50 million 5%
$50 to $500 million 4%
$500 million to $1 billion 3%
Over $1 billion 2%
Source: World Bank DFi 2016
Most of the RE trust funds we discuss here are small enough to incur the highest fee level. Bank staff were reportedly undecided on whether previous fee structures were adequate to cover the full cost of establishing and operating trust funds (Reinsberg 2017).These fees were however, first, deliberately set below 100% of cost recovery in 2015 , and second, fees collected accrue to the overall Bank budget and not the individual units managing the funds. The potential incentive effect is therefore diluted on both counts (World Bank Trust Funds Department, written comments on earlier draft).
This fee structure cannot be compared directly to the 1% levy applied to future contributions for UN development-related activities earmarked to a single agency, single programme or project (see https://undg.org/financing/the-special-purpose-trust-fund), as a

11
key additional resource, as well as an encouragement to work through broader pooled programmes under an invigorated Resident Coordinator system. This example also raises the further questions of (a) whether anything short of full cost recovery for trust funds is aver appropriate in the wider multilateral system, and (b) beyond that, whether some level of additional “congestion charge” is warranted for certain kinds of earmarked activities. In the narrower context of the World Bank and its large and diversified funding platforms, we think a further levy-type adjustment on this scale is unlikely to have a major positive incentive effect on staff, management or donors so we do not propose such an option, but progress with the UN initiative should be carefully monitored.
Finally, tight earmarking by donors of their contribution to pooled RETFs for specific purposes in specific countries is not possible. The donor would need to ask for a separate single-donor trust fund for that purpose (one of the reasons we mark down single-donor TFs in the Index, see later). Softer “preferences” of specific donors for particular components of the TF spend (for certain country categories, for example) can be accommodated within broader TF reporting mechanisms, not financial accounting.
Creatively expanding this whole field of “virtual earmarking”, in the sense of providing convincing ex-post mapping of donor funding to a sufficient range and granularity of outcomes to meet many of their major attribution needs, may be a useful way forward, as discussed below. A paradox of the current set-up is that trust fund donors are already encouraged to avoid preferencing (and prohibited from doing so in pooled funds). That being the case, they could presumably also be offered similar, or at least acceptable, attribution comfort levels through core channels.
Motivations for Multi-bi Support on the Part of Bilateral Donors
There are several well-documented motivations for Multi-bi funding on the part of individual donors. Some have to do with their second-order domestic public finance and internal administrative constraints. Multi-bi offers them the prospect of retaining sufficient control of “bilateral” resources (as Multi-bi is scored as bilateral within ODA) which they may otherwise struggle to spend through their own-managed channels, especially where they have insufficient presence on the ground. They can also reflect a preference among technical staff for using multilateral channels which exceeds the political appetite for multilateral contributions. Multi-bi may also provide a way to get around limits on administrative costs, which may become less visible when they are outsourced to the Bank as a bundle along with programme costs, and of course can be diluted by being pooled with many other donors.
Donor governments are not monolithic, moreover, so Multi-bi may also offer opportunities for departments with different interests, and perhaps lacking direct implementation channels of their own, to take a seat at the table. It may also be that Multi-bi helps groups of donors co-ordinate otherwise fragmented bilateral interventions among themselves: however, the evidence on this co-ordinating effect is at best mixed (Barakat 2009).
12
More fundamentally, Multi-bi responds to donors’ deep-seated need to be seen to drive the focus of multilateral institutions’ activities further and faster toward their own priorities than they believe feasible by relying entirely on the organisations’ core systems.
Our perspective on this last point combines elements of the much-documented twin needs for visibility/attribution and control (e.g. IEG 2011, Reinsberg et al. 2015, Reinsberg 2017) but focuses more attention on perceived or actual institutional gaps and failures in the institution’s core design and governance process, relative of course to changing international agendas. Trust funds are in that sense an admission of defeat, not a success-they create the impression of driving forward an agenda, while the essence of the institution, and its rigidities, remain unchanged.
In the WB case, a business model set up seven decades ago to provide loans (initially on a non-concessional basis) to individual sovereign states has been seriously stretched, some observers believe too far (Birdsall and Morris, 2016) by agenda expansion in at least two other simultaneous directions. The first concerns operating in fragile and failed states, or rather the limited relevance of sovereign loans where there is a vacuum of sovereignty, or where major debt restructuring must precede any further lending.
The second and even broader limitation is in the funding of global and regional public goods, where it is not reasonable to expect individual nation-states to borrow on their own account for activities primarily benefiting other states (i.e. externalities). There are subtler versions of this gap where, e.g. a middle-income country hosts many displaced persons from its conflict-affected neighbours and would consider employment-related investments for them, but preferably on concessional terms, reflecting the international community’s broader stake in maintaining sustainable migration flows (Kharas and Rogerson 2017)).
In such cases (see for example the World Bank’s Concessional Financing Facility, CFF), a dedicated Multi-bi-type fund can be a timely work-around, especially in emergency contexts. It is an alternative to a first-best restructuring of the institution to be able to tackle GPGs across a wider spectrum (Birdsall and Morris, op cit.), which could be a complex undertaking at best and might not garner enough support across the collective membership to achieve lift-off. The same applies to hypothetical changes in the WB’s Articles of Agreement to allow it to lend more flexibly to non-sovereigns without sovereign guarantees. But the mosaic of such workarounds has become arguably so large, and deep, that the case for a first-best revision of some of the core arrangements has become stronger. Meanwhile, unfortunately, the very existence of a work-around has deferred or deflected the momentum for necessary institutional reforms.
These uncertainties and limitations of collective action can go well beyond changing regulatory barriers to “do the right thing”, even if not foreseen in the original core institutional design. Some policies affecting core funding windows may also be the result of periodic political pressures from a significant minority, or even a single country, on both the core governance body and the management, pressures seen as unavoidable and/or irreversible by other players. Historical examples include the US’s strong preference for international competitive bidding, limiting the scope of budget support using national

13
systems, and the effect of, for example, UN Security Council revolving membership on the participants’ World Bank borrowing levels (Dreher et al, 2008). In UN space, some have also suggested there is “negative exceptionalism”-donors who overtly support UN agencies via Multi-bi because they would definitely prefer their core budgets to rise, but at the same time realise there is not enough support in the collective for that course of action (Graham, 2016).
Risks and Costs of Multi-bi for Client Countries and the Institution
A. Distorted country choices. Multi-bi, particularly when funding large grants for specific thematic priorities across many countries (health, climate change, education etc), is vulnerable to the charge of distorting client country choices, by subsidizing some relative to others. This is especially unfortunate for a “lending” institution, steeped in a culture of responding to “client” demand, not just top-down advocacy of its own development priorities.
What happens in practice, however, when Multi-bi limited to specific applications is added to core country funding envelopes, themselves constrained either by performance-based country allocation formulas (IDA) or less obviously, by staff-led country risk assessments and fiduciary exposure limits (IBRD)?
As introduced earlier, client countries and their WB counterparts already face incentives to make constant adjustments and substitutions within this expanded overall (core and Multi-bi) country concessional funding envelope, including by favouring the use of grants and blends for investments without obvious matching revenue streams, versus harder loan terms for the rest.
Money being fungible more widely, borrowing governments may also be willing and able to neutralise the intended earmarking effect of the additional Multi-bi by recourse to domestic revenues and/or other non-earmarked sources, such as sovereign market borrowings. Actual fungibility depends partly on the relative size of the earmarked funding stream compared to other sources at government disposal, and partly on the skills and political reach of the national authorities. The latter include the ability of the ministry of finance to set and monitor spending limits at sectoral or lower levels, or conversely the ability of the external partner to control, or even detect, such spending adjustments (Foster and Leavy, 2001).
At one extreme (think of India), some countries clearly have all the required capacities to such an extent that even project-level external funding can be turned into the effective equivalent of foreign exchange support, as the relevant substitutions are implemented at all domestic budget levels. At the other extreme, finance authorities of highly aid-dependent, low-capacity countries cannot realistically neutralise grant-funded earmarks completely, may not even try to do so, and might not even be fully aware of their size and specific purpose. In that case the sectoral ministries’ budgets may well expand by a large percentage of the relevant Multi-bi grant, i.e. distorting previous spending allocations at the margin to a marked extent.

14
This discussion is complicated by the explicit connections made between at least one major category of Multi-bi and World Bank core funding. In these constructs -typified by the Global Financing Facility (GFF) for reproductive, maternal and child health - Multi-bi grants are deliberately combined in a package deal with a much larger envelope of IDA or IBRD loans, effectively earmarking a slice of core funding for that purpose. Whether that funding would have been a serious standalone option even without the Multi-bi “lubricant” is a moot point, as there is no natural experiment available to test that proposition.
In terms of potential regional distortion of the combined (core + Multi-bi) WB focus, there may be the further question of donors trying to pull the WB centre of gravity in directions to which it is simply not suited. There may also be regional-based institutions that could do this better, so this could represent a misallocation across the multilateral system: most independent assessments (see, for example, Barder and Rogerson, 2019) score the better regional banks as equally if not more effective compared to the WB. There is a fair counterargument that their joint shareholders are surely best placed to exercise their option one way or the other, assuming that choice is deliberate in terms of timelines and evidence.
When we look at the regional distribution of RETFs by donor (Fig 5), we tend to see a few major donors pulling in different directions, with a handful of major departures from the IDA geographic pattern (itself concentrated heavily on Africa and South Asia). The total regional TF distribution, at least by number if not size, however, is not that dissimilar to IDA - notwithstanding a slightly lower proportion of disbursements in Africa, probably reflecting the inclusion of IBRD funds. The implication is that these outlier preferences tend to cancel each other out, leaving, on average, a reasonable level of complementarity between IDA and RETFs. Fungibility also operates at this level: donors whose regional preferences are anyway most aligned to IDA presumably have little incentive to place additional Multi-bi on regional grounds, so the outliers, like Australia, tend to stand out more.

15
Figure 5. Distribution of trust funds specific to each region, and distribution in 2017 of IDA / trust fund disbursements
Source: World Bank Annual Report 2018 (World Bank 2018a), World Bank 2019
Notes: ARTF (Afghanistan Reconstruction Trust Fund) accounts for roughly one third of trust fund disbursements and skews the distribution towards South Asia. For distribution of the number of trust funds by region, those listed as “Global” cannot be attributed and so are not included.
While the country substitution/distortion risk is therefore not lightly dismissed, there are arguably mitigation strategies and partial offsets available which could be deployed and expanded. One of them is simply to refrain from thematic earmarking, or quasi-earmarking, of IDA, as discussed below.
B. Institutional hollowing out. A potentially more dangerous effect, dynamically, is the “hollowing out” of the core institution itself, as donors setup elaborate and (arguably) legitimate core processes to ensure strategic funding coherence, and then increasingly bypass them in a blur of “shadow” governance arrangements. The classic metaphor here is the “Tragedy of the Commons” (after Hardin, 1968), whereby individual actors, left unchecked, have incentives to deplete shared resources benefiting them all.
This hollowing out works in two related ways. First, staff and management attention and capacity are increasingly pulled away from hitherto core activities, including as we surmise above, by having intellectually exciting agendas to develop along with their donor counterparts, as well as significant additional financing for targeted analysis and design work supporting those agendas.
Second, the locus of power and accountability gradually shifts away from the broader collective, with its wider purposes and legitimacy, and toward a narrower set of contracting roles. In effect, instead of a broad-based and dynamic member collective with member privileges and obligations, the institution increasingly becomes viewed as a mere instrument

16
to implement the spending choices of relatively few wealthy sponsors, leaving others as passive bystanders. The relationship focus shifts from one of actively belonging to the whole to a more instrumental one of “client and contractor”.
What might the longer-term consequences of such a trajectory include? One is clearly a cumulative loss of trust and buy-in from important non-donor (or non-traditional-donor) constituencies, including the non-OECD G20 members, who increasingly have alternative reference-points in the multilateral bank spectrum (like AIIB, NDB etc). This does not start and end with trust funds, rather is a product of wider challenges of governance, voice and representation, for which the hollowing-out via multi-bi funding is a further aggravating factor. This process is not easily reversible. Some believe also that ever-increasing institutional complexity eventually generates major stresses and instability in its own right, sometimes with severe consequences. (see e.g.Tainter, 1988).
Has the WB, however, recently begun to find an equilibrium point where the growth of Multi-bi has slowed, and is perhaps starting a prolonged period of decline in terms of its importance relative to the core, especially IDA?
This is not yet clear, although growth of RETF as a share of core funding has now ostensibly peaked (Fig 3). The headline success of IDA18 replenishment ( $75 billion, record levels, (World Bank 2017b)) reflects more the policy choice of tapping market borrowings, leveraged on IDA’s under-utilised balance sheet, than any increase in fresh donor grant resources for IDA. The latter have in fact remained roughly constant and even fallen slightly between the last two replenishments. And market borrowings will suck in further donor grants to bridge funding costs and concessional lending terms, for years into the future.
It is against this alternative use of concessional funding that Multi-bi grants ideally need to be compared. On this basis, Multi-bi is nearly 40% of the total. This represents an upper-bound on what could potentially be redirected to core IDA if Multi-bi funding were eschewed. The actual number will be lower: some funds will continue to operate in countries, or for purposes, which IDA cannot. Nevertheless, core donor resources could be expanded substantially if Multi-bi funds were somehow folded back into the core. Below, we calculate that if trust fund donors who contribute more than the median DAC level were just to lower their future contribution to that median level– which seems a reasonable goal – then up to 30% additional core IDA grant contributions could be mobilised at no additional cost to taxpayers.
We turn now to how that might be done.

17
Some Useful but Insufficient, and Some Potentially Damaging, Policy Responses
The World Bank is undertaking a comprehensive process of “Trust Fund Reform” with the overall objectives of (1) improving the fit and coherence of TF with the Bank’s core policies and systems and (2) reducing administrative burdens and fragmentation as far as possible, The most recent annual TF report (World Bank, 2017a) states the aim as that TFs should "reflect the highest priorities for the institution, reduce transaction costs, make more efficient use of resources, strengthen the results focus, and promote more active strategic management at the corporate, Global Practice, and Region levels." The Bank is now in the fourth of a series of phases of this reform, the third of which ended in 2017.
The most visible reform feature is a move to consolidate multiple TFs, including RETFs, in a logical framework of larger clusters or “Umbrella Funds”, grouped by country and thematic areas (managed by the respective regions and global practices). This is intended as a transition toward a near future where umbrella funds will channel the majority of donor contributions and the subsidiary funds will gradually be phased out. New smaller funds will still have to be accommodated outside the umbrellas in specific cases (e.g. a promising new area which is not yet an umbrella priority for the WB. (Communication received from Trust Funds Department).
There are some obvious direct, and more subtle indirect benefits that could be reaped by this large-scale undertaking. Donors are clearly being “nudged” in the direction of fewer, looser preferences rather than more and narrower quasi-earmarks. There may well be significant transactions savings over time, but some gains will be deferred as the bulk of costs are incurred up-stream during the fund (including umbrella fund) set-up, as against in terms of downstream running costs (see e.g. Reinsberg 2017 p.193 - interviews with Bank staff). Nonetheless, there will be significant short-term savings also through sharing governance and reporting overheads.
Finally, staff, particularly in global practices, are being forcefully encouraged to define fewer and more coherent strategies for these umbrellas, in closer relation to their strategic take on their area of the WB’s core business, rather than continue to seek Multi-bi funding on a free-for-all, bottom-up entrepreneurial basis. The latter, it must be said, is one of the WB’s historic strengths, and arguably aligns with current staff incentives.
Set against these potential improvements is the reality that the thrust of such reforms does not address all, or nearly enough, of the underlying Multi-bi problems described above, notably the distortion of country/thematic demand and hollowing out of the institutions’ core governance and legitimacy. However, by reducing “noise” and clustering Multi-bi funds into fewer, larger groups, they may have the collateral effect of making these problems more visible, a necessary condition to addressing them directly.

18
Financial incentives. Above, in referencing the UN 1% levy on “tight earmarking”, we raised the option of tax-like instruments against some of its distortionary effects but argued that on balance the incentive effect was likely to be too small in the case of the World Bank’s already more diversified and robust funding platforms. Perhaps more targeted levies-to discourage single-donor trust funds in particular-may have more beneficial impact and could be considered later, based also on experience with implementing the UN reforms.
IDA windows-a slippery slope? A quite different development is happening within core IDA itself, through innovations already introduced in the previous and current (IDA 18) replenishment and perhaps extended in the upcoming IDA 19 round. This concerns the establishment of several set-aside “windows” or “facilities” within the IDA core for particular thematic initiatives:
• The initial point of departure was the ($3.1 billion approx., to November 2018) Crisis Response Window, starting in IDA 16, effectively a reserve for timely responses to unpredictable events, such as disasters and other emergencies, over and above normal country allocations. This (now capped at a maximum 5% of IDA, and with disbursements slowing down appreciably) is an earmark, of sorts, but one justified by multiple uncertainties that, as yet, cannot entirely be covered by a growing portfolio of insurance-type instruments, like the new Pandemic Risk Facility. It is effectively an IDA reserve fund, and has served with distinction, for example in the wake of the Ebola Crisis (World Bank 2018b).
• Different motives led to the ($2.5b) Private Sector Facility in IDA18, entrusted to the WB’s private sector arms, which aims to mobilise additional resources from private sector investments in low-income countries via tools like guarantees and blended finance. This is also a set-aside from the pool of IDA country allocations (bearing in mind that the latter nonetheless grew very rapidly in IDA 18 thanks to market borrowings). It is given to the International Finance Corporation and MIGA to administer and has come under some criticism (e.g. Kenny, 2018) as a loosely defined and arbitrarily sized subsidy envelope that detracts from public sector choices on IDA.
• Two other major windows of note were introduced in IDA18:
o First, a Regional Sub-Window for Refugees ($2b), which channels additional IDA to IDA-eligible countries hosting refugees and displaced persons from their hinterland (14 identified as of November 2018, including Pakistan, per IDA 18 Fact Sheet), for investments in their social and economic integration. These set-aside funds are available in 100% grant terms for severely debt distressed countries and 50% grant and 50% credit terms for moderately or low-debt distressed ones. (The practical effect of these terms is a further grant subsidy for the last category, which they would not get from normal IDA allocations).

19
o Second, IDA then introduced a much larger ($6.2b) “Scale Up” Facility, offering additional funding on, in this case, IBRD terms, over and above country IDA allocations, for projects/programmes in IDA and Blend countries with “”potential for strong returns on investment, development impact and growth dividends”, and a clear preference for low-debt-risk countries and those with strong institutional assessment scores. Further requirements are that “ particular attention will also be given to “soft prioritization filters,” which may include an operation’s ability to crowd in resources; support resilience building; deliver benefits across borders, including infrastructure in line with low carbon development; and/or drive economic transformation, including through support of countries’ nationally determined contributions” (World Bank, 2017c) . To the extent that there are at least implicit earmarks embedded here, starting with the financial terms, they are toward so-called productive infrastructure investments.
This brief and doubtless incomplete round-up already shows how far the core IDA instrument is diversifying, perhaps splintering, in two directions. First, it has introduced direct or implied thematic earmarks through set-asides outside the country allocation pool, relevant especially to the private sector, refugee and scale-up facilities. And second, it is moving IDA further away from performance-based allocation (PBA) criteria, which is entirely legitimate for the Shocks Facility but potentially more troublesome for the Private Sector Window, in particular. (We are not here defending performance-based aid allocation models, which have their well-known defects, merely pointing out an inherent policy tension. At some point you must either acknowledge alternative allocation principles within a single instrument, or split the instrument into several slices, each with its own principle. Neither solution is fully satisfactory).
In the longer horizon, there is a bigger risk that such set-asides decided in boom years, when overall IDA country allocations were growing fast anyway, become entrenched. Then, if and when funding constraints start to bite, this patchwork of inherited earmarks could prove unsustainable. In the meantime, it is anyway of no great help, and perhaps sets a bad example, for the wider institutional dangers posed by Multi-bi funding.
Two Better and More Sustainable Solution Tracks
Sustainable solutions to the problems caused by Multi-bi are more likely to lie elsewhere. We suggest effort be concentrated on two related tracks. First, develop and implement better “dashboard” tools to map core activities and outputs more systematically to priorities that are championed by individual donors. Second, bring all major proposals for funding new priorities automatically into the institutions’ main decision fora, meaning Board approval, probably on a no-objections basis, and thence progressively into core funding. New priorities sponsored by member minorities could still be adopted, providing they are (collectively) judged both (a) consistent with the intent of the collective and (b) demonstrably additional to donors’ core contributions (i.e. not requiring reallocation of core funding away from existing priorities).
20
On the first point, it is obviously impossible to assign to every development input-output-outcome chain funded by the likes of IDA a unique “godparent” donor, to the exclusion of all others, just as it is now impractical to create an audit trail for every Trust Fund individual donor dollar (or yuan), right down to that bicycle outside that health centre, and so on.
Short of that, however, as the world of ethical investing has long shown the way, there is probably be a feasible way to design a sufficiently persuasive set of metrics associated with different ranges of funder preferences and providing them satisfactory feedback and accountability. This would mean having a sufficiently large array of outputs (and where possible, outcomes) linked persuasively and in real time to programme spending in all major sectors and thematic priorities. The classic example is Green Bonds, and their associated end-purposes of funding, whereby bond buyers are told in which countries and for what climate-change purposes the proceeds of their funding will be, and have been, directed. Sweden’s Swedfund is, for example, already working with World Bank staff to pilot a battery of such metrics for future “ethical bonds” over a wider spectrum of outcomes, such as health and education as well as environmental objectives. Private investors and citizens might perhaps have lower standards for such reporting than do bilateral donors, but we cannot assume that to be the case, or at least bilaterals could be constructively engaged in the search for a happy medium. (We need also to bear in mind that earmarking of TFs themselves is itself increasingly becoming “virtual”, per section 2 above.)
There will most likely be some reasonable level of aggregation, linked to enough evidence of commensurate contributions supplied by individual funders associated with desired outputs and, preferably, outcomes, to satisfy legitimate needs for plausible attribution-even if more than one member of the club ultimately claims a stake in the same, or similar, outcomes.
On the second proposal, of what stops Multi-bi proposals from being considered in “committees of the whole”, we suggest investigating, first what a simplified screening process might look like and second, framing practical tests for how far minority proposals on particular priorities can be accommodated within core instruments like IDA, and not. Management would need to exercise greater oversight to ensure that new funds are aligned with WB strategies and priorities.
Multi-bi donors might well be uncomfortable with subjecting “their” initiatives to meaningful collective scrutiny, implying some risk of rejection. An intermediate step might therefore be to, first, require much greater transparency from all trust fund proposals, for example on their alignment with core objectives and coverage of associated admin costs. Second, it could involve an agreed framework for maintaining additionality between core and multi-bi funding for each (substantial) donor. One possible model for this is the minimum standard contribution benchmark as applied in the case of Concessional Partner Loans to both IDA and the African Development Fund, using a reference floor of 80% of previous grant-equivalent contributions.

21
Potential financial impact. As presented above (Fig 3), DAC donor grants flowing into World Bank RETFs have recently averaged around 38% of their IDA contributions. We do not expect, nor would it be realistic to expect, that all new TF contributions be switched immediately into core funds. However, we have calculated what the effect would have been if during the IDA 17 period, all donors above the median level of TF contributions ($17 million on average across the period) had reduced them to the median and transferred the difference to IDA, all else unchanged. The result would have been an increase in their overall IDA contributions of nearly 30%1. This also points to the relatively skewed distribution of Multi-bi donorship, to which we now turn.
Responsible Multi-bi Donor Index: Preliminary Results
This index encapsulates the arguments made above about the potentially corrosive effects of excessive use trust funds. We combine data from the OECD on flows of Multi-bi aid, with information from the Directory of Programmes Supported by Trust Funds (World Bank 2019). While the intention is to capture the use of Multi-bi aid in general, information on the use of Multi-bi through the World Bank is somewhat more readily available (the caveats above notwithstanding), so we use this information as a proxy for use of Multi-bi aid more generally.
We combine three indicators that address different aspects of Multi-bi use into an overall index, based on (1) Multi-bi ODA as a percentage of all funds channelled through multilaterals, i.e. the sum of Multi-bi and core multilateral ODA, (2) the total number of World Bank trust funds participated in by each donor, and the (3) the percentage of these that are single-donor. More details on these indicators, and justification for their selection is given in Appendix 2. We use this index to rank DAC donors whose overall aid spend in 2017 was above $500 million.
This simple index should naturally be approached with caution. Only three indicators are used, and there may be many more relevant factors in the extent to which a donor’s use of Multi-bi aid is problematic or justifiable. As discussed above, some trust funds are necessary to overcome current deficiencies in core multilateral funding, or when achieving a worthy goal through core funding might be opposed by a minority of the membership, leading others to establish a trust fund as a second-best solution. Nevertheless, these indicators capture what we regard to be important aspects of Multi-bi funding.
Following the methodology used in the Commitment to Development Index (Robinson et al., 2018) in each case, these indicators are standardized and re-centred around five. The scores have been inverted so that higher numbers suggest a more responsible approach to Multi-bi ODA (for example, a lower percentage of single-donor trust funds leads to a higher
1 This analysis excludes countries in each year which do not contribute at all to TFs. If included, then this figure rises to 34%.

22
core). Each indicator has been giving equal weightings: they are summed to form a combined index with an average of 15. Figure 6 shows the results of this index.
Figure 6. Responsible Multi-bi Donor Index (World Bank Version)
Source: Authors’ elaborations on OECD DAC Stats, World Bank 2019
By this measure, the most responsible user of Multi-bi aid is Poland. Among countries considered, Poland participates in the fewest trust funds, none of which are single-donor, and their share of Multi-bi aid as a proportion of their total use of the multilateral system is moderate. However, Poland’s score is flattered by their contributions to EU development programmes, which account for nearly all of their multilateral aid, and are semi-automatic within the wider EU budgetary settlement. After Poland, France scores highest, mainly as a result of comparatively low use of Multi-bi aid.
At the other end, the EU Commission2 ranked the lowest. As a multilateral institution in itself, the EU Commission occupies an unusual position in this group. Its substantial use of Multi-bi aid reflects its limited ability to justify allocating pooled contributions by bilateral EU members to core-fund other multilaterals. Nevertheless, it is included here for reference purposes as its Multi-bi activity still risks having negative effects, and it is one of the largest backers of single donor trust funds. The UK is ranked second worst; it scores slightly above average on two indicators but participates in roughly three times as many trust funds as the
2 The European Investment Bank also funds four trust funds hosted at the World Bank, three of which the EU Commission also participates in.
0
15
Multi-bi as % of (core multi + multi-bi) Total TFs participated in % SDTFs

23
average among these countries. In the UK the decision to establish a trust fund partnership with World Bank staff is quite decentralised, and the latter are often seen as the most effective delivery partner. Switzerland also stands out on this indicator and participates in the second largest number, despite having a much smaller ODA programme.
Those familiar with the Commitment to Development Index (CDI) produced by CGD may notice that there is a (weak) negative correlation between the aid component of the CDI, and this Responsible Multi-bi index. This is driven entirely by the “aid quantity” component of the CDI, as there is also a negative correlation between donors’ rank on the Multi-bi index and the overall size of their aid programme. The CDI aid component also ranks donors on “aid quality”, which focuses on bilateral aid and includes such measures as percentage of aid tied, and reporting transparency. There is therefore no correlation between the “aid quality” dimension of the CDI aid component and this Multi-bi index. This is not surprising: our goal in producing the new Index is to highlight just one aspect of the broader aid effectiveness spectrum.
Although there is this weak negative correlation between the overall size of donors and their rank in the index, the position of France and Italy at the higher end – both of which countries have substantial aid programmes – suggests that there is nothing inevitable about the use of trust funds increasing in line with overall aid budgets.
Summary of Recommendations
1. Multi-bi donors should be encouraged to route all their new contributions through multilaterals’ core funding mechanisms and their governance processes. The latter should confirm that the new programme is coherent with core policies and attracts sufficient additional resources.
2. Donors to core funds should be offered more systematic, persuasive and specific “virtual earmarks’ to satisfy their domestic needs for attribution and visibility.
3. The World Bank and other multilaterals should make information on Multi-bi financing publicly available to the same standards of transparency as they do for core funding.

24
References
Barder, O. and Rogerson, A., (2019) “The Two Hundred Billion Dollar Question: How to Get the Biggest Impact from the 2019 Replenishments” CGD policy paper 137, February 2019
Barakat, S. (2009): “The failed promise of multi-donor trust funds: aid financing as an impediment to effective state-building in post-conflict contexts” Policy Studies 30:2, 107-126
Birdsall, N. and Morris, S. (2017): “Toward Better Multilateral Development Banks: Can the United States and China Lead Together?” Center for Global Development
Dreher, A. et al. (2009): “Development aid and international politics: Does membership on the UN Security Council influence World Bank decisions?” Journal of Development Economics 88 1–18
Foster, M. and Leavy, J. (2001): “The Choice of Financial Aid Instruments” Overseas Development Institute
Graham, E. (2016): The institutional design of funding rules at international organizations: Explaining the transformation in financing the United Nations” European Journal of International Relations 1-26
Gulrajani, N. (2016): “Bilateral versus multilateral aid channels” Overseas Development Institute Hardin, G. (1968): “The Tragedy of the Commons” Science 162 (3859):1243-1248 IEG (2011): “An Evaluation of the World Bank's Trust Fund Portfolio: Trust Fund Support
for Development” Washington, DC: Independent Evaluation Group, the World Bank Group Kenny, C. (2018): “A Review of the Mid-Term Review of the IDA Private Sector Window”
Center for Global Development Kharas, H. and Rogerson, A. (2017): “Global development trends and challenges: horizon
2025 revisited” Overseas Development Institute OECD (2015): “Multilateral Aid 2015: Better Partnerships for a Post-2015 World” OECD
Publishing OECD DAC Stat: Creditor Reporting System (accessed June 2019) OECD DAC Stat: DAC1 (accessed June 2019) Reinsberg, B. (2017): “Trust funds as a lever of influence at international development
organisations” Global Policy pp.85-95 Reinsberg, B. et al. (2015): “The rise of Multi-bi aid and the proliferation of trust funds”
Handbook on the Economics of Foreign Aid pp.527-554 Robinson, L. et. al. (2018): “The Commitment to Development Index: 2018 Edition,
Methodological Overview paper” Center for Global Development Tainter J. (1988): “The Collapse of Complex Societies” Cambridge University Press Winters, J. and Sridhar, D. (2017): “Earmarking for Global Health: benefits and perils of the
World Bank’s trust fund model” BMJ 358:j3394 World Bank DFi (2016): “Directive: Bank Directive Cost Recovery Framework for Trust
Funds” World Bank Group World Bank (2002): “Additions to IDA resources: Thirteenth Replenishment” World Bank
Group

25
World Bank (2005): “Additions to IDA resources : Fourteenth Replenishment (IDA14) - working together to achieve the Millennium Development Goals” World Bank Group
World Bank (2007): “World Bank Annual Report 2007” World Bank Group World Bank (2008): “Additions to IDA resources: Fifteenth Replenishment (IDA15)” World
Bank Group World Bank (2011): “Report from the Executive Directors of the International
Development Association (IDA) to the Board of Governors : additions to IDA resources - sixteenth replenishment - delivering development results” World Bank Group
World Bank (2013a): “World Bank Annual Report 2013” World Bank Group World Bank (2013b): “Trust Fund Annual Report 2013” World Bank Group World Bank (2014): “Additions to IDA resources : seventeenth replenishment - IDA17:
maximizing development impact” World Bank Group World Bank (2017a): “Trust Fund Annual Report 2017” World Bank Group World Bank (2017b): “Additions to IDA Resources - Eighteenth Replenishment” World
Bank Group World Bank (2017c): “IDA18 Scale-Up Facility: Overview” World Bank Group World Bank (2018a): “World Bank Annual Report 2018” World Bank Group World Bank (2018b): “IDA18 Mid-Term Review : Implementation and Results Progress
Report” World Bank Group World Bank (2019): “Directory of Programs Supported by World Bank Trust Funds 2018”
World Bank Group

26
Appendix 1. Stylised facts on World Bank Trust Funds
Figure A1. Contributions and Disbursements from IBRD/IDA Trust funds ($millions)
Contributions to trust funds have been falling for a number of years, but disbursements have held relatively stable. As of 2017, IBRD/IDA trust funds held $9 billion in trust.
Source: World Bank Trust Fund Annual Reports (various), IEG 2011
Figure A2. Average disbursement per trust fund, $million (with and without ARTF)
Source: World Bank Trust Fund Annual Reports (various), IEG 2011

27
Figure A3. Number of single- and multi-donor trust funds
The World Bank has made an effort to move away from smaller, proportionally more expensive single-donor funds, which has been reflected in the steady decline of active SDTFs.
Source: World Bank Trust Fund Annual Reports (various), IEG 2011

28
Table A1. Regional Comparison of RETFs and IDA
Africa East Asia Pacific
Europe and Central Asia
LAC Middle East North Africa
South Asia
RETF disbursements ($ billions)
2009 0.9 0.6 0.1 0.1 0.4 0.8
2010 0.9 0.5 0.3 0.2 0.4 0.5
2011 1.0 0.7 0.2 0.2 0.3 0.7
2012 1.2 0.6 0.3 0.2 0.4 0.8
2013 1.1 0.6 0.1 0.2 0.3 1.0
2014 1.0 0.4 0.1 0.2 0.4 1.1
2015 1.2 0.4 0.1 0.2 0.4 1.1
2016 1.0 0.3 0.1 0.2 0.4 1.3
2017 0.9 0.3 0.1 0.2 0.2 1.1
IDA disbursements ($ billions)
2009 4.3 1.3 0.5 0.2 0.2 2.8
2010 5.9 1.6 0.5 0.2 0.2 3.0
2011 4.9 1.2 0.6 0.3 0.2 3.0
2012 5.7 1.5 0.5 0.3 0.1 2.9
2013 5.8 1.8 0.5 0.3 0.2 2.7
2014 6.6 1.5 0.5 0.3 0.3 4.3
2015 6.6 1.5 0.3 0.4 0.2 3.9
2016 6.8 1.2 0.4 0.3 0.0 4.5
2017 6.6 1.2 0.3 0.2 0.4 4.0
RETF as % of IDA
2009 20.7 45.6 20.0 44.4 200.0 28.6

29
2010 16.9 35.9 54.8 90.0 200.0 16.8
2011 20.4 58.9 29.7 71.4 151.4 22.9
2012 20.9 40.3 60.0 60.0 365.0 27.1
2013 18.8 32.9 16.1 64.3 144.7 36.1
2014 15.1 27.4 19.3 65.4 146.5 25.8
2015 18.2 26.7 31.8 52.2 206.2 28.1
2016 14.7 24.9 27.4 66.0 909.1 29.1
2017 13.6 26.2 32.3 87.3 51.2 27.7
30
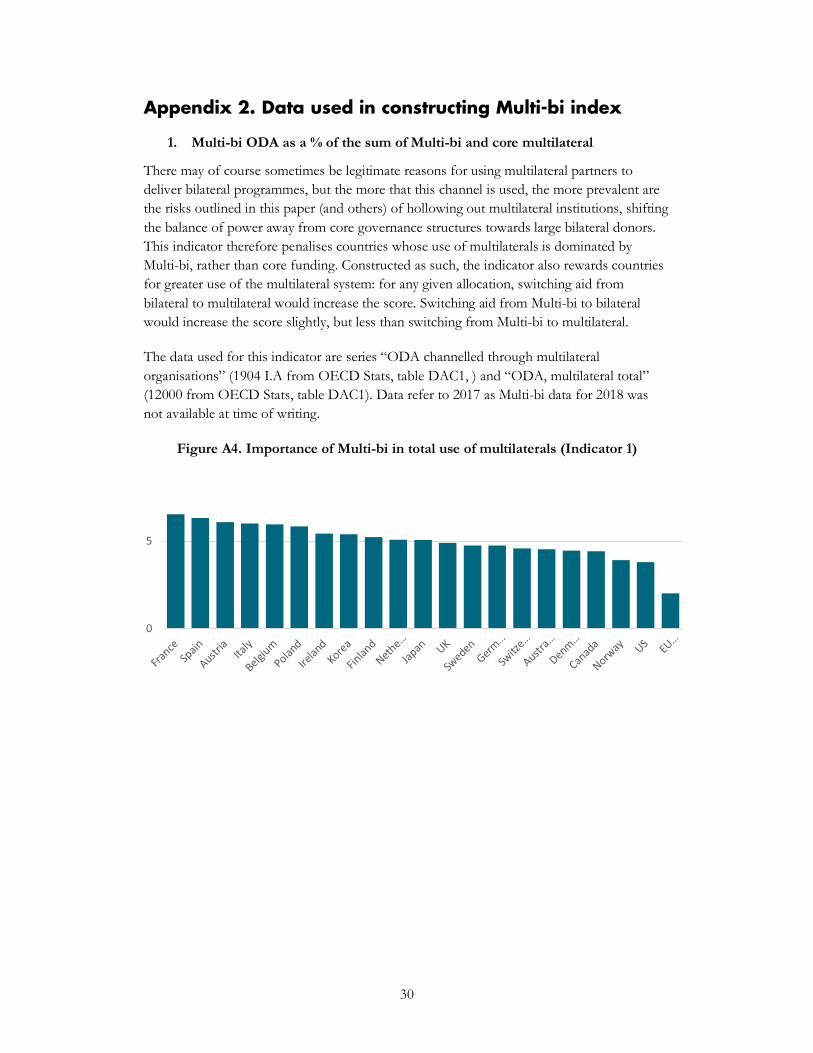
Appendix 2. Data used in constructing Multi-bi index
1. Multi-bi ODA as a % of the sum of Multi-bi and core multilateral
There may of course sometimes be legitimate reasons for using multilateral partners to deliver bilateral programmes, but the more that this channel is used, the more prevalent are the risks outlined in this paper (and others) of hollowing out multilateral institutions, shifting the balance of power away from core governance structures towards large bilateral donors. This indicator therefore penalises countries whose use of multilaterals is dominated by Multi-bi, rather than core funding. Constructed as such, the indicator also rewards countries for greater use of the multilateral system: for any given allocation, switching aid from bilateral to multilateral would increase the score. Switching aid from Multi-bi to bilateral would increase the score slightly, but less than switching from Multi-bi to multilateral.
The data used for this indicator are series “ODA channelled through multilateral organisations” (1904 I.A from OECD Stats, table DAC1, ) and “ODA, multilateral total” (12000 from OECD Stats, table DAC1). Data refer to 2017 as Multi-bi data for 2018 was not available at time of writing.
Figure A4. Importance of Multi-bi in total use of multilaterals (Indicator 1)
0
5

31
2. Total number of (active) RETFs in which a donor participates
Even conditional on the same total level trust fund contributions, there can still be varying effects on fragmentation, and the extent to which these contributions distort core priorities. One donor could give $100 million all to the ARTF, a fund operating in a country in which IDA (at some point) cannot, and another donor could give $10 million to ten small dispersed trust funds, each pulling the bank away from its core priorities. The latter clearly has more potential to be damaging in the ways we have described. To capture this, we include the total number of active World Bank RETF trust funds to which donors have contributed. The focus on trust funds solely at the World Bank is based on data availability. It should also be noted that the Directory (World Bank 2019) lists contributions since fund inception. Donors may be listed as a participant despite not having made a contribution in a number of years. If there are donors who have significantly reduced the number of funds to which they contribute, this will not be reflected.
Figure A5. Total use of WB RETFs (indicator 2)
0
5
32
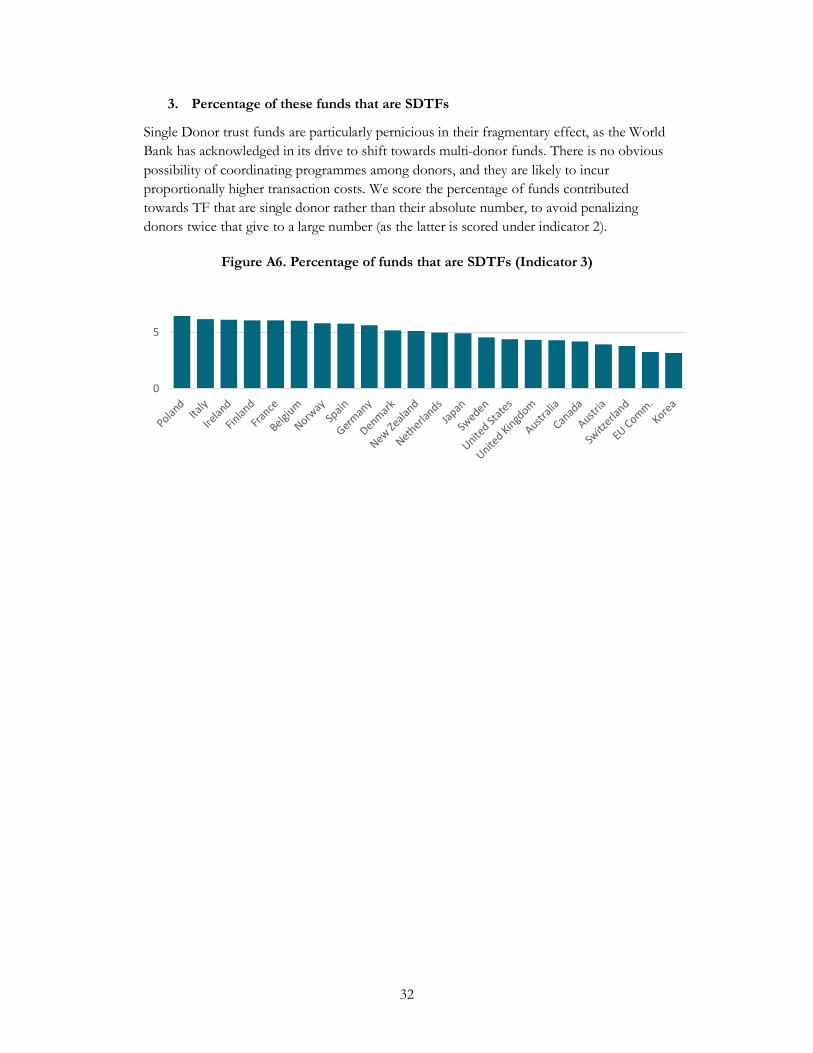
3. Percentage of these funds that are SDTFs
Single Donor trust funds are particularly pernicious in their fragmentary effect, as the World Bank has acknowledged in its drive to shift towards multi-donor funds. There is no obvious possibility of coordinating programmes among donors, and they are likely to incur proportionally higher transaction costs. We score the percentage of funds contributed towards TF that are single donor rather than their absolute number, to avoid penalizing donors twice that give to a large number (as the latter is scored under indicator 2).
Figure A6. Percentage of funds that are SDTFs (Indicator 3)
0
5

33
Table A2. Indicator raw values
MB as % of (core +MB) Total TFs participated in % SDTFs
EU Comm. 91.5 105 43.8
UK 36.9 149 28.9
Switzerland 42.6 113 36.3
US 57.5 67 28.4
Canada 45.8 74 31.1
Australia 43.6 65 29.2
Sweden 39.5 73 26.0
Norway 55.3 77 9.1
Netherlands 33.2 80 20.0
Denmark 45.1 63 17.5
Korea 27.3 20 45.0
Germany 39.6 53 11.3
Japan 33.7 38 21.1
Austria 14.3 35 34.3
Finland 30.4 37 5.4
Ireland 26.6 21 4.8
Italy 15.6 25 4.0
Spain 9.6 21 9.5
Belgium 16.7 17 5.9
France 5.4 36 5.6
Poland 18.8 2 0.0

34
Table A3. Indicator scores
Indicator 1 Indicator 2 Indicator 3
MB as % of (core + MB) Total TFs participated in % SDTFs
Poland 5.84 6.50 6.46
France 6.54 5.55 6.05
Belgium 5.95 6.08 6.03
Spain 6.32 5.97 5.76
Italy 6.01 5.86 6.17
Ireland 5.42 5.97 6.11
Finland 5.23 5.52 6.06
Austria 6.07 5.58 3.94
Japan 5.05 5.50 4.91
Germany 4.74 5.08 5.63
Korea 5.39 6.00 3.15
Denmark 4.45 4.80 5.18
Netherlands 5.08 4.32 4.99
Norway 3.92 4.41 5.80
Sweden 4.75 4.52 4.55
Australia 4.53 4.74 4.31
Canada 4.42 4.49 4.17
United States 3.80 4.69 4.37
Switzerland 4.58 3.40 3.79
United Kingdom 4.89 2.39 4.34
EU Comm. 2.01 3.62 3.24