“k” line fact book 2008 · ④transition of alliance for containership p10 ④car production...
TRANSCRIPT
July, 2008
in English

◇◆◇◆◇◆ INDEX ◆◇◆◇◆◇
1. Management Plan and Improvement of Business Structure P1 3-5. Emerging Markets ① Economig Growth in India(Exports ・Imports) P18
1-1. "K" Line Vision 100 General View P1 (India and Vietnam) ② Economic Growth in Vietnam(Exports・Imports)
1-2. Starting New Management Plan ①"K"Line Vision 2008+ =>"K"Line Vision100 P2 3-6. Emerging Markets ① Exports & Imports of BRICs (ex. China) P19
②Trends of Business Performance (BRICs,VISTA,Turkey) ② Exports & Imports of VISTA
③Improvement in Financial Position ③ Exports & Imports of Turkey
④Fleet Upgrading Plan P3 4. Bulk Carrier Business P20
⑤Newbuildings (Results and Plan) 4-1. "K"Line Fleet ① "K"Line Dry Bulk Fleet P20
1-3. Trends of Financial Indices ①Net Income and Dividend per Share P4 ② Energy Transportation Vessel Fleet
②Consolidated ROE/ROA ③ Ship Price as of Placing Order (Dry Bulkers, Tankers)
③Consolidated Assets Turnover ④ Ship Price as of Completion (Dry Bulkers, Tankers)
④Consolidated EV/EBITDA 4-2. Business Expansion of Drybulk Business into the World P21
⑤Operating Cash Flow 4-3. Demand on Dry Bulk ① Transition of Crude Steel Production P22
⑥Consolidated Interest Coverage Ratio ② World Coal Export (Thermal/Coking Coal) P23
1-4. History of Management Plans P5 ③ World Coal Import in Total
1-5. Restructuring and Scale Expansion ①No. of Seafarers/ "K"Line Employee P6 ④ Iron Ore Import into Major Asian Countries
②Our Fleet Scale, Ordinary Revenures & Income ⑤ World Coal Consumption
1-6. Current Business Composition ①Revenues, Ordinary Income <Division-wise> P7 5. Car Carrier Business P24
②Revenues, Ordinary Income <Segment-wise> 5-1. Fleet and Cargo Movements ① "K"Line PCC Fleet P24
③Fleet Composition ② Cars/Trucks Transported by Our Fleet
2. Comparison to Major Shipping Company P8 ③ Total Cars/Trucks Exported from Japan
2-1. Fleet-scale Ranking ① Major Container Carriers P8 5-2. Demand on Vehicles ① World Automobile Production (2007) P25
② Containership Asia-N.America Loading Volume ② No. of Vehicles Possessed (Cars/1,000 People)
③ Histrical Top 20 Container Carriers P9 ③ Transition of Overseas Production by Japanese Automakers
④ Transition of Alliance for Containership P10 ④ Car Production and Sales in USA
⑤ Cape-size Bulker Owned P11 6. Container Business P26
⑥ Dry Bulkers (All Types) Owned 6-1. Fleet and Cargo Volume ① "K"Line Containership Fleet P26
⑦ PCTC Operated ② "K" Line Average Freight/Volume for All Services
⑧ PCTC Owned ③ "K"Line Volume & Share for Asia-N.America/Europe
⑨ AFRAMAX Tanker Owned ④ Volume & L/F for Asia-N.America/Europe ("K"Line/All) P27
⑩ LNG Fleet (Managed) 6-2. Container Terminal Operated by "K"Line P28
3. World Market P12 6-3. Cargo Movements ① Container Cargo Movements P29
3-1. Fleet Scale by Vessel-type/Age ① Dry Bulk Carriers by Vessel-type/Age P12 ② Asia=>N.America/Europe Country-wise Cargo Volume
② PCC Delivery by Vessel-type/Age P13 6-4. Port-wise Volume ① Port-wise Handling Volume in Asia P30
③ Oil Tanker Delivery by Vessel-type/Age ② Top 10 Ports for 2007 Container Handling
④ Containership Delivery by Vessel-type/AgeP14 ③ Transition of Container Handling among Major Ports in Asia
3-2. Trend of Newbuildings ① Ship Price as of Placing Order P15 6-5. Factory of the World ① Major Electric Device Nation-wise Production P31
② Ship Price as of Delivery ② Trends of Export from Asian Major Nations and Regions
③ World Newbuilding Orders 7. New Businesses P32
④ World Newbuilding Delivery ① Heavy Lift Shipping P32
⑤ World Total Existing Tonnage ② Offshore Support Vessels
⑥ World Total Ship Demolotion ③ Floating LNG Production
3-3. World Cargo Movements ① World Cargo Movements (Ton-mile) P16 8. Financial Data P33
② Dry Bulk Market 9. "K" Line Overview P34
③ Tanker Market 9-1. "K" Line Corporate Governance System P34④ Containership Freight for Our Trunk Lines 9-2. Safety Navigaton P35
3-4. Emerging Markets (China) ① Economic Growth Rate P17 9-3. Enviroment Preservation P36
② Trade Trends for China 9-4. Brief History P37
③ Energy Consumption in China 9-5. Press Releases (Apr.2007-Mar.2008) P38
④ Income Gap between Urban and Rural Area 9-6. Certification by Third-party Organization & Information on Convertible Bonds P39
⑤ Per-Capital GDP by Region in China 9-7. Corporate Principles and Charter of Conduct P40
⑥ Earning Gap between Areas

1-1. "K"Line Vision 100 General View
New Midterm Management Plan ("K" LINE Vision 100)Themes: "Synergy for All and Sustainable Growth"
Efforts Toward Synergy for All and Sustainable Growth
Consolidated financial targets (assumptions: exchange rate of 100 Yen = US$1, Dubai oil price at US$100/barrel, fuel-oil price at US$520/MT)(Unit: billion yen) (Unit: trillion yen)
FY 2007 FY 2008 FY 2009 FY 2010 FY 2011 Mid-2010's 100th anniversary
Operating revenues 1,331 1,340 1,450 1,600 1,750Ordinary income 125.9 121 135 145 160Net income 83 78 85 95 105ROA 13% 12% 10% or higher
Shareholders' equity 355.8 426 680 or higherEquity ratio 37% 37% 40% or higherDER 93% 100% 85% or lowerInterest-bearing debt/operating CF 2.3 4.2 3.5 or lowerPayout ratio 20% 22% 25% 30%
Fleet, shipping capacity
End of FY 2007 End of FY 2011 Mid-2010's End of FY 2019
Containership 99 132Dry bulk carriers 169 225Car carriers 102 106LNG carriers 34 48Oil Tankers 28 45Heavy lift /offshore carriers 15 24Coastal/RORO carriers 52 60Total 499 640
(Approx. 1,180 billion yen)
Operaingrevenues: 2.2
Operatingrevenues: 3
Approx. 750vessels
Approx. 900vessels
Corporate Principles of the "K" Line Group:The basic principles of the "K" Line Group as a business organization centering on shipping liein:a. Diligent efforts for safety in navigation and cargo operations as well as for environmentalpreservation;b. Sincere response to customer needs by making every possible effort; andc. Contributing to the world’s economic growth and stability through continual upgrading ofservice quality.
1. Activities to promote environmental protection〇Preventing global warming〇Keeping the sea and air clean
2. Stable safety ship operation administration structure〇Enhancing safety-management systems and strengthening the land-based support structure〇Expanding our ship-management structure〇Hiring and training marine technical personnel
3. Borderless management through the best and strongest organization〇Accelerating borderless management through the spread of "K" Line Standards〇Strengthening overall abilities by bringing together Group knowledge and expertise〇Dramatic improvements in worker productivity〇A bright, vibrant workplace〇Industry-leading competitive strength
4. Strategic investment and proper allocation of management resources〇Establishing a stable profitability structure for existing businesses〇Growing new businesses into revenue-generating ones〇Advancing investment based on internal financial rules 5. Improvement of corporate value and complete risk management〇Enhancing corporate quality and maximizing returns on profits〇Identifying and responding swiftly to potential risks
Group Vision:1. To be trusted and supported by customers in all corners of the world while being able to continue to growglobally with sustainability,2. To build a business base that will be capable of responding to any and all changes in businesscircumstances, and to continually pursue and practice innovation for survival in the global market,3. To create and provide a workplace where each and every employee can have hopes and aspirations for thefuture, and can express creativity and display a challenging spirit.
Society in generalSocial contributions, a focus on the environment,
governanceBuilding relations of trust through actions as a corporate
citizen and contributions to local communities
CustomersProvision of safe logistics services
Building relations of trust through safe and reliabletransportation services
ShareholdersAppropriate returns on profits
Building relations of trust through stable andappropriate returns on profits and fair and accurate
disclosure of information
Business partnersEnhancing partnerships
Building relations of trust through fair transactions
EmployeesRewarding and satisfying work
Building relations of trust through enhancing HRdevelopment and improving both working conditions
and the working environment
ContainershipBusiness
Dry Bulk CarrierBusiness
Car CarrierBusiness
Energy Transportation and TankerBusiness,
Heavy Lift and Offshore SupportBusiness,
New Businesses
Logistics Business, Short Sea and Coastal
Shipping Business
Mobility and high-quality services
* Proposal-based sales that anticipatecustomer needs
* Tailor-made customer-specific services
World-leading transportation qualityand full route network
* High-quality services taking theenvironment and safety into consideration
* Global business expansion respondingswiftly to customer needs
Top class worldwide with safetransportation
* Aggressive efforts to take on newshipping demand
* Pursuing safe and high-quality services
Top class worldwide with cape-size andpost-panamax vessels
* High-quality services suited to diversecustomer needs
* Growing the customer base throughglobal business expansion
* Enhancing a stable profitability structurethrough mid- to long-term contracts
Synergy for All: Mutually beneficial relations
BusinessStrategies
Fleet upgrading plan (FY 2008 - FY 2011) 43 65 27 15 13 13 4
180
Sustainable business growth andefficient business management
* Responding to globalization ofcustomers' businesses throughenhancements to the service network* Enhancing competitive strengthsthrough sustained fleet and terminalimprovements* Pursuing safe transportation with a focuson protecting the environment
11

1-2. Starting New Management Plan "K"Line Vision 100, After "K"Line Vision 2008 +
① From "K"Line Vision 2008+ to "K"Line Vision100 Unit: Billion Yen
FY2006(Plan)
FY2006(Results)
FY2007(Plan)
FY2007(Results)
FY2008(Plan)
Performance
Operating Revenues 970.0 1,085.5 1,050.0 1,331.0 1,100.0 ◎
Ordinary Income 75.0 63.9 90.0 125.9 110.0 ◎
Net Income 53.0 51.5 60.0 83.0 70.0 ◎
ROE 19% 17% 19% 24% 19% ◎
Shareholders' Equity 293.0 344.5 342.0 355.8 400.0 ○
Equity Ratio 35% 38% 37% 37% 39% ○
DER 109% 95% 99% 93% 88% ○
Interest-bearing Debt 320.0 326.2 304.0 329.7 350.0 ◎
Payout Ratio ◎
(Original Assumption: Exchange rate-JPY110/US$, Fuel Oil Price-US$300/MT)
"K" LINE Vision 100 Financial Targets Unit: Billion Yen
FY2007 FY2008 FY2009 FY2010 FY2011Results Plan Plan Plan
Operating Revenues 1,331.0 1,340.0 1,450.0 1,600.0 Operating RevenuesOrdinary Income 125.9 121.0 135.0 145.0 160.0Net Income 83.0 78.0 85.0 95.0 105.0 (Unit: Trillion Yen)ROA 13% 12% over 10%Shareholders' Equity 355.8 426.0 over 680.0Equity Ratio 37% 37% over 40%DER 93% 100% under 85%
2.3 4.2 under 3.5 Payout RatioPayout Ratio 20% 22% 25%
(Assumption of the Plan: Exchange Rate (Yen/US$) 100yen/$, Bunker Oil Price US$520/MT)
(Fiscal Year) '92 '93 '94 '95 '96 '97 '98 '99 '00 '01 '02 '03 '04 '05 '06 '07 '08-'11 Average Exchange Rate (Yen/US$) 125 108 99 96 113 123 128 112 110 125 122 114 107 113 117 115 100 Average Fuel Price (US$/MT) 99 83 99 108 118 104 76 117 158 134 161 170 192 286 319 407 520
30%
Interest-bearingDebt/Operating CF
20% on consolidated basis
Plan1,750.0
2.2 3.0
100thAnniversaryMid-2010s
2
② Trends of Business Performance (P/L)
-100
300
700
1,100
1,500
1,900
2,300
2,700
3,100
92F93F94F95F96F97F98F99F00F01F02F03F04F05F06F07F08Fe09Fe10Fe11Fe mid-10s
2019F
(Billion Yen)
-10
10
30
50
70
90
110
130
150
170
190
210
(Billion Yen)Operating RevenuesOperating IncomeOrdinary IncomeNet Income
Target 10
K.R Plan
K.R.Phase2Ⅱ
New K-21KV-Plan
"K" Line Vision 2008
"K" Line Vision 2008+
"K" LINE Vision 100
◎ achieved beforehand○ achieved as planned
③ Improvement in Financial Position
0
100
200
300
400
500
600
700
800
92F
93F
94F
95F
96F
97F
98F
99F
00F
01F
02F
03F
04F
05F
06F
07F08
Fe09
Fe10
Fe11
Fe
Equity Ratio Indicated x10(%)↓(Billion Yen)
0%
100%
200%
300%
400%
500%
600%
700%
Interest Bearing Dept Shareholders' Equity Equity Ratio(x10) DER
※We began to record a part of lease obligation in B/S from 1995 because of changes in the accounting system.
Over 680.0 Bln Yen
over40%
under85%
(Year 2019)

④ 【Fleet Upgrading Plan】Toward a Fleet Scale about 900 Vessels in '19F: Investing Approx. 1.18 Trillion Yen on 180 Ships in '08-'11F ⑤ Newbuildings (Results and Plan)
(As of April 2008)
'08F '09F '10F '11F 4-yeartotal
2004FResults
2005FResults
2006FResults
2007FResults
2008FPlan
2009FPlan
Containership 99 4 15 15 9 43 132 Containership 5 5 6 4 4 15Dry Bulker 169 13 16 16 20 65 225 1,700TEU 0 0 3 2 4
PCTC 102 4 10 8 5 27 106 2,400TEU 0 0 0 1 2LNG 34 14 1 0 0 15 48 3,500TEU 3 0 0 0 4
Tanker 28 4 5 0 4 13 45 4,500TEU 2 3 0 0 1Heavy Lifter 15 3 1 3 0 7 18 6,400TEU 0 0 0 0 1
Offshore 0 0 0 3 3 6 6 8,000TEU 0 3 1 1 3Others 52 2 0 1 1 4 60 Dry Bulker 5 19 22 10 13 16Total 499 44 48 46 42 180 640 Capesize 3 8 9 2 4 7
Panamax 2 3 4 4 0 5Handymax 5 4 2 2 0SmallHandy 1 2 1 3 2Chip/Pulp 0 1 0 3 0Corona 2 2 1 1 2
PCTC 3 8 8 4 5 92,000 unit 2 2 0 0 13,800 unit 0 2 1 0 14,000 unit 1 2 0 0 25,000 unit 3 1 0 0 36,000 unit 2 1 4 4 3
LNG 2 4 2 2 14 1
Tanker 3 1 4 3 4 5VLCC 0 1 1 0 4AFRAMAX 1 1 0 2 0LRⅡ 0 2 0 1 1LPG 0 0 2 1 0
Heavy Lifter 0 0 0 1 3 1Others 0 1 5 2 2 0Total 18 38 47 27 44 48
Fleet ofApprox.7
50Vessels
Fleet ofApprox.
900 Vessels
End-'19F(100th
Anniversary)
As ofMar.'08
New Buildings As ofMar.'12
Mid-'10s
No. of Vessels at the End of 2011F (Planned)
(Total 640 Vessels)
Offshore, 6
Others, 60Containers
hip, 132
Dry Bulker,225
HeavyLifter, 18
Tanker, 45
LNG, 48PCTC, 106
No. of Vessels at the End of 2007F(Total 499 Vessels)
Others, 52Containership, 99
DryBulker,
169
PCTC,102
LNG, 34
Tanker, 28
HeavyLifter, 15
3
180 Newbuildings

1-3. Trends of Financial Indices in Recent Years
4
① Net Income and Dividend per Share
0 0 0 0 0
3 3 4 5 35
1016.5 18 18
26
△ 10
0
10
20
30
40
50
60
70
80
90
92F 93F 94F 95F 96F 97F 98F 99F 00F 01F 02F 03F 04F 05F 06F 07F
Unit: Billion Yen
-20
0
20
40
60
80
100
120
140Yen/Share
Net Income Net Income per Share Dividend per Share
② Consolidated ROE, ROA
△ 10
0
10
20
30
40
50
60
70
80
90
92F 93F 94F 95F 96F 97F 98F 99F 00F 01F 02F 03F 04F 05F 06F 07F -10%
0%
10%
20%
30%
40%
50%
Net Income ROE ROA
Unit: Billion Yen
③ Consolidated Assets Turnover
0
200
400
600
800
1,000
1,200
1,400
92F 93F 94F 95F 96F 97F 98F 99F 00F 01F 02F 03F 04F 05F 06F 07F
Unit: Billiion Yen
0.0
0.2
0.4
0.6
0.8
1.0
1.2
1.4
1.6
Operating Revenues Assets Turnover
④ Consolidated EV, EBITDA
0
20
40
60
80
100
120
140
160
180
92F 93F 94F 95F 96F 97F 98F 99F 00F 01F 02F 03F 04F 05F 06F 07F
Unit: Billion Yen
0
2
4
6
8
10
12
14
EBITDA EV/EBITDA
⑤ Operanig Cash Flow
△ 10
10
30
50
70
90
110
130
150
92F 93F 94F 95F 96F 97F 98F 99F 00F 01F 02F 03F 04F 05F 06F 07F
Unit: Billion Yen
Net Income Operating Cash Flow
⑥ Consolidated Interest Coverage Ratio
0
20
40
60
80
100
120
140
92F 93F 94F 95F 96F 97F 98F 99F 00F 01F 02F 03F 04F 05F 06F 07F
Unit: Billion Yen
0
5
10
15
20
25
30
Operating Income
Interest Coverage Ratio

1-4. History of Management Plans
Plan name Subjects RemarksNov.1982 Emergency Plan for Strengthening 1st theme: profitability improvement plan Radical improvement in operational structure was targetted,
- the Corporate Foundation 2nd theme: efforts to modernize and increase the efficiency of operational systems feared continued simultaneous slump in three salesAug.1983 ("K" Plan) First Stage 3rd theme: a cost-cutting campaign carried out with the participation of all personnel division and yen rising.
Emergency Plan for Strengthening Reconstruction of system to implement "K"plan, mainly for above 2nd theme (Reference-in June 1983, the Head Office was- the Corporate Foundation Promotion of office automation、Improvement in business procedure, Cost reduction etc relocated to current location )
Mar.1984 ("K" Plan) Second StageApr.1984 Intermediate-term Operational 1) Emergency Measures (disposal of uneconomical ships, establishment land-based and marine personnel plan.) Aimed to establish the capability to resume dividend payment.
Improvement Plan 2) Reinforcement of operational capabilities (development of an internationally competitive fleet, (A part of this plan was named Enhancement of cost control, Promotion of new business) (However, Plaza Accord in 1985 drastically rose yen
- New "K" Plan.) 3) Augmentaton of financial measures to 150 yen per one U.S. dollar, and the U.S. Shipping Act4) Modernization and increasing the efficiency of operational organization (streamlining of land-based of 1984 made container freight fall significantly. operations, reorganization and utilization of an information systems) Our losses were expanded.)
Mar.1987 5)Promotion of safe vessel navigation and cost reduction Apr.1987 Emergency Ratiolization Plan 1) Disposal of uneconomical ships
2) Make the organization more efficient and streamlined. (inc. spinning off our subsidiaries)3) Slashing of both of land and sea workforth with intoroduction of a special retirement policy. Almost all targets completed on schedule.
- <"Emergenvy Employment Measures"(agreed with All Japan Seamen's Union)4) Improvement and reinforcement of operational capabilities =>Once Operating Income moved into the black F88.5) Measures against stronger yen
Mar.1989 6) Implemantation of measures for cost reduction.While we did not have specific management plan during this period, there was a campaign for imporoving customer satisfaction (named 'One for All, All for One', April 1990 - March 1994), and"Project 20・20", an internal campaign in Containership division around 1991 (targeting at total USD 40 min. profit rise through revenue up by 20 mil. and cost down by 20 mil.) , etc.
Dec.1992 Target-10 - Reexamining costs and expenses from every angle '- Around Oct.1993Oct.1993 "K"Line Reengineering Program - Strenghtening international competitiveness through cost-saving and shift as many jobs as possible to overseas
- (K.R. Program) - Establishment of structrure to respond customers' needs and to ensure stable profit even if faced with Mar.1996 exchangerate rate 100 yen per one U.S. dollar,. Apr.1996 K.R.PhaseⅡ - Realization of the situation to implement continual payment of dividends Unfinished targets in K.R. Program. From non-consolidation
- - Reconstruction of operation on a consolidated basis by the entire "K"Line group to consolidation. Aiming for competetiveness matching shipping companies in developing Asia.
Mar.1998 =>In F97 dividend paid after 15 year absenseApr.1998 New"K"Line Spirit for 21(New K-21) - Standing firm in our basic policy of pursuit of profitability while trying to expand scale of business, and Aiming to make containership division move into the black,
*In '00, raised the numerical targets continuing stable payment of dividends which was not achieved in K.R.PhaseII. - *Completed a year ahead of - To expand shipping-based logistics business globally with customer-oriented attitude, and to aim at a corporate group Positive management plan for the first time in many years.
Mar.2002 schedule as most targets achieved which is soild, and fully commited to challenge with courage. =>Most targets achieved, though 9.11changed conditions at all.Apr.2002 KV-Plan 1. Further enhancing of Company’s overall organization through cost reductions and profitable use of IT, etc. Reconstruction of containership business-"Cost Slash 300"
2. Reinforcement of globalization firmly based on regional communities and pursuit of business synergy among business sectors. (Total 30 bln. yen cost reduction plan:- 3. Initiate stronger efforts to implement logistics business. 15 bln. is from deployment of larger ships)
4. Persuit of technical innovations in marine transport, perfection of safety in navigation and cargo operations, In F03 (ends Mar. '04) most of final targets inc. numerical*Completed a year ahead of and further contribution to environmental preservation. ones were atatined a year ahead of schedule.
Mar.2004 schedule as most targets achieved 5. Strengthening of corporate governance aiming at more transparency and greater effectiveness in management. =>"K"Line Vision 2008Apr.2004 "K"LINE Vision 2008 1.Ensuring a stable profitability structure through reinforcing our business base Set a vision for F08, to regard the period from now to F09, our
- -Sustainable Growth and Establish- 2.Creation of a high-level, refined and more matured culture of the "K" Line Group with materialization of dreams 90th anniversary, as a runway.ment of a Stable Profitability Structure and upgrading of the "K" Line Brand As profit targets, set F04, 05 estimation & F08 vision
Mar.2006 (Completed as most targets achieved) 3.Reinforcement of corporate governance and response to risk management Fulfilled most final numerical goals in F05/fuel price hike=>2008+
Apr.2006 "K"LINE Vision 2008+ -Measures to support systematic expansion of business scale (new target) NOT achieved F06 targets due to container freight drop- -Sustainable Growth and Establish- - Response to changes in business enviroments (new target) F07 resuts exceeded most targets for F08 in the plan due to dry
ment of a Stable Profitability Structure- bulk market hike and containership freigt restoration, Mar.2008 (Completed as most targets achieved) & condition change => "K"Line Vision 100Apr.2008 "K"Line Vision 100 1. Activities to promote environmental protection
- Themes: Synergy for All 2. Stable safety ship operation administration structure The plan based on what we will be like in 2019Mar.2012 and Sustainable Growth 3. Borderless management through the best and strongest organization when we celebrate our 100th anniversary.
+ 4. Strategic investment and proper allocation of management resources Detailed targets are set for 4years fom 2008F to 2011FImage for 2019 5. Improvement of corporate value and complete risk management
5

1-5. Effort for Structural Reform and Business Scale Expansion
② Our Fleet-Scale, Operating Revenues, Ordinary Income
-100
100
300
500
700
900
1,100
1,300
65/3 67/3 69/3 71/3 73/3 75/3 77/3 79/3 81/3 83/3 85/3 87/3 89/3 91/3
93/3
95/3
97/3 99/3 01/3 03/3 05/3 07/3
(Operating Revenues (Bln. Yen)/Operating Fleet (No. of Vessels, 100,000 Tons)) (Ordinary Income(Bln. Yen))
-10
10
30
50
70
90
110
130(Non-Consol) Operating Revenues (Consol) Operating Revenues (Non-Consol) Ordinary Income
(Consol) Ordinary Income (Non-Consol) Operating Fleet (Tons) (Non-Consol) No. of Operating Vessels
(Consol) No. of Operating Vessels (Consol) Operating Fleet (Tons)
① No. of Japanese Seafarer/"K"Line Employee
-1,000
0
1,000
2,000
3,000
4,000
5,000
6,000
7,000
8,000
9,000
65/3 67/3 69/3 71/3 73/3 75/3 77/3 79/3 81/3 83/3 85/3 87/3 89/3 91/3
93/3
95/3
97/3 99/3 01/3 03/3 05/3 07/3
(No. of Consolidated Group Employee, Non-Consolidated Employee)
0
100
200
300
400
500
600
700
800
(Japanese Seafarer (Hundred)/Exchange Rate)
Consolidated Group Employee (Non-Consolidated) Employee on Sea 平均為替レ-ト 海運業収益計 (Non-Consolidated) Employee on Land 経常利益平均燃料油価格 Japanese Seafarer for Overseas Shipping Exchange Rate (\/$)
6

1-6. Current Business Composition
① Operating Revenues, Ordinary Income <Division-wise> ② "K"Line's Operating Revenues/Ordinary Income
(Unit: Billion Yen)
Business Division FY2005 FY2006 FY2007Operating Revenues 451.4 503.5 599.8Ordinary Income 30.5 -7.8 4.7Operating Revenues 468.4 615.8Ordinary Income 66.0 115.3Operating Revenues 289.4 113.6 115.4Ordinary Income 58.1 5.7 5.9Operating Revenues 740.8 1,085.5 1,331.0Ordinary Income 88.6 63.9 125.9
ContainershipBusiness
Other MarineBusiness
Others
Total
Segment-wiseOrdinary Income
Logistics,HarborTransportationBusines
ShippingBusiness,45.136
Others,2.494
Segment-wise Operating Revenues
Logistics,Harbor
Transportation
Business, 127.107
Others,21.488
ShippingBusiness, 936.943
Segment-wise Ordinary Income
Logistics,HarborTransportationBusiness,16.5
ShippingBusiness, 107.6
Others,1.7
Segment-wiseOperating Revenues
ShippingBusiness,
1176.9
Others,22.8
Logistics,Harbor
Transportation
Business,131.3
Division-wiseOperating Revenues
ContainershipBusine
ss,503.45
Others,582.09
7
③ Fleet Composition
Consolidated Ordinary Income 63.9 Bln. Yen
FY2006 Consolidated Operating Revenues: 1,085.5 Bln.
FY2007 Consolidated Operating Revenues: 1,331.0 Bln. Yen
Consolidated Ordinary Income 125.9 Bln. YenDivision-wise
Operating Revenues
Others,731.2
ContainershipBusine
ss,599.8
Division-wiseOrdinary Income
Containership
Business, -7.8
Others,71.8
Other MarineBusiness
Containership
※ Long-term chartered ships are included above fleet
※ For FY2005, we disclosed our total results in two categories: Containership Business and Others
Container 89 Container 99
Bulk Carrier 159 Bulk Carrier 169
PCTC 100PCTC 102
Energy Resource54
Energy Resource62
Heavy Lifter/Coastal/Ferry/Other 51
Heavy Lifter/Coastal/Ferry/Other 67
0
100
200
300
400
500
600
March 2007 March 2008
Total 453 VesselsTotal 499 Vessels
Division-wiseOrdinary Income
Others,121.2
Containership
Business, 4.7
ContainershipBusiness for FY06△7.8 Bln. Yen

2. Comparison to Major Shipping Companies <2-1. Fleet-scale Ranking>
① Major Container Carriers
Top 18 Container Carriers Ranked by Operating Capacity
1 Maersk 1,881,619 456,763 2,338,3822 MSC 1,214,486 619,010 1,833,4963 CMA CGM 891,803 592,747 1,484,5504 EMC 619,462 16,642 636,104 1 Maersk 1,404,8495 HAPAG 494,516 143,235 637,751 2 Evergreen 1,170,7086 CSCL 431,550 219,716 651,266 3 Hanjin 1,131,6847 Cosco 430,472 382,044 812,516 4 APL(NOL) 936,5668 APL 401,625 266,370 667,995 5 CSCL 858,5199 NYK 375,925 255,257 631,182 6 COSCO 806,48810 OOCL 341,583 143,366 484,949 7 YML 767,46411 HANJIN 339,681 283,254 622,935 8 ”K" LINE 754,45612 MOL 333,857 222,927 556,784 9 OOCL 702,42513 K Line 306,486 171,960 478,446 10 Hyndai M.M. 676,40914 Zim 274,828 188,423 463,251 11 NYK 663,40115 Hamburg Süd 273,959 187,235 461,194 12 CSAV 650,39316 YML 272,813 166,508 439,321 13 MSC 598,36217 CSAV 248,987 166,412 415,399 14 MOL 481,29118 HMM 196,782 208,468 405,250 15 Hapag-Lloyd 390,236
Rank Alliance Operating On Order Total Rank Alliance Cargo1 Maersk 1,881,619 456,763 2,338,382 1 CKYH (inc."K"line 3,460,0922 CKYH 1,349,452 1,003,766 2,353,218 2 TNW 2,094,2663 GA 1,294,912 541,858 1,836,770 3 GA (ex.MISC) 1,756,0624 MSC 1,214,486 619,010 1,833,496 4 Maersk 1,404,8495 TNWA 932,264 697,765 1,630,029 5 Evergreen 1,170,7086 CMA 891,803 592,747 1,484,5507 EMC 619,462 16,642 636,104 Source: Piers, as of 2007
Source : AXS Liner (http://www1.axsmarine.com),
CargoLoadedRank Operator
TotalOperatorRankOperating
Fleet'08-'11
Delivery
8
0 500 1000 1500 2000 2500
MaerskMSC
CMA CGMEMC
Hapag-LloydCSCLCosco
APLNYK
OOCLHANJIN
MOLK LINE
ZimHamburg Süd
Yang MingCSAV Group
HMM
1,000 (TEU)
Existing '08 Delivery
'09 Delivery '10 Delivery
'11 Delivery
0 200 400 600 800 1000
MaerskCKYH
GAMSC
TNWACMAEMC
1,000 TEU
Alliance-wise '08-'11Newbuilding Delivery
'08 Delivery
'09 Delivery
'10 Delivery
'11 Delivery
② Containership Asia-N.America Loading Volume Top15 Carriers (Year 2007)
0 300 600 900 1200 1500
Hapag-Lloyd
MOL
MSC
CSAV
NYK
Hyndai M.M.
OOCL
K Line
Yang Ming
COSCO
CSCL
APL(NOL)
Hanjin
Evergreen
Maersk
1,000TEU

2-1. Fleet-scale Ranking
③ Historical Top 20 Container Carriers Ranked by Operating Full Containership Capacity (From 1983, biyearly)
Rank '83 '85 '87 '89 '91 '93 '95 '97 '99 '01 '03 '05 '071 HAPAG EVERGREEN EVERGREEN EVERGREEN EVERGREEN MAERSK MAERSK MAERSK MAERSK/SL MAERSK MAERSK MAERSK MAERSK2 SEA-LAND USL MAERSK MAERSK MAERSK EVERGREEN SEA-LAND SEA-LAND EVERGREEN P&ON MSC MSC MSC3 MAERSK MAERSK NYK SEA-LAND SEA-LAND SEA-LAND EVERGREEN P&ON P&ON EVERGREEN P&O/FARREL EVERGREEN CMA CGM4 OCL SEA-LAND APL APL NYK NYK COSCO EVERGREEN HANJIN/SEN HANJIN EVERGREEN CMA CGM/ANL EVERGREEN5 NYK HAPAG YANGMING NYK COSCO COSCO NYK COSCO MSC MSC HANJIN/SEN HAPAG HAPAG6 OOCL OCL SEA-LAND COSCO APL P&OCL P&OCL HANJIN COSCO APL(NOL) COSCO HANJIN/SEN CHINA SHIPPING7 APL NYK HAPAG OOCL MOL HANJIN NEDLLOYD NOL/APL NOL(APL) COSCO APL COSCO COSCO8 NEDLLOYD OOCL OOCL HAPAG OOCL "K"LINE HANJIN MSC NYK/TSK CP SHIPS CMA CGM/ANL CHINA SHIPPING NYK9 EVERGREEN "K"LINE P&OCL "K"LINE HAPAG NEDLLOYD MOL NYK CMA/CGM NYK "K"LINE APL APL
10 UASC APL "K"LINE YANGMING HANJIN HAPAG APL HMM CP CMA CGM NYK NYK HANJIN11 MOL MOL MOL HANJIN "K"LINE APL HAPAG MOL ZIM MOL CP SHIPS MOL OOCL12 USL COSCO COSCO MOL YANGMING YANGMING DSR-SENATOR ZIM MOL OOCL MOL OOCL "K"LINE13 YANGMING NEDLLOYD NEDLLOYD P&OCL P&OCL MOL "K"LINE YMTC "K"LINE "K"LINE ZIM CSAV MOL14 CGM UASC ZIM NEDLLOYD NOL NOL OOCL OOCL HMM ZIM OOCL "K"LINE ZIM15 ZIM CGM HANJIN ZIM ZIM OOCL YANGMING "K"LINE OOCL HL HAPAG ZIM YANGMING16 "K"LINE ZIM CGM NOL SCANDUTCH ZIM NOL HL YMTC HMM YANGMING YANGMING CSAV17 BALTIC YANGMING UASC CGM UASC HYUNDAI HMM DSR-SENATOR HL UASC CHINA SHIPPING HAMBURG SUD HAMBURG SUD18 W.WILHELMSEN W.WILHELMSEN NOL UASC NEDLLOYD UASC ZIM CMA UASC YANGMING HMM HMM HMM19 NOL BALTIC BSC W.WILHELMSEN CHO YANG CGM CMA WAN HAI CSAV CHINA SHIPPING HAMBURG SUD PIL PIL20 COSCO NOL W.WILHELMSEN BSC CGM CHO YANG MSC CONTSIP CHO YANG HAMBURG SUD CSAV WAN HAI LINES WAN HAI LINES
(Area-wise No. of Companies)U.S.A 3 3 2 2 2 2 2 1 0 0 0 0 0Europe 7 7 7 7 6 5 7 6 5 6 6 5 5Japan 3 3 3 3 3 3 3 3 3 3 3 3 3Asia* 5 5 6 6 7 8 7 9 8 8 8 10 10Others 2 2 2 2 2 2 1 1 4 3 2 2 2
'84 US Shipping Act 1984 '86US Line busted '88 Showa Line withdrew '91 NYK acquirNLS*** '92 HYUNDAI ranked in '96 'CKYH' alliance formed '99 MAERSK acquired '00 China Shipping ranked in '04 MAERSK acquired P&ON*Excluding Japan '85 Plaza Accord '86 HANJIN ranked in '88 NLS established (Japanese 4=>3) '96 P&O and Nedlloyd merged SEALAND '05 HAPAG acquired CP SHIPS
'86 'Emergency Employment (Japanese 6=>4) '97 NOL acquired APL (Americans went away) Measure' ’88 Kaizoshin** Asia-N.America '97 HANJIN acquired majority
route WG's report issued of DSR-SENATOR
1. Top 20 as of '83: U.S.A.: 3, Europe: 7, Japan: 3 , Asia (other than Japan) : 5, Others 2 5. Time-series Major Events '07: Europe: 5, Japan: 3, Asia (other than Japan): 10, Others: 2; U.S. carriers went away, and Asian shipping companies increased '84 U.S. Shipping Act 1984 effective
'85 Plaza Accord2. The No. of European operators reduced, but through M&As after '95, business scale of each was enlarged. In '07, 4 of top 5 were Europeans. '86 US Line busted. (No. of American carriers : 3=>2)
'Emergency Employment Measure' introduced3. Because of Europeans' decrease, Asian companies specialized in containership business (like PIL, WAN HAI.) came into top 20 recently. '88 Kaizoshin** Asia-N.America route Working Group's report issued
Showa Line withdrew, and NLS*** established4. No. of Japanese Containership Operators: (No. of Japanese carriers: 6=>4)
until '87 6 (Existing 3 + Yamashita Shinnihon Steamship Co. Ltd, Japan Line Ltd., Showa Line Ltd.) '91 NYK acquired NLS*** (No. of Japanese carriers: 4=>3)'88 4 ('Showa Line' withdrew, NLS***(Nippon Liner System Co., Ltd.) formed.) '96 P&O and NEDLLOYD merged. 'P&O NEDLLOYD' (P&ON) formed.'91 3 (NYK acquired NLS) '97 NOL acquired APL (No. of American carriers : 2=>1)
'99 MEARSK acquired SEALAND (American carriers disappeared)'04 MAERSK acquired P&ON
*** Joint Venture for containership business spun out of 'Yamashita Shinnihon' and 'Japan Line'. ** Council for Rationalization of Shipping and Shipbuilding Industries ***Joint Venture for containership business spun out of 'Yamashita Shinnihon' and 'Japan Line'.
Data: Containerisation International Yearbook
9

2-1. Fleet-scale Ranking
④ Transition of Alliances for Containership Business
1996 1997 1998 1999 2000 2001 2002 2003 2004 2005 2006 2007
Maersk Maersk Maersk Maersk-SL Maersk-SL Maersk-SL Maersk-SL Maersk-SL Maersk-SL Maersk(P&ONL) Maersk MaerskSea-Land Sea-Land Sea-Land
NYK NYK NYK NYK NYK NYK NYK NYK NYKNYK NYK NYK Hapag-Lloyd Hapag-Lloyd Hapag-Lloyd Hapag-Lloyd Hapag-Lloyd Hapag-Lloyd Hapag-Lloyd(CP ShipHapag-Lloyd Hapag-LloydHapag-Lloyd Hapag-Lloyd Hapag-Lloyd P&ONL P&ONL P&ONL P&ONL P&ONL P&ONL OOCL OOCL OOCLNOL NOL P&ONL OOCL OOCL OOCL OOCL OOCL OOCL MISC MISC MISCP&O P&ONL OOCL MISC MISC MISC MISC MISC MISC Grand Alliance
MISCCP Ships(Cast) CP Ships(Lykes,Contship) CP Ships CP Ships (TMM,OCA CP Ships CP Ships (Italia LinCP Ships CP Ships
CP Ships(Ivaran, ANZ) The New World AllianceMOL MOL MOL MOL MOL MOL MOL MOL MOL MOL MOLAPL APL MOL APL(NOL) APL(NOL) APL(NOL) APL(NOL) APL(NOL) APL(NOL) APL(NOL) APL(NOL) APL(NOL)OOCL OOCL APL(NOL) HMM HMM HMM HMM HMM HMM HMM HMM HMMNedlloyd (P&ONL) HMMMISC MISC COSCO COSCO COSCO COSCO COSCO COSCO COSCO COSCO COSCO CKYH
COSCO K-Line K-Line K-Line K-Line K-Line K-Line K-Line K-Line K-LineK-Line COSCO K-Line Yangming Yangming Yangming Yangming Yangming Yangming Yangming Yangming YangmingYangming K-Line Yangming Hanjin-Senator Hanjin-Senator Hanjin-Senator Hanjin-Senator Hanjin-Senator Hanjin-Senator
Yangming CSAV CSAV(Norasia) CSAV(Norasia)COSCO CSAV CSAV(Norasia) CSAV(Norasia) CSAV(Norasia) CSAV(Norasia) CSAV(Norasia) CSAV(Norasia)
CSAV NorasiaCSAV Norasia CMA-CGM CMA-CGM CMA-CGM CMA-CGM CMA-CGM CMA-CGM CMA-CGM CMA-CGM CMA-CGM
HMM CMAHMMMSC Norasia Choyang Choyang Hanjin-SenatorNorasia MSC Choyang Hanjin-Senator Hanjin-Senator UASC UASC UASC UASC UASC UASC UASC
Hanjin-Senator UASC UASCDSR-Senator DSR-Senator UASC Evergreen/LT Evergreen/LT Evergreen/LT Evergreen/LT Evergreen/LT Evergreen/IM Evergreen/IMChoyang Choyang Evergreen/LT Evergreen/LTHanjin Hanjin Evergreen MSC MSC MSC MSC MSC MSC MSC
UASC LT MSC MSCUASC CSG CSG CSG CSG CSG CSG CSG
Evergreen MSC CSGEvergreen LTLT
CMACMA
現在のアライアンスの基盤成立
アランアンス安定期、新興勢力台頭
Base leading topresent alliancesformed; (Nedloyd⇒P&O, NOL⇒APL,HJ⇒DSR-Snator)
Maersk⇒Sealand,CMA⇒CGM, EMC⇒Lloyd Triestino,-a series of M&A
Existing alliancesstabilized, newplayers emerging,CSAV=>Norasia
Choyangbankruptcy
Start-up newalliance (CKY+HS)
Maersk⇒P&ONedlloyd
Lloyd Triestino changed thename to Italia Marittima, andthen integrated intoEvergreen
10

2-1. Fleet-scale Ranking
⑧ PCTC Owned
14
18.6
33.5
53.4
62.2
73.8
76.0
82.1
96.1
105.265
58
59
50
33
38
33
21
165.5
0 20 40 60 80 100 120
UECC
Toyofuji Shipping
Eukor Car Carriers
Leif Hoegh & Co.
Ray Shipping
Wallenius Lines AB
Cido Shipping
"K" Line
Mitsui O.S.K. Lines
Nippon Yusen Kaisha
(No. of Vessels, 10,000 DWT)
⑩ LNG Fleet (Managed)
9
9
9
10
10
12
12
22
27
29
24
3.44
3.44
3.44
3.82
3.82
4.58
4.58
8.4
9.16
11.07
10.31
0 5 10 15 20 25 30
Teekay
BP Shipping
"K" Line
BW GS
Ceres
Pronav
Golar
Stasco
MISC
NYK
MOL
No. of Vessels Share(%)
⑤ Cape-size Bulker Owned
23.6
24.5
24.6
28.7
31.0
50.2
54.3
59.2
63.8
66.437
35
33
3331
19
17
15
1414
0 20 40 60 80
Enterprises Shpg.
Cardiff Marine Inc.
China Steel Corp
Angelicoussis Group
Hanjin Shpg Co.
China Ocean (COSCO)
Zodiac Maritime Agy.
Kawasaki Kisen
Mitsui O.S.K. Lines
Nippon Yusen Kaisha
(No. of Vessels, 100,000 DWT)
⑨ AFRAMAX Tanker Owned
1216161927
3856
63.774.6
114.9121.3
128.3179.8
167.5187.4
293.8395.1
67
7
1112
12
70.6
130.7
587.7
0 100 200 300 400 500 600
Kawasaki KisenNippon Yusen Kaisha
- - - - - -Mitsui O.S.K. Lines
- - - - - -- - - - - -- - - - - -
Overseas ShipholdingCentrofin Mngt.
A.P. MollerThenamaris (Mgmt.)
BP PLCMinerva Marine Inc.
Zodiac Maritime Agy.Novorossiysk Shpg.
MISCTeekay Corporation
(No. of Vessels, 10,000 DWT)
⑦ PCTC Operated
55.934
41.075
130.845
138.15
221.985
298.659
417.19
459.911
16
21
31
34
42
54
79
81
85
94
364.5
392.79
0 50 100 150 200 250 300 350 400 450 500
Toyofuji Shipping
UECC
CIDO
GRIMALDI
Leif Hoegh & Co.
Wallenius Lines AB
"K" Line
Eukor Car Carriers
Mitsui O.S.K. Lines
Nippon Yusen Kaisha
(No. of Vessels, 1,000 Cars)
⑥ Dry Bulkers (All Types) Owned
61.2
39.5
51.9
19.7
29.2
103.1
43.3
115.9
135.5
192.9
50
52
53
63
76100
118140
160
326
0 50 100 150 200 250 300 350
Zodiac Maritime Agy.
Excel Maritime Carr.
Cardiff Marine Inc.
Polish Steamship Co.
K. G. JebsenKawasaki Kisen
China Shipping Group
Mitsui O.S.K. Lines
Nippon Yusen Kaisha
China Ocean (COSCO)
(No. of Vessels, 100,000 DWT)
Clarkson Clarkson
Clarkson
"K"Line ProcessedClarkson
Fearnley World PCC Report
11
3. World Market <3-1. Fleet Scale by Vessel-type/Age>
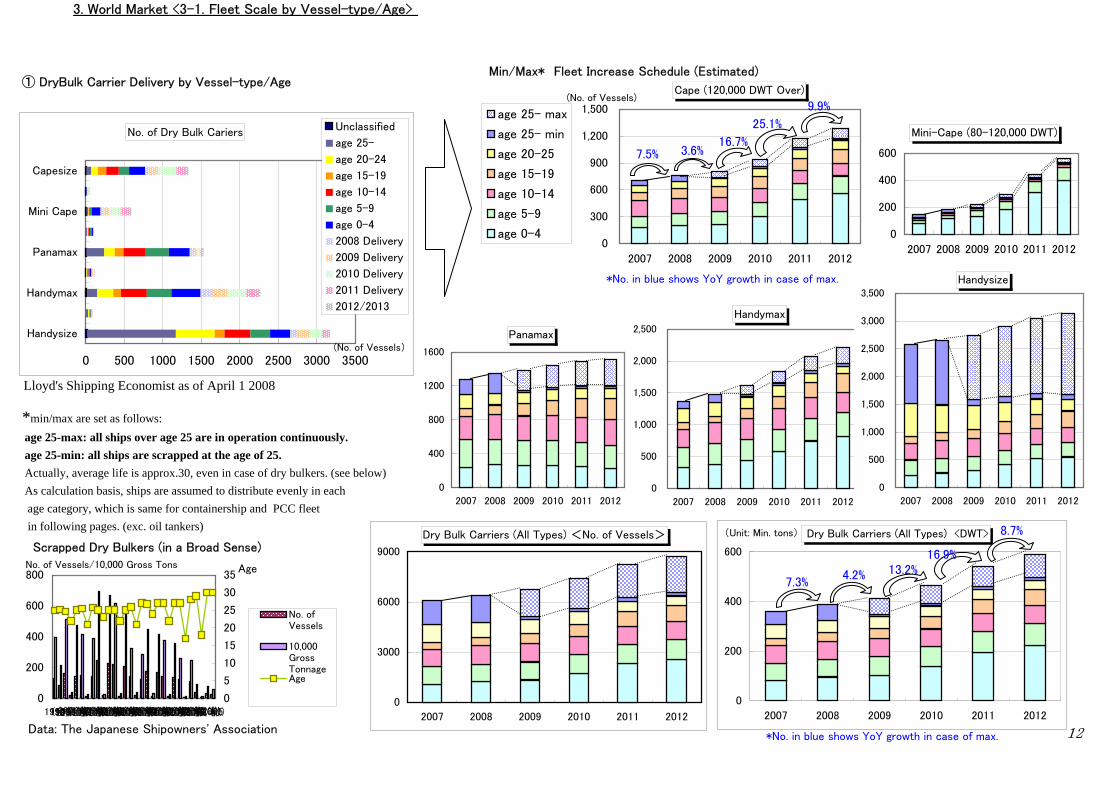
① DryBulk Carrier Delivery by Vessel-type/Age
*min/max are set as follows: age 25-max: all ships over age 25 are in operation continuously. age 25-min: all ships are scrapped at the age of 25. Actually, average life is approx.30, even in case of dry bulkers. (see below) As calculation basis, ships are assumed to distribute evenly in each age category, which is same for containership and PCC fleet in following pages. (exc. oil tankers)
Cape (120,000 DWT Over)
0
300
600
900
1,200
1,500
2007 2008 2009 2010 2011 2012
(No. of Vessels)
age 25- max
age 25- min
age 20-25
age 15-19
age 10-14
age 5-9
age 0-4
No. of Dry Bulk Cariers
0 500 1000 1500 2000 2500 3000 3500
Handysize
Handymax
Panamax
Mini Cape
Capesize
(No. of Vessels)
Unclassified
age 25-
age 20-24
age 15-19
age 10-14
age 5-9
age 0-4
2008 Delivery
2009 Delivery
2010 Delivery
2011 Delivery
2012/2013
Min/Max* Fleet Increase Schedule (Estimated)
Scrapped Dry Bulkers (in a Broad Sense)
0
200
400
600
800
199419951996(全損等)(解 撤)1997(全損等)(解 撤)1998(全損等)(解 撤)1999(全損等)(解 撤)2000(全損等)(解 撤)2001(全損等)(解 撤)2002(全損等)(解 撤)2003(全損等)(解 撤)2004(全損等)(解 撤)2005
No. of Vessels/10,000 Gross Tons
0
5
10
15
20
25
30
35Age
No. ofVessels
10,000GrossTonnageAge
Mini-Cape (80-120,000 DWT)
0
200
400
600
2007 2008 2009 2010 2011 2012
Panamax
0
400
800
1200
1600
2007 2008 2009 2010 2011 2012
Handymax
0
500
1,000
1,500
2,000
2,500
2007 2008 2009 2010 2011 2012
Handysize
0
500
1,000
1,500
2,000
2,500
3,000
3,500
2007 2008 2009 2010 2011 2012
Dry Bulk Carriers (All Types) <No. of Vessels>
0
3000
6000
9000
2007 2008 2009 2010 2011 2012
Dry Bulk Carriers (All Types) <DWT>
0
200
400
600
2007 2008 2009 2010 2011 2012
(Unit: Min. tons)
12
7.5% 3.6%16.7%
25.1%
9.9%
7.3%4.2% 13.2%
8.7%
16.9%
*No. in blue shows YoY growth in case of max.
*No. in blue shows YoY growth in case of max.
Lloyd's Shipping Economist as of April 1 2008
Data: The Japanese Shipowners' Association

3. World Market <3-1. Fleet Scale by Vessel-type/Age>
* Data are as of the end of each year. '08 Jan., No. of VLCC: 504 (151 of non-double hull tankers, and 353 of double hull) * Assumptions for no. of non-double hull tankers to be scrapped or converted after '08:
Min. Year '08: Vessels already fixed to be converted, and age over 25 yrs are scrapped Year '09, and '10 : Half of 94 non-double hull ships still existing at the end of '08 will be scrapped by half each year. By the end of '10, all of non-double hull will be demolished.
Max. After year '09, vessels only over 25 year old will be scrapped.
No. of PCC Carriers
0 100 200 300 400 500
-5,000DWT
5,000-9,999DWT
10,000-14,999DWT
15,000DWT-
Unclassified
age 25-
age 20-24
age 15-19
age 10-14
age 5-9
age 0-4
2008 Delivery
2009 Delivery
2010 Delivery
2011/2012
Lloyd's Shipping Economist as of April 1 2008
② PCC Delivery by Vessel-type/Age
No. of Oil Tankers
0 500 1000 1500 2000 2500
No.Handy
No.Panamax
No.Aframax
No.Suexmax
No.VLCC
No.Total Unclassified
age 25-
age 20-24
age 15-19
age 10-14
age 5-9
age 0-4
2008 Delivery
2009 Delivery
2010/11/2012
③ Oil Tanker Delivery by Vessel-type/AgeVLCC min-max* Forecasts
0
100
200
300
400
500
600
700
2000 2002 2004 2006 2008 2010 2012
No. of Vessels
Max.
Min
Newbuilding
PCC<All Types> (DWT)
0
2000
4000
6000
8000
10000
12000
14000
16000
2007 2008 2009 2010 2011
1,000dwt
11.7%7.2%
12.1%12.1%
Lloyd's Shipping Economist as of April 1 2008
"K"Line processedbased on Fearnleys,etc.
13
*No. in blue shows YoY growth in case of max.
PCC<All Types> (No. of Vessels)
0
200
400
600
800
1,000
2007 2008 2009 2010 2011
age25-max
age 25- min
age 20-24
age 15-19
age 10-14
age 5-9
age 0-4

3. World Market <3-1. Fleet Scale by Vessel-type/Age>
④ Containership Delivery by Vessel-type/Age
Min/Max* Fleet Increase Schedule (Estimated)
Lloyd's Shipping Economist as of Mar 1 2007
* Following graphs are based on other data-base to show no. of vessels, etc.
Containership Space (TEU)
0 1000 2000 3000 4000 5000
-1000 TEU-type
1000-1999
2000-2999
3000-3999
4000-4999
5000-5999
6000-7999
8000- TEU-type
1,000 TEUs
age 25-
age 20-24
age 15-19
age 10-14
age 5-9
age 0-4
2008 Delivery
2009 Delivery
2010 Delivery
2011/2012
Containership Delivery Schedule(No. of Vessels)
0
50
100
150
200
250
300
2008 2009 2010 2011 2012 2013
No. ofvessels
~3,100 ~5,100 ~8,200 ~10,000 10,000~
Containership Delivery Schedule(Capacity-base)
0
300
600
900
1200
1500
1800
2008 2009 2010 2011 2012 2013
1,000TEU
~3,100 ~5,100 ~8,200 ~10,000 10,001~
PR News Service
World Continership Increase (Results and Forecasts)
0
2000
4000
6000
8000
10000
12000
14000
16000
18000
'88'89'90'91'92'93'94'95'96'97'98'99'00'01'02'03'04'05'06'07'08'09'10'11
1,000 TEU/Vessel
0
0.02
0.04
0.06
0.08
0.1
0.12
0.14
0.16
0.18
No. of Vessels
Capa.(1,000TEU)
Capa. Growing Ratio
BRS-Alphaliner Annual Report2007 / Data as of 1 Jan. each year
Containerships <All Types> (Capacity)
0
4000
8000
12000
16000
20000
2007 2008 2009 2010 2011
(1,000 TEU)
age 25- max
age 25- min
age 20-24
age 15-19
age 10-14
age 5-9
age 0-4
Lloyd's Shipping Economist as of April 1 2008
14

3-2. Trend of Newbuildings
15
⑤ World Total Existing Tonnage
0
100
200
300
400
500
600
700
800
90 91 92 93 94 95 96 97 98 99 00 01 02 03 04 05 06
Mil. Gross Ton
Tanker Bulk Carrier Others
<Data: Lloyd's Register> *until '91, data as of mid-year, from '92 as of the year-end.Year
④ World Newbuilding Delivery
0
10
20
30
40
50
60
90 91 92 93 94 95 96 97 98 99 00 01 02 03 04 05 06Year
Mil. Gross Ton
Japan Korea China World Total
<Data: Lloyd's Register>
⑥ World Total Ship Demolition
05
1015202530354045
80 81 82 83 84 85 86 87 88 89 90 91 92 93 94 95 96 97 98 99 00 01 02 03 04 05 06 07
Year
Mil. DWT
Tanker Bulk Carrier Combined Carrier Others
<Data: Fearnleys>*Based on ships sold for scrap 3. 2005年は1~3月までの値。
③ World Newbuilding Orders _
0
20
40
60
80
100
90 91 92 93 94 95 96 97 98 99 00 01 02 03 04 05 06Year
Mil. Gross Ton
Japan Korea China World Total
<Data: Lloyd's Register>
① Ship Price as of Placing Order (Dry Bulkers, Tankers)
0
30
60
90
120
150
180
92 93 94 95 96 97 98 99 00 01 02 03 04 05 06 07 08Year
Mil. US$
VLCC AframaxCape PanamaxHandy
<Data: Clarkson>
<"K"Line processed based on domestic papers>
②Ship Price as of Delivery (Dry Bulkers, Tankers)
0
20
40
60
80
100
120
140
160
97 98 99 00 01 02 03 04 05 06 07 08 09 10 11Fiscal Year (Apr.-Mar.)
Mil. US$
CAPE PANAMAX
VLCC AFRAMAX
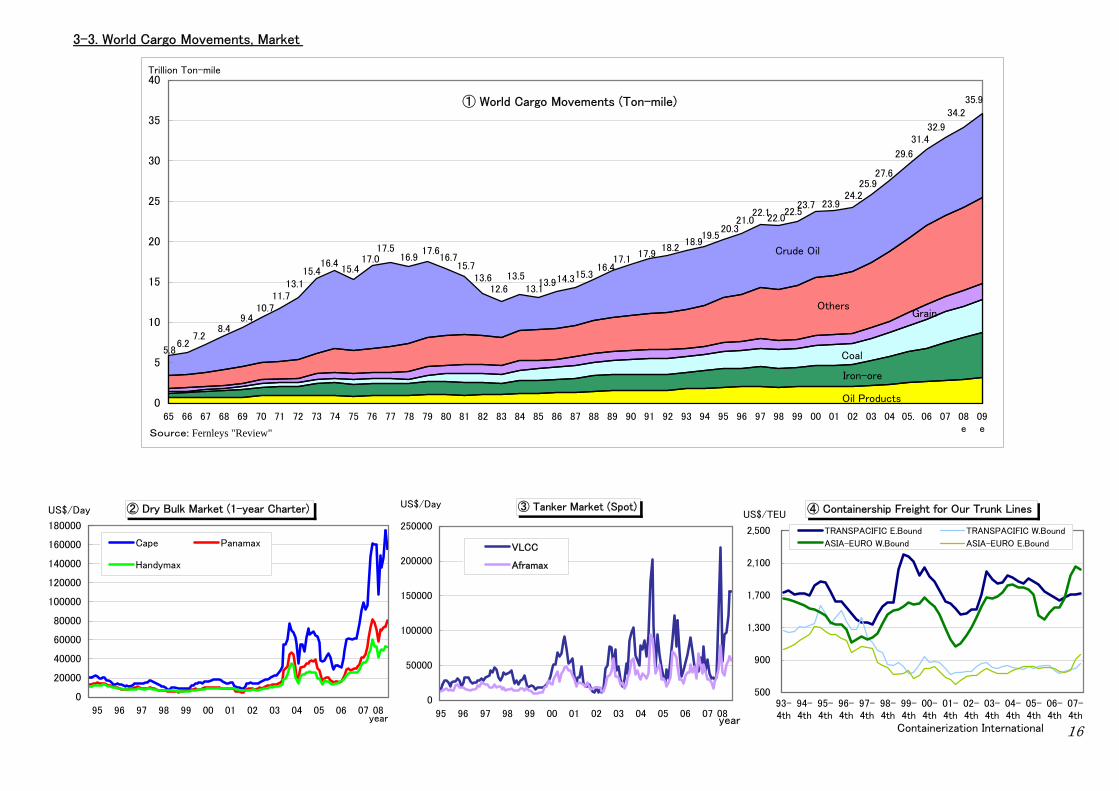
3-3. World Cargo Movements, Market
① World Cargo Movements (Ton-mile)
Oil Products
Iron-ore
Coal
GrainOthers
Crude Oil
35.934.2
32.931.4
29.6
27.625.9
24.223.923.7
22.522.0
22.121.0
20.319.5
18.918.2
17.917.1
16.415.314.313.9
13.113.5
12.613.6
15.716.7
17.616.9
17.517.0
15.416.4
15.413.1
11.710.7
9.48.4
7.2
5.86.2
0
5
10
15
20
25
30
35
40
65 66 67 68 69 70 71 72 73 74 75 76 77 78 79 80 81 82 83 84 85 86 87 88 89 90 91 92 93 94 95 96 97 98 99 00 01 02 03 04 05. 06 07 08e
09e
Trillion Ton-mile
Source: Fernleys "Review"
④ Containership Freight for Our Trunk Lines
500
900
1,300
1,700
2,100
2,500
93-4th
94-4th
95-4th
96-4th
97-4th
98-4th
99-4th
00-4th
01-4th
02-4th
03-4th
04-4th
05-4th
06-4th
07-4th
Containerization International
US$/TEU
TRANSPACIFIC E.Bound TRANSPACIFIC W.Bound
ASIA-EURO W.Bound ASIA-EURO E.Bound
② Dry Bulk Market (1-year Charter)
0
20000
40000
60000
80000
100000
120000
140000
160000
180000
95 96 97 98 99 00 01 02 03 04 05 06 07 08
US$/Day
year
Cape Panamax
Handymax
③ Tanker Market (Spot)
0
50000
100000
150000
200000
250000
95 96 97 98 99 00 01 02 03 04 05 06 07 08year
US$/Day
VLCC
Aframax
16

3-4. Emerging Markets (China)
① Economic Growth Rate
<MOFA "Key Economic Indicator"> *Data After '07 by IMF
<MOFA 'Key Economic Indicator'>
⑤ Per-Capital GDP by Region in China
Yunnan
ZhejiangJiangsu
Shandong
Tianjin
Beijing
Guizhou
HunanJiangxiAnhui
ChongqingXinjiang
NeimengguLiaoning
Hainan
Hebei Jilin
NationalAverage
16,000 yuan
Shanxi
HenanHubei
Guangdong
FujianHeilongjiang
Shanghai
Shaanxi
NingxiaQinhai
SichuanTibet
Guangxi
Gansu
0
1
2
3
4
5
6
10,000 Yuan/Person
② Trade Trends for China
0
200
400
600
800
1000
'94 '95 '96 '97 '98 '99 '00 '01 '02 '03 '04 '05 '06
(Billion Dollars)
0
40
80
120
160
200
Export
Import
Trade Balance
④ Income Gap between Urban and Rural Area
117.59
7.391
35.87
3.976
0
20
40
60
80
100
120
140
'85 '86 '87 '88 '89 '90 '91 '92 '93 '94 '95 '96 '97 '98 '99 '00 '01 '02 '03 '04 '05 '06
(100 Yuan/Person)
0
1
2
3
4
5
Disposal Income in Urban Area
Net Revenue in Rural Area
Income Gap (-folds)
Real GDP Growth
-2
0
2
4
6
8
10
12
14
'00 '01 '02 '03 '04 '05 '06 '07 '08-e
'09-e
(%)
Japan
Korea
U.S.
Brazil
Russia
India
China
Germany
France
U.K.
Mining and Industrial Outbut Growth (%)
-10
-5
0
5
10
15
20
2001 2002 2003 2004 2005 2006 2007
(%)
Japan
Korea
USA
Russia
India
China
Germany
France
U.K.
Eastern AreasAvrg 33,000yuan
North-East AreaAvrg 18,000 yuan
Central AreaAvrg 12,000 yuan
Western AreaAvrg 11,000 yuan
⑥ Earning Gap between Areas
15.1
2.6
5.744983288
0
2
4
6
8
10
12
14
16
18
'95 '96 '97 '98 '99 '00 '01 '02 '03 '04 '05 '06
(1000 Yuan /Person)
0
1
2
3
4
5
6(-fold)
Earnnig perPerson TheTop 20 Areas
Earnnig perPerson TheBottom 20Areas
Gap betweenthe Top 20and theBottom 20
*Dividing each of 31 provinces and cities nationwide into urban and ruralareas, income (disposal income for urban areas, and net revenue for rural)per-capita at each 62 area is calculated.
17
<METI 'White Paper on International Economy and Trade>
Shanghai57,000yuan
Guizhou6,000yuan
Gap of the No. of Durable Goods Ownedbetween Urban and Rural Area, 2006
0
50
100
150
200
Fan
Bicycle
Color T
VWash
er
Refrigir
ator
Teleph
one
Cell-ph
one
Air Con
dition
ar
Camera PC
Motorbi
ke
No./100 FamiliesUrban Area
Rural Area
*Data for Fan, Bicycle, Camera are as of 2005.
③ Energy Consumption in China
2.5
0.8
0.0
0.5
1.0
1.5
2.0
2.5
3.0
'85 '87 '89 '91 '93 '95 '97 '99 '01 '03 '05
(Billion SCEton)
-10
-5
0
5
10
15
20(%)
Energy Consumption
Growth Rate (YoY)
<METI 'White Paper on International Economy and Trade>
*SCE=Standard Coal Equivalent.
<METI 'White Paper on International Economy and Trade>
<METI 'White Paper on International Economy and Trade>
<METI 'White Paper on International Economy and Trade>
<METI 'White Paper on International Economy and Trade>

3-5. Emerging Markets (India, Vietnam)
① India
② Vietnam <Government of India, Ministry of Commerce & Industry, Dept. of Commerce>
<General Statistics Office of Vietnam>
Economic Growth in India
0
5
10
15
20
25
30
'90 '91 '92 '93 '94 '95 '96 '97 '98 '99 '00 '01 '02 '03 '04 '05 '06
(Trillion Rupee) %
0
2
4
6
8
10Real GDP
Real GDP Growth
Economic Growth in Vietnam
0
10
20
30
40
50
1995 1996 1997 1998 1999 2000 2001 2002 2003 2004 2005 2006
(Billion U.S.$) %
0
2
4
6
8
10
Real GDP
Real GDP Growth
18
Trends of Exports from India
0
20
40
60
80
100
120
140
1996-1997
1998-1999
2000-2001
2002-2003
2004-2005
2006-2007
(BillionU.S.$)
Japan China ASEAN4 NIEs USA EU15 Others
Trends of Imports into India
0
20
40
60
80
100
120
140
160
180
200
1996-1997
1998-1999
2000-2001
2002-2003
2004-2005
2006-2007
(BillionU.S.$)
Japan China ASEAN4 NIEs USA EU15 Others
Trends of Exports from Vietnam
0
5
10
15
20
25
30
35
40
45
1995
1996
1997
1998
1999
2000
2001
2002
2003
2004
2005
Prel. 20
06
(Billion U.S.$)
Japan China ASEAN4 NIEs U.S.A EU15※ Others
Trends of Imports into Vietnam
0
5
10
15
20
25
30
35
40
45
50
1995
1996
1997
1998
1999
2000
2001
2002
2003
2004
2005
Prel. 20
06
(BillionU.S.$)
Japan China ASEAN4 NIEs U.S.A. EU15※ Others
※W/O Data for Luxemburg

3-6. Emerging Markets (BRICs, VISTA, Turkey)
① BRICs (Ex. China)
② VISTA Countries
③ Turkey
Trends of Exports from VISTA Countries
0
20
40
60
80
100
120
2003 2004 2005 2006
(Billion U.S.$) Trends of Imports into VISTA Countries
0
20
40
60
80
100
120
140
160
2003 2004 2005 2006
(Billion U.S.$)
Vietnam
Indonesia
South Africa
Turkey
Argentina
<ジェトロ><JETRO>
Trends of Exports from BRICs Countries(Except China)
0
50
100
150
200
250
300
350
2003 2004 2005 2006
(10 BillionU.S.$)
Brazil
Russia
India
Trends of Imports into BRICs Countries(Except China)
0
50
100
150
200
2003 2004 2005 2006
(10 BillionU.S.$)
Trends of Imports into Turkey
0
20
40
60
80
100
120
140
160
180
1996 1997 1998 1999 2000 2001 2002 2003 2004 2005 2006 2007
(Billion U.S.$)
Others
EU15
U.S.A.
NIEs
ASEAN4
China
Japan
Trends of Exports from Turkey
0
20
40
60
80
100
120
1996 1997 1998 1999 2000 2001 2002 2003 2004 2005 2006 2007
(Billion U.S.$)
<Turkish Statistical Institute>19
<JETRO>

4. Bulk Carrier Business <4-1. "K"Line Fleet>
① K Line's Dry Bulk Fleet
0103 0203 0303 0403 0503 0603 0703 0803
Cape (DWT 170,000 ton~) 33 33 45 50 51 56 62 61
Over Panamax (DWT abt 100,000 ton) 10 11 12 15 14 12 15 15
Panamax (DWT 6-70,000 ton) 23 23 29 28 40 33 35 42
Handy max (DWT 4-50,000 ton) 13 14 20 16 15 17 21 24
Small Handy (DWT 3-40,000 ton) 19 21 17 17 15 11 11 12
Chip + Pulp 11 11 13 14 14 14 15 15
Total 109 113 136 140 149 143 159 169
*Data for Over Panamax till 0503 show no. of vessels operated by thermal coal carrier division
② K Line's Energy Transportation vessel Fleet
0203 0303 0403 0503 0603 0703 0803
LNG 21 22 24 26 30 31 34
Tankers LPG 2 3 3 3 3 3 5
CLEAN 2 3 3 3 2 5 5
DIRTY 5 5 6 9 10 10 12
VLCC 3 4 4 4 4 5 6
Tankers Total 12 15 16 19 19 23 28
③Ship Price as of Placing Order (Dry Bulkes, Tankers)
0
30
60
90
120
150
92 93 94 95 96 97 98 99 00 01 02 03 04 05 0607 08
Year
Unit: Mil. US$
VLCC Afra
Cape Panamax
Handy
④ Ship Price as of Completion (Dry Bulkers, Tankers)
0
30
60
90
120
150
97 98 99 00 01 02 03 04 05 06 07 08 09 10 11
Unit: Mil. US$
Fiscal Year (Apr.-Mar.)
CAPE PANAMAX
VLCC AFRAMAX
33 33 45 50 51 56 62 6110 11
12 15 14 1215 15
23 2329
28 40 3335 42
13 14
20 1615 17
2124
19 21
17 1715 11
1112
11 11
13 1414 14
1515
0
30
60
90
120
150
180
0103 0203 0303 0403 0503 0603 0703 0803
Vessels Cape Over Panamax Panamax
Handy max Small Handy Chip + Pulp
21 22 24 26 30 31 342 3 3 3
3 35
2 3 3 32 5
5
55 6
910
1012
34
44
45
6
0
10
20
30
40
50
60
70
0203 0303 0403 0503 0603 0703 0803
Vessels LNG Tankers LPG
Tankers CLEAN Tankers DIRTY
Tankers VLCC
<Data: Clarkson> 20<"K"Line processed based on domestic papers>

4-2. Business Expansion of Drybulk Business into the World
1.Development of Organization2002 May : Establishment of "Bulk & Gas Division" in “K” Line (Europe) Ltd. in UK.2006 Feb.: Dispatch of Resident Officer in Charge of Dry Bulk Business to Shanghai, China.2006 Jul. : Establishment of Drybulk Project Business Division in Headquarters of "K"Line Tokyo 2007 Jul. : Dispatch of Resident Officer in Charge of Dry Bulk Business to Mumbai, India.
2.Business Expansion in China
Contractor Contract Period Cargo, Volume Vessel, Services Trade Routes Date ReleasedJiangsu Shagang Group Co., Ltd 10 Years from 1Q of 2005 Iron Ore, 2 Mil. Tons per Year Consecutive Voyage Charter, Large-sized Bulker West Australia or S.Africa - China 2004/9/9Baoshan Iron & Steel Co., Ltd 3 Years from 4Q of 2006 Iron Ore, 0.5 Mil. Tons per Year 185,000-ton Bulker Brazil - China 2006/11/8Baoshan Iron & Steel Co., Ltd 10 Years from 2H of 2008 Iron Ore, 2.4 Mil. Tons per Year Consecutive Voyage Charter ・200,000-ton Bulker West Australia - China 2006/11/8Baoshan Iron & Steel Co., Ltd 3 Years from 3Q of 2007 Iron Ore, 0.5 Mil. Tons per Year 170,000-ton Bulker Brazil - China 2007/6/15Baoshan Iron & Steel Co., Ltd 15 Years from 1Q of 2011 Iron Ore, 1.2 Mil. Tons per Year Consecutive Voyage Charter ・300,000-ton Bulker Brazil - China 2007/6/15Shougang Corp 5 Years from 3Q of 2007 Iron Ore, 0.5 Mil. Tons per Year 170,000-ton Bulker Brazil - China 2007/6/15Wuhan Iron and Steel Corp 5 Years from 1Q of 2008 Iron Ore, 0.5 Mil. Tons per Year 170,000-ton Bulker Brazil - China 2007/6/15
3.Business Expansion in India
Contractor Contract Period Cargo, Volume Vessel, Services Trade Routes Date ReleasedJSW Steel 7 Years from Jan. 2007 Coking Coal, 0.5 Mil. Tons per Year Panamax 7 Voyages per Year East Australia - India 2006/12/25JSW Energy 15 Years from 2009 Thermal Coal, 2.5 Mil. Tons per Year Consecutive Voyage Charter of 2 Post Panamax Indonesia - India 2007/6/18JSW Steel 15 Years from Apr. 2008 Coking Coal, 0.7 Mil. Tons per Year Consecutive Voyage Charter of a Panamax or Post P'max Australia, S.Africa, China - India 2007/9/28
10 Years from 2008-2009 Consecutive Voyage Charter of 2 Panamax 10 Years from 2012-2014 Consecutive Voyage Charter of 3 Post Panamax 10 Years from 2011-2014 Consecutive Voyage Charter of 5 Capesize
4. Business Expansion in Europe
Contractor Contract Period Cargo, Volume Vessel, Services Trade Routes Date ReleasedILVA(Italy) From 2009 Iron Ore A Long-term Voyage Charter of 300,000-ton Bulker Brazil - Italy 2004/5/24Electricité de France From 2009 A Long-term Time Charter of 170-180,000-ton Bulker 2006/11/17
5. Business Expansion in Other Area
Contractor Contract Period Cargo, Volume Vessel, Services Trade Routes Date ReleasedKorea Western Power Co., Ltd. 10 Years from 2H of 2011 Thermal Coal, 2.5 Mil. Tons per Year Consecutive Voyage Charter of a Capesize & Panamax Australia, S.Africa, Indonesia, Canada, China - S.Korea 2008/1/30Glovis Co., Ltd. 20 Years from 2012 Iron Ore, 3 Mil. Tons per Year Consecutive Voyage Charter of 250,000-ton Bulker West Australia - South Korea 2008/2/29
Coking Coal and Thermal Coal,12 Mil. Tons per Year
Australia, Indonesia, S.Africa , China,etc. - East and West Coast of India
2008/3/17JSW Group
21

4-3. Demand on Dry Bulk
① Transition of World Crude Steel Production
2007 Total 1,344 Million Ton (+8.1% YoY)
Germany
Italia
Spain
CIS(Soviet)
USA
Brazil
OthersJapan,120.2
IndiaFrance
TurkeyEngland
Korea
China,489.2
Japan China Korea India
France Germany Italia Spain
England Turkey CIS(Soviet) USA
Brazil Others
1985 Total 717 Million Ton
Japan
China
Korea
India
France
Germany
CIS(Soviet)
USA
Brazil
Others
Italia
Turkey
EnglandSpain
Japan China KoreaIndia France GermanyItalia Spain EnglandTurkey CIS(Soviet) USABrazil Others
1995 Total 752 Million Ton
Korea
India
France
CIS(Soviet)
USA
Brazil
Others
China, 95.4
Germany
Italia
Spain
Japan,101.6
Turkey England
Japan China Korea India
France Germany Italia Spain
England Turkey CIS(Soviet) USA
Brazil Others
1955 Total 273 Million Ton
CIS(Soviet)
USA
Spain
GermanyItalia
EnglandTurkey
OthersBrazil France
China,KoreaJapanIndia
Japan China KoreaIndia France GermanyItalia Spain EnglandTurkey CIS(Soviet) USABrazil Others
1965 Total 459 Million Ton
France
Germany
Italia
Spain
England
Turkey
USA
Brazil
Others
Japan China
India
Korea
CIS(Soviet)Japan China Korea
India France GermanyItalia Spain EnglandTurkey CIS(Soviet) USABrazil Others
1975 Total 647 Million Ton
Japan
China
Korea
India
France
Germany
Italia
Spain
EnglandCIS(Sovie
t)
USA
Brazil
Others
Turkey
Japan China Korea
India France Germany
Italia Spain England
Turkey CIS(Soviet) USA
Brazil Others
2005 Total 1,138 Million Ton
KoreaIndia
England
CIS(Soviet)
USA
Brazil
OthersJapan,112.5
China,349.4
France
GermanyItalia
Spain
Turkey
Japan China Korea India
France Germany Italia Spain
England Turkey CIS(Soviet) USA
Brazil Others
2006 Total 1,243 Million Ton (+ 9.2% YoY)
USA
Brazil
Others
CIS(Soviet)
India
FranceGermany
ItaliaSpain
EnglandTurkey
Korea
China,422.7
Japan,116.2
Japan China Korea India
France Germany Italia Spain
England Turkey CIS(Soviet) USA
Brazil Others
22
(+3.4%YoY)
(+3.3%YoY)
(+21.0%YoY)
(+15.8%YoY)

4-3. Demand on Dry Bulk
② World Coal Export (Thermal/Coking Coal) ③ World Coal Import in Total (2006) (2006)
Export Import
(2004) (2004)
Export Import
IISI Report', 'Handbook for Iron and Steel Statistics', 'Clarkson', etc.
(2002) (2002)
Export Import
Data: 'Annual Energy Report', etc.
④ Iron Ore Import into Major Asian Countries
0
100
200
300
400
500
600
700
800
900
1996 1998 2000 2002 2004 2006 2008e
Milliion Tons
Japan China
Korea Taiwan
Total
Total Thermal Coal Export
451.3 Mil. Tons
Indonesia
Australia
ChinaSouthAfrica
Russia
Columbia
Others
Poland
USA
Total CokingCoal Export
189.0 Mil. Tons Australia
Canada
USA
Russia
OthersIndonesia
China
Total Import658.6 Mil. Tons
Japan
Korea
Taiwan
Germany
Others
Russia
USA
Canada
Spain
India
UK
⑤ World Coal Consumption
0
200
400
600
800
1,000
1,200
'71 '73 '80 '85 '90 '95 '00 '01 '02 '03 '04 '05
Conversion Volume for Oil / Mil.Tons
USA
EU15
China
Japan
Korea
India
ASEAN7
ex. USSR
Others
Quoted from different sauces, total for 'Export' and 'Import' are not coincident.
Total Thermal Coal Export563 Mil. Tons
Columbia
Russia
SouthAfrica China
Australia
U.S.A
Kazakhstan
OthersIndonesi
a
Total CokingCoal Export
192 Mil. Tons Australia
Canada
U.S.A.
China
Others
Russia
Total Import754 Mil. Tons
Taiwan
Korea
JapanOthers
U.K.
GermanyIndia
U.S.A.Italy
Netherlands
Spain
Total CokingCoal Export220 Mil.Tons
Others
Canada
USA
Indonesia
Australia
Total ThermalCoal Export
593 Mil Tons
Others
China
Columbia
SouthAfrica
Russia
Indonesia
Australia
Italy
RussiaChina
USA
India
Germany
UK
Taiwan
Korea
JapanOthers
Total Import819 Mil.T
23
Data: 'Handbook of Energy & Economic Statics in Japan',etc.

5. Car Carrier Business <5-1."K"Line Fleet and Cargo Movements>
①"K"Line PCC FleetNo. of Cars (RT) 0103 0203 0303 0403 0503 0603 0703 0803
6000 - 3 4 7 10 12 13 17
5000 (4750-5650) 28 28 28 26 26 29 30 32
4000 (3800-4600) 13 13 13 15 17 20 24 25
3000 (2800-3500) 10 8 9 13 13 15 14 11
2000 (1600-2500) 10 8 6 4 2 2 5 5
800 (800-850) 6 5 5 5 10 15 14 12
Total 67 65 65 70 78 93 100 102
Fleet Scale (No of. Vessels)
6 5 5 5 10 15 14 1210 8 6 4
22 5 5
108 9 13 13
15 1411
1313 13 15
17
20 2425
2828 28 26
26
2930 32
3 47
10
1213 17
0
10
20
30
40
50
60
70
80
90
100
110
0103 0203 0303 0403 0503 0603 0703 0803
Vessels 800 2000 3000
4000 5000 6000
Fleet Scale(Estimated Capacity)
0
50
100
150
200
250
300
350
400
450
0103 0203 0303 0403 0503 0603 0703 0803
1000 Cars 800 2000 3000
4000 5000 6000
<Data: JAMA>
③ Total Cars/Trucks Expoted from Japan (Inc. Cars by GM Japan)② Cars/Trucks Transported by Our Fleet (Each Half Year)
24
<自動車工業会>
0
50
100
150
200
250
300
350
400
97/03 98/03 99/03 00/03 01/03 02/03 03/03 04/03 05/03 06/03 07/03 08/03
10,000 CarsJapan/North America Japan/Europe Japan/Others
Others Trade Bound for Japan
0
100
200
300
400
500
600
700
97/03 98/03 99/03 00/03 01/03 02/03 03/03 04/03 05/03 06/03 07/03 08/03
10,000 Cars USA EU Russia Middle East
China Thailand Other Asia Oceania
Central America South America Africa Others
※ 'Others' includes short sea transportation in Europe from 04/09

5-2. Demand on Vehicles
① World Automobile Production (2007) <OICA>
(Data: 'Handbook of Energy & Economic Statics in Japan')
③ Transition of Overseas Vehicle Production by Japanese Automakers <Data: JAMA>
<Data: JAMA>
<Data: JAMA>
Japan38.2%
China29.3%
Korea13.5%
Thailand4.1%
India7.6%
Others1.3%
Makaysia1.4%
Indonesia1.4%
Iran3.3%
25
Breakdown in Asia (2007)
Y1997 Y2007 ASIA 31.2% 41.6% EUROPE 34.2% 31.0% USA 33.2% 26.2%
④ Four-wheel Car Production and Sales in USA
0
5,000
10,000
15,000
20,000
1999 2000 2001 2002 2003 2004 2005 2006 2007
Unit : 1000 Cars
Production Sales (Import in Sales)
0
20
40
60
80
97 98 99 00 01 02 03 04 05 06 07
(Unit: Mil. Cars)CHINA
JAPAN
OTHER ASIA
EUROPE
USA
OCEANIA
AFRICA
Asia
② No. of Vehicles Possessed (Cars/1,000 People)
0
200
400
600
800
1000
1971 1980 1990 2000 2005
USA Brazil Russia Africa Middle East
China Japan Korea EU15 ASEAN9
Overseas Vehicle Production by Japanese Automakers
0
2000
4000
6000
8000
10000
12000
1985 1986 1987 1988 1989 1990 1991 1992 1993 1994 1995 1996 1997 1998 1999 2000 2001 2002 2003 2004 2005 2006
Unit 1000 Cars USA EU AsiaMiddle East Europe(ex.EU) North America (ex.USA)Latin America Africa Oceania

6. Container Business <6-1. "K"Line Fleet and Cargo Volume>
① "K"Line Containership Fleet0103 0203 0303 0403 0503 0603 0703 0803
5500TEU Over (5500-8000) 0 8 13 13 13 15 21 22
3500TEU Type (3400-4000) 21 16 17 17 22 25 23 24
2800TEU Type (2700-2900) 8 5 5 4 5 5 7 8
2000TEU Type (1500-2500) 10 13 10 13 11 9 11 17
~1400TEU Type 18 19 18 17 22 23 27 28
Total 57 61 63 64 73 77 89 99
③"K"Line Volume, Share for Asia-North America/Europe Routes
② "K" Line Containership Average Freight/Volume for All Services
*As cargo volume for '97 1H-'99 2H, half of the actual data are indicated.
266258277280311
355391413414407426
450435409
556575 566
630661 666
825804763
584 615 617595
667
520
808
657711
732742754
516530504
1299
1301
1349
1220
11431146
1175
11391144
124312501207
117311751178
1108
1000
10501122
925
1044
932
810852
915861
1110
98110371073
1055
10731132
1078
1143
1068
11281194
0
200
400
600
800
1000
97 1H 98 1H 99 1H 00F1Q
00F3Q
01F1Q
01F3Q
02F1Q
02F3Q
03F1Q
03F3Q
04F1Q
04F3Q
05F1Q
05F3Q
06F1Q
06F3Q
07F1Q
07F3Q
USD/TEU
0
200
400
600
800
1000
1200
1400
1000 TEU Volume Average Freight
26
Asia-North America East-bound Volume, Share
0
50000
100000
150000
200000
250000
300000
350000
400000
450000
500000
1000 TEU)
0
0.01
0.02
0.03
0.04
0.05
0.06
(Share)
KL Volume 2E+0 2E+0 2E+0 2E+0 2E+0 3E+0 2E+0 3E+0 3E+0 3E+0 3E+0 4E+0 4E+0 4E+0 4E+0
Share 0.048 0.048 0.049 0.047 0.051 0.048 0.046 0.046 0.048 0.047 0.048 0.049 0.054 0.057 0.054
20011H
20012H
20021H
20022H
20031H
20032H
20041H
20042H
20051H
20052H
20061H
20062H
20071H
20072H
20081He
Asia-Europe West-bound Volume, Share
0
50000
100000
150000
200000
250000
300000
(1000 TEU)
0
0.01
0.02
0.03
0.04
0.05
0.06
(Share)
KL Volume 96613 1E+0 97793 2E+0 2E+0 2E+0 2E+0 2E+0 2E+0 2E+0 2E+0 2E+0 3E+0 3E+0 3E+0
Share 0.037 0.037 0.035 0.05 0.045 0.048 0.044 0.045 0.042 0.04 0.041 0.038 0.04 0.035 0.034
20011H
20012H
20021H
20022H
20031H
20032H
20041H
20042H
20051H
20052H
20061H
20062H
20071H
20072H
20081He
Fleet Scale(No. of Vessels)
19 18 17 22 23 27 28
10 13 10 1311 9
1117
8 55 4
5 5
7
821 1617 17
22 25
23
24
0 8 13 13
1315
21
22
18
0
20
40
60
80
100
0103 0203 0303 0403 0503 0603 0703 0803
Vessel ~1400TEU Type 2000TEU Type
2800TEU Type 3500TEU Type
5500TEU Over
Fleet Scale (Estimated Capacity)
0
50
100
150
200
250
300
350
0103 0203 0303 0403 0503 0603 0703 0803
1000 TEU
~1400TEU Type 2000TEU Type
2800TEU Type 3500TEU Type
5500TEU Over

6-1. "K" Line Fleet and Cargo Volume④ "K"Line/All Line Cargo Volume, Loading Factor for Asia-North America/Europe Services
"K"Line Asia-N. America (East-bound) CargoVolume, L/F
0
50
100
150
200
250
20001H20002H20011H20012H20021H20023Q
20024Q
20031Q
20032Q
20033Q
20034Q
20041Q
20042Q
20043Q
20044Q
20051Q
20052Q
20053Q
20054Q
20061Q
20062Q
20063Q
20064Q
20071Q
20072Q
20073Q
20074Q
1,000 TEU
-20%
0%
20%
40%
60%
80%
100%
120%Cargo Volume L/F L/F Growth
Container Asia Europe Trade (Market) Data: Drewry
0
500
1000
1500
2000
2500
3000
19981H
19992H
20003Q
20012Q
20021Q
20024Q
20033Q
20042Q
20051Q
20054Q
20063Q
20072Q
2008e1Q
1,000 TEU/USD
-20%
0%
20%
40%
60%
80%
100%
120%
CAPA W/B CARGO W/B Loading Factor E/B(%) L/F Growth Freight(USD/TEU)
"K"Line Asia-Europe (West-bound) Cargo Volume, L/F
0
50
100
150
20001H
20002H
20011H
20012H
20021H
20023Q
20024Q
20031Q
20032Q
20033Q
20034Q
20041Q
20042Q
20043Q
20044Q
20051Q
20052Q
20053Q
20054Q
20061Q
20062Q
20063Q
20064Q
20071Q
20072Q
20073Q
20074Q
1,000 TEU
-20%
0%
20%
40%
60%
80%
100%
120%Cargo Volume L/F L/F Growth
Container Transpacific Trade (Market) Data: Drewry
0
500
1000
1500
2000
2500
3000
3500
4000
4500
19962H
19971H
19982H
20001Q
20004Q
20013Q
20022Q
20031Q
20034Q
20043Q
20052Q
20061Q
20064Q
20073Q
2008e2Q
1,000 TEU/USD
-20%
0%
20%
40%
60%
80%
100%
CAPA E/B CARGO E/B L/F Growth Loading FactorE/B(%) Freight(USD/TEU)
27

6-2. Container Terminal Operated by "K"Line
Terminal Location Length Depth Total Area Storage Capacity* Gantry Crane
Japan "K"LINE Tokyo Container Terminal Ohi No.1 and No.2 Berth 660 m 15 m 259,500 SQM 4,370 TEU 5 Units
"K"LINE Yokohama Container Terminal Honmoku Quay A No.5 and 6 Berth 400 m 12 m 133,591 SQM 1,968 TEU 3 Units
"K"LINE Osaka Container Terminal Nanko No.8 Berth 350 m 14 m 63,031 SQM 1,082 TEU 2 Units
"K"LINE Kobe Container Terminal** Rokko Terminal RC 4 West and RC 4/5 Berth 800 m 14 m 355,900 SQM 4,716 TEU 6 Units
USA International Transportation Service, Inc. Long Beach, CA., Pier G 1,920 m 13-16 m 955,000 SQM 15,905 TEU 19 Units
Husky Terminal and Stevedoring Inc. Tacoma, WA., Berth 3&4 830 m 16 m 376,000 SQM 4,800 TEU 4 Units
TransBay Container Terminal Inc. Oakland, CA., Berth 25 320 m 14 m 182,000 SQM 2,551 TEU 2 Units
Belgium Antwerp Internatinal Terminal NV*** Antwerp, PSA-HNN Deurganck Terminal 350 m 15.5 m 175,000 SQM 2,990 TEU 3 Units
* Flat Space
**Operating with Maersk K.K.
***Joint venture between K-Line ,Yang Ming Line,Hanjin Shipping and PSA-HMN.
Tokyo・YokohamaOsaka・KobeLong Beach
TacomaOackland
Antwerp
Tokyo(Ohi)
Kobe(Rokko)
ITS (Long Beach)
A.I.T
28

6-3. Container Cargo Movements
① Container Cargo Movements
② Asia⇒North America/Europe Country-wise Cargo Volume
Cargo Volume : Asia⇒North America
4,2535,448
6,1117,403
8,6349,779736
736773
813
873
883
456
516512
539
575
612
572
629685
615
611
630
1,152
1,2831,326
1,446
1,605
1,701 1,683
351
419447
502
581
640
10,083
828602585
630
0
3,000
6,000
9,000
12,000
15,000
2001 2002 2003 2004 2005 2006 2007
1000 TEU Cargo Volume : Asia⇒Europe
3,0853,675
4,742
6,445
468
474
513
543
590
674
235
262
290
297
370
534
196
208
232
232
254
292
865
955
1,067
1,085
1,268
1,551
2,5651,932
0
2,000
4,000
6,000
8,000
10,000
2002 2003 2004 2005 2006 2007
1000 TEU
29<Japan Maritime Center/Piers>
North America⇒Asia
1,141 1,211 1,577 1,726 2,006 2,233
932 883895 843
840834
392 426439 455
470488
283 285302 340
391470
738
485.387517.276531.442573.483
610.643615.884
827.952
160.936159.001196.591
206.46237.745
220.77
2,389
818
626
313.839
0
2,000
4,000
6,000
2001 2002 2003 2004 2005 2006 2007
1000 TEU
China* Japan Korea
Taiwan ASEAN South Asia
Japan28%
China34%
Japan14%
China42%
Japan10%
China57%
Japan6%
China70%
China68%
Japan7%
Japan13%
China52%
<FEFC>
1
North
America
Asia
Europe
Intra-Asia
350 (15.0%)
Others864 (36.9%)
Total: 23.41 million TEU
305 (13.0%)
533 (22.8%)288 (12.3%)
1990 Container Cargo Movements
*Data for China includes Hong Kong and Macao

6-4. Port-wise Container Handling Volume
① Port-wise Container Handling Volume in Asia
② Top 10 Ports for 2007 Container Handling
(Unit: Million TEU)
Port 2007 2006 Growth Rate1 Singapore 27.9 24.8 12.5%2 Shanghai 26.2 21.7 20.5%3 Hong Kong 23.9 23.5 1.4%4 Shenzhen 21.1 18.5 14.2%5 Busan 13.3 12.0 10.3%6 Rotterdam 10.8 9.7 11.8%7 Dubai 10.7 8.9 19.4%8 Kaohsiung 10.3 9.8 5.0%9 Hamburg 9.9 8.9 11.7%
10 Qingdao 9.5 7.7 22.9%
※ Ports in China(Containerization International)
4,783Osaka Bay
1,724
7,5481,354
Tokyo Bay
Busan
13,270634
10,260979
Kaohsiung
Shanghai
26,15049
Singapore
27,930917
Hong Kong
1,46523,880
2007(Above)
1980(Below)
Transition of Container Handling Volume
(Unit:1,000TEU)
30
<Ref. Containerization International Year Book, Website for Each Port, etc.>
③ Transition of Container Handling among Major Ports in Asia
0
5
10
15
20
25
30
2000 2001 2002 2003 2004 2005 2006 2007
Mil.TEU
Singapore
Shanghai
Hong Kong
Shenzhen
Busan
Kaohsiung
Qingdao
Tokyo
Yokohama
Nagoya
Kobe
Osaka

6-5. Factory of the World, Asia
① Major Electric Device Nation-wise Production ②Trends of Export from Asian Major Nations and Regions
<METI White Paper on International Economy and Trade>
* Data based on estimation for 2006.
Malaysia10.3%
China31.2%
Korea12.1%
Singapore17.2%
Thailand19.3%
Phillipines8.0%
Indonesia1.3%
Japan0.6%
Chemical Fiber
Others18.5%
W.Europe6.4%
China44.8%
Japan3.0%
East Asia(Ex. Japan& China)
19.5%
US7.8%
Vietnam0.8%
Japan31.8%
China56.0%
Korea2.9%
ASEAN48.5%
HDD Digital Camera
East AsiaProduction Ratio
100%
31
Personal Computer
China87.3%
Japan2.1%
East Asia(Ex. Japan& China)
7.5%
Others3.2%
East AsiaProductionRatio 96.8%
Mobile Phone
Japan4.9%
Korea18.2%
China46.7%
Europe11.4%
S.America4.7%USA
3.0%
Singapore1.6%
Taiwan4.4%
India2.5%
Malaysia2.5%
East AsiaProductionRatio 80.8%
0
200
400
600
800
1,000
1,200
’80 ’82 ’84 ’86 ’88 ’90 ’92 ’94 ’96 ’98 ’00 ’02 ’04
(Billion Dollar)
-5%
0%
5%
10%
15%
20%
25%
30%
35%Export ex China (inc. Hong Kong)
Year to Year Growth Rate
0
50
100
150
200
250
300
350
400
450
’80’82’84’86’88’90’92’94’96’98’00’02’04
(Billiondollar)
-15%
-10%
-5%
0%
5%
10%
15%
20%
25%
30%Export ex ASEAN4
Year to Year Growth Rate
0
50
100
150
200
250
300
350
400
450
’89 ’91 ’93 ’95 ’97 ’99 ’01 ’03 ’05
(Billion dollar)
-20%
-15%
-10%
-5%
0%
5%
10%
15%
20%
25%
Export ex NIEs
Year to Year Growth Rate
0
100
200
300
400
500
600
’80 ’82 ’84 ’86 ’88 ’90 ’92 ’94 ’96 ’98 ’00 ’02 ’04
(Billion dollar)
-20%
-10%
0%
10%
20%
30%Export exJapan
Year to Year Growth Rate
DVD Recorder/Player
Indonesia3.8% Europe
7.5%
Malaysia5.5%
Thailand2.4%
S.America0.4%
China78.1%
Korea1.1%
Japan1.2%
East AsiaProductionRatio 92.2%
Automobile
NAFTA24.6%
EU27.3%
Others10.3%
Taiwan0.7%
East Asia(Ex.
Japan &China)12.1%
Japan16.4%
China8.6%
East AsiaProductionRatio 37.1%
East AsiaProductionRatio 67.3%

7. New Businesses
① Heavy Lift Shipping
CommencingTime
Business Unit Investment Ratio Fleet Future Plan Remarks
April 2007 SAL* (Germany) "K"Line 50% 15 Vessels 4 vessels with 2x700 ton cranes are delivered Investment via (Consolidated Subsidiary) as of 2007 in 2008. "K" Line Heavy Lift
2 vessels with 2x1000 ton cranes will be (UK) Ltd.Partner: SAL* delivered in 2009 and 2010, respectively.
*Schiffahrtskontor Altes Land GmbH & Co KG
② Offshore Support Vessels
CommencingTime
Business Unit Investment Ratio Fleet Future Plan Remarks
Around 2011 K LINE OFFSHOER AS Partner: 6 Vessels Dec. 2010 - Jul. 2011 Ship management CH. Sørensen as of 2011 2 AHTS* will be delivered. is entrusted to Management AS 4 PSV** will be delivered. OSM Group, (Norway) Shipyard: Aker Yards AS, Norway Norway
*AHTS - Anchor Handling Tug and Supply Vessel which is a dual-purpose tug designed for transport of cargo in addition to anchor handling and towing duties of floating rigs (Jack Ups, Semi Submersibles, etc.)**PSV - Platfoam Supply Vessel which is used for transport of cargo (Fuel, Food, Water, Dry-Bulk, Explosives, etc.) to and from offshore installations.
③ Floating LNG Production
CommencingTime
Business Unit Investment Ratio Fleet Future Plan Remarks
After 2011 FLEX LNG Ltd. (Registered 15% = aprox. 18 Billion Yen 4 Vessels 4 floating liquefaction units (LNG Producers) FLEX LNG already
in British Virgin Islands, as of 2011 will be delivered in 2011. signed MoUs with
Listed in Norway OTC Market) Other Major Shareholders: Shipyard: Samsung Heavy Industries, Korea Peak Petroleum and
http://www.flexlng.com Security Houses, etc. Rift Oil, respectively.
AHTS
PSV
32
Heavy Lift Ship

8. Financial Data <8-1. Trends of Major Financial Figures>
(Unit : Million Yen)
Our Financial Term 110th 111th 112th 113th 114th 115th 116th 117th 118th 119th 120th 121st 122nd 123rd 124th 125th 126th 127th 128th 129th 130th 131st 132nd 133rd 134th 135th 136th 137th 138th 139th 140th
Ended in Ended in Ended in Ended in Ended in Ended in Ended in Ended in Ended in Ended in Ended in Ended in Ended in Ended in Ended in Ended in Ended in Ended in Ended in Ended in Ended in Ended in Ended in Ended in Ended in Ended in Ended in Ended in Ended in Ended in Ended in
'78 Mar. '79 Mar. '80 Mar. '81 Mar. '82 Mar. '83 Mar. '84 Mar. '85 Mar. '86 Mar. '87 Mar. '88 Mar. '89 Mar. '90 Mar. '91 Mar. '92 Mar. '93 Mar. '94 Mar. '95 Mar. '96 Mar. '97 Mar. '98 Mar. '99 Mar. '00 Mar. '01 Mar. '02 Mar. '03 Mar. '04 Mar. '05 Mar. '06 Mar. '07 Mar. '08 Mar.
No. of Consolidated Subsidiaries 17 18 19 20 20 19 19 20 20 24 27 31 39 48 53 53 59 82 90 95 91 88 87 93 114 142 177 186 207 220 275
No. of Equity Method Affiliates 0 2 2 2 2 2 10 11 11 10 10 7 6 10 10 11 11 10 11 12 13 17 21 19 17 18 18 18 26 28 28
Total 17 20 21 22 22 21 29 31 31 34 37 38 45 58 63 64 70 92 101 107 104 105 108 112 131 160 195 204 233 248 303
302,337 269,724 352,273 410,759 443,010 423,686 416,555 470,640 447,617 359,916 362,869 389,387 454,551 488,107 511,235 498,843 444,093 448,969 450,095 482,620 517,755 513,100 485,693 557,869 571,013 632,725 724,666 828,443 940,818 1,085,539 1,331,048
275,553 239,709 309,013 363,774 391,646 384,079 370,752 408,518 397,213 327,939 329,582 332,726 388,172 415,912 428,886 425,786 378,112 377,201 376,748 407,755 439,656 441,843 411,741 473,365 502,762 552,006 601,552 666,099 791,803 957,847 1,127,017
Gross Profit on Sales 26,784 30,015 43,260 46,985 51,364 39,607 45,803 62,122 50,404 31,977 33,287 56,661 66,379 72,194 82,348 73,057 65,981 71,767 73,347 74,865 78,098 71,256 73,951 84,504 68,251 80,719 123,113 162,343 149,015 127,692 204,030
21,014 23,734 24,731 28,187 29,981 31,314 32,514 35,171 35,675 34,239 32,531 41,458 44,100 57,260 63,094 60,155 59,779 60,594 49,280 51,265 51,176 49,748 47,133 48,494 49,202 51,436 52,579 54,289 61,039 66,335 74,381
5,770 6,281 18,529 18,798 21,383 8,293 13,289 26,951 14,729 △ 2,262 756 15,203 22,279 14,934 19,254 12,902 6,202 11,173 24,067 23,599 26,922 21,507 26,817 36,009 19,048 29,282 70,534 108,054 87,976 61,356 129,648
Interest and Dividends Received 3,858 3,105 3,382 3,760 4,216 4,791 3,213 2,995 2,662 2,240 2,000 2,135 2,559 3,267 2,748 2,716 2,046 1,588 1,701 1,960 1,841 2,157 2,100 1,992 1,463 1,332 1,904 2,030 3,213 5,696 6,546
- - - - - - - - - - - - - - - - - - - - - 797 654 312 178 208 528 790 - 1,572 1,642
Other Non-operating Income 3,887 4,558 2,625 1,530 2,565 6,046 5,176 1,772 8,190 13,517 14,939 7,588 6,655 9,203 6,241 6,402 6,305 4,188 5,570 1,344 1,304 1,442 1,944 1,164 1,680 1,118 827 1,319 2,590 1,763 2,004
7,745 7,663 6,007 5,290 6,781 10,837 8,389 4,767 10,852 15,757 16,939 9,723 9,214 12,471 8,990 9,121 8,354 5,778 7,273 3,306 3,146 4,398 4,699 3,470 3,323 2,659 3,261 4,140 5,804 9,032 10,192
Interest and Discount Expenses 13,165 13,222 15,158 16,280 17,472 17,728 18,587 18,386 17,264 17,455 17,574 17,902 21,297 22,443 22,457 17,159 13,746 12,767 17,720 15,840 15,652 15,128 11,591 12,240 9,478 6,487 5,451 4,546 4,336 4,228 5,105
Other Non-operating Expenses 1,737 2,243 1,631 480 2,634 1,836 574 2,218 833 1,370 1,114 636 2,869 2,688 2,946 2,367 2,752 2,913 3,636 2,734 3,610 5,281 5,564 434 925 1,781 5,778 412 871 2,233 8,868
14,902 15,465 16,789 16,760 20,106 19,564 19,161 20,604 18,097 18,825 18,688 18,538 24,166 25,131 25,404 19,526 16,499 15,681 21,356 18,574 19,262 20,411 17,157 12,675 10,403 8,269 11,230 4,959 5,207 6,461 13,973
△ 1,387 △ 1,521 7,747 7,328 8,058 △ 434 2,517 11,114 7,484 △ 5,330 △ 993 6,388 7,327 2,274 2,840 2,496 △ 1,943 1,271 9,983 8,331 10,806 5,494 14,358 26,804 11,968 23,672 62,565 107,235 88,573 63,927 125,867
Extraordinary Income 4,694 5,296 4,963 5,997 5,928 11,026 5,566 2,900 3,493 5,838 13,275 6,639 2,647 2,829 10,753 2,957 9,898 10,745 5,043 6,920 2,927 7,899 4,232 2,579 14,505 4,263 1,860 1,980 8,498 14,384 11,834
Extraordinary Losses 2,128 2,530 8,650 6,791 7,357 3,436 5,034 6,191 7,894 7,138 20,491 12,124 2,574 1,760 4,648 2,935 4,068 6,817 9,817 5,915 7,987 7,376 7,899 26,776 18,226 9,255 9,398 13,704 1,793 1,959 873
Income before Income Taxes 1,179 1,245 4,060 6,534 6,629 7,156 3,049 7,823 3,083 △ 6,630 △ 8,209 903 7,400 3,342 8,946 2,518 3,886 5,199 5,208 9,336 5,745 6,018 10,691 2,606 8,247 18,680 55,026 95,510 95,278 76,352 136,828
Income Taxes 747 977 2,241 3,742 2,975 2,976 1,480 3,084 2,995 1,323 1,202 1,762 4,839 6,193 4,386 5,037 1,334 1,780 2,649 3,387 4,074 4,044 4,855 8,626 3,985 8,662 20,103 37,420 27,126 23,006 47,579
Deffered Corporate Tax (△=Plus) - - - - - - - - - - - - - - - - - - - - - - △ 1,198 △ 8,348 △ 1,090 △ 872 857 △ 3,209 3,952 315 2,422
- - - - - - - - - - - - - - - - - - - - - 377 192 380 585 518 870 1,446 1,775 1,516 3,815
19 △ 268 0 △ 162 △ 193 86 △ 97 64 △ 130 △ 361 △ 625 197 210 489 623 398 △ 114 △ 141 30 333 250 - - - - - - - - - -
- - △ 216 △ 238 △ 226 15 △ 56 △ 31 61 △ 813 △ 618 △ 669 - - - - - - - - - - - - - - - - - - -
- - - - - - 649 96 3 222 124 279 336 248 418 209 119 152 306 687 248 - - - - - - - - - -
413 536 2,035 3,192 4,073 4,079 2,371 4,802 160 △ 6,557 △ 8,044 △ 108 2,687 △ 3,092 4,355 △ 2,707 2,787 3,712 2,834 6,303 1,667 1,596 6,843 1,948 4,767 10,373 33,196 59,852 62,423 51,515 83,012
Total Assets 306,332 306,352 314,391 334,636 380,955 426,624 432,387 439,903 441,476 461,444 447,644 437,795 461,068 505,026 518,672 506,988 467,293 429,477 522,836 557,892 576,109 522,498 514,802 513,797 533,295 515,824 559,135 605,331 757,040 900,438 968,629
25,216 24,498 26,545 29,667 37,573 50,872 53,700 57,901 67,850 61,074 51,674 51,933 54,971 50,501 55,245 51,604 53,894 57,163 60,235 66,773 68,435 68,606 74,131 68,647 77,716 82,039 121,006 181,276 257,809 357,624 376,277
Average Exchange Rate 256.54 201.43 223.82 218.33 223.75 249.73 236.42 244.00 221.73 159.91 138.49 128.31 142.85 141.29 133.18 124.84 107.85 99.43 96.48 112.70 122.68 128.27 111.62 109.71 125.11 122.29 113.97 107.46 113.09 116.91 115.29
- - 2.20% 1.78% 1.82% - 0.60% 2.36% 1.67% - - 1.64% 1.61% 0.47% 0.56% 0.50% - 0.28% 2.22% 1.73% 2.09% 1.07% 2.96% 4.80% 2.10% 3.74% 8.63% 12.94% 9.41% 5.89% 9.46%
ROE - 2.16% 7.97% 11.36% 12.11% 9.22% 4.53% 8.61% 0.25% - - - 5.03% - 8.24% - 5.28% 6.68% 4.83% 9.93% 2.47% 2.33% 9.59% 2.73% 6.51% 12.99% 32.70% 39.60% 28.43% 16.74% 22.62%
Interest Bearing Liability 196,863 203,874 196,156 193,321 235,810 281,553 290,878 283,504 286,536 319,172 309,105 295,912 311,468 348,861 350,201 349,777 318,820 272,775 373,559 394,619 404,633 367,352 348,601 331,482 335,620 306,573 281,809 239,248 257,231 326,185 329,714
Financial Account Balance △ 9,307 △ 10,117 △ 11,776 △ 12,520 △ 13,256 △ 12,937 △ 15,374 △ 15,391 △ 14,602 △ 15,215 △ 15,574 △ 15,767 △ 18,738 △ 19,176 △ 19,709 △ 14,443 △ 11,700 △ 11,179 △ 16,019 △ 13,880 △ 13,811 △ 12,971 △ 9,491 △ 10,248 △ 8,015 △ 5,155 △ 3,547 △ 2,516 △ 1,123 1,468 1,441
(Operating Revenues) 1.18 1.22 1.20 1.18 1.16 1.17 1.18 1.18 1.19 1.25 1.24 1.30 1.28 1.34 1.33 1.34 1.32 1.34 1.37 1.38 1.36 1.33 1.34 1.32 1.27 1.27 1.24 1.26 1.27 1.27 1.25
(Operating Income) 3.97 2.74 1.61 1.51 1.57 5.89 2.14 1.49 1.58 - - 2.21 1.66 2.66 2.21 2.21 2.62 1.53 1.88 1.92 1.57 1.68 1.60 1.47 2.30 1.48 1.28 1.27 1.55 2.18 1.45
(Ordinary Income) - - 1.69 1.39 1.43 - 3.34 1.57 1.53 - - 3.59 1.41 2.18 1.65 2.11 - 1.29 1.02 1.20 1.05 0.67 1.29 1.24 1.68 1.44 1.26 1.23 1.53 2.00 1.42
(Net Income) 5.88 4.05 102.07 1.59 1.90 1.41 1.74 1.46 - - - - 0.88 - 1.20 - - 70.04 1.78 3.48 0.74 0.53 1.69 0.43 1.71 1.59 1.36 1.22 1.61 2.04 1.41
(Total Assets) 1.41 1.33 1.36 1.37 1.32 1.32 1.31 1.34 1.34 1.39 1.41 1.44 1.53 1.63 1.63 1.69 1.67 1.69 2.13 2.19 2.23 2.16 2.12 2.13 2.06 1.92 1.69 1.61 1.57 1.74 1.79
(Operating Revenues) 256,449 220,464 293,388 348,977 381,889 361,104 352,618 399,026 376,780 288,602 291,652 300,366 355,085 363,942 384,257 372,516 335,758 334,859 328,123 348,613 379,602 385,482 362,029 424,021 449,157 499,791 584,957 658,699 742,568 857,278 1,063,704
(Operating Income) 1,453 2,293 11,499 12,461 13,627 1,407 6,221 18,121 9,322 △ 7,505 △ 3,975 6,884 13,453 5,622 8,731 5,846 2,363 7,319 12,788 12,281 17,171 12,766 16,809 24,444 8,299 19,843 55,068 85,288 56,678 28,103 89,715
(Ordinary Income) △ 3,235 △ 2,878 4,592 5,276 5,647 △ 1,817 753 7,065 4,893 △ 6,304 △ 2,260 1,777 5,182 1,045 1,719 1,181 △ 588 988 9,827 6,949 10,258 8,233 11,133 21,582 7,115 16,434 49,670 86,873 57,849 31,941 88,422
(Net Income) 70 132 20 2,006 2,138 2,903 1,362 3,279 △ 1,346 △ 6,953 △ 6,019 △ 2,009 3,044 3,224 3,615 △ 1,280 △ 2,457 53 1,593 1,811 2,244 3,015 4,042 4,532 2,786 6,535 24,452 49,012 38,820 25,250 58,938
(Total Assets) 217,005 229,570 230,649 243,858 288,104 323,523 331,220 327,856 328,925 332,692 316,538 303,906 301,968 310,498 317,388 300,579 279,380 253,502 245,896 255,032 258,367 241,432 242,278 241,295 259,200 269,140 329,965 376,344 481,541 518,500 541,450
Dividened/share (yen) 0.0 0.0 0.0 4.0 4.0 4.0 0.0 0.0 0.0 0.0 0.0 0.0 0.0 0.0 0.0 0.0 0.0 0.0 0.0 0.0 3.0 3.0 4.0 5.0 3.0 5.0 10.0 16.5 18.0 18.0 26.0
*1: Basically those figures are quoted from annual security report ('Yuka Shoken Hokokuisho'), which is mentioned by the million, and figures are rounded to the nearest million till 122nd, and rounded down, thereafter.
*2: Dividend for the year Ended in '08 Mar. has not been realized.
Non-Consolidated
Net Income
Total Operating Revenues
Operating Income
Total Cost of Sales
Ordinary Income
Total Non-operating Income
Total Non-operating Expenses
Selling, General and AdministrativeExpenses
The RatioofConsolidated toNon-Consolidated
Equity in Earnings of Affiliates
Minority Shareholders' Interests (△=Plus)
Shareholders' Equity ('Net Assets'from the Year Ended in '07 Mar.)
Ordinary Income on OperatnigRevenues
Foreign Currency ExchangeAdjustaments (△=Plus)Equity in Earnings of Affiliates('+'=Plus)
Minority Shareholder Income/Loss(△=Plus)
33

9. "K"Line Overview <9-1. Corporate Governance System>
Chart: "K"Line Corporate Governance System
◎ Countermeasures Against Corporate Takeover ◎
By approval of the Company's shareholders at the AnnualGeneral Meeting of Shareholders held in June 2006, it wasdecided to draw up a strategy to protect the Company from ahostile takeover.
We laid down rules to govern the conditions under which large-scale purchases of the company's shares may be made andthese rules will also stipulate the provision to the company'sshareholders of adequate background information and time, andfurthermore, in the event that the regulations are not observed,and/or in the event that it is clear that the proposed purchasewould be harmful to the common interests of the Company'sshareholders, the rule may enable us to ensure the feasibility oftaking appropriate measures with the aim of saving the interestsof the Company's shareholders.
34
CSR & ComplianceDivision

9-2. Safety Navigation
← Operating Simulator
Engine →
Simulator
"K" LINE is aggressively grappling with safety issues throughout the Company, focusing with highest priority on the workplace as the frontline. Essentially, this provides thegroundwork for all our business activities in our effort to perform ship operations and cargo handling with utmost and total safety. Education/training will substantially contribute agreat deal toward perfection in this most fundamental work. From this perspective, the subject of ongoing education/training for crewmembers is also being taken up here.
"K" LINE has taken the following steps: formation of a Ship Safety Promotion Committee in 1984 to ensure safenavigation for the entire fleet, including chartered vessels; establishment of a Standing Committee that includes shipmanagement companies; detailed ship safety measures based on analyses of marine accident data; inspections of itsentire fleet by ship safety inspectors/auditors; and a campaign for Zero Accidents.
"K" LINE’s main direction is protecting safety of humans, ships and cargo, and contributing to protection of ourearthly environment. Our Safety Management System’s activities are composed of:–making a comprehensive manual of all procedures for safety and protection of marine environment;–distributing the standard and unified manual and documented instructions to all people concerned as well as crewsfor achieving perfection in practicing their day-to-day duties;–making it a rule to record how practice is carried out along the lines of the manual and amending it if anythingproves to be unpractical.This manual system is what makes it happen-assuring that all people concerned are at the same level of knowledgeand information. Every action is arranged to be integrated and produce synergetic power for safety. What is more,filing all information or records in a manual helps increase accountability and transparency to any interested outsiderssuch as our valued customers.
We understand that the set-up and steady development of an across-the-company Emergency Response Systemwill lead and bring together all people concerned on shore and sea and related group personnel to effectively copewith whatever emergency that may be related to vessels, human lives and environment. It will also help raiseawareness of the necessity for education and training as preparation for emergency response.If and when a marine pollution incident occurs due to an oil leak from a ship, an injury or death at sea, a seriousmarine calamity such as collision, fire, stranding, grounding or sinking, Management shall set up an EmergencyResponse Team, ordering staff concerned in accordance with the "Company Emergency Procedures" and takeadequate measures to prevent further expansion of damage. Subject to the size and degree of an accident, anEmergency Response Headquarters shall be set up with the president or a director designated by the president asthe commander, and all necessary measures shall be taken for the earliest settlement of any such accident andexecuted by making the best of functionality that the Company provides.Getting top management, assigned staff and operated vessels involved, the Company periodically carries out so-called "Table Top Drill" designed to identify and improve response emergency procedures for safe operation,environmental protection and information disclosure.
Work is shared and performed by crews of different countries, such as the Philippines, India, Bangladesh, etc.,including Japan. Not only knowledge and skills but also "K" LINE safety policy must be commonly shared with eachother for the best possible fulfillment of everyone's assignment.
“K” LINE Vision 100 advocates “Synergy for All and Sustainable Growth” as its main theme and we set up “Stableand safe ship operation administration structure”to achieve the theme. We established ""K" Line Safety Standard",our safe management system, which is built on our own know-how and global safety standards, to ensure safenavigation and improving ship quality for whole our operating fleet by enhancing "KL Quality" and strengthening onboard inspection scheme. Moreover, in order to promote sharing of safety information in all groups, we try toreinforce safety management system and strongthen shore-base back-up structure including establishent of "KLSafety Network", etc. We enhance better ship management system by expansion of overseas bases of in-house shipmanagement companies, pomoting efficient ship management which specializes specific types of ship, and maintinningship's quality with high quality seafarer and experienced ship superintendents. Furthermore, we try to develop andensure high-level marine technicians by strongthening recruiting system at overseas sources, improvement ofsoftware of "K"Line Maritima Academy, upgrading crew training system, and providing more attractive workplaces,etc., to achieve “Stable and safe ship operation administration structure.”
SKILL: Technical capabilities acquired fromexperience
PROFESSIONALISM: Professional dedication withthorough knowledge about each vessel
INTELLIGENCE: Intelligence that contributes toimproving society worldwide
RESPONSIBILITY:Strong feeling of personalresponsibility
INNOVATION:Innovate through new technology
TEAMWORK: Teamwork for achieving each target
35
Safety Navigation
No.1Quality
Enhancing Safety-management Systems(Maintaining safeopertion throughoutthe entire fleet,including chartervessels)
Enhancing Ship-management Structure(Global development ofGroup ship-managementcompanies and improvingtheir competitiveabilities, and securingrepair docks)
Hiring andtraining marinetechnicalpersonnel(on a global scale)
「KL Safety Standard」&「KL Quality」
Opening Ceremony of "K"Line Maritime Academy in Philippins↑ Philippine President Gloria Arroyo and President Maekawa
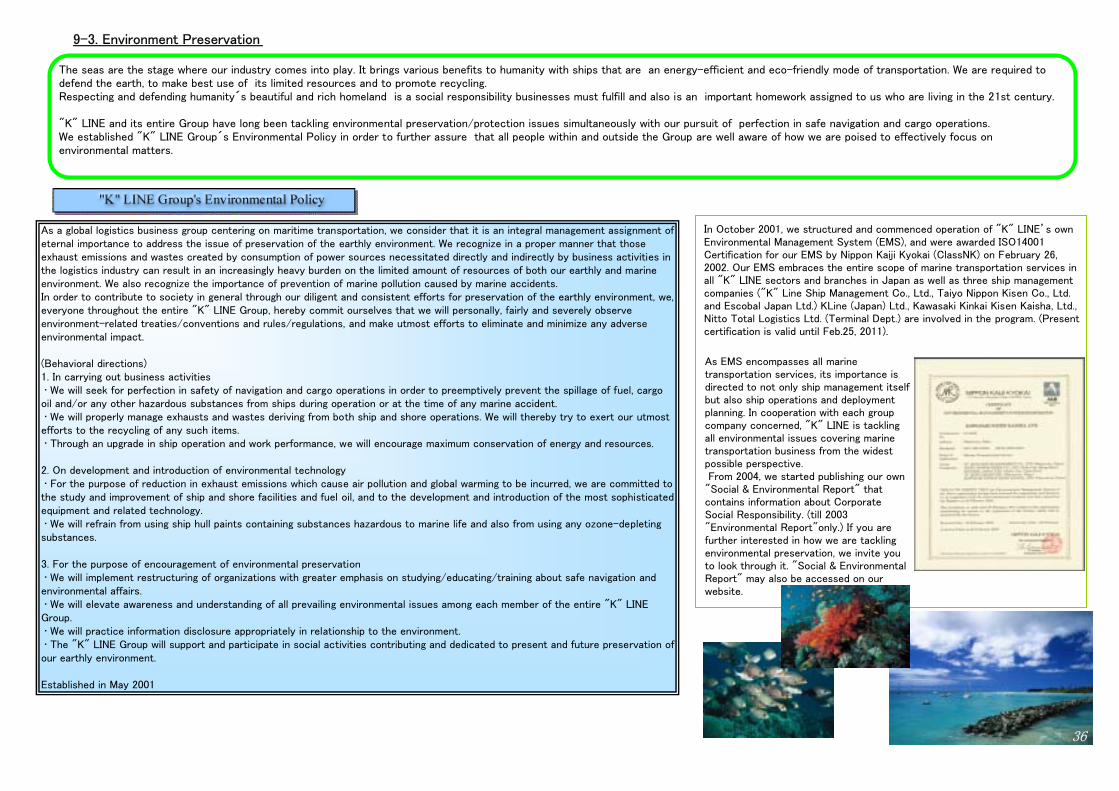
9-3. Environment Preservation
The seas are the stage where our industry comes into play. It brings various benefits to humanity with ships that are an energy-efficient and eco-friendly mode of transportation. We are required todefend the earth, to make best use of its limited resources and to promote recycling.Respecting and defending humanity´s beautiful and rich homeland is a social responsibility businesses must fulfill and also is an important homework assigned to us who are living in the 21st century. "K" LINE and its entire Group have long been tackling environmental preservation/protection issues simultaneously with our pursuit of perfection in safe navigation and cargo operations.We established "K" LINE Group´s Environmental Policy in order to further assure that all people within and outside the Group are well aware of how we are poised to effectively focus onenvironmental matters.
In October 2001, we structured and commenced operation of "K" LINE’s ownEnvironmental Management System (EMS), and were awarded ISO14001Certification for our EMS by Nippon Kaiji Kyokai (ClassNK) on February 26,2002. Our EMS embraces the entire scope of marine transportation services inall "K" LINE sectors and branches in Japan as well as three ship managementcompanies ("K" Line Ship Management Co., Ltd., Taiyo Nippon Kisen Co., Ltd.and Escobal Japan Ltd.) KLine (Japan) Ltd., Kawasaki Kinkai Kisen Kaisha, Ltd.,Nitto Total Logistics Ltd. (Terminal Dept.) are involved in the program. (Presentcertification is valid until Feb.25, 2011).
As EMS encompasses all marinetransportation services, its importance isdirected to not only ship management itselfbut also ship operations and deploymentplanning. In cooperation with each groupcompany concerned, "K" LINE is tacklingall environmental issues covering marinetransportation business from the widestpossible perspective. From 2004, we started publishing our own"Social & Environmental Report" thatcontains information about CorporateSocial Responsibility. (till 2003"Environmental Report"only.) If you arefurther interested in how we are tacklingenvironmental preservation, we invite youto look through it. "Social & EnvironmentalReport" may also be accessed on ourwebsite.
36
As a global logistics business group centering on maritime transportation, we consider that it is an integral management assignment ofeternal importance to address the issue of preservation of the earthly environment. We recognize in a proper manner that thoseexhaust emissions and wastes created by consumption of power sources necessitated directly and indirectly by business activities inthe logistics industry can result in an increasingly heavy burden on the limited amount of resources of both our earthly and marineenvironment. We also recognize the importance of prevention of marine pollution caused by marine accidents.In order to contribute to society in general through our diligent and consistent efforts for preservation of the earthly environment, we,everyone throughout the entire "K" LINE Group, hereby commit ourselves that we will personally, fairly and severely observeenvironment-related treaties/conventions and rules/regulations, and make utmost efforts to eliminate and minimize any adverseenvironmental impact.
(Behavioral directions)1. In carrying out business activities • We will seek for perfection in safety of navigation and cargo operations in order to preemptively prevent the spillage of fuel, cargooil and/or any other hazardous substances from ships during operation or at the time of any marine accident. • We will properly manage exhausts and wastes deriving from both ship and shore operations. We will thereby try to exert our utmostefforts to the recycling of any such items. • Through an upgrade in ship operation and work performance, we will encourage maximum conservation of energy and resources. 2. On development and introduction of environmental technology • For the purpose of reduction in exhaust emissions which cause air pollution and global warming to be incurred, we are committed tothe study and improvement of ship and shore facilities and fuel oil, and to the development and introduction of the most sophisticatedequipment and related technology. • We will refrain from using ship hull paints containing substances hazardous to marine life and also from using any ozone-depletingsubstances. 3. For the purpose of encouragement of environmental preservation • We will implement restructuring of organizations with greater emphasis on studying/educating/training about safe navigation andenvironmental affairs. • We will elevate awareness and understanding of all prevailing environmental issues among each member of the entire "K" LINEGroup. • We will practice information disclosure appropriately in relationship to the environment. • The "K" LINE Group will support and participate in social activities contributing and dedicated to present and future preservation ofour earthly environment. Established in May 2001

9-4. Brief History
Line of Presidents in "K"Line and Brief History
CompanyName President AD
JapaneseCalender History
(Kawasaki Dockyard)Shozo Kawsaki 1837 Tenpo 8 Born in Kagoshima (ex. Kawasaki 1853 Kaei 6 Started trading business in Nagasaki Heavy 1878 Meiji 11 Established Kawasaki Tsukiji Shipyard in Tsukiji, Tokyo Industries) 1881 14 Established Kawasaki Hyogo Shipyard in Hyogo
1896 29 Incorporated Kawasaki Dockyard Co., Ltd.1904 37 Started marine trasportation business, under name of KAWASAKI Marine
Freight Department.Kawasaki Kisen Kaisha Ltd.
1 Yoshitaro Kawasaki 1919 Taisho 8 Official registration of 'Kawasaki Kisen Kaisha, Ltd.', started business with the name
2 Kojiro Matsukata 1920 91921 10 'Kawasaki Kisen', tying up 'Kawasaki Marine Freight Department', and
("K"Line) 'Kokusai Kisen' formed "K"LINE.1927 Showa 2 'Kokusai Kisen' disengaged from "K"LINE
3 Fusajiro Kashima 1928 34 Hachisaburo Hirao 1933 8
9 'Kawasaki Marine Freight Department' liquidated.'Kawasaki Kisen' became the only operator for "K"LINE.
5 Masasuke Itani 1935 106 Koichi Kimishima 1946 21
1948 23 Succeeded refloatation of KIYOKAWA MARU, sunk during the war.7 Motozo Hattori 1950 25
1951 26 Japan/Bangkok liner service inauguated.1953 28 Started independent oil transport service (with vessel 'Andrew Dillon')1960 35 Iron ore carrier "FUKUKAWA MARU" is completed.1964 39 Japanese shipping industry consolidated into six groups. "K"Line merged with Iino Kisen
1968 43 "K"Line's 1st full-container ship "GOLDEN GATE BRIDGE"delivered."TOYOTA MARU NO.1"('Car Bulker')delivered
8 Mamoru Adachi 1970 45 "TOYOTA MARU NO.10", the first Pure Car Carrier in Japan delivered9 Kosuke Okada 1976 51
10 Kiyoshi Kumagai 1980 551983 58 "BISHU MARU", the first LNG carrier in Japan completed
11 Kiyoshi Ito 1985 6012 Hiroshige Matsunari 1988 63 "Manhattan Bridge"started service with 11crew as the first Japanese 'pioneership'.
13 Shiro Nagumo 1992 Heisei 41993 5 "K"Line Reengineering Program (K.R. Program) launched.
14 Isao Shintani 1994 61996 8 "K" Line Re-engineering Phase II (K.R. PHASEⅡ) started1998 10 A 5-year management plan, New"K"Line Spirit for 21 (New K-21) established
Resumption of dividend for the first time in 15 years15 Yasuhide Sakinaga 2000 12
2002 14 A 3-year management plan "KV-Plan" formulated.2004 16 New management plan "K"LINE Vision 2008 adopted
16 Hiroyuki Maekawa 2005 17
2006 18 Newly developed management plan "K"LINE Vision 2008+ started
2008 20 Newly developed management plan "K"LINE Vision 100 started
(1)Kawasaki Kisen inauguration Aim to one of the major international shipping companies along with NYK and MOL using stock boats prepared
originally for extra demand by World War I.
(2)“K” LINE formed Operation in the same flag, funnel mark, and trade name
(3) KIYOKAWA MARU Our symbol of recovery from World War Ⅱ; reflotation of KIYOKAWA MARU
(4) Shipping industry consolidation Depression after boom in shipping by Korean War and closure of the Suez Canal - measures to strengthen
shipping industry by the Japanese government
37
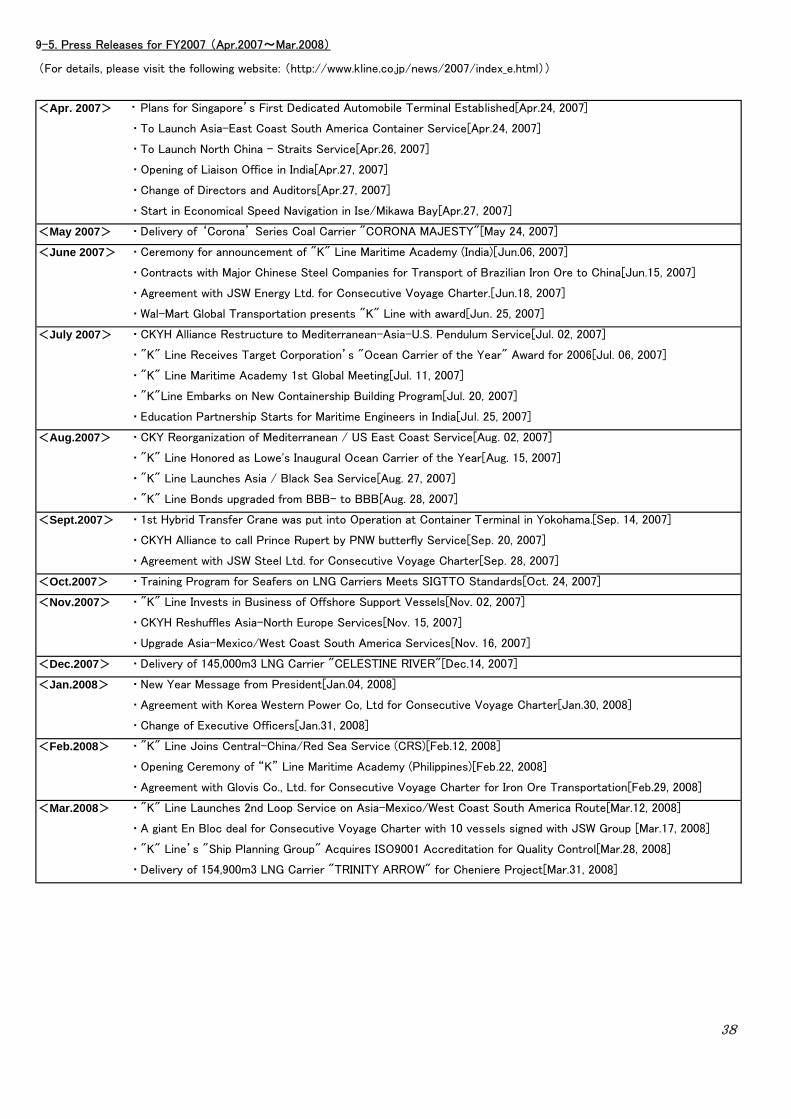
9-5. Press Releases for FY2007 (Apr.2007~Mar.2008)
(For details, please visit the following website: (http://www.kline.co.jp/news/2007/index_e.html))
・ Plans for Singapore’s First Dedicated Automobile Terminal Established[Apr.24, 2007]
・To Launch Asia-East Coast South America Container Service[Apr.24, 2007]
・To Launch North China - Straits Service[Apr.26, 2007]
・Opening of Liaison Office in India[Apr.27, 2007]
・Change of Directors and Auditors[Apr.27, 2007]
・Start in Economical Speed Navigation in Ise/Mikawa Bay[Apr.27, 2007]
<May 2007> ・Delivery of ‘Corona’ Series Coal Carrier "CORONA MAJESTY"[May 24, 2007]
<June 2007> ・Ceremony for announcement of "K" Line Maritime Academy (India)[Jun.06, 2007]
・Contracts with Major Chinese Steel Companies for Transport of Brazilian Iron Ore to China[Jun.15, 2007]
・Agreement with JSW Energy Ltd. for Consecutive Voyage Charter.[Jun.18, 2007]
・Wal-Mart Global Transportation presents "K" Line with award[Jun. 25, 2007]
<July 2007> ・CKYH Alliance Restructure to Mediterranean-Asia-U.S. Pendulum Service[Jul. 02, 2007]
・"K" Line Receives Target Corporation’s "Ocean Carrier of the Year" Award for 2006[Jul. 06, 2007]
・"K" Line Maritime Academy 1st Global Meeting[Jul. 11, 2007]
・"K"Line Embarks on New Containership Building Program[Jul. 20, 2007]
・Education Partnership Starts for Maritime Engineers in India[Jul. 25, 2007]
<Aug.2007> ・CKY Reorganization of Mediterranean / US East Coast Service[Aug. 02, 2007]
・"K" Line Honored as Lowe's Inaugural Ocean Carrier of the Year[Aug. 15, 2007]
・"K" Line Launches Asia / Black Sea Service[Aug. 27, 2007]
・"K" Line Bonds upgraded from BBB- to BBB[Aug. 28, 2007]
<Sept.2007> ・1st Hybrid Transfer Crane was put into Operation at Container Terminal in Yokohama.[Sep. 14, 2007]
・CKYH Alliance to call Prince Rupert by PNW butterfly Service[Sep. 20, 2007]
・Agreement with JSW Steel Ltd. for Consecutive Voyage Charter[Sep. 28, 2007]
<Oct.2007> ・Training Program for Seafers on LNG Carriers Meets SIGTTO Standards[Oct. 24, 2007]
<Nov.2007> ・"K" Line Invests in Business of Offshore Support Vessels[Nov. 02, 2007]
・CKYH Reshuffles Asia-North Europe Services[Nov. 15, 2007]
・Upgrade Asia-Mexico/West Coast South America Services[Nov. 16, 2007]
<Dec.2007> ・Delivery of 145,000m3 LNG Carrier "CELESTINE RIVER"[Dec.14, 2007]
<Jan.2008> ・New Year Message from President[Jan.04, 2008]
・Agreement with Korea Western Power Co, Ltd for Consecutive Voyage Charter[Jan.30, 2008]
・Change of Executive Officers[Jan.31, 2008]
<Feb.2008> ・"K" Line Joins Central-China/Red Sea Service (CRS)[Feb.12, 2008]
・Opening Ceremony of “K” Line Maritime Academy (Philippines)[Feb.22, 2008]
・Agreement with Glovis Co., Ltd. for Consecutive Voyage Charter for Iron Ore Transportation[Feb.29, 2008]
<Mar.2008> ・"K" Line Launches 2nd Loop Service on Asia-Mexico/West Coast South America Route[Mar.12, 2008]
・A giant En Bloc deal for Consecutive Voyage Charter with 10 vessels signed with JSW Group [Mar.17, 2008]
・"K" Line’s "Ship Planning Group" Acquires ISO9001 Accreditation for Quality Control[Mar.28, 2008]
・Delivery of 154,900m3 LNG Carrier "TRINITY ARROW" for Cheniere Project[Mar.31, 2008]
<Apr. 2007>
38

9-6. Certification by Third-party Organization and Information on Convertible Bonds
Certification by Third-party Organization on CSR /Environment
Rating Information (for Long-term Bonds)
R&I JCR S&P2003 2004 2005 2006 2007 2008 2003 2004 2005 2006 2007 2008 2003 2004 2005 2006 2007 2008
BBB+ A- A- A- A- A A- A A A A A BB+ BB+ BBB- BBB- BBB BBB
Issued Convertible Bond Information
Maturity Date
22 March 20114 April 2013
Conversion Price
700yen/share
851yen/share
Date of Issue Issued Amount Coupon
zero-coupon22 March 2004
4 April 2005
30 bil. Yen
30 bil. Yen zero-coupon
Environmental Management System ISO14001 Scope of Application : Marine Transportation Services *Awarded in Feb.26 2002(valid for Feb. 25 2011)
Quality Management System ISO9001 (Car Carrier) Scope of Application : Car Carrier Marine Transportation Service andDesign/Development of Motor Vehicle, Heavy Duty Vehicle and Other Self-conveyable Machine *Awarded in Nov.29 1999 (valid for Nov.28, 2008)
FTSE4 Good Index Series
FTSE(joint venture between The Financial Times and London Stock Exchange),
a UK based famous global index company, has included our company for their SRI
(Socially Responsible Investment) index FTSE4 Good Index series since Mar 2003.
39
Quality Management System ISO9001 (Ship Planning Group,"K" Line Ship Management Co.Ltd. New Building roup)Scope of Application : Planning, Development and Determination Business ofSpecification for New Shipbuilding, Approval Business of Plan and Drawings,
Supervision Business in Shipyard *Awarded in Mar.13 2008 (valid for Mar.13 2011)

9-7. Corporate principles, Charter of conduct, etc.
"K" LINE established its Corporate Principles and Vision, which promises the formation of a stable business
base for the "K"LINE Group, in the management plan that was initiated from April 2004.
The basic principles of the "K" LINE Group as a shipping business organization centering on shipping lie in: a.) Diligent efforts for safety in navigation and cargo operations as well as for environmental preservation:
c.) Contributing to the world’s economic growth and stability through continual upgrading of service quality.
1 To be trusted and supported by customers in all corners of the world while being able to continue to growglobally with sustainability,
2 To build a business base that will be capable of responding to any and all changes in businesscircumstances, and to continually pursue and practice innovation for survival in the global market,
3 To create and provide a workplace where each and every employee can have hopes and aspirations forthe future, and can express creativity and display a challenging spirit.
Charter of Conduct : "K" Line Group Companies
by "Charter of Conduct" spelled out below:
1 Human rights
members and improve work safety and conditions to offer them comfort and affluence.
2 Compliance to the Principles of Corporate Ethics
and conduct its corporate activities through fair, transparent and free competition.
3. Trustworthy company group
from the community by providing safe and beneficial services
4. Environmental efforts The "K" Line Group recognize that global enviromental efforts are a key issue for all of humanity and that they are essential both
in business activities and existence of the company and therefore we are committed to a coluntary and proactive approach
to such issues to protect and preserve the environment.
5 Disclosure of corporate information and communication with society
and appropriately, widely promoting bidirectional communication with society including shareholders.
6 Contribution to society
The "K" Line Group as a Good Corporate Citizen will make ongoing efforts to contribute to social development and improvement
and support employee’s voluntary participation in such activities.
7. Harmony in the international society
The "K" Line Group will contribute to development of international society in pursuance of its business pertaining to international
logistics and related businesses, respecting each country’s culture and customs.
8. Confront anti-social forces
(⇒http://www.kline.co.jp/csr/Guideline.pdf)
Additionally, such management will expeditiously and accurately release information and fulfill their accountability to society.
In the event of any incidents in breach of this Charter, the management of the respective "K" Line Group member company will demonstrate
This Charter of Conduct is accompanied by "Implementation Guidance for Charter of Conduct", which we have posted in our HP.
b.) Sincere response to customer needs by making every possible effort; and
The management of each "K" Line Group Company recognizes that it is their role to realize the spirit of the Charter and to set the pace
that is to be followed by every employee in their company as well as by business partners.
decisiveness to resolve the problem(s), conduct a thorough investigation to determine the cause and to take preventative measures.
The "K" Line Group will protect personal information, properly manage corporate information and disclose corporate information timely
The "K" Line Group will resolutely confront anti-social forces or organizations which may threaten social order and public safety.
The "K" Line Group will consistently respect human rights and well consider personality, individuality and diversity of its corporate
The "K" Line Group promises to comply with applicable laws, ordinances, rules and spirit of the international community
"K" Line Group continues to pay special attention to safety in navigation, achieving customer satisfaction and garnering trust
Kawasaki Kisen Kaisha, Ltd. and it’s group companies (hereinafter "K" Line Group) reemphasize that due respect forhuman rights and compliance with applicable laws, ordinances, rules are the fundamental foundations for corporateactivities and that group companies’growth must be in harmony with society and therefore we herein declare to abide
40

【Contact Information】KAWASAKI KISEN KAISHA, LTD. IR&PR Group
Hibiya Central Bldg., 2-9, Nishi-Shinbashi 1-chome, Minato-ku, TOKYO 105-8421, JAPANE-Mail: [email protected]. (+81)-(0)3-3595-5063Fax. (+81)-(0)3-3595-5001
Home Page: http://www.kline.co.jp/
President Message => http://www.kline.co.jp/ir/index_e.htmlAbout "K"Line & its group => http://www.kline.co.jp/corp/index_e.html
Financial Highlights => http://www.kline.co.jp/ir/financial_e.htmlAnnual Report => http://www.kline.co.jp/ir/annual_e.htmlSocial & Environmental Report => http://www.kline.co.jp/csr/report_e.htm
Investor Meeting => http://www.kline.co.jp/ir/info_e.html(PPT, Streaming, etc.)
Management Plan => http://www.kline.co.jp/ir/plan_e.html(PPT, Streaming, etc.) => http://www.irwebcasting.com/080514/15/3f094726d4/index.html
Business => http://www.kline.co.jp/biz/container/index_e.html(inc. Fleet List)
Mailing List Registration => https://www.kline.co.jp/qa/qa_e.asp(Press Release etc.)