aop presentation guidance
TRANSCRIPT

Investor PresentationNOVEMBER 2021
1

This presentation contains forward-looking statements, including, in particular, statements about Interface’s plans, strategies and prospects. These are based
on the Company’s current assumptions, expectations and projections about future events.
Although Interface believes that the expectations reflected in these forward-looking statements are reasonable, the Company can give no assurance that these
expectations will prove to be correct or that savings or other benefits anticipated in the forward-looking statements will be achieved. The forward-looking
statements set forth involve a number of risks and uncertainties that could cause actual results to differ materially from any such statement, including risks and
uncertainties associated with the ongoing COVID-19 pandemic, including interruptions to our manufacturing operations and reduced demand for our products,
and economic conditions in the commercial interiors industry. Additional risks and uncertainties that may cause actual results to differ materially from those
predicted in forward-looking statements also include, but are not limited to the risks under the heading “Risk Factors” in the Company's Annual Report on Form
10-K for the fiscal year ended January 3, 2021, which discussions are hereby incorporated by reference. You should also consider any additional or updated
information we include under the heading “Risk Factors” in our subsequent annual and quarterly reports.
Forward-looking statements in this presentation include, without limitation, the information set forth on the slides titled “Investment Thesis”, “Interface is a
Purpose-Driven Organization,” “Opportunities for Growth” and “Brand Leader in the Specified Channel”, and the section of this presentation titled “Growth and
Value Creation”. Other forward-looking statements can be identified by words such as “may,” “expect,” “forecast,” “anticipate,” “intend,” “plan,” “believe,”
“could,” “should”, “goal”, “aim”, “objective”, “seek,” “project,” “estimate,” “target,” and similar expressions. Forward-looking statements speak only as of the date
made. The Company assumes no responsibility to update or revise forward-looking statements and cautions listeners and meeting attendees not to place
undue reliance on any such statements.
This presentation includes certain financial measures not calculated in accordance with U.S. GAAP. They may be different from similarly titled non-GAAP
measures used by other companies, and should not be used as a substitute for, or considered superior to, GAAP measures. Reconciliations to the most
directly comparable GAAP measures appear in the Appendix.
2
Forward Looking Statements and Non-GAAP Measures

47%53%53%33%
14%
Interface is a Leader in Commercial Flooring
• Headquartered in Atlanta, GA
• 7 manufacturing locations on 4 continents
• 3,700 global employees
• Sales in over 100 countries
• Over 1,000 Sales & Marketing professionals
• Invented Modular Carpet Tile
• Global Sustainability Leader
• All products are Carbon NeutralAmericasEMEA
APAC
Corporate
OfficeNon-Office
* See Appendix for a reconciliation of Non-GAAP figures
Note: Geographic and Segment breakdown figures represent LTM as of Q3 2021; may not sum to 100% due to rounding
REVENUE BY REGION REVENUE BY SEGMENT
3
Interface at a Glance
($ in millions, except EPS) LTM
Q3 2021
Net Sales $1,138
Adj Operating Income* $107
Adj EPS (Diluted)* $1.03
Net Debt* $432
Adj EBITDA* $154
Net Debt / Adj EBITDA* 2.8x

Investment Thesis
• Strong commercial brands that lead in growth areas of the industry
• Share leader in a $39 billion global commercial flooring category:
• Leading share in carpet tile and rubber
• Growing share in LVT
• Strong growth execution and positioned for future growth:
• Selling system transformation is increasing salesforce productivity
and delivering results
• Segmentation strategy is further expanding opportunity in healthcare,
education, hospitality, and life sciences
• Geographic diversification is leveraging global account growth
opportunities
• Cross-selling opportunities are expanding across the Interface, nora
and FLOR brands
• Recognized design leader in commercial flooring
• Robust innovation pipeline
• Carbon Neutral Floors
• First carbon negative carpet tile (measured cradle-to-gate)
• Advanced tufting technology
• Manufacturing efficiencies
• Attractive gross profit margins
• Global footprint with manufacturing on four continents to
service local and global customers
• Strong liquidity and healthy balance sheet
4

Who We Are
Leading
global provider
of commercial
flooring: Carpet Tile,
Modular Area Rugs,
LVT, Rubber
Strong brands
with a history
of innovation and
a commitment to
sustainability
Engaged
customer-centric
culture focused on
performance and
galvanized around
our sustainability
mission
Strong global sales
& marketing
capabilities
Innovation and
Design Leader in
modular carpet
Design and Innovation Leader Focused on Solving Customer Problems Across Multiple Segments
Global
sales &
manufacturing
footprint with
industry-leading
gross margins
5

Interface is a Purpose-Driven Organization
Our Core Mission is to Lead a World-Changing Sustainability MovementCentered Around Climate Take Back
While Also Executing on Five Strategic Pillars to Drive the Business
6
Grow our
Commercial
Business
Expand our
Living Space
Business
Drive
Supply Chain
Excellence
Leverage SG&A
Resources
Develop and
Maximize our
ESG Leadership

Opportunities for Growth
7
Consumer
Presence via
FLOR
Product
Innovation
Continued Growth
in Resilient
Services as a
Differentiator
Broadloom
Conversion
Across Segments
Enhanced Share
of Dealer
Discretionary

Interface Positioning
8

Carpet Tile
• Industry-leading cradle-to-gate carbon negative carpet tile
• Biomimicry-inspired random design (i2)
• High recycled content
• No glue installation (TacTiles®)
• Faster, more profitable installation for contractors
• Easily recycled (ReEntry® program)
• Carbon neutral (Carbon Neutral Floors™)
Luxury Vinyl Tile (LVT)
• Creative design freedom
• Complements and enhances our carpet tile portfolio
• No transition strips needed; same sizes as our carpet tiles
• High acoustic value (Sound Choice™ backing)
• Carbon neutral (Carbon Neutral Floors™)
Rubber
• norament® - modular rubber tiles
• noraplan® - sheet rubber
• Ideal for hygienic, safe flooring applications
• Extremely durable with strong chemical resistance
• Carbon neutral (Carbon Neutral Floors™)
Attractive Product Portfolio
9
Interface Positioning

Leading Global Provider of Commercial Flooring Solutions
• Interface participates in the $39 Billion Global Commercial Flooring segment
• We are the global share leader in the $5.0 Billion Carpet Tile segment which now exceeds the value of Broadloom globally
• We entered the high growth $3.3 Billion LVT segment in 2017
• We entered the $1.0 Billion Rubber flooring segment with our acquisition of nora, the category leader
• Our served market has expanded from ~$4.2 Billion a couple of years ago to over $9.0 Billion today
Source: Management estimates
$11.7 $7.4
$1.9
$1.0
$3.4
$3.3 $5.0 $4.7
Rubber
Other
Global Commercial Flooring Segment (in Billions)
10
Interface Positioning

Participating in Attractive Commercial Flooring Segments
11
Wood
Laminate
LVT
Other Resilient
Ceramic Tile
Carpet Tile
Rubber
Broadloom
(4%)
(2%)
0%
2%
4%
6%
8%
10%
12%
14%
0% 5% 10% 15% 20% 25% 30% 35% 40% 45% 50%
Estim
ate
d C
AG
R thro
ug
h 2
02
4
Gross Margin
Bubble size = Global commercial value of category, 2019
Interface Positioning
Source: Management estimates
• Interface serves growing segments of hard and soft surface with the highest margins
Global Commercial Flooring: Segment Size vs. Forecasted Growth and Gross Margin

Brand Leader in the Specified Channel
12
Interface Positioning
Source: Management estimates
• Interface competes on design, sustainability and innovation, commanding a premium price point and industry leading margins
• Interface is the share leader in the specified and end user channels of commercial carpet tile which are highly influenced by
Architects & Designers
Global Carpet Tile Price Categories
-
20
40
60
80
100
120
Low End Mid-Range High End
Vo
lum
e (
sq
ua
re m
ete
rs i
n m
illio
ns)
Interface Share <15% ~15-25% +25%
Interface maintains significant
share of the high-end and mid-
range price points
There is opportunity to expand in
low/mid-range price points

Global Sales and Manufacturing Platform
• Sales & marketing offices in over 70
locations across 28 countries
• Global account management
• Seven manufacturing locations on four
continents
• Global supply chain management
• Unique blend of efficiency and
customization
Note: Figures represent LTM Q3 2021, may not sum to 100% due to rounding
AMERICAS
53%of Net Sales
EMEA
33%of Net Sales
ASIA-PACIFC
14% of Net Sales
Carpet Manufacturing Facility
Rubber Manufacturing Facility
LVT Supplier Facility
Showroom
13
Interface Positioning

Corporate Office47%
Education17%
Healthcare10%
Government7%
Retail5%
Residential/Living3%
Consumer/Residential
3%
Hospitality2%
Other6%
Diversified Customer Verticals CORPORATE OFFICE• Highest penetration of carpet tile vs broadloom
• Global account management
• Recurring renovations
• Ongoing opportunity in Emerging Markets
EDUCATION• K-12 and higher education
• Second highest penetration of carpet tile vs broadloom
• Second largest market for rubber
• Significant opportunity for broadloom conversion
HOSPITALITY• Guest rooms, corridors and public spaces
• Named the brand standard or alternate at Hilton, Marriott,
IHG and Choice Hotels properties
• Significant opportunity for broadloom conversion
RETAIL• Retail and bank branches
• Significant opportunity for broadloom conversion
• High penetration of LVT
Note: Figures represent LTM Q3 2021 for Interface and nora combined,
figures in chart may not sum to 100% due to rounding
HEALTHCARE• Hospitals, Medical Office Building, Assisted Living, Senior
Living and Life Sciences
• Largest rubber market based on hygienic properties,
chemical resistance, and durability
• Significant opportunity for broadloom conversion
REVENUE BY VERTICAL
14
Interface Positioning

Growth and Value Creation
15

Interface is a Purpose-Driven Organization
Our Core Mission is to Lead a World-Changing Sustainability MovementCentered Around Climate Take Back
While Also Executing on Five Strategic Pillars to Drive the Business
16
Grow our
Commercial
Business
Expand our
Living Space
Business
Drive
Supply Chain
Excellence
Leverage SG&A
Resources
Develop and
Maximize our
ESG Leadership
Growth and Value Creation

• Enhance salesforce productivity – Capitalize on selling system transformation
• Elevate and grow segments – Drive growth in priority segments including Corporate Office, Hospitality, Living and Education
• Optimize product portfolio – Expand our portfolio to increase the addressable market, participating in lower price points
• Lead the market in design and innovation –introduce new products that energize and inspire
• Introduce first cradle-to-gate carbon negative carpet tile to meet increasing customer demand – launched in Q4 2020
• Expanding global account presence
• Continue to develop brand loyalty, by maintaining the strongest Net Promoter Score among A&D and End Users
Growth and Value Creation
Grow the Core Carpet Tile Business
17

Architect & Designer Specifier
• Virtually endless styling choices
• Truly custom – design by tile
• No transition strips required
• Better sustainability
Dealer/Installer
• Easier materials access into the building
• Easier to handle and install
• Less waste at end of job
• One trade union for multiple flooring types
End User
• Lower total cost of ownership
• Less site down time
• Virtually endless styling choices
• Selective replacement extends life
• Can inset rugs within LVT – no doubling up
Benefits of Modular Carpet Tile Driving Share Gains vs. Broadloom
18
Growth and Value Creation
The value of commercial carpet tile and broadloom soft flooring is ~$10B globally. Ongoing conversion of broadloom represents a $4.7B market opportunity for carpet tile.

• Continue taking share in the high growth commercial LVT
segment
• Maximize cross-selling opportunities between nora® rubber
flooring, LVT and carpet tile
• Expand LVT offering in education and healthcare market with
specialized 3mm product
• Expand global participation
• Strategically expand product portfolio with a robust innovation
pipeline – Vinyl Sheet
• Provide carbon neutral products to meet increasing customer
demand while committing to reduce the carbon footprint of
LVT and rubber products
Growth and Value Creation
Continue Building a Resilient Flooring
Business
19

Modular Flooring & Social Distancing
• Architects and Designers (A&D) are re-thinking space layouts and interior design
elements as the world contemplates the return to work and school
• Interface modular flooring plays an integral part in design solutions that:
• Control occupant flow and traffic
• Create zones and enable separation
• Provide a sense of safety & security
• …all while providing for an aesthetically appealing environment
Zoning & Wayfinding
• By using modular shapes and dimensions, carpet tile, LVT and rubber can create
clear and graphic zoning and traffic direction for buildings
• Examples include Arrows, Pattern Shading, Design-by-tile, Shape marker insets
Beyond Wayfinding
• Flooring impacts a space in more ways than just wayfinding:
• Conveys brand identity
• Can shape perception, experience and behavior
• Can be used creatively with furniture to create distinct areas
• Can suggest boundaries with lines, banding, color and pattern
Design Solutions for the Post-COVID-19 Environment
20
Growth and Value Creation

Purpose-Driven Culture – Galvanized Around a Common
Sustainability Mission
21
Growth and Value Creation
Unilever
Patagonia
IKEA
Natura
Nestle
Danone
19
97
19
98
19
99
20
00
20
01
20
02
20
04
20
05
20
06
20
07
20
09
20
10
20
11
20
12
20
13
20
14
20
15
20
16
20
17
20
18
20
19
20
20
Tesla
Only company recognized
consistently since survey
inception
• Our sustainability journey began in 1994, led by our
founder, Ray Anderson.
• Over the last 25 years, we’ve changed our business to
help change the world by becoming, first and foremost, a
purpose-driven company.
Recent Recognition
UN Global Climate Action Award
Climate Neutral Now
Fast Company Most Innovative Energy Companies
GlobeScan SustainAbility Leaders Report
Floor Covering Weekly’s GreenStep Awards
Pinnacle Award Winner
INEX Sustainable Product of the Year (India)
Sustainable Business Awards (Singapore)
Winner, Climate Changes & Best Flagship Initiative
GlobeScan SustainAbility Survey – 20+ Year History

Radical Reductions in Environmental Impacts
22
Growth and Value Creation
Fewer greenhouse gasemissions*
Smaller cradle-to-gate product carbon footprint *
Less wastesent to landfills*
Less water used to make products*
Of materials in the flooring products we sell are from recycled or bio-based
sources
Renewable energy used at carpet and rubber manufacturing sites
96% 88% 48%
75%76% 92%
Learn more about Interface’s sustainability strategy, environmental commitment and social responsibility at:
https://investors.interface.com/corporate-responsibility-esg/default.aspx
*Global carpet tile manufacturing sites per unit of output since 1996
Note: Data as of 2020

23
Growth and Value Creation
Carpet Tile Carbon Footprint ComparisonCradle-to-Gate, From Raw Material Extraction Through Manufacturing

Product InnovationThe First Cradle-to-Gate Carbon Negative Carpet Tile
24
Growth and Value Creation
• Our goal is to make products with the lowest carbon footprint possible – products that go beyond neutral to help restore the health of the planet
• We’ve innovated ways to work with recycled content and bio-based materials – which has led us to make carpet tiles that store carbon, preventing its release into the atmosphere
• When we stop seeing carbon as the enemy and start using it as a resource, great things can happen. Taking our cue from nature, we can learn to work with carbon, using it as a building
block to engineer better products
The carbon life cycle
In the life of almost any product, carbon dioxide is
released into the atmosphere. This release of carbon
happens in two stages: the embodied carbon stage
and the operational carbon stage
Operational carbon
The carbon emitted after our product is installed. This
phase includes customer use through end-of-life. Also
known as "gate to end-of-life", this phase is much
harder for us to control. So we purchase offsets and
we reclaim and recycle our products at the end of
their useful life
Embodied carbon
The carbon dioxide emitted by making our products.
This phase covers raw material creation, growth and
extraction, through manufacture, until a product is
ready for sale. Also known as "cradle to gate", this is
the most exciting phase for us because we can
engineer our embodied carbon footprint to negative
CQuestTMGB Backing
A new-and-improved version of our
GlasBacTM backing. It features the same
superior performance with a construction of
post-consumer carpet tiles, bio-based
additives, and pre-consumer recycled
materials, which are net carbon negative
CQuestTMBio Backing
A non-vinyl backing made with biopolymers,
and bio-based and recycled fillers which are
net carbon negative
CQuestTM BioX Backing
Our most carbon negative backing. It's the
same material make-up as CQuestTMBio with
a higher concentration of carbon negative
materials

Financial Performance
25

Financial Performance
GAAP Financial Results
26
Note: Q1 2020 consisted of 14 weeks vs. 13 weeks in Q1 2021
($ in millions, except EPS) First Nine Months
2021 2020 Change 2021 2020 Change
Net Sales $313 $279 12% $861 $826 4%
Gross Profit 106 102 4% 311 314 (1%)
% of Net Sales 34.0% 36.7% 36.2% 38.0%
SG&A Expense 78 88 (12%) 237 256 (7%)
% of Net Sales 24.9% 31.6% 27.5% 31.0%
Restructuring Charges 4 (2) NM 4 (3) NM
Goodwill and Intangible Asset Impairment Charge - - - - 121 NM
Operating Income/(Loss) 25 16 56% 71 (60) NM
% of Net Sales 7.9% 5.7% 8.2% (7.3%)
Net Income/(Loss) 11 6 85% 33 (92) NM
% of Net Sales 3.5% 2.1% 3.9% (11.1%)
Diluted EPS $0.19 $0.10 90% $0.57 ($1.56) NM
Third Quarter

Financial Performance
Adjusted Financial Results*
27
* See Appendix for a reconciliation on Non-GAAP figures
Note: Q1 2020 consisted of 14 weeks vs. 13 weeks in Q1 2021
($ in millions, except EPS) First Nine Months
2021 2020 Change 2021 2020 Change
Net Sales $313 $279 12% $861 $826 4%
Adjusted Gross Profit 108 104 4% 316 318 (1%)
% of Net Sales 34.5% 37.2% 36.7% 38.5%
Adj SG&A Expense 78 75 3% 234 233 1%
% of Net Sales 24.8% 27.1% 27.2% 28.2%
Adjusted Operating Income 30 28 7% 81 85 (4%)
% of Net Sales 9.7% 10.1% 9.4% 10.3%
Adjusted Net Income 17 17 2% 44 51 (13%)
% of Net Sales 5.4% 5.9% 5.2% 6.2%
Adjusted Diluted EPS $0.29 $0.28 4% $0.75 $0.88 (15%)
Adjusted EBITDA $42 $37 14% $117 $108 7%
Third Quarter

Adjusted EBITDA
Financial Performance
Adjusted EBITDA*
28
$ million
* See Appendix for a reconciliation on Non-GAAP figures
$141
$152
$185
$197
$146 $154
$0
$50
$100
$150
$200
2016 2017 2018 2019 2020 LTM Q3 2021

Adjusted Earnings Per Share (Diluted)
Financial Performance
Adjusted Earnings Per Share*
29
$ million
* See Appendix for a reconciliation on Non-GAAP figures
$1.03
$1.18
$1.49
$1.59
$1.15
$1.03
$0.00
$0.20
$0.40
$0.60
$0.80
$1.00
$1.20
$1.40
$1.60
$1.80
2016 2017 2018 2019 2020 LTM Q3 2021
Total Debt Net Debt
Net Debt / Adjusted EBITDA
Financial Performance
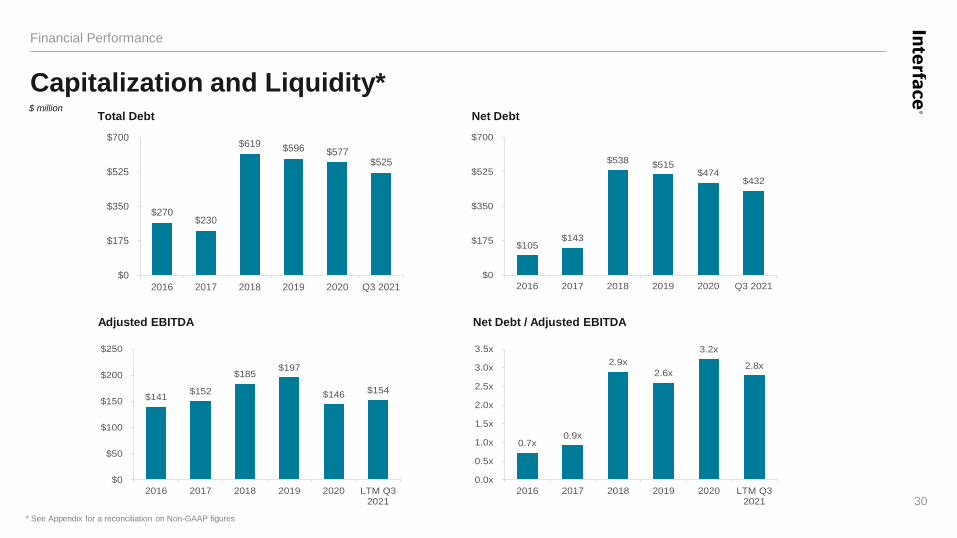
Capitalization and Liquidity*
Adjusted EBITDA
30
$ million
$270 $230
$619 $596 $577 $525
$0
$175
$350
$525
$700
2016 2017 2018 2019 2020 Q3 2021
$105 $143
$538 $515
$474 $432
$0
$175
$350
$525
$700
2016 2017 2018 2019 2020 Q3 2021
$141 $152
$185 $197
$146 $154
$0
$50
$100
$150
$200
$250
2016 2017 2018 2019 2020 LTM Q32021
* See Appendix for a reconciliation on Non-GAAP figures
0.7x 0.9x
2.9x
2.6x
3.2x
2.8x
0.0x
0.5x
1.0x
1.5x
2.0x
2.5x
3.0x
3.5x
2016 2017 2018 2019 2020 LTM Q32021

Financial Performance
Financial Policy
Reduce Debt
Reinvest in the
Business
Explore M&A
Opportunities
Return Excess Cash
to Shareowners
• Utilize excess cash to pay down debt
• Optimize cost of capital and target Net Debt / Adjusted EBITDA < 2.0x
• Invest in strategic initiatives with high returns, including organic growth opportunities, innovation,
manufacturing productivity and salesforce effectiveness
• Opportunistically evaluate accretive M&A transactions
• Provide dividends while prioritizing capital deployment
• Investing in the business to fuel our growth strategy while upholding a disciplined approach to deleveraging
CAPITAL DEPLOYMENT PHILOSOPHY
31

Who We Are
Leading
global provider
of commercial
flooring: Carpet Tile,
Modular Area Rugs,
LVT, Rubber
Strong brands
with a history
of innovation and
a commitment to
sustainability
Engaged
customer-centric
culture focused on
performance and
galvanized around
our sustainability
mission
Strong global sales
& marketing
capabilities
Innovation and
Design Leader in
modular carpet
Design and Innovation Leader Focused on Solving Customer Problems Across Multiple Segments
Global
sales &
manufacturing
footprint with
industry-leading
gross margins
32

Appendix
33

Appendix
Reconciliation of Non-GAAP Figures
34Note: Sum of reconciling items may differ from total due to rounding of individual components
($ in millions) Q3 2020 Q3 2021
First Nine
Months
2020
First Nine
Months
2021
Net Sales as Reported (GAAP) $278.6 $312.7 $826.3 $860.8
Impact of Changes in Currency - (2.5) - (27.5)
Organic Sales $278.6 $310.2 $826.3 $833.2
Gross Profit as Reported (GAAP) $102.2 $106.3 $313.8 $311.4
Purchase Accounting Amortization 1.4 1.4 4.0 4.3
Adjusted Gross Profit $103.6 $107.7 $317.8 $315.6
SG&A Expense as Reported (GAAP) $88.2 $77.7 $255.9 $236.9
Impact of Change in Equity Award Forfeiture Accounting - - (1.4) -
Restructuring, Asset Impairment, Severance and Other Charges (7.7) (0.2) (16.6) (2.4)
SEC Fine (5.0) - (5.0) -
Adjusted SG&A Expense $75.5 $77.5 $232.9 $234.5
Q3 2020 Q3 2021
LTM
Q3 2021
First Nine
Months
2020
First Nine
Months
2021
Operating Income as Reported (GAAP) $15.9 $24.8 $91.8 ($60.2) $70.9
Purchase Accounting Amortization 1.4 1.4 5.7 4.0 4.3
Goodwill and Intangible Asset Impairment - - - 121.3 -
Impact of Change in Equity Award Forfeiture Accounting - - - 1.4 -
Restructuring, Asset Impairment, Severance and Other Charges 5.8 4.0 9.2 13.5 6.0
SEC Fine 5.0 - - 5.0 -
Adjusted Operating Income* $28.1 $30.2 $106.7 $84.9 $81.2

Appendix
Reconciliation of Non-GAAP Figures
35Note: Sum of reconciling items may differ from total due to rounding of individual components
($ in millions) Q3 2020 Q3 2021
LTM
Q3 2021
First Nine
Months
2020
First Nine
Months
2021
Net Income (Loss) as Reported (GAAP) $5.9 $11.0 $53.0 ($91.5) $33.4
Purchase Accounting Amortization 1.0 1.0 4.0 2.8 3.0
Goodwill and Intangible Asset Impairment - - - 119.8 -
Impact of Change in Equity Award Forfeiture Accounting - - - 1.1 -
Restructuring, Asset Impairment, Severance and Other Charges 4.6 3.5 7.5 10.8 5.1
Warehouse Fire Loss - - (0.1) 3.2 (0.1)
SEC Fine 5.0 - - 5.0 -
Loss on Extinguishment of Debt - - 2.8 - -
Loss on Discontinuance if Interest Rate Swaps - 1.4 5.9 - 3.0
FIN 48 Release on Discontinued Operations - - (12.7) - -
Adjusted Net Income $16.5 $16.9 $60.5 $51.2 $44.5
2016 2017 2018 2019 2020 Q3 2020 Q3 2021
LTM
Q3 2021
First Nine
Months
2020
First Nine
Months
2021
Diluted EPS as Reported (GAAP) $0.83 $0.86 $0.84 $1.34 ($1.23) $0.10 $0.19 $0.90 ($1.56) $0.57
Purchase Accounting Amortization - - 0.38 0.08 0.07 0.02 0.02 0.07 0.05 0.05
Transaction Related Expenses - - 0.12 - - - - - - -
Goodwill and Intangible Asset Impairment - - - - 2.05 - - - 2.05 -
Impact of Change in Equity Award Forfeiture Accounting - - - - 0.02 - - - 0.02 -
Restructuring, Asset Impairment, Severance and Other Charges 0.20 0.08 0.26 0.17 0.23 0.08 0.06 0.13 0.18 0.09
Tax Act Expense (Benefit) - 0.25 (0.11) - - - - - - -
Warehouse Fire Loss - - - - 0.05 - - (0.00) 0.05 (0.00)
SEC Fine - - - - 0.09 0.09 - - 0.09 -
Loss on Extinguishment of Debt - - - - 0.05 - - 0.05 - -
Loss on Discontinuance if Interest Rate Swaps - - - - 0.05 - 0.02 0.10 - 0.05
FIN 48 Release on Discontinued Operations - - - - (0.22) - - (0.22) - -
Adjusted Diluted EPS* $1.03 $1.18 $1.49 $1.59 $1.15 $0.28 $0.29 $1.03 $0.88 $0.75

Appendix
Reconciliation of Non-GAAP Figures
Note: Sum of reconciling items may differ from total due to rounding of individual components
* Historical AEBITDA figures have been updated to reflect a change in depreciation and amortization values used to calculate AEBITDA.
36
($ in millions) Q3 2020 Q3 2021
First Nine
Months
2020
First Nine
Months
2021
Net Income as Reported (GAAP) $5.9 $11.0 ($91.5) $33.4
Income Tax Expense (Benefit) 1.6 5.2 5.7 13.0
Interest Expense (including debt issuance cost amortization) 5.4 7.7 16.0 22.3
Depreciation and Amortization (excluding debt issuance cost amortization) 10.9 11.0 31.8 33.7
Stock Compensation Amortization (Benefit) 0.8 1.7 (1.4) 4.2
Purchase Accounting Amortization 1.4 1.4 4.0 4.3
Goodwill and Intangible Asset Impairment - - 121.3 -
Restructuring, Asset Impairment, Severance and Other Charges 5.8 4.0 13.5 6.0
Warehouse Fire Loss - - 4.2 (0.2)
SEC Fine 5.0 - 5.0 -
Adjusted Earnings before Interest, Taxes, Depreciation and Amortization (AEBITDA)* $36.9 $42.0 $108.5 $116.6
($ in millions) 2016 2017 2018 2019 2020
LTM
Q3 2021
Net Income as Reported (GAAP) $54.2 $53.2 $50.3 $79.2 ($71.9) $53.0
Income Tax Expense (Benefit) 25.0 47.3 4.7 22.6 (7.5) (0.3)
Transaction Related Other Expense - - 4.2 - - -
Interest Expense (includiing debt issuance cost amortization) 6.1 7.1 15.4 25.6 29.2 35.5
Depreciation and Amortization (excluding debt issuance cost amortization) 30.1 29.8 37.9 42.0 43.8 45.8
Stock Compensation Amortization 5.9 7.2 14.5 8.7 (0.5) 5.1
Purchase Accounting Amortization - - 32.1 5.9 5.5 5.7
Transaction and Integration Related Expenses - - 5.3 - - -
Goodwill and Intangible Asset Impairment - - - - 121.3 -
Restructuring, Asset Impairment, Severance and Other Charges 19.8 7.3 20.5 12.9 16.7 9.2
Warehouse Fire Loss - - - - 4.2 (0.2)
SEC Fine - - - - 5.0 -
Adjusted Earnings before Interest, Taxes, Depreciation and Amortization (AEBITDA)* $141.1 $152.0 $184.9 $197.0 $145.7 $153.9
($ in millions) 2016 2017 2018 2019 2020 Q3 2021
Total Debt $270 $230 $619 $596 $577 $525
Less: Cash (166) (87) (81) (81) (103) (93)
Net Debt $105 $143 $538 $515 $474 $432
Total Debt / LTM Net Income as Reported (GAAP) 5.0x 4.3x 12.3x 7.5x (8.0x) 9.9x
Net Debt / LTM Adjusted EBITDA 0.7x 0.9x 2.9x 2.6x 3.2x 2.8x