ap bio lab 3
DESCRIPTION
This is a very simple AP LAB, #3, that most AP students will desire to use. Obviously, not the most fun, but you guys will like it. Just give it a try/TRANSCRIPT
BIG IDEA 1
3
EVT AP03.120828
EDVO-Kit: AP03
Determining Evolutionary Relationships Using BLAST
See Page 3 for storage instructions.
EXPERIMENT OBJECTIVE:
The objective of the experiment is for students to become familiar with databases that can be used to investigate gene sequences and to construct cladograms that provide evidence for evolutionary relatedness among species.
2 Duplication of any part of this document is permitted for non-profi t educational purposes only. Copyright © 1989-2012 EDVOTEK, Inc., all rights reserved. EVT AP03.120828
Determining Evolutionary Relationships Using BLASTAP03EXPERIMENT
The Biotechnology Education Company® • 1-800-EDVOTEK • www.edvotek.com
The Advanced Placement (AP) Program is a registered trademark of the College Entrance Examination Board. These laboratory materials have been prepared by EDVOTEK, Inc. which bears sole responsibility for their contents.
All components are intended for educational research only. They are not to be used for diagnostic or drug pur-poses, nor administered to or consumed by humans or animals.
THIS EXPERIMENT DOES NOT CONTAIN HUMAN DNA. None of the experiment components are derived from human sources.
EDVOTEK and The Biotechnology Education Company are registered trademarks of EDVOTEK, Inc.
Page
Experiment Components 3 Experiment Requirements 3Background Information 4 Experiment Procedures Experiment Overview 7 Investigation I: Understanding a Cladogram 8 Investigation II: Building Simple Cladograms 9 Investigation III: Uncovering Fossil Specimen using BLAST 11 Investigation IV: BLAST Your Own Genes of Interest! 18 Study Questions, Expected Results and Selected Answers 19
Instructor’s Guidelines Notes to the Instructor 25
Table of Contents
3Duplication of any part of this document is permitted for non-profi t educational purposes only. Copyright © 1989-2012 EDVOTEK, Inc., all rights reserved. EVT AP03.120828
The Biotechnology Education Company® • 1-800-EDVOTEK • www.edvotek.com
AP03EXPERIMENT
Determining Evolutionary Relationships Using BLAST
• Instructions
Store the entire experiment at room temperature.
This experiment is designed for 10 lab groups.
Experiment Components
Requirements
• Computer with internet access
4 Duplication of any part of this document is permitted for non-profi t educational purposes only. Copyright © 1989-2012 EDVOTEK, Inc., all rights reserved. EVT AP03.120828
Determining Evolutionary Relationships Using BLASTAP03EXPERIMENT
The Biotechnology Education Company® • 1-800-EDVOTEK • www.edvotek.com
Background Information
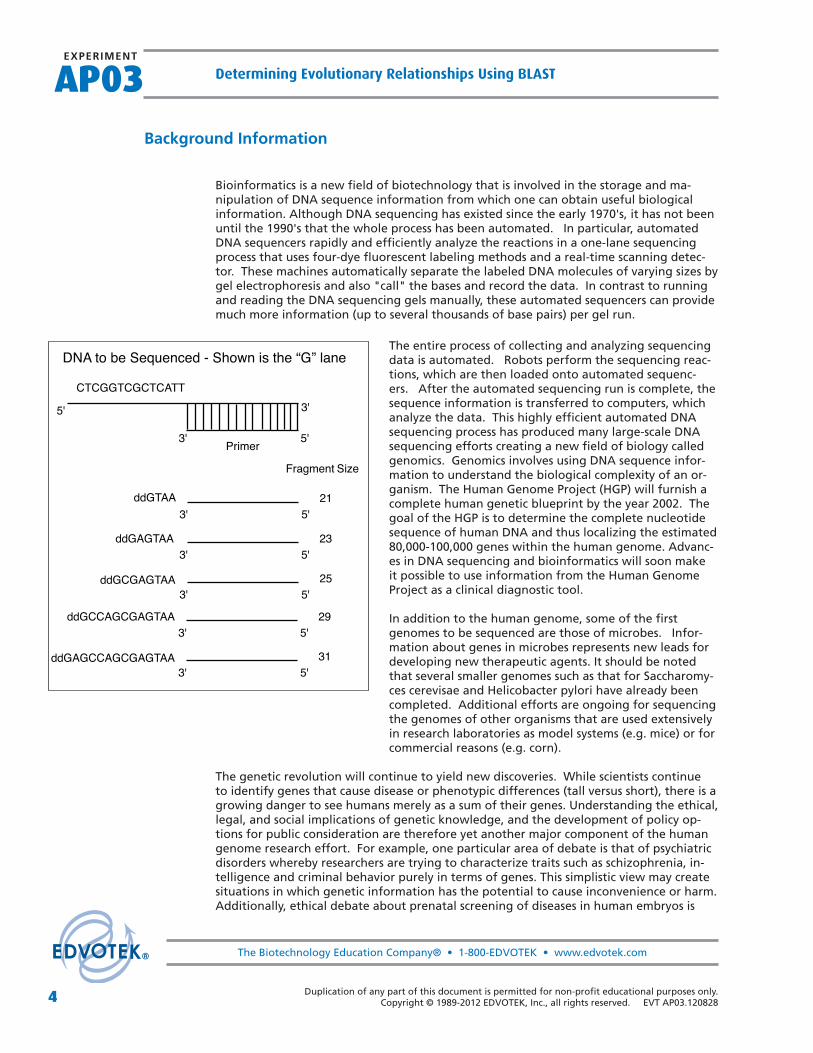
Bioinformatics is a new fi eld of biotechnology that is involved in the storage and ma-nipulation of DNA sequence information from which one can obtain useful biological information. Although DNA sequencing has existed since the early 1970's, it has not been until the 1990's that the whole process has been automated. In particular, automated DNA sequencers rapidly and effi ciently analyze the reactions in a one-lane sequencing process that uses four-dye fl uorescent labeling methods and a real-time scanning detec-tor. These machines automatically separate the labeled DNA molecules of varying sizes by gel electrophoresis and also "call" the bases and record the data. In contrast to running and reading the DNA sequencing gels manually, these automated sequencers can provide much more information (up to several thousands of base pairs) per gel run.
The genetic revolution will continue to yield new discoveries. While scientists continue to identify genes that cause disease or phenotypic differences (tall versus short), there is a growing danger to see humans merely as a sum of their genes. Understanding the ethical, legal, and social implications of genetic knowledge, and the development of policy op-tions for public consideration are therefore yet another major component of the human genome research effort. For example, one particular area of debate is that of psychiatric disorders whereby researchers are trying to characterize traits such as schizophrenia, in-telligence and criminal behavior purely in terms of genes. This simplistic view may create situations in which genetic information has the potential to cause inconvenience or harm. Additionally, ethical debate about prenatal screening of diseases in human embryos is
The entire process of collecting and analyzing sequencing data is automated. Robots perform the sequencing reac-tions, which are then loaded onto automated sequenc-ers. After the automated sequencing run is complete, the sequence information is transferred to computers, which analyze the data. This highly effi cient automated DNA sequencing process has produced many large-scale DNA sequencing efforts creating a new fi eld of biology called genomics. Genomics involves using DNA sequence infor-mation to understand the biological complexity of an or-ganism. The Human Genome Project (HGP) will furnish a complete human genetic blueprint by the year 2002. The goal of the HGP is to determine the complete nucleotide sequence of human DNA and thus localizing the estimated 80,000-100,000 genes within the human genome. Advanc-es in DNA sequencing and bioinformatics will soon make it possible to use information from the Human Genome Project as a clinical diagnostic tool.
In addition to the human genome, some of the fi rst genomes to be sequenced are those of microbes. Infor-mation about genes in microbes represents new leads for developing new therapeutic agents. It should be noted that several smaller genomes such as that for Saccharomy-ces cerevisae and Helicobacter pylori have already been completed. Additional efforts are ongoing for sequencing the genomes of other organisms that are used extensively in research laboratories as model systems (e.g. mice) or for commercial reasons (e.g. corn).
5'
CTCGGTCGCTCATT
Primer3' 5'
3'
Fragment Size
3' 5'21ddGTAA
3' 5'23ddGAGTAA
3' 5'25ddGCGAGTAA
3' 5'29ddGCCAGCGAGTAA
3' 5'31ddGAGCCAGCGAGTAA
DNA to be Sequenced - Shown is the “G” lane
5Duplication of any part of this document is permitted for non-profi t educational purposes only. Copyright © 1989-2012 EDVOTEK, Inc., all rights reserved. EVT AP03.120828
The Biotechnology Education Company® • 1-800-EDVOTEK • www.edvotek.com
AP03EXPERIMENT
Determining Evolutionary Relationships Using BLAST
Background Information
In order to gain experience in database searching, students will utilize the free service of-fered by the National Center for Biotechnology (NCBI) which can be accessed on the inter-net. At present there are several Databases of GenBank including the GenBank and EMBL nucleotide sequences, the non-redundant GenBank CDS (protein sequences) translations, and the EST (expressed sequence tags) database. Students can use any of these databases as well as others available on the internet to perform the activities in this lab. For purpos-es of simplifi cation, we have chosen to illustrate the database offered by the NCBI. These exercises will involve using BLASTN, whereby a nucleotide sequence will be compared to other sequences in the nucleotide database. BLASTP will also be used to compare the amino acid sequence of a protein with other protein sequences in the databank.
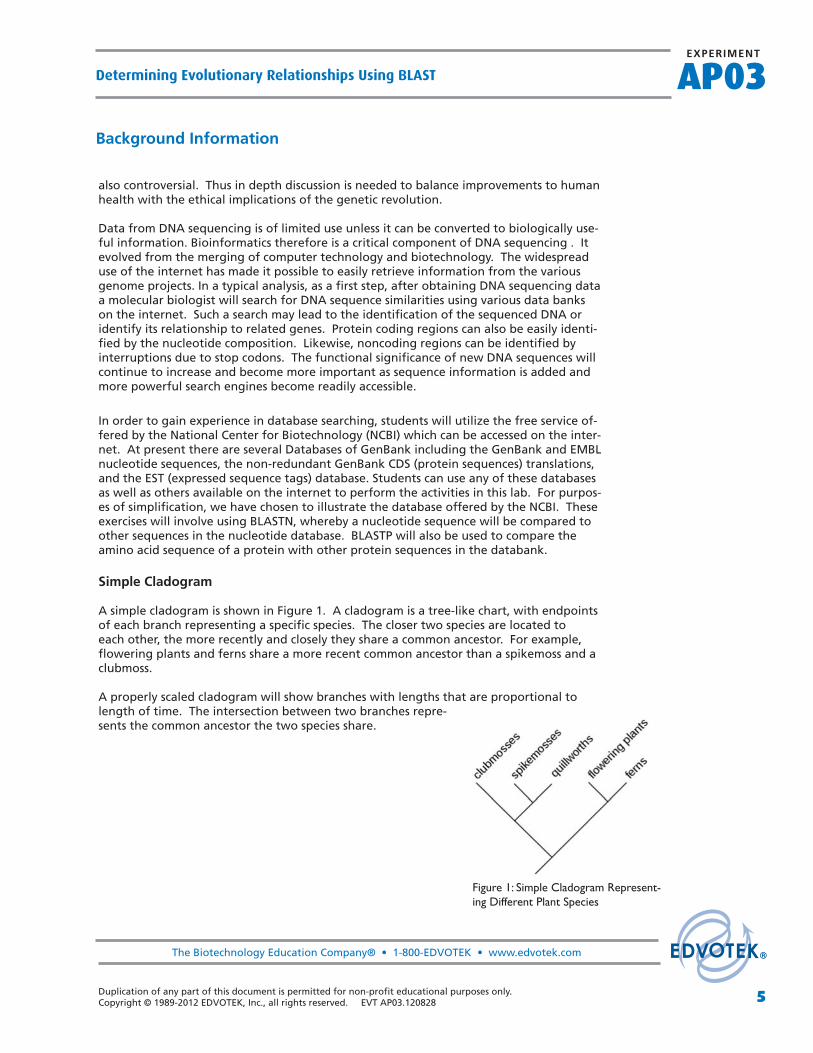
Simple Cladogram
A simple cladogram is shown in Figure 1. A cladogram is a tree-like chart, with endpoints of each branch representing a specifi c species. The closer two species are located to each other, the more recently and closely they share a common ancestor. For example, fl owering plants and ferns share a more recent common ancestor than a spikemoss and a clubmoss.
A properly scaled cladogram will show branches with lengths that are proportional to length of time. The intersection between two branches repre-sents the common ancestor the two species share.
Figure 1: Simple Cladogram Represent-ing Different Plant Species
also controversial. Thus in depth discussion is needed to balance improvements to human health with the ethical implications of the genetic revolution.
Data from DNA sequencing is of limited use unless it can be converted to biologically use-ful information. Bioinformatics therefore is a critical component of DNA sequencing . It evolved from the merging of computer technology and biotechnology. The widespread use of the internet has made it possible to easily retrieve information from the various genome projects. In a typical analysis, as a fi rst step, after obtaining DNA sequencing data a molecular biologist will search for DNA sequence similarities using various data banks on the internet. Such a search may lead to the identifi cation of the sequenced DNA or identify its relationship to related genes. Protein coding regions can also be easily identi-fi ed by the nucleotide composition. Likewise, noncoding regions can be identifi ed by interruptions due to stop codons. The functional signifi cance of new DNA sequences will continue to increase and become more important as sequence information is added and more powerful search engines become readily accessible.

6 Duplication of any part of this document is permitted for non-profi t educational purposes only. Copyright © 1989-2012 EDVOTEK, Inc., all rights reserved. EVT AP03.120828
Determining Evolutionary Relationships Using BLASTAP03EXPERIMENT
The Biotechnology Education Company® • 1-800-EDVOTEK • www.edvotek.com
Background Information
Complex Cladogram
Figure 2 includes additional information such as the evolution of particular physical structures known as shared derived characters. The placement of the derived characters corresponds with when that character evolved and that every species above the character label possesses that structure. For example, lizard, tiger and gorilla have dry skin; how-ever, lamprey, shark and salamander do not have dry skin according to the cladogram.
In this laboratory investigation, you will use BLAST to analyze several genes and use the information to construct a cladogram. A cladogram (also called a phylogenetic tree) is a visualization of the evolutionary relatedness between species.
Figure 2: Cladogram of Several Animal Species with shared derived characters.
7Duplication of any part of this document is permitted for non-profi t educational purposes only. Copyright © 1989-2012 EDVOTEK, Inc., all rights reserved. EVT AP03.120828
The Biotechnology Education Company® • 1-800-EDVOTEK • www.edvotek.com
AP03EXPERIMENT
Determining Evolutionary Relationships Using BLASTExp
erimen
t Pro
cedu
re
Experiment Overview and General Instructions
EXPERIMENT OBJECTIVE
In this investigation, students will:
1. Create cladograms that depict evolutionary relationships among organisms.
2. Analyze biological data with a sophisticated bioinformatics online tool.
3. Connect and apply concepts pertaining to genetics and evolution.
LABORATORY SAFETY GUIDELINES
1. Wear gloves and goggles while working in the laboratory.
2. Exercise caution when working in the laboratory. You will be using equipment that can be dangerous if used incorrectly.
3. Always wash hands thoroughly with soap and water after working in the laboratory.
4. If you are unsure of something, ASK YOUR INSTRUCTOR!
LABORATORY NOTEBOOKS
Scientists document everything that happens during an experiment, including experi-mental conditions, thoughts and observations while conducting the experiment, and, of course, any data collected. Today, you’ll be documenting your experiment in a laboratory notebook or on a separate worksheet.
BEFORE STARTING THE EXPERIMENT:
• Carefully read the introduction and the protocol. Use this information to form a hypothesis for this experiment.
• Predict the results of your experiment.
DURING THE EXPERIMENT:
• Record your observations.
AFTER THE EXPERIMENT:
• Interpret the results - does your data support or contradict your hypothesis? • If you repeated this experiment, what would you change? Revise your hypothesis to
refl ect this change.
8 Duplication of any part of this document is permitted for non-profi t educational purposes only. Copyright © 1989-2012 EDVOTEK, Inc., all rights reserved. EVT AP03.120828
Determining Evolutionary Relationships Using BLASTAP03EXPERIMENT
The Biotechnology Education Company® • 1-800-EDVOTEK • www.edvotek.com
Exp
erim
ent
Pro
ced
ure
Investigation I: Understanding a Cladogram
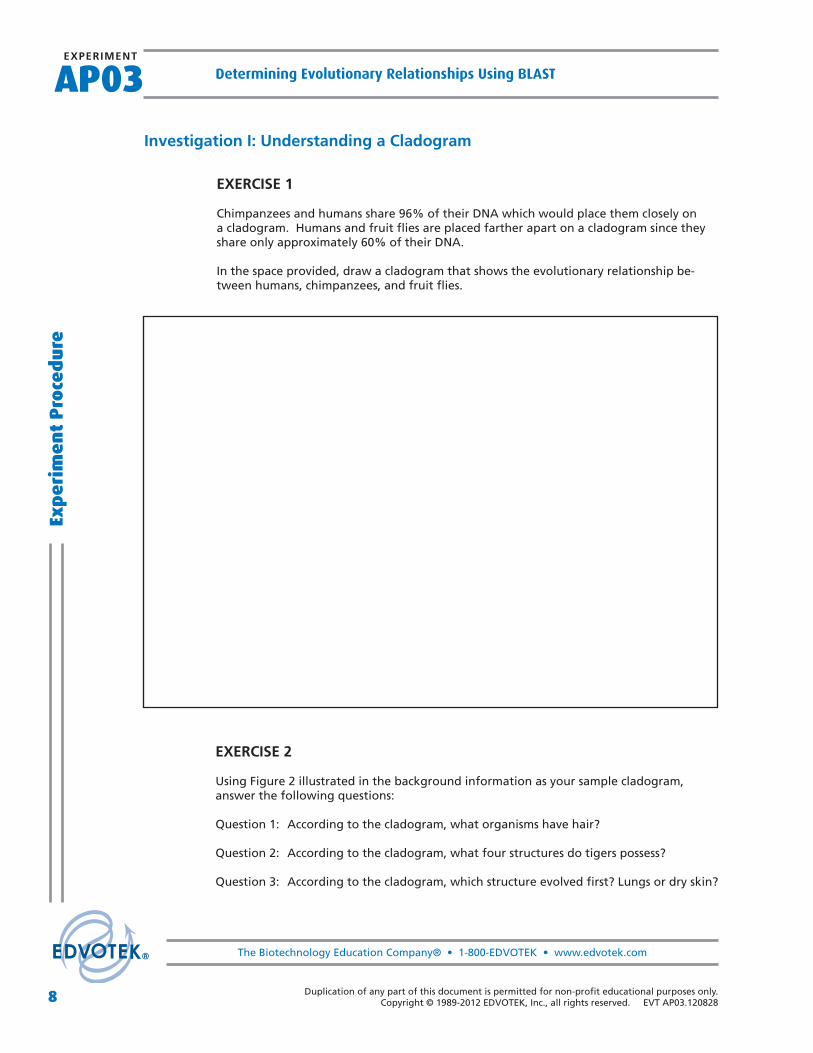
EXERCISE 1
Chimpanzees and humans share 96% of their DNA which would place them closely on a cladogram. Humans and fruit fl ies are placed farther apart on a cladogram since they share only approximately 60% of their DNA.
In the space provided, draw a cladogram that shows the evolutionary relationship be-tween humans, chimpanzees, and fruit fl ies.
EXERCISE 2
Using Figure 2 illustrated in the background information as your sample cladogram, answer the following questions:
Question 1: According to the cladogram, what organisms have hair?
Question 2: According to the cladogram, what four structures do tigers possess?
Question 3: According to the cladogram, which structure evolved fi rst? Lungs or dry skin?

9Duplication of any part of this document is permitted for non-profi t educational purposes only. Copyright © 1989-2012 EDVOTEK, Inc., all rights reserved. EVT AP03.120828
The Biotechnology Education Company® • 1-800-EDVOTEK • www.edvotek.com
AP03EXPERIMENT
Determining Evolutionary Relationships Using BLASTExp
erimen
t Pro
cedu
re
Investigation II: Building Simple Cladograms
EXERCISE 3
Use the following data to construct a cladogram of the major plant groups in the space provided below.

10 Duplication of any part of this document is permitted for non-profi t educational purposes only. Copyright © 1989-2012 EDVOTEK, Inc., all rights reserved. EVT AP03.120828
Determining Evolutionary Relationships Using BLASTAP03EXPERIMENT
The Biotechnology Education Company® • 1-800-EDVOTEK • www.edvotek.com
Exp
erim
ent
Pro
ced
ure
Investigation II: Building Simple Cladograms
EXERCISE 4
GAPDH (glyceraldehyde 3-phosphate dehydrogenase) is an enzyme that participates in glycolysis, an important reaction in the process of cellular respiration. The following table shows the percentage of similarity of this gene and the protein it expresses in humans versus other species.
a) Why is the percentage of similarity in the protein always higher than the percentage of similarity in the gene for each of the species?
b) In the space below, draw a cladogram depicting the evolutionary relationships be-tween all fi ve species based on their percentage of similarity in the GAPDH gene.

11Duplication of any part of this document is permitted for non-profi t educational purposes only. Copyright © 1989-2012 EDVOTEK, Inc., all rights reserved. EVT AP03.120828
The Biotechnology Education Company® • 1-800-EDVOTEK • www.edvotek.com
AP03EXPERIMENT
Determining Evolutionary Relationships Using BLASTExp
erimen
t Pro
cedu
re
Investigation III: Uncovering Fossil Specimen using BLAST
A. MORPHOLOGICAL OBSERVATION OF THE FOSSIL SPECIMEN AND FORMING THE HYPOTHESIS
A team of scientists have uncovered the following fossil specimen near Hells Creek, Mon-tana.
1. Make some general observations about the morphology (physical structure) of the fossil and record your observations in the space provided.
________________________________________________________________________________
________________________________________________________________________________
________________________________________________________________________________
________________________________________________________________________________
________________________________________________________________________________
________________________________________________________________________________
2. Little is known about the fossil other than it appears to be a new species. Upon careful examination of the fossil, small amounts of soft tissue have been discovered. The scientists were able to extract proteins from the tissue and use the information to sequence several genes. Your task is to use BLAST to analyze these genes and de-termine the most likely placement of the fossil species on the following fossil clado-gram:

12 Duplication of any part of this document is permitted for non-profi t educational purposes only. Copyright © 1989-2012 EDVOTEK, Inc., all rights reserved. EVT AP03.120828
Determining Evolutionary Relationships Using BLASTAP03EXPERIMENT
The Biotechnology Education Company® • 1-800-EDVOTEK • www.edvotek.com
Exp
erim
ent
Pro
ced
ure
Investigation III: Uncovering Fossil Specimen using BLAST
3. Form an initial hypothesis as to where you believe the specimen should be placed on the cladogram based on the morphological observations you made earlier.
________________________________________________________________________________
________________________________________________________________________________
________________________________________________________________________________
________________________________________________________________________________
________________________________________________________________________________
________________________________________________________________________________
4. Draw your hypothesis on the cladogram.
13Duplication of any part of this document is permitted for non-profi t educational purposes only. Copyright © 1989-2012 EDVOTEK, Inc., all rights reserved. EVT AP03.120828
The Biotechnology Education Company® • 1-800-EDVOTEK • www.edvotek.com
AP03EXPERIMENT
Determining Evolutionary Relationships Using BLASTExp
erimen
t Pro
cedu
re
Investigation III: Uncovering Fossil Specimen using BLAST
B. USING BLAST TO ANALYZE GENES AND DETERMINE THE MOST LIKELY PLACEMENT OF THE FOSSIL SPECIES
Step 1: Instruction for Downloading Gene Files
Before starting this investigation, students need to download four gene fi les (Gene 1- Gene 4) to their fl ash drive or computer. These fi les are located at the following web address:
http://blogging4biology.edublogs.org/2010/08/28/college-board-lab-fi les/
Note that these fi les will not open on your computer. They only work when opened on the BLAST website.
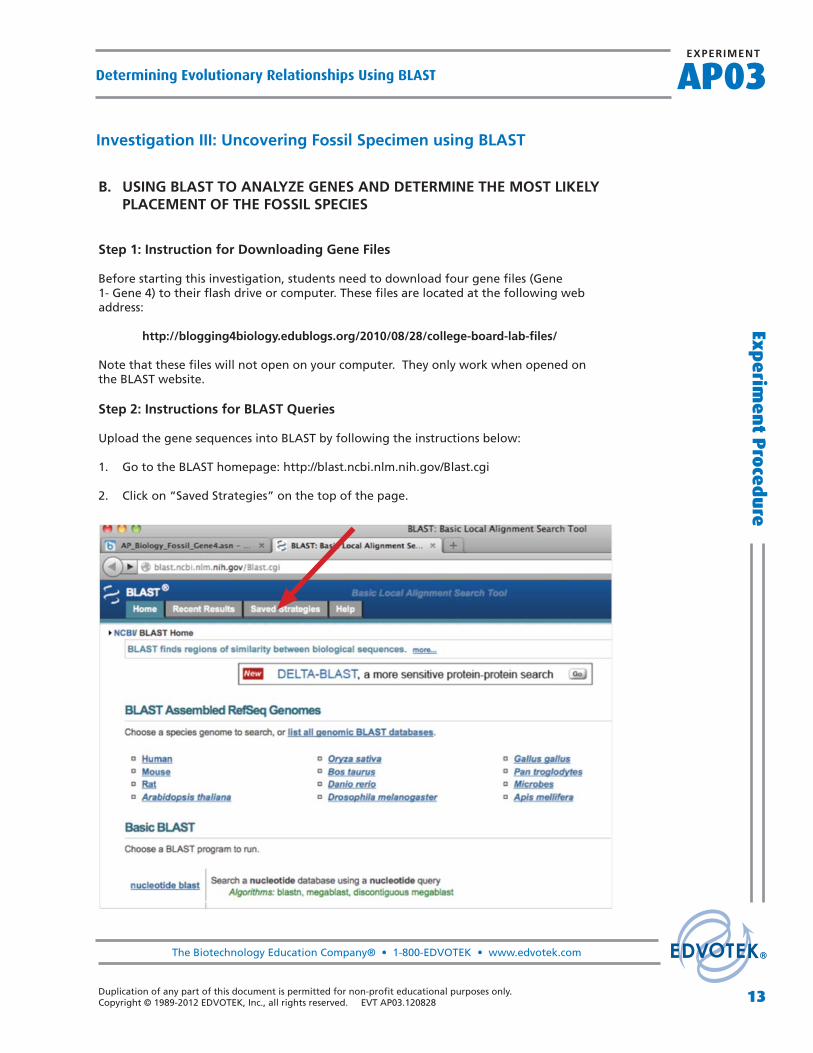
Step 2: Instructions for BLAST Queries
Upload the gene sequences into BLAST by following the instructions below:
1. Go to the BLAST homepage: http://blast.ncbi.nlm.nih.gov/Blast.cgi
2. Click on “Saved Strategies” on the top of the page.
14 Duplication of any part of this document is permitted for non-profi t educational purposes only. Copyright © 1989-2012 EDVOTEK, Inc., all rights reserved. EVT AP03.120828
Determining Evolutionary Relationships Using BLASTAP03EXPERIMENT
The Biotechnology Education Company® • 1-800-EDVOTEK • www.edvotek.com
Exp
erim
ent
Pro
ced
ure
Investigation III: Uncovering Fossil Specimen using BLAST
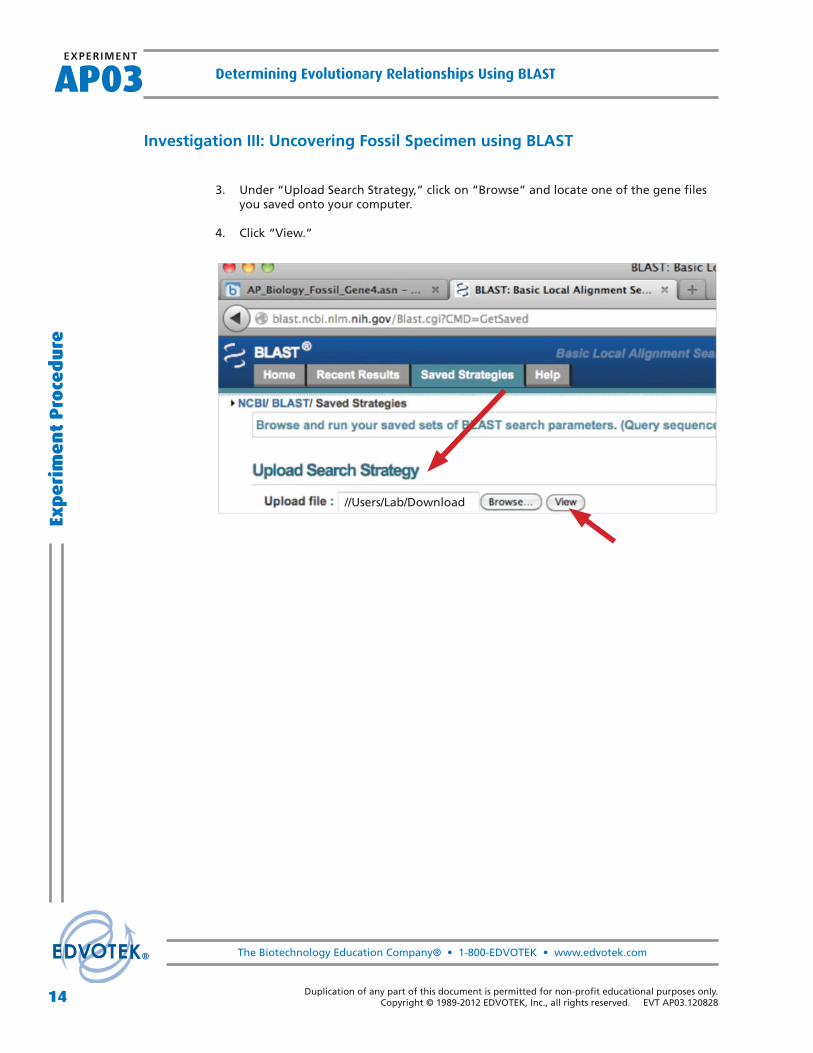
3. Under “Upload Search Strategy,” click on “Browse” and locate one of the gene fi les you saved onto your computer.
4. Click “View.”
//Users/Lab/Download
15Duplication of any part of this document is permitted for non-profi t educational purposes only. Copyright © 1989-2012 EDVOTEK, Inc., all rights reserved. EVT AP03.120828
The Biotechnology Education Company® • 1-800-EDVOTEK • www.edvotek.com
AP03EXPERIMENT
Determining Evolutionary Relationships Using BLASTExp
erimen
t Pro
cedu
re
Investigation III: Uncovering Fossil Specimen using BLAST
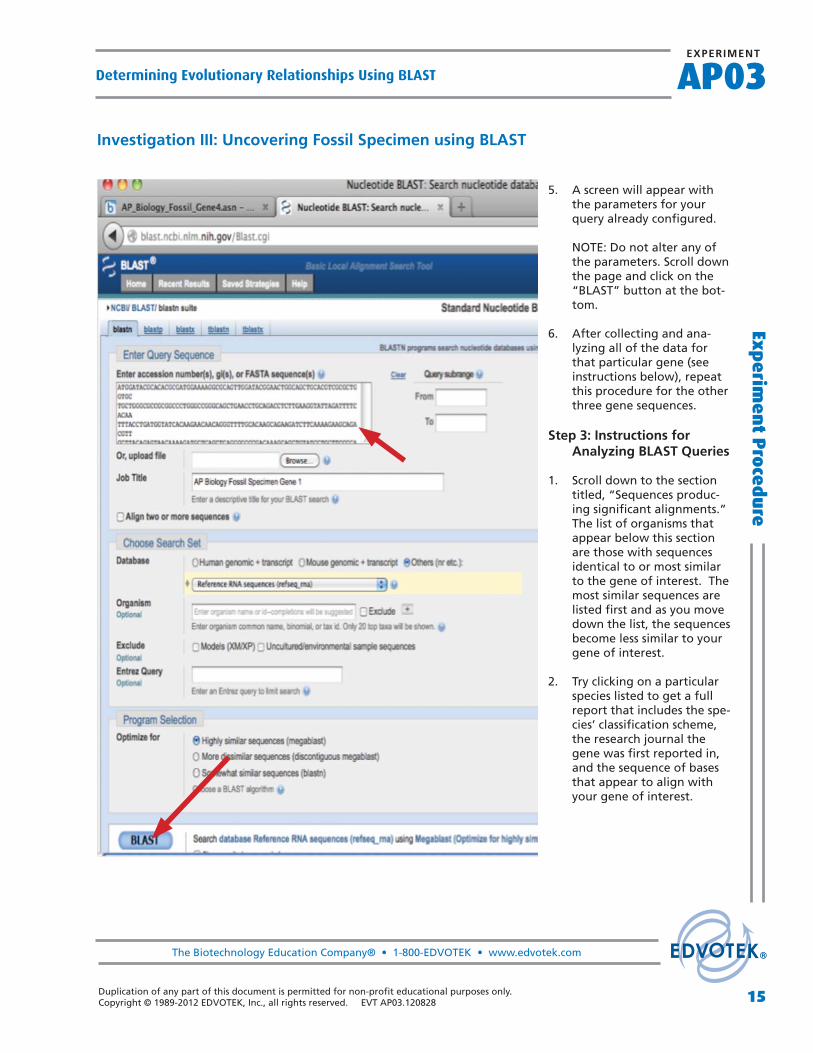
5. A screen will appear with the parameters for your query already confi gured.
NOTE: Do not alter any of the parameters. Scroll down the page and click on the “BLAST” button at the bot-tom.
6. After collecting and ana-lyzing all of the data for that particular gene (see instructions below), repeat this procedure for the other three gene sequences.
Step 3: Instructions for Analyzing BLAST Queries
1. Scroll down to the section titled, “Sequences produc-ing signifi cant alignments.” The list of organisms that appear below this section are those with sequences identical to or most similar to the gene of interest. The most similar sequences are listed fi rst and as you move down the list, the sequences become less similar to your gene of interest.
2. Try clicking on a particular species listed to get a full report that includes the spe-cies’ classifi cation scheme, the research journal the gene was fi rst reported in, and the sequence of bases that appear to align with your gene of interest.
16 Duplication of any part of this document is permitted for non-profi t educational purposes only. Copyright © 1989-2012 EDVOTEK, Inc., all rights reserved. EVT AP03.120828
Determining Evolutionary Relationships Using BLASTAP03EXPERIMENT
The Biotechnology Education Company® • 1-800-EDVOTEK • www.edvotek.com
Exp
erim
ent
Pro
ced
ure
Investigation III: Uncovering Fossil Specimen using BLAST
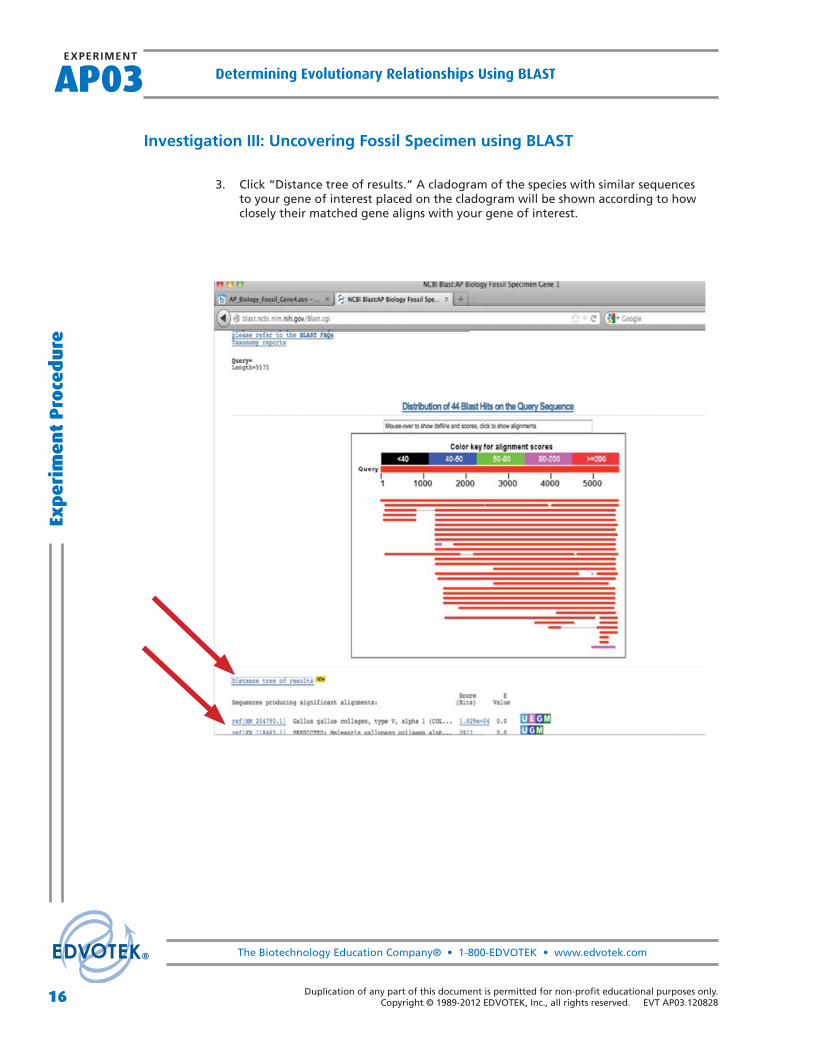
3. Click “Distance tree of results.” A cladogram of the species with similar sequences to your gene of interest placed on the cladogram will be shown according to how closely their matched gene aligns with your gene of interest.
17Duplication of any part of this document is permitted for non-profi t educational purposes only. Copyright © 1989-2012 EDVOTEK, Inc., all rights reserved. EVT AP03.120828
The Biotechnology Education Company® • 1-800-EDVOTEK • www.edvotek.com
AP03EXPERIMENT
Determining Evolutionary Relationships Using BLASTExp
erimen
t Pro
cedu
re
Investigation III: Uncovering Fossil Specimen using BLAST
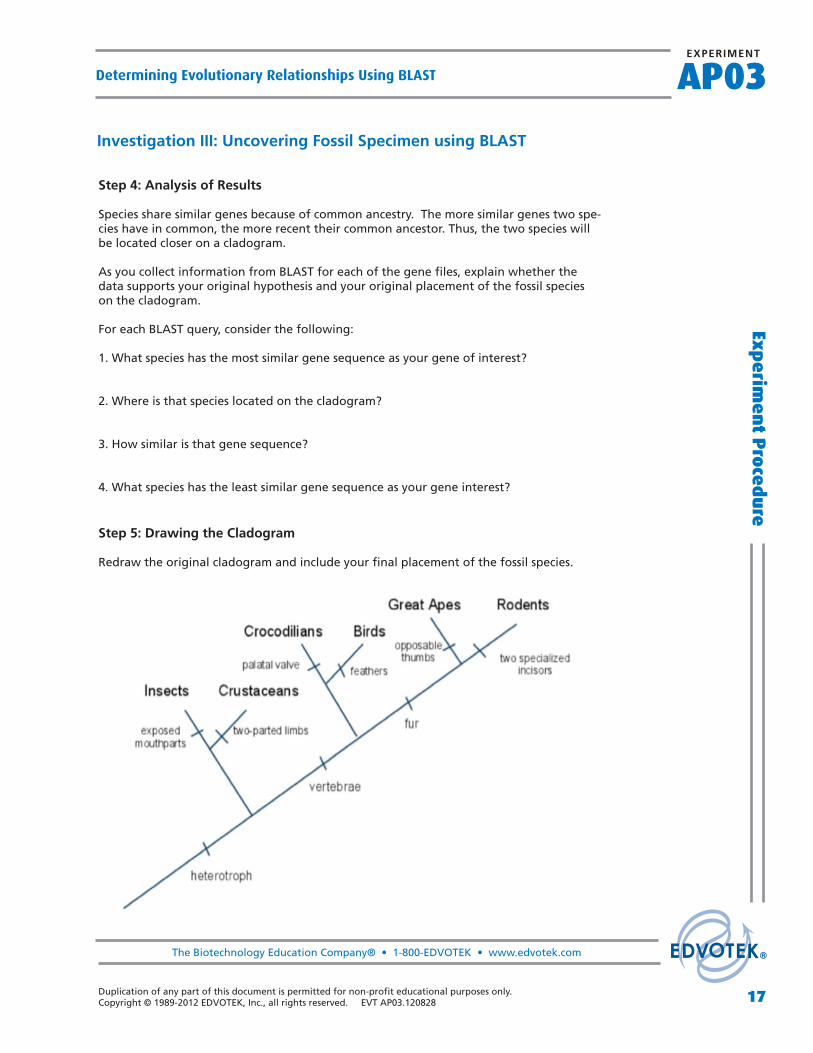
Step 4: Analysis of Results
Species share similar genes because of common ancestry. The more similar genes two spe-cies have in common, the more recent their common ancestor. Thus, the two species will be located closer on a cladogram.
As you collect information from BLAST for each of the gene fi les, explain whether the data supports your original hypothesis and your original placement of the fossil species on the cladogram.
For each BLAST query, consider the following:
1. What species has the most similar gene sequence as your gene of interest?
2. Where is that species located on the cladogram?
3. How similar is that gene sequence?
4. What species has the least similar gene sequence as your gene interest?
Step 5: Drawing the Cladogram
Redraw the original cladogram and include your fi nal placement of the fossil species.
18 Duplication of any part of this document is permitted for non-profi t educational purposes only. Copyright © 1989-2012 EDVOTEK, Inc., all rights reserved. EVT AP03.120828
Determining Evolutionary Relationships Using BLASTAP03EXPERIMENT
The Biotechnology Education Company® • 1-800-EDVOTEK • www.edvotek.com
Exp
erim
ent
Pro
ced
ure
Investigation IV: BLAST Your Own Genes of Interest!
Now that the fi rst part of the investigation is complete, the next step is to learn how to fi nd and BLAST your own genes of interest. To locate a gene, go to the Entrez Gene web-site (http://www.ncbi.nlm.nih.gov/gene) and search for the gene. Once you have found the gene on the site, copy the gene sequence and input it into a BLAST query.
Follow the instructions below to BLAST your own gene of interest:
1. On the Entrez Gene website search the term “human actin.”
2. Click on the fi rst link that appears and scroll down to “NCBI Reference Sequences.”
3. Click on the fi rst fi le name “NM 001100.3” under “mRNA and Proteins.”
4. Click on “FASTA” just below the gene title.
5. The nucleotide sequence displayed is that of the actin gene in humans.
6. Copy the gene sequence and go to the BLAST homepage (http://blast.ncbi.nlm.nih.gov/Blast.cgi).
7. Click on “nucleotide blast” under the Basic BLAST menu.
8. Paste the sequence into the box “Enter Query Sequence.”
9. Give the query a title in the box provided if you plan on saving it for later.
10. Under “Choose Search Set” select the type or genome you want to search (human genome, mouse genome, or all genomes available).
11. Under “Program Selection” choose whether or not you want highly similar sequences or somewhat similar sequences. Choosing somewhat similar sequences will provide you with more results.
12. Click BLAST.
In humans, what is the importance of the gene you chose? Would you expect to fi nd that gene is all organisms? Why or why not?
Some gene suggestions you could try out:
Actin ATP synthase Catalase GAPDH Keratin Myosin Pax1 Ubiquitin Zinc fi nger