ap biology lab1
TRANSCRIPT

8/3/2019 AP Biology Lab1
http://slidepdf.com/reader/full/ap-biology-lab1 1/8
Title: AP Biology Lab 1: Diffusion and Osmosis
By: Petrell Vereen
Date: 10/31/11
Purpose: In this lab, we will be investigating the processes of diffusion and osmosis in our ideal
membrane systems as well as investigating effects of solute concentration on water potentialusing plant tissue cells.
Hypothesis: Exercise A) If the concentrations of glucose is higher inside of the cell, then glucose will move
out of the cell into the beaker.
Exercise B) If there is an equal solute concentration inside and outside of the cell, then there will
be no net movement of solute or water in or out of the cell.Exercise C) If water moves into the potato cells, then the water potential of the potato cells is
negative.
Exercise D) N/A
Exercise E) If salt is moving into the cell and water is moving out of the cell, then central vacuolein the plant cell will contract, and lessen pressure against the cell wall.
Procedure:
Exercise A)
1) Get a piece of dialysis tubing presoaked in water. Tie off one end to form a bag.2) Test the glucose-starch solution to check for the presence of glucose.
3) Put some of the solution into the bag and tie off the other end, making sure to leave
room for expansion.
4) Fill a beaker 2/3 full of water and add the IKI solution to the water inside of the
beaker. Test this solution for glucose presence.5) Place the dialysis tubing bag into the beaker.6) Allow 30 minutes to pass, checking for a distinct color change in the bag or the
beaker.
7) Test both the bag and the liquid for glucose presence.Exercise B)
1) Get 6 strips of presoaked dialysis tubing.
2) Tie up one side of each and fill with solutions.
3) Rinse, dry, and record weight of bags.4) Place each bag into a beaker to find the molarity of the solution in the dialysis bags.
5) Fill beakers with enough water to submerge the bags.
6) Wait 30 minutes, then remove bags, and individually mass them.Exercise C)
1) Slice a potato into cores.
2) Pour solution into a beaker.3) Mass and record the cores or discs of potato
4) Let the cores or discs sit in the solutions overnight
5) Remove the potato pieces. Measure and record mass.
6) Calculate percent change in mass, and graph.

8/3/2019 AP Biology Lab1
http://slidepdf.com/reader/full/ap-biology-lab1 2/8
Exercise D)
1) Complete questions on calculation of water potential.
Exercise E)
1) Prepare a wet mount slide of epidermal plant cell. Observe.2) Add salt solution to the slide, observe and record appearance change.
3) Remove cover slip and flood with pure water. Observe and record.
Data:
Exercise A)Table 1.1
Presence of Glucose in Water Through Dialysis Bag
Initial Contents Solution Color Presence of Glucose
Initial Final Initial FinalBag 15% Glucose & 1% Starch Colorless Royal Purple Positive Positive
Beaker H2O & IKI Amber Amber Negative Positive
Exercise B)
Table 1.2
Percent Change in Mass of Dialysis Bags –Group Data
Contents in
Dialysis Bag
Initial Mass(g) Final Mass(g) Mass
Difference(g)
Percent Change
in Mass(%)
0.0 M Distilled
Water
10.58 10.69 .1900 1.040
0.2 M Sucrose 15.25 16.44 1.19 7.803
0.4 M Sucrose 16.50 18.82 2.32 14.06
Solution X 15.73 18.26 2.53 6.217

8/3/2019 AP Biology Lab1
http://slidepdf.com/reader/full/ap-biology-lab1 3/8
Table 1.3
Content
in
Dialysis
Bag
Group
1(%Δg)
Group
2(%Δg)
Group
3(%Δg)
Group
4(%Δg)
Group
5(%Δg)
Group
6(%Δg)
Total
(%Δg)
Class
Average
(%Δg)
0.0 MDistilled
Water
1.040 1.560 3.049 5.649 1.883
0.2 MSucrose
7.803 4.760 5.630 18.193 6.064
0.4 MSucrose
14.06 11.62 11.51 37.19 12.40
0.6 MSucrose
15.85 11.66 9.680 37.19 12.40
0.8 M
Sucrose
16.59 5.879 21.35 43.82 14.61
1.0 M
Sucrose
23.12 24.12 27.85 75.09 25.03
Graph 1.1---- Percent Change vs. Sucrose Molarity
8/3/2019 AP Biology Lab1
http://slidepdf.com/reader/full/ap-biology-lab1 4/8
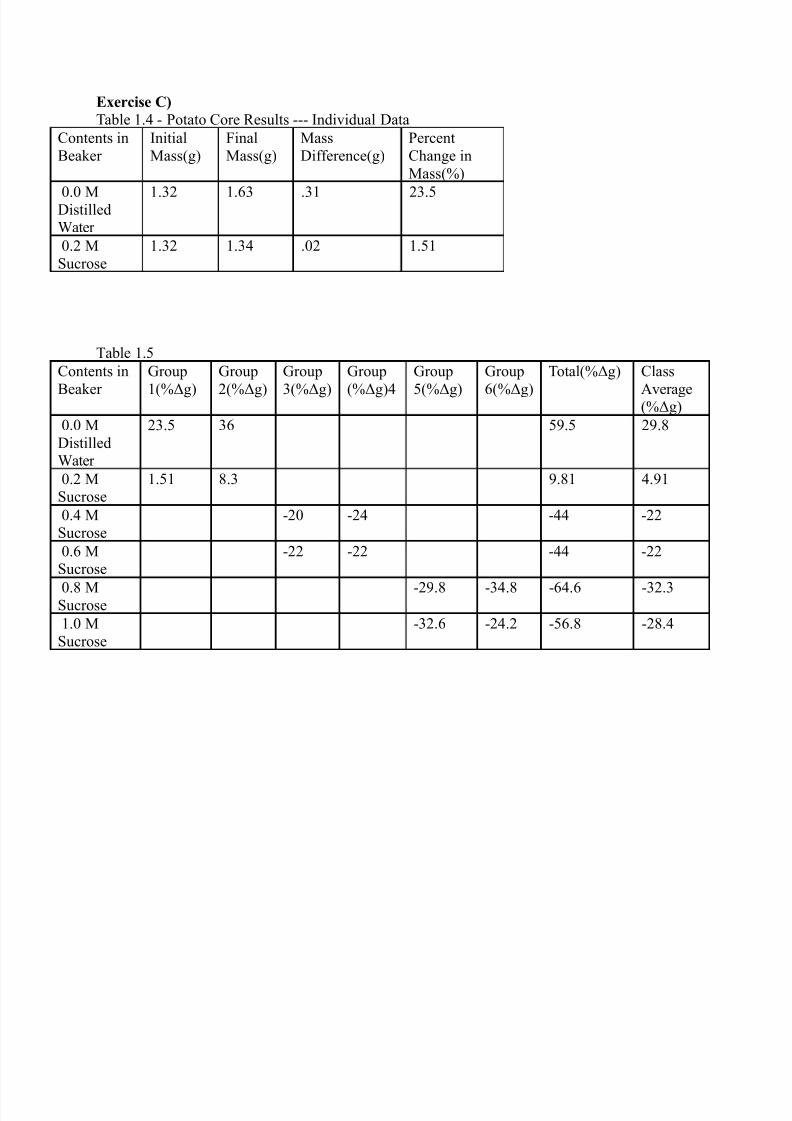
Exercise C)
Table 1.4 - Potato Core Results --- Individual Data
Contents in
Beaker
Initial
Mass(g)
Final
Mass(g)
Mass
Difference(g)
Percent
Change in
Mass(%)
0.0 MDistilledWater
1.32 1.63 .31 23.5
0.2 M
Sucrose
1.32 1.34 .02 1.51
Table 1.5
Contents in
Beaker
Group
1(%Δg)
Group
2(%Δg)
Group
3(%Δg)
Group
(%Δg)4
Group
5(%Δg)
Group
6(%Δg)
Total(%Δg) Class
Average(%Δg)
0.0 M
DistilledWater
23.5 36 59.5 29.8
0.2 MSucrose
1.51 8.3 9.81 4.91
0.4 MSucrose
-20 -24 -44 -22
0.6 MSucrose
-22 -22 -44 -22
0.8 MSucrose
-29.8 -34.8 -64.6 -32.3
1.0 M
Sucrose
-32.6 -24.2 -56.8 -28.4

8/3/2019 AP Biology Lab1
http://slidepdf.com/reader/full/ap-biology-lab1 5/8
Graph 1.2 ------ Percent Change in Mass vs Sucrose Molarity

8/3/2019 AP Biology Lab1
http://slidepdf.com/reader/full/ap-biology-lab1 6/8
Exercise D)
Percent Change in Mass Sucrose Molarity
20% Distilled Water
10% 0.2M
-3% 0.4M
-17% 0.6M
-25% 0.8M
-30% 1.0M
Graph 1.3
Analysis:

8/3/2019 AP Biology Lab1
http://slidepdf.com/reader/full/ap-biology-lab1 7/8
Exercise A)
1) Glucose leaves the bag and IKI enters the bag. The color change inside the bag indicatedIKI present with glucose and starch. When testing for glucose in the beaker, the test was
positive, suggesting the glucose moved into the beaker.
2) Our test results indicated IKI moved from the beaker into the dialysis tubing. Thereaction causes the resulting color change. Movement of IKI was only the result of
osmosis, moving the IKI from higher to lower concentration. The carbohydrate solution
moved out of the bag to achieve the dynamic equilibrium that IKI sought as well.3) Using the initial and final molarities of the carbohydrate solute and IKI solution were
obtained, and then quantitatively, there would be a clear change in solute concentration
inside and outside the bag.
4) Water molecules, IKI molecules, Glucose molecules, and Membrane Pores. Starchmolecules are too big, and therefore impermeable to the dialysis tubing.
Exercise B)
1) The molarity of the sucrose in or out of the cell determines how quickly, where, and howmuch water moves through a membrane. We observed that high solute concentrations
outside a cell will make water move out. While vice-versa causes the water to move in.2) Of each of the bags were placed in a 0.4M Sucrose solution, the masses would all change
differently. 0.0, and 0.2M Sucrose inside the bags would lose mass while 0.4M would
stay relatively stagnant. Above 0.4M everything would gain mass due to the higher water
concentration gradient favoring the exterior of the cell.3) Percent change in mass was calculated by using the difference in mass divided by the
initial mass to show how much water was gained or lost through unequal water
concentrations, driving osmosis, whereas the difference wouldn’t give any reference tothe initial mass.
4)
Initial
Mass(g)
Final Mass(g) Mass
Difference(g)
Percent Change in Mass(%Δg)
20.0 18.0 2.0 18 – 20 = 2 ; 2 / 20 = 0.10 ; 0.10 x 100 = 10% Δg
5) The sucrose solution would be hypotonic to the distilled water in the bag.
Exercise C)
10: Molar Concentration of Sucrose:Group: 0.4M
Exercise D)
Water Potential from Experimental Data:Group: -1(0.4 mole / liter) (0.0831 liter bar / mole °K) (295°K) = -9.801 bars
1) The water potential of the potato core would decrease due to the loss of water during
evaporation.
2) The solute concentration of the plant cell is hypertonic due to the solute concentration being higher than the water concentration.
3) 0
4) Dialysis bag

8/3/2019 AP Biology Lab1
http://slidepdf.com/reader/full/ap-biology-lab1 8/8
5) Out of, because water always moves from higher water potential to lower.
7b) ~0.375M
8)a) Solute Potential = -1(0.375 mole / liter)(0.0831 liter bar / mole °K)(295°K) = -9.193 bars
b) Water Potential = 0 + -9.193 = -9.193 bars
9) Providing more solute to a solution increases water potential.10)
a) Distilled Water
b) Distilled Water c) The red blood cells would swell because of the water moving into the cell because of
the higher water potential outside of the cell than inside.
Exercise E)Procedure:
1) Prepare a wet mount of plant cell. Observe and describe appearance.
2) Add NaCl solution to wet mount. Observe.
3) Remove cover slip and flood cells with fresh water. Observe.
Analysis of Results:
1) Plasmolysis is the pulling away of the cell membrane from the cell wall due to
reduced turgor pressure from the central vacuole.2) The cells plasmolysized because the water potential inside of the cell was greater
than outside, making the water from the cell diffuse out.
3) Water from the snow and rain mix with salt on the roads which then kill plants andgrasses nearby with runoff from the roads.
Conclusion:
In this lab, we observed passive transport through a model membrane in the form of a
dialysis tubing bag. I right for my hypothesis for Exercise A. Glucose moved out of the
membrane by diffusion. My hypothesis for Exercise B was correct also. We observed the bagsgetting heavier over the course of 30 minutes. I was also correct in my hypothesis for Exercise
C. My hypothesis for Exercise E turned out to be correct also. The plant cells, when salt was
added, plasmolysized. When large amounts of water were introduced, the cells swelled and
became rigid again.Our results turned out to be consistent with the theory of osmosis and diffusion. When
water potential was higher one place than another, water and solute moved in or out until
dynamic equilibrium was reached.