ap chemistry course planning and pacing guide 2 - college board
TRANSCRIPT

AP® ChemistryCourse Planning and Pacing Guide 2
Jamie BenignaThe Roeper SchoolBirmingham, Michigan
© 2012 The College Board. College Board, Advanced Placement Program, AP, AP Central, SAT and the acorn logo are registered trademarks of the College Board. All other products and services may be trademarks of their respective owners. Visit the College Board on the Web: www.collegeboard.org.

iiAP Chemistry ■ Course Planning and Pacing Guide 2 © 2012 The College Board.
About the College Board
The College Board is a mission-driven not-for-profit organization that connects students to college success and opportunity. Founded in 1900, the College Board was created to expand access to higher education. Today, the membership association is made up of over 6,000 of the world’s leading educational institutions and is dedicated to promoting excellence and equity in education. Each year, the College Board helps more than seven million students prepare for a successful transition to college through programs and services in college readiness and college success — including the SAT® and the Advanced Placement Program®. The organization also serves the education community through research and advocacy on behalf of students, educators and schools.
For further information, visit www.collegeboard.org.
AP Equity and Access Policy
The College Board strongly encourages educators to make equitable access a guiding principle for their AP programs by giving all willing and academically prepared students the opportunity to participate in AP. We encourage the elimination of barriers that restrict access to AP for students from ethnic, racial and socioeconomic groups that have been traditionally underserved. Schools should make every effort to ensure their AP classes reflect the diversity of their student population. The College Board also believes that all students should have access to academically challenging course work before they enroll in AP classes, which can prepare them for AP success. It is only through a commitment to equitable preparation and access that true equity and excellence can be achieved.
Welcome to the AP® Chemistry Course Planning and Pacing Guides
This guide is one of four course planning and pacing guides designed for AP® Chemistry teachers. Each provides an example of how to design instruction for the AP course based on the author’s teaching context (e.g., demographics, schedule, school type, setting).
These course planning and pacing guides highlight how the components of the AP Chemistry Curriculum Framework — the learning objectives, big ideas, conceptual understandings, and science practices — are addressed in the course. Each guide also provides valuable suggestions for teaching the course, including the selection of resources, instructional activities, laboratory investigations, and assessments. The authors have offered insight into the why and how behind their instructional choices — displayed in boxes along the right side of the individual unit plans — to aid in course planning for AP Chemistry teachers. Additionally, each author explicitly explains how he or she manages course breadth and increases depth for each unit of instruction.
The primary purpose of these comprehensive guides is to model approaches for planning and pacing curriculum throughout the school year. However, they can also help with syllabus development when used in conjunction with the resources created to support the AP Course Audit: the Syllabus Development Guide and the four Annotated Sample Syllabi. These resources include samples of evidence and illustrate a variety of strategies for meeting curricular requirements.
iiiAP Chemistry ■ Course Planning and Pacing Guide 2 © 2012 The College Board.
Contents
Instructional Setting . . . . . . . . . . . . . . . . . . . . . . . . . . . . . . . . . . . . . . . . . . . . . . . . 1
Overview of the Course . . . . . . . . . . . . . . . . . . . . . . . . . . . . . . . . . . . . . . . . . . . . 2
Big Ideas and Science Practices . . . . . . . . . . . . . . . . . . . . . . . . . . . . . . . . . . . 3
Managing Breadth and Increasing Depth . . . . . . . . . . . . . . . . . . . . . . . . . . 5
Course Planning and Pacing by Unit
Unit 1: The Structure of Matter . . . . . . . . . . . . . . . . . . . . . . . . . . . . . . . . . . . . . . . 7
Unit 2: Stoichiometry and Reactions in Solution . . . . . . . . . . . . . . . . . . . . . . . . . 11
Unit 3: Chemical Energy and Thermochemistry . . . . . . . . . . . . . . . . . . . . . . . . . . 18
Unit 4: Atomic Structure and Periodicity . . . . . . . . . . . . . . . . . . . . . . . . . . . . . . . 22
Unit 5: Bonding . . . . . . . . . . . . . . . . . . . . . . . . . . . . . . . . . . . . . . . . . . . . . . . . . . . 24
Unit 6: States of Matter and Interparticle Forces . . . . . . . . . . . . . . . . . . . . . . . . 27
Unit 7: Rates of Chemical Reactions . . . . . . . . . . . . . . . . . . . . . . . . . . . . . . . . . . 35
Unit 8: Equilibrium . . . . . . . . . . . . . . . . . . . . . . . . . . . . . . . . . . . . . . . . . . . . . . . . 39
Unit 9: Entropy and Free Energy . . . . . . . . . . . . . . . . . . . . . . . . . . . . . . . . . . . . . . 49

ivAP Chemistry ■ Course Planning and Pacing Guide 2 © 2012 The College Board.
Contents (continued)
Unit 10: Electrochemistry . . . . . . . . . . . . . . . . . . . . . . . . . . . . . . . . . . . . . . . . . . . 52
Resources. . . . . . . . . . . . . . . . . . . . . . . . . . . . . . . . . . . . . . . . . . . . . . . . . . . . . . . . . 56

1AP Chemistry ■ Course Planning and Pacing Guide 2 © 2012 The College Board.
Instructional Setting
The Roeper School Birmingham, Michigan
School The Roeper School is an independent, coeducational day school for gifted students, ranging from preschool through 12th grade.
Student population The Roeper School draws students from four neighboring counties and has a commitment to developing and serving a diverse student population:
• 71 percent Caucasian• 14 percent African American• 8 percent multiracial• 3 percent Asian American• 3 percent Middle Eastern• 1 percent Hispanic
The overwhelming majority of our students continue to a postsecondary college or university (over 98 percent of graduates). Close to 40 percent of students receive some level of financial aid. The total enrollment of the school is 560 students.
Instructional time Classes begin the day after Labor Day. The school is on an alternating day schedule, and the AP® Chemistry class meets for 90 minutes on “A” days and 45 minutes on “B” days, five days a week. This results in an average of 340 minutes of class time per week. The course meets for two semesters, concluding in the first week of June, with 160 instructional days.
Student preparation Students have a great deal of choice in their courses, and we do not prescribe course sequences; most students, however, elect to take biology in ninth grade and chemistry in 10th grade. The prerequisite for AP Chemistry is successful completion of Introductory Chemistry and Algebra II. Students gain extensive laboratory experience in Introductory Chemistry, completing at least 15 labs per semester. The AP Chemistry course is offered every year.
Textbooks and lab manuals
Zumdahl, Steven S., and Susan Arena Zumdahl. Chemistry. 7th ed. Boston: Houghton Mifflin, 2007.
2AP Chemistry ■ Course Planning and Pacing Guide 2 © 2012 The College Board.
Overview of the Course
Approach Adopted
The new curriculum framework for AP® Chemistry focuses on a greater depth of student understanding, with sensitivity to concept interrelatedness. The framework emphasizes moving students beyond formulaic algorithms and focusing instead on conceptual reasoning and deep understanding in order to develop a robust foundation for further studies in chemistry and other scientific disciplines. Students should be comfortable using pictorial representations, graphs, mathematics, and laboratory investigations to build knowledge and apply concepts to new situations.
To integrate the new curriculum strands, teachers can update their curricula through two approaches: build thematic units centered on each big idea, or build on the sequence traditionally presented in most current textbooks, supplementing with external resources when needed. The latter approach is taken in this planning guide, as it requires less retooling of current practices and allows the instructor to continue with a current textbook. This approach also allows for reinforcement of core concepts periodically throughout the year, and allows students to connect overarching principles that interrelate across different conceptual strands.
Guiding Philosophy
Inquiry is a central focus of the new course, and inquiry permeates my instructional strategies: laboratories, demonstrations, class activities, and lessons can quickly and easily be adapted to emphasize questioning and student-directed discovery of information. If the teacher’s mindset is less on giving students information and more on helping students find information, then student inquiry drives the course. I find it critically important to incorporate how students’ daily experiences relate to the various concepts that we study in class. I insist that my students tell me not only the answer, but also how they know that their answer is correct.
Chemistry is a laboratory-based science, and we have come to understand the nature of the chemical world around us through questioning,
experimentation, and analysis. Likewise, students should engage in laboratory investigations to gain both laboratory skills and inquiry skills. Research scientists constantly invent new ways to answer the questions they develop, and our students should exhibit similar creativity in their investigations into the chemical world around them. To this end, I often rewrite published lab procedures to incorporate varying levels of inquiry, and I often require students to analyze how adjusting a procedure could allow for better data collection. At least 25 percent of instructional time is spent in hands-on laboratory experiences.
When I think about chemistry, I visualize it as an interaction between particles: collisions, reactions, relative motion, rearrangement, and modification. My students do not come into my class “seeing” chemistry, so I focus on helping them visualize what happens on the particulate level in chemical and physical processes. Through experimentation, demonstrations, drawing, and analogies I help my students link what they observe on the macroscopic level to the particle-level interactions that cause it to happen.
Formative Assessment and Instruction Differentiation
Questions drive my instruction. I present new information through asking questions. If the class cannot answer a question, I ask a more basic question followed by leading questions until the class can answer the original question. I present new information in 10–15 minute intervals, coupling new instruction with relevant demonstrations, particulate-level animations, and practice problems. Answers are provided for practice problems, and a class thumbs-up/thumbs-down vote lets me know whether to explain the concept differently or introduce a new idea. While students work collaboratively on problems, I circulate and provide assistance to groups that need additional instruction or strategies for problem solving. We review homework problems at the beginning of class, which allows for clarification when needed. Students often reveal their level of understanding through their questions; those questions are my best guide for future instruction.

3AP Chemistry ■ Course Planning and Pacing Guide 2 © 2012 The College Board.
Big Ideas and Science Practices
AP Chemistry Big Ideas
Big Idea 1: The chemical elements are fundamental building materials of matter, and all matter can be understood in terms of arrangements of atoms. These atoms retain their identity in chemical reactions.
Big Idea 2: Chemical and physical properties of materials can be explained by the structure and the arrangement of atoms, ions, or molecules and the forces between them.
Big Idea 3: Changes in matter involve the rearrangement and/or reorganization of atoms and/or the transfer of electrons.
Big Idea 4: Rates of chemical reactions are determined by details of the molecular collisions.
Big Idea 5: The laws of thermodynamics describe the essential role of energy and explain and predict the direction of changes in matter.
Big Idea 6: Any bond or intermolecular attraction that can be formed can be broken. These two processes are in a dynamic competition, sensitive to initial conditions and external perturbations.
Science Practices for AP Chemistry
A practice is a way to coordinate knowledge and skills in order to accomplish a goal or task. The science practices enable students to establish lines of evidence and use them to develop and refine testable explanations and predictions of natural phenomena. These science practices capture important aspects of the work that scientists engage in, at the level of competence expected of AP Chemistry students.
Science Practice 1: The student can use representations and models to communicate scientific phenomena and solve scientific problems.
1.1 The student can create representations and models of natural or man-made phenomena and systems in the domain.
1.2 The student can describe representations and models of natural or man-made phenomena and systems in the domain.
1.3 The student can refine representations and models of natural or man-made phenomena and systems in the domain.
1.4 The student can use representations and models to analyze situations or solve problems qualitatively and quantitatively.
1.5 The student can re-express key elements of natural phenomena across multiple representations in the domain.
Science Practice 2: The student can use mathematics appropriately.
2.1 The student can justify the selection of a mathematical routine to solve problems.
2.2 The student can apply mathematical routines to quantities that describe natural phenomena.
2.3 The student can estimate numerically quantities that describe natural phenomena.
Science Practice 3: The student can engage in scientific questioning to extend thinking or to guide investigations within the context of the AP course.
3.1 The student can pose scientific questions.3.2 The student can refine scientific questions.3.3 The student can evaluate scientific questions.
Science Practice 4: The student can plan and implement data collection strategies in relation to a particular scientific question.
4.1 The student can justify the selection of the kind of data needed to answer a particular scientific question.
4.2 The student can design a plan for collecting data to answer a particular scientific question.
4.3 The student can collect data to answer a particular scientific question.4.4 The student can evaluate sources of data to answer a particular scientific
question.

4AP Chemistry ■ Course Planning and Pacing Guide 2 © 2012 The College Board.
Big Ideas and Science Practices (continued)
Science Practice 5: The student can perform data analysis and evaluation of evidence.
5.1 The student can analyze data to identify patterns or relationships.5.2 The student can refine observations and measurements based on data
analysis.5.3 The student can evaluate the evidence provided by data sets in relation to
a particular scientific question.
Science Practice 6: The student can work with scientific explanations and theories.
6.1 The student can justify claims with evidence.6.2 The student can construct explanations of phenomena based on evidence
produced through scientific practices.6.3 The student can articulate the reasons that scientific explanations and
theories are refined or replaced.6.4 The student can make claims and predictions about natural phenomena
based on scientific theories and models.6.5 The student can evaluate alternative scientific explanations.
Science Practice 7: The student is able to connect and relate knowledge across various scales, concepts, and representations in and across domains.
7.1 The student can connect phenomena and models across spatial and temporal scales.
7.2 The student can connect concepts in and across domain(s) to generalize or extrapolate in and/or across enduring understandings and/or big ideas.

5AP Chemistry ■ Course Planning and Pacing Guide 2 © 2012 The College Board.
Managing Breadth and Increasing Depth
Unit Managing Breadth Increasing DepthUnit 1: The Structure of Matter
Since this is mostly review from the Introductory Chemistry course, breadth is not much of a consideration for this short unit.
Students are asked to think of all of the systems that we encounter on the molecular level in this unit. We focus greatly on visualizing processes and building mental models that connect the submicroscopic level to the macroscopic observations that we make in class. Students also deepen their understanding of precision and improving precision in the lab. This unit concludes with a review of the mole concept and introduces the use of mass spectrometry to confirm the existence of isotopes and provide a deeper understanding of how we determine the molar masses of elements. The introduction of the mole concept provides a bridge to the next unit of study: stoichiometry.
Unit 2: Stoichiometry and Reactions in Solution
Balancing redox equations in acidic and basic solutions is no longer a part of the course, nor is memorization of solubility rules (other than knowing that sodium, potassium, and ammonium ions are always soluble, as are nitrates). Later in the year, Ksp will be used to describe solubility more quantitatively. Students are no longer required to have a vast memorized knowledge of certain patterns in reactivity, so they can focus more on translating between observed phenomena, laboratory data, and balanced equations. Assigning the terms “oxidizing agent” and “reducing agent” is no longer required, and this reduces some confusion on the students’ part.
Students are asked to describe why some compounds are more soluble than others, based on ion charge and radius. The strength of Coulombic attractions is a theme carried throughout the course. Students must reason at the particulate level a great deal in this unit. Also, providing the opportunity for students to view as well as draw particle-level animations will help students to connect macroscopic observations with the particle-level interactions that are responsible.
Unit 3: Chemical Energy and Thermochemistry
Energy is fundamental to the study of chemistry, so there has not been much content removed from this section of the curriculum. The use of standard enthalpies in order to calculate the enthalpy of a reaction is minimized in favor of using bond energy calculations, which are more intuitive for students. The formal definition of enthalpy is not stressed, and discussion of state functions has been eliminated (this concept usually brought more confusion than clarity to my students).
The focus is on the balance of energy needed to break existing bonds and the energy released by forming new bonds as the reason for processes being endothermic or exothermic. The law of conservation of energy permeates this section, and students are attuned to how energy can move from one system to another based on particle collisions. This is reinforced in Unit 6, in which kinetic molecular theory is used to increase student understanding of the properties of various states of matter. These concepts will be revisited and deepened in Unit 9 (thermodynamics), when the concepts of entropy and free energy are added to the students’ understanding of enthalpy.
Unit 4: Atomic Structure and Periodicity
The removal of exceptions to the Aufbau filling rules, assigning quantum numbers, and discussion of the wave nature of electrons has narrowed the scope of the course. These topics often cause great confusion for students. (In fact, the models are so complex, they must be solved with the help of a computer.) Memorization of Pauli exclusion principles, de Broglie wavelength, Heisenberg’s uncertainty principle, and the Bohr equation for the hydrogen atom are not required.
Students focus on data that support the shell model of the atom and tie this data to the arrangement of the modern periodic table. Students look at ionization energy data and PES data, which complement each other. Ionization energy data and PES data can also be investigated for ion formation and patterns among elements in the same group of the periodic table. The theme of Coulombic attractions as a way of explaining atomic-level phenomena continues through this unit: the primary forces responsible for atomic radius, ionization energy, and electron shielding are the attractive force from the nucleus and the repulsive force from the other electrons.
Unit 5: Bonding The molecular orbital theory has not been a part of the course for many years, but the concepts of bond order and delocalization of electrons in pi bonding remain. The hybridization model has been reduced to only include sp, sp2, and sp3 hybridization, as recent evidence suggests that using the dsp3 and d2sp3 hybridized orbital model to describe covalent molecules is inaccurate.
Students dig deeper into the molecular structure by considering expanded octets (without the potentially erroneous hybridization descriptions) and conjugated pi bonding systems, which allow for resonance structures. We discuss why double and triple bonds do not allow for rotation, and why the bond energy required to break a pi bond is less than that for a sigma bond. This primes students for organic chemistry in the future, and it ties together concepts from Unit 3. The energetics of bond formation are reinforced in this unit, and Coulombic attractions carry through as a central theme.

6AP Chemistry ■ Course Planning and Pacing Guide 2 © 2012 The College Board.
Managing Breadth and Increasing Depth (continued)
Unit Managing Breadth Increasing DepthUnit 6: States of Matter and Interparticle Forces
The largest deletion of content occurred in the “Solutions” section of the course. Colligative properties are no longer included, and this shows a large modernization of the course. Determining molar mass by freezing point depression is simply not a lab procedure that is necessary in a world with mass spectrometers. Also, the margin of error on those lab procedures often reached 30 percent, which is completely unacceptable given the precision of modern instrumentation. With the deletion of colligative properties, other units of concentration like molality are unnecessary. In the gases section, calculation with the Van der Waals equation is unnecessary, although students should understand the qualitative reasons why real gases deviate from ideal behavior (and that these deviations are small under most laboratory conditions).
With the omission of colligative properties, much time is saved in the course. This time is used to explore other topics in greater depth in other units. In this unit, metallic bonding is explored in much greater depth than before, and the focus on the solid state opens students’ minds to the world of materials science, which is a rapidly expanding and relevant field of study. A huge part of the unit involves looking at interparticle attractions of varying types: dispersion forces, dipole attractions, hydrogen bonding, metallic bonding, network covalent bonding, and network ionic bonding. Past AP Exam questions have revealed high levels of misunderstanding of these very important concepts, which become key factors in understanding future course work like biology, organic chemistry, and biochemistry.
Unit 7: Rates of Chemical Reactions
Students learn a basic model of collision theory in their Introductory Chemistry course, and they build on that fundamental knowledge in this unit. By reducing the amount of algorithmic problem solving in this unit (e.g., using the Arrhenius equation to determine activation energy, using integrated rate laws as a stand-alone exercise), students have fewer equations to keep in mind.
Students can design their own elementary experiment or modify previously established protocols to gain valuable understanding of the factors that influence the reaction rate. Linear regression is introduced as a statistical method that can be used to determine the rate order for a chemical process. Mechanisms are used as the primary method of investigating why a reaction rate is controlled by factors like concentration and the presence of a catalyst. Real-world applications like the catalytic decomposition of the ozone layer, the function of an automobile’s catalytic converter, and enzyme function bring both depth and relevance to this unit. This unit focuses heavily on students using particulate-level reasoning to explain observed phenomena, and that greatly deepens the connections across spatial and temporal scales.
Unit 8: Equilibrium The removal of the Lewis acid-base definition reduces a source of confusion and common mistakes from the course. The mathematics are heavily reduced in the solubility and complex ion equilibria, and the focus in acid-base equilibrium is much more on particulate-level reasoning and less on algorithmic number-crunching to obtain a value of pH.
The connections between kinetics and equilibrium provide a nice segue from Unit 7 to Unit 8. The solubility equilibria refresh concepts from the beginning of the year and help to start the process of reviewing for the AP Exam. Titrations are reexamined through the lens of pH and weak ionization of acids and bases. Particle-level reasoning is emphasized heavily in this unit, as many of the processes (acid-base reactions, gas equilibrium) do not often show very visible macroscopic changes.
Unit 9: Entropy and Free Energy
Students are required to do less mathematical computation in this unit, and the calculation of ΔG from ΔG° and the reaction quotient is no longer required. These tended to become algorithmic exercises for many of my students.
Time is spent evaluating systems from a particle standpoint (greater or less dispersion) and comparing the relative magnitudes of the enthalpy change to the entropy change. Students go deeper into the coupling of reactions to make unfavorable reactions favorable, which is hugely important in biological systems. This also prepares students for the next unit, when students look at electrolytic cells.
Unit 10: Electrochemistry
Eliminating the Nernst equation reduces a lot of number-crunching and allows students to focus on the qualitative reasons why concentration can affect voltage.
In our current electricity-driven world, this unit provides some of the most important applications to students’ daily lives. The reductions in scope elsewhere in the curriculum will allow me to delve deeper into these concepts, which integrate many other units from the year. This provides a nice cap to the content as well as a jump start on reviewing for the AP Exam.

7 © 2012 The College Board.AP Chemistry ■ Course Planning and Pacing Guide 2
Unit
1:
The Structure of Matter Laboratory Investigations:•Thickness of Aluminum Foil (guided inquiry)
Estimated Time: 1 week
Essential Questions:
▼ Knowing that error is unavoidable in experimentation, what margins of error are acceptable for experimental results to be considered reliable? ▼ Is every number that a measuring device provides actually reliable? ▼ How do the bonding structures between atoms and molecules influence how materials appear and behave at the macroscopic level? ▼ Why can seawater be purified through boiling and distillation, and what are the social and geographic implications of an accessible desalination system?
Learning Objectives Materials Instructional Activities and AssessmentsPredict the type of bonding present between two atoms in a binary compound based on position in the periodic table and the electronegativity of the elements. [LO 2.17, SP 6.4]
Create visual representations of ionic substances that connect the microscopic structure to macroscopic properties, and/or use representations to connect the microscopic structure to macroscopic properties (e.g., boiling point, solubility, hardness, brittleness, low volatility, lack of malleability, ductility, or conductivity). [LO 2.19, SP 1.1, SP 1.4, SP 7.1, connects to 2.D.1, 2.D.2]
Create a representation of an ionic solid that shows essential characteristics of the structure and interactions present in the substance. [LO 2.23, SP 1.1]
Explain a representation that connects properties of an ionic solid to its structural attributes and to the interactions present at the atomic level. [LO 2.24, SP 1.1, SP 6.2, SP 7.1]
Zumdahl and Zumdahl, Chapter 1: “Chemical Foundations” and Chapter 2: “Atoms, Molecules, and Ions”
Instructional Activity:
I demonstrate a model of ionic bonding. First, I put opaque adhesive tape on top of disk magnets to make “+” and “-” signs, being sure to affix the tape on opposite sides for the differing charges (so that opposite ions have opposite magnetic polarity when arranged on a flat surface). I arrange the ions in an alternating array on the overhead projector to show the structure of an ionic crystal. We can then talk about malleability/brittleness, and why distorting an ionic crystal causes shattering. This also allows the introduction of Coulombic forces in a very visual and memorable way. Homework exercises and in-class practice problems are excerpted from the relevant chapters to the left. Students are required to predict and identify the bonding in binary compounds using periodic trends.
This same setup can be used later in the year to show why negative ions are larger than their neutral atoms, as having a circle of negative ions and adding one or two more causes them to move apart.

8 © 2012 The College Board.AP Chemistry ■ Course Planning and Pacing Guide 2
Unit
1:
The Structure of Matter (continued)
Learning Objectives Materials Instructional Activities and AssessmentsUse aspects of particulate models (i.e., particle spacing, motion, and forces of attraction) to reason about observed differences between solid and liquid phases and among solid and liquid materials. [LO 2.3, SP 6.4, SP 7.1]
Draw and/or interpret representations of solutions that show the interactions between the solute and solvent. [LO 2.8, SP 1.1, SP 1.2, SP 6.4]
Ethanol, water, long glass tube and rubber stoppers to fit
Instructional Activity:
I demonstrate the spaces between molecules: First I fill a long glass tube halfway with water and then layer ethanol over the top to fill the tube all but 1 inch full. I have a student mark the liquid level with a permanent marker, and I invert the tube (with my thumb pressed firmly over the top) several times. A noticeable volume decrease occurs, and students hypothesize why. I introduce a model showing the interparticle spacing between ethanol molecules and water molecules. The model takes into account the spacing between molecules and why volume is not a conserved quantity (unlike mass). We review hydrogen bonding as a relevant interparticle force for this demonstration.
Use aspects of particulate models (i.e., particle spacing, motion, and forces of attraction) to reason about observed differences between solid and liquid phases and among solid and liquid materials. [LO 2.3, SP 6.4, SP 7.1]
Water, isopropyl alcohol, ice cubes, two beakers
Instructional Activity:
I place an ice cube into a beaker of a clear, colorless liquid, and it floats. I place another ice cube into a second beaker of a clear, colorless liquid, and it sinks. I then ask students to provide an explanation within a small group. Groups share their explanations with the rest of the class, and we evaluate whether each explanation accounts for the observation and makes sound chemical sense.
Design and/or interpret the results of a separation experiment (filtration, paper chromatography, column chromatography, or distillation) in terms of the relative strength of interactions among and between the components. [LO 2.10, SP 4.2, SP 5.1, SP 6.4]
Solution of copper (II) sulfate, ethanol, and water, distillation apparatus, Bunsen burner, boiling stones
Web“Distillation”
Instructional Activity:
I demonstrate distillation as a method of separating a mixture. The live demonstration is followed by viewing the online animation in class. We review the reasons for differing values in boiling points from what the students encountered in their Introductory Chemistry class, and we expand on those reasons to include interparticle attractions in metals, ionic compounds, and network covalent solids. I ask students why paper filtration would not be effective for separating the components of this mixture using particle level reasoning. As a class, we discuss their responses.
Essential Questions:
▼ Knowing that error is unavoidable in experimentation, what margins of error are acceptable for experimental results to be considered reliable? ▼ Is every number that a measuring device provides actually reliable? ▼ How do the bonding structures between atoms and molecules influence how materials appear and behave at the macroscopic level? ▼ Why can seawater be purified through boiling and distillation, and what are the social and geographic implications of an accessible desalination system?

9 © 2012 The College Board.AP Chemistry ■ Course Planning and Pacing Guide 2
Learning Objectives Materials Instructional Activities and AssessmentsDesign and/or interpret the results of a separation experiment (filtration, paper chromatography, column chromatography, or distillation) in terms of the relative strength of interactions among and between the components. [LO 2.10, SP 4.2, SP 5.1, SP 6.4]
Formative Assessment:
I present students with other mixtures, and they brainstorm methods to separate them. They share their proposals with the rest of the class, and we debate the merits of each method collectively.
Connect the number of particles, moles, mass, and volume of substances to one another, both qualitatively and quantitatively. [LO 1.4, SP 7.1]
Select and apply mathematical routines to mass data to identify or infer the composition of pure substances and/or mixtures. [LO 1.2, SP 2.2]
Aluminum foil (cut in 4-cm squares), analytical balance (±0.0001g), millimeter ruler, Vernier caliper, graduated cylinders, water
Formative Assessment:
Students work in small groups to devise an experimental procedure to determine how many atoms thick a sheet of aluminum foil is. Students decide which measurements to take and how to process the data. They must determine the thickness to three significant figures. A variety of thicknesses of aluminum foil can be used for this experiment if you want groups to get different results. Other metals can be used as well (copper sheeting, tin foil, etc.). Several approaches work for this lab, including folding the foil multiple times and measuring the thickness, or using the density of aluminum and the mass to find the height. The multiple possibilities make for a valuable inquiry experience.
Summative Assessment:
Students construct formal lab write-ups. They must show all procedural steps used and correctly track the collected data to a final calculated value. In their error analyses, they must reflect on the limitations on their precision as well as propose improvements to their procedures that could yield more precise data or a better calculated value.
This lab is geared more toward learning how to design experiments and focuses much less on learning science content. Since each group (rather than each student) devises a procedure, I have time and flexibility in class to circulate throughout the room and provide feedback on their work. This allows me to provide individualized instruction for the groups with varying levels of comfort and competency with experimental design.
The lab report analysis addresses the essential question, Knowing that error is unavoidable in experimentation, what margins of error are acceptable for experimental results to be considered reliable?
Unit
1:
The Structure of Matter (continued)
The quality of the proposed separation techniques determines whether more instruction is needed. The debate/discussion here occurs between student groups, and I add information or feedback as the conversation unfolds. I steer students back to relevant discussion if they wander off track. Some years I need to say very little at all, as the students have already addressed all of the points that I would have made.
Essential Questions:
▼ Knowing that error is unavoidable in experimentation, what margins of error are acceptable for experimental results to be considered reliable? ▼ Is every number that a measuring device provides actually reliable? ▼ How do the bonding structures between atoms and molecules influence how materials appear and behave at the macroscopic level? ▼ Why can seawater be purified through boiling and distillation, and what are the social and geographic implications of an accessible desalination system?
10 © 2012 The College Board.AP Chemistry ■ Course Planning and Pacing Guide 2
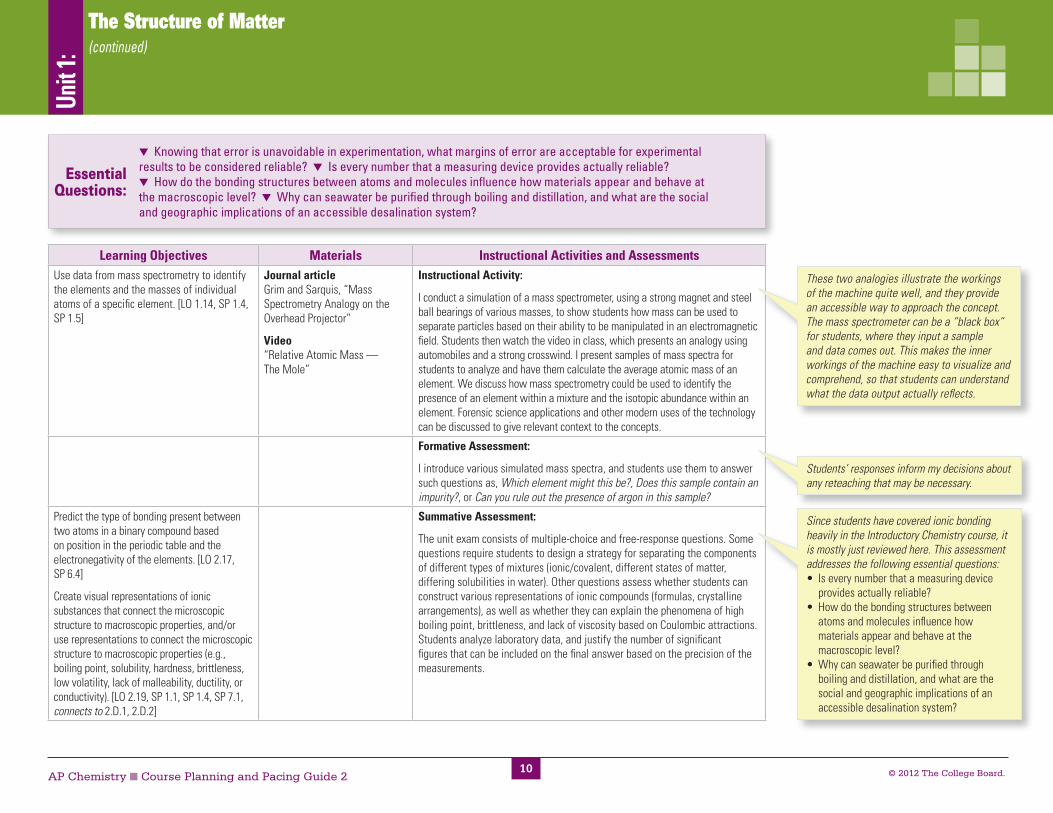
Learning Objectives Materials Instructional Activities and AssessmentsUse data from mass spectrometry to identify the elements and the masses of individual atoms of a specific element. [LO 1.14, SP 1.4, SP 1.5]
Journal articleGrim and Sarquis, “Mass Spectrometry Analogy on the Overhead Projector”
Video“Relative Atomic Mass — The Mole”
Instructional Activity:
I conduct a simulation of a mass spectrometer, using a strong magnet and steel ball bearings of various masses, to show students how mass can be used to separate particles based on their ability to be manipulated in an electromagnetic field. Students then watch the video in class, which presents an analogy using automobiles and a strong crosswind. I present samples of mass spectra for students to analyze and have them calculate the average atomic mass of an element. We discuss how mass spectrometry could be used to identify the presence of an element within a mixture and the isotopic abundance within an element. Forensic science applications and other modern uses of the technology can be discussed to give relevant context to the concepts.
Formative Assessment:
I introduce various simulated mass spectra, and students use them to answer such questions as, Which element might this be?, Does this sample contain an impurity?, or Can you rule out the presence of argon in this sample?
Predict the type of bonding present between two atoms in a binary compound based on position in the periodic table and the electronegativity of the elements. [LO 2.17, SP 6.4]
Create visual representations of ionic substances that connect the microscopic structure to macroscopic properties, and/or use representations to connect the microscopic structure to macroscopic properties (e.g., boiling point, solubility, hardness, brittleness, low volatility, lack of malleability, ductility, or conductivity). [LO 2.19, SP 1.1, SP 1.4, SP 7.1, connects to 2.D.1, 2.D.2]
Summative Assessment:
The unit exam consists of multiple-choice and free-response questions. Some questions require students to design a strategy for separating the components of different types of mixtures (ionic/covalent, different states of matter, differing solubilities in water). Other questions assess whether students can construct various representations of ionic compounds (formulas, crystalline arrangements), as well as whether they can explain the phenomena of high boiling point, brittleness, and lack of viscosity based on Coulombic attractions. Students analyze laboratory data, and justify the number of significant figures that can be included on the final answer based on the precision of the measurements.
Essential Questions:
Students’ responses inform my decisions about any reteaching that may be necessary.
Since students have covered ionic bonding heavily in the Introductory Chemistry course, it is mostly just reviewed here. This assessment addresses the following essential questions:• Is every number that a measuring device
provides actually reliable?• How do the bonding structures between
atoms and molecules influence how materials appear and behave at the macroscopic level?
•Why can seawater be purified through boiling and distillation, and what are the social and geographic implications of an accessible desalination system?
▼ Knowing that error is unavoidable in experimentation, what margins of error are acceptable for experimentalresults to be considered reliable? ▼ Is every number that a measuring device provides actually reliable? ▼ How do the bonding structures between atoms and molecules influence how materials appear and behave at the macroscopic level? ▼ Why can seawater be purified through boiling and distillation, and what are the social and geographic implications of an accessible desalination system?
These two analogies illustrate the workings of the machine quite well, and they provide an accessible way to approach the concept. The mass spectrometer can be a “black box” for students, where they input a sample and data comes out. This makes the inner workings of the machine easy to visualize and comprehend, so that students can understand what the data output actually reflects.
Unit
1:
The Structure of Matter (continued)

11 © 2012 The College Board.AP Chemistry ■ Course Planning and Pacing Guide 2
Learning Objectives Materials Instructional Activities and AssessmentsJustify the observation that the ratio of the masses of the constituent elements in any pure sample of that compound is always identical on the basis of the atomic molecular theory. [LO 1.1, SP 6.1]
Select and apply mathematical routines to mass data to identify or infer the composition of pure substances and/or mixtures. [LO 1.2, SP 2.2]
Zumdahl and Zumdahl, Chapter 3: “Stoichiometry” and Chapter 4: “Types of Chemical Reactions and Solution Stoichiometry”
Various types of chalk (sidewalk, white, colored, art pastels), analytical balance, paper, periodic table with molar masses or CRC Handbook
Formative Assessment:
Students work in pairs to design a procedure to determine the number of formula units of calcium carbonate they use in signing their name with chalk on a surface of their choosing. Students must design a procedure that enables them to get four significant figures in their answer, and they can earn extra credit if they devise a procedure that yields five or more significant figures. Homework exercises and in-class practice problems are excerpted from the relevant chapters to the left. We assume that the chalk is 100 percent CaCO3. This lab illustrates that more precision can be obtained using the same laboratory equipment as long as a greater quantity of material is used.
Select and apply mathematical routines to mass data to identify or infer the composition of pure substances and/or mixtures. [LO 1.2, SP 2.2]
Summative Assessment:
Formal lab write-up (pertaining to the formula units for a chalk signature). Additionally, students must evaluate in their error analyses how the results of the experiment would be different if we did not assume that the chalk is 100 percent calcium carbonate.
Select and apply mathematical routines to mass data to identify or infer the composition of pure substances and/or mixtures. [LO 1.2, SP 2.2]
Use stoichiometric calculations to predict the results of performing a reaction in the laboratory and/or to analyze deviations from the expected results. [LO 3.3, SP 2.2, SP 5.1]
Relate quantities (measured mass of substances, volumes of solutions, or volumes and pressures of gases) to identify stoichiometric relationships for a reaction, including situations involving limiting reactants and situations in which the reaction has not gone to completion. [LO 3.4, SP 2.2, SP 5.1, SP 6.4]
Pan balance (±0.01g), granulated tin (20 mesh), 8 M HNO3, evaporating dish, fume hood, watch glass, Bunsen burner, ring stand, wire gauze
Instructional Activity:
Students react elemental tin with nitric acid and then heat off the extra nitrates as nitrogen dioxide gas in a well-ventilated area. They then use their data to determine the formula for the oxide produced and the oxidation state of tin in the compound.
Essential Questions:
▼ How do we know if a sample is actually pure, and how can we test a solution through chemical reactions to determine the amount of a material present in a mixture? ▼ How do we know that transition metals make ions with different charges? ▼ Why don’t all single and double displacement reactions occur?
This assessment addresses the essential question, How do we know if a sample is actually pure, and how can we test a solution through chemical reactions to determine the amount of a material present in a mixture?
The use of tin requires the students to actually perform the experiment and analyze the data to determine the compound’s formula (unlike using an element like magnesium).
As students work through their experimental designs, I talk with individual groups about their proposed procedures and their limitations before they start the experiment. Very often, several revisions occur before the group can start collecting data. The extra credit option allows me to provide the students who already possess greater skill in experimental design with a greater challenge to pursue, giving me the time to help other students build stronger inquiry skills.
Unit
2:
Stoichiometry and Reactions in Solution
Laboratory Investigations:• Formula Units in a Chalk Signature
(guided inquiry)•Quantitative Determination of an Empirical
Formula of Tin Oxide•Gravimetric Analysis of Silver Purity
•Standardization of NaOH with a Primary Standard Determination of Vitamin C in a Tablet
•Make-Your-Own Activity Series (guided inquiry)•Redox Titrations
Estimated Time: 5 weeks
12 © 2012 The College Board.AP Chemistry ■ Course Planning and Pacing Guide 2
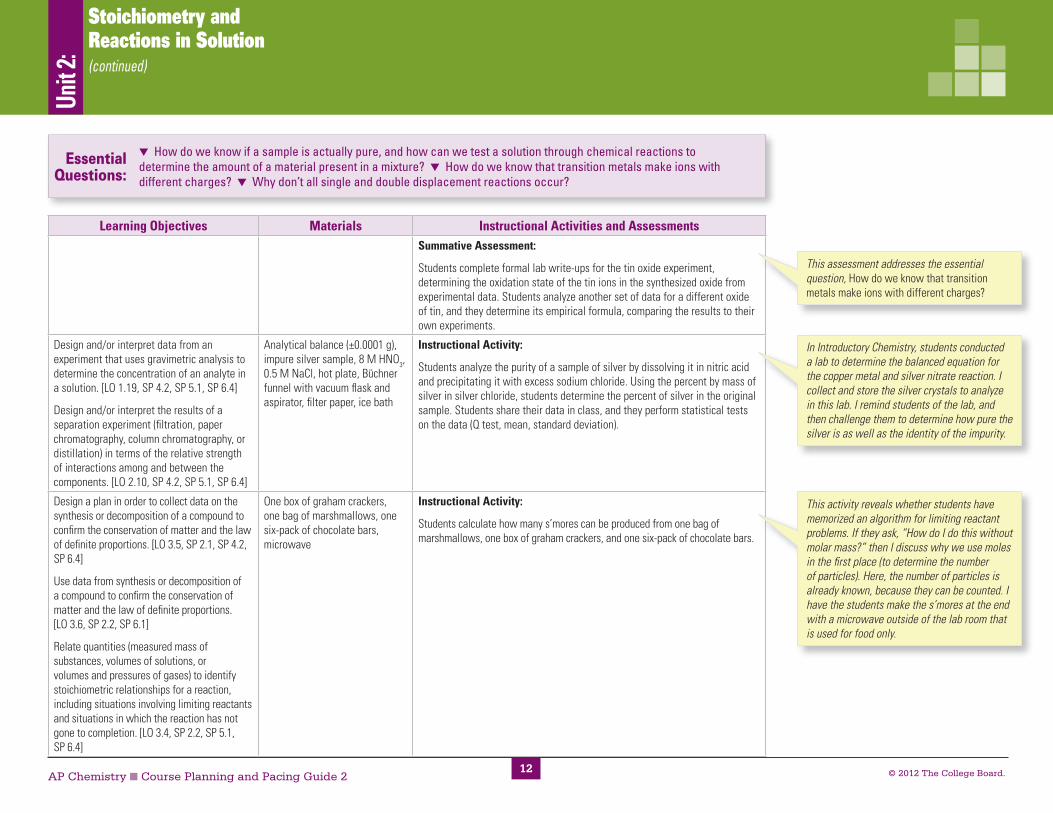
Learning Objectives Materials Instructional Activities and AssessmentsSummative Assessment:
Students complete formal lab write-ups for the tin oxide experiment, determining the oxidation state of the tin ions in the synthesized oxide from experimental data. Students analyze another set of data for a different oxide of tin, and they determine its empirical formula, comparing the results to their own experiments.
Design and/or interpret data from an experiment that uses gravimetric analysis to determine the concentration of an analyte in a solution. [LO 1.19, SP 4.2, SP 5.1, SP 6.4]
Design and/or interpret the results of a separation experiment (filtration, paper chromatography, column chromatography, or distillation) in terms of the relative strength of interactions among and between the components. [LO 2.10, SP 4.2, SP 5.1, SP 6.4]
Analytical balance (±0.0001 g), impure silver sample, 8 M HNO3, 0.5 M NaCl, hot plate, Büchner funnel with vacuum flask and aspirator, filter paper, ice bath
Instructional Activity:
Students analyze the purity of a sample of silver by dissolving it in nitric acid and precipitating it with excess sodium chloride. Using the percent by mass of silver in silver chloride, students determine the percent of silver in the original sample. Students share their data in class, and they perform statistical tests on the data (Q test, mean, standard deviation).
Design a plan in order to collect data on the synthesis or decomposition of a compound to confirm the conservation of matter and the law of definite proportions. [LO 3.5, SP 2.1, SP 4.2, SP 6.4]
Use data from synthesis or decomposition of a compound to confirm the conservation of matter and the law of definite proportions. [LO 3.6, SP 2.2, SP 6.1]
Relate quantities (measured mass of substances, volumes of solutions, or volumes and pressures of gases) to identify stoichiometric relationships for a reaction, including situations involving limiting reactants and situations in which the reaction has not gone to completion. [LO 3.4, SP 2.2, SP 5.1, SP 6.4]
One box of graham crackers, one bag of marshmallows, one six-pack of chocolate bars, microwave
Instructional Activity:
Students calculate how many s’mores can be produced from one bag of marshmallows, one box of graham crackers, and one six-pack of chocolate bars.
Unit
2:
Stoichiometry and Reactions in Solution (continued)
This activity reveals whether students have memorized an algorithm for limiting reactant problems. If they ask, “How do I do this without molar mass?” then I discuss why we use moles in the first place (to determine the number of particles). Here, the number of particles is already known, because they can be counted. I have the students make the s’mores at the end with a microwave outside of the lab room that is used for food only.
In Introductory Chemistry, students conducted a lab to determine the balanced equation for the copper metal and silver nitrate reaction. I collect and store the silver crystals to analyze in this lab. I remind students of the lab, and then challenge them to determine how pure the silver is as well as the identity of the impurity.
This assessment addresses the essential question, How do we know that transition metals make ions with different charges?
Essential Questions:
▼ How do we know if a sample is actually pure, and how can we test a solution through chemical reactions to determine the amount of a material present in a mixture? ▼ How do we know that transition metals make ions with different charges? ▼ Why don’t all single and double displacement reactions occur?

13 © 2012 The College Board.AP Chemistry ■ Course Planning and Pacing Guide 2
Learning Objectives Materials Instructional Activities and AssessmentsDesign, and/or interpret data from, an experiment that uses titration to determine the concentration of an analyte in a solution. [LO 1.20, SP 4.2, SP 5.1, SP 6.4]
Use stoichiometric calculations to predict the results of performing a reaction in the laboratory and/or to analyze deviations from the expected results. [LO 3.3, SP 2.2, SP 5.1]
Relate quantities (measured mass of substances, volumes of solutions, or volumes and pressures of gases) to identify stoichiometric relationships for a reaction, including situations involving limiting reactants and situations in which the reaction has not gone to completion. [LO 3.4, SP 2.2, SP 5.1, SP 6.4]
Burets, buret stand, solid NaOH, deionized water, 1% phenolphthalein solution, potassium hydrogen phthalate (dried), 125 mL Erlenmeyer flasks, analytical balance
Instructional Activity:
Students prepare a solution of NaOH that is approximately 0.1 M. They mass out a sample of dry KHP, and they predict an approximate volume of NaOH that will be required to neutralize it. Students determine the actual molarity to four significant figures, comparing their results to their predicted value of 0.1 M. Students repeat the procedure until three trials are conducted that yield a concentration within 2% of one another. The NaOH solution is stored and used in the next lab.
Burets, buret stand, solid NaOH, deionized water, 1% phenolphthalein solution, potassium hydrogen phthalate (dried), 500-mg vitamin C tablet, 125 mL Erlenmeyer flasks, analytical balance
Formative Assessment:
Students dissolve a 500-mg tablet in warm water and use their standardized NaOH solution to titrate it. Students predict the approximate volume of NaOH that will be required to neutralize all of the vitamin C, and after conducting the titration, they determine the vitamin C content and compare it to the published value. Students account for potential errors in their experiment as well as reasons why their value might not match the published value. Students must account for the effect of consistently titrating past the endpoint as well as not rinsing the buret with the NaOH solution prior to titration. In this procedure, we assume that the only acid in a vitamin C tablet is ascorbic acid.
Identify redox reactions and justify the identification in terms of electron transfer. [LO 3.8, SP 6.1]
Translate among macroscopic observations of change, chemical equations, and particle views. [LO 3.1, SP 1.5, SP 7.1]
Translate an observed chemical change into a balanced chemical equation and justify the choice of equation type (molecular, ionic, or net ionic) in terms of utility for the given circumstances. [LO 3.2, SP 1.5, SP 7.1]
Mossy zinc, solution of 1 M SnCl2 dissolved in 1 M HCl, 400 mL tall form beaker, watch glass (Flinn Scientific Kit — AP 4425)
Instructional Activity:
I coat the bottom of a beaker with mossy zinc and then pour the tin (II) chloride solution over the top. Bubbling occurs immediately and later long, needlelike projections of tin metal appear. As a class, we analyze the redox reactions occurring and identify what is being oxidized and reduced.
Samples of zinc, copper, and lead metal; solutions of 0.1 M Mg(NO3)2, Zn(NO3)2, Cu(NO3)2, Pb(NO3)2, and AgNO3; large well plate, magnifying glass
Instructional Activity:
Students design their own procedure to arrange zinc, copper, lead, magnesium, and silver into a series based on increasing reactivity. For each combination of metal and ionic solution that results in the plating of a metal, students generate a net ionic equation that reflects their observations.
During the lab, I circulate among the students providing tips and adjusting procedures. I give individual feedback on their progress by commenting on their completed lab reports before they take the unit exam. If I see consistent errors across several lab groups, I can address the missed concepts in class the following day.
The primary reason for conducting this experiment is to teach the skill of titration. This enables students to design future experiments involving titrations. Pellet forms of NaOH have some water in them already, so student concentrations are almost always below 0.1 M.
Unit
2:
Stoichiometry and Reactions in Solution (continued)
Essential Questions:
▼ How do we know if a sample is actually pure, and how can we test a solution through chemical reactions to determine the amount of a material present in a mixture? ▼ How do we know that transition metals make ions with different charges? ▼ Why don’t all single and double displacement reactions occur?

14 © 2012 The College Board.AP Chemistry ■ Course Planning and Pacing Guide 214
Learning Objectives Materials Instructional Activities and AssessmentsTranslate among macroscopic observations of change, chemical equations, and particle views. [LO 3.1, SP 1.5, SP 7.1]
Translate an observed chemical change into a balanced chemical equation and justify the choice of equation type (molecular, ionic, or net ionic) in terms of utility for the given circumstances. [LO 3.2, SP 1.5, SP 7.1]
Web“Metal/Metal Ion Reactions: A Laboratory Simulation”
“Metals in Aqueous Solutions”
Formative Assessment:
Prior to turning in their lab reports, students work through an online simulation of various single displacement reactions. The simulation provides excellent atomic-level animations of the reactions, and students translate these particle-level views into net ionic equations. As part of their lab reports, students are asked if they can definitively place tin into their reactivity series, and if not, what other data they would need to make that determination. Students must include balanced net ionic equations for each of the reactions that result in new products.
Design and/or interpret the results of an experiment involving a redox titration. [LO 3.9, SP 4.2, SP 5.1]
Translate an observed chemical change into a balanced chemical equation and justify the choice of equation type (molecular, ionic, or net ionic) in terms of utility for the given circumstances. [LO 3.2, SP 1.5, SP 7.1]
Identify redox reactions and justify the identification in terms of electron transfer. [LO 3.8, SP 6.1]
Web“Redox Titration in Acidic Medium”
Instructional Activity:
Prior to conducting a redox titration in class, students work through a virtual lab procedure investigating various systems of redox titration. The protocol in this lab is used to assess the hydrogen peroxide content of a commercial solution through titration with potassium permanganate. Groups can be assigned a source of peroxide and devise a procedure to measure the peroxide concentration. Different groups can analyze drugstore hydrogen peroxide (3%), hair bleaching solutions (these have a variety of peroxide contents), Oxyclean (dissolved in water), Clear Care contact lens solution (3%), and peroxide solutions that have been exposed to sunlight for a day prior to the lab. The simulation allows multiple trials and can be quickly reset with no chemical waste disposal concerns.
Summative Assessment:
Each group prepares a whiteboard write-up of the experiment documenting their results. They provide a brief synopsis of their protocol and analysis of experimental errors. The class then asks questions of each group, and they defend their findings or brainstorm methods of further investigation to arrive at better results. Using whiteboard lab write-ups provides a great opportunity for quick feedback as well as peer-to-peer discussion and evaluation of experimental design. Students can help one another become better designers of experimental procedures. This way, feedback is not limited to the one student who reads it; instead, the whole class benefits from the critical evaluation of data collection protocols.
This simulation does a great job of showing the molecular level interactions and the electron transfer in redox reactions. I provide individual feedback on their choices and determine whether more instruction is needed. This concept is revisited at the end of the course when we investigate standard reduction potentials.
Since groups submit a procedure before conducting the lab, I can review their protocols as well as troubleshoot the experimental design. Reading through the procedures allows me to determine whether students understand how to apply their titration knowledge to redox systems, and I can provide individualized feedback to students who need more help with their experimental designs or challenge groups to answer a bigger question with their experiment.
This assessment addresses the essential question, How do we know if a sample is actually pure, and how can we test a solution through chemical reactions to determine the amount of a material present in a mixture?
Unit
2:
Stoichiometry and Reactions in Solution (continued)
Essential Questions:
▼ How do we know if a sample is actually pure, and how can we test a solution through chemical reactions to determine the amount of a material present in a mixture? ▼ How do we know that transition metals make ions with different charges? ▼ Why don’t all single and double displacement reactions occur?

15 © 2012 The College Board.AP Chemistry ■ Course Planning and Pacing Guide 2
Learning Objectives Materials Instructional Activities and AssessmentsExpress the law of conservation of mass quantitatively and qualitatively using symbolic representations and particulate drawings. [LO 1.17, SP 1.5]
Apply conservation of atoms to the rearrangement of atoms in various processes. [LO 1.18, SP 1.4]
Draw and/or interpret representations of solutions that show the interactions between the solute and solvent. [LO 2.8, SP 1.1, SP 1.2, SP 6.4]
Web“Molecular View of Solution Formation”
Instructional Activity:
In Introductory Chemistry, students learned to balance chemical equations by drawing circles for each atom and then figuring out how to rearrange them in order to ensure that equal atoms are on each side. We reinforce this technique with additional particulate-level drawings, including assessing limiting reactants. Various practice problems illustrate the particle-level reasoning. The Web activities provide many particle-level animations of the dissolving process and chemical reactions, and it clearly shows the ion-dipole orientation for the dissolving of an ionic crystal in water.
Apply conservation of atoms to the rearrangement of atoms in various processes. [LO 1.18, SP 1.4]
Translate among macroscopic observations of change, chemical equations, and particle views. [LO 3.1, SP 1.5, SP 7.1]
Translate an observed chemical change into a balanced chemical equation and justify the choice of equation type (molecular, ionic, or net ionic) in terms of utility for the given circumstances. [LO 3.2, SP 1.5, SP 7.1]
Web“Solubility Rules and Net Ionic Equations”
Instructional Activity:
The POGIL (Process Oriented Guided Inquiry Learning) activity described has students look at patterns of precipitation reactions and guides them through the process of translating full molecular equations into net ionic equations. Students are not required to memorize solubility rules, but they can examine patterns in the data.
Unit
2:
Stoichiometry and Reactions in Solution (continued)
Essential Questions:
▼ How do we know if a sample is actually pure, and how can we test a solution through chemical reactions to determine the amount of a material present in a mixture? ▼ How do we know that transition metals make ions with different charges? ▼ Why don’t all single and double displacement reactions occur?

16 © 2012 The College Board.AP Chemistry ■ Course Planning and Pacing Guide 2
Learning Objectives Materials Instructional Activities and AssessmentsTranslate among macroscopic observations of change, chemical equations, and particle views. [LO 3.1, SP 1.5, SP 7.1]
Draw and/or interpret representations of solutions that show the interactions between the solute and solvent. [LO 2.8, SP 1.1, SP 1.2, SP 6.4]
Create or interpret representations that link the concept of molarity with particle views of solutions. [LO 2.9, SP 1.1, SP 1.4]
Apply Coulomb’s Law qualitatively (including using representations) to describe the interactions of ions, and the attractions between ions and solvents to explain the factors that contribute to the solubility of ionic compounds. [LO 2.14, SP 1.4, SP 6.4]
Explain observations regarding the solubility of ionic solids and molecules in water and other solvents on the basis of particle views that include intermolecular interactions and entropic effects. [LO 2.15, SP 1.4, SP 6.2, connects to 5.E.1]
Web“Salts & Solubility”
“Molarity — Solute, Solvent, Solutions”
Instructional Activity:
Students use two interactive simulations to investigate the influences on ionic compound solubility in water: ion charge, ionic radius, and number of ions in the salt. Students can investigate these properties easily, as the salts and solubility simulation automatically tallies the number of dissolved and bound ions. Students can see the effects of differing ion charge on the lattice structure and solubility. After equilibrium is attained, students can remove water to observe the effects of solvent volume on the equilibrium. The salts and solubility simulation clearly demonstrates the dynamic equilibrium involved in solubility, and students can observe surface ions detaching and displacing over time. The molarity simulation reinforces the idea that when a solution is saturated, the concentration above the precipitate does not change, even as evaporation occurs.
These simulations can be used again later in the year when Ksp is being discussed. They are helpful at addressing two commonly misunderstood concepts, as they clearly demonstrate that even when there is a precipitate, there is always some ion concentration in solution. Also, students can increase and decrease the amount of solvent to observe that the ion concentration remains saturated as long as some salt remains in the bottom of the beaker.
Unit
2:
Stoichiometry and Reactions in Solution (continued)
Essential Questions:
▼ How do we know if a sample is actually pure, and how can we test a solution through chemical reactions to determine the amount of a material present in a mixture? ▼ How do we know that transition metals make ions with different charges? ▼ Why don’t all single and double displacement reactions occur?

17 © 2012 The College Board.AP Chemistry ■ Course Planning and Pacing Guide 2
Learning Objectives Materials Instructional Activities and AssessmentsSummative Assessment:
The unit test contains multiple-choice and free-response questions regarding writing and balancing equations for chemical processes, including precipitation, redox, and formation of gases. Students create pictorial representations of solutions before and after a chemical reaction. Questions require students to analyze empirical formula and gravimetric analysis data to determine the identity and purity of a substance. Students must compare this data with given mass spectra for further analysis. Students also propose an experimental method to determine the empirical formula of rust (iron oxide), design a titration experiment to determine the amount of citric acid in a sour candy, and calculate theoretical yields for reactions that have stoichiometrically equal quantities of reactants as well as limiting reactants.
This assessment addresses the following essential questions:• How do we know if a sample is actually
pure, and how can we test a solution through chemical reactions to determine the amount of a material present in a mixture?
• How do we know that transition metals make ions with different charges?
Unit
2:
Stoichiometry and Reactions in Solution (continued)
Essential Questions:
▼ How do we know if a sample is actually pure, and how can we test a solution through chemical reactions to determine the amount of a material present in a mixture? ▼ How do we know that transition metals make ions with different charges? ▼ Why don’t all single and double displacement reactions occur?
18 © 2012 The College Board.AP Chemistry ■ Course Planning and Pacing Guide 2
Unit
3:
Chemical Energy and Thermochemistry
Laboratory Investigations:•Heats of Reaction and Hess’s Law•Heat of Fusion of Ice (whole-class, guided inquiry)
Estimated Time: 3 weeks
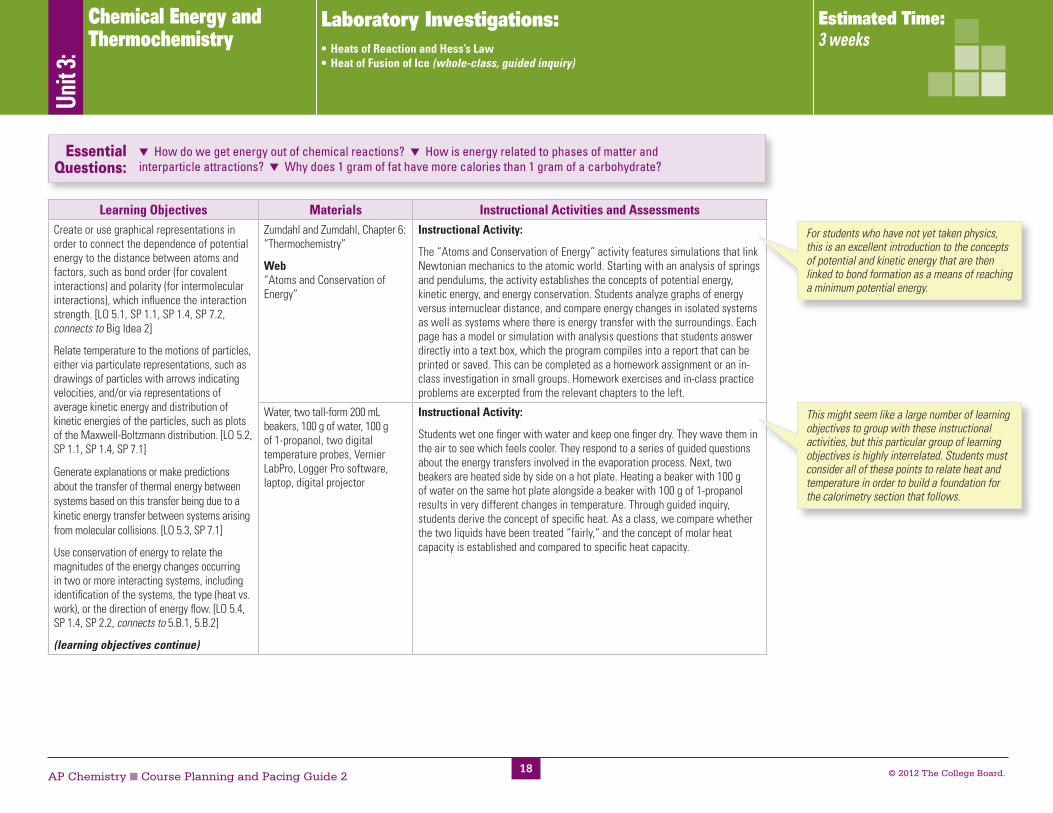
Learning Objectives Materials Instructional Activities and AssessmentsCreate or use graphical representations in order to connect the dependence of potential energy to the distance between atoms and factors, such as bond order (for covalent interactions) and polarity (for intermolecular interactions), which influence the interaction strength. [LO 5.1, SP 1.1, SP 1.4, SP 7.2, connects to Big Idea 2]
Relate temperature to the motions of particles, either via particulate representations, such as drawings of particles with arrows indicating velocities, and/or via representations of average kinetic energy and distribution of kinetic energies of the particles, such as plots of the Maxwell-Boltzmann distribution. [LO 5.2, SP 1.1, SP 1.4, SP 7.1]
Generate explanations or make predictions about the transfer of thermal energy between systems based on this transfer being due to a kinetic energy transfer between systems arising from molecular collisions. [LO 5.3, SP 7.1]
Use conservation of energy to relate the magnitudes of the energy changes occurring in two or more interacting systems, including identification of the systems, the type (heat vs. work), or the direction of energy flow. [LO 5.4, SP 1.4, SP 2.2, connects to 5.B.1, 5.B.2]
(learning objectives continue)
Zumdahl and Zumdahl, Chapter 6: “Thermochemistry”
Web“Atoms and Conservation of Energy”
Instructional Activity:
The “Atoms and Conservation of Energy” activity features simulations that link Newtonian mechanics to the atomic world. Starting with an analysis of springs and pendulums, the activity establishes the concepts of potential energy, kinetic energy, and energy conservation. Students analyze graphs of energy versus internuclear distance, and compare energy changes in isolated systems as well as systems where there is energy transfer with the surroundings. Each page has a model or simulation with analysis questions that students answer directly into a text box, which the program compiles into a report that can be printed or saved. This can be completed as a homework assignment or an in-class investigation in small groups. Homework exercises and in-class practice problems are excerpted from the relevant chapters to the left.
Water, two tall-form 200 mL beakers, 100 g of water, 100 g of 1-propanol, two digital temperature probes, Vernier LabPro, Logger Pro software, laptop, digital projector
Instructional Activity:
Students wet one finger with water and keep one finger dry. They wave them in the air to see which feels cooler. They respond to a series of guided questions about the energy transfers involved in the evaporation process. Next, two beakers are heated side by side on a hot plate. Heating a beaker with 100 g of water on the same hot plate alongside a beaker with 100 g of 1-propanol results in very different changes in temperature. Through guided inquiry, students derive the concept of specific heat. As a class, we compare whether the two liquids have been treated “fairly,” and the concept of molar heat capacity is established and compared to specific heat capacity.
Essential Questions:
▼ How do we get energy out of chemical reactions? ▼ How is energy related to phases of matter and interparticle attractions? ▼ Why does 1 gram of fat have more calories than 1 gram of a carbohydrate?
For students who have not yet taken physics, this is an excellent introduction to the concepts of potential and kinetic energy that are then linked to bond formation as a means of reaching a minimum potential energy.
This might seem like a large number of learning objectives to group with these instructional activities, but this particular group of learning objectives is highly interrelated. Students must consider all of these points to relate heat and temperature in order to build a foundation for the calorimetry section that follows.

19 © 2012 The College Board.AP Chemistry ■ Course Planning and Pacing Guide 2
Learning Objectives Materials Instructional Activities and Assessments(continued)
Use conservation of energy to relate the magnitudes of the energy changes when two nonreacting substances are mixed or brought into contact with one another. [LO 5.5, SP 2.2, connects to 5.B.1, 5.B.2]
Interpret observations regarding macroscopic energy changes associated with a reaction or process to generate a relevant symbolic and/or graphical representation of the energy changes. [LO 3.11, SP 1.5, SP 4.4]
Formative Assessment:
Students work on practice problems in groups with the q = mCΔT equation. I demonstrate that heating 40 g of copper pellets to 80°C and placing them into 40 g of 20°C water does not result in 50°C as a final temperature. Students reason why, and I record the final temperature of the copper/water mixture. Students then calculate the specific heat capacity of copper and compare it to published values. As a class, we account for deviations from the expected results.
Design and/or interpret the results of an experiment in which calorimetry is used to determine the change in enthalpy of a chemical process (heating/cooling, phase transition, or chemical reaction) at constant pressure. [LO 5.7, SP 4.2, SP 5.1, SP 6.4]
Use calculations or estimations to relate energy changes associated with heating/cooling a substance to the heat capacity, relate energy changes associated with a phase transition to the enthalpy of fusion/vaporization, relate energy changes associated with a chemical reaction to the enthalpy of the reaction, and relate energy changes to PΔV work. [LO 5.6, SP 2.2, SP 2.3]
Magnesium ribbon, magnesium oxide, 1 M HCl, microscale calorimeters, 0.01 g balance, graduated cylinders, temperature probe or digital thermometer
Cesa, “Heats of Reaction and Hess’s Law”
Formative Assessment:
In this teacher-directed lab, students apply Hess’s law and react magnesium metal and magnesium oxide with hydrochloric acid to determine the enthalpy change of the following reaction: Mg + O2"MgO.
Draw qualitative and quantitative connections between the reaction enthalpy and the energies involved in the breaking and formation of chemical bonds. [LO 5.8, SP 2.3, SP 7.1, SP 7.2]
Zumdahl and Zumdahl, Chapter 8: “Bonding: General Concepts”
WebMiller, “Ending Misconceptions About the Energy of Chemical Bonds”
Instructional Activity:
As a class, we examine tables of average bond enthalpy and establish patterns with regard to bond order, atomic radius, and bond length. Similar patterns are examined for the standard enthalpies of formation. Students work through several practice problems using bond energies and enthalpies of formation to determine the enthalpy of a chemical reaction. Homework exercises and in-class practice problems are excerpted from the relevant chapters to the left.
Unit
3:
Chemical Energy and Thermochemistry (continued)
I provide individual feedback to students on their data processing when they hand in their lab reports. The “Heats of Reaction and Hess’s Law” lab provides the skill set that students need to apply later in the “Heat of Fusion of Ice” lab. If I see consistent errors, I address them the next day in class and provide additional instruction on calorimetry.
Essential Questions:
▼ How do we get energy out of chemical reactions? ▼ How is energy related to phases of matter and interparticle attractions? ▼ Why does 1 gram of fat have more calories than 1 gram of a carbohydrate?
I monitor students’ progress, providing feedback and additional instruction where needed.

20 © 2012 The College Board.AP Chemistry ■ Course Planning and Pacing Guide 2
Learning Objectives Materials Instructional Activities and AssessmentsInterpret observations regarding macroscopic energy changes associated with a reaction or process to generate a relevant symbolic and/or graphical representation of the energy changes. [LO 3.11, SP 1.5, SP 4.4]
Instructional Activity:
As a class, we generate reaction energy diagrams for exothermic and endothermic reactions and introduce the concept of activation energy, which will be expanded in the kinetics unit. We relate the placement of reactants and products on the potential energy axis based on the bond energy of each.
Draw qualitative and quantitative connections between the reaction enthalpy and the energies involved in the breaking and formation of chemical bonds. [LO 5.8, SP 2.3, SP 7.1, SP 7.2]
Calcium oxide lumps, water, two aluminum pie tins, one raw egg
Instructional Activity:
In this “cooking with chemistry” activity, students calculate the heat released by 200 g of CaO reacting completely with water given the standard enthalpies of formation. While they calculate, I pour water over the calcium oxide, place the second pie tin over it, and cook an egg over the heat released by the reaction.
Use calculations or estimations to relate energy changes associated with heating/cooling a substance to the heat capacity, relate energy changes associated with a phase transition to the enthalpy of fusion/vaporization, relate energy changes associated with a chemical reaction to the enthalpy of the reaction, and relate energy changes to PΔV work. [LO 5.6, SP 2.2, SP 2.3]
Design and/or interpret the results of an experiment in which calorimetry is used to determine the change in enthalpy of a chemical process (heating/cooling, phase transition, or chemical reaction) at constant pressure. [LO 5.7, SP 4.2, SP 5.1, SP 6.4]
Support the claim about whether a process is a chemical or physical change (or may be classified as both) based on whether the process involves changes in intramolecular versus intermolecular interactions. [LO 5.10, SP 5.1]
Ice, water, two Styrofoam cups, digital thermometer or temperature probe
Holmquist, et al., “Experiment 4: Heat of Fusion of Ice”
Formative Assessment:
Students measure the temperature decrease of water in a calorimeter and the mass of ice that melts to determine the heat of fusion in kJ/mol. As a class, we brainstorm a procedure of what needs to be measured. Students then collect the data (two trials, usually), and we pool class data to do statistical analysis on the final results (Q test, mean, standard deviation, and percent error to the accepted value of 6.02 kJ/mol). I stay on the sidelines of this discussion and allow the class to do the work. I only intercede when safety concerns arise or if the class becomes stuck. My contribution is usually only a question designed to steer them in a different direction.
Following the execution of the lab procedure, students share their results with the rest of the class, and we propose adjustments to the procedure that would yield better results. I can tell by the students’ discussions in the brainstorming sessions if there are still concepts that I need to reinforce in a later class.
Unit
3:
Chemical Energy and Thermochemistry (continued)
Essential Questions:
▼ How do we get energy out of chemical reactions? ▼ How is energy related to phases of matter and interparticle attractions? ▼ Why does 1 gram of fat have more calories than 1 gram of a carbohydrate?
Students find this fascinating, and it opens the discussion of whether this reaction releases so much energy because of the bonds that it breaks or because of the bonds that it forms. It also prepares students for the consideration of stronger bonds being formed after breaking comparatively weaker ones as the reason we get so much energy out of many chemical reactions, particularly combustive fuels.
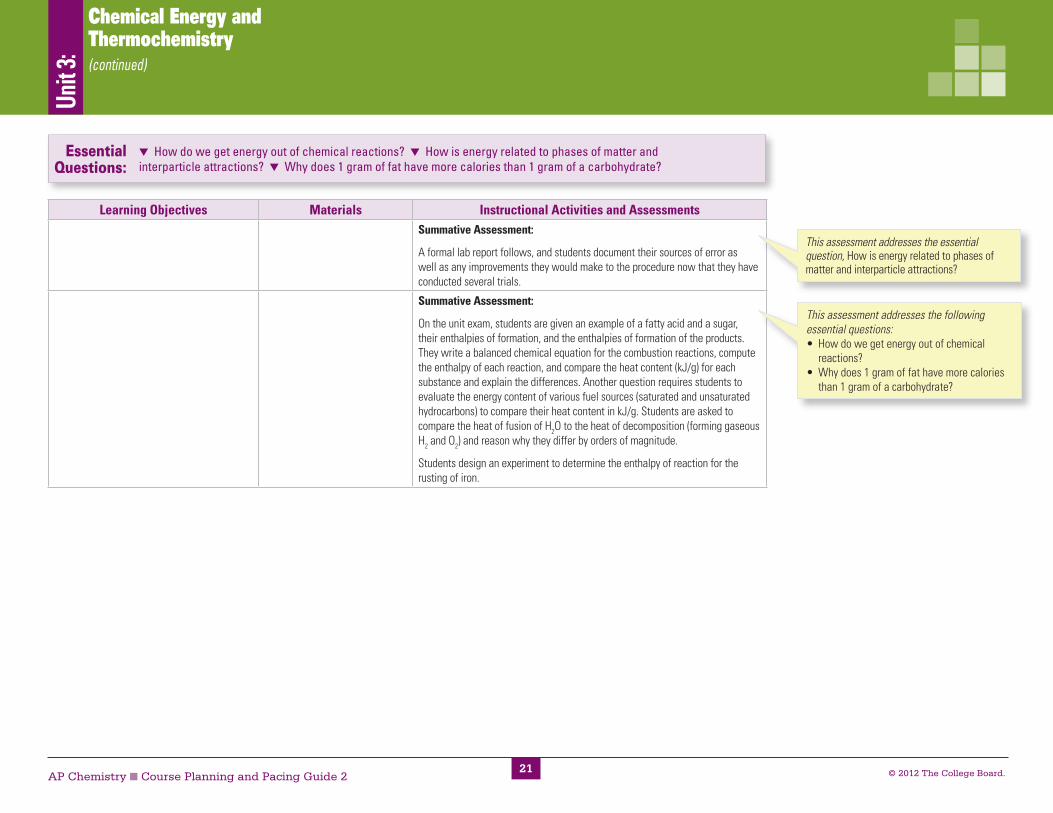
21 © 2012 The College Board.AP Chemistry ■ Course Planning and Pacing Guide 2
Learning Objectives Materials Instructional Activities and AssessmentsSummative Assessment:
A formal lab report follows, and students document their sources of error as well as any improvements they would make to the procedure now that they have conducted several trials.
Summative Assessment:
On the unit exam, students are given an example of a fatty acid and a sugar, their enthalpies of formation, and the enthalpies of formation of the products. They write a balanced chemical equation for the combustion reactions, compute the enthalpy of each reaction, and compare the heat content (kJ/g) for each substance and explain the differences. Another question requires students to evaluate the energy content of various fuel sources (saturated and unsaturated hydrocarbons) to compare their heat content in kJ/g. Students are asked to compare the heat of fusion of H2O to the heat of decomposition (forming gaseous H2 and O2) and reason why they differ by orders of magnitude.
Students design an experiment to determine the enthalpy of reaction for the rusting of iron.
This assessment addresses the following essential questions:• How do we get energy out of chemical
reactions?•Why does 1 gram of fat have more calories
than 1 gram of a carbohydrate?
Unit
3:
Chemical Energy and Thermochemistry (continued)
Essential Questions:
▼ How do we get energy out of chemical reactions? ▼ How is energy related to phases of matter and interparticle attractions? ▼ Why does 1 gram of fat have more calories than 1 gram of a carbohydrate?
This assessment addresses the essential question, How is energy related to phases of matter and interparticle attractions?

22 © 2012 The College Board.AP Chemistry ■ Course Planning and Pacing Guide 2
Unit
4:
Atomic Structure and Periodicity
Laboratory Investigations:(no labs for this unit)
Estimated Time: 1 week
Learning Objectives Materials Instructional Activities and AssessmentsPredict and/or justify trends in atomic properties based on location on the periodic table and/or the shell model. [LO 1.9, SP 6.4]
Justify with evidence the arrangement of the periodic table and apply periodic properties to chemical reactivity. [LO 1.10, SP 6.1]
Zumdahl and Zumdahl, Chapter 7: “Atomic Structure and Periodicity”
Two large test tubes, 2 g KClO3, 2 g NaClO3, two candies (Skittles, M&Ms, or Gummi Bears), Meker burner, fume hood with sash
Web“Atomic Radii”
Instructional Activity:
The “Hungry Dragon.” Two chlorate salts are liquefied in separate test tubes inside the fume hood. One candy is inserted into each tube. The candies produce a vigorous reaction and different colored flames are expelled from each tube. Students write balanced equations for the process, explain why the reactions are similar (in energy and stoichiometry), and provide a reason for the different flame colors based on sodium and potassium’s position on the periodic table. We then discuss Coulombic attractions to the nucleus, ionization energy, electron shielding, and atomic emission spectra. We extend this reasoning into ions, as the Coulombic attractions explain the increase in size of negative ions and the decrease in size of positive ions (as compared to their neutral atoms).
Explain the distribution of electrons in an atom or ion based upon data. [LO 1.5, SP 1.5, SP 6.2]
Analyze data relating to electron energies for patterns and relationships. [LO 1.6, SP 5.1]
Explain the distribution of electrons using Coulomb’s Law to analyze measured energies. [LO 1.8, SP 6.2]
Web“Ionization Energy: 1st: Cylinders”
Instructional Activity:
In Introductory Chemistry, students learned how to assign electron configurations based on an element’s placement on the periodic table. This unit starts with a graph of ionization energy versus atomic number, and students are asked to describe a pattern. Then, looking at the same data as a graph overlaid on the periodic table, students discuss in groups any patterns that they see. We use this pattern to establish the shell model of the atom.
Justify the selection of a particular type of spectroscopy to measure properties associated with vibrational or electronic motions of molecules. [LO 1.15, SP 4.1, SP 6.4]
Describe the electronic structure of the atom, using PES data, ionization energy data, and/or Coulomb’s Law to construct explanations of how the energies of electrons within shells in atoms vary. [LO 1.7, SP 5.1, SP 6.2]
Moog and Farrell, Chapter 8: “Photoelectron Spectroscopy”
Formative Assessment:
Students work through the activity to reason through photoelectron spectroscopy (PES) data and the relationship to electron configurations, the shell model of the atom, and ionization energies. The POGIL activity clearly relates the energy of the light used to probe the atom and the amount of energy needed to remove an electron from a particular sublevel. A PES spectrum can easily be displayed to the class, and students can vote on which element would result in that spectrum.
Essential Questions:
▼ Why isn’t there just one model of the atom on which all scientists agree? ▼ Why do different elements or compounds produce different colors when ignited? ▼ How does modern experimental evidence like PES, ionization energy, and mass spectroscopy both support and show the limitations of the shell model of the atom?
There are no lab procedures for this unit, as students already completed flame tests and atomic emission spectroscopy in their Introductory Chemistry course. The demos in this segment are designed to review, reinforce, and further develop what students learned previously. The + and – disk magnets can be reintroduced here to solidify the Coulombic attraction/repulsion concepts.
Probing questions, such as, Why does the larger peak appear on the right-hand side of the spectrum? or Why are the magnitudes of the peaks not the same? can be used to pretest the depth of student understanding or provide the initiation for further discussion. Students’ responses to the questions and the ensuing discussion allow me to provide them with feedback about their learning.

23 © 2012 The College Board.AP Chemistry ■ Course Planning and Pacing Guide 2
Essential Questions:
▼ Why isn’t there just one model of the atom on which all scientists agree? ▼ Why do different elements or compounds produce different colors when ignited? ▼ How does modern experimental evidence like PES, ionization energy, and mass spectroscopy both support and show the limitations of the shell model of the atom?
Unit
4:
Atomic Structure and Periodicity (continued)
Learning Objectives Materials Instructional Activities and AssessmentsExplain why a given set of data suggests, or does not suggest, the need to refine the atomic model from a classical shell model with the quantum mechanical model. [LO 1.12, SP 6.3]
Given information about a particular model of the atom, determine if the model is consistent with specified evidence. [LO 1.13, SP 5.3]
Web“Models of the Hydrogen Atom”
Instructional Activity:
After reviewing and explaining the trends in first ionization energy, successive ionization energies, atomic radius, ionic radius, and electronegativity, students find places where these trends do not follow our predicted patterns. A brief introduction to the quantum mechanical model follows, and we discuss electron spin, but assigning of quantum numbers or attempts at discussing the Schroedinger equation are more confusing than helpful. It is important for students to have a robust mental model of the shell structure of the atom, but they should realize this model has limitations which they will study if they take future chemistry courses. Students then examine various models of the hydrogen atom based on the experimental evidence that leads to them, using the PhET online simulation.
Summative Assessment:
The unit test consists of multiple-choice and free-response questions requiring students to analyze PES data and sketch estimates of a spectrum for a given element. Students evaluate differences in successive ionization energies to explain patterns and inconsistencies through the concepts of the shell model, nuclear charge, and electron shielding. Students can also use the Planck equation (E = hv) to reason why high energy waves like x-rays are needed for PES. Students analyze data on atoms, particularly inconsistencies in ionization energy, to assess if this information might require something other than the shell model to explain the data. Students analyze atomic emission line spectra for various colors of fireworks to determine the elemental composition from reference spectra. Students also compare the terms theory and law.
This assessment addresses all of the essential questions in this unit.

24 © 2012 The College Board.AP Chemistry ■ Course Planning and Pacing Guide 2
Unit
5:
Bonding Laboratory Investigations:•Molecular Modeling•Separation and Analysis of Grape Kool-Aid
Estimated Time: 3–4 weeks
Learning Objectives Materials Instructional Activities and AssessmentsPredict the type of bonding present between two atoms in a binary compound based on position in the periodic table and the electronegativity of the elements. [LO 2.17, SP 6.4]
Rank and justify the ranking of bond polarity on the basis of the locations of the bonded atoms in the periodic table. [LO 2.18, SP 6.1]
Zumdahl and Zumdahl, Chapter 8: “Bonding: General Concepts” and Chapter 9: “Covalent Bonding: Orbitals”
Moog and Farrell, Chapter 26: “The Bond Type Triangle”
Formative Assessment:
Students work through a POGIL activity that I have modified from the Moog and Farrell version. They examine data on melting points and compare the difference in electronegativity (ΔEN) as well as the average electronegativity (ENavg) to classify a bond between two atoms as ionic, covalent, polar covalent, metallic, or semimetallic. Homework exercises and in-class practice problems are excerpted from the relevant chapters to the left. This goes beyond the scope of the AP Chemistry Exam, but it has always bothered me that ΔEN has been the only criteria offered for differentiating bonding, as it is only useful for differentiating polar covalent from nonpolar covalent. The bond triangle approach allows for discussions of metallic bonding, alloys, and a better line between ionic and covalent.
Use Lewis diagrams and VSEPR to predict the geometry of molecules, identify hybridization, and make predictions about polarity. [LO 2.21, SP 1.4]
Describe the relationships between the structural features of polar molecules and the forces of attraction between the particles. [LO 2.13, SP 1.4, SP 6.4]
Web“Molecule Shapes”
Instructional Activity:
I construct various VSEPR shapes using balloons to show the three-dimensional arrangement of atoms in various bonding arrangements, including expanded octets. We then examine the PhET simulation to see the effects of lone pairs and bonding pairs on molecular shape. Students can work on this individually after being shown how to use the interface, or it can be projected and examined as a class. Students work with the simulation to add/remove bonds and add/remove lone pairs to determine whether the most likely three-dimensional shape and bond angles in a molecule.
Instructional Activity:
In a molecular modeling lab, students generate models of molecules and polyatomic ions, draw Lewis dot structures, describe their geometry, identify the hybridization, and predict their polarity.
Use Lewis diagrams and VSEPR to predict the geometry of molecules, identify hybridization, and make predictions about polarity. [LO 2.21, SP 1.4]
Web“Bonding Quiz”
Formative Assessment:
Students take the self-checking online quiz, and their answers help me determine whether we need to review the concepts of VSEPR.
Essential Questions:
▼ How would Earth be different if water were not polar and most of the molecules in the atmosphere were? ▼ How can differing intermolecular forces be used to separate a mixture of molecules? ▼ How do the differences in polarity of hydrocarbons and water make hydraulic fracturing a method for removing natural gas from shale?
I circulate throughout the room as students are working and provide leading questions or redirect their discussions as needed. We debrief the activity the next day, and that determines what I present next. This activity serves as a primer for many of the bonding concepts we will cover in this unit.

25 © 2012 The College Board.AP Chemistry ■ Course Planning and Pacing Guide 2
Unit
5:
Bonding (continued)
Learning Objectives Materials Instructional Activities and AssessmentsExplain how solutes can be separated by chromatography based on intermolecular interactions. [LO 2.7, SP 6.2]
Design and/or interpret the results of a separation experiment (filtration, paper chromatography, column chromatography, or distillation) in terms of the relative strength of interactions among and between the components. [LO 2.10, SP 4.2, SP 5.1, SP 6.4]
Evaluate the classification of a process as a physical change, chemical change, or ambiguous change based on both macroscopic observations and the distinction between rearrangement of covalent interactions and noncovalent interactions. [LO 3.10, SP 1.4, SP 6.1, connects to 5.D.2]
Web“Chromatography”
Instructional Activity:
In small groups, students work through the chromatography simulation to vary the attraction of the molecules for the stationary phase and the mobile phase. We debrief as a class, and I then use the class discussion of the reverse phase chromatography separation as a prelab.
Design and/or interpret the results of a separation experiment (filtration, paper chromatography, column chromatography, or distillation) in terms of the relative strength of interactions among and between the components. [LO 2.10, SP 4.2, SP 5.1, SP 6.4]
Design and/or interpret the results of an experiment regarding the absorption of light to determine the concentration of an absorbing species in a solution. [LO 1.16, SP 4.2, SP 5.1]
Justify the selection of a particular type of spectroscopy to measure properties associated with vibrational or electronic motions of molecules. [LO 1.15, SP 4.1, SP 6.4]
Web“Separation of Food Dyes Via Column Chromatography”
Instructional Activity:
Students use a Sep-Pak C18 Cartridge (Flinn Scientific AP8917) to separate Grape Kool-Aid into its component red and blue dyes. Students then compare the separated dyes to reference solutions of common food dyes using a spectrophotometer and measure the percent transmittance at 25 nm intervals across the range of 400–750 nm.
Essential Questions:
▼ How would Earth be different if water were not polar and most of the molecules in the atmosphere were? ▼ How can differing intermolecular forces be used to separate a mixture of molecules? ▼ How do the differences in polarity of hydrocarbons and water make hydraulic fracturing a method for removing natural gas from shale?
The prelab activity involves a discussion or demonstration of the procedure in anticipation of actually conducting the lab.
The Sep-Pak C18 cartridges are expensive, but they can be cleaned and reused from year to year. Students can also bring their own drinks into class: soda, Gatorade, etc. Diet versions of these are a better idea, as sugar can start to clog the Sep-Pak cartridges.

26 © 2012 The College Board.AP Chemistry ■ Course Planning and Pacing Guide 2
Unit
5:
Bonding (continued)
Essential Questions:
▼ How would Earth be different if water were not polar and most of the molecules in the atmosphere were? ▼ How can differing intermolecular forces be used to separate a mixture of molecules? ▼ How do the differences in polarity of hydrocarbons and water make hydraulic fracturing a method for removing natural gas from shale?
Learning Objectives Materials Instructional Activities and AssessmentsSummative Assessment:
Formal lab write-up requires students to analyze the spectra that they create through graphing in Excel to identify the possible dyes in the Kool-Aid sample. They analyze whether they achieved complete separation based on the presence of percent transmittance minimums at the same wavelength of the component dyes. They predict the best wavelength to analyze a solution that contains yellow dye and justify their prediction based on the results of this lab.
Summative Assessment:
The unit exam consists of multiple-choice and free-response questions that require students to articulate the type of bonding in a substance based on properties, positioning on the periodic table, and analysis of electronegativity values. For one free-response item, students design a chromatography experiment to determine if Orange Crush soda contains more than one dye. They additionally must explain why paper filtration cannot separate the dye from the soda. Students read a news article excerpt on hydraulic fracturing and analyze why water can displace (and not dissolve) the natural gas and rock.
This lab report addresses the essential question, How can differing intermolecular forces be used to separate a mixture of molecules?
This assessment addresses the following essential questions:• How would Earth be different if water were
not polar and most of the molecules in the atmosphere were?
• How do the differences in polarity of hydrocarbons and water make hydraulic fracturing a method for removing natural gas from shale?

27 © 2012 The College Board.AP Chemistry ■ Course Planning and Pacing Guide 2
Learning Objectives Materials Instructional Activities and AssessmentsRelate temperature to the motions of particles, either via particulate representations, such as drawings of particles with arrows indicating velocities, and/or via representations of average kinetic energy and distribution of kinetic energies of the particles, such as plots of the Maxwell-Boltzmann distribution. [LO 5.2, SP 1.1, SP 1.4, SP 7.1]
Refine multiple representations of a sample of matter in the gas phase to accurately represent the effect of changes in macroscopic properties on the sample. [LO 2.5, SP 1.3, SP 6.4, SP 7.2]
Zumdahl and Zumdahl, Chapter 5: “Gases”; Chapter 10: “Liquids and Solids”; and Chapter 11: “Properties of Solutions”
Web“Kinetic Energies in a Gas”
Instructional Activity:
After viewing the animation of the various gas samples at different temperatures, students generate their own sketches of Maxwell-Boltzmann distributions for samples of gases at various temperatures. As a class, we discuss that changing temperature does not mean that all molecules in the sample necessarily achieve the same kinetic energy/particle speed, but the average increases. Changing a macroscopic property (temperature in this case) means that a new Maxwell-Boltzmann distribution will be generated with a new mean and different distribution. Homework exercises and in-class practice problems are excerpted from the relevant chapters to the left.
Relate temperature to the motions of particles, either via particulate representations, such as drawings of particles with arrows indicating velocities, and/or via representations of average kinetic energy and distribution of kinetic energies of the particles, such as plots of the Maxwell-Boltzmann distribution. [LO 5.2, SP 1.1, SP 1.4, SP 7.2]
Formative Assessment:
A graph with three different Maxwell-Boltzmann distribution curves is displayed on the board, and students are given three possible systems (three different temperatures or three different molecules at the same temperature), which they must match with the different curves.
Apply mathematical relationships or estimation to determine macroscopic variables for ideal gases. [LO 2.6, SP 2.2, SP 2.3]
Magnesium ribbon, 6 M HCl, eudiometer tube, large beaker, water, copper wire, thermometer, large graduated cylinder
Instructional Activity:
For the purpose of determining the gas law constant, students react magnesium ribbon with hydrochloric acid in a eudiometer tube. They derive the gas constant R by measuring the temperature, pressure, and volume of the hydrogen gas produced.
Essential Questions:
▼ Since gases cannot be easily studied with mass data, how else can we measure and study gas particles? ▼ Why does ice disappear in the freezer if the water molecules cannot move relative to each other in the solid phase? ▼ Can London dispersion forces be stronger than hydrogen bonding? ▼ Could life exist without hydrogen bonding?
Understanding the Maxwell-Boltzmann distribution graphs becomes quite important in Unit 7 (kinetics) to explain why all molecules do not convert to products and why heating a reaction increases the rate.
We review the correct answers, and the accuracy of students’ predictions determines whether I need to review the concepts.
Unit
6:
States of Matter and Interparticle Forces
Laboratory Investigations:•Determination of the Gas Law Constant•Determination of Molar Mass by Vapor Density Method•Bonding Bottles• Freezing and Melting of Water
Estimated Time: 3–4 weeks

28 © 2012 The College Board.AP Chemistry ■ Course Planning and Pacing Guide 2
Learning Objectives Materials Instructional Activities and AssessmentsApply mathematical relationships or estimation to determine macroscopic variables for ideal gases. [LO 2.6, SP 2.2, SP 2.3]
Use KMT and concepts of intermolecular forces to make predictions about the macroscopic properties of gases, including both ideal and nonideal behaviors. [LO 2.4, SP 1.4, SP 6.4]
60 mL or 120 mL syringe, analytical balance (±0.0001g), nail, various gases (propane, methane, butane, difluoroethane)
Instructional Activity:
In order to determine the molar mass of a volatile liquid by the vapor density method, students mass an evacuated syringe on an analytical balance, then fill the syringe to the same volume with air and record its mass. They then fill the syringe to the same volume with another sample of gas (propane, butane, difluoroethane, or carbon dioxide) and record its mass. Students calculate the molar mass of each gas and compare their values to the actual masses. Students account for reasons why their experimental values do not match the actual masses.
Apply mathematical relationships or estimation to determine macroscopic variables for ideal gases. [LO 2.6, SP 2.2, SP 2.3]
Formative Assessment:
Snowball Quiz. Students take a short quiz on the mathematical manipulation of the ideal gas law. After completing, they crumple the paper, throw it at a classmate (as in a snowball fight), and then check the quiz they receive. No score is assessed, but students get instant feedback on how they did.
Use KMT and concepts of intermolecular forces to make predictions about the macroscopic properties of gases, including both ideal and nonideal behaviors. [LO 2.4, SP 1.4, SP 6.4]
Qualitatively analyze data regarding real gases to identify deviations from ideal behavior and relate these to molecular interactions. [LO 2.12, SP 5.1, SP 6.5, connects to 2.A.2]
Porous cup, CO2 gas, beaker, manometer made from Tygon tubing filled with tinted water, clamped in a buret stand
Instructional Activity:
In order to demonstrate the comparative rates of effusion, before class, I attach a porous ceramic cup (used in electrochemistry experiments) with a rubber stopper and glass tube to a simple manometer made of Tygon or aquarium tubing, filled with tinted water. I place the porous cup in a beaker filled with CO2, and students observe that the pressure inside the cup drops. As a class, we discuss the observations, and I give a model of comparative rates of effusion based on molecular mass.
Formative Assessment:
Students read a brochure advertisement for filling car tires with nitrogen. The brochure states that because of nitrogen’s larger size, it is less likely to leak out of the walls of the tire. The class discusses the validity of the selling points offered in the brochure, and I lead them with such prompts as, “it is important to worry about ...” and “does it make a difference if ...”
Unit
6:
States of Matter and Interparticle Forces (continued)
This particular variation of the lab is the best that I’ve found in terms of time required and margin of error. Higher molecular mass gases usually have more error, most likely due to their greater IMFs. Propane and butane usually give excellent results with careful student technique (<5% error).
I ask students to raise their hand if the paper they are checking has the right answer, and the number of raised hands lets me know which concepts I need to explain further.
The quality of students' arguments determines whether additional instruction in effusion and molecular motion as a function of molecular mass is needed.
Essential Questions:
▼ Since gases cannot be easily studied with mass data, how else can we measure and study gas particles? ▼ Why does ice disappear in the freezer if the water molecules cannot move relative to each other in the solid phase? ▼ Can London dispersion forces be stronger than hydrogen bonding? ▼ Could life exist without hydrogen bonding?

29 © 2012 The College Board.AP Chemistry ■ Course Planning and Pacing Guide 229
Learning Objectives Materials Instructional Activities and AssessmentsUse KMT and concepts of intermolecular forces to make predictions about the macroscopic properties of gases, including both ideal and nonideal behaviors. [LO 2.4, SP 1.4, SP 6.4]
Qualitatively analyze data regarding real gases to identify deviations from ideal behavior and relate these to molecular interactions. [LO 2.12, SP 5.1, SP 6.5, connects to 2.A.2]
Butane gas, syringe, Vernier pressure sensor with LabPro, Logger Pro software, computer, LCD projector
Instructional Activity:
Using a syringe attached to a pressure sensor, I collect and display the data for the pressure-volume relationship for air and butane, which starts to liquefy under high pressure. I ask the students to examine the data and explain why the graphs are different based on intermolecular forces.
Summative Assessment:
The midunit test contains multiple-choice and free-response questions that focus on the properties and behavior of gases. Students analyze Maxwell-Boltzmann distributions and the relative speeds of molecules of various samples of gas at specified temperatures. Students relate intermolecular forces to the behavior of gases, and predict and explain why certain substances might not exhibit ideal behavior. Students analyze experimental data on vapor density and connect such data to gas variables. Using items from a list of laboratory equipment, students design a procedure to measure to the molar mass of the gas inside a disposable lighter.
I project the data through an LCD projector using Vernier equipment and software. With a different capped syringe, I also show students that butane liquefies at room temperature if pressure on it is increased enough.
This assessment addresses the essential question, Since gases cannot be easily studied with mass data, how else can we measure and study gas particles?
Unit
6:
States of Matter and Interparticle Forces (continued)
Essential Questions:
▼ Since gases cannot be easily studied with mass data, how else can we measure and study gas particles? ▼ Why does ice disappear in the freezer if the water molecules cannot move relative to each other in the solid phase? ▼ Can London dispersion forces be stronger than hydrogen bonding? ▼ Could life exist without hydrogen bonding?

30 © 2012 The College Board.AP Chemistry ■ Course Planning and Pacing Guide 2
Learning Objectives Materials Instructional Activities and AssessmentsExplain the trends in properties and/or predict properties of samples consisting of particles with no permanent dipole on the basis of London dispersion forces. [LO 2.11, SP 6.2, SP 6.4]
Describe the relationships between the structural features of polar molecules and the forces of attraction between the particles. [LO 2.13, SP 1.4, SP 6.4]
Explain the properties (phase, vapor pressure, viscosity, etc.) of small and large molecular compounds in terms of the strengths and types of intermolecular forces. [LO 2.16, SP 6.2]
Identify the noncovalent interactions within and between large molecules, and/or connect the shape and function of the large molecule to the presence and magnitude of these interactions. [LO 5.11, SP 7.2]
Web“Intermolecular Attractions”
Formative Assessment:
Students work through the simulation in small groups at laptops in class. I circulate throughout the room and answer questions or provide additional instruction if groups require it. If time is scarce, this can be completed as homework, as the activity is guided inquiry. The information and animations are excellent in this online unit. The simulation handily connects the molecular level with the macroscopic, and it contains great contexts for learning the information.
We debrief the “Intermolecular Attractions” activity the next day, and the students’ questions determine the nature of the lesson. If students demonstrate high proficiency in the concepts form the previous day, we proceed to cover new content. If many questions arise that indicate a lack of understanding, I present a different explanation and elaborate on the explanations given in the simulation.
Unit
6:
States of Matter and Interparticle Forces (continued)
Essential Questions:
▼ Since gases cannot be easily studied with mass data, how else can we measure and study gas particles? ▼ Why does ice disappear in the freezer if the water molecules cannot move relative to each other in the solid phase? ▼ Can London dispersion forces be stronger than hydrogen bonding? ▼ Could life exist without hydrogen bonding?

31 © 2012 The College Board.AP Chemistry ■ Course Planning and Pacing Guide 2
Learning Objectives Materials Instructional Activities and AssessmentsExplain the properties (phase, vapor pressure, viscosity, etc.) of small and large molecular compounds in terms of the strengths and types of intermolecular forces. [LO 2.16, SP 6.2]
Explain the trends in properties and/or predict properties of samples consisting of particles with no permanent dipole on the basis of London dispersion forces. [LO 2.11, SP 6.2, SP 6.4]
Describe the relationships between the structural features of polar molecules and the forces of attraction between the particles. [LO 2.13, SP 1.4, SP 6.4]
Make claims and/or predictions regarding relative magnitudes of the forces acting within collections of interacting molecules based on the distribution of electrons within the molecules and the types of intermolecular forces through which the molecules interact. [LO 5.9, SP 6.4]
Instructional Activity:
In small groups, students complete a POGIL activity in which they analyze the boiling and melting points of alkanes and alcohols (three-carbon chains through six-carbon chains). They compare boiling points based on similar numbers of electrons and by similar functional groups.
Sealed glass bottles containing:• propane, pentane, heptane,
decane, and paraffin• propanol, 1,2-propanediol,
and glycerol• propane, acetone, and
isopropanol• heptane and 1-heptanol• naphthalene and cyclohexane• iodine, copper iodide, and
copper metal
Instructional Activity:
In the bonding bottles activity, students migrate from station to station where different substances are laid out in bottles so students can observe differences in viscosity, state of matter, surface tension, boiling point, and vapor pressure. The grouping of substances allows variation of molecular size, or important functional groups: e.g., propane/pentane/heptane, or propanol/1,2-propanediol/glycerol. Students relate their observations to the strength and nature of IMFs.
Explain the properties (phase, vapor pressure, viscosity, etc.) of small and large molecular compounds in terms of the strengths and types of intermolecular forces. [LO 2.16, SP 6.2]
Describe the relationships between the structural features of polar molecules and the forces of attraction between the particles. [LO 2.13, SP 1.4, SP 6.4]
Plastic marbles, large test tubes with stoppers, 1-propanol, 1,2-propanediol, glycerol
Instructional Activity:
In this marble races demonstration, I drop a plastic marble into 1-propanol, 1,2-propanediol, and glycerol to show the differences in behavior when there are singular versus multiple hydrogen bonding sites.
Unit
6:
States of Matter and Interparticle Forces (continued)
Essential Questions:
▼ Since gases cannot be easily studied with mass data, how else can we measure and study gas particles? ▼ Why does ice disappear in the freezer if the water molecules cannot move relative to each other in the solid phase? ▼ Can London dispersion forces be stronger than hydrogen bonding? ▼ Could life exist without hydrogen bonding?

32 © 2012 The College Board.AP Chemistry ■ Course Planning and Pacing Guide 2
Learning Objectives Materials Instructional Activities and AssessmentsExplain the properties (phase, vapor pressure, viscosity, etc.) of small and large molecular compounds in terms of the strengths and types of intermolecular forces. [LO 2.16, SP 6.2]
Explain the trends in properties and/or predict properties of samples consisting of particles with no permanent dipole on the basis of London dispersion forces. [LO 2.11, SP 6.2, SP 6.4]
Describe the relationships between the structural features of polar molecules and the forces of attraction between the particles. [LO 2.13, SP 1.4, SP 6.4]
Make claims and/or predictions regarding relative magnitudes of the forces acting within collections of interacting molecules based on the distribution of electrons within the molecules and the types of intermolecular forces through which the molecules interact. [LO 5.9, SP 6.4]
Erlenmeyer flask, rubber stopper fitted with a glass tube, volatile liquids (water, acetone, pentane), manometer constructed by connecting glass tubes to Tygon or aquarium tubing, which is clamped into a buret stand and filled with colored water
Instructional Activity:
Using a manometer, students investigate the different vapor pressures of volatile liquids (water, acetone, and pentane) at room temperature and elevated temperatures.
Make claims and/or predictions regarding relative magnitudes of the forces acting within collections of interacting molecules based on the distribution of electrons within the molecules and the types of intermolecular forces through which the molecules interact. [LO 5.9, SP 6.4]
Formative Assessment:
Students rank the boiling points of various substances given their molecular formulas. They must predict which will have the greatest IMFs based on the molecular shape and structure. Once they have finished analyzing and discussing the options, students indicate their ranking by holding up their hands with the number of fingers that correspond to their ranking.
Unit
6:
States of Matter and Interparticle Forces (continued)
Essential Questions:
▼ Since gases cannot be easily studied with mass data, how else can we measure and study gas particles? ▼ Why does ice disappear in the freezer if the water molecules cannot move relative to each other in the solid phase? ▼ Can London dispersion forces be stronger than hydrogen bonding? ▼ Could life exist without hydrogen bonding?
I discuss validity of the popular and any nonmajority options before moving on to the next question. Consistently wrong answers indicate that I need to offer more instruction.

33 © 2012 The College Board.AP Chemistry ■ Course Planning and Pacing Guide 2
Learning Objectives Materials Instructional Activities and AssessmentsCompare the properties of metal alloys with their constituent elements to determine if an alloy has formed, identify the type of alloy formed, and explain the differences in properties using particulate level reasoning. [LO 2.25, SP 1.4, SP 7.2]
Use the electron sea model of metallic bonding to predict or make claims about the macroscopic properties of metals or alloys. [LO 2.26, SP 6.4, SP 7.1]
Create a representation of a metallic solid that shows essential characteristics of the structure and interactions present in the substance. [LO 2.27, SP 1.1]
Explain a representation that connects properties of a metallic solid to its structural attributes and to the interactions present at the atomic level. [LO 2.28, SP 1.1, SP 6.2, SP 7.1]
Web“Metallic Bonding and Metallic Properties”
“Nature of Metallic Bonding”
“The Atomic Structure and the Properties of Materials”
Instructional Activity:
For homework the night before, students watch the YouTube video. The explanation is concise and accurate, and it is more student-friendly than the equivalent reading in their textbook. We discuss the video the next day and answer any questions, and we look as a class at the animations to extend the model of metallic bonding further. We connect this to the properties of alloys and investigate data on various types of alloys (substitutional and interstitial) to see patterns in density, melting point, and other properties. Alloys are compared and contrasted to ionic bonding in terms of fixed composition versus flexible composition, and the properties of the final product compared to the pure elements.
Paper clips, Bunsen burner, beaker of cool water, Plexiglas sleeve with BBs, overhead projector or video camera and screen
Instructional Activity:
Paper clips are a cheap source of steel, and various methods of heating and quenching can produce steel that is harder, more brittle, or more springy. I use a Plexiglas sleeve with a single layer of BBs to discuss the crystal defects, slip lines, and domains that are responsible for the properties.
Support the claim about whether a process is a chemical or physical change (or may be classified as both) based on whether the process involves changes in intramolecular versus intermolecular interactions. [LO 5.10, SP 5.1]
Make claims and/or predictions regarding relative magnitudes of the forces acting within collections of interacting molecules based on the distribution of electrons within the molecules and the types of intermolecular forces through which the molecules interact. [LO 5.9, SP 6.4]
Temperature probe, LabPro, Logger Pro software, ice, rock salt, beakers, test tube, deionized water
Holmquist, et al., “Experiment 2: Freezing and Melting of Water”
Instructional Activity:
Students take a sample of pure water and freeze it in an ice/salt bath. They then let it return to room temperature, recording the temperature along the way. Students are asked to account for the large plateau region in terms of potential and kinetic energy. We extrapolate this into heat of fusion and vaporization, and students must account through intermolecular forces for why the heat of vaporization of a pure substance is greater than the heat of fusion.
Web“States of Matter”
Instructional Activity:
Students use the online simulation to investigate variables that are important components of the nature of phase changes: intermolecular spacing, energy, pressure, temperature, intermolecular forces, atom size, etc.
I do not usually assign video lectures for homework, but this one is rather short and provides an excellent overview of the atomic reasons for the properties of metals. In class the next day, we look at the other animations to build a model of metallic bonding in the students’ minds.
Unit
6:
States of Matter and Interparticle Forces (continued)
Essential Questions:
▼ Since gases cannot be easily studied with mass data, how else can we measure and study gas particles? ▼ Why does ice disappear in the freezer if the water molecules cannot move relative to each other in the solid phase? ▼ Can London dispersion forces be stronger than hydrogen bonding? ▼ Could life exist without hydrogen bonding?

34 © 2012 The College Board.AP Chemistry ■ Course Planning and Pacing Guide 2
Learning Objectives Materials Instructional Activities and AssessmentsSummative Assessment:
The unit test consists of multiple-choice and free-response questions that require students to differentiate between various intermolecular forces, rank their strength, and explain macroscopic data through the lens of intermolecular interactions. Students analyze many everyday phenomena to determine the role of intermolecular forces in the observations. Students translate from a molecular formula to a geometric shape of the molecule, and they reason based on structure the nature of the IMFs and how they influence macroscopic variables such as boiling point and vapor pressure. Students differentiate between a substitutional and interstitial alloy based on the particulate level drawings that are provided. They differentiate between metallic and ionic bonding based on the properties of the solid that is formed as compared to the original elements.
This assessment addresses the following essential questions:•Why does ice disappear in the freezer if the
water molecules cannot move relative to each other in the solid phase?
• Can London dispersion forces be stronger than hydrogen bonding?
• Could life exist without hydrogen bonding?
Unit
6:
States of Matter and Interparticle Forces (continued)
Essential Questions:
▼ Since gases cannot be easily studied with mass data, how else can we measure and study gas particles? ▼ Why does ice disappear in the freezer if the water molecules cannot move relative to each other in the solid phase? ▼ Can London dispersion forces be stronger than hydrogen bonding? ▼ Could life exist without hydrogen bonding?

35 © 2012 The College Board.AP Chemistry ■ Course Planning and Pacing Guide 2
Unit
7:
Rates of Chemical Reactions
Laboratory Investigations:•Alka-Seltzer Kinetics (guided inquiry)•Kinetics and Bleach•Kinetics of a Burning Candle
Estimated Time: 2–3 weeks
Learning Objectives Materials Instructional Activities and AssessmentsDesign and/or interpret the results of an experiment regarding the factors (i.e., temperature, concentration, surface area) that may influence the rate of a reaction. [LO 4.1, SP 4.2, SP 5.1]
Zumdahl and Zumdahl, Chapter 12: “Chemical Kinetics”
Alka-Seltzer tablets, water, heating device, thermometers, syringes, rubber stoppers, Erlenmeyer flasks, mortar and pestle, balance, stopwatch
Formative Assessment:
As an introduction to kinetics, students form small groups to design an experiment to establish a relationship between the rate and a specific reaction parameter of Alka-Seltzer tablets in water. Students select varying temperature, concentration, mass, or surface area and decide which data to collect. Homework exercises and in-class practice problems are excerpted from the relevant chapters to the left. Groups use whiteboards to present their data and major findings to the rest of the class. These presentations are intended to be a source of many questions to explore as a class in the coming weeks and not a demonstration of content mastery; that is reserved for the unit exam.
Analyze concentration vs. time data to determine the rate law for a zeroth-, first-, or second-order reaction. [LO 4.2, SP 5.1, SP 6.4, connects to 4.A.3]
Spectrophotometer or colorimeter, bleach, green food coloring, cuvettes, beakers, plastic pipettes, computer with Excel
Instructional Activity:
Using a spectrophotometer, students measure the absorbance of a solution of green food coloring after bleach has been added. Students use Excel to prepare different graphs of the data, such as absorbance vs. time, and 1/(absorbance) vs. time. They use a linear regression analysis to determine the most linear fit, the order of the reaction, and the effect on the value of k when the concentration of bleach is increased.
Birthday candles, matches, weigh boat, balance, stopwatch, computer with Excel
Formative Assessment:
Using a balance and a stopwatch, students determine the rate order of a burning birthday candle by preparing graphs in Excel, and use a linear regression analysis to determine the most linear fit and the value of the rate constant, k. Students compare their results with other groups to see if their results are consistent.
Summative Assessment:
The formal lab report requires students to analyze the concentration dependence of the reaction rate for both of these processes. The error analysis requires them to look at the effects of certain experimental errors and hypothesize regarding their effects. Students must justify why the rate of mass disappearance of the candle does not change as the candle burns down.
Essential Questions:
▼ How can experimental controls be used to regulate the rate at which a chemical reaction will proceed? ▼ What are the industrial and environmental benefits of catalysts? ▼ Why don’t all reaction rates depend on concentration?
This lab and the one that follows provide reliable data for a first- and zeroth-order process, respectively. The data analysis allows students to establish definitively the order of the reaction as well as factors that influence the rate constant, k.
This assessment addresses the following essential questions:•Why don’t all reaction rates depend on
concentration?• How can experimental controls be used
to regulate the rate at which a chemical reaction will proceed?
In the postlab discussion and sharing of class data, I am able to provide feedback on how students are processing the data and whether they are reaching valid conclusions about rate order based on the data they have collected. I am able to clarify concepts and determine whether more instruction is needed based on the types of questions that students ask as well as how they respond to the questions that I ask them about the experiments.
I circulate during the lab period, providing feedback on proposed laboratory protocols and offering troubleshooting assistance. During the whiteboard presentations, I can provide feedback and questions on students’ procedures and findings, but typically the other lab groups ask the questions before I have to. In the feedback session, I can determine what concepts will require more attention than others.
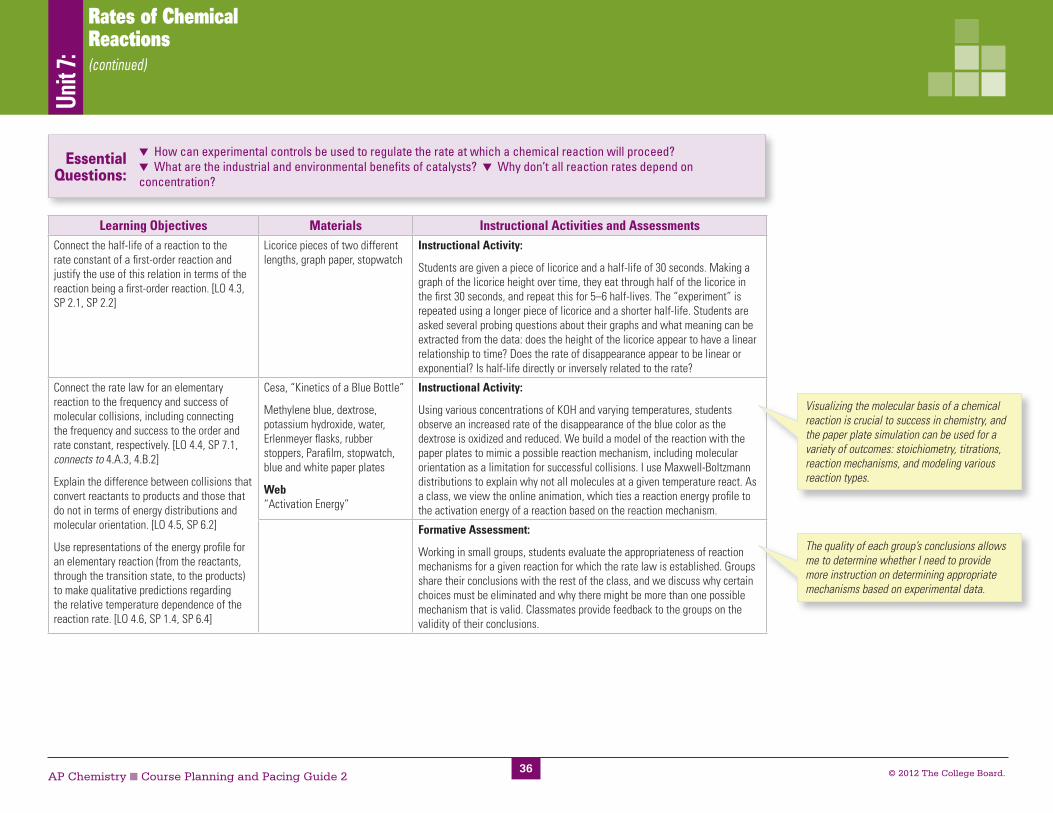
36 © 2012 The College Board.AP Chemistry ■ Course Planning and Pacing Guide 2
Unit
7:
Rates of Chemical Reactions (continued)
Learning Objectives Materials Instructional Activities and AssessmentsConnect the half-life of a reaction to the rate constant of a first-order reaction and justify the use of this relation in terms of the reaction being a first-order reaction. [LO 4.3, SP 2.1, SP 2.2]
Licorice pieces of two different lengths, graph paper, stopwatch
Instructional Activity:
Students are given a piece of licorice and a half-life of 30 seconds. Making a graph of the licorice height over time, they eat through half of the licorice in the first 30 seconds, and repeat this for 5–6 half-lives. The “experiment” is repeated using a longer piece of licorice and a shorter half-life. Students are asked several probing questions about their graphs and what meaning can be extracted from the data: does the height of the licorice appear to have a linear relationship to time? Does the rate of disappearance appear to be linear or exponential? Is half-life directly or inversely related to the rate?
Connect the rate law for an elementary reaction to the frequency and success of molecular collisions, including connecting the frequency and success to the order and rate constant, respectively. [LO 4.4, SP 7.1, connects to 4.A.3, 4.B.2]
Explain the difference between collisions that convert reactants to products and those that do not in terms of energy distributions and molecular orientation. [LO 4.5, SP 6.2]
Use representations of the energy profile for an elementary reaction (from the reactants, through the transition state, to the products) to make qualitative predictions regarding the relative temperature dependence of the reaction rate. [LO 4.6, SP 1.4, SP 6.4]
Cesa, “Kinetics of a Blue Bottle”
Methylene blue, dextrose, potassium hydroxide, water, Erlenmeyer flasks, rubber stoppers, Parafilm, stopwatch, blue and white paper plates
Web“Activation Energy”
Instructional Activity:
Using various concentrations of KOH and varying temperatures, students observe an increased rate of the disappearance of the blue color as the dextrose is oxidized and reduced. We build a model of the reaction with the paper plates to mimic a possible reaction mechanism, including molecular orientation as a limitation for successful collisions. I use Maxwell-Boltzmann distributions to explain why not all molecules at a given temperature react. As a class, we view the online animation, which ties a reaction energy profile to the activation energy of a reaction based on the reaction mechanism.
Formative Assessment:
Working in small groups, students evaluate the appropriateness of reaction mechanisms for a given reaction for which the rate law is established. Groups share their conclusions with the rest of the class, and we discuss why certain choices must be eliminated and why there might be more than one possible mechanism that is valid. Classmates provide feedback to the groups on the validity of their conclusions.
Visualizing the molecular basis of a chemical reaction is crucial to success in chemistry, and the paper plate simulation can be used for a variety of outcomes: stoichiometry, titrations, reaction mechanisms, and modeling various reaction types.
The quality of each group’s conclusions allows me to determine whether I need to provide more instruction on determining appropriate mechanisms based on experimental data.
Essential Questions:
▼ How can experimental controls be used to regulate the rate at which a chemical reaction will proceed? ▼ What are the industrial and environmental benefits of catalysts? ▼ Why don’t all reaction rates depend on concentration?

37 © 2012 The College Board.AP Chemistry ■ Course Planning and Pacing Guide 2
Unit
7:
Rates of Chemical Reactions (continued)
Essential Questions:
▼ How can experimental controls be used to regulate the rate at which a chemical reaction will proceed? ▼ What are the industrial and environmental benefits of catalysts? ▼ Why don’t all reaction rates depend on concentration?
Learning Objectives Materials Instructional Activities and AssessmentsEvaluate alternative explanations, as expressed by reaction mechanisms, to determine which are consistent with data regarding the overall rate of a reaction, and data that can be used to infer the presence of a reaction intermediate. [LO 4.7, SP 6.5, connects to 4.C.1, 4.C.2, 4.C.3]
Web“Mechanisms of a Chemical Reaction”
Decomposition of 30% hydrogen peroxide with 1.0 M iron (III) chloride to show a reaction intermediate
Formative Assessment:
Using the guided-inquiry handout that accompanies the activity, students work in small groups to process the data from the molecular-level online simulation. They derive the mechanism and appropriate reaction intermediate for a simulated reaction. Students can control the temperature and concentration of the reactants as well as observe that all collisions do not result in product conversion. I set up the demonstration to show evidence of a reaction intermediate (a distinct color change occurs in this reaction, which returns to the original color when complete). We discuss the nature of reaction intermediates and I have students discuss how what they observed in the online simulation relates to what they observed in the demonstration.
Translate among reaction energy profile representations, particulate representations, and symbolic representations (chemical equations) of a chemical reaction occurring in the presence and absence of a catalyst. [LO 4.8, SP 1.5]
Explain changes in reaction rates arising from the use of acid-base catalysts, surface catalysts, or enzyme catalysts, including selecting appropriate mechanisms with or without the catalyst present. [LO 4.9, SP 6.2, SP 7.2]
3% hydrogen peroxide solution, 1.0 M potassium iodide solution, 1.0 M sodium phosphate solution, platinum-coated disk from Ciba Vision Clear Care contact lens case, three-compartment divided petri dish
Formative Assessment:
Working in small groups, students observe the effects of homogeneous catalysts (KI solution), inhibitors (Na3PO4), and heterogeneous catalysts (platinum-coated disk). I provide various reaction mechanisms involving catalysts and reaction energy diagrams. As a class, we evaluate the mechanisms to explain the change in activation energy. I then extend the concept into biological systems with a discussion of enzyme function and environmental applications by discussing catalytic converters in cars as halogen/CFC catalytic decomposition of ozone.
While students are working on the online simulation, I circulate throughout the room and examine their responses to the guiding questions. This allows me to give individualized instruction and directions for further investigation when needed. During the demonstration, I ask probing questions to elicit students’ current understanding as a means to determining the next steps of instruction.
The class discussion and questions raised by students guide my next set of questions and topics of discussion. Various practice multiple-choice questions assessed through a clicker response system or by a simple raising of fingers to indicate the chosen answer allows for a quick assessment of the current understanding and lets me know when more explanation is needed.

38 © 2012 The College Board.AP Chemistry ■ Course Planning and Pacing Guide 2
Unit
7:
Rates of Chemical Reactions (continued)
Essential Questions:
▼ How can experimental controls be used to regulate the rate at which a chemical reaction will proceed? ▼ What are the industrial and environmental benefits of catalysts? ▼ Why don’t all reaction rates depend on concentration?
Learning Objectives Materials Instructional Activities and AssessmentsSummative Assessment:
This unit exam consists of multiple-choice and free-response questions, requiring students to combine conceptual reasoning and problem solving to analyze data regarding reaction rate and the factors that influence it, including establishing the order of the reaction. Data analysis and reasoning through reaction mechanisms play a large role in this exam, and students must justify their responses through molecular-level reasoning. Students propose methods for maximizing product yield for individual reactions as well as multistep mechanisms with and without catalysts. Students also relate activation energy to reaction rate, and they must discuss how catalysts succeed in lowering activation energy.
This assessment addresses the following essential questions:• How can experimental controls be used
to regulate the rate at which a chemical reaction will proceed?
•What are the industrial and environmental benefits of catalysts?
•Why don’t all reaction rates depend on concentration?

39 © 2012 The College Board.AP Chemistry ■ Course Planning and Pacing Guide 2
Unit
8:
Equilibrium Laboratory Investigations:•Titration Curves — Weak Acid/Strong Base and Weak Base/Strong Acid•Determination of Ksp for Calcium Hydroxide (guided inquiry)•Determination of K for the Formation of Fe(SCN)2+
Estimated Time: 6 weeks
Learning Objectives Materials Instructional Activities and AssessmentsGiven a set of experimental observations regarding physical, chemical, biological, or environmental processes that are reversible, construct an explanation that connects the observations to the reversibility of the underlying chemical reactions or processes. [LO 6.1, SP 6.2]
Given a set of initial conditions (concentrations or partial pressures) and the equilibrium constant, K, use the tendency of Q to approach K to predict and justify the prediction as to whether the reaction will proceed toward products or reactants as equilibrium is approached. [LO 6.4, SP 2.2, SP 6.4]
Given data (tabular, graphical, etc.) from which the state of a system at equilibrium can be obtained, calculate the equilibrium constant, K. [LO 6.5, SP 2.2]
Given a set of initial conditions (concentrations or partial pressures) and the equilibrium constant, K, use stoichiometric relationships and the law of mass action (Q equals K at equilibrium) to determine qualitatively and/or quantitatively the conditions at equilibrium for a system involving a single reversible reaction. [LO 6.6, SP 2.2, SP 6.4]
Zumdahl and Zumdahl, Chapter 13: “Chemical Equilibrium”; Chapter 14: Acids and Bases”; and Chapter 15: “Applications of Aqueous Equilibria”
Instructional Activity:
Groups of students are given containers that contain objects representing particles in an equilibrium mix (beads work well here). Each bead represents a molecule in a reversible synthesis reaction. The law of mass action is introduced, and students are asked to calculate K. Each group should get the same value for K, even though the number of particles in each container is different. Each group of students then gets a new container that represents a mixture not at equilibrium, and they calculate the ratio using the law of mass action. The concept of Q is introduced, and then students determine if and how they could get the ratio of reactants and products to be equal to K by attaching beads or detaching them.
Formative Assessment:
Students are given a third container that is not at equilibrium (this time all groups are given the same mix of beads), and they must decide if more products or reactants must be formed to reach equilibrium and how many molecules must change for this to occur. Groups present their conclusions, and we discuss the correct answer as a class.
Essential Questions:
▼ Why do chickens produce eggs with thinner shells in the summer months than in winter? ▼ Water treatment facilities often precipitate out heavy metal ions before water is reused. Is it a problem that they can never precipitate every ion? ▼ How can light be used to measure the amount of dissolved particles in a solution?
This same setup can be reused when discussing LeChatelier’s principle, and students can be given a set number of either product or reactant beads to add to their mix and decide what must happen to reach equilibrium.
Student performance on this task lets me know whether to proceed to introducing ICE charts or give another explanation of Q and K.
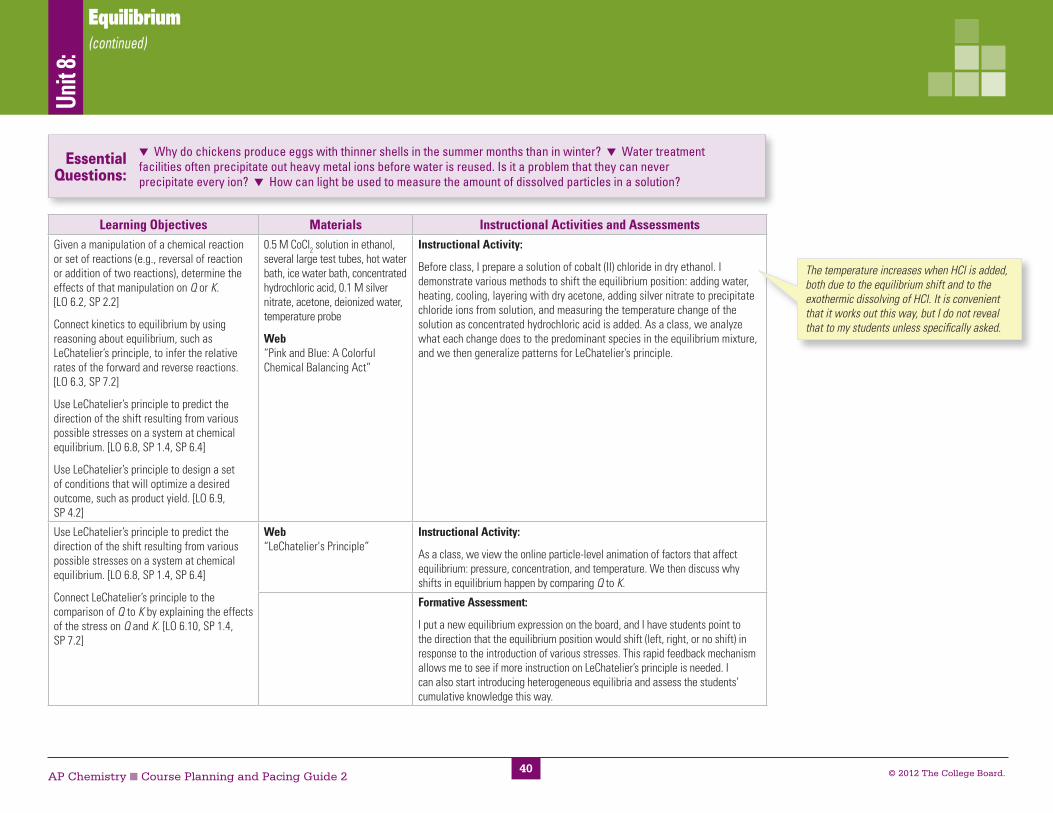
40 © 2012 The College Board.AP Chemistry ■ Course Planning and Pacing Guide 2
Essential Questions:
▼ Why do chickens produce eggs with thinner shells in the summer months than in winter? ▼ Water treatment facilities often precipitate out heavy metal ions before water is reused. Is it a problem that they can never precipitate every ion? ▼ How can light be used to measure the amount of dissolved particles in a solution?
Unit
8:
Equilibrium (continued)
Learning Objectives Materials Instructional Activities and AssessmentsGiven a manipulation of a chemical reaction or set of reactions (e.g., reversal of reaction or addition of two reactions), determine the effects of that manipulation on Q or K. [LO 6.2, SP 2.2]
Connect kinetics to equilibrium by using reasoning about equilibrium, such as LeChatelier’s principle, to infer the relative rates of the forward and reverse reactions. [LO 6.3, SP 7.2]
Use LeChatelier’s principle to predict the direction of the shift resulting from various possible stresses on a system at chemical equilibrium. [LO 6.8, SP 1.4, SP 6.4]
Use LeChatelier’s principle to design a set of conditions that will optimize a desired outcome, such as product yield. [LO 6.9, SP 4.2]
0.5 M CoCl2 solution in ethanol, several large test tubes, hot water bath, ice water bath, concentrated hydrochloric acid, 0.1 M silver nitrate, acetone, deionized water, temperature probe
Web“Pink and Blue: A Colorful Chemical Balancing Act”
Instructional Activity:
Before class, I prepare a solution of cobalt (II) chloride in dry ethanol. I demonstrate various methods to shift the equilibrium position: adding water, heating, cooling, layering with dry acetone, adding silver nitrate to precipitate chloride ions from solution, and measuring the temperature change of the solution as concentrated hydrochloric acid is added. As a class, we analyze what each change does to the predominant species in the equilibrium mixture, and we then generalize patterns for LeChatelier’s principle.
Use LeChatelier’s principle to predict the direction of the shift resulting from various possible stresses on a system at chemical equilibrium. [LO 6.8, SP 1.4, SP 6.4]
Connect LeChatelier’s principle to the comparison of Q to K by explaining the effects of the stress on Q and K. [LO 6.10, SP 1.4, SP 7.2]
Web“LeChatelier's Principle”
Instructional Activity:
As a class, we view the online particle-level animation of factors that affect equilibrium: pressure, concentration, and temperature. We then discuss why shifts in equilibrium happen by comparing Q to K.
Formative Assessment:
I put a new equilibrium expression on the board, and I have students point to the direction that the equilibrium position would shift (left, right, or no shift) in response to the introduction of various stresses. This rapid feedback mechanism allows me to see if more instruction on LeChatelier’s principle is needed. I can also start introducing heterogeneous equilibria and assess the students’ cumulative knowledge this way.
The temperature increases when HCl is added, both due to the equilibrium shift and to the exothermic dissolving of HCl. It is convenient that it works out this way, but I do not reveal that to my students unless specifically asked.

41 © 2012 The College Board.AP Chemistry ■ Course Planning and Pacing Guide 2
Essential Questions:
▼ Why do chickens produce eggs with thinner shells in the summer months than in winter? ▼ Water treatment facilities often precipitate out heavy metal ions before water is reused. Is it a problem that they can never precipitate every ion? ▼ How can light be used to measure the amount of dissolved particles in a solution?
Unit
8:
Equilibrium (continued)
Learning Objectives Materials Instructional Activities and AssessmentsJournal articleBrown and MacKay, “Le Châtelier’s Principle, Coupled Equilibrium, and Egg Shells”
Summative Assessment:
The midunit exam on fundamentals of equilibrium contains multiple-choice and free-response questions that require students to analyze particle representations and numerical computations of mixtures before achieving and during equilibrium. Students predict whether a system will produce more product or reactant in order to reach equilibrium. Additionally, students must be able to compute the equilibrium concentrations/pressures of all species. Students predict the effects of adding stress to a system at equilibrium (both heterogeneous and homogeneous), justify their prediction by comparing Q to K, and suggest methods for maximizing product yield given specific reversible reactions and their reaction enthalpies. The calcium carbonate equilibrium is highlighted in one of the questions, and students must analyze why calcium carbonate is not produced as much by chickens in the summer months.
This assessment addresses the essential question, Why do chickens produce eggs with thinner shells in the summer months than in winter?
42 © 2012 The College Board.AP Chemistry ■ Course Planning and Pacing Guide 2
Unit
8:
Equilibrium (continued)
Learning Objectives Materials Instructional Activities and AssessmentsIdentify compounds as Brønsted-Lowry acids, bases, and/or conjugate acid-base pairs, using proton-transfer reactions to justify the identification. [LO 3.7, SP 6.1]
Generate or use a particulate representation of an acid (strong or weak or polyprotic) and a strong base to explain the species that will have large versus small concentrations at equilibrium. [LO 6.11, SP 1.1, SP 1.4, SP 2.3]
Reason about the distinction between strong and weak acid solutions with similar values of pH, including the percent ionization of the acids, the concentrations needed to achieve the same pH, and the amount of base needed to reach the equivalence point in a titration. [LO 6.12, SP 1.4, SP 6.4, connects to 1.E.2]
Web“Acid-Base Solutions”
Instructional Activity:
Students work through the PhET online simulation of acid or base strength and concentration and testing of pH. Students design their own acid or base solution by varying strength and concentration and observing what happens to the pH and electrical conductivity of the solution. For this unit, only the Brønsted-Lowry definition of acids and bases is used.
Identify a given solution as being the solution of a monoprotic weak acid or base (including salts in which one ion is a weak acid or base), calculate the pH and concentration of all species in the solution, and/or infer the relative strengths of the weak acids or bases from given equilibrium concentrations. [LO 6.16, SP 2.2, SP 6.4]
Explain the relative strengths of acids and bases based on molecular structure, interparticle forces, and solution equilibrium. [LO 2.2, SP 7.2, connects to Big Idea 5, Big Idea 6]
Essential Questions:
▼ Why do chickens produce eggs with thinner shells in the summer months than in winter? ▼ Water treatment facilities often precipitate out heavy metal ions before water is reused. Is it a problem that they can never precipitate every ion? ▼ How can light be used to measure the amount of dissolved particles in a solution?
43 © 2012 The College Board.AP Chemistry ■ Course Planning and Pacing Guide 2
Learning Objectives Materials Instructional Activities and AssessmentsFor a reversible reaction that has a large or small K, determine which chemical species will have very large versus very small concentrations at equilibrium. [LO 6.7, SP 2.2, SP 2.3]
Identify a given solution as being the solution of a monoprotic weak acid or base (including salts in which one ion is a weak acid or base), calculate the pH and concentration of all species in the solution, and/or infer the relative strengths of the weak acids or bases from given equilibrium concentrations. [LO 6.16, SP 2.2, SP 6.4]
Reason about the distinction between strong and weak acid solutions with similar values of pH, including the percent ionization of the acids, the concentrations needed to achieve the same pH, and the amount of base needed to reach the equivalence point in a titration. [LO 6.12, SP 1.4, SP 6.4, connects to 1.E.2]
Test tubes, Rainbow Acid Indicator (Flinn Scientific Item U0012), 0.001 M HCl, 0.001 M H2SO4, and 0.001 M HC2H3O2
Instructional Activity:
Rainbow Acid Indicator (Flinn Scientific Item U0012) is added to 0.001 M solutions of HCl, H2SO4, and HC2H3O2. Students reason out why the pH values are not the same, and the concept of Ka is introduced. Students then calculate the pH of each solution to explain their earlier observations. Percent ionization is discussed, and how ICE charts reflect the percent ionization is explained.
Explain the relative strengths of acids and bases based on molecular structure, interparticle forces, and solution equilibrium. [LO 2.2, SP 7.2, connects to Big Idea 5, Big Idea 6]
Worksheet“Explaining Acid Strength”
Formative Assessment:
Students complete the "Explaining Acid Strength" worksheet and discuss their answers in small groups before we poll the class for their responses. Alternatively, the images of strong, weak, concentrated, and dilute acids can be projected, and students can justify whether the image depicted represents a concentrated strong acid, concentrated weak acid, dilute strong acid, or dilute weak acid. The student responses to the classification determine whether I review the concepts or progress into numeric methods of establishing acid strength (i.e., Ka).
Essential Questions:
▼ Why do chickens produce eggs with thinner shells in the summer months than in winter? ▼ Water treatment facilities often precipitate out heavy metal ions before water is reused. Is it a problem that they can never precipitate every ion? ▼ How can light be used to measure the amount of dissolved particles in a solution?
Unit
8:
Equilibrium (continued)
Many of my students find this activity to be the “aha” moment of explaining why strong does not mean the same thing as concentrated. The molecular-level views depicted build an excellent mental model for students.

44 © 2012 The College Board.AP Chemistry ■ Course Planning and Pacing Guide 2
Essential Questions:
▼ Why do chickens produce eggs with thinner shells in the summer months than in winter? ▼ Water treatment facilities often precipitate out heavy metal ions before water is reused. Is it a problem that they can never precipitate every ion? ▼ How can light be used to measure the amount of dissolved particles in a solution?
Unit
8:
Equilibrium (continued)
Learning Objectives Materials Instructional Activities and AssessmentsIdentify a given solution as being the solution of a monoprotic weak acid or base (including salts in which one ion is a weak acid or base), calculate the pH and concentration of all species in the solution, and/or infer the relative strengths of the weak acids or bases from given equilibrium concentrations. [LO 6.16, SP 2.2, SP 6.4]
Deionized water (boiled and cooled, then adjusted to neutral pH), universal indicator, three-division petri dishes, straws for stirring, various salts: NaCl, KNO2, AlCl3, NaH2PO4, Na2HPO4, Na3PO4, NH4NO3
Instructional Activity:
Before class, I add universal indicator to previously boiled and cooled deionized water and adjust the pH to neutral. I add this solution to various salts and the pH of the solution is projected for the class. As a class, we determine why some salts are acidic, basic, or neutral, writing relevant equations to justify the observations.
Formative Assessment:
Using a table of Ka values, students determine whether a given salt will be acidic, basic, or neutral. They justify their predictions with relevant chemical equations, and we test their predictions with a solution and universal indicator.
Identify a solution as being a buffer solution and explain the buffer mechanism in terms of the reactions that would occur on addition of acid or base. [LO 6.20, SP 6.4]
Given an arbitrary mixture of weak and strong acids and bases (including polyprotic systems), determine which species will react strongly with one another (i.e., with K >1) and what species will be present in large concentrations at equilibrium. [LO 6.17, SP 6.4]
Design a buffer solution with a target pH and buffer capacity by selecting an appropriate conjugate acid-base pair and estimating the concentrations needed to achieve the desired capacity. [LO 6.18, SP 2.3, SP 4.2, SP 6.4]
Alka-Seltzer tablets, deionized water, six small beakers, universal indicator, 1.0 M HCl, 1.0 M NaOH
Instructional Activity:
Before class, I add an Alka-Seltzer tablet to 200 mL of water and pour the resulting solution into three small beakers. I add deionized water to three more beakers. In class, I add universal indicator to all six beakers, and I then add strong acids and strong bases to each beaker to demonstrate buffering ability and buffer capacity.
The number of correct votes allows me to determine whether more instruction on salt hydrolysis is needed, or whether we can move on to the common ion effect.

45 © 2012 The College Board.AP Chemistry ■ Course Planning and Pacing Guide 2
Essential Questions:
▼ Why do chickens produce eggs with thinner shells in the summer months than in winter? ▼ Water treatment facilities often precipitate out heavy metal ions before water is reused. Is it a problem that they can never precipitate every ion? ▼ How can light be used to measure the amount of dissolved particles in a solution?
Unit
8:
Equilibrium (continued)
Learning Objectives Materials Instructional Activities and AssessmentsIdentify a solution as being a buffer solution and explain the buffer mechanism in terms of the reactions that would occur on addition of acid or base. [LO 6.20, SP 6.4]
Given an arbitrary mixture of weak and strong acids and bases (including polyprotic systems), determine which species will react strongly with one another (i.e., with K >1) and what species will be present in large concentrations at equilibrium. [LO 6.17, SP 6.4]
Web“Buffers”
Instructional Activity:
As a class, we view the online particle-level animation and discuss the processes happening at the particle level in buffer solutions when acids and bases are added. We extend this model into several practice problems, including devising buffer systems at a target pH. The Henderson-Hasselbach equation is introduced as a way to rearrange the Ka expression, and I have students manipulate the variables that affect pH and share how much change must occur in the acid/base ratio in order to adjust the pH of the system by one pH unit.
Identify a given solution as containing a mixture of strong acids and/or bases and calculate or estimate the pH (and concentrations of all chemical species) in the resulting solution. [LO 6.15, SP 2.2, SP 2.3, SP 6.4]
Interpret titration data for monoprotic or polyprotic acids involving titration of a weak or strong acid by a strong base (or a weak or strong base by a strong acid) to determine the concentration of the titrant and the pKa for a weak acid, or the pKb for a weak base. [LO 6.13, SP 5.1, SP 6.4, connects to 1.E.2]
Reason about the distinction between strong and weak acid solutions with similar values of pH, including the percent ionization of the acids, the concentrations needed to achieve the same pH, and the amount of base needed to reach the equivalence point in a titration. [LO 6.12, SP 1.4, SP 6.4, connects to 1.E.2]
Instructional Activity:
For the Titration Curves — Weak Acid/Strong Base and Weak Base/Strong Acid lab, a pH probe connected to a computer tracks the pH of a titration as it proceeds to and beyond the endpoint. Each group works with a different acid/base system: some groups perform the titration with the acid and some groups perform the titration with the base. Relevant data points are labeled on the graph, and the pKa is determined by the pH at the half equivalence point. After the data collection is completed, we inspect the computer-generated graphs from each group and discuss what is happening at the particle level. Using a PowerPoint presentation, I provide a particle-level visualization of the stoichiometry at critical points in the titration curve: initial conditions, buffering region, halfway to the equivalence point, equivalence point, and beyond the equivalence point.
I created the PowerPoint presentation in collaboration with another teacher, and students find it incredibly helpful for understanding the relationships between pH and the stoichiometry of the titrations of weak acids/bases. We go over how to calculate the pH at various points on the curve.

46 © 2012 The College Board.AP Chemistry ■ Course Planning and Pacing Guide 2
Essential Questions:
▼ Why do chickens produce eggs with thinner shells in the summer months than in winter? ▼ Water treatment facilities often precipitate out heavy metal ions before water is reused. Is it a problem that they can never precipitate every ion? ▼ How can light be used to measure the amount of dissolved particles in a solution?
Unit
8:
Equilibrium (continued)
Learning Objectives Materials Instructional Activities and AssessmentsDesign a buffer solution with a target pH and buffer capacity by selecting an appropriate conjugate acid-base pair and estimating the concentrations needed to achieve the desired capacity. [LO 6.18, SP 2.3, SP 4.2, SP 6.4]
Formative Assessment:
In small groups, students calculate the pH at various points on a titration curve for a new acid/base combination. They sketch a titration curve on a whiteboard to share with the rest of the class. Other groups provide feedback and share their observations about the curve being presented. Acids with different Ka values are used so that we can compare acid strength to the shape and critical points of the titration curve. Students then design a combination of an acid and base that would produce a buffer at a specified pH.
Predict the solubility of a salt, or rank the solubility of salts, given the relevant Ksp values. [LO 6.21, SP 2.2, SP 2.3, SP 6.4]
Explain observations regarding the solubility of ionic solids and molecules in water and other solvents on the basis of particle views that include intermolecular interactions and entropic effects. [LO 2.15, SP 1.4, SP 6.2, connects to 5.E.1]
0.01 M Pb(NO3)2, 0.1 M KI, table of Ksp values, 250 mL graduated cylinder
Formative Assessment:
After examining the Ksp tables for patterns (including ion charge, ionic radius, polyatomic vs. monoatomic ions, etc.), we investigate the Ksp of lead (II) iodide. One drop of 0.1 M potassium iodide is added to 250 mL of 0.01 M lead (II) nitrate. A precipitate forms but then dissolves as it dissipates through the solution. Based on Ksp, students calculate whether the precipitate should have formed, and we discuss the observation as a class. Students determine how many mL of the 0.1 M KI solution would need to be added for a lasting precipitate to be formed. They share their calculated values and I write them on the board, grouping any common answers. We then agree as a class which is the best answer.
Interpret data regarding the relative solubility of salts in terms of factors (common ions, pH) that influence the solubility. [LO 6.23, SP 5.1, SP 6.4]
Web“Color Changing Milk of Magnesia”
Instructional Activity:
I add universal indicator to a slurry of ice and milk of magnesia on a magnetic stir plate. I add a few milliliters at a time of 6 M sulfuric acid. Students observe the buffering ability as well as the shifting of the solubility equilibrium as more sulfuric acid is added.
Students’ success at this task allows me to determine whether more instruction on buffering and acid/base titrations is needed.
On the end-of-year course evaluations that I give my students, they often indicate that this is one of their favorite demonstrations.
Students’ success at this task determines whether I need to review precipitation formation or can continue to the common ion effect in solubility.

47 © 2012 The College Board.AP Chemistry ■ Course Planning and Pacing Guide 2
Unit
8:
Equilibrium (continued)
Essential Questions:
▼ Why do chickens produce eggs with thinner shells in the summer months than in winter? ▼ Water treatment facilities often precipitate out heavy metal ions before water is reused. Is it a problem that they can never precipitate every ion? ▼ How can light be used to measure the amount of dissolved particles in a solution?
Learning Objectives Materials Instructional Activities and AssessmentsInterpret data regarding solubility of salts to determine, or rank, the relevant Ksp values. [LO 6.22, SP 2.2, SP 2.3, SP 6.4]
Apply Coulomb’s Law qualitatively (including using representations) to describe the interactions of ions, and the attractions between ions and solvents to explain the factors that contribute to the solubility of ionic compounds. [LO 2.14, SP 1.4, SP 6.4]
pH probes, saturated solution of calcium hydroxide, filter paper, funnel, small beaker or Erlenmeyer flask, deionized water
Instructional Activity:
For the Determination of Ksp for Calcium Hydroxide guided-inquiry lab, students work in small groups to design a procedure to determine the Ksp of calcium hydroxide. They submit a written protocol and complete the experiment the following day. As part of their lab write-up, students must examine the provided Ksp values for the other Group II hydroxides (magnesium hydroxide, strontium hydroxide, and barium hydroxide) and explain why they are different using reasoning about ionic radii, Coulombic attractions, and lattice energy.
Design and/or interpret the results of an experiment regarding the absorption of light to determine the concentration of an absorbing species in a solution. [LO 1.16, SP 4.2, SP 5.1]
Randall, “The Determination of an Equilibrium Constant”
Formative Assessment:
For the Determination of K for the Formation of Fe(SCN)2+ lab, different lab groups prepare five standard solutions of Fe(SCN)2+. Students use a spectrophotometer to make a Beer-Lambert law calibration plot of concentration versus absorbance at 470 nm. Then, several other combinations of iron (III) nitrate and potassium thiocyanate are combined by the students to make several equilibrium mixtures. Their absorbance is measured and a value for K is calculated. As part of their lab reports, students propose a method of adapting this procedure to determine the concentration of nickel (II) ions in a solution.
Summative Assessment:
The formal lab report serves as one assessment of the students’ ability to relate interactions with light to solution components and concentration. The lab report requires students to construct a Beer-Lambert plot of absorbance versus concentration, perform a linear regression to determine the equation of the line, and use this equation to determine the concentration of the product in an equilibrium mixture. Students analyze the factors limiting their precision in this experiment and propose how to adapt this experiment to study a different equilibrium mixture that would have a maximum absorbance at a different wavelength of light.
This assessment addresses the essential question, How can light be used to measure the amount of dissolved particles in a solution?
I provide feedback on their proposals directly, and their experimental protocols allow me to determine whether more instruction is needed on the use of a Beer-Lambert plot to determine concentration in spectroscopy.

48 © 2012 The College Board.AP Chemistry ■ Course Planning and Pacing Guide 2
Unit
8:
Equilibrium (continued)
Essential Questions:
▼ Why do chickens produce eggs with thinner shells in the summer months than in winter? ▼ Water treatment facilities often precipitate out heavy metal ions before water is reused. Is it a problem that they can never precipitate every ion? ▼ How can light be used to measure the amount of dissolved particles in a solution?
Learning Objectives Materials Instructional Activities and AssessmentsSummative Assessment:
The unit test contains multiple-choice and free-response questions that require students to predict the concentrations of various species in weak acid and weak base solutions, as well as in salts that undergo hydrolysis. Students analyze buffers and titration curves for the concentration of various species. Students must also compare the concentrations of important chemical species in different weak/strong acids, weak/strong bases, buffers, and various combinations of these. Students analyze solubility equilibrium systems, as well as their manipulation through the common ion effect and LeChatelier’s principle. Students analyze data with a provided Beer-Lambert plot, and they use this data to calculate K for a provided system.
Use representations and models to predict the sign and relative magnitude of the entropy change associated with chemical or physical processes. [LO 5.12, SP 1.4]
Analyze the enthalpic and entropic changes associated with the dissolution of a salt, using particulate level interactions and representations. [LO 6.24, SP 1.4, SP 7.1, connects to 5.E]
Zumdahl and Zumdahl, Chapter 16: “Spontaneity, Entropy, and Free Energy”
Web“Entropy”
Instructional Activity:
Using an online tutorial, students investigate the particle-level changes associated with entropy changes (thermal, states of matter, molecular size). The tutorial guides students on using standard entropy values to calculate ΔS for a process. Students work in small groups, and I circulate throughout the room to check on their progress. The tutorial has embedded questions to check for understanding, and the nature of students’ questions guides the remainder of the class. Homework exercises and in-class practice problems are excerpted from the relevant chapters to the left.
Web“Mixing Ethanol and Water”
“Solubility”
Formative Assessment:
For homework, students complete the two online simulations/animations that use particle-level animations to investigate the effects of interparticle forces (Coulombic, dipole, and dispersion forces); enthalpy; and entropy in the dissolving process. The Concord Consortium animation has questions embedded in the activity, and it can be set up so that students print or email their responses prior to the next day’s class. These two simulations/animations really focus on the particle-level reasoning for these processes. They build a great mental model of the dispersion of matter increasing the entropy of the system, and the embedded links provide excellent context to biological applications.
This assessment addresses the following essential questions:•Water treatment facilities often precipitate
out heavy metal ions before water is reused. Is it a problem that they can never precipitate every ion?
• How can light be used to measure the amount of dissolved particles in a solution?
There are no labs for this unit, since entropy and free energy are not easily measurable with the equipment available in most high school laboratories. Instead, time is spent with particle-level animations and visualizations to bring greater conceptual understanding in this rather abstract unit.
By viewing the responses or having students compare with classmates, we can identify what topics were understood from the covering of the solvation process at the beginning of the year and what needs to be reinforced. I provide feedback on general patterns that I see (both of mastery and deficiency).

49 © 2012 The College Board.AP Chemistry ■ Course Planning and Pacing Guide 2
Unit
9:
Entropy and Free Energy Laboratory Investigations:(no labs for this unit)
Estimated Time: 1–2 weeks
Learning Objectives Materials Instructional Activities and AssessmentsPredict whether or not a physical or chemical process is thermodynamically favored by determination of (either quantitatively or qualitatively) the signs of both ΔH° and ΔS°, and calculation or estimation of ΔG° when needed. [LO 5.13, SP 2.2, SP 2.3, SP 6.4, connects to 5.E.3]
Determine whether a chemical or physical process is thermodynamically favorable by calculating the change in standard Gibbs free energy. [LO 5.14, SP 2.2, connects to 5.E.2]
Thick rubber bands Instructional Activity:
Students are each handed a rubber band and asked to stretch it and assess any changes in temperature by holding it against their bottom lip. They then release the rubber band and detect any temperature changes. From their observations, we determine whether the entropy of the system is increasing or decreasing, and whether the rubber molecules are getting more ordered or less. From here, we introduce the idea of free energy and the Gibbs-Hemholtz equation to determine ΔG.
Explain how the application of external energy sources or the coupling of favorable with unfavorable reactions can be used to cause processes that are not thermodynamically favorable to become favorable. [LO 5.15, SP 6.2]
Plastic milk jug, heat gun Formative Assessment:
I use a heat gun to warm a section of a #2 (HDPE) plastic milk jug, and students observe that the plastic becomes clearer. Blowing into the jug expands the heated plastic, and it becomes cloudy again. Students debate in small groups what heating the plastic did to the entropy and the sign of ΔG. Each group shares their conclusions and thought processes. I show several molecular-level illustrations of the polymer strands through the heating process so that students know whether their thought processes were consistent with the model of entropy, enthalpy, and free energy that was presented previously.
Predict whether or not a physical or chemical process is thermodynamically favored by determination of (either quantitatively or qualitatively) the signs of both ΔH° and ΔS°, and calculation or estimation of ΔG° when needed. [LO 5.13, SP 2.2, SP 2.3, SP 6.4, connects to 5.E.3]
Journal articleCampbell, et al., “Spontaneous Assembly of Soda Straws”
Instructional Activity:
Straw pieces are submerged in water and allowed to float to the top. The straw pieces can be stirred vigorously, but the straw pieces consistently line up end to end. The signs for ΔH, ΔS, and ΔG are discussed, and this provides a segue into discussing self-assembly of molecules.
Essential Questions:
▼ How can an endothermic reaction ever be thermodynamically favorable? ▼ Why is it easier to prevent a pollutant from entering the environment than to clean it up after it has already dispersed into the soil or water supply? ▼ How is it possible for solutions to form when they have endothermic heats of solution? ▼ Combustion is thermodynamically favored, so why hasn’t all of the combustible material in the world already burned?
The number of students responding correctly allows me to determine whether more instruction is needed or students are ready to move forward.
Self-assembly is a very important concept for nanotechnology and nanoarchitecture.
50 © 2012 The College Board.AP Chemistry ■ Course Planning and Pacing Guide 2
Unit
9:
Entropy and Free Energy (continued)
Essential Questions:
▼ How can an endothermic reaction ever be thermodynamically favorable? ▼ Why is it easier to prevent a pollutant from entering the environment than to clean it up after it has already dispersed into the soil or water supply? ▼ How is it possible for solutions to form when they have endothermic heats of solution? ▼ Combustion is thermodynamically favored, so why hasn’t all of the combustible material in the world already burned?
Learning Objectives Materials Instructional Activities and AssessmentsUse LeChatelier’s principle to make qualitative predictions for systems in which coupled reactions that share a common intermediate drive formation of a product. [LO 5.16, SP 6.4, connects to 6.B.1]
Make quantitative predictions for systems involving coupled reactions that share a common intermediate, based on the equilibrium constant for the combined reaction. [LO 5.17, SP 6.4, connects to 6.A.2]
Whiteboards and markers, tables of thermodynamic data
Web“Metal ores”
Instructional Activity:
As a class, we investigate various methods of extracting metals from the naturally occurring ores. We calculate the ΔH and ΔS to determine if they are thermodynamically favorable. The class is then divided into four groups, and each group is given one of four different ores and some information on their method of extraction. They determine the effects of adding oxygen, carbon, or carbon monoxide on the ΔH, ΔS, and ΔG of the combined reactions and summarize their results on whiteboards. We discuss as a class the findings of each group. The concept of coupling reactions is extended into biological systems, where it is incredibly common (although more complex).
Explain why a thermodynamically favored chemical reaction may not produce large amounts of product (based on consideration of both initial conditions and kinetic effects), or why a thermodynamically unfavored chemical reaction can produce large amounts of product for certain sets of initial conditions. [LO 5.18, SP 1.3, SP 7.2, connects to 6.D.1]
Web“Endothermic and Exothermic Reactions”
Instructional Activity:
Students mix barium hydroxide and ammonium nitrate in a stoppered flask and swirl them together until a liquid forms. Students then place a small drop of water on a wood block, and the flask is rested on top of it for a few minutes. The flask is lifted and the block is stuck to the bottom. Students feel the flask and determine that it is significantly below room temperature. In small groups, they debate why the reaction is thermodynamically favored.
Formative Assessment:
Students predict whether the mixing of baking soda and vinegar is endothermic or exothermic, given that it is clearly thermodynamically favored. I then test their predictions by conducting the reaction and measuring the temperature with a thermometer.
Zinc, iron, tin, and lead are extracted by the reaction with carbon or carbon monoxide. Zinc can be extracted from zinc sulfide more effectively in the presence of oxygen to make SO2 gas. Copper can be extracted from copper oxide by the addition of H2 gas.
The number of students responding correctly allows me to determine whether more instruction is needed or students are ready to move forward.
51 © 2012 The College Board.AP Chemistry ■ Course Planning and Pacing Guide 2
Unit
9:
Entropy and Free Energy (continued)
Essential Questions:
▼ How can an endothermic reaction ever be thermodynamically favorable? ▼ Why is it easier to prevent a pollutant from entering the environment than to clean it up after it has already dispersed into the soil or water supply? ▼ How is it possible for solutions to form when they have endothermic heats of solution? ▼ Combustion is thermodynamically favored, so why hasn’t all of the combustible material in the world already burned?
Learning Objectives Materials Instructional Activities and AssessmentsSummative Assessment:
The unit exam consists of multiple-choice and free-response questions that require students to determine the sign of the enthalpy, entropy, and free energy changes for a described process. They indicate whether the process is thermodynamically favored, or if the favorability is temperature dependent. Students consider reactions that have large K values as well as negative values of ΔG, but they do not produce many products due to high activation energy. Students consider reactions that are coupled by a common intermediate and evaluate their favorability with and without the intermediate.
This assessment addresses the following essential questions:• How can an endothermic reaction ever be
thermodynamically favorable?•Why is it easier to prevent a pollutant from
entering the environment than to clean it up after it has already dispersed into the soil or water supply?
• How is it possible for solutions to form when they have endothermic heats of solution?
• Combustion is thermodynamically favored, so why hasn’t all of the combustible material in the world already burned?

52 © 2012 The College Board.AP Chemistry ■ Course Planning and Pacing Guide 2
Unit
10:
Electrochemistry Laboratory Investigations:•Electrolysis Reactions•Electroplating Pennies•Duragizer Research (guided inquiry)
Estimated Time: 2 weeks
Essential Questions:
▼ Why are lithium-ion batteries used for most high-tech devices like cell phones and laptops? ▼ How can corrosion of cars, ships, and statues be avoided when they are constantly exposed to oxygen in the air and water? ▼ Why can’t rechargeable batteries be recharged forever? ▼ Why is it not possible to obtain sodium metal from the electrolysis of salt water?
Learning Objectives Materials Instructional Activities and AssessmentsAnalyze data regarding galvanic or electrolytic cells to identify properties of the underlying redox reactions. [LO 3.13, SP 5.1]
Zumdahl and Zumdahl, Chapter 17: “Electrochemistry”
Orange juice, magnesium ribbon, copper strip, two wires with alligator leads, quartz clock, ring stand
Video“The World of Chemistry #15: The Busy Electron”
Instructional Activity:
I construct a simple battery by submerging the two electrodes into the orange juice and attaching it to the battery compartment of a quartz clock. I instruct students to ask as many questions as they can think of. We allow the clock to run for as long as possible, and we examine the magnesium anode after a day to see if it corrodes away. As a class, we examine the table of standard reduction potentials, and discuss where the electrons are coming from and going to in order to power the clock. After discussing half-reactions, we watch the first 11 minutes of the video, which shows the redox reactions happening in each electrode in a copper-zinc cell. Homework exercises and in-class practice problems are excerpted from the relevant chapters to the left.
Analyze data regarding galvanic or electrolytic cells to identify properties of the underlying redox reactions. [LO 3.13, SP 5.1]
Translate among macroscopic observations of change, chemical equations, and particle views. [LO 3.1, SP 1.5, SP 7.1]
Web“Zinc Copper Electrochemical Cell”
Instructional Activity:
Students examine the online simulation, which provides macroscopic and atomic views of the process. Students examine the table of standard reduction potentials to determine the underlying redox reactions and why the zinc copper cell voltage equates to a cell voltage of 1.10 V. Students write relevant half-reactions for the anode and cathode, and, as a class, we discuss how to use standard reduction potential to calculate cell potential.
Whiteboards, markers, table of standard reduction potentials
Formative Assessment:
I give different groups of students a different target voltage for a galvanic cell and ask them to construct a drawing of a cell that would yield that value. Each group shares their drawing with the rest of the class. Classmates indicate if they agree or disagree with their findings, and whether another cell could be created to yield the same voltage.
I purposely end with this unit because electrochemistry provides an excellent review of the year, as it incorporates oxidation states, electron transfer reactions, net ionic equations, solubility concerns, equilibrium, free energy, stoichiometry, and periodic trends. Having this unit last allows me to review some of the major concepts from the year prior to starting the review for the AP Exam.
I stand back for most of this discussion, interceding only if students do not realize that more than one combination can often result in the desired cell potential. I can tell by the group presentations whether I need to explain galvanic cells further.

53 © 2012 The College Board.AP Chemistry ■ Course Planning and Pacing Guide 2
Learning Objectives Materials Instructional Activities and AssessmentsIdentify redox reactions and justify the identification in terms of electron transfer. [LO 3.8, SP 6.1]
Make qualitative or quantitative predictions about galvanic or electrolytic reactions based on half-cell reactions and potentials and/or Faraday’s Laws. [LO 3.12, SP 2.2, SP 2.3, SP 6.4]
Explain how the application of external energy sources or the coupling of favorable with unfavorable reactions can be used to cause processes that are not thermodynamically favorable to become favorable. [LO 5.15, SP 6.2]
9V battery with alligator leads, mechanical pencil refills, three-partition petri dishes, 0.5 M NaCl, 0.5 M KI, 0.5 M CuBr2, soluble starch solution, phenolphthalein
Cesa, “Electrolysis Reactions”
Instructional Activity:
Students use a 9V battery to electrolyze 0.5 M solutions of NaCl, KI, and CuBr2. They then derive appropriate half-reactions for the chemical process at each electrode based on their observations of changes in state of matter and pH.
Summative Assessment:
In the formal lab report for this experiment, students write balanced overall reactions for the electrolytic cell, identify the processes happening at each electrode, determine the minimum voltage needed to cause the reaction to occur, and determine which electrode increases in mass and which decreases.
Unit
10:
Electrochemistry (continued)
Essential Questions:
▼ Why are lithium-ion batteries used for most high-tech devices like cell phones and laptops? ▼ How can corrosion of cars, ships, and statues be avoided when they are constantly exposed to oxygen in the air and water? ▼ Why can’t rechargeable batteries be recharged forever? ▼ Why is it not possible to obtain sodium metal from the electrolysis of salt water?
This assessment addresses the following essential questions:•Why can’t rechargeable batteries be
recharged forever?•Why is it not possible to obtain sodium metal
from the electrolysis of salt water?

54 © 2012 The College Board.AP Chemistry ■ Course Planning and Pacing Guide 2
Unit
10:
Electrochemistry (continued)
Essential Questions:
▼ Why are lithium-ion batteries used for most high-tech devices like cell phones and laptops? ▼ How can corrosion of cars, ships, and statues be avoided when they are constantly exposed to oxygen in the air and water? ▼ Why can’t rechargeable batteries be recharged forever? ▼ Why is it not possible to obtain sodium metal from the electrolysis of salt water?
Learning Objectives Materials Instructional Activities and AssessmentsMake qualitative or quantitative predictions about galvanic or electrolytic reactions based on half-cell reactions and potentials and/or Faraday’s Laws. [LO 3.12, SP 2.2, SP 2.3, SP 6.4]
Explain how the application of external energy sources or the coupling of favorable with unfavorable reactions can be used to cause processes that are not thermodynamically favorable to become favorable. [LO 5.15, SP 6.2]
Use stoichiometric calculations to predict the results of performing a reaction in the laboratory and/or to analyze deviations from the expected results. [LO 3.3, SP 2.2, SP 5.1]
Evaluate the classification of a process as a physical change, chemical change, or ambiguous change based on both macroscopic observations and the distinction between rearrangement of covalent interactions and noncovalent interactions. [LO 3.10, SP 1.4, SP 6.1, connects to 5.D.2]
Several new pennies, 1.0 M NaOH solution, beaker or evaporating dish, 9V battery with alligator clips, zinc strip, thick gauge copper wire, 20 mesh zinc dust, hot plate, analytical balance (±0.0001 g)
Instructional Activity:
Students mass a new penny with an analytical balance. They attach the penny to the negative electrode, which is attached to a 9V battery. A zinc strip is attached to the positive electrode. The penny is submerged in a 1.0 M NaOH solution with zinc dust and the zinc electrode for 10 minutes. Students dry the penny, and mass it again. Using Faraday’s laws, they calculate the current that must have been delivered to plate the zinc onto the penny. After drying, students can place the penny on a warm hot plate to make brass. They must state whether the process is a physical or chemical change and justify their answer with particulate-level reasoning.
Make qualitative or quantitative predictions about galvanic or electrolytic reactions based on half-cell reactions and potentials and/or Faraday’s laws. [LO 3.12, SP 2.2, SP 2.3, SP 6.4]
Use stoichiometric calculations to predict the results of performing a reaction in the laboratory and/or to analyze deviations from the expected results. [LO 3.3, SP 2.2, SP 5.1]
Web“Voltaic Cell”
Instructional Activity:
As a primer for the guided-inquiry lab that follows, students work in small groups to examine the effects of changing the solution concentration of the anode and cathode. After several trials, they generalize a rule.
Students can make good arguments for either chemical or physical here, as definite changes in properties occur. The deciding factor becomes whether covalent interactions are being broken or formed.

55 © 2012 The College Board.AP Chemistry ■ Course Planning and Pacing Guide 2
Unit
10:
Electrochemistry (continued)
Essential Questions:
▼ Why are lithium-ion batteries used for most high-tech devices like cell phones and laptops? ▼ How can corrosion of cars, ships, and statues be avoided when they are constantly exposed to oxygen in the air and water? ▼ Why can’t rechargeable batteries be recharged forever? ▼ Why is it not possible to obtain sodium metal from the electrolysis of salt water?
Learning Objectives Materials Instructional Activities and AssessmentsMake qualitative or quantitative predictions about galvanic or electrolytic reactions based on half-cell reactions and potentials and/or Faraday’s laws. [LO 3.12, SP 2.2, SP 2.3, SP 6.4]
Explain how the application of external energy sources or the coupling of favorable with unfavorable reactions can be used to cause processes that are not thermodynamically favorable to become favorable. [LO 5.15, SP 6.2]
Use stoichiometric calculations to predict the results of performing a reaction in the laboratory and/or to analyze deviations from the expected results. [LO 3.3, SP 2.2, SP 5.1]
Instructional Activity:
In the Duragizer Research guided-inquiry lab, student groups pretend they have been commissioned by a hypothetical company to build the highest voltage battery possible. They are presented with a choice of five electrodes, and ionic solutions of those same metals in three concentrations: 0.1 M, 1.0 M, and 2.0 M. They have one class period to build and test the voltage of a cell with the highest voltage possible.
Whiteboards, markers, table of standard reduction potentials
Formative Assessment:
As a follow-up to the lab, each student group must propose how they could achieve the maximum cell potential on a whiteboard to present to the class. The class then evaluates the advantages and limitations of each proposed cell (safety, effectiveness, likelihood of obtaining the required materials, etc.). I facilitate the discussion, and introduce “what if” and “did you consider whether” questions when needed.
Summative Assessment:
The unit exam consists of multiple-choice and free-response questions that require students to analyze galvanic and electrolytic cells, predict the cell potential, determine if it will operate galvanically or electrolytically, propose methods of increasing or decreasing the cell potential, and draw electrochemical cells with the appropriate redox half-reactions. Students must also be able to determine which metal will plate out of solution first in a mixture of ions (based on standard reduction potentials), and defend whether electroplating should be considered a chemical or physical process. Students analyze various common batteries for their underlying redox reactions, and postulate how to improve the batteries’ performance (increase voltage or lifetime) based on electrochemical principles. Students justify the use of sacrificial anodes based on half-reaction voltages.
This lab is much more manageable if you narrow the choices and have students submit proposals before the actual lab period.
By this point in the year, students are fairly good at providing questions and feedback during whiteboard presentations. My role is mostly to monitor the interactions and make sure that the discussion represents valid chemical reasoning. The nature of the student designs allows me to determine whether more instruction is needed on galvanic cells and the concentration dependence of the cell potential.
This assessment addresses the following essential questions:•Why are lithium-ion batteries used for
most high-tech devices like cell phones and laptops?
• How can corrosion of cars, ships, and statues be avoided when they are constantly exposed to oxygen in the air and water?
•Why can’t rechargeable batteries be recharged forever?

56AP Chemistry ■ Course Planning and Pacing Guide 2 © 2012 The College Board.
General Resources
Textbook
Zumdahl, Steven S., and Susan Arena Zumdahl. Chemistry. 7th ed. Boston: Houghton Mifflin, 2007.
Laboratory Manuals
Cesa, Irene. ed. Flinn ChemTopic Labs: Experiments and Demonstrations in Chemistry. Batavia, IL: Flinn Scientific, 2002.
Randall, Jack. Advanced Chemistry with Vernier. Beaverton, OR: Vernier Software & Technology, 2004.
Vonderbrink, Sally Ann. Laboratory Experiments for Advanced Placement Chemistry. Batavia, IL: Flinn Scientific, 1995.
Demonstration Manuals
Bilash, Borislaw, II, George R. Gross, and John K. Koob. A Demo a Day: A Year of Chemical Demonstrations. Batavia, IL: Flinn Scientific, 1995.
Bilash, Borislaw, II, George R. Gross, and John K. Koob. A Demo a Day Volume 2: Another Year of Chemical Demonstrations. Batavia, IL: Flinn Scientific, 1998.
Summerlin, Lee R., and James L. Ealy, Jr. Chemical Demonstrations: A Sourcebook for Teachers. 2nd ed. Vol. 1. Washington, DC: American Chemical Society, 1988.
Summerlin, Lee R., Christine L. Borgford, and Julie B. Ealy. Chemical Demonstrations: A Sourcebook for Teachers. 2nd ed. Vol. 2. Washington, DC: American Chemical Society, 1988.
Online Simulations and Resources
“Activities.” The Concord Consortium. Accessed June 12, 2012. http://www.concord.org/activities.
“Animations Index.” Chemical Education Research Group. Iowa State University. Accessed June 12, 2012. http://group.chem.iastate.edu/Greenbowe/sections/projectfolder/animationsindex.htm.
“AP Chemistry Course Home Page.” AP Central. The College Board. Accessed June 12, 2012. http://apcentral.collegeboard.com/apc/public/courses/teachers_corner/2119.html.
“Education.” Royal Society of Chemistry. Accessed June 12, 2012. http://www.rsc.org/education/.
“Free Chemistry Animations.” LearnersTV. Accessed June 12, 2012. http://www.learnerstv.com/animation/animationcategory.php?cat=chemistry.
Gelder, John, and Michael Abraham. “MoLE Project.” Molecular Level Laboratory Experiments. Accessed June 12, 2012. http://genchem1.chem.okstate.edu/ccli/Startup.html.
“Interactive Simulations.” PhET. University of Colorado at Boulder. Accessed June 12, 2012. http://phet.colorado.edu.
“Teacher Resources: Science.” Annenberg Learner. Accessed June 12, 2012. http://www.learner.org/resources/browse.html?discipline=6&grade=0.
Unit 1 (The Structure of Matter) Resources
“Distillation.” Footprints-Science. Accessed June 8, 2012. http://www.footprints-science.co.uk/distillation.htm.
Grim, Nancy, C., and Jerry L. Sarquis. “Mass Spectrometry Analogy on the Overhead Projector.” Journal of Chemical Education 72, no. 10 (October 1995): 930–931. Accessed June 14, 2012. http://pubs.acs.org/doi/abs/10.1021/ed072p930.
“Relative Atomic Mass — The Mole.” The Mole Concept. VHS. Directed by David Chamberlain. Princeton, NJ: Films for the Humanities & Sciences, 1992.
Unit 2 (Stoichiometry and Reactions in Solution) Resources
Chang, Raymond. “Molecular View of Solution Formation.” Essential Chemistry 2/e. Accessed June 8, 2012. http://www.mhhe.com/physsci/chemistry/essentialchemistry/flash/molvie1.swf.
“Metal/Metal Ion Reactions: A Laboratory Simulation.” Chemical Education Research Group. Iowa State University. Accessed June 8, 2012. http://group.chem.iastate.edu/Greenbowe/sections/projectfolder/Metal%3DMetalIonTutorialtgrt.pdf.
“Metals in Aqueous Solutions.” Chemical Education Research Group. Iowa State University. Accessed June 8, 2012. http://group.chem.iastate.edu/Greenbowe/sections/projectfolder/flashfiles/redox/home.html.
“Molarity — Solute, Solvent, Solutions.” PhET. University of Colorado at Boulder. Accessed June 8, 2012. http://phet.colorado.edu/en/simulation/molarity.
Resources

57AP Chemistry ■ Course Planning and Pacing Guide 2 © 2012 The College Board.
Resources (continued)
Prilliman, Stephen. “Solubility Rules and Net Ionic Equations.” Process Oriented Guided Inquiry Learning (POGIL). Accessed June 8, 2012. http://www.pogil.org/uploads/media_items/net-ionic-reactions.original.pdf.
“Redox Titration in Acidic Medium.” Chemical Education Research Group. Iowa State University. Accessed June 8, 2012. http://group.chem.iastate.edu/Greenbowe/sections/projectfolder/flashfiles/redoxNew/redox.html.
“Salts & Solubility.” PhET. University of Colorado at Boulder. Accessed June 8, 2012. http://phet.colorado.edu/en/simulation/soluble-salts.
Unit 3 (Chemical Energy and Thermochemistry) Resources
“Atoms and Conservation of Energy.” Molecular Workbench. The Concord Consortium, Inc. Accessed June 10, 2012. http://workbench.concord.org/database/activities/310.htm.
Cesa, Irene, ed. “Heats of Reaction and Hess’s Law.” In Flinn ChemTopic Labs: Experiments and Demonstrations in Chemistry. Vol. 10, Thermochemistry, 51–62. Batavia, IL: Flinn Scientific, 2002.
Holmquist, Dan D., Jack Randall, and Donald L. Volz. “Experiment 4: Heat of Fusion of Ice.” In Chemistry with Vernier. Beaverton, OR: Vernier Software & Technology, 2004. This lab is available online at http://www.vernier.com/experiments/cwv/4/heat_of_fusion_of_ice/.
Miller, George. “Ending Misconceptions About the Energy of Chemical Bonds.” AP Central. Accessed June 10, 2012. http://apcentral.collegeboard.com/apc/members/courses/teachers_corner/49039.html.
Unit 4 (Atomic Structure and Periodicity) Resources
Chang, Raymond. “Atomic Radii.” Essential Chemistry 2/e. Accessed June 11, 2012. http://www.mhhe.com/physsci/chemistry/essentialchemistry/flash/atomic4.swf.
“Ionization Energy: 1st: Cylinders.” WebElements. Accessed June 11, 2012. http://www.webelements.com/periodicity/ionisation_energy_1/cylinders_chart.html.
“Models of the Hydrogen Atom.” PhET. University of Colorado at Boulder. Accessed June 11, 2012. http://phet.colorado.edu/en/simulation/hydrogen-atom.
Moog, Richard S., and John J. Farrell. “Photoelectron Spectroscopy.” Chap. 8 in Chemistry: A Guided Inquiry, 42–49. 3rd ed. Hoboken, NJ: Wiley, 2006. A modified version of this experiment is available at http://scidiv.bellevuecollege.edu/jm/c140/c140%20f06/POGIL/PES_140.pdf.
Unit 5 (Bonding) Resources
“Bonding Quiz.” Chemistry Learning Tools. Accessed June 11, 2012. http://treefrog.fullerton.edu/chem/montana/geo11.htm.
Damelin, Dan. “Chromatography.” Damelin Chemsite. Accessed June 11, 2012. http://chemsite.lsrhs.net/Intro/chromatography.html.
“Molecule Shapes.” PhET. University of Colorado at Boulder. Accessed June 11, 2012. http://phet.colorado.edu/en/simulation/molecule-shapes.
Moog, Richard S., and John J. Farrell. “The Bond Type Triangle.” Chap. 26 in Chemistry: A Guided Inquiry, 146–150. 3rd ed. Hoboken, NJ: Wiley, 2006.
“Separation of Food Dyes Via Column Chromatography.” University of Minnesota. Department of Chemistry. Accessed June 18, 2012. http://www.chem.umn.edu/services/lecturedemo/info/column_chromatography.html.
Unit 6 (States of Matter and Interparticle Forces) Resources
“The Atomic Structure and the Properties of Materials.” yTeach.co.uk. Accessed June 11, 2012. http://www.yteach.co.uk/page.php/resources/view_all?id=p5_stresses_matter_equilibrium_compression_tension_shear_torsion_structure_atomic_page_6. Note: License purchase required to use in class.
Holmquist, Dan D., Jack Randall, and Donald L. Volz. “Experiment 2: Freezing and Melting of Water.” In Chemistry with Vernier. Beaverton, OR: Vernier Software & Technology, 2004. This lab is available online at http://www.vernier.com/experiments/cwv/2/freezing_and_melting_of_water/.
“Intermolecular Attractions.” The Concord Consortium. Accessed June 11, 2012. http://www.concord.org/activities/intermolecular-attractions.
“Kinetic Energies in a Gas.” Prentice Hall Media. Accessed June 11, 2012. http://wps.prenhall.com/wps/media/objects/603/618448/KineticEnergiesinaGas.html.

58AP Chemistry ■ Course Planning and Pacing Guide 2 © 2012 The College Board.
Resources (continued)
“Nature of Metallic Bonding.” yTeach.co.uk. Accessed June 11, 2012. http://www.yteach.co.uk/page.php/resources/view_all?id=bond_covalent_malleable_conducting_electricity_heat_periodic_table_electron_configuration_metal_page_7. Note: license purchase required to use in class.
“States of Matter.” PhET. University of Colorado at Boulder. Accessed June 11, 2012. http://phet.colorado.edu/en/simulation/states-of-matter.
Weiner, J. “Metallic Bonding and Metallic Properties.” YouTube video, 7:37. Posted November 23, 2011. http://www.youtube.com/watch?v=Bjf9gMDP47s.
Supplementary Resources
“Gas Properties — Gas, Pressure, Volume.” PhET. University of Colorado at Boulder. Accessed June 18, 2012. http://phet.colorado.edu/en/simulation/gas-properties.
Unit 7 (Rates of Chemical Reactions) Resources
Cesa, Irene. “Kinetics of a Blue Bottle.” In Flinn ChemTopic Labs Book, Volume 14. Batavia, IL: Flinn Scientific, 2002.
Chang, Raymond. “Activation Energy.” Essential Chemistry 2/e. Accessed June 11, 2012. http://www.mhhe.com/physsci/chemistry/essentialchemistry/flash/activa2.swf.
“Mechanisms of a Chemical Reaction.” Web-Based Simulations/Inquiry Activities. Oklahoma State University. Accessed June 11, 2012. http://introchem.chem.okstate.edu/DCICLA/Mechanisms.pdf.
Unit 8 (Equilibrium) Resources
“Acid-Base Solutions.” PhET. University of Colorado at Boulder. Accessed June 11, 2012. http://phet.colorado.edu/en/simulation/acid-base-solutions.
Brown, David B., and John A. MacKay III. “Le Châtelier’s Principle, Coupled Equilibrium, and Egg Shells.” Journal of Chemical Education 60, no. 3 (March 1983): 198. Accessed June 18, 2012. http://pubs.acs.org/doi/abs/10.1021/ed060p198.
Chang, Raymond. “Buffers.” Essential Chemistry 2/e. Accessed June 11, 2012. http://www.mhhe.com/physsci/chemistry/essentialchemistry/flash/buffer12.swf.
Chang, Raymond. “LeChatelier’s Principle.” Essential Chemistry 2/e. Accessed June 11, 2012. www.mhhe.com/physsci/chemistry/essentialchemistry/flash/lechv17.swf.
“Color Changing Milk of Magnesia.” Steve Spangler Science. Accessed June 11, 2012. http://www.stevespanglerscience.com/experiment/color-changing-milk-of-magnesia.
“Explaining Acid Strength.” Microsoft Word file. Chemical Misconceptions. Royal Society of Chemistry. Accessed June 11, 2012. www.rsc.org/images/Explaining_acid_strength_tcm18-194542.doc.
“Explaining Acid Strength.” PDF file. Chemical Misconceptions. Royal Society of Chemistry. Accessed June 11, 2012. www.rsc.org/images/Explaining_acid_strength_tcm18-189309.pdf
Flinn Scientific. “Pink and Blue: A Colorful Chemical Balancing Act.” ChemmyBear. Accessed June 11, 2012. http://chemmybear.com/blackboard/CF8471.pdf.
Randall, Jack. “AP Lab 10: The Determination of an Equilibrium Constant.” In Advanced Chemistry with Vernier. Beaverton, OR: Vernier Software & Technology, 2007. This lab is available online at http://www.vernier.com/experiments/chem-a/10/determination_of_an_equilibrium_constant/.
Unit 9 (Entropy and Free Energy) Resources
Bishop, Mark. “Mixing Ethanol and Water.” An Introduction to Chemistry. Chiral Publishing. Accessed June 11, 2012. http://preparatorychemistry.com/Bishop_Ethanol_frames.htm.
Campbell, D. J., E. R. Freidinger, J. M. Hastings, and M. K. Querns. “Spontaneous Assembly of Soda Straws.” Journal of Chemical Education 79, no. 2 (2002): 201–203. http://pubs.acs.org/doi/abs/10.1021/ed079p201.
“Endothermic and Exothermic Reactions.” University of Minnesota Department of Chemistry. http://www.chem.umn.edu/outreach/EndoExo.html.
“Entropy.” W. W. Norton & Company: ChemTours. Chemistry 2e, The Science in Context. Accessed June 11, 2012. http://www.wwnorton.com/college/chemistry/gilbert2/tutorials/interface.asp?chapter=chapter_13&folder=entropy.
“Metal ores.” GCSE Bitesize. BBC. Accessed June 11, 2012. http://www.bbc.co.uk/schools/gcsebitesize/science/edexcel_pre_2011/chemicalreactions/extractingmetalsrev1.shtml.
“Solubility.” The Concord Consortium. Accessed June 11, 2012. http://www.concord.org/activities/solubility.

59AP Chemistry ■ Course Planning and Pacing Guide 2 © 2012 The College Board.
Resources (continued)
Unit 10 (Electrochemistry) Resources
Cesa, Irene, ed. “Electrolysis Reactions.” In Flinn ChemTopic Labs: Experiments and Demonstrations in Chemistry. Vol. 1, Electrochemistry. Batavia, IL: Flinn Scientific, 2002.
“Voltaic Cell.” Chemical Education Research Group. Iowa State University. Accessed June 11, 2012. http://group.chem.iastate.edu/Greenbowe/sections/projectfolder/flashfiles/electroChem/voltaicCellEMF.html.
“The World of Chemistry #15: The Busy Electron.” Annenberg Learner. Accessed June 11, 2012. http://www.learner.org/resources/series61.html.
“Zinc Copper Electrochemical Cell.” Chemical Education Research Group. Iowa State University. Accessed June 11, 2012. http://group.chem.iastate.edu/Greenbowe/sections/projectfolder/animations/CuZncell.html.