ap economics - edison · define economics and the features of the economic perspective ... ap...
TRANSCRIPT

1
PUBLIC SCHOOLS OF EDISON TOWNSHIP
DIVISION OF CURRICULUM AND INSTRUCTION
AP ECONOMICS
Length of Course: Full Year
Elective/Required: Elective
School: High School
Student Eligibility: Grades 11-12
Credit Value: 5 Credits
Date Approved: August 24, 2015

AP ECONOMICS
2
Table of Contents
Statement of Purpose …………………………………………………………………………… 3
Pacing Guide ……………………………………………………………………………………... 4
Unit 1: Basic Economic Concepts……………………………………………………………… 5
Unit 2: Supply & Demand ……………………………………………………………………… 9
Unit 3: Measurements of Economic Performance …………………….…………………….. 12
Unit 4: National Income & Price Determination ………………………………………………15
Unit 5: The Financial Sector ……………………………………………………………………. 19
Unit 6: Inflation, Unemployment, & Stabilization Policies …………………………………… 24
Unit 7: Economic Growth & Productivity ……………………………………………………… 27
Unit 8: The Open Economy: International Trade …………………………………………… 30
Unit 9: Demand – Consumer Behavior & Choice ……………………………………………. 33
Unit 10: Supply – Profit, Production, & Cost …………………………………………………. 37
Unit 11: Market Structures – Perfect Competition & Monopoly …………………………….. 41
Unit 12: Market Structures – Imperfect Competition …………………………………………. 45
Unit 13: Factor Markets ………………………………………………………………………….49
Unit 14: Market Failure & Government Intervention ………………………………………….. 52
Unit 15: AP Economics Exam Review …………………………………………………………. 56
Unit 16: Explorations in Economics ……………………………………………………………. 58
Modifications will be made to accommodate IEP mandates for classified students.

AP ECONOMICS
3
Statement of Purpose
The Edison Public School District is committed to improving instruction and providing the
most challenging academic opportunities for our students. The district has recently restructured
the Business Department curriculum in order to provide students with expanded opportunities in
college and career after high school, and as part of that restructuring has added an Advanced
Placement Micro/Macro Economics course. In one year, the AP Economics Course will cover
two courses in economics: AP Macroeconomics and AP Microeconomics, each corresponding
to one semester of a typical introductory college course in economics. The course is aligned
with the College Board and completion of the course will prepare students to take the AP
exams.
AP Macroeconomics focuses on the principles that apply to an economic system as a
whole. The course places particular emphasis on the study of national income and price-level
determination; it also develops students’ familiarity with economic performance measures, the
financial sector, stabilization policies, economic growth, and international economics. Students
are provided with a thorough understanding of the principles of economics and how economists
use those principles to examine aggregate economic behavior. Students learn how the
measures of economic performance, such as gross domestic product (GDP), inflation, and
unemployment are constructed and how to apply them to evaluate the macroeconomic
conditions of an economy. The course recognizes the global nature of economics and provides
ample opportunities to examine the impact of international trade and finance on national
economies. Various economic schools of thought are introduced as students consider solutions
to economic problems.
AP Microeconomics focuses on the principles of economics that apply to the functions of
individual decision-makers, both consumers and producers, including individual households and
firms, within the economic system. The course also develops students’ familiarity with the
operation of product and factor markets, distributions of income, market failure, and the role of
government in promoting greater efficiency and equity in the economy. The course examines
the theory of consumer behavior, the theory of the firm, and the behavior of profit-maximizing
firms under various market structures. Students evaluate the efficiency of the outcomes with
respect to price, output, consumer surplus, and producer surplus. They examine the behaviors
of households and businesses in factor markets, and learn how the determination of factor
prices, wages, interest and rent influence the distribution of income in a market economy.
There are ample opportunities to consider instances in which private markets may fail to
allocate resources efficiently and examine various public policy alternatives aimed at improving
the efficiency of private markets.
The curriculum was created by:
Jennifer Teboul, JP Stevens High School
Lynne Tierney, Edison High School
Completed under the supervision of Mr. Joseph Ferrara, EHS Assistant Principal, and Dr.
Anthony Shallop, JPS Assistant Principal.
AP ECONOMICS
4
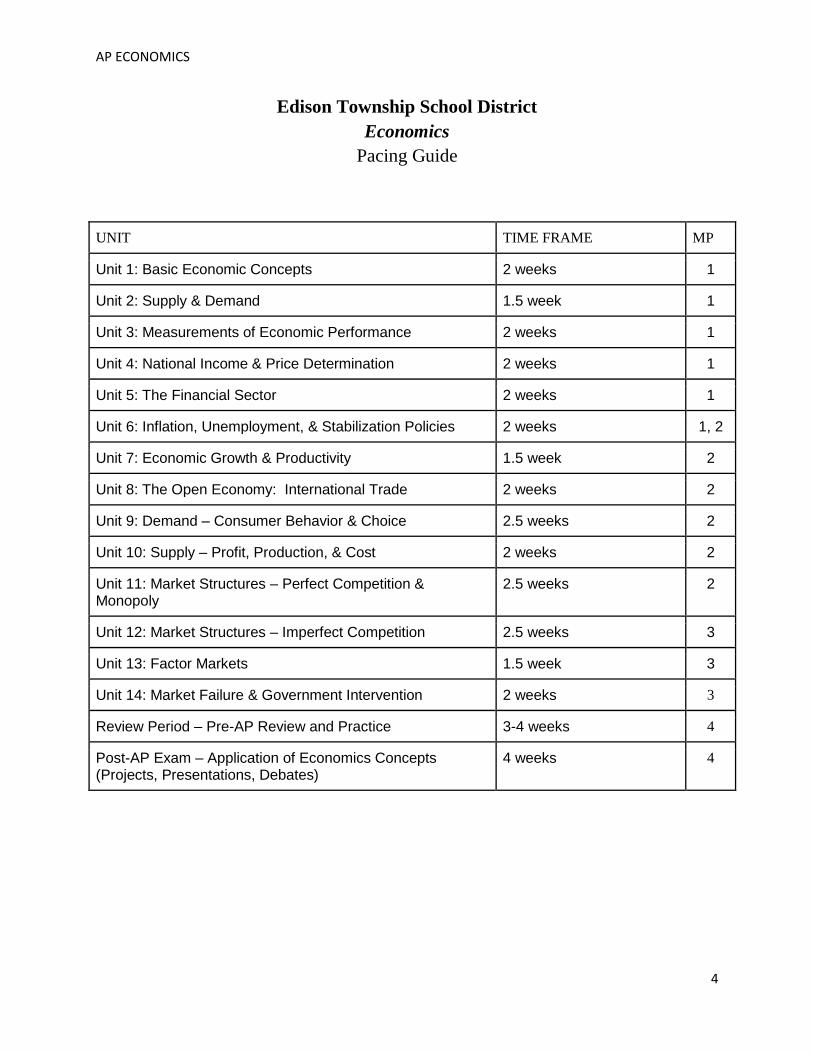
Edison Township School District
Economics
Pacing Guide
UNIT TIME FRAME MP
Unit 1: Basic Economic Concepts 2 weeks 1
Unit 2: Supply & Demand 1.5 week 1
Unit 3: Measurements of Economic Performance 2 weeks 1
Unit 4: National Income & Price Determination 2 weeks 1
Unit 5: The Financial Sector 2 weeks 1
Unit 6: Inflation, Unemployment, & Stabilization Policies 2 weeks 1, 2
Unit 7: Economic Growth & Productivity 1.5 week 2
Unit 8: The Open Economy: International Trade 2 weeks 2
Unit 9: Demand – Consumer Behavior & Choice 2.5 weeks 2
Unit 10: Supply – Profit, Production, & Cost 2 weeks 2
Unit 11: Market Structures – Perfect Competition & Monopoly
2.5 weeks 2
Unit 12: Market Structures – Imperfect Competition 2.5 weeks 3
Unit 13: Factor Markets 1.5 week 3
Unit 14: Market Failure & Government Intervention 2 weeks 3
Review Period – Pre-AP Review and Practice 3-4 weeks 4
Post-AP Exam – Application of Economics Concepts (Projects, Presentations, Debates)
4 weeks 4

AP ECONOMICS
5
Unit One: Basic Economic Concepts
Targeted Standards: Voluntary National Content Standards in Economics, Council for Economic Education: Standards 1, 2, 3, 4, 5,
6, 7, 8, 9
Unit Objectives/Conceptual Understandings: (Students will be able to)
● Define economics and the features of the economic perspective
● Distinguish microeconomics from macroeconomics and positive economics from normative economics
● Explain the individual’s economizing problem and how trade-offs, opportunity costs, and attainable combinations can be
illustrated with budget line
● Apply production possibilities analysis, increasing opportunity costs, and economic growth
● Explain how economic growth and international trade increase consumption possibilities
● Understand graphs, curves and slopes as they relate to economics
Essential Questions:
● What is the relationship between scarcity, choice, and opportunity cost?
● How do you define and display a production possibilities curve?
● How does the concept of comparative advantage and terms of trade define the basis of trade?
● How do countries choose an economic system?
● How does the market system answer the five fundamental questions of what to produce, how to produce, who obtains the
output, How to adjust to change, and how to promote progress?
● What is the same/different between laissez-faire capitalism, the command system, and the market system?
● What roles do incentives and property rights play in a mixed market model?
● What is the “Invisible Hand?” Why do market economies usually do a better job than command economies at efficiently
transforming economic resources into desirable output?
● Why is marginal thinking the central idea of microeconomics?
Unit Assessment:
● Students will be assessed by their creation of neat, clear, accurately and completely labeled graphs; their logical and clear
answers to Free Response Questions (FRQs) from previous AP exams; and their participation in class activities, as well as
vocabulary and lesson quizzes.

AP ECONOMICS
6
Unit One: Basic Economic Concepts (cont . )
Core Content Objectives
Instructional Actions
Cumulative Progress
Indicators
Concepts
What students will know.
Skills
What students will be
able to do.
Activities/Strategies
Technology Implementation/
Interdisciplinary Connections
Assessment
Check Points
1. The definition of
economics and
features of the
economic way of
thinking.
2. The role of economic
theory.
3. How to distinguish
microeconomics from
macroeconomics and
positive economics from
normative economics.
4. The basic principles of
economic reasoning.
5. The economizing
problem, and the role of
trade-offs and opportunity
costs.
6. The factors of
production
7. The definitions and
applications of scarcity,
choice, and cost.
8. How to define and
calculate opportunity cost.
1. Construct, label, and
interpret a budget
constraint curve.
2. Construct, label,
interpret, and
manipulate a
production
possibilities curve.
3. Illustrate the effects
of economic growth
and trade on a
production possibility
graph.
4. Graphically illustrate
the optimal allocation
of resources (MB =
MC).
5. Analyze a production
possibilities curve for
economic growth
Possible activities:
- scarce chairs experiment
- market structures simulation
- business cycle stations
- I, Pencil movie
Neat, clear, accurately and completely labeled graphs.
FRQs from
previous AP
exams
Vocabulary
assessments
Class participation
Lesson quizzes
Group projects
Homework
Class participation

AP ECONOMICS
7
Unit One: Basic Economic Concepts (cont.)
Core Content Objectives
Instructional Actions
Cumulative Progress
Indicators
Concepts
What students will know.
Skills
What students will be
able to do.
Activities/Strategies
Technology Implementation/
Interdisciplinary Connections
Assessment
Check Points
9. How to explain and
apply marginal analysis.
10. How to construct and
interpret a production
possibilities curve
11. How economic growth and
international trade can
increase consumption
possibilities.
12. The difference between
laissez faire capitalism,
the command system, and
the market system.
13. The main characteristics
of the market system.
14. The fundamental
economic questions
(what, how, and for
whom to produce).
15. How to explain and apply
the operation of the
“invisible hand.”
16. How to define and
calculate comparative and
absolute advantage and
terms of trade.

AP ECONOMICS
8
Unit One: Basic Economic Concepts (cont.)
Core Content Objectives
Instructional Actions
Cumulative Progress
Indicators
Concepts What students will know.
Skills What students will be
able to do.
Activities/Strategies Technology Implementation/ Interdisciplinary Connections
Assessment Check Points
17. How to define and apply the terms productive and allocative efficiency.
18. The ways in which economic growth is measured.
19. The phases of the business cycle.
Resources: Essential Materials, Supplementary Materials, Links to Best Practices
- Ray, Margaret and David Anderson. Krugman’s Economics for AP 2nd Edition. New York: Worth Publishers, 2015. - Advanced Placement Microeconomics: Student Activities, 4th ed., New York: National
Council for Economic Education. - Anderson, David. Economics by Example 2nd Edition. New York: Worth, 2015. - Mr. Clifford Videos - AP Teacher Community Resources - Practice with AP Economics Test Prep Books
Instructional Adjustments: Modifications, student difficulties, possible misunderstandings
- Advise students to be careful when they see terms they think they already know, because economists have special meanings for many terms. ie: questions on the AP exam generally use the term “capital” to refer to the category of factors of production made up of manufactured goods used to make other goods and services. Don’t confuse this type of capital with “financial capital” such as money, stocks and bonds.
AP ECONOMICS
9
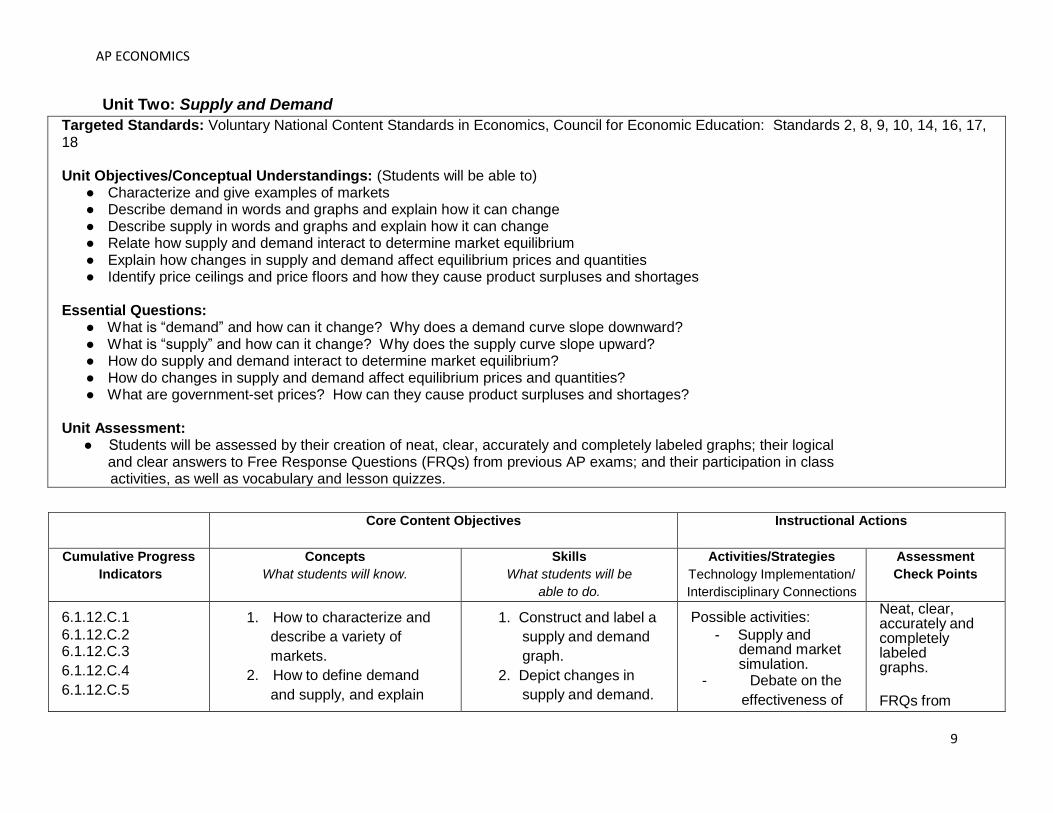
Unit Two: Supply and Demand
Targeted Standards: Voluntary National Content Standards in Economics, Council for Economic Education: Standards 2, 8, 9, 10, 14, 16, 17, 18 Unit Objectives/Conceptual Understandings: (Students will be able to)
● Characterize and give examples of markets ● Describe demand in words and graphs and explain how it can change ● Describe supply in words and graphs and explain how it can change ● Relate how supply and demand interact to determine market equilibrium ● Explain how changes in supply and demand affect equilibrium prices and quantities ● Identify price ceilings and price floors and how they cause product surpluses and shortages
Essential Questions:
● What is “demand” and how can it change? Why does a demand curve slope downward? ● What is “supply” and how can it change? Why does the supply curve slope upward? ● How do supply and demand interact to determine market equilibrium? ● How do changes in supply and demand affect equilibrium prices and quantities? ● What are government-set prices? How can they cause product surpluses and shortages?
Unit Assessment:
● Students will be assessed by their creation of neat, clear, accurately and completely labeled graphs; their logical and clear answers to Free Response Questions (FRQs) from previous AP exams; and their participation in class activities, as well as vocabulary and lesson quizzes.
Core Content Objectives
Instructional Actions
Cumulative Progress
Indicators
Concepts
What students will know.
Skills
What students will be
able to do.
Activities/Strategies
Technology Implementation/
Interdisciplinary Connections
Assessment
Check Points
6.1.12.C.1
6.1.12.C.2 6.1.12.C.3
6.1.12.C.4
6.1.12.C.5
1. How to characterize and
describe a variety of
markets.
2. How to define demand
and supply, and explain
1. Construct and label a
supply and demand
graph.
2. Depict changes in
supply and demand.
Possible activities:
- Supply and demand market simulation.
- Debate on the
effectiveness of
Neat, clear, accurately and completely labeled graphs.
FRQs from

AP ECONOMICS
10
Unit Two: Supply and Demand (cont.)
Core Content Objectives
Instructional Actions
Cumulative Progress
Indicators
Concepts
What students will know.
Skills
What students will be
able to do.
Activities/Strategies
Technology Implementation/
Interdisciplinary Connections
Assessment
Check Points
6.1.12.C.6
6.1.12.C.7
6.1.12.C.8 6.1.12.C.9
6.1.12.C.10
6.1.12.C.11
6.1.12.C.12
6.1.12.C.13
6.1.12.C.14 6.1.12.C.15
6.1.12.C.16
6.2.12.C.1
6.2.12.C.2
6.2.12.C.3 6.2.12.C.4
6.2.12.C.5
6.2.12.C.6
6.3.12.C.1
how it can change.
3. The determinants of
demand and
determinants of supply.
4. How to illustrate supply
and demand through
schedules and graphs.
5. How to differentiate
between a change in
supply/demand a change
in quantity
supplied/demanded.
6. The causes of shifts in
supply and demand.
7. How to describe how supply
and demand interact to
determine market
equilibrium.
8. How to assess the impact of
changes in supply and
demand on the equilibrium
price and quantity in the
market.
9. Normal goods, inferior
goods, substitutes, and
complements.
a. Illustrate a change
in demand or
supply.
b. Illustrate a
change in
quantity
demanded or
quantity supplied.
3. Depict the effect of a
price ceiling or a price
floor in the market
real- world price
ceilings and price
floors.
previous AP
exams
Vocabulary
assessments
Lesson quizzes
Group projects
Homework
Class participation
AP ECONOMICS
11
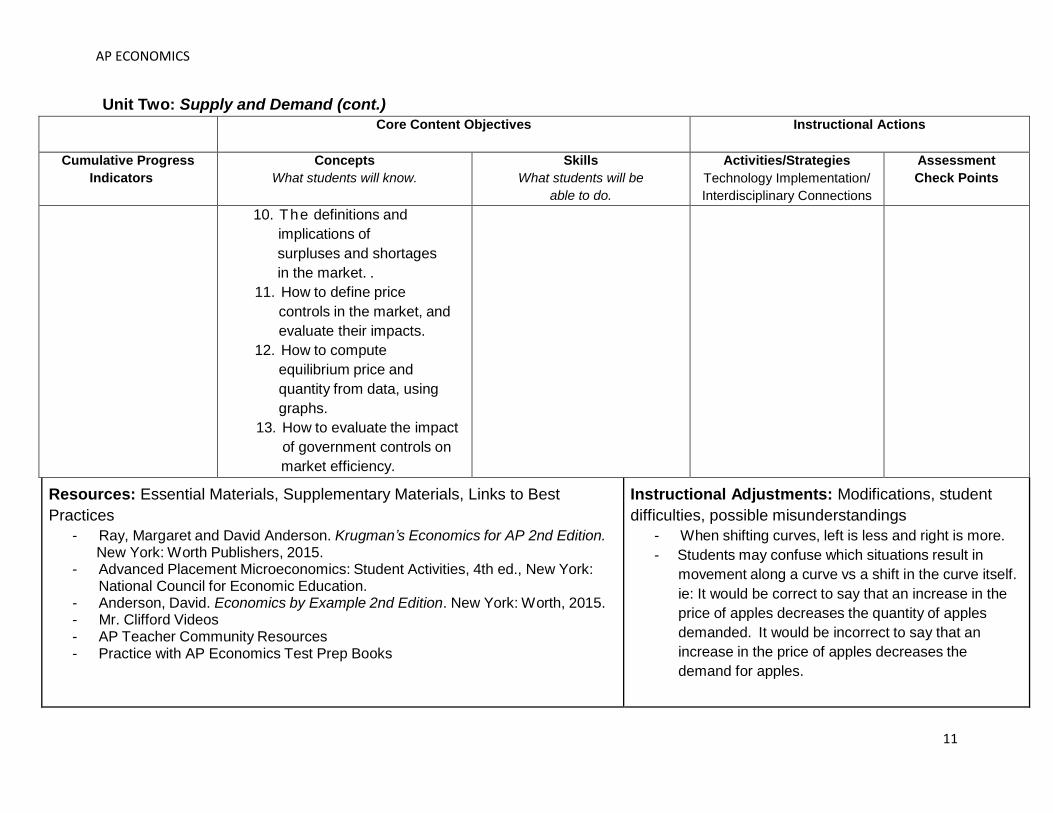
Unit Two: Supply and Demand (cont.)
Core Content Objectives
Instructional Actions
Cumulative Progress
Indicators
Concepts
What students will know.
Skills
What students will be
able to do.
Activities/Strategies
Technology Implementation/
Interdisciplinary Connections
Assessment
Check Points
10. The definitions and
implications of
surpluses and shortages
in the market. .
11. How to define price
controls in the market, and
evaluate their impacts.
12. How to compute
equilibrium price and
quantity from data, using
graphs.
13. How to evaluate the impact
of government controls on
market efficiency.
Resources: Essential Materials, Supplementary Materials, Links to Best
Practices
- Ray, Margaret and David Anderson. Krugman’s Economics for AP 2nd Edition. New York: Worth Publishers, 2015. - Advanced Placement Microeconomics: Student Activities, 4th ed., New York: National Council for Economic Education. - Anderson, David. Economics by Example 2nd Edition. New York: Worth, 2015. - Mr. Clifford Videos - AP Teacher Community Resources - Practice with AP Economics Test Prep Books
Instructional Adjustments: Modifications, student
difficulties, possible misunderstandings
- When shifting curves, left is less and right is more.
- Students may confuse which situations result in
movement along a curve vs a shift in the curve itself.
ie: It would be correct to say that an increase in the
price of apples decreases the quantity of apples
demanded. It would be incorrect to say that an
increase in the price of apples decreases the
demand for apples.

AP ECONOMICS
12
Unit Three: Measurements of Economic Performance
Targeted Standards: Voluntary National Content Standards in Economics, Council for Economic Education: Standards 11, 12, 13, 15, 16, 17, 18, 19, 20
Unit Objectives/Conceptual Understandings: (Students will be able to)
● Explain how Gross Domestic Product (GDP) is defined and calculated ● Describe the relationships among GDP, net domestic product, national income, personal income, and disposable income ● Discuss the nature and function of a GDP price index. ● Illustrate how unemployment is measured. ● Analyze measures of inflation. ● Explain why economists focus on GDP, inflation, and unemployment when assessing the health of an entire economy ● Identify the general supply, demand, and efficiency forces that give rise to economic growth ● Discuss differing perspectives as to whether economic growth is desirable and sustainable
Essential Questions:
● In what ways are national income statistics useful? ● Why is an economy measured by market value of goods rather than physical volume of production?
Why do economists include only final goods and services when measuring GDP? How can you differentiate between intermediate and final goods?
● What is a price index? ● What is the difference between Nominal and Real GDP? ● What are some limitations of the GDP measure? ● How is unemployment measured? What is the difference between frictional, structural and cyclical unemployment? ● How is inflation measured? Can you distinguish between cost-push inflation and demand-pull inflation? ● Is there a tradeoff between lower rates of unemployment and higher rates of inflation? ● Is economic growth always desirable? Sustainable?
Unit Assessment:
● Students will be assessed by their creation of neat, clear, accurately and completely labeled graphs; their logical and clear answers to Free Response Questions (FRQs) from previous AP exams; and their participation in class activities, as well as vocabulary and lesson quizzes.
AP ECONOMICS
13
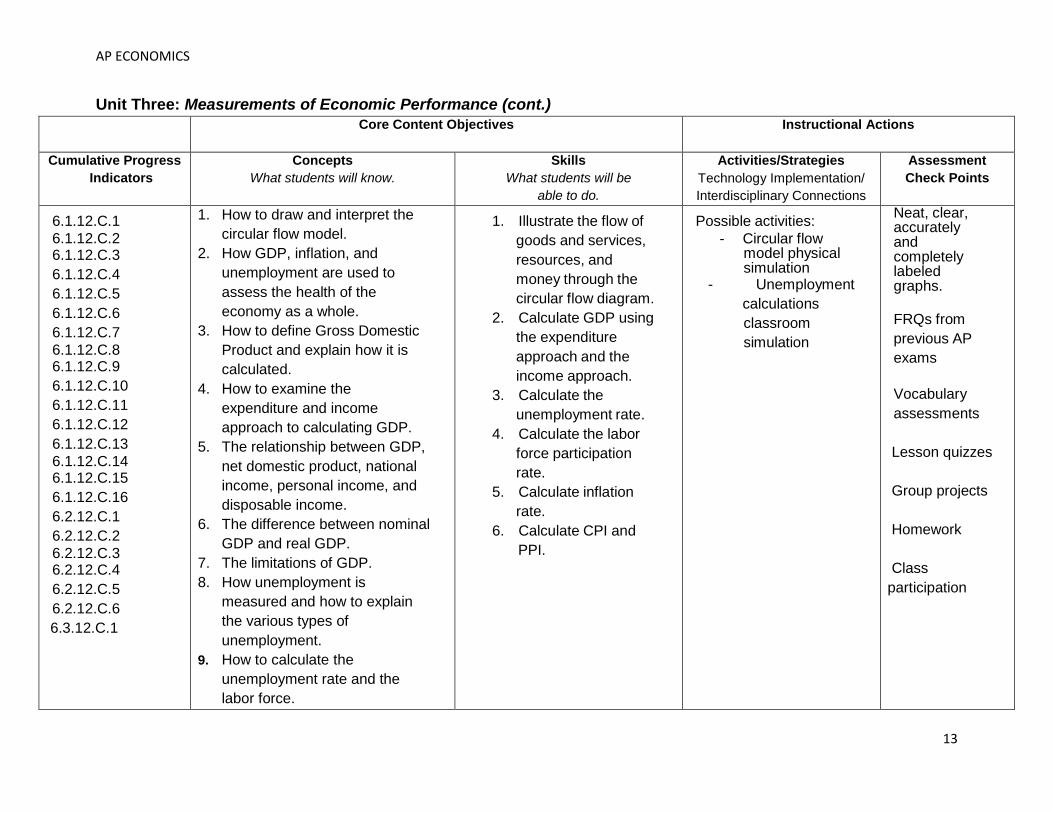
Unit Three: Measurements of Economic Performance (cont.)
Core Content Objectives
Instructional Actions
Cumulative Progress
Indicators
Concepts
What students will know.
Skills
What students will be
able to do.
Activities/Strategies
Technology Implementation/
Interdisciplinary Connections
Assessment
Check Points
6.1.12.C.1
6.1.12.C.2 6.1.12.C.3
6.1.12.C.4
6.1.12.C.5
6.1.12.C.6
6.1.12.C.7
6.1.12.C.8 6.1.12.C.9
6.1.12.C.10
6.1.12.C.11
6.1.12.C.12
6.1.12.C.13
6.1.12.C.14 6.1.12.C.15
6.1.12.C.16
6.2.12.C.1
6.2.12.C.2
6.2.12.C.3 6.2.12.C.4
6.2.12.C.5
6.2.12.C.6
6.3.12.C.1
1. How to draw and interpret the
circular flow model.
2. How GDP, inflation, and
unemployment are used to
assess the health of the
economy as a whole.
3. How to define Gross Domestic
Product and explain how it is
calculated.
4. How to examine the
expenditure and income
approach to calculating GDP.
5. The relationship between GDP,
net domestic product, national
income, personal income, and
disposable income.
6. The difference between nominal
GDP and real GDP.
7. The limitations of GDP.
8. How unemployment is
measured and how to explain
the various types of
unemployment.
9. How to calculate the
unemployment rate and the
labor force.
1. Illustrate the flow of
goods and services,
resources, and
money through the
circular flow diagram.
2. Calculate GDP using
the expenditure
approach and the
income approach.
3. Calculate the
unemployment rate.
4. Calculate the labor
force participation
rate.
5. Calculate inflation
rate.
6. Calculate CPI and
PPI.
Possible activities:
- Circular flow model physical simulation
- Unemployment
calculations
classroom
simulation
Neat, clear, accurately and completely labeled graphs.
FRQs from
previous AP
exams
Vocabulary
assessments
Lesson quizzes
Group projects
Homework
Class
participation

AP ECONOMICS
14
Unit Three: Measurements of Economic Performance (cont.)
Core Content Objectives
Instructional Actions
Cumulative Progress
Indicators
Concepts
What students will know.
Skills
What students will be
able to do.
Activities/Strategies
Technology Implementation/
Interdisciplinary Connections
Assessment
Check Points
10. How to find the full employment
level of GDP.
11. What inflation is and how to
measure it.
12. The impact of inflation on the
economy.
13. How to calculate and interpret
Consumer Price Index and
Producer Price Index.
14. How to use price indices to
calculate real wages and real
interest rates.
Resources: Essential Materials, Supplementary Materials, Links to Best
Practices - Ray, Margaret and David Anderson. Krugman’s Economics for AP 2nd Edition. New
York: Worth Publishers, 2015.
- Advanced Placement Microeconomics: Student Activities, 4th ed., New York: National
Council for Economic Education.
- Anderson, David. Economics by Example 2nd Edition. New York: Worth, 2015. - Mr. Clifford Videos
- AP Teacher Community Resources
- Practice with AP Economics Test Prep Books
Instructional Adjustments: Modifications, student
difficulties, possible misunderstandings
- While there are three ways to calculate GDP
(value- added, income, expenditure), the first
two are very rarely tested on the AP.
Thoroughly teach the expenditure approach.
- Economists use many different types of
abbreviations, and different sources used in the
classroom may thus be confusing to students.
The AP typically uses the following:
- (X - IM) - (X - M)
- Nx
- Xn

AP ECONOMICS
15
Unit Four: National Income & Price Determination
Targeted Standards: Voluntary National Content Standards in Economics, Council for Economic Education: Standards 11, 12, 13, 15, 16, 17, 18, 19, 20 Unit Objectives/Conceptual Understandings: (Students will be able to)
● Distinguish between a change in aggregate demand and a change in the price level that causes a movement along the aggregate demand curve
● Distinguish between a change in aggregate supply and a change in the price level that causes a movement along the aggregate supply curve
● Show how the shape of the aggregate supply curve differs between the short run and the long run. ● Determine the potential (or full-employment) level of output ● Demonstrate the effects of expansionary or contractionary fiscal policy on price levels, aggregate demand, and real GDP ● Determine the size of a tax multiplier and assess its impact on aggregate demand. ● Understand the differences between discretionary fiscal policy and automatic stabilizers
Essential Questions:
● How does the consumption function relate to disposable income? ● How do the determinants of investment spending affect GDP? ● How can you determine the size of the spending multiplier? ● What impact does a specific spending multiplier have on aggregate demand spending? ● What are the determinants of aggregate demand? ● What are the determinants of aggregate supply? ● How is equilibrium defined using an AD-AS graph?
● Why does a tax multiplier have a smaller effect on GDP than the spending multiplier from transfer payments? Unit Assessment:
● Students will be assessed by their creation of neat, clear, accurately and completely labeled graphs; their logical and clear answers to Free Response Questions (FRQs) from previous AP exams; and their participation in class activities, as well as vocabulary and lesson quizzes.
AP ECONOMICS
16
Unit Four: National Income & Price Determination (cont.)
Core Content Objectives
Instructional Actions
Cumulative Progress
Indicators
Concepts
What students will know.
Skills
What students will be
able to do.
Activities/Strategies
Technology Implementation/
Interdisciplinary Connections
Assessment
Check Points
6.1.12.C.1
6.1.12.C.2 6.1.12.C.3
6.1.12.C.4
6.1.12.C.5
6.1.12.C.6
6.1.12.C.7
6.1.12.C.8 6.1.12.C.9
6.1.12.C.10
6.1.12.C.11
6.1.12.C.12
6.1.12.C.13
6.1.12.C.14 6.1.12.C.15
6.1.12.C.16
6.2.12.C.1
6.2.12.C.2
6.2.12.C.3 6.2.12.C.4
6.2.12.C.5
6.2.12.C.6
6.3.12.C.1
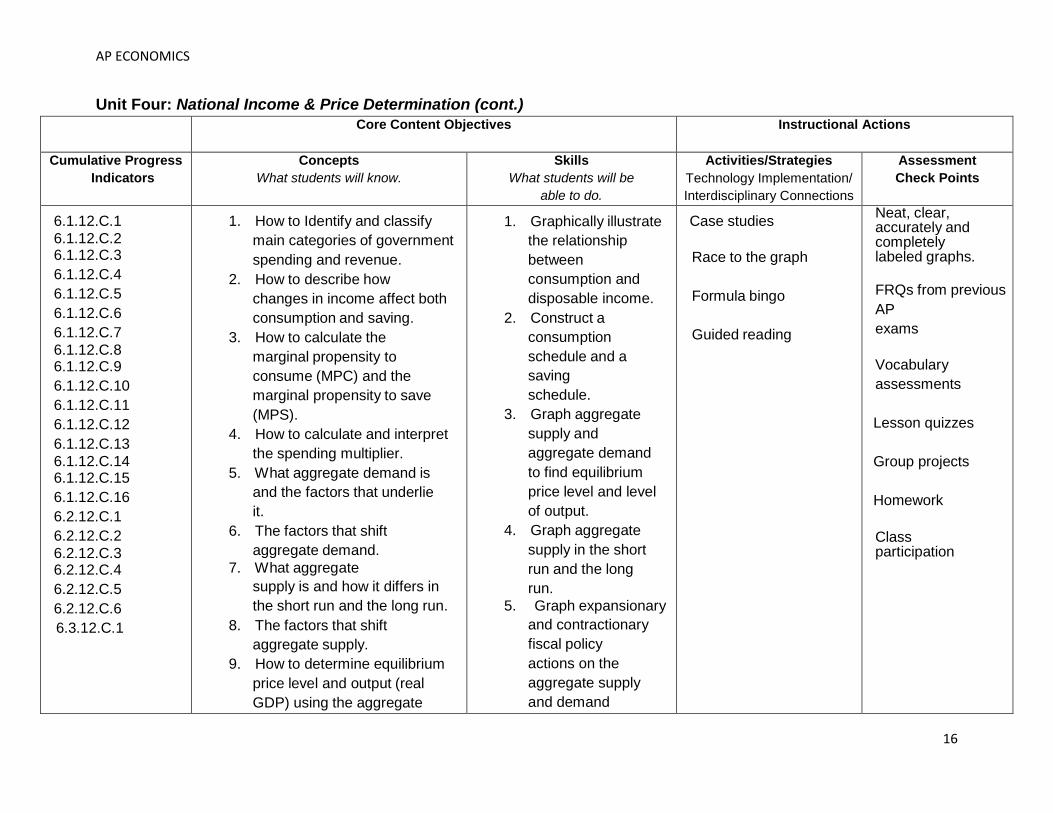
1. How to Identify and classify
main categories of government
spending and revenue.
2. How to describe how
changes in income affect both
consumption and saving.
3. How to calculate the
marginal propensity to
consume (MPC) and the
marginal propensity to save
(MPS).
4. How to calculate and interpret
the spending multiplier.
5. What aggregate demand is
and the factors that underlie
it.
6. The factors that shift
aggregate demand.
7. What aggregate
supply is and how it differs in
the short run and the long run.
8. The factors that shift
aggregate supply.
9. How to determine equilibrium
price level and output (real
GDP) using the aggregate
1. Graphically illustrate
the relationship
between
consumption and
disposable income.
2. Construct a
consumption
schedule and a
saving
schedule.
3. Graph aggregate
supply and
aggregate demand
to find equilibrium
price level and level
of output.
4. Graph aggregate
supply in the short
run and the long
run.
5. Graph expansionary
and contractionary
fiscal policy
actions on the
aggregate supply
and demand
Case studies
Race to the graph
Formula bingo
Guided reading
Neat, clear, accurately and completely labeled graphs.
FRQs from previous
AP
exams
Vocabulary
assessments
Lesson quizzes
Group projects
Homework
Class participation
AP ECONOMICS
17
Unit Four: National Income & Price Determination (cont.)
Core Content Objectives
Instructional Actions
Cumulative Progress
Indicators
Concepts
What students will know.
Skills
What students will be
able to do.
Activities/Strategies
Technology Implementation/
Interdisciplinary Connections
Assessment
Check Points
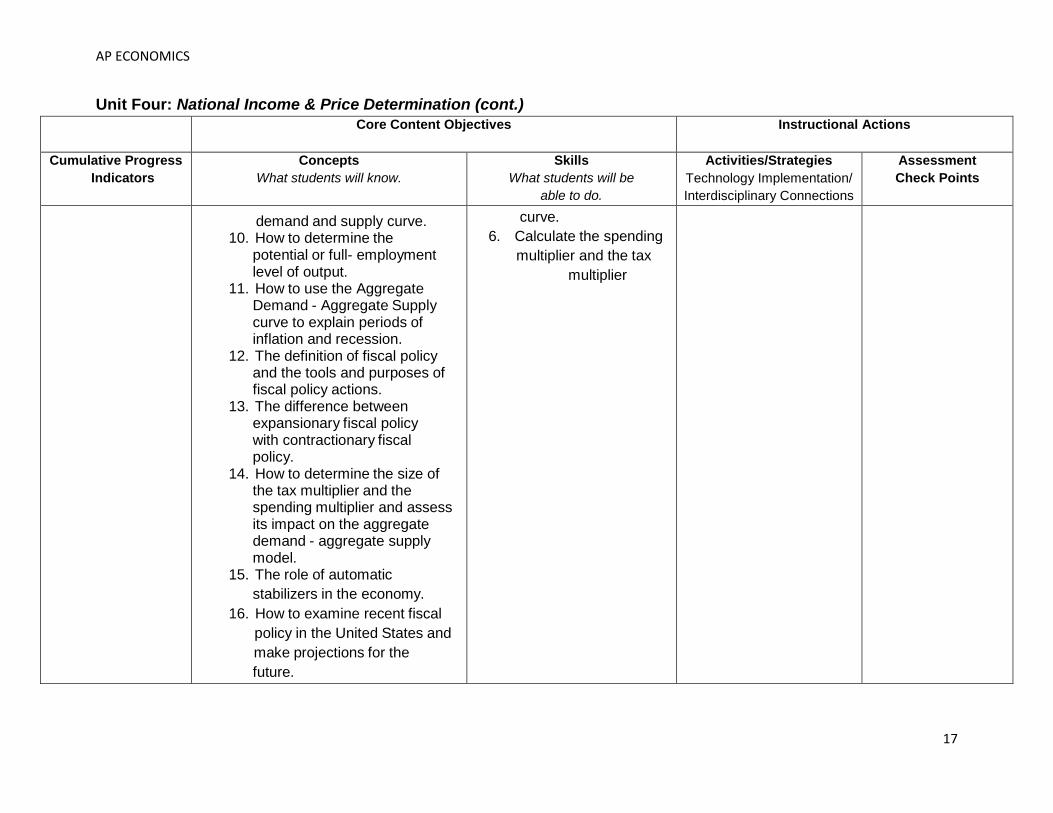
demand and supply curve.
10. How to determine the potential or full- employment level of output.
11. How to use the Aggregate Demand - Aggregate Supply curve to explain periods of inflation and recession.
12. The definition of fiscal policy and the tools and purposes of fiscal policy actions.
13. The difference between expansionary fiscal policy with contractionary fiscal policy.
14. How to determine the size of the tax multiplier and the spending multiplier and assess its impact on the aggregate demand - aggregate supply model.
15. The role of automatic
stabilizers in the economy.
16. How to examine recent fiscal
policy in the United States and
make projections for the
future.
curve.
6. Calculate the spending
multiplier and the tax
multiplier
AP ECONOMICS
18
Unit Four: National Income & Price Determination (cont.)
Core Content Objectives
Instructional Actions
Cumulative Progress
Indicators
Concepts
What students will know.
Skills
What students will be
able to do.
Activities/Strategies
Technology Implementation/
Interdisciplinary Connections
Assessment
Check Points
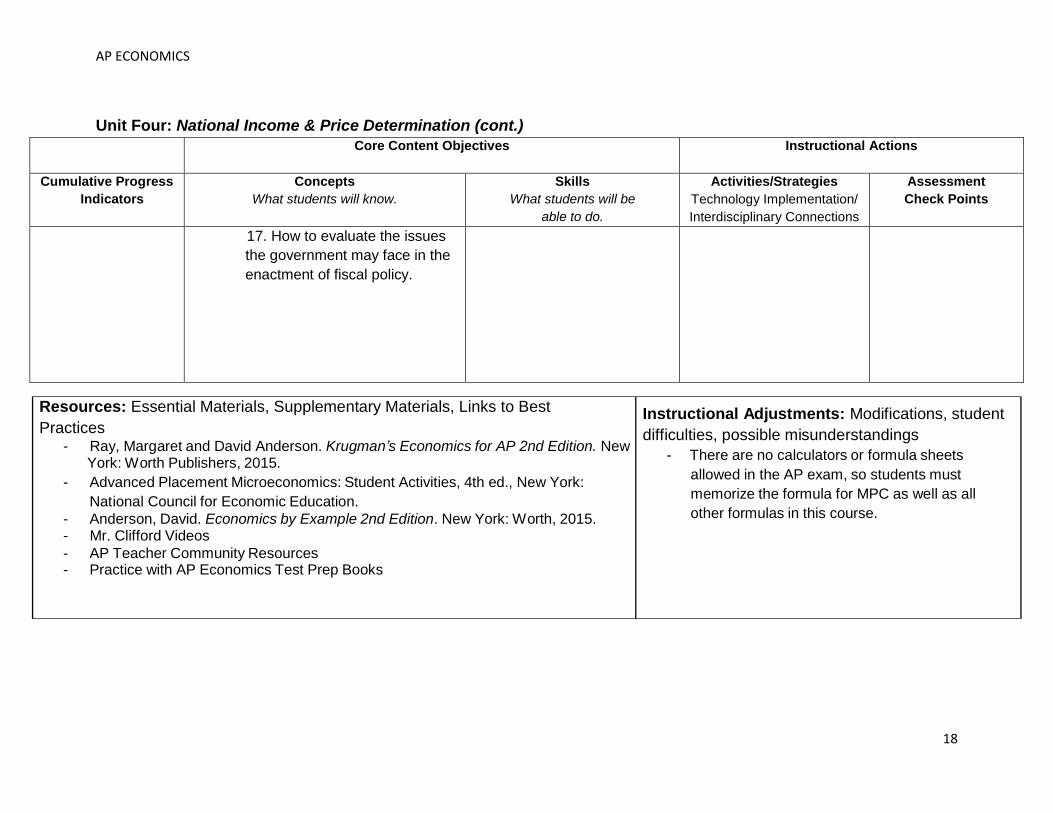
17. How to evaluate the issues
the government may face in the
enactment of fiscal policy.
Resources: Essential Materials, Supplementary Materials, Links to Best
Practices - Ray, Margaret and David Anderson. Krugman’s Economics for AP 2nd Edition. New
York: Worth Publishers, 2015.
- Advanced Placement Microeconomics: Student Activities, 4th ed., New York:
National Council for Economic Education.
- Anderson, David. Economics by Example 2nd Edition. New York: Worth, 2015. - Mr. Clifford Videos
- AP Teacher Community Resources - Practice with AP Economics Test Prep Books
Instructional Adjustments: Modifications, student
difficulties, possible misunderstandings
- There are no calculators or formula sheets
allowed in the AP exam, so students must
memorize the formula for MPC as well as all
other formulas in this course.

AP ECONOMICS
19
Unit Five: The Financial Sector
Targeted Standards: Voluntary National Content Standards in Economics, Council for Economic Education: Standards 10, 11, 12
Unit Objectives/Conceptual Understandings: (Students will be able to)
● Explain how the three tasks of a financial system bring forth efficiency in the financial markets ● Describe how a bank creates money and increases the money supply, and how the monetary base defines the
money multiplier ● Explore how the Federal Reserve System acts as a central bank for the US. ● Compare how the Fed responded to banking crises in the Great Depression, the 1980s, and in 2008. ● Explain how the concept of present value can help one make decisions when costs or benefits materialize in the future ● Describe how crowding out leads to a decrease in invesmtne spending
Essential Questions:
● What are the four types of financial assets, and how do they differ in purpose? ● What is the function of money? ● How do you measure the supply of money?
● How does a bank create money? ● What is the Federal Reserve System?
● How does the Fed respond to crises in the banking system? ● What is money demand and what are the factors that shift the money demand curve? ● How is the equilibrium interest rate determined in the money market? ● How does the loanable funds market match savers and investors?
Unit Assessment: ● Students will be assessed by their creation of neat, clear, accurately and completely labeled graphs; their logical and
clear answers to Free Response Questions (FRQs) from previous AP exams; and their participation in class activities, as well as vocabulary and lesson quizzes.

AP ECONOMICS
20
Unit Five: The Financial Sector (cont.)
Core Content Objectives
Instructional Actions
Cumulative Progress
Indicators
Concepts
What students will know.
Skills
What students will be
able to do.
Activities/Strategies
Technology Implementation/
Interdisciplinary Connections
Assessment
Check Points
6.1.12.C.1
6.1.12.C.2
6.1.12.C.3
6.1.12.C.4
6.1.12.C.5 6.1.12.C.6
6.1.12.C.7
6.1.12.C.8
6.1.12.C.9
6.1.12.C.10
6.1.12.C.11 6.1.12.C.12
6.1.12.C.13
6.1.12.C.14
6.1.12.C.15
6.1.12.C.16
6.2.12.C.1 6.2.12.C.2
6.2.12.C.3
6.2.12.C.4
6.2.12.C.5
6.2.12.C.6
6.3.12.C.1
1. The basic functions of money.
2. The components of the
United States money supply
(M1, M2).
3. How to explain what backs
the money supply in the
United States.
4. How to explain the functions
of the Federal Reserve
System, and identify its
components.
5. The Federal Reserve’s role in
setting monetary policy in the
UnitedStates.
6. The main causes of the
financial crisis of
2007 - 2008.
7. The actions of the
U.S. Treasury and the Federal
Reserve in response to the
crisis of 2007 - 2008.
8. The meaning behind a
“fractional reserve” banking
system.
9. The difference between a bank’s
1. Draw and label the
supply and demand
curves in a loanable
funds market.
2. Graphically illustrate
the crowding out
effect
3. Draw and label the
demand for money,
the supply of money,
and the equilibrium
interest rate.
4. Graphically
illustrate
expansionary
monetary policy
and contractionary
monetary policy, as
it relates to the
amount of money
demanded and
supplied, the real
interest rate, real
GDP, and price
level.
Possible activities:
- Model an
FOMC meeting
and debate on
the appropriate
Federal Funds
Rate Target.
- Money
creation
simulation.
- Fiscal/monetary
policy debates.
Neat, clear,
accurately and
completely
labeled
graphs.
FRQs from
previous AP
exams
Vocabulary
assessments
Lesson quizzes
Group projects
Homework
Class
participation

AP ECONOMICS
21
Unit Five: The Financial Sector (cont.)
Core Content Objectives
Instructional Actions
Cumulative Progress
Indicators
Concepts
What students will know.
Skills
What students will be
able to do.
Activities/Strategies
Technology Implementation/
Interdisciplinary Connections
Assessment
Check Points
actual reserves and its
required reserves.
10. How a bank can create
money.
11. How to define the money
multiplier, calculate it, and
explain how it works.
12. How to determine the
equilibrium interest rate in the
market for money.
13. The goals of monetary policy
and the tools it uses to
achieve those goals.
14. How to define the federal funds
rate and describe how the
Federal Reserve influences it.
15. The role of the FOMC in setting
the federal funds rate target.
16. The ways in which
monetary policy affects GDP
and price level in the economy.
17. The limitations of monetary
policy.
18. The definition of financial
economics, and how to

AP ECONOMICS
22
Unit Five: The Financial Sector (cont.)
Core Content Objectives
Instructional Actions
Cumulative Progress
Indicators
Concepts
What students will know.
Skills
What students will be
able to do.
Activities/Strategies
Technology Implementation/
Interdisciplinary Connections
Assessment
Check Points
distinguish between economic
and financial investment.
19. The time value of money, and
how to calculate present and
future value.
20. How to calculate compound
interest.
21. How to compare and contrast
forms of investment - stocks,
bonds, and mutual funds.
22. How financial intermediaries
help investors achieve
diversification.
23. What arbitrage is.
24. How to define interest and
explain the causes of variation
in interest rates.
25. How to distinguish between
nominal and real interest rates,
and describe the Fischer effect
26. The loanable funds theory of
interest rates.
27. How to explain and illustrate the
crowding-out effect.
AP ECONOMICS
23
Unit Five: The Financial Sector (cont.)
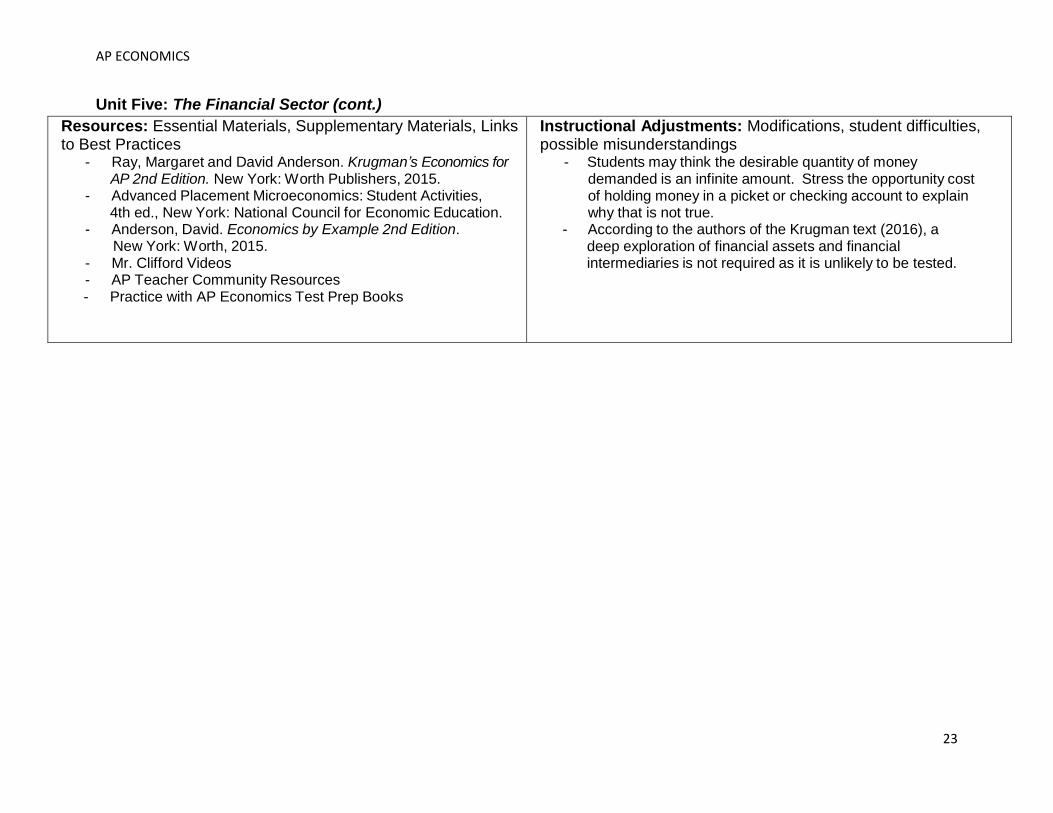
Resources: Essential Materials, Supplementary Materials, Links to Best Practices
- Ray, Margaret and David Anderson. Krugman’s Economics for AP 2nd Edition. New York: Worth Publishers, 2015. - Advanced Placement Microeconomics: Student Activities, 4th ed., New York: National Council for Economic Education. - Anderson, David. Economics by Example 2nd Edition. New York: Worth, 2015. - Mr. Clifford Videos - AP Teacher Community Resources
- Practice with AP Economics Test Prep Books
Instructional Adjustments: Modifications, student difficulties, possible misunderstandings
- Students may think the desirable quantity of money demanded is an infinite amount. Stress the opportunity cost of holding money in a picket or checking account to explain why that is not true.
- According to the authors of the Krugman text (2016), a deep exploration of financial assets and financial intermediaries is not required as it is unlikely to be tested.

AP ECONOMICS
24
Unit Six: Inflation, Unemployment, and Stabilization Policies
Targeted Standards: Voluntary National Content Standards in Economics, Council for Economic Education: Standards 11, 12, 13, 14, 15, 16, 17, 18, 19, 20
Unit Objectives/Conceptual Understandings: (Students will be able to) ● Explore how the long-run implications of government deficit budgets and crowding out create concern ● Explain how implicit liabilities - Social Security and Medicare - pose problems for budget planners ● Show how expansionary and contractionary monetary policy affects interest rates, investment, AD, price level and real GDP in the short and long run ● Understand the differences between short and long run effects of fiscal and monetary policies ● Differentiate between classical and Keynesian views of economics
Essential Questions: ● How does the government calculate the cyclically adjusted budget? ● How does the size and burden of the national debt affect further budget planning? ● How does the Fed target the federal funds rate to change interest rates? ● What is the difference between expansionary and contractionary monetary policy? ● How do expansionary and contractionary monetary policies affect interest rates, investment, AD, price level, and real GDP in the short run? The long run? ● Why is the real quantity of money always at its long-run equilibrium in the classical model? ● Why are money holders punished when government prints money to pay for spending? ● How does cost-push inflation differ from demand-pull inflation? ● What does the short-run Phillips curve display? ● Is there a tradeoff between unemployment and inflation in the long run? ● What limits expansionary policy? ● Why is deflation a problem for policy makers? ● What is disinflation? ● What does the term “political business cycle” mean? Unit Assessment: ● Students will be assessed by their creation of neat, clear, accurately and completely labeled graphs; their logical and clear answers to Free Response Questions (FRQs) from previous AP exams; and their participation in class activities, as well as vocabulary and lesson quizzes.

AP ECONOMICS
25
Unit Six: Inflation, Unemployment, and Stabilization Policies (cont.)
Core Content Objectives
Instructional Actions
Cumulative Progress
Indicators
Concepts
What students will know.
Skills
What students will be
able to do.
Activities/Strategies
Technology Implementation/
Interdisciplinary Connections
Assessment
Check Points
6.1.12.C.1
6.1.12.C.2
6.1.12.C.3
6.1.12.C.4
6.1.12.C.5 6.1.12.C.6
6.1.12.C.7
6.1.12.C.8
6.1.12.C.9
6.1.12.C.10
6.1.12.C.11 6.1.12.C.12
6.1.12.C.13
6.1.12.C.14
6.1.12.C.15
6.1.12.C.16 6.2.12.C.1
6.2.12.C.2
6.2.12.C.3
6.2.12.C.4
6.2.12.C.5 6.2.12.C.6
6.3.12.C.1
1. The composition and
implications of the U.S.
public debt.
2. How the government calculates the budget.
3. How the Fed targets the federal funds rate to change interest rates.
4. How expansionary and contractionary monetary policy affects interest rates, investment, aggregate demand, price level, and real GDP in both the short run and the long run.
5. How the classic model of
the price level explains
that the real quantity of
money is always at long-
run equilibrium.
6. The difference
between cost-push and
demand-pull inflation.
7. How the unemployment
Relates to the output
gap.
1. Draw and interpret the Phillips Curve.
2. Draw and interpret the Laffer Curve.
3. Graphically illustrate the impact of monetary policy actions on the money supply and equilibrium interest rate.
4. Determine the appropriate monetary policy move in a given economic situation and assess its impact.
5. Discuss the point- of- view of various economic schools of thought.
Possible activities:
- Economic research on
present day challenges
with a policy approach to
addressing the issue.
Neat, clear,
accurately and
completely labeled
graphs.
FRQs from previous
AP exams
Vocabulary
assessments
Lesson quizzes
Group projects
Homework
Class participation
AP ECONOMICS
26
Unit Six: Inflation, Unemployment, and Stabilization Policies (cont.)
Core Content Objectives
Instructional Actions
Cumulative Progress
Indicators
Concepts
What students will know.
Skills
What students will be
able to do.
Activities/Strategies
Technology Implementation/
Interdisciplinary Connections
Assessment
Check Points
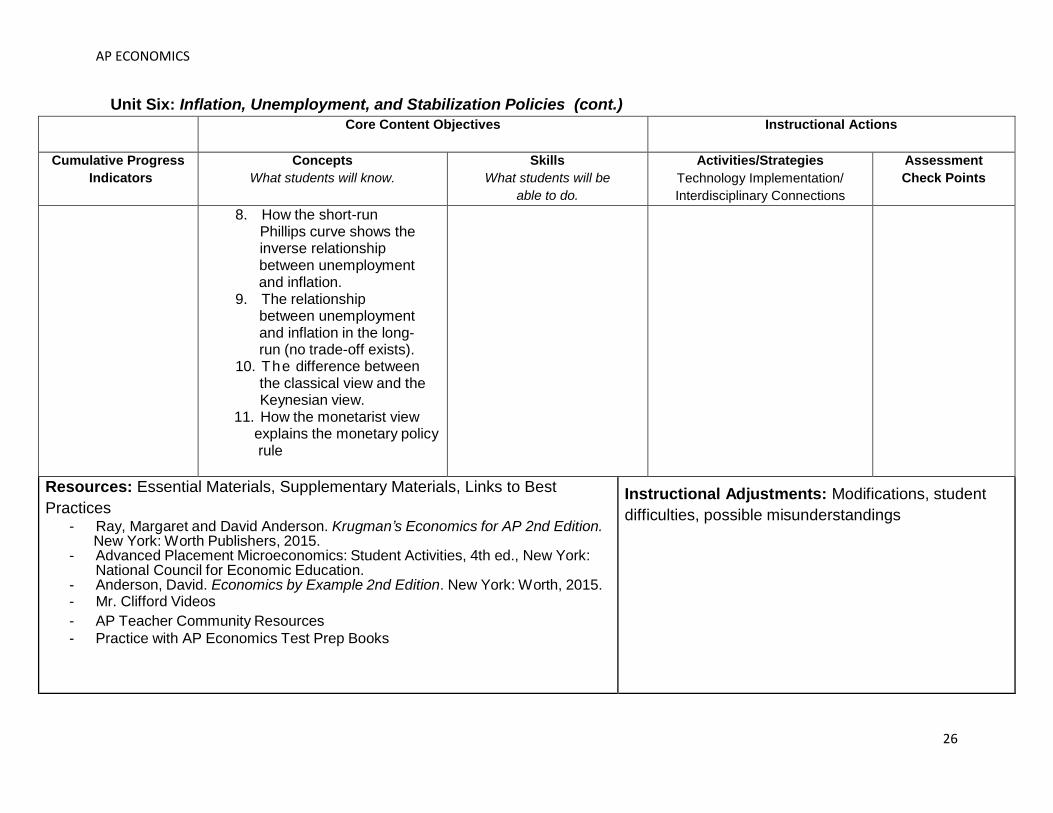
8. How the short-run Phillips curve shows the inverse relationship between unemployment and inflation. 9. The relationship
between unemployment and inflation in the long- run (no trade-off exists).
10. The difference between the classical view and the Keynesian view.
11. How the monetarist view explains the monetary policy rule
Resources: Essential Materials, Supplementary Materials, Links to Best
Practices - Ray, Margaret and David Anderson. Krugman’s Economics for AP 2nd Edition. New York: Worth Publishers, 2015. - Advanced Placement Microeconomics: Student Activities, 4th ed., New York: National Council for Economic Education. - Anderson, David. Economics by Example 2nd Edition. New York: Worth, 2015. - Mr. Clifford Videos
- AP Teacher Community Resources
- Practice with AP Economics Test Prep Books
Instructional Adjustments: Modifications, student
difficulties, possible misunderstandings

AP ECONOMICS
27
Unit Seven: Economic Growth & Productivity
Targeted Standards: Voluntary National Content Standards in Economics, Council for Economic Education: Standards 15, 18 Unit Objectives/Conceptual Understandings: (Students will be able to)
● Measure long-run economic growth ● Define the factors that stimulate long-run economic growth ● Understand how productivity is driven by physical and human capital, and technological progress ● Understand how changes in productivity are shown using an aggregate production function ● Show how economic growth has varied among regions of the world and why the convergence hypothesis applies
to economically advanced countries ● Define factors to explain why long-run economic growth rates differ among countries ● Consider how the scarcity of natural resources and efforts to make growth sustainable pose challenges to growth
● Demonstrate how long-run economic growth is represented in macroeconomic models and how to model growth effects in these models
Essential Questions:
● How has real GDP changed over time? How has real GDP varied across countries? ● How is productivity driven by physical capital, human capital, and technological progress? ● How does an aggregate production function illustrate changes in productivity? ● What factors explain the difference between long-run growth rates in different countries? ● Is growth sustainable? ● How is long-run economic growth represented in macroeconomic models?
Unit Assessment: ● Students will be assessed by their creation of neat, clear, accurately and completely labeled graphs; their logical and
clear answers to Free Response Questions (FRQs) from previous AP exams; and their participation in class activities, as well as vocabulary and lesson quizzes.

AP ECONOMICS
28
Unit Seven: Economic Growth & Productivity (cont.)
Core Content Objectives
Instructional Actions
Cumulative Progress
Indicators
Concepts
What students will know.
Skills
What students will be
able to do.
Activities/Strategies
Technology Implementation/
Interdisciplinary Connections
Assessment
Check Points
6.1.12.C.1
6.1.12.C.2 6.1.12.C.3
6.1.12.C.4
6.1.12.C.5
6.1.12.C.6
6.1.12.C.7
6.1.12.C.8 6.1.12.C.9
6.1.12.C.10
6.1.12.C.11
6.1.12.C.12
6.1.12.C.13
6.1.12.C.14 6.1.12.C.15
6.1.12.C.16
6.2.12.C.1
6.2.12.C.2
6.2.12.C.3 6.2.12.C.4
6.2.12.C.5
6.2.12.C.6
6.3.12.C.1
1. How to measure long- run economic growth.
2. The factors that stimulate economic growth.
3. How productivity is driven by physical capital, human capital, and
technological
progress.
4. How to illustrate changes
in productivity using the
aggregate production
function.
5. How economic growth
has varied around the
world.
6. Why the convergence
hypothesis applies to
economically advanced
countries.
7. Why long-run economic
growth rates vary around
the world.
8. The various challenges to
growth.
1. Calculate growth
rates.
2. Use the rule of 70 to
calculate the number
of years for the
economy to double
at a given rate of
economic growth.
3. Calculate GDP per
worker and use it as
an aggregate
production function.
4. Use growth
accounting to
estimate the
contributions of
factors to economic
growth.
5. Illustrate economic
growth on the
production
possibilities curve.
6. Illustrate long-run
economic growth on
the LRAS curve.
Possible
activities:
- Race to the graph - Kahoots
Neat, clear, accurately and completely labeled graphs. FRQs from previous
AP
exams
Vocabulary
assessments
Lesson quizzes Group projects Homework
Class participation

AP ECONOMICS
29
Unit Seven: Economic Growth & Productivity (cont.)
Core Content Objectives
Instructional Actions
Cumulative Progress
Indicators
Concepts
What students will know.
Skills
What students will be
able to do.
Activities/Strategies
Technology Implementation/
Interdisciplinary Connections
Assessment
Check Points
9. How long-run economic
growth is shown in
macroeconomic models.
10. How to model growth effects.
Resources: Essential Materials, Supplementary Materials, Links to Best Practices
- Ray, Margaret and David Anderson. Krugman’s Economics for AP 2nd Edition. New York: Worth Publishers, 2015. - Advanced Placement Microeconomics: Student Activities, 4th ed, New York: National Council for Economic Education. - Anderson, David. Economics by Example 2nd Edition. New York: Worth, 2015. - Mr. Clifford Videos - AP Teacher Community Resources - Practice with AP Economics Test Prep Books
Instructional Adjustments: Modifications, student difficulties, possible misunderstandings
- The AP exam does not test specifics of implicit liabilities like Social Security and Medicare. Students need to know just that these and other programs are implicit liabilities and that they will add to the US debt as American demographics shift to an older population.

AP ECONOMICS
30
Unit Eight: The Open Economy: International Trade
Targeted Standards: Voluntary National Content Standards in Economics, Council for Economic Education: Standards 3, 4, 5, 6, 7 Unit Objectives/Conceptual Understandings: (Students will be able to)
● Record and analyze the balance of payments in accounts ● Create a loanable funds market graph to model international capital flows ● Explain how market forces and public policy affect currency demand and currency supply ● Model the equilibrium exchange rate using supply/demand analysis ● Show how changes in capital flows affect the balance of payments accounts ● Show how a fixed exchange rate system differs from a floating exchange rate system ● How to illustrate the effects of a tariff and an import quota
Essential Questions:
● What is the meaning of the balance of payments accounts? ● What are the determinants of international capital flows? ● What is the role of the exchange rate and the foreign exchange market? ● What is the difference between fixed exchange rates and floating exchange rates? ● What are the effects of currency devaluation and revaluation under a fixed exchange rate regime? ● How does macroeconomic policy affect exchange rates under a floating exchange rate regime? ● What are the effects of tariffs and import quotas?
Unit Assessment:
● Students will be assessed by their creation of neat, clear, accurately and completely labeled graphs; their logical and clear answers to Free Response Questions (FRQs) from previous AP exams; and their participation in class activities, as well as vocabulary and lesson quizzes.
AP ECONOMICS
31
Unit Eight: The Open Economy: International Trade (cont.)
Core Content Objectives
Instructional Actions
Cumulative Progress
Indicators
Concepts
What students will know.
Skills
What students will be
able to do.
Activities/Strategies
Technology Implementation/
Interdisciplinary Connections
Assessment
Check Points
6.1.12.C.1
6.1.12.C.2 6.1.12.C.3
6.1.12.C.4
6.1.12.C.5
6.1.12.C.6
6.1.12.C.7
6.1.12.C.8 6.1.12.C.9
6.1.12.C.10
6.1.12.C.11
6.1.12.C.12
6.1.12.C.13
6.1.12.C.14 6.1.12.C.15
6.1.12.C.16
6.2.12.C.1
6.2.12.C.2
6.2.12.C.3 6.2.12.C.4
6.2.12.C.5
6.2.12.C.6
6.3.12.C.1
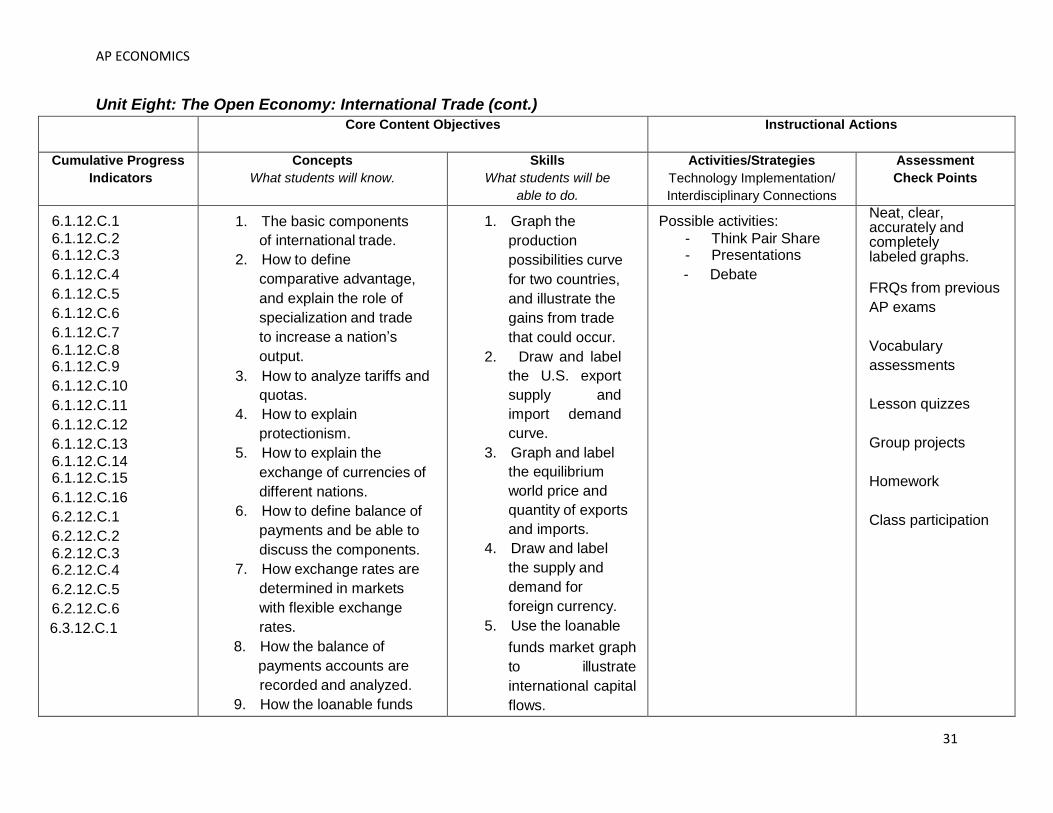
1. The basic components
of international trade.
2. How to define
comparative advantage,
and explain the role of
specialization and trade
to increase a nation’s
output.
3. How to analyze tariffs and
quotas.
4. How to explain
protectionism.
5. How to explain the
exchange of currencies of
different nations.
6. How to define balance of
payments and be able to
discuss the components.
7. How exchange rates are
determined in markets
with flexible exchange
rates.
8. How the balance of
payments accounts are
recorded and analyzed.
9. How the loanable funds
1. Graph the
production
possibilities curve
for two countries,
and illustrate the
gains from trade
that could occur.
2. Draw and label
the U.S. export
supply and
import demand
curve.
3. Graph and label
the equilibrium
world price and
quantity of exports
and imports.
4. Draw and label
the supply and
demand for
foreign currency.
5. Use the loanable
funds market graph
to illustrate
international capital
flows.
Possible activities:
- Think Pair Share - Presentations
- Debate
Neat, clear, accurately and completely labeled graphs. FRQs from previous
AP exams
Vocabulary
assessments
Lesson quizzes
Group projects
Homework
Class participation

AP ECONOMICS
32
Unit Eight: The Open Economy: International Trade (cont.)
Core Content Objectives Instructional Actions
Cumulative Progress
Indicators
Concepts
What students will know.
Skills
What students will be
able to do.
Activities/Strategies
Technology Implementation/
Interdisciplinary Connections
Assessment
Check Points
market graph can be used
to model international
capital flows.
10. How market forces and
public policy affect
currency demand and
supply.
11. The difference between a
fixed exchange rate
system differs from a
floating rate system.
12. The impact of currency
appreciation and
depreciation.
13. The causes and
consequences of the U.S.
trade deficit
6. Model the foreign
exchange market
and calculate
equilibrium
exchange rate.
7. Analyze the impact
of tariffs and quotas
on the market.
Resources: Essential Materials, Supplementary Materials, Links to Best Practices
- Ray, Margaret and David Anderson. Krugman’s Economics for AP 2nd Edition. New York: Worth Publishers, 2015. - Advanced Placement Microeconomics: Student Activities, 4th ed., New York: National Council for Economic Education. - Anderson, David. Economics by Example 2nd Edition. New York: Worth, 2015. - Mr. Clifford Videos - AP Teacher Community Resources
- Practice with AP Economics Test Prep Books
Instructional Adjustments: Modifications, student difficulties, possible misunderstandings
● The foreign exchange market appears frequently on the AP exam. Students should be prepared to graph and explain this market in the free-response section

AP ECONOMICS
33
Unit Nine: Demand - Consumer Behavior & Choice
Targeted Standards: Voluntary National Content Standards in Economics, Council for Economic Education: Standards 1, 2, 3, 4
Unit Objectives/Conceptual Understandings: (Students will be able to) ● Use the income effect and substitution effect to explain the downward-sloping demand curve ● Examine elasticity as a measure of responsiveness to changes in price or income ● Calculate price elasticity of demand ● Differentiate between normal and inferior goods ● Calculate price elasticity of supply ● Calculate consumer and producer surplus ● Use total surplus to evaluate efficiency in markets ● Differentiate between efficiency and equity ● Show how taxes can affect total surplus and create deadweight loss ● Understand the principle of diminishing marginal utility
Essential Questions:
● What is the law of demand? ● How do you calculate the price elasticity of demand? ● What is the difference between elastic and inelastic demand? ● How does price elasticity change along a demand curve? ● What factors determine price elasticity of demand? ● How do you measure the responsiveness of demand for one good to changes in the price of another good? ● What is price elasticity of supply? ● What is a consumer surplus? How does it relate to the demand curve? ● What is a producer surplus? How does it relate to the supply curve? ● How do taxes affect total surplus? ● What is deadweight loss, and what are some reasons for it to occur? ● Why is a consumer’s general goal to maximize utility? ● How do you use marginal analysis to find the optimal consumption bundle?
Unit Assessment: ● Students will be assessed by their creation of neat, clear, accurately and completely labeled graphs; their logical and clear answers to Free Response Questions (FRQs) from previous AP exams; and their participation in class activities, as well as vocabulary and lesson quizzes.

AP ECONOMICS
34
Unit Nine: Demand - Consumer Behavior & Choice (cont.)
Core Content Objectives
Instructional Actions
Cumulative Progress
Indicators
Concepts
What students will know.
Skills
What students will be
able to do.
Activities/Strategies
Technology Implementation/
Interdisciplinary Connections
Assessment
Check Points
6.1.12.C.1
6.1.12.C.2 6.1.12.C.3
6.1.12.C.4
6.1.12.C.5
6.1.12.C.6
6.1.12.C.7
6.1.12.C.8 6.1.12.C.9
6.1.12.C.10
6.1.12.C.11
6.1.12.C.12
6.1.12.C.13
6.1.12.C.14 6.1.12.C.15
6.1.12.C.16
6.2.12.C.1
6.2.12.C.2
6.2.12.C.3
6.2.12.C.4 6.2.12.C.5
6.2.12.C.6
6.3.12.C.1
1. Why the income effect
and substitution effect lead
to a downward-sloping
demand curve.
2. How to calculate price
elasticity of demand, and
explain its application.
3. The factors that
determine price elasticity
of demand.
4. The use of the total
revenue test in
determining price
elasticity.
5. How to calculate and
interpret cross-price
elasticity of demand and
income elasticity of
demand, and explain its
application.
6. How to calculate price
elasticity of supply and
explain it as a measure
of seller
responsiveness to price
1. Label an elastic and inelastic demand curve.
2. Construct, label and interpret a total utility curve and a marginal utility curve.
3. Graphically illustrate the incidence of a tax.
4. Graphically illustrate the efficiency loss of a tax.
5. Graphically illustrate consumer surplus and producer surplus.
6. Graphically illustrate efficiency loss (or deadweight loss).
7. Calculate price elasticity of demand.
8. Calculate price elasticity of supply.
9. Calculate cross-price elasticity and
Possible activities:
- Mr. Clifford videos - Graphing scenarios
Neat, clear, accurately and completely labeled graphs.
FRQs from previous
AP exams
Vocabulary
assessments
Lesson quizzes
Group projects
Homework
Class participation

AP ECONOMICS
35
Unit Nine: Demand - Consumer Behavior & Choice (cont.)
Core Content Objectives
Instructional Actions
Cumulative Progress
Indicators
Concepts
What students will know.
Skills
What students will be
able to do.
Activities/Strategies
Technology Implementation/
Interdisciplinary Connections
Assessment
Check Points
change.
10. The relationship
between total utility,
marginal utility, and the
law of diminishing
marginal utility.
11. How to use and apply the
process of utility
maximization and the
supporting model.
12. How to construct and
interpret marginal utility
schedules and curves.
13. How to derive
consumer demand
schedules and curves.
14. How to apply the theory of
consumer behavior to real-
world phenomena.
15. How to explain the
principles elating to tax
efficiency and efficiency
losses caused by taxes,
as well as tax incidence.
16. The calculation and
income elasticity.
.

AP ECONOMICS
36
Unit Nine: Demand - Consumer Behavior & Choice (cont.)
Core Content Objectives
Instructional Actions
Cumulative Progress Indicators
Concepts What students will know.
Skills What students will be
able to do.
Activities/Strategies Technology Implementation/ Interdisciplinary Connections
Assessment Check Points
meaning of consumer surplus and producer
surplus. 14. The use of total surplus to evaluate efficiency in markets.
15. The difference between efficiency and equity
Resources: Essential Materials, Supplementary Materials, Links to Best Practices
- Ray, Margaret and David Anderson. Krugman’s Economics for AP 2nd Edition. New York: Worth Publishers, 2015. - Advanced Placement Microeconomics: Student Activities, 4th ed., New York: National Council for Economic Education. - Anderson, David. Economics by Example 2nd Edition. New York: Worth, 2015. - Mr. Clifford Videos - AP Teacher Community Resources - Practice with AP Economics Test Prep Books
Instructional Adjustments: Modifications, student difficulties, possible misunderstandings
● Consumer and producer surplus are represented as a triangle on a graph, and students may need to review how to calculate the area of a triangle (1/2bh)

AP ECONOMICS
37
Unit Ten: Supply - Profit, Production, and Cost
Targeted Standards: Voluntary National Content Standards in Economics, Council for Economic Education: Standards 7, 8, 9 Unit Objectives/Conceptual Understandings: (Students will be able to)
● Differentiate between implicit and explicit costs ● Calculate accounting profit, economic profit, and normal profit ● Use marginal analysis to determine the profit-maximizing level of output ● Define and calculate marginal and average costs ● Graph short-run costs (TC, FC, VC, ATC, AVC, AFC, MC) ● Know the shapes of the total, marginal, and average cost curves ● Differentiate between long-run and short-run ● Characterize perfect competition, monopoly, monopolistic competition, and oligopoly
Essential Questions:
● What are the differences between implicit and explicit costs? ● What is the difference between accounting profit, economic profit, and normal profit? ● How do you perform marginal analysis? ● How do you use the optimal output rule? ● What is the relationship between a quantity of inputs and quantity of outputs in a firm’s production function? ● Explain the role of diminishing returns in production. ● What costs do firms face, and how do those costs generate marginal cost curves and average cost curves? ● How can a firm enjoy economies of scale? ● What are the four principle types of market structure?
Unit Assessment: ● Students will be assessed by their creation of neat, clear, accurately and completely labeled graphs; their logical and clear answers to Free Response Questions (FRQs) from previous AP exams; and their participation in class activities, as well as vocabulary and lesson quizzes.
AP ECONOMICS
38
Unit Ten: Supply - Profit, Production, and Cost (cont.)
Core Content Objectives
Instructional Actions
Cumulative Progress Indicators
Concepts What students will know.
Skills What students will be
able to do.
Activities/Strategies Technology Implementation/ Interdisciplinary Connections
Assessment Check Points
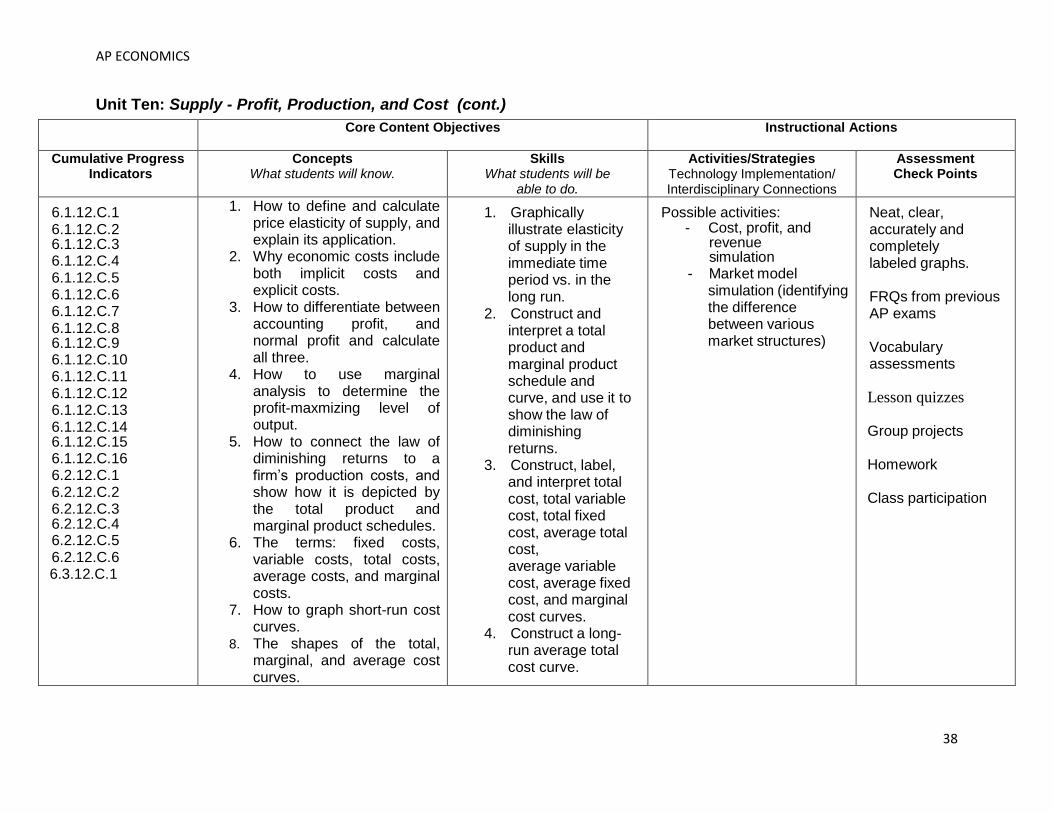
6.1.12.C.1 6.1.12.C.2 6.1.12.C.3 6.1.12.C.4 6.1.12.C.5 6.1.12.C.6 6.1.12.C.7 6.1.12.C.8 6.1.12.C.9 6.1.12.C.10 6.1.12.C.11 6.1.12.C.12 6.1.12.C.13 6.1.12.C.14 6.1.12.C.15 6.1.12.C.16 6.2.12.C.1 6.2.12.C.2 6.2.12.C.3 6.2.12.C.4 6.2.12.C.5 6.2.12.C.6
6.3.12.C.1
1. How to define and calculate price elasticity of supply, and explain its application.
2. Why economic costs include both implicit costs and explicit costs.
3. How to differentiate between accounting profit, and normal profit and calculate all three.
4. How to use marginal analysis to determine the profit-maxmizing level of output.
5. How to connect the law of diminishing returns to a firm’s production costs, and show how it is depicted by the total product and marginal product schedules.
6. The terms: fixed costs, variable costs, total costs, average costs, and marginal costs.
7. How to graph short-run cost curves.
8. The shapes of the total, marginal, and average cost curves.
1. Graphically illustrate elasticity of supply in the immediate time period vs. in the long run.
2. Construct and interpret a total product and marginal product schedule and curve, and use it to show the law of diminishing returns.
3. Construct, label, and interpret total cost, total variable cost, total fixed cost, average total cost, average variable cost, average fixed cost, and marginal cost curves.
4. Construct a long-run average total cost curve.
Possible activities: - Cost, profit, and
revenue simulation
- Market model simulation (identifying the difference between various market structures)
Neat, clear, accurately and completely labeled graphs.
FRQs from previous AP exams
Vocabulary assessments
Lesson quizzes Group projects Homework
Class participation

AP ECONOMICS
39
Unit Ten: Supply - Profit, Production, and Cost (cont.)
Core Content Objectives
Instructional Actions
Cumulative Progress Indicators
Concepts What students will know.
Skills What students will be
able to do.
Activities/Strategies Technology Implementation/ Interdisciplinary Connections
Assessment Check Points
9. How to differentiate between the short-run and long-run when it comes to costs.
10. How to explain economies of scale, constant returns to scale, and diseconomies of scale and discuss a firm’s average costs in the long run.
11. How to construct cost curves and identify relationships between them
12. How to explain why economic profits occur.
13. How to find the optimal
input mix and the cost-
minimization rule.
14. The basic characteristics of perfect competition, monopoly, monopolistic competition, and oligopoly.
5. Find the optimal input mix by using the cost- minimization rule.
6. Use marginal analysis to determine the profit-maximizing level of output.

AP ECONOMICS
40
Unit Ten: Supply - Profit, Production, and Cost (cont.)
Resources: Essential Materials, Supplementary Materials, Links to Best
Practices
- Ray, Margaret and David Anderson. Krugman’s Economics for AP 2nd Edition New York: Worth Publishers, 2015. - Advanced Placement Microeconomics: Student Activities, 4th ed., New York: National Council for Economic Education. - Anderson, David. Economics by Example 2nd Edition. New York: Worth, 2015. - Mr. Clifford Videos - AP Teacher Community Resources - Practice with AP Economics Test Prep Books
Instructional Adjustments: Modifications, student
difficulties, possible misunderstandings
AP ECONOMICS
41
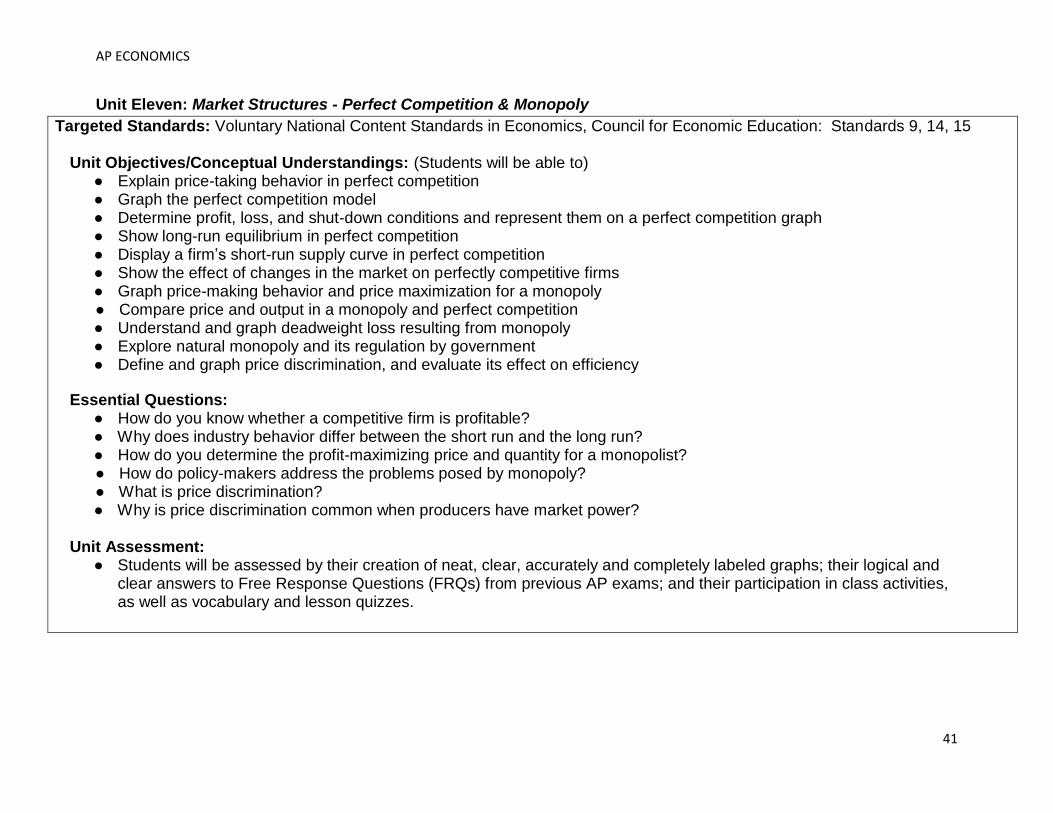
Unit Eleven: Market Structures - Perfect Competition & Monopoly
Targeted Standards: Voluntary National Content Standards in Economics, Council for Economic Education: Standards 9, 14, 15
Unit Objectives/Conceptual Understandings: (Students will be able to) ● Explain price-taking behavior in perfect competition ● Graph the perfect competition model ● Determine profit, loss, and shut-down conditions and represent them on a perfect competition graph ● Show long-run equilibrium in perfect competition ● Display a firm’s short-run supply curve in perfect competition ● Show the effect of changes in the market on perfectly competitive firms ● Graph price-making behavior and price maximization for a monopoly
● Compare price and output in a monopoly and perfect competition ● Understand and graph deadweight loss resulting from monopoly ● Explore natural monopoly and its regulation by government ● Define and graph price discrimination, and evaluate its effect on efficiency
Essential Questions:
● How do you know whether a competitive firm is profitable? ● Why does industry behavior differ between the short run and the long run? ● How do you determine the profit-maximizing price and quantity for a monopolist?
● How do policy-makers address the problems posed by monopoly? ● What is price discrimination?
● Why is price discrimination common when producers have market power? Unit Assessment:
● Students will be assessed by their creation of neat, clear, accurately and completely labeled graphs; their logical and clear answers to Free Response Questions (FRQs) from previous AP exams; and their participation in class activities, as well as vocabulary and lesson quizzes.

AP ECONOMICS
42
Unit Eleven: Market Structures - Perfect Competition & Monopoly (cont.)
Core Content Objectives
Instructional Actions
Cumulative Progress Indicators
Concepts What students will know.
Skills What students will be
able to do.
Activities/Strategies Technology Implementation/ Interdisciplinary Connections
Assessment Check Points
6.1.12.C.1 6.1.12.C.2 6.1.12.C.3 6.1.12.C.4 6.1.12.C.5 6.1.12.C.6 6.1.12.C.7 6.1.12.C.8 6.1.12.C.9 6.1.12.C.10 6.1.12.C.11 6.1.12.C.12 6.1.12.C.13 6.1.12.C.14 6.1.12.C.15 6.1.12.C.16 6.2.12.C.1 6.2.12.C.2 6.2.12.C.3 6.2.12.C.4 6.2.12.C.5 6.2.12.C.6
6.3.12.C.1
1. Price-taking behavior that occurs in perfect competition.
2. How and where profit maximization occurs in perfect competition.
3. How to graph the perfect competition model.
4. How to determine profit, loss, and shut- down conditions and graphically illustrate them for perfectly competition.
5. How to find long-run equilibrium in perfect competition. 6. The impact of changes
in the market on perfectly competitive firms
1. Price-making behavior that occurs in a monopoly market.
8. How and where profit
maximization occurs for a
monopoly.
9. How to determine profit,
loss, and shut- down
conditions and
1. Draw graphs for both a single firm and for the industry, and differentiate between the two.
2. Construct a cost curve for a purely competitive firm in the short run and identify the break-even point, shut-down point, and area of economic profit (or loss).
3. Construct cost
curves for a purely
competitive firm in
the long-run.
4. Construct and
label cost curves
for a pure
monopoly, and
identify profit-
maximizing output
Possible activities - Mock businesses - “Shark tank”
presentations - Consecutive
graphing of situations (one group graphs status quo, pass to right when conditions change to modify graph, pass again to
show new graph)
Neat, clear, accurately and completely labeled graphs.
FRQs from previous AP exams Vocabulary assessments Lesson quizzes Group projects Homework Class participation
AP ECONOMICS
43
Unit Eleven: Market Structures - Perfect Competition & Monopoly (cont.)
Core Content Objectives
Instructional Actions
Cumulative Progress Indicators
Concepts What students will know.
Skills What students will be
able to do.
Activities/Strategies Technology Implementation/ Interdisciplinary Connections
Assessment Check Points
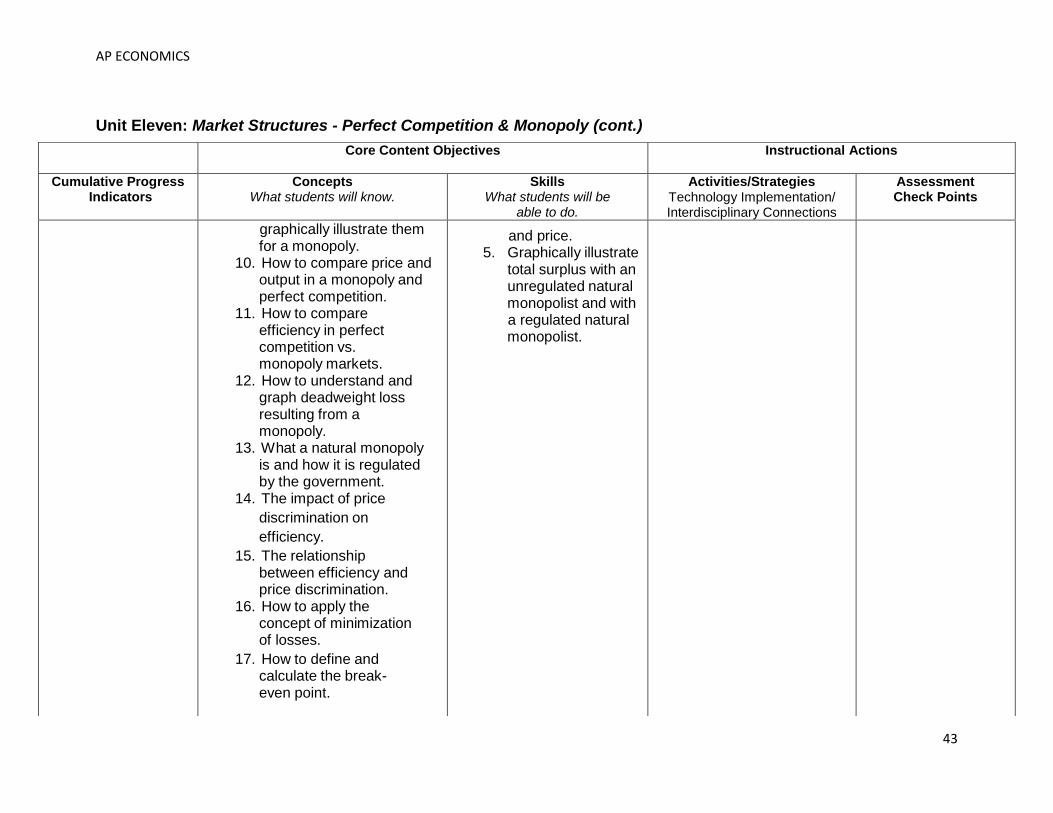
graphically illustrate them for a monopoly.
10. How to compare price and output in a monopoly and perfect competition.
11. How to compare efficiency in perfect competition vs. monopoly markets.
12. How to understand and graph deadweight loss resulting from a monopoly.
13. What a natural monopoly is and how it is regulated by the government.
14. The impact of price
discrimination on
efficiency.
15. The relationship between efficiency and price discrimination.
16. How to apply the concept of minimization of losses.
17. How to define and calculate the break- even point.
and price. 5. Graphically illustrate total surplus with an unregulated natural monopolist and with a regulated natural monopolist.

AP ECONOMICS
44
Unit Eleven: Market Structures - Perfect Competition & Monopoly (cont.)
Resources: Essential Materials, Supplementary Materials, Links to Best
Practices
- Ray, Margaret and David Anderson. Krugman’s Economics for AP 2nd Edition. New York: Worth Publishers, 2015. - Advanced Placement Microeconomics: Student Activities, 4th ed., New York: National Council for Economic Education. - Anderson, David. Economics by Example 2nd Edition. New York: Worth, 2015. - Mr. Clifford Videos - AP Teacher Community Resources - Practice with AP Economics Test Prep Books
Instructional Adjustments: Modifications, student
difficulties, possible misunderstandings
● On the AP exam, students should approach
changes that have long-run repercussions one
small step at a time. First, teach them to show the
initial change on their graphs. Then analyze the
short-run effects of that change. Finally, focus on
the adjustments that lead to long-run equilibrium.
Core Content Objectives
Instructional Actions
Cumulative Progress Indicators
Concepts What students will know.
Skills What students will be
able to do.
Activities/Strategies Technology Implementation/ Interdisciplinary Connections
Assessment Check Points
18. How to define and
calculate the
shutdown point.
19. How long-run equilibrium in pure competition leads to an efficient allocation of resources.
20. The types of monopolies, and the barriers to entry that are present in this type of market model.
AP ECONOMICS
45
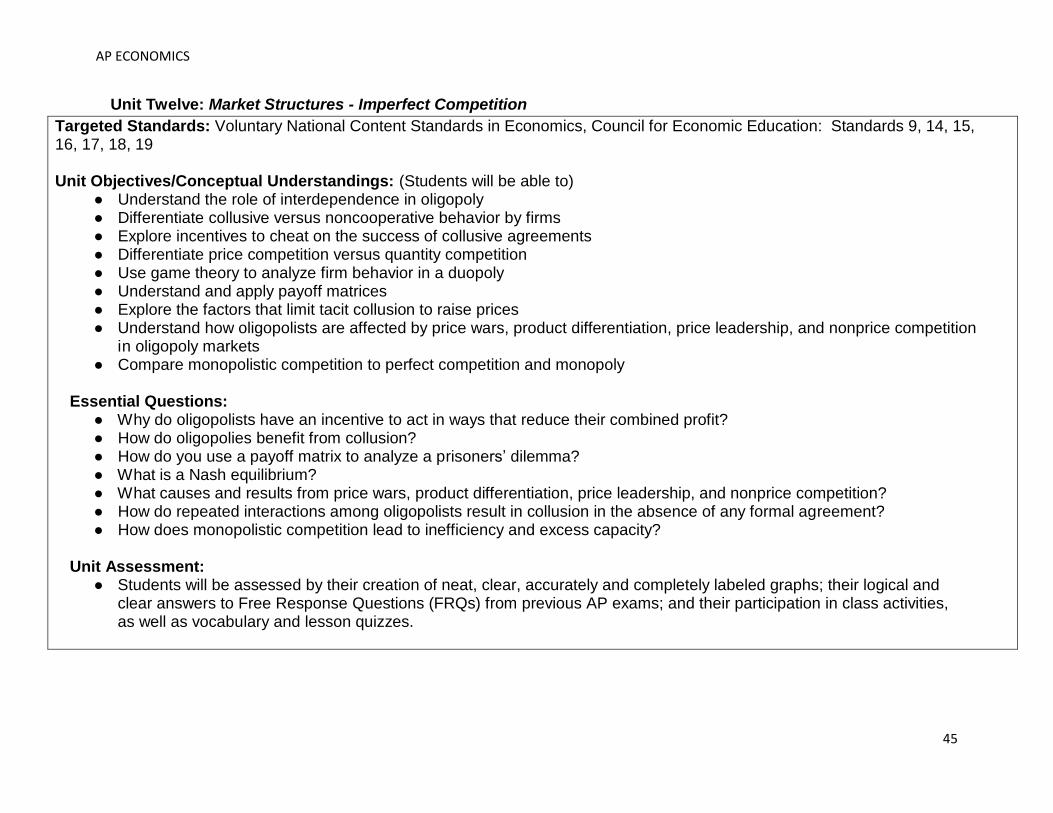
Unit Twelve: Market Structures - Imperfect Competition
Targeted Standards: Voluntary National Content Standards in Economics, Council for Economic Education: Standards 9, 14, 15, 16, 17, 18, 19 Unit Objectives/Conceptual Understandings: (Students will be able to)
● Understand the role of interdependence in oligopoly ● Differentiate collusive versus noncooperative behavior by firms ● Explore incentives to cheat on the success of collusive agreements ● Differentiate price competition versus quantity competition ● Use game theory to analyze firm behavior in a duopoly ● Understand and apply payoff matrices ● Explore the factors that limit tacit collusion to raise prices ● Understand how oligopolists are affected by price wars, product differentiation, price leadership, and nonprice competition
in oligopoly markets ● Compare monopolistic competition to perfect competition and monopoly
Essential Questions:
● Why do oligopolists have an incentive to act in ways that reduce their combined profit? ● How do oligopolies benefit from collusion? ● How do you use a payoff matrix to analyze a prisoners’ dilemma? ● What is a Nash equilibrium? ● What causes and results from price wars, product differentiation, price leadership, and nonprice competition? ● How do repeated interactions among oligopolists result in collusion in the absence of any formal agreement? ● How does monopolistic competition lead to inefficiency and excess capacity?
Unit Assessment:
● Students will be assessed by their creation of neat, clear, accurately and completely labeled graphs; their logical and clear answers to Free Response Questions (FRQs) from previous AP exams; and their participation in class activities, as well as vocabulary and lesson quizzes.
AP ECONOMICS
46
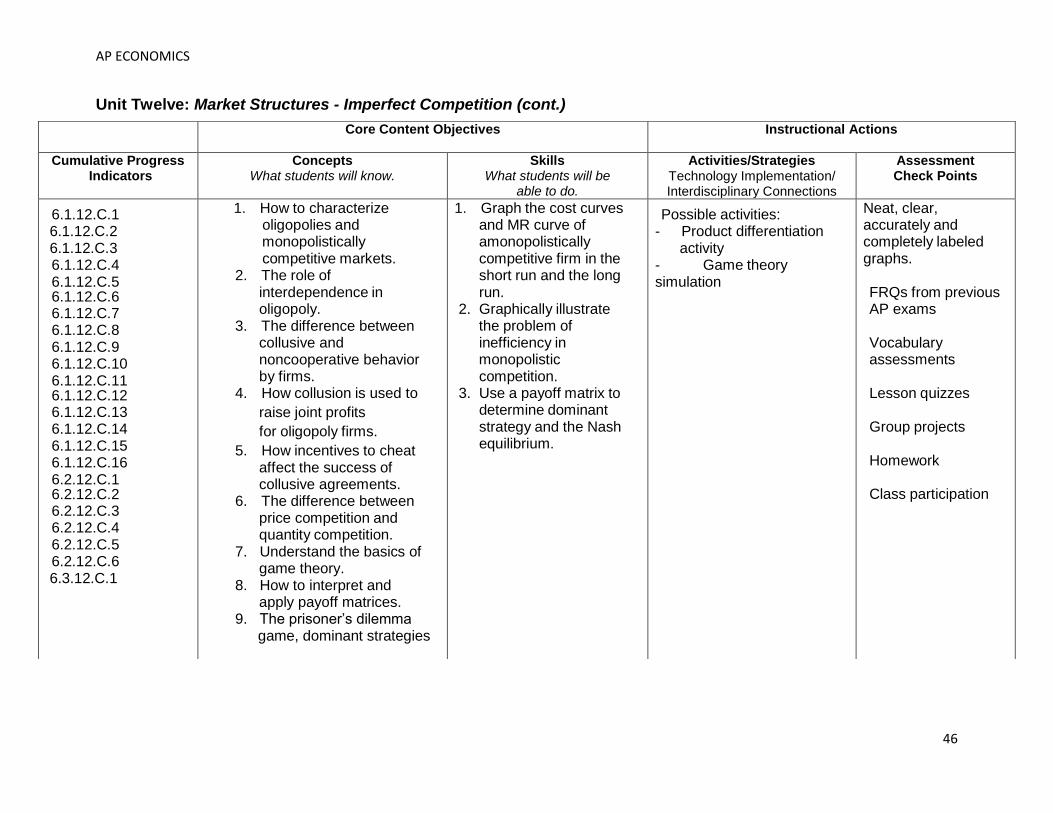
Unit Twelve: Market Structures - Imperfect Competition (cont.)
Core Content Objectives
Instructional Actions
Cumulative Progress Indicators
Concepts What students will know.
Skills What students will be
able to do.
Activities/Strategies Technology Implementation/ Interdisciplinary Connections
Assessment Check Points
6.1.12.C.1 6.1.12.C.2 6.1.12.C.3 6.1.12.C.4 6.1.12.C.5 6.1.12.C.6 6.1.12.C.7 6.1.12.C.8 6.1.12.C.9 6.1.12.C.10 6.1.12.C.11 6.1.12.C.12 6.1.12.C.13 6.1.12.C.14 6.1.12.C.15 6.1.12.C.16 6.2.12.C.1 6.2.12.C.2 6.2.12.C.3 6.2.12.C.4 6.2.12.C.5 6.2.12.C.6
6.3.12.C.1
1. How to characterize oligopolies and monopolistically competitive markets.
2. The role of interdependence in oligopoly.
3. The difference between collusive and noncooperative behavior by firms.
4. How collusion is used to
raise joint profits
for oligopoly firms.
5. How incentives to cheat affect the success of collusive agreements.
6. The difference between price competition and quantity competition.
7. Understand the basics of game theory.
8. How to interpret and apply payoff matrices.
9. The prisoner’s dilemma game, dominant strategies
1. Graph the cost curves and MR curve of amonopolistically competitive firm in the short run and the long run. 2. Graphically illustrate the problem of inefficiency in monopolistic competition. 3. Use a payoff matrix to determine dominant strategy and the Nash equilibrium.
Possible activities: - Product differentiation activity - Game theory simulation
Neat, clear, accurately and completely labeled graphs. FRQs from previous AP exams Vocabulary assessments Lesson quizzes Group projects Homework Class participation
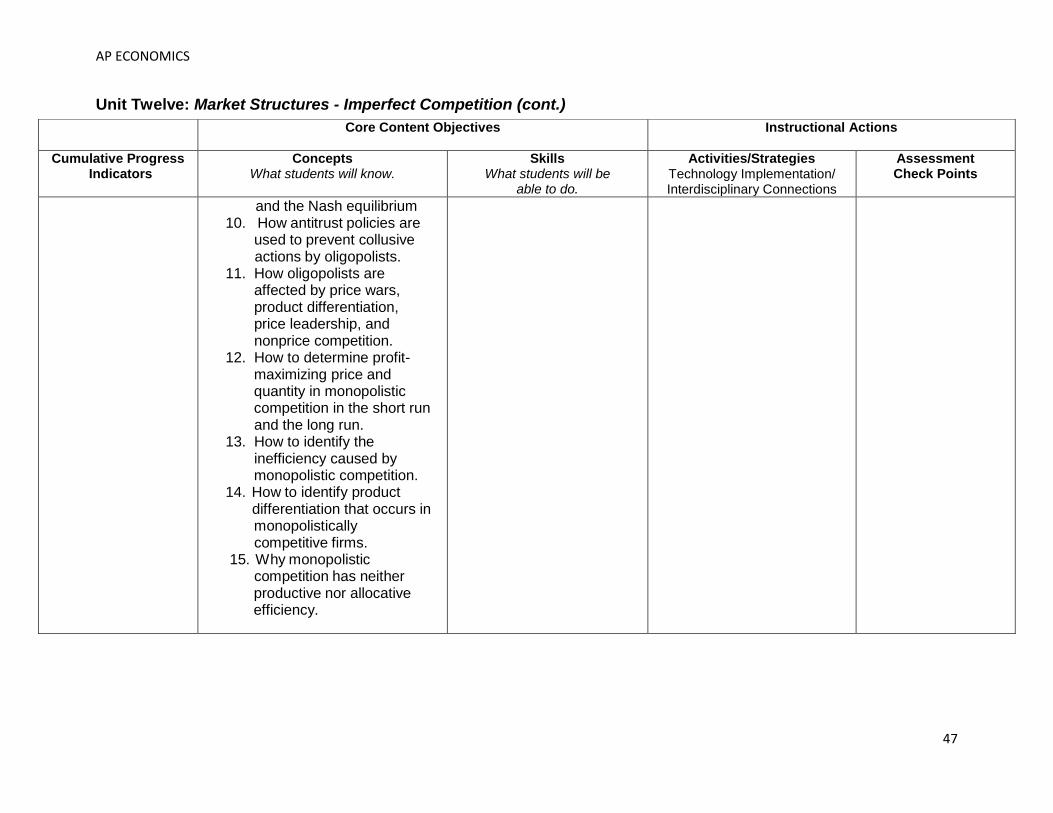
AP ECONOMICS
47
Unit Twelve: Market Structures - Imperfect Competition (cont.)
Core Content Objectives
Instructional Actions
Cumulative Progress Indicators
Concepts What students will know.
Skills What students will be
able to do.
Activities/Strategies Technology Implementation/ Interdisciplinary Connections
Assessment Check Points
and the Nash equilibrium 10. How antitrust policies are used to prevent collusive actions by oligopolists. 11. How oligopolists are affected by price wars, product differentiation, price leadership, and nonprice competition. 12. How to determine profit- maximizing price and quantity in monopolistic competition in the short run and the long run. 13. How to identify the inefficiency caused by monopolistic competition. 14. How to identify product differentiation that occurs in monopolistically competitive firms. 15. Why monopolistic competition has neither productive nor allocative efficiency.
AP ECONOMICS
48
Unit Twelve: Market Structures - Imperfect Competition (cont.)
Resources: Essential Materials, Supplementary Materials, Links to Best
Practices - Ray, Margaret and David Anderson. Krugman’s Economics for AP 2nd Edition. New
York: Worth Publishers, 2015.
- Advanced Placement Microeconomics: Student Activities, 4th ed., New York:
National
Council for Economic Education.
- Anderson, David. Economics by Example 2nd Edition. New York: Worth, 2015. - Mr. Clifford Videos
- AP Teacher Community Resources
- Practice with AP Economics Test Prep Books
Instructional Adjustments: Modifications, student
difficulties, possible misunderstandings
Core Content Objectives
Instructional Actions
Cumulative Progress Indicators
Concepts What students will know.
Skills What students will be
able to do.
Activities/Strategies Technology Implementation/ Interdisciplinary Connections
Assessment Check Points
16. Why monopolistically competitive firms only earn a normal profit in the long run.

AP ECONOMICS
49
Unit Thirteen: Factor Markets
Targeted Standards: Voluntary National Content Standards in Economics, Council for Economic Education: Standards 9, 13, 18
Unit Objectives/Conceptual Understandings: (Students will be able to)
● Define physical and human capital ● Explain the factor distribution of income between land, labor, capital, and entrepreneurship ● Graph marginal productivity and the MP curve ● Graph the MRP and factor demand curves ● Explore the labor supply curve for individuals and the market, and show equilibrium in the labor market ● Examine perfectly competitive and imperfectly competitive labor markets ● Explore theories of income distribution
Essential Questions: ● What differentiates markets for factors of production from factors of goods markets? ● How do factor markets determine the factor distribution of income? ● How does the demand for factors lead to the marginal productivity theory of income distribution? ● How does a worker’s decision about time preference give rise to labor supply? ● How do firms determine the optimal input mix? ● What are the sources of wage disparities?
Unit Assessment:
● Students will be assessed by their creation of neat, clear, accurately and completely labeled graphs; their logical and clear answers to Free Response Questions (FRQs) from previous AP exams; and their participation in class activities, as well as vocabulary and lesson quizzes.

AP ECONOMICS
50
Unit Thirteen: Factor Markets (cont.)
Core Content Objectives
Instructional Actions
Cumulative Progress Indicators
Concepts What students will know.
Skills What students will be
able to do.
Activities/Strategies Technology Implementation/ Interdisciplinary Connections
Assessment Check Points
6.1.12.C.1 6.1.12.C.2 6.1.12.C.3 6.1.12.C.4 6.1.12.C.5 6.1.12.C.6 6.1.12.C.7 6.1.12.C.8 6.1.12.C.9 6.1.12.C.10 6.1.12.C.11 6.1.12.C.12 6.1.12.C.13 6.1.12.C.14 6.1.12.C.15 6.1.12.C.16 6.2.12.C.1 6.2.12.C.2 6.2.12.C.3 6.2.12.C.4 6.2.12.C.5 6.2.12.C.6
6.3.12.C.1
1. The significance of resource pricing. 2. How to explain the concept of derived demand.
3. The marginal revenue productivity of a resource.
4. How to demonstrate the MRP and the factor demand curves and illustrate shifts in these curves.
5. How to show supply and demand in the markets for land and capital.
6. The factors that increase and decrease demand for resources.
7. How to find the determinants of elasticity of resource demand.
8. How a firm selects the optimal combination of resources.
9. How to calculate and explain the quantity of labor/resources a firm
hires/purchases. 10. How wage rates and employment levels are
1. Draw and label a firm’s demand curve for a resource.
2. Draw and label a labor supply and labor demand curve in both a perfectly competitive labor market and an imperfectly competitive market.
3. Graphically illustrate the wage rate and level of employment in a monopsonistic labor market.
4. Use the cost- minimization rule to determine the cost- minimizing combination of inputs.
Possible activities:
- Labor market
simulation
Neat, clear, accurately and completely labeled graphs. FRQs from previous AP exams Vocabulary assessments Lesson quizzes Group projects Simulations Homework Class participation

AP ECONOMICS
51
Unit Thirteen: Factor Markets (cont.)
Resources: Essential Materials, Supplementary Materials, Links to Best Practices
- Ray, Margaret and David Anderson. Krugman’s Economics for AP 2nd Edition. New York: Worth Publishers, 2015. - Advanced Placement Microeconomics: Student Activities, 4th ed., New York: National Council for Economic Education. - Anderson, David. Economics by Example 2nd Edition. New York: Worth, 2015. - Mr. Clifford Videos - AP Teacher Community Resources
- Practice with AP Economics Test Prep Books
Instructional Adjustments: Modifications, student difficulties, possible misunderstandings
Core Content Objectives
Instructional Actions
Cumulative Progress Indicators
Concepts What students will know.
Skills What students will be
able to do.
Activities/Strategies Technology Implementation/ Interdisciplinary Connections
Assessment Check Points
determined in competitive labor markets. 11. How to determine equilibrium in both a perfectly competitive and imperfectly competitive labor market. 12. How to find the cost- minimizing input combination and the optimal input mix. 13. How monopsony can reduce wages below competitive levels. 14. What economic rent is and how it is determined.
AP ECONOMICS
52
Unit Fourteen: Market Failure and Government Intervention
Targeted Standards: Voluntary National Content Standards in Economics, Council for Economic Education: Standards 16, 17, 18, 20 Unit Objectives/Conceptual Understandings: (Students will be able to) ● Define positive and negative externalities
● Examine the effect of externalities on efficiency in markets ● Explain and analyze externalities using the supply and demand model ● Critique government policy actions to address inefficiency resulting from externalities ● Explore the free-rider problem and determine the optimal level of government intervention ● Use marginal cost pricing and average cost pricing to regulate natural monopolies ● Analyze how income inequality has changed over time in the U.S. ● Explore how programs like Social Security and unemployment insurance affect income inequality
Essential Questions: ● What is an externality? ● Why do externalities often require government intervention? How can private individuals remedy externalities? ● What is the difference between a negative and a positive externality? ● Why are some government policies to deal with externalities efficient and others inefficient? ● What are public goods and why do markets fail to supply efficient quantities of public goods? ● Why is it difficult to find the right level of government intervention? ● What are the three major antitrust laws? ● What are the pros and cons of using marginal cost pricing and average cost pricing to regulate prices in natural monopolies? ● What are the causes and consequences of poverty? ● How has income inequality in America changed over time?
Unit Assessment:
● Students will be assessed by their creation of neat, clear, accurately and completely labeled graphs; their logical and clear answers to Free Response Questions (FRQs) from previous AP exams; and their participation in class activities, as well as vocabulary and lesson quizzes.

AP ECONOMICS
53
Unit Fourteen: Market Failure and Government Intervention (cont.)
Core Content Objectives
Instructional Actions
Cumulative Progress Indicators
Concepts What students will know.
Skills What students will be
able to do.
Activities/Strategies Technology Implementation/ Interdisciplinary Connections
Assessment Check Points
6.1.12.C.1 6.1.12.C.2 6.1.12.C.3 6.1.12.C.4 6.1.12.C.5 6.1.12.C.6 6.1.12.C.7
6.1.12.C.8 6.1.12.C.9 6.1.12.C.10 6.1.12.C.11 6.1.12.C.12 6.1.12.C.13 6.1.12.C.14 6.1.12.C.15 6.1.12.C.16 6.2.12.C.1 6.2.12.C.2 6.2.12.C.3 6.2.12.C.4 6.2.12.C.5 6.2.12.C.6
6.3.12.C.1
1. Various causes of market failures.
2. The definition of positive and negative and externalities.
3. How to explain the effects of positive and on the allocation of resources.
4. How to apply the Coase Theorem as a private solution to externalities.
5. The use of the supply and demand model to explain and analyze externalities.
6. What government policy actions exist to address the inefficiency resulting from externalities.
7. How to characterize public and private goods on the basis of excludability and
rivalry. 8. How to describe free
riding and public goods, and illustrate the issue presented when private markets allocate public
goods.
1. Graphically illustrate the optimal amount of a public good.
2. Graph the effects of negative and positive externalities on the market, and label the effect of underallocation or overallocation.
3. Illustrate the effect of a government regulation on either producers or consumers.
4. Graph, label, and interpret the Lorenz
curve.
Possible activities: - Free rider simulation - Tragedy of the
Commons simulation
Neat, clear, accurately and completely labeled graphs.
FRQs from previous AP exams
Vocabulary assessments
Lesson quizzes
Group projects Homework Class participation
AP ECONOMICS
54
Unit Fourteen: Market Failure and Government Intervention (cont.)
Core Content Objectives
Instructional Actions
Cumulative Progress Indicators
Concepts What students will know.
Skills What students will be
able to do.
Activities/Strategies Technology Implementation/ Interdisciplinary Connections
Assessment Check Points
9. What the tragedy of the commons is. 10. The core elements of
antitrust laws in the United States.
11. The economic principles related to the setting of prices by natural monopolies.
12. The definition of poverty and its consequences. 13. How income inequality is measured in the United States. 14. The causes and the impacts of income inequality. 15. The equality and efficiency arguments behind income inequality. 16. How to use the Lorenz curve and Gini
coefficient to measure a country’s level of income
inequality.
AP ECONOMICS
55
Unit Fourteen: Market Failure and Government Intervention (cont.)
Resources: Essential Materials, Supplementary Materials, Links to Best
Practices - Ray, Margaret and David Anderson. Krugman’s Economics for AP 2nd Edition. New
York: Worth Publishers, 2015.
- Advanced Placement Microeconomics: Student Activities, 4th ed., New York:
National
Council for Economic Education.
- Anderson, David. Economics by Example 2nd Edition. New York: Worth, 2015. - Mr. Clifford Videos
- AP Teacher Community Resources
- Practice with AP Economics Test Prep Books
Instructional Adjustments: Modifications, student
difficulties, possible misunderstandings

AP ECONOMICS
56
Unit Fifteen: AP Economics Exam Review
Targeted Standards: Voluntary National Content Standards in Economics, Council for Economic Education: Standards 1, 2, 3, 4, 5, 6, 7, 8, 9, 10, 11, 12, 13, 14, 15, 16, 17, 18, 19, 20
Unit Objectives/Conceptual Understandings: (Students will be able to)
Demonstrate understanding of macro and micro economic concepts that will be tested on the AP exams Essential Questions:
On which content areas must I devote the most studying time?
Unit Assessment: ● Students will be assessed by their creation of neat, clear, accurately and completely labeled graphs; their logical and clear answers to Free Response Questions (FRQs) from previous AP exams; and their participation in class activities, as well as vocabulary and lesson quizzes.
Core Content Objectives
Instructional Actions
Cumulative Progress Indicators
Concepts What students will know.
Skills What students will be
able to do.
Activities/Strategies Technology Implementation/ Interdisciplinary Connections
Assessment Check Points
6.1.12.C.1 6.1.12.C.2 6.1.12.C.3 6.1.12.C.4 6.1.12.C.5 6.1.12.C.6 6.1.12.C.7 6.1.12.C.8 6.1.12.C.9 6.1.12.C.10 6.1.12.C.11 6.1.12.C.12 6.1.12.C.13
The content and concepts tested on the AP Exams. Macro:
- Basic economic concepts
- Measurement of economic performance
- National income and price determination
- Financial sector - Stabilization policies - Economic growth
Demonstrate ability to create neat, clear, accurate and completely labeled graphs. Provide logical and correct answers to FRQs from previous AP exams. Answer multiple choice questions from previous AP exams correctly.
Possible activities: - Kahoots for MC
question warm-up - Timed questioning
Neat, clear, accurately and completely labeled graphs.
Multiple Choice questions and FRQs from previous AP exams Timed exams

AP ECONOMICS
57
Unit Fifteen: AP Economics Exam Review (cont.)
Resources: Essential Materials, Supplementary Materials, Links to Best
Practices - Ray, Margaret and David Anderson. Krugman’s Economics for AP 2nd Edition. New York: Worth Publishers, 2015. - Advanced Placement Microeconomics: Student Activities, 4th ed., New York:
National
Council for Economic Education.
- Anderson, David. Economics by Example 2nd Edition. New York: Worth, 2015. - Mr. Clifford Videos
- AP Teacher Community Resources
- Practice with AP Economics Test Prep Books
Instructional Adjustments: Modifications, student
difficulties, possible misunderstandings
Core Content Objectives
Instructional Actions
Cumulative Progress Indicators
Concepts What students will know.
Skills What students will be
able to do.
Activities/Strategies Technology Implementation/ Interdisciplinary Connections
Assessment Check Points
6.1.12.C.14 6.1.12.C.15 6.1.12.C.16 6.2.12.C.1 6.2.12.C.2 6.2.12.C.3 6.2.12.C.4 6.2.12.C.5 6.2.12.C.6 6.3.12.C.1
- Open economy: international trade and finance
Micro: - The nature and function of product markets
- Factor markets - Market failure and the role of government

AP ECONOMICS
58
Unit Sixteen: Explorations in Economics
Targeted Standards: Voluntary National Content Standards in Economics, Council for Economic Education: Standards 1, 2, 3, 4, 5, 6, 7, 8, 9, 10, 11, 12, 13, 14, 15, 16, 17, 18, 19, 20 Unit Objectives/Conceptual Understandings: (Students will be able to)
Apply knowledge of economic concepts to real world scenarios Essential Questions:
How is economics applied in the real world?
Unit Assessment: ● Students will be assessed by their logical and clear application of economic concepts to current issues in the economy, as demonstrated through class and community activities.
Core Content Objectives
Instructional Actions
Cumulative Progress Indicators
Concepts What students will know.
Skills What students will be
able to do.
Activities/Strategies Technology Implementation/ Interdisciplinary Connections
Assessment Check Points
6.1.12.C.1 6.1.12.C.2 6.1.12.C.3 6.1.12.C.4 6.1.12.C.5 6.1.12.C.6 6.1.12.C.7 6.1.12.C.8 6.1.12.C.9 6.1.12.C.10 6.1.12.C.11 6.1.12.C.12 6.1.12.C.13 6.1.12.C.14 6.1.12.C.15 6.1.12.C.16
Students will apply their knowledge of economic theory in projects for the remainder of class time following the AP exams
Application will vary depending on projects selected
Possible activities: - internship in
community or school
- “teacher for a day” - research paper - research presentation - music video - budget debates
- mock congressional hearing
Application will vary depending on projects selected

AP ECONOMICS
59
Unit Sixteen: Explorations in Economics (cont.)
Resources: Essential Materials, Supplementary Materials, Links to Best
Practices - Ray, Margaret and David Anderson. Krugman’s Economics for AP 2nd Edition. New York: Worth Publishers, 2015. - Advanced Placement Microeconomics: Student Activities, 4th ed., New York:
National
Council for Economic Education.
- Anderson, David. Economics by Example 2nd Edition. New York: Worth, 2015. - Mr. Clifford Videos
- AP Teacher Community Resources - Practice with AP Economics Test Prep Books
Instructional Adjustments: Modifications, student
difficulties, possible misunderstandings
Core Content Objectives
Instructional Actions
Cumulative Progress Indicators
Concepts What students will know.
Skills What students will be
able to do.
Activities/Strategies Technology Implementation/ Interdisciplinary Connections
Assessment Check Points
6.2.12.C.1 6.2.12.C.2 6.2.12.C.3 6.2.12.C.4 6.2.12.C.5 6.2.12.C.6
6.3.12.C.1