ap photo/ben margot motion in one dimension...
TRANSCRIPT

25
AP
Ph
oto
/Be
n M
arg
ot
The current absolute land
speed record holder is the
British designed ThrustSSC,
a twin turbofan-powered car
which achieved 763 miles per
hour (1,228 km/h) for the mile
(1.6 km), breaking the sound
barrier. The car was driven by
Andy Green (UK) on 10/15/1997
in the Black Rock Desert in
Gerlach, Nevada.
Life is motion. Our muscles coordinate motion microscopically to enable us to walk and jog. Our hearts pump tirelessly for decades, moving blood through our bodies. Cell wall mecha-nisms move select atoms and molecules in and out of cells. From the prehistoric chase of antelopes across the savanna to the pursuit of satellites in space, mastery of motion has been critical to our survival and success as a species. The study of motion and of physical concepts such as force and mass is called dynamics. The part of dynamics that describes motion without regard to its causes is called kinematics. In this chapter the focus is on kinematics in one dimension: motion along a straight line. This kind of motion—and, indeed, any motion—involves the concepts of displacement, velocity, and acceleration. Here, we use these concepts to study the motion of objects undergoing constant acceleration. In Chapter 3 we will repeat this discussion for objects moving in two dimensions. The first recorded evidence of the study of mechanics can be traced to the people of ancient Sumeria and Egypt, who were interested primarily in understanding the motions of heavenly bodies. The most systematic and detailed early studies of the heavens were con-ducted by the Greeks from about 300 B.C. to A.D. 300. Ancient scientists and laypeople regarded the Earth as the center of the Universe. This geocentric model was accepted by such notables as Aristotle (384–322 B.C.) and Claudius Ptolemy (about A.D. 140). Largely because of the authority of Aristotle, the geocentric model became the accepted theory of the Universe until the seventeenth century. About 250 B.C., the Greek philosopher Aristarchus worked out the details of a model of the solar system based on a spherical Earth that rotated on its axis and revolved around the Sun. He proposed that the sky appeared to turn westward because the Earth was turning eastward. This model wasn’t given much consideration because it was believed that a turning Earth would generate powerful winds as it moved through the air. We now know that the Earth carries the air and everything else with it as it rotates. The Polish astronomer Nicolaus Copernicus (1473–1543) is credited with initiating the revolution that finally replaced the geocentric model. In his system, called the heliocentric model, Earth and the other planets revolve in circular orbits around the Sun.
2.1 Displacement
2.2 Velocity
2.3 Acceleration
2.4 Motion Diagrams
2.5 One-Dimensional Motion with Constant Acceleration
2.6 Freely Falling Objects
Motion in One Dimension 2
ser62060_02_c02_p025-055.indd 25ser62060_02_c02_p025-055.indd 25 8/17/10 2:19 PM8/17/10 2:19 PM
Copyright 2010 Cengage Learning. All Rights Reserved. May not be copied, scanned, or duplicated, in whole or in part. Due to electronic rights, some third party content may be suppressed from the eBook and/or eChapter(s).Editorial review has deemed that any suppressed content does not materially affect the overall learning experience. Cengage Learning reserves the right to remove additional content at any time if subsequent rights restrictions require it.

26 CHAPTER 2 | Motion in One Dimension
This early knowledge formed the foundation for the work of Galileo Galilei (1564–1642), who stands out as the dominant facilitator of the entrance of physics into the modern era. In 1609 he became one of the first to make astronomical observations with a telescope. He observed mountains on the Moon, the larger satellites of Jupiter, spots on the Sun, and the phases of Venus. Galileo’s observations convinced him of the correctness of the Copernican theory. His quantitative study of motion formed the foundation of Newton’s revolutionary work in the next century.
2.1 DisplacementMotion involves the displacement of an object from one place in space and time
to another. Describing motion requires some convenient coordinate system and a
specified origin. A frame of reference is a choice of coordinate axes that defines
the starting point for measuring any quantity, an essential first step in solving vir-
tually any problem in mechanics (Fig. 2.1). In Active Figure 2.2a, for example, a
car moves along the x -axis. The coordinates of the car at any time describe its posi-
tion in space and, more importantly, its displacement at some given time of interest.
The displacement Dx of an object is defined as its change in position and is
given by
Dx ; xf 2 xi [2.1]
where xi is the coordinate of the initial position of the car and xf is the coor-
dinate of the car’s final position. (The indices i and f stand for initial and
final, respectively.)
SI unit: meter (m)
We will use the Greek letter delta, D, to denote a change in any physical quantity.
From the definition of displacement, we see that Dx (read “delta ex”) is positive if
xf is greater than xi and negative if xf is less than xi. For example, if the car moves
from point � to point � so that the initial position is xi 5 30 m and the final
position is xf 5 52 m, the displacement is Dx 5 xf 2 xi 5 52 m 2 30 m 5 122 m.
However, if the car moves from point � to point �, then the initial position is
xi 5 38 m and the final position is xf 5 253 m, and the displacement is Dx 5
xf 2 xi 5 253 m 2 38 m 5 291 m. A positive answer indicates a displacement in
Definition of displacement c
Tip 2.1 A Displacement Isn’t a Distance!The displacement of an object
is not the same as the distance it
travels. Toss a tennis ball up and
catch it. The ball travels a distance equal to twice the maximum
height reached, but its displace-ment is zero.
a
b
Figure 2.1 (a) How large is the canyon? Without a frame of reference, it’s
hard to tell. (b) The canyon is Valles Marineris on Mars, and with a frame
of reference provided by a superposed outline of the United States, its size
is easily grasped.
NA
SA
/US
GS
NA
SA
/US
GS
ser62060_02_c02_p025-055.indd 26ser62060_02_c02_p025-055.indd 26 8/17/10 2:19 PM8/17/10 2:19 PM
Copyright 2010 Cengage Learning. All Rights Reserved. May not be copied, scanned, or duplicated, in whole or in part. Due to electronic rights, some third party content may be suppressed from the eBook and/or eChapter(s).Editorial review has deemed that any suppressed content does not materially affect the overall learning experience. Cengage Learning reserves the right to remove additional content at any time if subsequent rights restrictions require it.

2.2 | Velocity 27
the positive x-direction, whereas a negative answer indicates a displacement in the
negative x-direction. Active Figure 2.2b displays the graph of the car’s position as
a function of time.
Because displacement has both a magnitude (size) and a direction, it’s a vector
quantity, as are velocity and acceleration. In general, a vector quantity is charac-terized by having both a magnitude and a direction. By contrast, a scalar quantity has magnitude, but no direction. Scalar quantities such as mass and temperature
are completely specified by a numeric value with appropriate units; no direction is
involved.
Vector quantities will be usually denoted in boldface type with an arrow over
the top of the letter. For example, vS represents velocity and aS denotes an accelera-
tion, both vector quantities. In this chapter, however, it won’t be necessary to use
that notation because in one-dimensional motion an object can only move in one
of two directions, and these directions are easily specified by plus and minus signs.
2.2 VelocityIn everyday usage the terms speed and velocity are interchangeable. In physics, how-
ever, there’s a clear distinction between them: Speed is a scalar quantity, having
only magnitude, whereas velocity is a vector, having both magnitude and direction.
Why must velocity be a vector? If you want to get to a town 70 km away in an
hour’s time, it’s not enough to drive at a speed of 70 km/h; you must travel in the
correct direction as well. That’s obvious, but it shows that velocity gives consider-
ably more information than speed, as will be made more precise in the formal
definitions.
The average speed of an object over a given time interval is the length of the
path it travels divided by the total elapsed time:
Average speed ; path length
elapsed time
SI unit: meter per second (m/s)
b Definition of average speed
�60 �50 �40 �30 �20 �10 0 10 20 30 40 50 60x (m)
� �
The car moves to the right between
positions � and �.
�60 �50 �40 �30 �20 �10 0 10 20 30 40 50 60x (m)
� ���
The car moves to the left between
positions � and �.
a
�
10 20 30 40 500
�40
�60
�20
0
20
40
60
�t
�x
x (m)
t (s)
�
�
�
�
�
b
Active Figure 2.2(a) A car moves back and forth along a straight line taken to be the x -axis. Because we are interested
only in the car’s translational motion, we can model it as a particle. (b) Graph of position vs. time for
the motion of the “particle.”
Tip 2.2 Vectors Have Both a Magnitude and a DirectionScalars have size. Vectors, too,
have size, but they also indicate a
direction.
ser62060_02_c02_p025-055.indd 27ser62060_02_c02_p025-055.indd 27 8/17/10 2:19 PM8/17/10 2:19 PM
Copyright 2010 Cengage Learning. All Rights Reserved. May not be copied, scanned, or duplicated, in whole or in part. Due to electronic rights, some third party content may be suppressed from the eBook and/or eChapter(s).Editorial review has deemed that any suppressed content does not materially affect the overall learning experience. Cengage Learning reserves the right to remove additional content at any time if subsequent rights restrictions require it.

28 CHAPTER 2 | Motion in One Dimension
In symbols this equation might be written v 5 d/t, where v represents the aver-
age speed (not average velocity), d represents the path length, and t represents
the elapsed time during the motion. The path length is often called the “total
distance,” but that can be misleading, because distance has a different, precise
mathematical meaning based on differences in the coordinates between the initial
and final points. Distance (neglecting any curvature of the surface) is given by
the Pythagorean theorem, Ds 5 !1xf 2 xi 22 1 1yf 2 yi 22, which depends only on
the endpoints, (xi , yi) and (xf , yf ), and not on what happens in between. The same
equation gives the magnitude of a displacement. The straight-line distance from
Atlanta, Georgia, to St. Petersburg, Florida, for example, is about 500 miles. If
someone drives a car that distance in 10 h, the car’s average speed is 500 mi/10 h 5
50 mi/h, even if the car’s speed varies greatly during the trip. If the driver takes
scenic detours off the direct route along the way, however, or doubles back for a
while, the path length increases while the distance between the two cities remains
the same. A side trip to Jacksonville, Florida, for example, might add 100 miles to
the path length, so the car’s average speed would then be 600 mi/10 h 5 60 mi/h.
The magnitude of the average velocity, however, would remain 50 mi/h.
■ EXAMPLE 2.1 The Tortoise and the Hare
GOAL Apply the concept of average speed.
PROBLEM A turtle and a rabbit engage in a footrace over a distance of 4.00 km. The rabbit runs 0.500 km and then stops
for a 90.0-min nap. Upon awakening, he remembers the race and runs twice as fast. Finishing the course in a total time
of 1.75 h, the rabbit wins the race. (a) Calculate the average speed of the rabbit. (b) What was his average speed before he
stopped for a nap? Assume no detours or doubling back.
STRATEGY Finding the overall average speed in part (a) is just a matter of dividing the path length by the elapsed time.
Part (b) requires two equations and two unknowns, the latter turning out to be the two different average speeds: v1 before
the nap and v2 after the nap. One equation is given in the statement of the problem (v
2 5 2v
1), whereas the other comes
from the fact the rabbit ran for only 15 minutes because he napped for 90 minutes.
SOLUTION
(a) Find the rabbit’s overall average speed.
Apply the equation for average speed: Average speed ; path length
elapsed time5
4.00 km1.75 h
5 2.29 km/h
(b) Find the rabbit’s average speed before his nap.
Sum the running times, and set the sum equal to 0.25 h: t1 1 t
2 5 0.250 h
Substitute t1 5 d
1/v
1 and t
2 5 d
2/v
2: (1)
d1
v11
d2
v25 0.250 h
Substitute v2 5 2v
1 and the values of d
1 and d
2 into Equa-
tion (1):
(2) 0.500 km
v11
3.50 km2v1
5 0.250 h
Solve Equation (2) for v1: v
1 5 9.00 km/h
REMARKS As seen in this example, average speed can be calculated regardless of any variation in speed over the given
time interval.
QUESTION 2.1 Does a doubling of an object’s average speed always double the magnitude of its displacement in a given
amount of time? Explain.
EXERCISE 2.1 Estimate the average speed of the Apollo spacecraft in meters per second, given that the craft took five
days to reach the Moon from Earth. (The Moon is 3.8 3 108 m from Earth.)
ANSWER , 900 m/s
ser62060_02_c02_p025-055.indd 28ser62060_02_c02_p025-055.indd 28 8/17/10 2:19 PM8/17/10 2:19 PM
Copyright 2010 Cengage Learning. All Rights Reserved. May not be copied, scanned, or duplicated, in whole or in part. Due to electronic rights, some third party content may be suppressed from the eBook and/or eChapter(s).Editorial review has deemed that any suppressed content does not materially affect the overall learning experience. Cengage Learning reserves the right to remove additional content at any time if subsequent rights restrictions require it.

Unlike average speed, average velocity is a vector quantity, having both a mag-
nitude and a direction. Consider again the car of Figure 2.2, moving along the
road (the x-axis). Let the car’s position be xi at some time ti and xf at a later time tf .
In the time interval Dt 5 tf 2 ti, the displacement of the car is Dx 5 xf 2 xi.
The average velocity v during a time interval Dt is the displacement Dx
divided by Dt:
v ;DxDt
5xf 2 xi
tf 2 ti [2.2]
SI unit: meter per second (m/s)
Unlike the average speed, which is always positive, the average velocity of an
object in one dimension can be either positive or negative, depending on the sign
of the displacement. (The time interval Dt is always positive.) In Figure 2.2a, for
example, the average velocity of the car is positive in the upper illustration, a posi-
tive sign indicating motion to the right along the x -axis. Similarly, a negative aver-
age velocity for the car in the lower illustration of the figure indicates that it moves
to the left along the x -axis.
As an example, we can use the data in Table 2.1 to find the average velocity in
the time interval from point � to point � (assume two digits are significant):
v 5DxDt
552 m 2 30 m
10 s 2 0 s5 2.2 m/s
Aside from meters per second, other common units for average velocity are feet
per second (ft/s) in the U.S. customary system and centimeters per second (cm/s)
in the cgs system.
To further illustrate the distinction between speed and velocity, suppose we’re
watching a drag race from a stationary blimp. In one run we see a car follow the
straight-line path from � to � shown in Figure 2.3 during the time interval Dt, and in a second run a car follows the curved path during the same interval. From
the definition in Equation 2.2, the two cars had the same average velocity because
they had the same displacement Dx 5 xf 2 xi during the same time interval Dt. The
car taking the curved route, however, traveled a greater path length and had the
higher average speed.
■ Quick Quiz
2.1 Figure 2.4 shows the unusual
path of a confused football player.
After receiving a kickoff at his own
goal, he runs downfield to within
inches of a touchdown, then reverses
direction and races back until he’s
tackled at the exact location where he
first caught the ball. During this run,
which took 25 s, what is (a) the path
length he travels, (b) his displace-
ment, and (c) his average velocity in
the x -direction? (d) What is his aver-
age speed?
Graphical Interpretation of VelocityIf a car moves along the x -axis from � to � to �, and so forth, we can plot the
positions of these points as a function of the time elapsed since the start of the
motion. The result is a position vs. time graph like those of Figure 2.5 (page 30).
In Figure 2.5a, the graph is a straight line because the car is moving at constant
b Definition of average velocity
2.2 | Velocity 29
Table 2.1 Position of the Car at Various Times
Position t (s) x (m)
� 0 30
� 10 52
� 20 38
� 30 0
� 40 237
50 253
�� xxfxi
Figure 2.3 A drag race viewed
from a stationary blimp. One car
follows the rust-colored straight-line
path from � to �, and a second car
follows the blue curved path.
100 yd
1 02 03 04 05 04 03 02 1
0 yd 50 yd
FOO
TB
ALL
FOO
TB
ALLFO
OT
BA
LL
FOO
TB
ALL
00
1 0 2 0 3 0 4 0 5 0 4 0 3 0 2 0 1 0
Figure 2.4 (Quick Quiz 2.1) The path followed
by a confused football player.
ser62060_02_c02_p025-055.indd 29ser62060_02_c02_p025-055.indd 29 8/18/10 8:49 AM8/18/10 8:49 AM
Copyright 2010 Cengage Learning. All Rights Reserved. May not be copied, scanned, or duplicated, in whole or in part. Due to electronic rights, some third party content may be suppressed from the eBook and/or eChapter(s).Editorial review has deemed that any suppressed content does not materially affect the overall learning experience. Cengage Learning reserves the right to remove additional content at any time if subsequent rights restrictions require it.

30 CHAPTER 2 | Motion in One Dimension
velocity. The same displacement Dx occurs in each time interval Dt. In this case,
the average velocity is always the same and is equal to Dx/Dt. Figure 2.5b is a graph
of the data in Table 2.1. Here, the position vs. time graph is not a straight line
because the velocity of the car is changing. Between any two points, however, we
can draw a straight line just as in Figure 2.5a, and the slope of that line is the
average velocity Dx/Dt in that time interval. In general, the average velocity of an object during the time interval Dt is equal to the slope of the straight line joining the initial and final points on a graph of the object’s position versus time. From the data in Table 2.1 and the graph in Figure 2.5b, we see that the car
first moves in the positive x-direction as it travels from � to �, reaches a position
of 52 m at time t 5 10 s, then reverses direction and heads backwards. In the first
10 s of its motion, as the car travels from � to �, its average velocity is 2.2 m/s,
as previously calculated. In the first 40 seconds, as the car goes from � to �, its
displacement is Dx 5 237 m 2 (30 m) 5 267 m. So the average velocity in this
interval, which equals the slope of the blue line in Figure 2.5b from � to �, is v 5
Dx/Dt 5(267 m)/(40 s) 5 21.7 m/s. In general, there will be a different average
velocity between any distinct pair of points.
Instantaneous VelocityAverage velocity doesn’t take into account the details of what happens during an
interval of time. On a car trip, for example, you may speed up or slow down a num-
ber of times in response to the traffic and the condition of the road, and on rare
occasions even pull over to chat with a police officer about your speed. What is
most important to the police (and to your own safety) is the speed of your car and
the direction it was going at a particular instant in time, which together determine
the car’s instantaneous velocity. So in driving a car between two points, the average velocity must be computed
over an interval of time, but the magnitude of instantaneous velocity can be read
on the car’s speedometer.
The instantaneous velocity v is the limit of the average velocity as the time
interval Dt becomes infinitesimally small:
v ; limDt S0
DxDt
[2.3]
SI unit: meter per second (m/s)
Definition of instantaneous c velocity
Tip 2.3 Slopes of GraphsThe word slope is often used in
reference to the graphs of physi-
cal data. Regardless of the type of
data, the slope is given by
Slope 5change in vertical axis
change in horizontal axis
Slope carries units.
Tip 2.4 Average Velocity vs. Average SpeedAverage velocity is not the same
as average speed. If you run from
x 5 0 m to x 5 25 m and back
to your starting point in a time
interval of 5 s, the average velocity
is zero, whereas the average speed
is 10 m/s.
50403020100
60
20
0
–20�
�40
�
x (m)
t (s)–60
–40
a
x (m)
t (s)50403020100
60
20
0
�20
�40
�60
�
�
�
40
�
�
�
The average velocity between any two points equals the slope of the blue line connecting the points.
b
Active Figure 2.5
(a) Position vs. time graph
for the motion of a car
moving along the x -axis at
constant velocity. (b) Posi-
tion vs. time graph for
the motion of a car with
changing velocity, using
the data in Table 2.1.
ser62060_02_c02_p025-055.indd 30ser62060_02_c02_p025-055.indd 30 8/17/10 2:19 PM8/17/10 2:19 PM
Copyright 2010 Cengage Learning. All Rights Reserved. May not be copied, scanned, or duplicated, in whole or in part. Due to electronic rights, some third party content may be suppressed from the eBook and/or eChapter(s).Editorial review has deemed that any suppressed content does not materially affect the overall learning experience. Cengage Learning reserves the right to remove additional content at any time if subsequent rights restrictions require it.

2.2 | Velocity 31
The notation limDt S0
means that the ratio Dx/Dt is repeatedly evaluated for smaller
and smaller time intervals Dt. As Dt gets extremely close to zero, the ratio Dx/Dt gets closer and closer to a fixed number, which is defined as the instantaneous
velocity.
To better understand the formal definition, consider data obtained on our vehi-
cle via radar (Table 2.2). At t 5 1.00 s, the car is at x 5 5.00 m, and at t 5 3.00 s, it’s
at x 5 52.5 m. The average velocity computed for this interval Dx/Dt 5 (52.5 m 2
5.00 m)/(3.00 s 2 1.00 s) 5 23.8 m/s. This result could be used as an estimate for
the velocity at t 5 1.00 s, but it wouldn’t be very accurate because the speed changes
considerably in the 2-second time interval. Using the rest of the data, we can con-
struct Table 2.3. As the time interval gets smaller, the average velocity more closely
approaches the instantaneous velocity. Using the final interval of only 0.010 0 s,
we find that the average velocity is v 5 Dx/Dt 5 0.470 m/0.010 0 s 5 47.0 m/s. Because 0.010 0 s is a very short time interval, the actual instantaneous velocity is
probably very close to this latter average velocity, given the limits on the car’s abil-
ity to accelerate. Finally using the conversion factor on the front endsheets of the
book, we see that this is 105 mi/h, a likely violation of the speed limit.
As can be seen in Figure 2.6, the chords formed by the blue lines gradually
approach a tangent line as the time interval becomes smaller. The slope of the line tangent to the position vs. time curve at “a given time” is defined to be the instantaneous velocity at that time. The instantaneous speed of an object, which is a scalar quantity, is defined as the magnitude of the instantaneous velocity. Like average speed, instanta-
neous speed (which we will usually call, simply, “speed”) has no direction associ-
ated with it and hence carries no algebraic sign. For example, if one object has an
b Definition of instantaneous speed
Table 2.2 Positions of a Car at Specific Instants of Time
t (s) x (m)
1.00 5.00
1.01 5.47
1.10 9.67
1.20 14.3
1.50 26.3
2.00 34.7
3.00 52.5
Table 2.3 Calculated Values of the Time Intervals, Displacements, and Average Velocities of the Car of Table 2.2
Time Interval (s) Dt (s) Dx (m) v 1m/s 2 1.00 to 3.00 2.00 47.5 23.8
1.00 to 2.00 1.00 29.7 29.7
1.00 to 1.50 0.50 21.3 42.6
1.00 to 1.20 0.20 9.30 46.5
1.00 to 1.10 0.10 4.67 46.7
1.00 to 1.01 0.01 0.470 47.0
x (m)
t (s)2.502.001.501.00
10.0
20.0
30.0
40.0
50.0
3.00
The slopes of the blue lines are average velocities which approach the slope of the green tangent line, an instantaneous velocity.
Figure 2.6 Graph representing the
motion of the car from the data in
Table 2.2.
ser62060_02_c02_p025-055.indd 31ser62060_02_c02_p025-055.indd 31 8/17/10 2:19 PM8/17/10 2:19 PM
Copyright 2010 Cengage Learning. All Rights Reserved. May not be copied, scanned, or duplicated, in whole or in part. Due to electronic rights, some third party content may be suppressed from the eBook and/or eChapter(s).Editorial review has deemed that any suppressed content does not materially affect the overall learning experience. Cengage Learning reserves the right to remove additional content at any time if subsequent rights restrictions require it.
32 CHAPTER 2 | Motion in One Dimension
instantaneous velocity of 115 m/s along a given line and another object has an
instantaneous velocity of 215 m/s along the same line, both have an instantaneous
speed of 15 m/s.
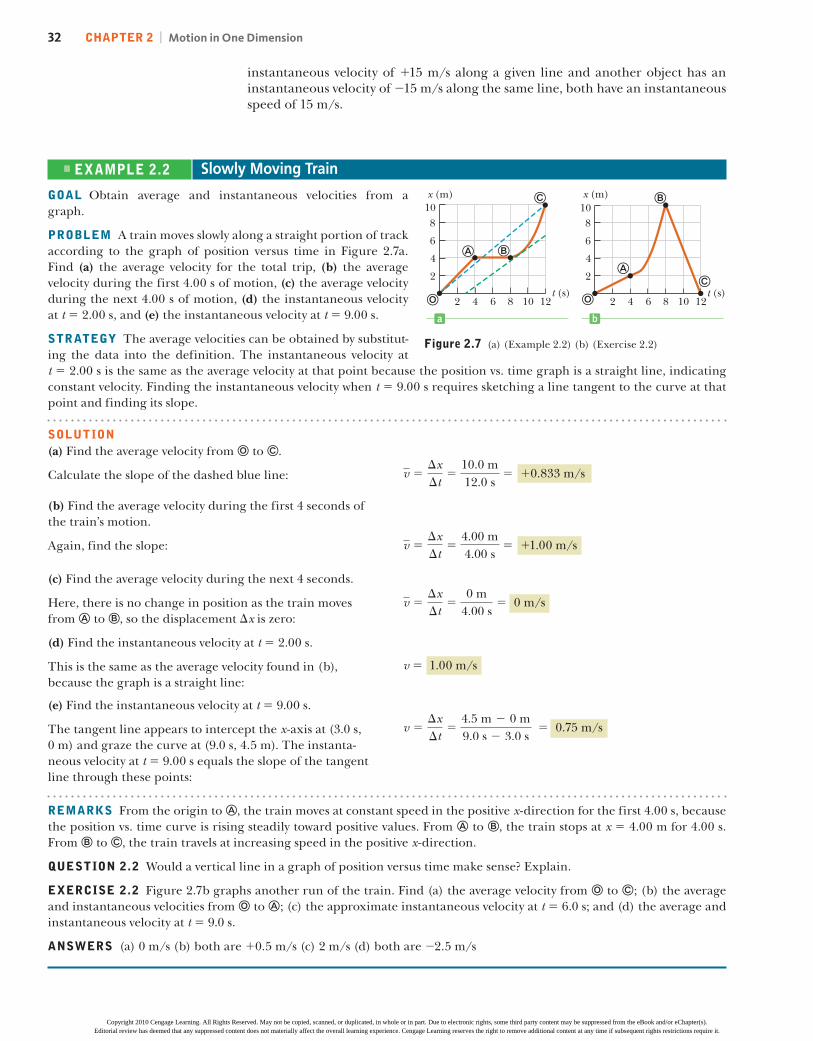
■ EXAMPLE 2.2 Slowly Moving Train
GOAL Obtain average and instantaneous velocities from a
graph.
PROBLEM A train moves slowly along a straight portion of track
according to the graph of position versus time in Figure 2.7a.
Find (a) the average velocity for the total trip, (b) the average
velocity during the first 4.00 s of motion, (c) the average velocity
during the next 4.00 s of motion, (d) the instantaneous velocity
at t 5 2.00 s, and (e) the instantaneous velocity at t 5 9.00 s.
STRATEGY The average velocities can be obtained by substitut-
ing the data into the definition. The instantaneous velocity at
t 5 2.00 s is the same as the average velocity at that point because the position vs. time graph is a straight line, indicating
constant velocity. Finding the instantaneous velocity when t 5 9.00 s requires sketching a line tangent to the curve at that
point and finding its slope.
SOLUTION
128642
10
6
4
2
10
8
x (m)
t (s)
�
�
�
�
�
128642
10
6
4
2
10
8
x (m)
t (s)
�
a b
Figure 2.7 (a) (Example 2.2) (b) (Exercise 2.2)
(a) Find the average velocity from to �.
Calculate the slope of the dashed blue line: v 5DxDt
510.0 m12.0 s
5 10.833 m/s
(b) Find the average velocity during the first 4 seconds of
the train’s motion.
Again, find the slope: v 5DxDt
54.00 m4.00 s
5 11.00 m/s
(c) Find the average velocity during the next 4 seconds.
Here, there is no change in position as the train moves
from � to �, so the displacement Dx is zero:
v 5DxDt
50 m
4.00 s5 0 m/s
(d) Find the instantaneous velocity at t 5 2.00 s.
This is the same as the average velocity found in (b),
because the graph is a straight line:
v 5 1.00 m/s
(e) Find the instantaneous velocity at t 5 9.00 s.
The tangent line appears to intercept the x -axis at (3.0 s,
0 m) and graze the curve at (9.0 s, 4.5 m). The instanta-
neous velocity at t 5 9.00 s equals the slope of the tangent
line through these points:
v 5DxDt
54.5 m 2 0 m9.0 s 2 3.0 s
5 0.75 m/s
REMARKS From the origin to �, the train moves at constant speed in the positive x -direction for the first 4.00 s, because
the position vs. time curve is rising steadily toward positive values. From � to �, the train stops at x 5 4.00 m for 4.00 s.
From � to �, the train travels at increasing speed in the positive x -direction.
QUESTION 2.2 Would a vertical line in a graph of position versus time make sense? Explain.
EXERCISE 2.2 Figure 2.7b graphs another run of the train. Find (a) the average velocity from to �; (b) the average
and instantaneous velocities from to �; (c) the approximate instantaneous velocity at t 5 6.0 s; and (d) the average and
instantaneous velocity at t 5 9.0 s.
ANSWERS (a) 0 m/s (b) both are 10.5 m/s (c) 2 m/s (d) both are 22.5 m/s
ser62060_02_c02_p025-055.indd 32ser62060_02_c02_p025-055.indd 32 8/18/10 8:49 AM8/18/10 8:49 AM
Copyright 2010 Cengage Learning. All Rights Reserved. May not be copied, scanned, or duplicated, in whole or in part. Due to electronic rights, some third party content may be suppressed from the eBook and/or eChapter(s).Editorial review has deemed that any suppressed content does not materially affect the overall learning experience. Cengage Learning reserves the right to remove additional content at any time if subsequent rights restrictions require it.

2.3 | Acceleration 33
2.3 AccelerationGoing from place to place in your car, you rarely travel long distances at con-
stant velocity. The velocity of the car increases when you step harder on the gas
pedal and decreases when you apply the brakes. The velocity also changes when
you round a curve, altering your direction of motion. The changing of an object’s
velocity with time is called acceleration.
Average AccelerationA car moves along a straight highway as in Figure 2.8. At time ti it has a velocity of
vi, and at time tf its velocity is vf , with Dv 5 vf 2 vi and Dt 5 tf 2 ti.
The average acceleration a during the time interval Dt is the change in veloc-
ity Dv divided by Dt:
a ;DvDt
5vf 2 vi
tf 2 ti [2.4]
SI unit: meter per second per second (m/s2)
For example, suppose the car shown in Figure 2.8 accelerates from an initial
velocity of vi 5 110 m/s to a final velocity of vf 5 120 m/s in a time interval of 2 s.
(Both velocities are toward the right, selected as the positive direction.) These val-
ues can be inserted into Equation 2.4 to find the average acceleration:
a 5DvDt
520 m/s 2 10 m/s
2 s5 15 m/s2
Acceleration is a vector quantity having dimensions of length divided by the
time squared. Common units of acceleration are meters per second per second
((m/s)/s, which is usually written m/s2) and feet per second per second (ft/s2). An
average acceleration of 15 m/s2 means that, on average, the car increases its veloc-
ity by 5 m/s every second in the positive x-direction.
For the case of motion in a straight line, the direction of the velocity of an object
and the direction of its acceleration are related as follows: When the object’s veloc-ity and acceleration are in the same direction, the speed of the object increases with time. When the object’s velocity and acceleration are in opposite directions, the speed of the object decreases with time. To clarify this point, suppose the velocity of a car changes from 210 m/s to
220 m/s in a time interval of 2 s. The minus signs indicate that the velocities of the
car are in the negative x -direction; they do not mean that the car is slowing down!
The average acceleration of the car in this time interval is
a 5DvDt
5220 m/s 2 1210 m/s 2
2 s5 25 m/s2
The minus sign indicates that the acceleration vector is also in the negative
x-direction. Because the velocity and acceleration vectors are in the same direc-
tion, the speed of the car must increase as the car moves to the left. Positive and
negative accelerations specify directions relative to chosen axes, not “speeding up”
or “slowing down.” The terms speeding up or slowing down refer to an increase and a
decrease in speed, respectively.
■ Quick Quiz
2.2 True or False? (a) A car must always have an acceleration in the same direction
as its velocity. (b) It’s possible for a slowing car to have a positive acceleration. (c) An
object with constant nonzero acceleration can never stop and remain at rest.
b Definition of average acceleration
t fv fv i
ti
Figure 2.8 A car moving to the
right accelerates from a velocity of vi
to a velocity of vf in the time interval
Dt 5 tf 2 ti.
Tip 2.5 Negative AccelerationNegative acceleration doesn’t nec-
essarily mean an object is slowing
down. If the acceleration is nega-
tive and the velocity is also nega-
tive, the object is speeding up!
Tip 2.6 DecelerationThe word deceleration means a
reduction in speed, a slowing
down. Some confuse it with a
negative acceleration, which
can speed something up. (See
Tip 2.5.)
ser62060_02_c02_p025-055.indd 33ser62060_02_c02_p025-055.indd 33 8/17/10 2:19 PM8/17/10 2:19 PM
Copyright 2010 Cengage Learning. All Rights Reserved. May not be copied, scanned, or duplicated, in whole or in part. Due to electronic rights, some third party content may be suppressed from the eBook and/or eChapter(s).Editorial review has deemed that any suppressed content does not materially affect the overall learning experience. Cengage Learning reserves the right to remove additional content at any time if subsequent rights restrictions require it.

34 CHAPTER 2 | Motion in One Dimension
An object with nonzero acceleration can have a velocity of zero, but only instan-
taneously. When a ball is tossed straight up, its velocity is zero when it reaches its
maximum height. Gravity still accelerates the ball at that point, however; other-
wise, it wouldn’t fall down.
Instantaneous AccelerationThe value of the average acceleration often differs in different time intervals, so
it’s useful to define the instantaneous acceleration, which is analogous to the
instantaneous velocity discussed in Section 2.2.
The instantaneous acceleration a is the limit of the average acceleration as
the time interval Dt goes to zero:
a ; limDt S0
DvDt [2.5]
SI unit: meter per second per second (m/s2)
Here again, the notation limDt S0
means that the ratio Dv/Dt is evaluated for smaller
and smaller values of Dt. The closer Dt gets to zero, the closer the ratio gets to a
fixed number, which is the instantaneous acceleration.
Figure 2.9, a velocity vs. time graph, plots the velocity of an object against time.
The graph could represent, for example, the motion of a car along a busy street.
The average acceleration of the car between times ti and tf can be found by deter-
mining the slope of the line joining points � and . If we imagine that point is
brought closer and closer to point �, the line comes closer and closer to becoming
tangent at �. The instantaneous acceleration of an object at a given time equals the slope of the tangent to the velocity vs. time graph at that time. From now on,
we will use the term acceleration to mean “instantaneous acceleration.”
In the special case where the velocity vs. time graph of an object’s motion is a
straight line, the instantaneous acceleration of the object at any point is equal to its
average acceleration. That also means that the tangent line to the graph overlaps
the graph itself. In that case, the object’s acceleration is said to be uniform, which
means that it has a constant value. Constant acceleration problems are important
in kinematics and will be studied extensively in this and the next chapter.
■ Quick Quiz
2.3 Parts (a), (b), and (c) of Figure 2.10 represent three graphs of the velocities of
different objects moving in straight-line paths as functions of time. The possible
accelerations of each object as functions of time are shown in parts (d), (e), and (f).
Match each velocity vs. time graph with the acceleration vs. time graph that best
describes the motion.
Definition of instantaneous c
acceleration
b
a
�
�
t ft i
v
vf
vi
�t
�v
t
ti tfx
v � vi v �vf
The car moves with different velocities at
points � and .
The slope of the green line is the instantaneous acceleration
of the car at point (Eq. 2.5).
The slope of the blue
line connecting � and
is the average acceleration of the car during the time interval �t � tf � ti (Eq. 2.4).
Figure 2.9 (a) A car, modeled as
a particle, moving along the x -axis
from � to , has velocity vxi at t 5 ti
and velocity vxf at t 5 tf . (b) Velocity
vs. time graph for an object moving
in a straight line.
t
v
t
a
t
v
t
a
t
v
t
a
a b c
d e f
Active Figure 2.10 (Quick Quiz
2.3) Match each velocity vs. time
graph to its corresponding accelera-
tion vs. time graph.
ser62060_02_c02_p025-055.indd 34ser62060_02_c02_p025-055.indd 34 8/17/10 2:19 PM8/17/10 2:19 PM
Copyright 2010 Cengage Learning. All Rights Reserved. May not be copied, scanned, or duplicated, in whole or in part. Due to electronic rights, some third party content may be suppressed from the eBook and/or eChapter(s).Editorial review has deemed that any suppressed content does not materially affect the overall learning experience. Cengage Learning reserves the right to remove additional content at any time if subsequent rights restrictions require it.

2.4 | Motion Diagrams 35
■ EXAMPLE 2.3 Catching a Fly Ball
GOAL Apply the definition of instantaneous acceleration.
PROBLEM A baseball player moves in a straight-line path in
order to catch a fly ball hit to the outfield. His velocity as a
function of time is shown in Figure 2.11a. Find his instanta-
neous acceleration at points �, �, and �.
STRATEGY At each point, the velocity vs. time graph is a
straight line segment, so the instantaneous acceleration will
be the slope of that segment. Select two points on each seg-
ment and use them to calculate the slope.
SOLUTION
O 1 2 3 4
1
2
3
4
v (m/s)
t (s)
�
�
O 1 2 3 4
1
2
3
4
v (m/s)
t (s)
� �
��
a b
Figure 2.11 (a) (Example 2.3) (b) (Exercise 2.3)
Acceleration at �.
The acceleration at � equals the slope of the line con-
necting the points (0 s, 0 m/s) and (2.0 s, 4.0 m/s):
a 5DvDt
54.0 m/s 2 0
2.0 s 2 05 12.0 m/s2
Acceleration at �.
Dv 5 0, because the segment is horizontal: a 5DvDt
54.0 m/s 2 4.0 m/s
3.0 s 2 2.0 s5 0 m/s2
Acceleration at �.
The acceleration at � equals the slope of the line con-
necting the points (3.0 s, 4.0 m/s) and (4.0 s, 2.0 m/s):
a 5DvDt
52.0 m/s 2 4.0 m/s
4.0 s 2 3.0 s5 22.0 m/s2
REMARKS Assume the player is initially moving in the positive x -direction. For the first 2.0 s, the ballplayer moves in the
positive x -direction (the velocity is positive) and steadily accelerates (the curve is steadily rising) to a maximum speed of
4.0 m/s. He moves for 1.0 s at a steady speed of 4.0 m/s and then slows down in the last second (the v vs. t curve is falling),
still moving in the positive x -direction (v is always positive).
QUESTION 2.3 Can the tangent line to a velocity vs. time graph ever be vertical? Explain.
EXERCISE 2.3 Repeat the problem, using Figure 2.11b.
ANSWER The accelerations at �, �, and � are 23.0 m/s2, 1.0 m/s2, and 0 m/s2, respectively.
2.4 Motion DiagramsVelocity and acceleration are sometimes confused with each other, but they’re
very different concepts, as can be illustrated with the help of motion diagrams. A
motion diagram is a representation of a moving object at successive time intervals,
with velocity and acceleration vectors sketched at each position, red for velocity vec-
tors and violet for acceleration vectors, as in Active Figure 2.12 (page 36). The time
intervals between adjacent positions in the motion diagram are assumed equal.
A motion diagram is analogous to images resulting from a stroboscopic photo-
graph of a moving object. Each image is made as the strobe light flashes. Active
Figure 2.12 represents three sets of strobe photographs of cars moving along a
straight roadway from left to right. The time intervals between flashes of the stro-
boscope are equal in each diagram.
In Active Figure 2.12a, the images of the car are equally spaced: The car moves
the same distance in each time interval. This means that the car moves with con-stant positive velocity and has zero acceleration. The red arrows are all the same length
(constant velocity) and there are no violet arrows (zero acceleration).
In Active Figure 2.12b, the images of the car become farther apart as time pro-
gresses and the velocity vector increases with time, because the car’s displacement
ser62060_02_c02_p025-055.indd 35ser62060_02_c02_p025-055.indd 35 8/18/10 8:49 AM8/18/10 8:49 AM
Copyright 2010 Cengage Learning. All Rights Reserved. May not be copied, scanned, or duplicated, in whole or in part. Due to electronic rights, some third party content may be suppressed from the eBook and/or eChapter(s).Editorial review has deemed that any suppressed content does not materially affect the overall learning experience. Cengage Learning reserves the right to remove additional content at any time if subsequent rights restrictions require it.

36 CHAPTER 2 | Motion in One Dimension
between adjacent positions increases as time progresses. The car is moving with a
positive velocity and a constant positive acceleration. The red arrows are successively
longer in each image, and the violet arrows point to the right.
In Active Figure 2.12c, the car slows as it moves to the right because its dis-
placement between adjacent positions decreases with time. In this case, the car
moves initially to the right with a constant negative acceleration. The velocity vec-
tor decreases in time (the red arrows get shorter) and eventually reaches zero, as
would happen when the brakes are applied. Note that the acceleration and velocity
vectors are not in the same direction. The car is moving with a positive velocity, but
with a negative acceleration. Try constructing your own diagrams for various problems involving kinematics.
■ Quick Quiz
2.4 The three graphs in Figure 2.13 represent the position vs. time for objects mov-
ing along the x-axis. Which, if any, of these graphs is not physically possible?
2.5 Figure 2.14a is a diagram of a multiflash image of an air puck moving to the
right on a horizontal surface. The images sketched are separated by equal time inter-
vals, and the first and last images show the puck at rest. (a) In Figure 2.14b, which
color graph best shows the puck’s position as a function of time? (b) In Figure 2.14c,
which color graph best shows the puck’s velocity as a function of time? (c) In Figure
2.14d, which color graph best shows the puck’s acceleration as a function of time?
Active Figure 2.12Motion diagrams of a car moving
along a straight roadway in a single
direction. The velocity at each
instant is indicated by a red arrow,
and the constant acceleration is indi-
cated by a purple arrow.
a
b
c
v
v
v
a
a
This car moves at constant velocity (zero acceleration).
This car has a constant acceleration in the direction of its velocity.
This car has a constant acceleration in the direction opposite its velocity.
x
t
x
t
x
ta b c
Figure 2.13(Quick Quiz 2.4) Which position vs. time curve is impossible?
2.5 One-Dimensional Motion with Constant Acceleration
Many applications of mechanics involve objects moving with constant acceleration. This type of motion is important because it applies to numerous objects in nature,
such as an object in free fall near Earth’s surface (assuming air resistance can be
neglected). A graph of acceleration versus time for motion with constant accelera-
tO
+
x
+
tO
v
–
+
tO
a
–
a
b
c
d
Figure 2.14 (Quick Quiz 2.5)
Choose the correct graphs.
ser62060_02_c02_p025-055.indd 36ser62060_02_c02_p025-055.indd 36 8/17/10 2:19 PM8/17/10 2:19 PM
Copyright 2010 Cengage Learning. All Rights Reserved. May not be copied, scanned, or duplicated, in whole or in part. Due to electronic rights, some third party content may be suppressed from the eBook and/or eChapter(s).Editorial review has deemed that any suppressed content does not materially affect the overall learning experience. Cengage Learning reserves the right to remove additional content at any time if subsequent rights restrictions require it.

2.5 | One-Dimensional Motion with Constant Acceleration 37
tion is shown in Active Figure 2.15a. When an object moves with constant accel-eration, the instantaneous acceleration at any point in a time interval is equal to the value of the average acceleration over the entire time interval. Consequently,
the velocity increases or decreases at the same rate throughout the motion, and a
plot of v versus t gives a straight line with either positive, zero, or negative slope.
Because the average acceleration equals the instantaneous acceleration when a
is constant, we can eliminate the bar used to denote average values from our defin-
ing equation for acceleration, writing a 5 a, so that Equation 2.4 becomes
a 5vf 2 vi
tf 2 ti
The observer timing the motion is always at liberty to choose the initial time, so
for convenience, let ti 5 0 and tf be any arbitrary time t. Also, let vi 5 v0 (the initial
velocity at t 5 0) and vf 5 v (the velocity at any arbitrary time t). With this notation,
we can express the acceleration as
a 5 v 2 v0
tor
v 5 v0 1 at (for constant a) [2.6]
Equation 2.6 states that the acceleration a steadily changes the initial velocity v0 by
an amount at. For example, if a car starts with a velocity of 12.0 m/s to the right
and accelerates to the right with a 5 16.0 m/s2, it will have a velocity of 114 m/s
after 2.0 s have elapsed:
v 5 v0 1 at 5 1 2.0 m/s 1 (6.0 m/s2)(2.0 s) 5 114 m/s
The graphical interpretation of v is shown in Active Figure 2.15b. The veloc-
ity varies linearly with time according to Equation 2.6, as it should for constant
acceleration.
Because the velocity is increasing or decreasing uniformly with time, we can
express the average velocity in any time interval as the arithmetic average of the
initial velocity v0 and the final velocity v:
v 5v0 1 v
2 (for constant a) [2.7]
Remember that this expression is valid only when the acceleration is constant, in
which case the velocity increases uniformly.
We can now use this result along with the defining equation for average veloc-
ity, Equation 2.2, to obtain an expression for the displacement of an object as a
function of time. Again, we choose ti 5 0 and tf 5 t, and for convenience, we write
Dx 5 xf 2 xi 5 x 2 x0. This results in
Dx 5 vt 5 av0 1 v2
bt
Dx 512 1v0 1 v 2 t (for constant a) [2.8]
We can obtain another useful expression for displacement by substituting the
equation for v (Eq. 2.6) into Equation 2.8:
Dx 512 1v0 1 v0 1 at 2 t
Dx 5 v0t 112at2 (for constant a) [2.9]
This equation can also be written in terms of the position x, since Dx 5 x 2 x0.
Active Figure 2.15c shows a plot of x versus t for Equation 2.9, which is related to
the graph of velocity vs. time: The area under the curve in Active Figure 2.15b is
equal to v0t 112at2, which is equal to the displacement Dx. In fact, the area under
the graph of v versus t for any object is equal to the displacement Dx of the object.
v
v
t
v0
v0
at
t
Slope � a
x
t
x0
Slope � v0
t
Slope � v
t
a
t
Slope � 0
a
a
b
c
Active Figure 2.15A particle moving along the x -axis
with constant acceleration a.(a) the acceleration vs. time graph,
(b) the velocity vs. time graph, and
(c) the position vs. time graph.
ser62060_02_c02_p025-055.indd 37ser62060_02_c02_p025-055.indd 37 8/17/10 2:19 PM8/17/10 2:19 PM
Copyright 2010 Cengage Learning. All Rights Reserved. May not be copied, scanned, or duplicated, in whole or in part. Due to electronic rights, some third party content may be suppressed from the eBook and/or eChapter(s).Editorial review has deemed that any suppressed content does not materially affect the overall learning experience. Cengage Learning reserves the right to remove additional content at any time if subsequent rights restrictions require it.

38 CHAPTER 2 | Motion in One Dimension
Finally, we can obtain an expression that doesn’t contain time by solving Equa-
tion 2.6 for t and substituting into Equation 2.8, resulting in
Dx 512 1v 1 v0 2 av 2 v0
a b 5v2 2 v0
2
2a
v2 5 v0
2 1 2aDx (for constant a) [2.10]
Equations 2.6 and 2.9 together can solve any problem in one-dimensional motion
with constant acceleration, but Equations 2.7, 2.8, and, especially, 2.10 are some-
times convenient. The three most useful equations—Equations 2.6, 2.9, and
2.10—are listed in Table 2.4.
The best way to gain confidence in the use of these equations is to work a num-
ber of problems. There is usually more than one way to solve a given problem,
depending on which equations are selected and what quantities are given. The dif-
ference lies mainly in the algebra.
■ PROBLEM-SOLVING STRATEGY
Motion in One Dimension at Constant AccelerationThe following procedure is recommended for solving problems involving accelerated motion.
1. Read the problem.
2. Draw a diagram, choosing a coordinate system, labeling initial and final
points, and indicating directions of velocities and accelerations with arrows.
3. Label all quantities, circling the unknowns. Convert units as needed.
4. Equations from Table 2.4 should be selected next. All kinematics problems in
this chapter can be solved with the first two equations, and the third is often
convenient.
5. Solve for the unknowns. Doing so often involves solving two equations for two
unknowns.
6. Check your answer, using common sense and estimates.
Most of these problems reduce to writing the kinematic equations from Table 2.4
and then substituting the correct values into the constants a, v0, and x
0 from the
given information. Doing this produces two equations—one linear and one qua-
dratic—for two unknown quantities.
Table 2.4 Equations for Motion in a Straight Line Under Constant Acceleration
Equation Information Given by Equation
v 5 v0 1 at Velocity as a function of time
Dx 5 v0t 112at2 Displacement as a function of time
v2 5 v0
2 1 2a Dx Velocity as a function of displacement
Note: Motion is along the x -axis. At t 5 0, the velocity of the particle is v0.
Tip 2.7 Pigs Don’t FlyAfter solving a problem, you
should think about your answer
and decide whether it seems rea-
sonable. If it isn’t, look for your
mistake!
■ EXAMPLE 2.4 The Daytona 500
GOAL Apply the basic kinematic equations.
PROBLEM (a) A race car starting from rest accelerates at a constant rate of 5.00 m/s2.
What is the velocity of the car after it has traveled 1.00 3 102 ft? (b) How much time has
elapsed? (c) Calculate the average velocity two different ways.
STRATEGY (a) We’ve read the problem, drawn the diagram in Figure 2.16, and cho-
sen a coordinate system (steps 1 and 2). We’d like to find the velocity v after a certain
known displacement Dx. The acceleration a is also known, as is the initial velocity v0
(step 3, labeling, is complete), so the third equation in Table 2.4 looks most useful for solving part (a). Given the velocity,
v = ?
x = 0
v0 = 0
x = 30.5 m+ x
Figure 2.16 (Example 2.4)
ser62060_02_c02_p025-055.indd 38ser62060_02_c02_p025-055.indd 38 8/17/10 2:19 PM8/17/10 2:19 PM
Copyright 2010 Cengage Learning. All Rights Reserved. May not be copied, scanned, or duplicated, in whole or in part. Due to electronic rights, some third party content may be suppressed from the eBook and/or eChapter(s).Editorial review has deemed that any suppressed content does not materially affect the overall learning experience. Cengage Learning reserves the right to remove additional content at any time if subsequent rights restrictions require it.
2.5 | One-Dimensional Motion with Constant Acceleration 39
the first equation in Table 2.4 can then be used to find the time in part (b). Part (c) requires substitution into Equations
2.2 and 2.7, respectively.
SOLUTION
(a) Convert units of Dx to SI, using the information in the
inside front cover.
1.00 3 102 ft 5 11.00 3 102 ft 2 a 1 m3.28 ft
b 5 30.5 m
Write the kinematics equation for v2 (step 4): v2 5 v0
2 1 2a Dx
Solve for v, taking the positive square root because the
car moves to the right (step 5):
v 5 "v02 1 2a Dx
Substitute v0 5 0, a 5 5.00 m/s2, and Dx 5 30.5 m: v 5 "v0
2 1 2a Dx 5 "10 22 1 2 15.00 m/s2 2 130.5 m 2 5 17.5 m/s
(b) How much time has elapsed?
Apply the first equation of Table 2.4: v 5 at 1 v0
Substitute values and solve for time t: 17.5 m/s 5 (5.00 m/s2)t
t 517.5 m/s5.00 m/s2 5 3.50 s
(c) Calculate the average velocity in two different ways.
Apply the definition of average velocity, Equation 2.2: v 5xf 2 xi
tf 2 ti5
30.5 m3.50 s
5 8.71 m/s
Apply the definition of average velocity in Equation 2.7: v 5v0 1 v
25
0 1 17.5 m/s2
5 8.75 m/s
REMARKS The answers are easy to check. An alternate technique is to use Dx 5 v0t 112at2 to find t and then use the
equation v 5 v0 1 at to find v. Notice that the two different equations for calculating the average velocity, due to rounding,
give slightly different answers.
QUESTION 2.4 What is the final speed if the displacement is increased by a factor of 4?
EXERCISE 2.4 Suppose the driver in this example now slams on the brakes, stopping the car in 4.00 s. Find (a) the accel-
eration, (b) the distance the car travels while braking, assuming the acceleration is constant, and (c) the average velocity.
ANSWERS (a) 24.38 m/s2 (b) 35.0 m (c) 8.75 m/s
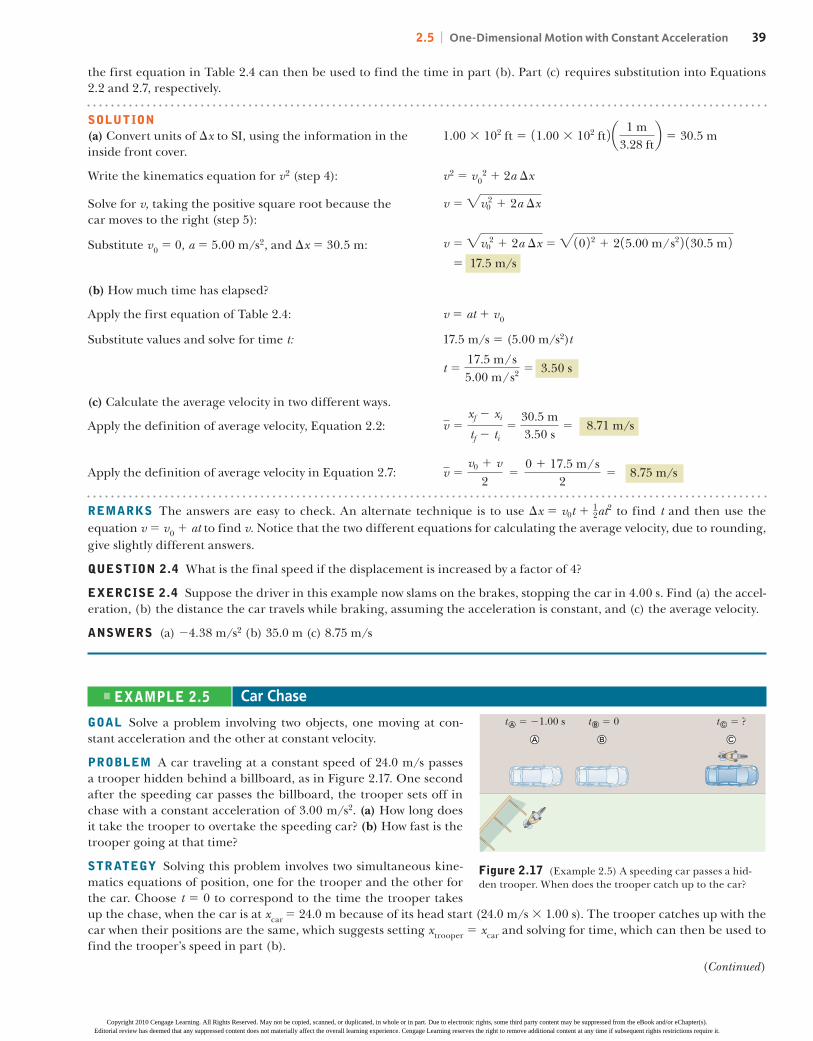
■ EXAMPLE 2.5 Car Chase
GOAL Solve a problem involving two objects, one moving at con-
stant acceleration and the other at constant velocity.
PROBLEM A car traveling at a constant speed of 24.0 m/s passes
a trooper hidden behind a billboard, as in Figure 2.17. One second
after the speeding car passes the billboard, the trooper sets off in
chase with a constant acceleration of 3.00 m/s2. (a) How long does
it take the trooper to overtake the speeding car? (b) How fast is the
trooper going at that time?
STRATEGY Solving this problem involves two simultaneous kine-
matics equations of position, one for the trooper and the other for
the car. Choose t 5 0 to correspond to the time the trooper takes
up the chase, when the car is at xcar
5 24.0 m because of its head start (24.0 m/s 3 1.00 s). The trooper catches up with the
car when their positions are the same, which suggests setting xtrooper
5 xcar
and solving for time, which can then be used to
find the trooper’s speed in part (b).
t� � ?t� � 0t� � �1.00 s
� � �
Figure 2.17 (Example 2.5) A speeding car passes a hid-
den trooper. When does the trooper catch up to the car?
(Continued)
ser62060_02_c02_p025-055.indd 39ser62060_02_c02_p025-055.indd 39 8/17/10 2:19 PM8/17/10 2:19 PM
Copyright 2010 Cengage Learning. All Rights Reserved. May not be copied, scanned, or duplicated, in whole or in part. Due to electronic rights, some third party content may be suppressed from the eBook and/or eChapter(s).Editorial review has deemed that any suppressed content does not materially affect the overall learning experience. Cengage Learning reserves the right to remove additional content at any time if subsequent rights restrictions require it.

40 CHAPTER 2 | Motion in One Dimension
REMARKS The trooper, traveling about twice as fast as the car, must swerve or apply his brakes strongly to avoid a colli-
sion! This problem can also be solved graphically by plotting position versus time for each vehicle on the same graph. The
intersection of the two graphs corresponds to the time and position at which the trooper overtakes the car.
QUESTION 2.5 The graphical solution corresponds to finding the intersection of what two types of curves in the tx -plane?
EXERCISE 2.5 A motorist with an expired license tag is traveling at 10.0 m/s down a street, and a policeman on a motor-
cycle, taking another 5.00 s to finish his donut, gives chase at an acceleration of 2.00 m/s2. Find (a) the time required to
catch the car and (b) the distance the trooper travels while overtaking the motorist.
ANSWERS (a) 13.7 s (b) 188 m
(a) How long does it take the trooper to overtake the car?
Write the equation for the car’s displacement: Dxcar 5 xcar 2 x0 5 v0t 112acart
2
Take x0 5 24.0 m, v
0 5 24.0 m/s, and a
car 5 0. Solve
for xcar
:
xcar
5 x0 1 vt 5 24.0 m 1 (24.0 m/s)t
Write the equation for the trooper’s position, taking
x0 5 0, v
0 5 0, and a
trooper 5 3.00 m/s2:
xtrooper 512atroopert
2 512 13.00 m/s2 2 t2 5 11.50 m/s2 2 t2
Set xtrooper
5 xcar
, and solve the quadratic equation. (The
quadratic formula appears in Appendix A, Equation A.8.)
Only the positive root is meaningful.
(1.50 m/s2)t 2 5 24.0 m 1 (24.0 m/s)t
(1.50 m/s2)t 2 2 (24.0 m/s)t 2 24.0 m 5 0
t 5 16.9 s
(b) Find the trooper’s speed at that time.
Substitute the time into the trooper’s velocity equation: vtrooper
5 v0 1 a
trooper t 5 0 1 (3.00 m/s2)(16.9 s)
5 50.7 m/s
SOLUTION
■ EXAMPLE 2.6 Runway Length
GOAL Apply kinematics to horizontal motion with two phases.
PROBLEM A typical jetliner lands at a speed of 1.60 3 102 mi/h
and decelerates at the rate of (10.0 mi/h)/s. If the plane travels
at a constant speed of 1.60 3 102 mi/h for 1.00 s after landing
before applying the brakes, what is the total displacement of the
aircraft between touchdown on the runway and coming to rest?
STRATEGY See Figure 2.18. First, convert all quantities to SI
units. The problem must be solved in two parts, or phases, cor-
responding to the initial coast after touchdown, followed by
braking. Using the kinematic equations, find the displacement
during each part and add the two displacements.
SOLUTION
a
Coastingdistance
Braking distance+x
v0 = 71.5 m/sa = 0t = 1.00 s
v = 71.5 m/svf = 0a = –4.47 m/s2
Origin
vv
0
Figure 2.18 (Example 2.6) Coasting and braking distances for
a landing jetliner.
Convert units of speed and acceleration to SI: v0 5 11.60 3 102 mi/h 2 a0.447 m/s1.00 mi/h
b 5 71.5 m/s
a 5 1210.0 1mi/h 2/s 2 a0.447 m/s1.00 mi/h
b 5 24.47 m/s2
Taking a 5 0, v0 5 71.5 m/s, and t 5 1.00 s, find the dis-
placement while the plane is coasting:Dxcoasting 5 v0t 1
12at2 5 171.5 m/s 2 11.00 s 2 1 0 5 71.5 m
Use the time-independent kinematic equation to find the
displacement while the plane is braking.
v2 5 v0
2 1 2aDxbraking
ser62060_02_c02_p025-055.indd 40ser62060_02_c02_p025-055.indd 40 8/17/10 2:19 PM8/17/10 2:19 PM
Copyright 2010 Cengage Learning. All Rights Reserved. May not be copied, scanned, or duplicated, in whole or in part. Due to electronic rights, some third party content may be suppressed from the eBook and/or eChapter(s).Editorial review has deemed that any suppressed content does not materially affect the overall learning experience. Cengage Learning reserves the right to remove additional content at any time if subsequent rights restrictions require it.

(Continued)
2.5 | One-Dimensional Motion with Constant Acceleration 41
REMARKS To find the displacement while braking, we could have used the two kinematics equations involving time,
namely, Dx 5 v0t 112at2 and v 5 v
0 1 at, but because we weren’t interested in time, the time-independent equation was
easier to use.
QUESTION 2.6 How would the answer change if the plane coasted for 2.00 s before the pilot applied the brakes?
EXERCISE 2.6 A jet lands at 80.0 m/s, the pilot applying the brakes 2.00 s after landing. Find the acceleration needed to
stop the jet within 5.00 3 102 m after touchdown.
ANSWER 29.41 m/s2
Take a 5 24.47 m/s2 and v0 5 71.5 m/s. The negative
sign on a means that the plane is slowing down.
Dxbraking 5v2 2 v0
2
2a5
0 2 171.5 m/s 22
2.00 124.47 m/s2 2 5 572 m
Sum the two results to find the total displacement: Dxcoasting
1 Dxbraking
5 71.5 m 1 572 m 5 644 m
■ EXAMPLE 2.7 The Acela: The Porsche of American Trains
GOAL Find accelerations and displacements from a velocity vs. time graph.
PROBLEM The sleek high-speed electric train known as
the Acela (pronounced ahh-sell-ah) is currently in service
on the Washington-New York-Boston run. The Acela con-
sists of two power cars and six coaches and can carry 304
passengers at speeds up to 170 mi/h. In order to negoti-
ate curves comfortably at high speeds, the train carriages
tilt as much as 6° from the vertical, preventing passengers
from being pushed to the side. A velocity vs. time graph for
the Acela is shown in Figure 2.19a (page 42). (a) Describe
the motion of the Acela. (b) Find the peak acceleration of
the Acela in miles per hour per second ((mi/h)/s) as the
train speeds up from 45 mi/h to 170 mi/h. (c) Find the
train’s displacement in miles between t 5 0 and t 5 200 s.
(d) Find the average acceleration of the Acela and its dis-
placement in miles in the interval from 200 s to 300 s. (The
train has regenerative braking, which means that it feeds
energy back into the utility lines each time it stops!) (e) Find the total displacement in the interval from 0 to 400 s.
STRATEGY For part (a), remember that the slope of the
tangent line at any point of the velocity vs. time graph gives
the acceleration at that time. To find the peak acceleration
in part (b), study the graph and locate the point at which
the slope is steepest. In parts (c) through (e), estimating
the area under the curve gives the displacement during
a given period, with areas below the time axis, as in part
(e), subtracted from the total. The average acceleration in
part (d) can be obtained by substituting numbers taken
from the graph into the definition of average acceleration,
a 5 Dv/Dt.
SOLUTION
(a) Describe the motion.
From about 250 s to 50 s, the Acela cruises at a constant velocity in the 1x -direction. Then the train accelerates in the
1x -direction from 50 s to 200 s, reaching a top speed of about 170 mi/h, whereupon it brakes to rest at 350 s and reverses,
steadily gaining speed in the 2x -direction.
(b) Find the peak acceleration.
Calculate the slope of the steepest tangent line,
which connects the points (50 s, 50 mi/h) and (100 s,
150 mi/h) (the light blue line in Figure 2.19b):
a 5 slope 5DvDt
511.5 3 102 2 5.0 3 101 2 mi/h11.0 3 102 2 5.0 3 101 2s
5 2.0 (mi/h)/s
(c) Find the displacement between 0 s and 200 s.
Using triangles and rectangles, approximate the
area in Figure 2.19c (see page 42):
Dx0 S 200 s 5 area1 1 area2 1 area3 1 area4 1 area5
< (5.0 3 101 mi/h)(5.0 3 101 s)
1 (5.0 3 101 mi/h)(5.0 3 101 s)
1 (1.6 3 102 mi/h)(1.0 3 102 s)
112 15.0 3 101 s 2 11.0 3 102 mi/h 2
112 11.0 3 102 s 2 11.7 3 102 mi/h 2 1.6 3 102 mi/h 2
5 2.4 3 104 (mi/h)s
ser62060_02_c02_p025-055.indd 41ser62060_02_c02_p025-055.indd 41 8/17/10 2:19 PM8/17/10 2:19 PM
Copyright 2010 Cengage Learning. All Rights Reserved. May not be copied, scanned, or duplicated, in whole or in part. Due to electronic rights, some third party content may be suppressed from the eBook and/or eChapter(s).Editorial review has deemed that any suppressed content does not materially affect the overall learning experience. Cengage Learning reserves the right to remove additional content at any time if subsequent rights restrictions require it.

42 CHAPTER 2 | Motion in One Dimension
REMARKS There are a number of ways to find the approximate area under a graph. Choice of technique is a personal
preference.
QUESTION 2.7 According to the graph in Figure 2.19a, at what different times is the acceleration zero?
EXERCISE 2.7 Suppose the velocity vs. time graph of another train is given in Figure 2.19d. Find (a) the maximum
instantaneous acceleration and (b) the total displacement in the interval from 0 s to 4.00 3 102 s.
ANSWERS (a) 1.0 (mi/h)/s (b) 4.7 mi
–50
0
50
100
150
200
–100
0 50 100 150 200 250 300 350 400–50�t
�v
–50
0
50
100
150
200
–100
0 50 100 150 200 250 300 350 400–50
v (m
i/h
)v
(mi/
h)
v (m
i/h
)
t (s)
t (s)
t (s)
–50
0
50
100
150
200
–100
0 50 100 200 250 300 350 400–50
1 2 6
4 3
150
5
–25–50
0
50
100
150
200
–100
0 50 100
150 200 250 300 350 400
v (m
i/h
)
t (s)
a b
c d
Figure 2.19 (Example 2.7) (a) Velocity vs. time graph for the Acela. (b) The slope of the steepest tangent blue line gives the peak
acceleration, and the slope of the green line is the average acceleration between 200 s and 300 s. (c) The area under the velocity vs. time
graph in some time interval gives the displacement of the Acela in that time interval. (d) (Exercise 2.7).
Convert units to miles by converting hours to seconds: Dx0 S 200 s < 2.4 3 104 mi # s
h a 1 h
3 600 sb 5 6.7 mi
(d) Find the average acceleration from 200 s to 300 s, and
find the displacement.
The slope of the green line is the average acceleration
from 200 s to 300 s (Fig. 2.19b):
a 5 slope 5DvDt
511.0 3 101 2 1.7 3 102 2 mi/h
1.0 3 102 s
5 21.6 (mi/h)/s
The displacement from 200 s to 300 s is equal to area6,
which is the area of a triangle plus the area of a very nar-
row rectangle beneath the triangle:
Dx200 S 300 s < 12 11.0 3 102 s 2 11.7 3 102 2 1.0 3 101 2 mi/h
1 (1.0 3 101 mi/h)(1.0 3 102 s)
5 9.0 3 103(mi/h)(s) 5 2.5 mi
(e) Find the total displacement from 0 s to 400 s.
The total displacement is the sum of all the individual dis-
placements. We still need to calculate the displacements
for the time intervals from 300 s to 350 s and fromv 350 s
to 400 s. The latter is negative because it’s below the time
axis.
Dx300 S 350 s < 12 15.0 3 101 s 2 11.0 3 101 mi/h 2
5 2.5 3 102(mi/h)(s)
Dx350 S 400 s < 12 15.0 3 101 s 2 125.0 3 101 mi/h 2
5 21.3 3 103(mi/h)(s)
Find the total displacement by summing the parts: Dx0 S 400 s < 12.4 3 104 1 9.0 3 103 1 2.5 3 102
21.3 3 103)(mi/h)(s) 5 8.9 mi
ser62060_02_c02_p025-055.indd 42ser62060_02_c02_p025-055.indd 42 8/17/10 2:19 PM8/17/10 2:19 PM
Copyright 2010 Cengage Learning. All Rights Reserved. May not be copied, scanned, or duplicated, in whole or in part. Due to electronic rights, some third party content may be suppressed from the eBook and/or eChapter(s).Editorial review has deemed that any suppressed content does not materially affect the overall learning experience. Cengage Learning reserves the right to remove additional content at any time if subsequent rights restrictions require it.

2.6 | Freely Falling Objects 43
2.6 Freely Falling ObjectsWhen air resistance is negligible, all objects dropped under the influence of grav-
ity near Earth’s surface fall toward Earth with the same constant acceleration. This
idea may seem obvious today, but it wasn’t until about 1600 that it was accepted.
Prior to that time, the teachings of the great philosopher Aristotle (384–322 b.c.)
had held that heavier objects fell faster than lighter ones.
According to legend, Galileo discovered the law of falling objects by observing
that two different weights dropped simultaneously from the Leaning Tower of Pisa
hit the ground at approximately the same time. Although it’s unlikely that this
particular experiment was carried out, we know that Galileo performed many sys-
tematic experiments with objects moving on inclined planes. In his experiments
he rolled balls down a slight incline and measured the distances they covered in
successive time intervals. The purpose of the incline was to reduce the accelera-
tion and enable Galileo to make accurate measurements of the intervals. (Some
people refer to this experiment as “diluting gravity.”) By gradually increasing the
slope of the incline he was finally able to draw mathematical conclusions about
freely falling objects, because a falling ball is equivalent to a ball going down a ver-
tical incline. Galileo’s achievements in the science of mechanics paved the way for
Newton in his development of the laws of motion, which we will study in Chapter 4.
Try the following experiment: Drop a hammer and a feather simultaneously
from the same height. The hammer hits the floor first because air drag has a
greater effect on the much lighter feather. On August 2, 1971, this same experi-
ment was conducted on the Moon by astronaut David Scott, and the hammer and
feather fell with exactly the same acceleration, as expected, hitting the lunar sur-
face at the same time. In the idealized case where air resistance is negligible, such
motion is called free fall. The expression freely falling object doesn’t necessarily refer to an object dropped
from rest. A freely falling object is any object moving freely under the influence of gravity alone, regardless of its initial motion. Objects thrown upward or down-
ward and those released from rest are all considered freely falling.
We denote the magnitude of the free-fall acceleration by the symbol g. The
value of g decreases with increasing altitude, and varies slightly with latitude as
well. At Earth’s surface, the value of g is approximately 9.80 m/s2. Unless stated
otherwise, we will use this value for g in doing calculations. For quick estimates,
use g < 10 m/s2.
If we neglect air resistance and assume that the free-fall acceleration doesn’t
vary with altitude over short vertical distances, then the motion of a freely falling
object is the same as motion in one dimension under constant acceleration. This
means that the kinematics equations developed in Section 2.5 can be applied. It’s
conventional to define “up” as the 1 y -direction and to use y as the position vari-
able. In that case the acceleration is a 5 2g 5 29.80 m/s2. In Chapter 7, we study
the variation in g with altitude.
■ Quick Quiz
2.6 A tennis player on serve tosses a ball straight up. While the ball is in free fall,
does its acceleration (a) increase, (b) decrease, (c) increase and then decrease,
(d) decrease and then increase, or (e) remain constant?
2.7 As the tennis ball of Quick Quiz 2.6 travels through the air, does its speed
(a) increase, (b) decrease, (c) decrease and then increase, (d) increase and then
decrease, or (e) remain the same?
2.8 A skydiver jumps out of a hovering helicopter. A few seconds later, another sky-
diver jumps out, so they both fall along the same vertical line relative to the helicop-
ter. Both skydivers fall with the same acceleration. Does the vertical distance between
them (a) increase, (b) decrease, or (c) stay the same? Does the difference in their
velocities (d) increase, (e) decrease, or (f) stay the same? (Assume g is constant.)
Galileo GalileiItalian Physicist and Astronomer (1564–1642)Galileo formulated the laws that gov-ern the motion of objects in free fall. He also investigated the motion of an object on an inclined plane, estab-lished the concept of relative motion, invented the thermometer, and dis-covered that the motion of a swinging pendulum could be used to measure time intervals. After designing and constructing his own telescope, he dis-covered four of Jupiter’s moons, found that our own Moon’s surface is rough, discovered sunspots and the phases of Venus, and showed that the Milky Way consists of an enormous number of stars. Galileo publicly defended Nicolaus Copernicus’s assertion that the Sun is at the center of the Universe (the heliocentric system). He published Dialogue Concerning Two New World Systems to support the Copernican model, a view the Church declared to be heretical. After being taken to Rome in 1633 on a charge of heresy, he was sentenced to life imprisonment and later was confined to his villa at Arcetri, near Florence, where he died in 1642.
No
rth
Win
d A
rchi
ve
ser62060_02_c02_p025-055.indd 43ser62060_02_c02_p025-055.indd 43 8/17/10 2:19 PM8/17/10 2:19 PM
Copyright 2010 Cengage Learning. All Rights Reserved. May not be copied, scanned, or duplicated, in whole or in part. Due to electronic rights, some third party content may be suppressed from the eBook and/or eChapter(s).Editorial review has deemed that any suppressed content does not materially affect the overall learning experience. Cengage Learning reserves the right to remove additional content at any time if subsequent rights restrictions require it.

44 CHAPTER 2 | Motion in One Dimension
■ EXAMPLE 2.8 Not a Bad Throw for a Rookie!
GOAL Apply the kinematic equations to a
freely falling object with a nonzero initial
velocity.
PROBLEM A ball is thrown from the top of
a building with an initial velocity of 20.0 m/s
straight upward, at an initial height of 50.0 m
above the ground. The ball just misses the
edge of the roof on its way down, as shown in
Figure 2.20. Determine (a) the time needed
for the ball to reach its maximum height,
(b) the maximum height, (c) the time needed
for the ball to return to the height from which
it was thrown and the velocity of the ball at
that instant, (d) the time needed for the ball
to reach the ground, and (e) the velocity and
position of the ball at t 5 5.00 s. Neglect air
drag.
STRATEGY The diagram in Figure 2.20
establishes a coordinate system with y0 5 0 at
the level at which the ball is released from the
thrower’s hand, with y positive upward. Write
the velocity and position kinematic equations
for the ball, and substitute the given informa-
tion. All the answers come from these two
equations by using simple algebra or by just
substituting the time. In part (a), for exam-
ple, the ball comes to rest for an instant at its
maximum height, so set v 5 0 at this point
and solve for time. Then substitute the time
into the displacement equation, obtaining the
maximum height.
SOLUTION
t � 5.00 sy � �22.5 mv � �29.0 m/s
t � 4.08 sy � 0v � �20.0 m/s
t � 2.04 symax � 20.4 m
v � 0
50.0 m
t � 5.83 sy � �50.0 mv � �37.1 m/s
t � 0y0 � 0v0 � 20.0 m/s
Figure 2.20 (Example 2.8) A ball is
thrown upward with an initial velocity of
v0 5 120.0 m/s. Positions and velocities
are given for several times.
(a) Find the time when the ball reaches its maximum
height.
Write the velocity and position kinematic equations: v 5 at 1 v0
Dy 5 y 2 y0 5 v0t 112at2
Substitute a 5 29.80 m/s2, v0 5 20.0 m/s, and y
0 5 0 into
the preceding two equations:(1) v 5 (29.80 m/s2)t 1 20.0 m/s
(2) y 5 (20.0 m/s)t 2 (4.90 m/s2)t2
Substitute v 5 0, the velocity at maximum height, into
Equation (1) and solve for time:
0 5 (29.80 m/s2)t 1 20.0 m/s
t 5220.0 m/s29.80 m/s2 5 2.04 s
(b) Determine the ball’s maximum height.
Substitute the time t 5 2.04 s into Equation (2): ymax
5 (20.0 m/s)(2.04 s) 2 (4.90 m/s2)(2.04 s)2 5 20.4 m
(c) Find the time the ball takes to return to its initial posi-
tion, and find the velocity of the ball at that time.
Set y 5 0 in Equation (2) and solve t: 0 5 (20.0 m/s)t 2 (4.90 m/s2)t2
5 t(20.0 m/s 2 4.90 m/s2t)
t 5 4.08 s
ser62060_02_c02_p025-055.indd 44ser62060_02_c02_p025-055.indd 44 8/17/10 2:19 PM8/17/10 2:19 PM
Copyright 2010 Cengage Learning. All Rights Reserved. May not be copied, scanned, or duplicated, in whole or in part. Due to electronic rights, some third party content may be suppressed from the eBook and/or eChapter(s).Editorial review has deemed that any suppressed content does not materially affect the overall learning experience. Cengage Learning reserves the right to remove additional content at any time if subsequent rights restrictions require it.

2.6 | Freely Falling Objects 45
REMARKS Notice how everything follows from the two kinematic equations. Once they are written down and the con-
stants correctly identified as in Equations (1) and (2), the rest is relatively easy. If the ball were thrown downward, the ini-
tial velocity would have been negative.
QUESTION 2.8 How would the answer to part (b), the maximum height, change if the person throwing the ball jumped
upward at the instant he released the ball?
EXERCISE 2.8 A projectile is launched straight up at 60.0 m/s from a height of 80.0 m, at the edge of a sheer cliff. The
projectile falls, just missing the cliff and hitting the ground below. Find (a) the maximum height of the projectile above
the point of firing, (b) the time it takes to hit the ground at the base of the cliff, and (c) its velocity at impact.
ANSWERS (a) 184 m (b) 13.5 s (c) 272.3 m/s
Substitute the time into Equation (1) to get the velocity: v 5 20.0 m/s 1 (29.80 m/s2)(4.08 s) 5 220.0 m/s
(d) Find the time required for the ball to reach the
ground.
In Equation (2), set y 5 250.0 m: 250.0 m 5 (20.0 m/s)t 2 (4.90 m/s2)t 2
Apply the quadratic formula and take the positive root: t 5 5.83 s
(e) Find the velocity and position of the ball at t 5 5.00 s.
Substitute values into Equations (1) and (2): v 5 (29.80 m/s2)(5.00 s) 1 20.0 m/s 5 229.0 m/s
y 5 (20.0 m/s)(5.00 s) 2 (4.90 m/s2)(5.00 s)2 5 222.5 m
■ EXAMPLE 2.9 Maximum Height Derived
GOAL Find the maximum height of a thrown projectile using symbols.
PROBLEM Refer to Example 2.8. Use symbolic manipulation to find (a) the time tmax
it takes the ball to reach its maxi-
mum height and (b) an expression for the maximum height that doesn’t depend on time. Answers should be expressed in
terms of the quantities v0, g, and y
0 only.
STRATEGY When the ball reaches its maximum height, its velocity is zero, so for part (a) solve the kinematics velocity
equation for time t and set v 5 0. For part (b), substitute the expression for time found in part (a) into the displacement
equation, solving it for the maximum height.
SOLUTION
(a) Find the time it takes the ball to reach its maximum
height.
Write the velocity kinematics equation: v 5 at 1 v0
Move v0 to the left side of the equation: v 2 v
0 5 at
Divide both sides by a:v 2 v0
a5
ata
5 t
Turn the equation around so that t is on the left and sub-
stitute v 5 0, corresponding to the velocity at maximum
height:
(1) t 52v0
a
Replace t by tmax
and substitute a 5 2g : (2) tmax
5 v0
g
(b) Find the maximum height.
Write the equation for the position y at any time: y 5 y0 1 v0t 112at2
(Continued)
ser62060_02_c02_p025-055.indd 45ser62060_02_c02_p025-055.indd 45 8/18/10 8:49 AM8/18/10 8:49 AM
Copyright 2010 Cengage Learning. All Rights Reserved. May not be copied, scanned, or duplicated, in whole or in part. Due to electronic rights, some third party content may be suppressed from the eBook and/or eChapter(s).Editorial review has deemed that any suppressed content does not materially affect the overall learning experience. Cengage Learning reserves the right to remove additional content at any time if subsequent rights restrictions require it.

46 CHAPTER 2 | Motion in One Dimension
REMARKS Notice that g 5 19.8 m/s2, so the second term is positive overall. Equations (1)–(3) are much more useful
than a numerical answer because the effect of changing one value can be seen immediately. For example, doubling the
initial velocity v0 quadruples the displacement above the point of release. Notice also that y
max could be obtained more
readily from the time-independent equation, v2 2 v0
2 5 2a Dy.
QUESTION 2.9 By what factor would the maximum displacement above the rooftop be increased if the building were
transported to the Moon, where a 5 216g?
EXERCISE 2.9 (a) Using symbols, find the time tE it takes for a ball to reach the ground on Earth if released from rest at
height y0. (b) In terms of tE, how much time tM would be required if the building were on Mars, where a 5 20.385g?
ANSWERS (a) tE 5 Å2y0
g (b) tM 5 1.61tE
Substitute t 5 2v0/a, which corresponds to the time it
takes to reach ymax
, the maximum height:
ymax 5 y0 1 v0a2v0
ab 1
12a a2v0
ab2
5 y0 2v0
2
a1
12
v02
a
Combine the last two terms and substitute a 5 2g : (3) ymax 5 y0 1v0
2
2g
■ EXAMPLE 2.10 A Rocket Goes Ballistic
GOAL Solve a problem involving a
powered ascent followed by free-fall
motion.
PROBLEM A rocket moves straight
upward, starting from rest with an
acceleration of 129.4 m/s2. It runs
out of fuel at the end of 4.00 s and
continues to coast upward, reaching
a maximum height before falling
back to Earth. (a) Find the rocket’s
velocity and position at the end of
4.00 s. (b) Find the maximum height
the rocket reaches. (c) Find the veloc-
ity the instant before the rocket
crashes on the ground.
STRATEGY Take y 5 0 at the
launch point and y positive upward,
as in Figure 2.21. The problem con-
sists of two phases. In phase 1 the
rocket has a net upward acceleration
of 29.4 m/s2, and we can use the
kinematic equations with constant
acceleration a to find the height and velocity of the rocket at the end of phase 1, when the fuel is burned up. In phase 2 the
rocket is in free fall and has an acceleration of 29.80 m/s2, with initial velocity and position given by the results of phase 1.
Apply the kinematic equations for free fall.
SOLUTION
(a) Phase 1: Find the rocket’s velocity and position after 4.00 s.
Figure 2.21 (Example 2.10)
Two linked phases of motion
for a rocket that is launched,
uses up its fuel, and crashes.
y = 0 Launch
Rocket crashesafter fallingfrom ymax
Rocketfuelburnsout
+y
Phase 1a = 29.4 m/s2
Phase 2a = –9.80 m/s2
Maximumheight ymaxv = 0
Write the velocity and position kinematic equations: (1) v 5 v0 1 at
(2) Dy 5 y 2 y0 5 v0t 112 at2
ser62060_02_c02_p025-055.indd 46ser62060_02_c02_p025-055.indd 46 8/17/10 2:19 PM8/17/10 2:19 PM
Copyright 2010 Cengage Learning. All Rights Reserved. May not be copied, scanned, or duplicated, in whole or in part. Due to electronic rights, some third party content may be suppressed from the eBook and/or eChapter(s).Editorial review has deemed that any suppressed content does not materially affect the overall learning experience. Cengage Learning reserves the right to remove additional content at any time if subsequent rights restrictions require it.

| Summary 47
REMARKS You may think that it is more natural to break this problem into three phases, with the second phase ending
at the maximum height and the third phase a free fall from maximum height to the ground. Although this approach gives
the correct answer, it’s an unnecessary complication. Two phases are sufficient, one for each different acceleration.
QUESTION 2.10 If, instead, some fuel remains, at what height should the engines be fired again to brake the rocket’s fall
and allow a perfectly soft landing? (Assume the same acceleration as during the initial ascent.)
EXERCISE 2.10 An experimental rocket designed to land upright falls freely from a height of 2.00 3 102 m, starting at
rest. At a height of 80.0 m, the rocket’s engines start and provide constant upward acceleration until the rocket lands. What
acceleration is required if the speed on touchdown is to be zero? (Neglect air resistance.)
ANSWER 14.7 m/s2
Adapt these equations to phase 1, substituting
a 5 29.4 m/s2, v0 5 0, and y
0 5 0:
(3) v 5 (29.4 m/s2)t
(4) y 512 129.4 m/s2 2 t2 5 114.7 m/s2 2 t2
Substitute t 5 4.00 s into Equations (3) and (4) to find
the rocket’s velocity v and position y at the time of burn-
out. These will be called vb and yb, respectively.
vb 5 118 m/s and yb 5 235 m
(b) Phase 2: Find the maximum height the rocket attains.
Adapt Equations (1) and (2) to phase 2, substituting
a 5 29.8 m/s2, v0 5 vb 5 118 m/s, and y
0 5 yb 5 235 m:
(5) v 5 (29.8 m/s2)t 1 118 m/s
(6) y 5 235 m 1 1118 m/s 2 t 2 14.90 m/s2 2 t2Substitute v 5 0 (the rocket’s velocity at maximum
height) in Equation (5) to get the time it takes the
rocket to reach its maximum height:
0 5 129.8 m/s2 2 t 1 118 m/s S t 5118 m/s
9.80 m/s2 5 12.0 s
Substitute t 5 12.0 s into Equation (6) to find the
rocket’s maximum height:
ymax
5 235 m 1 (118 m/s)(12.0 s) 2 (4.90 m/s2)(12.0 s)2
5 945 m
(c) Phase 2: Find the velocity of the rocket just prior to
impact.
Find the time to impact by setting y 5 0 in Equation (6)
and using the quadratic formula:
0 5 235 m 1 (118 m/s)t 2 (4.90 m/s)t 2
t 5 25.9 s
Substitute this value of t into Equation (5): v 5 (29.80 m/s2)(25.9 s) 1 118 m/s 5 2136 m/s
■ SUMMARY
2.1 DisplacementThe displacement of an object moving along the x -axis is
defined as the change in position of the object,
Dx ; xf 2 xi [2.1]
where xi is the initial position of the object and xf is its final
position.
A vector quantity is characterized by both a magnitude
and a direction. A scalar quantity has a magnitude only.
2.2 VelocityThe average speed of an object is given by
Average speed ;path length
elapsed timeThe average velocity v during a time interval Dt is the dis-
placement Dx divided by Dt.
v ;DxDt
5xf 2 xi
tf 2 ti [2.2]
The average velocity is equal to the slope of the straight
line joining the initial and final points on a graph of the
position of the object versus time.
The slope of the line tangent to the position vs. time
curve at some point is equal to the instantaneous veloc-ity at that time. The instantaneous speed of an object is
defined as the magnitude of the instantaneous velocity.
2.3 AccelerationThe average acceleration a of an object undergoing a
change in velocity Dv during a time interval Dt is
a ;DvDt
5vf 2 vi
tf 2 ti [2.4]
ser62060_02_c02_p025-055.indd 47ser62060_02_c02_p025-055.indd 47 8/17/10 2:19 PM8/17/10 2:19 PM
Copyright 2010 Cengage Learning. All Rights Reserved. May not be copied, scanned, or duplicated, in whole or in part. Due to electronic rights, some third party content may be suppressed from the eBook and/or eChapter(s).Editorial review has deemed that any suppressed content does not materially affect the overall learning experience. Cengage Learning reserves the right to remove additional content at any time if subsequent rights restrictions require it.

48 CHAPTER 2 | Motion in One Dimension
All problems can be solved with the first two equations
alone, the last being convenient when time doesn’t explic-
itly enter the problem. After the constants are properly
identified, most problems reduce to one or two equations
in as many unknowns.
2.6 Freely Falling ObjectsAn object falling in the presence of Earth’s gravity exhib-
its a free-fall acceleration directed toward Earth’s center.
If air friction is neglected and if the altitude of the falling
object is small compared with Earth’s radius, then we can
assume that the free-fall acceleration g 5 9.8 m/s2 is con-
stant over the range of motion. Equations 2.6, 2.9, and 2.10
apply, with a 5 2g.
The instantaneous acceleration of an object at a certain
time equals the slope of a velocity vs. time graph at that
instant.
2.5 One-Dimensional Motion with Constant Acceleration
The most useful equations that describe the motion of an
object moving with constant acceleration along the x -axis
are as follows:
v 5 v0 1 at [2.6]
Dx 5 v0t 112at2 [2.9]
v2 5 v0
2 1 2a Dx [2.10]
1. An arrow is shot straight up in the air at an initial
speed of 15.0 m/s. After how much time is the arrow
heading downward at a speed of 8.00 m/s? (a) 0.714 s
(b) 1.24 s (c) 1.87 s (d) 2.35 s (e) 3.22 s
2. One drop of oil falls straight down onto the road from
the engine of a moving car every 5 s. Figure MCQ2.2
shows the pattern of the drops left behind on the pave-
ment. What is the average speed of the car over this
section of its motion? (a) 20 m/s (b) 24 m/s (c) 30 m/s
(d) 100 m/s (e) 120 m/s.
during this time, which of the following statements
must be true? (a) The car travels a distance vt. (b) The
average speed of the car is v/2. (c) The acceleration of
the car is v/t. (d) The velocity of the car remains con-
stant. (e) None of these
6. When the pilot reverses the propeller in a boat moving
north, the boat moves with an acceleration directed
south. Assume the acceleration of the boat remains con-
stant in magnitude and direction. What happens to the
boat? (a) It eventually stops and remains stopped. (b) It
eventually stops and then speeds up in the northward
direction. (c) It eventually stops and then speeds up
in the southward direction. (d) It never stops but loses
speed more and more slowly forever. (e) It never stops
but continues to speed up in the northward direction.
7. An object moves along the x -axis, its position measured
at each instant of time. The data are organized into an
accurate graph of x vs. t. Which of the following quanti-
ties cannot be obtained from this graph? (a) the velocity
at any instant (b) the acceleration at any instant (c) the
displacement during some time interval (d) the aver-
age velocity during some time interval (e) the speed of
the particle at any instant
8. A skateboarder starts from rest and moves down a hill
with constant acceleration in a straight line, traveling
for 6 s. In a second trial, he starts from rest and moves
along the same straight line with the same accelera-
tion for only 2 s. How does his displacement from his
starting point in this second trial compare with the
first trial? (a) one-third as large (b) three times larger
(c) one-ninth as large (d) nine times larger (e) 1/!3
times as large
9. Races are timed to an accuracy of 1/1 000 of a second.
What distance could a person in-line skating at a speed
of 8.5 m/s travel in that period of time? (a) 85 mm
(b) 85 cm (c) 8.5 m (d) 8.5 mm (e) 8.5 km
■ MULTIPLE-CHOICE QUESTIONS
The multiple-choice questions in this chapter may be assigned online in Enhanced WebAssign.
600 m
Figure MCQ2.2
3. When applying the equations of kinematics for an object
moving in one dimension, which of the following state-
ments must be true? (a) The velocity of the object must
remain constant. (b) The acceleration of the object
must remain constant. (c) The velocity of the object
must increase with time. (d) The position of the
object must increase with time. (e) The velocity of the
object must always be in the same direction as its
acceleration.
4. A juggler throws a bowling pin straight up in the air.
After the pin leaves his hand and while it is in the air,
which statement is true? (a) The velocity of the pin is
always in the same direction as its acceleration. (b) The
velocity of the pin is never in the same direction as its
acceleration. (c) The acceleration of the pin is zero.
(d) The velocity of the pin is opposite its acceleration
on the way up. (e) The velocity of the pin is in the same
direction as its acceleration on the way up.
5. A racing car starts from rest and reaches a final speed
v in a time t. If the acceleration of the car is constant
ser62060_02_c02_p025-055.indd 48ser62060_02_c02_p025-055.indd 48 8/17/10 2:19 PM8/17/10 2:19 PM
Copyright 2010 Cengage Learning. All Rights Reserved. May not be copied, scanned, or duplicated, in whole or in part. Due to electronic rights, some third party content may be suppressed from the eBook and/or eChapter(s).Editorial review has deemed that any suppressed content does not materially affect the overall learning experience. Cengage Learning reserves the right to remove additional content at any time if subsequent rights restrictions require it.

| Conceptual Questions 49
11. A ball is thrown downward from the top of a 40.0 m
tower with an initial speed of 12 m/s. Assuming neg-
ligible air resistance, what is the speed of the ball
just before hitting the ground? (a) 28 m/s (b) 30 m/s
(c) 56 m/s (d) 784 m/s (e) More information is needed.
12. A ball is thrown straight up in the air. For which situa-
tion are both the instantaneous velocity and the accel-
eration zero? (a) on the way up (b) at the top of the
flight path (c) on the way down (d) halfway up and
halfway down (e) none of these
10. A student at the top of a building throws a red ball
upward with speed v0 and then throws a blue ball
downward with the same initial speed v0. Immediately
before the two balls reach the ground, which of the fol-
lowing statements are true? (Choose all correct state-
ments; neglect air friction.) (a) The speed of the red
ball is less than that of the blue ball. (b) The speed
of the red ball is greater than that of the blue ball.
(c) Their velocities are equal. (d) The speed of each
ball is greater than v0. (e) The acceleration of the blue
ball is greater than that of the red ball.
1. If the velocity of a particle is nonzero, can the particle’s
acceleration be zero? Explain.
2. If the velocity of a particle is zero, can the particle’s
acceleration be nonzero? Explain.
3. If a car is traveling eastward, can its acceleration be
westward? Explain.
4. (a) Can the equations in Table 2.4 be used in a situa-
tion where the acceleration varies with time? (b) Can
they be used when the acceleration is zero?
5. Two cars are moving in the same direction in paral-
lel lanes along a highway. At some instant, the velocity
of car A exceeds the velocity of car B. Does that mean
that the acceleration of A is greater than that of B at
that instant? Explain.
6. Figure CQ2.6 shows strobe photographs taken of a disk
moving from left to right under different conditions.
The time interval between images is constant. Tak-
ing the direction to the right to be positive, describe
the motion of the disk in each case. For which case is
(a) the acceleration positive? (b) the acceleration nega-
tive? (c) the velocity constant?
7. (a) Can the instantaneous velocity of an object at an
instant of time ever be greater in magnitude than the
average velocity over a time interval containing that
instant? (b) Can it ever be less?
8. A ball is thrown vertically upward. (a) What are its
velocity and acceleration when it reaches its maximum
altitude? (b) What is the acceleration of the ball just
before it hits the ground?
9. Consider the following combinations of signs and val-
ues for the velocity and acceleration of a particle with
respect to a one-dimensional x -axis:
Velocity Acceleration
a. Positive Positive
b. Positive Negative
c. Positive Zero
d. Negative Positive
e. Negative Negative
f. Negative Zero
g. Zero Positive
h. Zero Negative
Describe what the particle is doing in each case and
give a real-life example for an automobile on an east–
west one-dimensional axis, with east considered the
positive direction.
10. A ball rolls in a straight line along the horizontal direc-
tion. Using motion diagrams (or multiflash photo-
graphs), describe the velocity and acceleration of the
ball for each of the following situations: (a) The ball
moves to the right at a constant speed. (b) The ball
moves from right to left and continually slows down.
(c) The ball moves from right to left and continually
speeds up. (d) The ball moves to the right, first speed-
ing up at a constant rate and then slowing down at a
constant rate.
■ CONCEPTUAL QUESTIONS
The conceptual questions in this chapter may be assigned online in Enhanced WebAssign.
c
Figure CQ2.6
b
a
© C
har
les
D.
Win
ters
/Ce
ng
ag
e Le
arni
ng
ser62060_02_c02_p025-055.indd 49ser62060_02_c02_p025-055.indd 49 8/17/10 2:19 PM8/17/10 2:19 PM
Copyright 2010 Cengage Learning. All Rights Reserved. May not be copied, scanned, or duplicated, in whole or in part. Due to electronic rights, some third party content may be suppressed from the eBook and/or eChapter(s).Editorial review has deemed that any suppressed content does not materially affect the overall learning experience. Cengage Learning reserves the right to remove additional content at any time if subsequent rights restrictions require it.

50 CHAPTER 2 | Motion in One Dimension
2.1 Displacement
2.2 Velocity
1. The speed of a nerve impulse in the human body
is about 100 m/s. If you accidentally stub your toe in
the dark, estimate the time it takes the nerve impulse
to travel to your brain.
2. Light travels at a speed of about 3 3 108 m/s. (a) How
many miles does a pulse of light travel in a time inter-
val of 0.1 s, which is about the blink of an eye? (b) Com-
pare this distance to the diameter of Earth.
3. A person travels by car from one city to another with
different constant speeds between pairs of cities. She
drives for 30.0 min at 80.0 km/h, 12.0 min at 100 km/h,
and 45.0 min at 40.0 km/h and spends 15.0 min eat-
ing lunch and buying gas. (a) Determine the average
speed for the trip. (b) Determine the distance between
the initial and final cities along the route.
4. The current indoor world record time in the 200-m
race is 19.92 s, held by Frank Fredericks of Namibia
(1996), while the indoor record time in the one-mile
race is 228.5 s, held by Hicham El Guerrouj of Mor-
roco (1997). Find the mean speed in meters per second
corresponding to these record times for (a) the 200-m
event and (b) the one-mile event.
5. Two boats start together and race across a 60-km-wide
lake and back. Boat A goes across at 60 km/h and
returns at 60 km/h. Boat B goes across at 30 km/h,
and its crew, realizing how far behind it is getting,
returns at 90 km/h. Turnaround times are negligible,
and the boat that completes the round trip first wins.
(a) Which boat wins and by how much? (Or is it a tie?)
(b) What is the average velocity of the winning boat?
6. A graph of position versus
time for a certain particle
moving along the x -axis
is shown in Figure P2.6.
Find the average velocity
in the time intervals from
(a) 0 to 2.00 s, (b) 0 to
4.00 s, (c) 2.00 s to 4.00 s,
(d) 4.00 s to 7.00 s, and
(e) 0 to 8.00 s.
7. A motorist drives north for 35.0 minutes at 85.0 km/h
and then stops for 15.0 minutes. He then continues
north, traveling 130 km in 2.00 h. (a) What is his total
displacement? (b) What is his average velocity?
8. A tennis player moves in a
straight-line path as shown
in Figure P2.8. Find her
average velocity in the
time intervals from (a) 0 to
1.0 s, (b) 0 to 4.0 s, (c) 1.0 s
to 5.0 s, and (d) 0 to 5.0 s.
9. A jet plane has a takeoff
speed of vto
5 75 m/s and
can move along the runway at an average acceleration
of 1.3 m/s2. If the length of the runway is 2.5 km, will
the plane be able to use this runway safely? Defend
your answer.
10. Two cars travel in the same direction along a straight
highway, one at a constant speed of 55 mi/h and the
other at 70 mi/h. (a) Assuming they start at the same
point, how much sooner does the faster car arrive at a
destination 10 mi away? (b) How far must the faster car
travel before it has a 15-min lead on the slower car?
11. The cheetah can reach a top speed of 114 km/h
(71 mi/h). While chasing its prey in a short sprint, a
cheetah starts from rest and runs 45 m in a straight
line, reaching a final speed of 72 km/h. (a) Determine
the cheetah’s average acceleration during the short
sprint, and (b) find its displacement at t 5 3.5 s.
12. An athlete swims the length L of a pool in a time
t1 and makes the return trip to the starting position
in a time t2. If she is swimming initially in the positive
x -direction, determine her average velocities symboli-
cally in (a) the first half of the swim, (b) the second
half of the swim, and (c) the round trip. (d) What is
her average speed for the round trip?
13. A person takes a trip, driving with a constant speed
of 89.5 km/h, except for a 22.0-min rest stop. If the
person’s average speed is 77.8 km/h, (a) how much
time is spent on the trip and (b) how far does the per-
son travel?
14. A tortoise can run with a speed of 0.10 m/s, and a hare
can run 20 times as fast. In a race, they both start at
the same time, but the hare stops to rest for 2.0 min-
utes. The tortoise wins by a shell (20 cm). (a) How long
does the race take? (b) What is the length of the race?
x (m)
1 2 3 4 5 7t (s)
–6–4–202468
10
6 8
Figure P2.6 Problems 6 and 17
x (m)
t (s)1 2 3 4 5
2
4
–2
Figure P2.8
■ PROBLEMS
The problems in this chapter may be assigned online in Enhanced WebAssign. Selected problems also have Watch It video solutions.
1. denotes straightforward problem; 2. denotes intermediate problem;
3. denotes challenging problem
1. denotes full solution available in Student Solutions Manual/Study Guide
1. denotes problems most often assigned in Enhanced WebAssign
denotes biomedical problems
denotes guided problems
denotes Master It tutorial available in Enhanced WebAssign
denotes asking for quantitative and conceptual reasoning
denotes symbolic reasoning problem
ser62060_02_c02_p025-055.indd 50ser62060_02_c02_p025-055.indd 50 8/17/10 2:19 PM8/17/10 2:19 PM
Copyright 2010 Cengage Learning. All Rights Reserved. May not be copied, scanned, or duplicated, in whole or in part. Due to electronic rights, some third party content may be suppressed from the eBook and/or eChapter(s).Editorial review has deemed that any suppressed content does not materially affect the overall learning experience. Cengage Learning reserves the right to remove additional content at any time if subsequent rights restrictions require it.

| Problems 51
car to accelerate from rest to 60.0 miles per hour? (The
car would need rocket boosters!)
23. A certain car is capable of accelerating at a rate of
0.60 m/s2. How long does it take for this car to go from
a speed of 55 mi/h to a speed of 60 mi/h?
24. The velocity vs. time graph for an object moving along
a straight path is shown in Figure P2.24. (i) Find the
average acceleration of the object during the time
intervals (a) 0 to 5.0 s, (b) 5.0 s to 15 s, and (c) 0 to 20 s.
(ii) Find the instantaneous acceleration at (a) 2.0 s,
(b) 10 s, and (c) 18 s.
15. To qualify for the finals in a racing event, a race car
must achieve an average speed of 250 km/h on a track
with a total length of 1 600 m. If a particular car cov-
ers the first half of the track at an average speed of
230 km/h, what minimum average speed must it have
in the second half of the event in order to qualify?
16. One athlete in a race running on a long,
straight track with a constant speed v1 is a distance d
behind a second athlete running with a constant speed
v2. (a) Under what circumstances is the first athlete
able to overtake the second athlete? (b) Find the time
t it takes the first athlete to overtake the second ath-
lete, in terms of d, v1, and v
2. (c) At what minimum dis-
tance d2 from the leading athlete must the finish line
be located so that the trailing athlete can at least tie for
first place? Express d2 in terms of d, v
1, and v
2 by using
the result of part (b).
17. A graph of position versus time for a certain particle
moving along the x -axis is shown in Figure P2.6. Find
the instantaneous velocity at the instants (a) t 5 1.00 s,
(b) t 5 3.00 s, (c) t 5 4.50 s, and (d) t 5 7.50 s.
18. A race car moves such that its position fits the
relationship
x 5 (5.0 m/s)t 1 (0.75 m/s3)t3
where x is measured in meters and t in seconds. (a) Plot
a graph of the car’s position versus time. (b) Deter-
mine the instantaneous velocity of the car at t 5
4.0 s, using time intervals of 0.40 s, 0.20 s, and 0.10 s.
(c) Compare the average velocity during the first 4.0 s
with the results of part (b).
19. Runner A is initially 4.0 mi west of a flagpole and is
running with a constant velocity of 6.0 mi/h due east.
Runner B is initially 3.0 mi east of the flagpole and is
running with a constant velocity of 5.0 mi/h due west.
How far are the runners from the flagpole when they
meet?
2.3 Acceleration 20. A particle starts from rest
and accelerates as shown
in Figure P2.20. Deter-
mine (a) the particle’s
speed at t 5 10.0 s and at
t 5 20.0 s, and (b) the dis-
tance traveled in the first
20.0 s.
21. A 50.0-g Super Ball traveling at 25.0 m/s bounces off
a brick wall and rebounds at 22.0 m/s. A high-speed
camera records this event. If the ball is in contact with
the wall for 3.50 ms, what is the magnitude of the aver-
age acceleration of the ball during this time interval?
22. The average person passes out at an acceleration
of 7g (that is, seven times the gravitational acceleration
on Earth). Suppose a car is designed to accelerate at
this rate. How much time would be required for the
2a (m/s2)
0
1
�3
�2
5 10 15 20t (s)
�1
Figure P2.20
5t (s)
6
8
2
0
4
–4
–2
–8
–6
v (m/s)
15 2010
Figure P2.24
25. A steam catapult launches a jet aircraft from the
aircraft carrier John C. Stennis, giving it a speed of
175 mi/h in 2.50 s. (a) Find the average acceleration of
the plane. (b) Assuming the acceleration is constant,
find the distance the plane moves.
2.5 One-Dimensional Motion with Constant Acceleration
26. Solve Example 2.5, “Car Chase” by a graphical method.
On the same graph, plot position versus time for the
car and the trooper. From the intersection of the two
curves, read the time at which the trooper overtakes
the car.
27. An object moving with uniform acceleration has a
velocity of 12.0 cm/s in the positive x-direction when
its x -coordinate is 3.00 cm. If its x coordinate 2.00 s
later is 25.00 cm, what is its acceleration?
28. In 1865 Jules Verne proposed sending men to the
Moon by firing a space capsule from a 220-m-long can-
non with final speed of 10.97 km/s. What would have
been the unrealistically large acceleration experienced
by the space travelers during their launch? (A human
can stand an acceleration of 15g for a short time.)
Compare your answer with the free-fall acceleration,
9.80 m/s2.
29. A truck covers 40.0 m in 8.50 s while uniformly slow-
ing down to a final velocity of 2.80 m/s. (a) Find the
truck’s original speed. (b) Find its acceleration.
30. A speedboat increases its speed uniformly from
vi 5 20.0 m/s to vf 5 30.0 m/s in a distance of 2.00 3
102 m. (a) Draw a coordinate system for this situation
ser62060_02_c02_p025-055.indd 51ser62060_02_c02_p025-055.indd 51 8/17/10 2:19 PM8/17/10 2:19 PM
Copyright 2010 Cengage Learning. All Rights Reserved. May not be copied, scanned, or duplicated, in whole or in part. Due to electronic rights, some third party content may be suppressed from the eBook and/or eChapter(s).Editorial review has deemed that any suppressed content does not materially affect the overall learning experience. Cengage Learning reserves the right to remove additional content at any time if subsequent rights restrictions require it.

52 CHAPTER 2 | Motion in One Dimension
38. A car accelerates uniformly from rest to a speed of
40.0 mi/h in 12.0 s. Find (a) the distance the car trav-
els during this time and (b) the constant acceleration
of the car.
39. A car starts from rest and travels for 5.0 s with a uni-
form acceleration of 11.5 m/s2. The driver then
applies the brakes, causing a uniform acceleration of
22.0 m/s2. If the brakes are applied for 3.0 s, (a) how
fast is the car going at the end of the braking period,
and (b) how far has the car gone?
40. A car starts from rest and travels for t1 seconds
with a uniform acceleration a1. The driver then applies
the brakes, causing a uniform acceleration a2. If the
brakes are applied for t2 seconds, (a) how fast is the car
going just before the beginning of the braking period?
(b) How far does the car go before the driver begins to
brake? (c) Using the answers to parts (a) and (b) as the
initial velocity and position for the motion of the car
during braking, what total distance does the car travel?
Answers are in terms of the variables a1, a
2, t
1, and t
2.
41. In the Daytona 500 auto race, a Ford Thunderbird
and a Mercedes Benz are moving side by side down a
straightaway at 71.5 m/s. The driver of the Thunder-
bird realizes that she must make a pit stop, and she
smoothly slows to a stop over a distance of 250 m. She
spends 5.00 s in the pit and then accelerates out, reach-
ing her previous speed of 71.5 m/s after a distance
of 350 m. At this point, how far has the Thunderbird
fallen behind the Mercedes Benz, which has continued
at a constant speed?
42. A certain cable car in San Francisco can stop in 10 s
when traveling at maximum speed. On one occasion,
the driver sees a dog a distance d in front of the car
and slams on the brakes instantly. The car reaches the
dog 8.0 s later, and the dog jumps off the track just in
time. If the car travels 4.0 m beyond the position of the
dog before coming to a stop, how far was the car from
the dog? (Hint: You will need three equations.)
43. A hockey player is standing on his skates on a frozen
pond when an opposing player, moving with a uniform
speed of 12 m/s, skates by with the puck. After 3.0 s, the
first player makes up his mind to chase his opponent. If
he accelerates uniformly at 4.0 m/s2, (a) how long does
it take him to catch his opponent, and (b) how far has
he traveled in that time? (Assume the player with the
puck remains in motion at constant speed.)
44. A train 400 m long is moving on a straight track with
a speed of 82.4 km/h. The engineer applies the brakes
at a crossing, and later the last car passes the crossing
with a speed of 16.4 km/h. Assuming constant acceler-
ation, determine how long the train blocked the cross-
ing. Disregard the width of the crossing.
2.6 Freely Falling Objects
45. A ball is thrown vertically upward with a speed of
25.0 m/s. (a) How high does it rise? (b) How long does
and label the relevant quantities, including vectors.
(b) For the given information, what single equation is
most appropriate for finding the acceleration? (c) Solve
the equation selected in part (b) symbolically for the
boat’s acceleration in terms of vf , vi, and Dx. (d) Substi-
tute given values, obtaining that acceleration. (e) Find
the time it takes the boat to travel the given distance.
31. A Cessna aircraft has a liftoff speed of 120 km/h.
(a) What minimum constant acceleration does the air-
craft require if it is to be airborne after a takeoff run
of 240 m? (b) How long does it take the aircraft to
become airborne?
32. An object moves with constant acceleration 4.00 m/s2
and over a time interval reaches a final velocity of
12.0 m/s. (a) If its original velocity is 6.00 m/s, what
is its displacement during the time interval? (b) What
is the distance it travels during this interval? (c) If its
original velocity is 26.00 m/s, what is its displacement
during this interval? (d) What is the total distance it
travels during the interval in part (c)?
33. In a test run, a certain car accelerates uniformly
from zero to 24.0 m/s in 2.95 s. (a) What is the mag-
nitude of the car’s acceleration? (b) How long does
it take the car to change its speed from 10.0 m/s to
20.0 m/s? (c) Will doubling the time always double the
change in speed? Why?
34. A jet plane lands with a speed of 100 m/s and can
accelerate at a maximum rate of 25.00 m/s2 as it comes
to rest. (a) From the instant the plane touches the run-
way, what is the minimum time needed before it can
come to rest? (b) Can this plane land on a small tropi-
cal island airport where the runway is 0.800 km long?
35. Speedy Sue, driving at 30.0 m/s, enters a one-lane
tunnel. She then observes a slow-moving van 155 m
ahead traveling at 5.00 m/s. Sue applies her brakes but
can accelerate only at 22.00 m/s2 because the road is
wet. Will there be a collision? State how you decide.
If yes, determine how far into the tunnel and at what
time the collision occurs. If no, determine the distance
of closest approach between Sue’s car and the van.
36. A record of travel along a straight path is as follows:
1. Start from rest with a constant acceleration of
2.77 m/s2 for 15.0 s.
2. Maintain a constant velocity for the next 2.05 min.
3. Apply a constant negative acceleration of 29.47 m/s2
for 4.39 s.
(a) What was the total displacement for the trip?
(b) What were the average speeds for legs 1, 2, and 3 of
the trip, as well as for the complete trip?
37. A train is traveling down a straight track at 20 m/s when
the engineer applies the brakes, resulting in an accel-
eration of 21.0 m/s2 as long as the train is in motion.
How far does the train move during a 40-s time inter-
val starting at the instant the brakes are applied?
ser62060_02_c02_p025-055.indd 52ser62060_02_c02_p025-055.indd 52 8/17/10 2:19 PM8/17/10 2:19 PM
Copyright 2010 Cengage Learning. All Rights Reserved. May not be copied, scanned, or duplicated, in whole or in part. Due to electronic rights, some third party content may be suppressed from the eBook and/or eChapter(s).Editorial review has deemed that any suppressed content does not materially affect the overall learning experience. Cengage Learning reserves the right to remove additional content at any time if subsequent rights restrictions require it.

| Problems 53
copter in terms of g and t? (c) What are the answers to
parts (a) and (b) if the helicopter is rising steadily at
the same speed?
53. A model rocket is launched straight upward
with an initial speed of 50.0 m/s. It accelerates with
a constant upward acceleration of 2.00 m/s2 until its
engines stop at an altitude of 150 m. (a) What can you
say about the motion of the rocket after its engines
stop? (b) What is the maximum height reached by the
rocket? (c) How long after liftoff does the rocket reach
its maximum height? (d) How long is the rocket in the
air?
54. A baseball is hit so that it travels straight upward
after being struck by the bat. A fan observes that it
takes 3.00 s for the ball to reach its maximum height.
Find (a) the ball’s initial velocity and (b) the height it
reaches.
Additional Problems
55. A truck tractor pulls two trailers, one behind the other,
at a constant speed of 100 km/h. It takes 0.600 s for the
big rig to completely pass onto a bridge 400 m long.
For what duration of time is all or part of the truck–
trailer combination on the bridge?
56. Colonel John P. Stapp, USAF, participated
in studying whether a jet pilot could survive emer-
gency ejection. On March 19, 1954, he rode a rocket-
propelled sled that moved down a track at a speed of
632 mi/h (see Fig. P2.56). He and the sled were safely
brought to rest in 1.40 s. Determine in SI units (a) the
negative acceleration he experienced and (b) the dis-
tance he traveled during this negative acceleration.
it take to reach its highest point? (c) How long does the
ball take to hit the ground after it reaches its highest
point? (d) What is its velocity when it returns to the
level from which it started?
46. A ball is thrown directly downward with an initial
speed of 8.00 m/s, from a height of 30.0 m. After what
time interval does it strike the ground?
47. A certain freely falling object, released from rest,
requires 1.50 s to travel the last 30.0 m before it hits
the ground. (a) Find the velocity of the object when it
is 30.0 m above the ground. (b) Find the total distance
the object travels during the fall.
48. An attacker at the base of a castle wall 3.65 m
high throws a rock straight up with speed 7.40 m/s
at a height of 1.55 m above the ground. (a) Will the
rock reach the top of the wall? (b) If so, what is the
rock’s speed at the top? If not, what initial speed must
the rock have to reach the top? (c) Find the change in
the speed of a rock thrown straight down from the top
of the wall at an initial speed of 7.40 m/s and moving
between the same two points. (d) Does the change in
speed of the downward-moving rock agree with the
magnitude of the speed change of the rock moving
upward between the same elevations? Explain physi-
cally why or why not.
49. Traumatic brain injury such as concussion results
when the head undergoes a very large acceleration.
Generally, an acceleration less than 800 m/s2 lasting
for any length of time will not cause injury, whereas an
acceleration greater than 1 000 m/s2 lasting for at least
1 ms will cause injury. Suppose a small child rolls off a
bed that is 0.40 m above the floor. If the floor is hard-
wood, the child’s head is brought to rest in approxi-
mately 2.0 mm. If the floor is carpeted, this stopping
distance is increased to about 1.0 cm. Calculate the
magnitude and duration of the deceleration in both
cases, to determine the risk of injury. Assume the child
remains horizontal during the fall to the floor. Note
that a more complicated fall could result in a head
velocity greater or less than the speed you calculate.
50. A small mailbag is released from a helicopter that is
descending steadily at 1.50 m/s. After 2.00 s, (a) what
is the speed of the mailbag, and (b) how far is it below
the helicopter? (c) What are your answers to parts (a)
and (b) if the helicopter is rising steadily at 1.50 m/s?
51. A tennis player tosses a tennis ball straight up and then
catches it after 2.00 s at the same height as the point of
release. (a) What is the acceleration of the ball while it
is in flight? (b) What is the velocity of the ball when it
reaches its maximum height? Find (c) the initial veloc-
ity of the ball and (d) the maximum height it reaches.
52. A package is dropped from a helicopter that is
descending steadily at a speed v0. After t seconds have
elapsed, (a) what is the speed of the package in terms
of v0, g, and t? (b) What distance d is it from the heli-
a
Figure P2.56
b
Co
urte
sy U
.S.
Air
Fo
rce
Ph
otr
i, In
c.
57. A bullet is fired through a board 10.0 cm thick in such
a way that the bullet’s line of motion is perpendicular
to the face of the board. If the initial speed of the bul-
let is 400 m/s and it emerges from the other side of
the board with a speed of 300 m/s, find (a) the accel-
eration of the bullet as it passes through the board
and (b) the total time the bullet is in contact with the
board.
58. A speedboat moving at 30.0 m/s approaches a no-wake
buoy marker 100 m ahead. The pilot slows the boat
with a constant acceleration of 23.50 m/s2 by reducing
the throttle. (a) How long does it take the boat to reach
ser62060_02_c02_p025-055.indd 53ser62060_02_c02_p025-055.indd 53 8/17/10 2:19 PM8/17/10 2:19 PM
Copyright 2010 Cengage Learning. All Rights Reserved. May not be copied, scanned, or duplicated, in whole or in part. Due to electronic rights, some third party content may be suppressed from the eBook and/or eChapter(s).Editorial review has deemed that any suppressed content does not materially affect the overall learning experience. Cengage Learning reserves the right to remove additional content at any time if subsequent rights restrictions require it.

54 CHAPTER 2 | Motion in One Dimension
ward at a speed v0; at the same time, the other student
throws a ball vertically upward at the same speed.
Answer the following symbolically in terms of v0, g,
h, and t. (a) Write the kinematic equation for the
y - coordinate of each ball. (b) Set the equations found
in part (a) equal to height 0 and solve each for t sym-
bolically using the quadratic formula. What is the dif-
ference in the two balls’ time in the air? (c) Use the
time-independent kinematics equation to find the
velocity of each ball as it strikes the ground. (d) How
far apart are the balls at a time t after they are released
and before they strike the ground?
67. You drop a ball from a window on an upper floor of
a building and it is caught by a friend on the ground
when the ball is moving with speed vf . You now repeat
the drop, but you have a friend on the street below
throw another ball upward at speed vf exactly at the
same time that you drop your ball from the window.
The two balls are initially separated by 28.7 m. (a) At
what time do they pass each other? (b) At what loca-
tion do they pass each other relative the window?
68. The driver of a truck slams on the brakes when he sees
a tree blocking the road. The truck slows down uni-
formly with an acceleration of 25.60 m/s2 for 4.20 s,
making skid marks 62.4 m long that end at the tree.
With what speed does the truck then strike the tree?
69. Emily challenges
her husband, David,
to catch a $1 bill as fol-
lows. She holds the bill
vertically as in Figure
P2.69, with the cen-
ter of the bill between
David’s index finger
and thumb. David must
catch the bill after
Emily releases it with-
out moving his hand downward. If his reaction time is
0.2 s, will he succeed? Explain your reasoning. (This
challenge is a good trick you might want to try with
your friends.)
70. A mountain climber stands at the top of a 50.0-m cliff
that overhangs a calm pool of water. She throws two
stones vertically downward 1.00 s apart and observes
that they cause a single splash. The first stone had
an initial velocity of 22.00 m/s. (a) How long after
release of the first stone did the two stones hit the
water? (b) What initial velocity must the second stone
have had, given that they hit the water simultaneously?
(c) What was the velocity of each stone at the instant it
hit the water?
71. An ice sled powered by a rocket engine starts from
rest on a large frozen lake and accelerates at 140 ft/s2.
After some time t1, the rocket engine is shut down and
the sled moves with constant velocity v for a time t2. If
the buoy? (b) What is the velocity of the boat when it
reaches the buoy?
59. A student throws a set of keys vertically upward to his
fraternity brother, who is in a window 4.00 m above.
The brother’s outstretched hand catches the keys
1.50 s later. (a) With what initial velocity were the keys
thrown? (b)? What was the velocity of the keys just
before they were caught?
60. A student throws a set of keys vertically upward to
his fraternity brother, who is in a window a distance
h above. The brother’s outstretched hand catches the
keys on their way up a time t later. (a) With what initial
velocity were the keys thrown? (b) What was the veloc-
ity of the keys just before they were caught? (Answers
should be in terms of h, g, and t.)
61. It has been claimed that an insect called the
froghopper (Philaenus spumarius) is the best jumper
in the animal kingdom. This insect can accelerate at
4 000 m/s2 over a distance of 2.0 mm as it straightens
its specially designed “ jumping legs.” (a) Assuming a
uniform acceleration, what is the velocity of the insect
after it has accelerated through this short distance, and
(b) how long did it take to reach that velocity? (c) How
high would the insect jump if air resistance could be
ignored? Note that the actual height obtained is about
0.7 m, so air resistance is important here.
62. Draw motion diagrams (see Section 2.5) for
(a) an object moving to the right at constant speed,
(b) an object moving to the right and speeding up at
a constant rate, (c) an object moving to the right and
slowing down at a constant rate, (d) an object mov-
ing to the left and speeding up at a constant rate, and
(e) an object moving to the left and slowing down at a
constant rate. (f) How would your drawings change if
the changes in speed were not uniform; that is, if the
speed were not changing at a constant rate?
63. A ball is thrown upward from the ground with an
initial speed of 25 m/s; at the same instant, another
ball is dropped from a building 15 m high. After how
long will the balls be at the same height?
64. To pass a physical education class at a university, a
student must run 1.0 mi in 12 min. After running for
10 min, she still has 500 yd to go. If her maximum
acceleration is 0.15 m/s2, can she make it? If the answer
is no, determine what acceleration she would need to
be successful.
65. In Chapter 5 we will define the center of mass of an
object. The center of mass moves with constant accel-
eration when constant forces act on the object. A gym-
nast jumps straight up, with her center of mass moving
at 2.80 m/s as she leaves the ground. How high above
this point is her center of mass (a) 0.100 s, (b) 0.200 s,
(c) 0.300 s, and (d) 0.500 s thereafter?
66. Two students are on a balcony a distance h above
the street. One student throws a ball vertically down-
Figure P2.69
© C
en
ga
ge
Lear
nin
g/G
eo
rge
Se
mp
le
ser62060_02_c02_p025-055.indd 54ser62060_02_c02_p025-055.indd 54 8/17/10 2:19 PM8/17/10 2:19 PM
Copyright 2010 Cengage Learning. All Rights Reserved. May not be copied, scanned, or duplicated, in whole or in part. Due to electronic rights, some third party content may be suppressed from the eBook and/or eChapter(s).Editorial review has deemed that any suppressed content does not materially affect the overall learning experience. Cengage Learning reserves the right to remove additional content at any time if subsequent rights restrictions require it.

| Problems 55
constant speed toward the person, find the velocity of
the airplane. (c) Look up the speed of light in air and
defend the approximation used in part (a).
74. A glider on an air track carries a flag of length
, through a stationary photogate, which measures the
time interval Dtd during which the flag blocks a beam
of infrared light passing across the photogate. The
ratio vd 5 ,/Dtd is the average velocity of the glider over
this part of its motion. Suppose the glider moves with
constant acceleration. (a) Is vd necessarily equal to the
instantaneous velocity of the glider when it is halfway
through the photogate in space? Explain. (b) Is vd
equal to the instantaneous velocity of the glider when
it is halfway through the photogate in time? Explain.
75. A stuntman sitting on a tree limb wishes to drop verti-
cally onto a horse galloping under the tree. The con-
stant speed of the horse is 10.0 m/s, and the man is
initially 3.00 m above the level of the saddle. (a) What
must be the horizontal distance between the saddle
and the limb when the man makes his move? (b) How
long is he in the air?
the total distance traveled by the sled is 17 500 ft and
the total time is 90 s, find (a) the times t1 and t
2 and
(b) the velocity v. At the 17 500-ft mark, the sled begins
to accelerate at 220 ft/s2. (c) What is the final position
of the sled when it comes to rest? (d) How long does it
take to come to rest?
72. In Bosnia, the ultimate test of a young man’s cour-
age used to be to jump off a 400-year-old bridge
(destroyed in 1993; rebuilt in 2004) into the River
Neretva, 23 m below the bridge. (a) How long did the
jump last? (b) How fast was the jumper traveling upon
impact with the river? (c) If the speed of sound in air is
340 m/s, how long after the jumper took off did a spec-
tator on the bridge hear the splash?
73. A person sees a lightning bolt pass close to an airplane
that is flying in the distance. The person hears thun-
der 5.0 s after seeing the bolt and sees the airplane
overhead 10 s after hearing the thunder. The speed
of sound in air is 1 100 ft/s. (a) Find the distance of
the airplane from the person at the instant of the bolt.
(Neglect the time it takes the light to travel from the
bolt to the eye.) (b) Assuming the plane travels with a
ser62060_02_c02_p025-055.indd 55ser62060_02_c02_p025-055.indd 55 8/17/10 2:19 PM8/17/10 2:19 PM
Copyright 2010 Cengage Learning. All Rights Reserved. May not be copied, scanned, or duplicated, in whole or in part. Due to electronic rights, some third party content may be suppressed from the eBook and/or eChapter(s).Editorial review has deemed that any suppressed content does not materially affect the overall learning experience. Cengage Learning reserves the right to remove additional content at any time if subsequent rights restrictions require it.