ap report to the nation california - college...
TRANSCRIPT

Cal
ifor
nia
THE 10TH ANNUAL
AP® Report to the NationSTATE SUPPLEMENT FEBRUARY 11, 2014

2
T H E 1 0 T H A N N U A L A P R E P O R T T O T H E N A T I O N · C A L I F O R N I A S U P P L E M E N T
About This Report
This report provides educators and policymakers with information
they can use to celebrate their successes, understand their unique
challenges, and set meaningful goals to increase opportunity for all
students. It’s important to note that while AP® Exams are valid
measures of students’ content mastery of college-level studies in
specific academic disciplines, AP results should never be used as
the sole measure for gauging educational excellence and equity.
Because reliable demographic data for nonpublic schools are not
available for all states, this report represents public school students
only. Additionally, this report looks at students’ entire experience
with AP — tracking exams taken by graduates throughout their high
school careers — as opposed to reporting exam results from a
particular calendar year.
Additional data are available at apreport.collegeboard.org.
Table of Contents
3 State Strategies
7 Fostering AP® Participation and Success
9 A Closer Look at Equity Gaps in AP Participation and Success
Note: Throughout this report, public high school graduates represent projections supplied in Knocking at the College Door (Western Interstate Commission for Higher Education, 2012).
The redesigned courses, Biology, Latin, and Spanish Literature and Culture, began in fall 2012, and the first AP Exam based on those redesigned courses was administered in May 2013. As a result, the data in this report reflect a blend of the old and redesigned exam results.

3
T H E 1 0 T H A N N U A L A P R E P O R T T O T H E N A T I O N · C A L I F O R N I A S U P P L E M E N T
STATE STRATEG IESSTATE STRATEG IES
California has made progress in recent years in improving student access and supporting student performance in AP®. Just as we do in the national report, we wanted to take an opportunity to applaud your efforts and offer additional strategies for your consideration.
Current Picture
Congratulations. You are already using these strategies to build a robust AP Program. You:
Include AP in the state accountability system. • Establish AP participation and performance indicators. • Set clear, measurable statewide goals toward improvement.
Celebrate the 29 districts that have earned a spot on the AP Honor Roll through their hard work and dedication toward increasing participation and success in AP, particularly for underrepresented students. See page 6 for more details.
Encourage your educators to participate in the development of the AP Program, such as by becoming AP Exam Readers or participating in course and exam development committees. See page 5 for more details.
Provide funding for teachers in underserved areas of the state to participate in professional development.
Provide targeted assistance and resources to schools serving traditionally underserved populations. For example, funding for materials, supplies, outreach efforts, and tutoring programs.
Clearly communicate your state’s graduation requirements, and share information about funding opportunities that enable students to participate and succeed in AP.
Develop policies that allow AP course work and exam scores for sophomores and juniors to substitute for statewide graduation requirements and/or end-of-course assessments.
Provide resources to schools and districts to support research-based programs that build content knowledge and skills — particularly in literacy and math — to prepare students for success in AP course work, and in college and careers.
Ensure that colleges and universities award credit or placement for AP Exam scores using evidence-based methods.

4
T H E 1 0 T H A N N U A L A P R E P O R T T O T H E N A T I O N · C A L I F O R N I A S U P P L E M E N T
STATE STRATEG IESSTATE STRATEG IES
The following strategies have been proven effective. To build an even stronger AP program, you could:
¨ Create opportunities for other schools and districts to learn from your AP Honor Roll winners.
¨ Encourage schools and districts to utilize AP Potential™ and other tools to expand access and performance.
Opportunities

5
T H E 1 0 T H A N N U A L A P R E P O R T T O T H E N A T I O N · C A L I F O R N I A S U P P L E M E N T
STATE STRATEG IESSTATE STRATEG IES
The following information dives a little deeper into the details of your efforts.
Participation in the Development of AP
2013 Reading participants — Total: 993 California represents 8.7% of all Readers • AP High School Teachers: 724 • College and University Faculty: 269
2013 AP Professional Development Leaders — Total: 124
2013 AP Development Committee Members — Total: 36
Macroeconomics Bonita High SchoolStatistics Cal Poly–San Luis ObispoFrench Language and Culture California Polytechnic State UniversityPhysics C California State Polytechnic University–PomonaBiology Castle Park High SchoolChinese Language and Culture Clovis West High SchoolArt History Corona del Mar High SchoolChinese Language and Culture Cupertino High SchoolU.S. Government and Politics Hart High SchoolGerman Language and Culture Henry M. Gunn High SchoolArt History Humboldt State UniversityEnvironmental Science La Canada High SchoolPsychology Lowell High SchoolLatin Loyola High SchoolMicroeconomics Menlo SchoolPsychology Mission Hills High SchoolJapanese Language and Culture North Salinas High SchoolEnvironmental Science San Dimas High SchoolPhysics C Shasta CollegeSpanish Language and Culture Sonoma State UniversityAP Capstone™ Seminar Stanford UniversityBiology The Bishop’s SchoolMicroeconomics The Bishop’s SchoolFrench Language and Culture The Harker SchoolStatistics Troy High SchoolChemistry University of California–BerkeleyComputer Science A University of California–BerkeleyEnglish Literature and Composition University of California–BerkeleySpanish Language University of California–DavisUnited States History University of California–IrvineWorld History University of California–IrvineWorld History University of California–BerkeleyPsychology University of San DiegoUnited States History University of Southern CaliforniaStatistics University of CaliforniaPhysics B William S. Hart Union High School
Highlights

6
T H E 1 0 T H A N N U A L A P R E P O R T T O T H E N A T I O N · C A L I F O R N I A S U P P L E M E N T
STATE STRATEG IESSTATE STRATEG IES
Highlights (continued)
The AP Honor RollThe AP Honor Roll recognizes and honors those outstanding school districts that simultaneously increase access to Advanced Placement® course work while increasing the percentage of students earning scores of 3 or higher on AP Exams. Achieving both of these goals is the ideal scenario for a district’s AP program because it indicates that the district is successfully identifying motivated, academically prepared students who are likely to benefit most from rigorous AP course work.
4th Annual Honor Roll Districts in California: 29
Alameda Unified School DistrictCarlsbad Unified School DistrictCentral Unified School District* Clovis Unified School DistrictChico Unified School DistrictDiocese of Sacramento Education Office Diocese of San Jose Education Office*El Monte Union High School DistrictFillmore Unified School DistrictFremont Unified School District*Huntington Beach Union High School DistrictIrvine Unified School DistrictKings Canyon Unified School DistrictLas Virgenes Unified School DistrictLos Alamitos Unified School District*Milpitas Unified School District*Oak Park Unified School DistrictPajaro Valley Unified School DistrictPalos Verdes Peninsula Unified School DistrictReef-Sunset Unified School DistrictSaddleback Valley Unified School DistrictSan Lorenzo Valley Unified School DistrictSan Luis Coastal Unified School DistrictSan Ramon Valley Unified School District*Santa Ana Unified School District*Temecula Valley Unified School DistrictTracy Unified School DistrictTustin Unified School District*Walnut Valley Unified School District
*District has achieved the honor for multiple years.

7
T H E 1 0 T H A N N U A L A P R E P O R T T O T H E N A T I O N · C A L I F O R N I A S U P P L E M E N T
FOSTER ING AP PART IC IPAT ION AND SUCCESS
More graduatesare succeeding on AP Exams today than took them in 2003
History and Social Scienceshad the greatest number of students achieving a score of 3 or higher
F I G U R E 1 Growth in AP® Participation and Success
F I G U R E 2 Participation in and Success on AP Exams in the Class of 2013
Number of graduates leaving high school having taken an AP Exam Number of graduates scoring 3+ on an AP Exam during high school
2003 2008 2012 2013
119,33886,303 144,801 152,647
78,34258,90795,695 101,415
2.7%
21.5%
26.6%
16.4%
15.4%
11.0%
40.6%
1.9%
12.2%
14.6%
9.8%
8.2%
8.8%
26.9%
60%30%0%
Arts
English
WorldLanguages
Mathematics andComputer Science
Sciences
History andSocial Sciences
AnyDiscipline
Total Number of Graduates: 376,369
Percentage of graduates leaving high school having taken an AP Exam Percentage of graduates scoring 3+ on an AP Exam during high school
Percentage of California Graduating Class
* AP Italian Language and Culture was discontinued after the 2008-09 school year, and was reinstated in 2011-12.
Art History, Music Theory, Studio Art: Drawing, Studio Art: 2-D Design, and Studio Art: 3-D Design
English Language and Composition, and English Literature and Composition
Comparative Government and Politics, European History, Human Geography, Macroeconomics, Microeconomics, Psychology, United States Government and Politics, United States History, and World History
Calculus AB, Calculus BC, Computer Science A, and Statistics
Biology, Chemistry, Environmental Science, Physics B, Physics C: Electricity and Magnetism, and Physics C: Mechanics
Chinese Language and Culture, French Language and Culture, German Language and Culture, Italian Language and Culture*, Japanese Language and Culture, Latin, Spanish Language, and Spanish Literature and Culture
8
T H E 1 0 T H A N N U A L A P R E P O R T T O T H E N A T I O N · C A L I F O R N I A S U P P L E M E N T
FOSTER ING AP PART IC IPAT ION AND SUCCESS
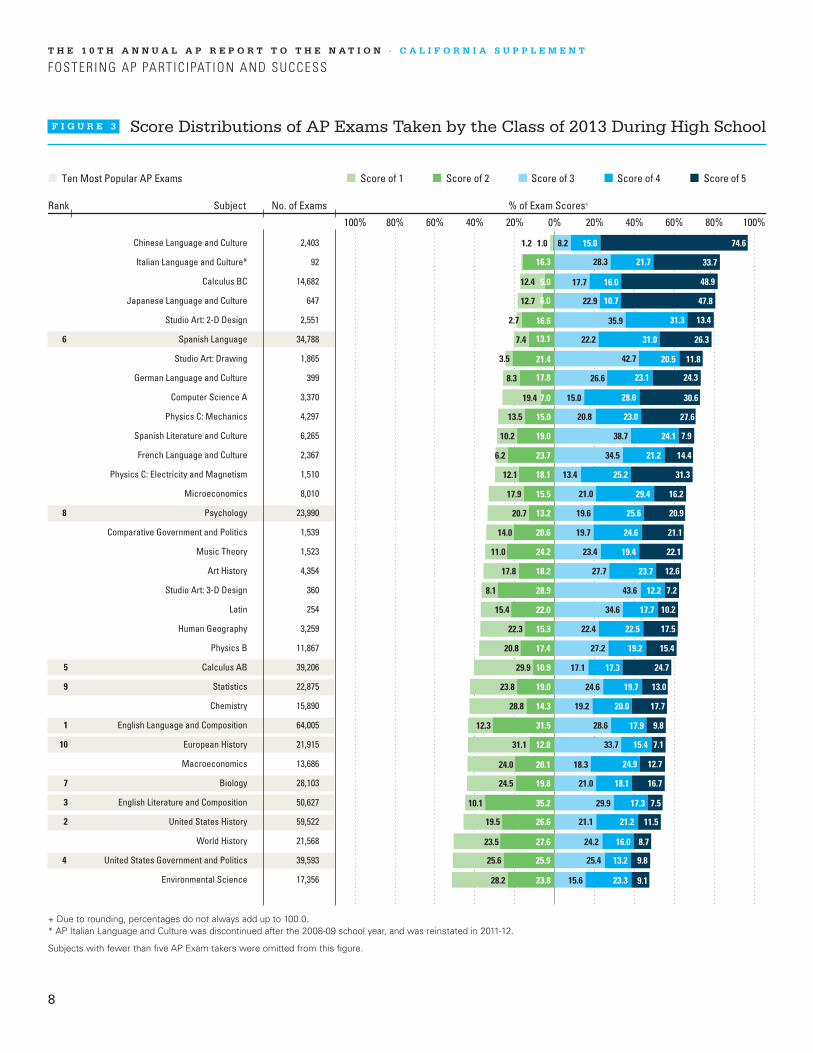
+ Due to rounding, percentages do not always add up to 100.0.* AP Italian Language and Culture was discontinued after the 2008-09 school year, and was reinstated in 2011-12.
Subjects with fewer than five AP Exam takers were omitted from this figure.
F I G U R E 3 Score Distributions of AP Exams Taken by the Class of 2013 During High School
Rank
100% 80% 60% 40% 20% 0% 20% 40% 60% 80% 100%
Subject No. of Exams % of Exam Scores+
8.2
28.3
17.7
22.9
35.9
22.2
42.7
26.6
15.0
20.8
38.7
34.5
13.4
21.0
19.6
19.7
23.4
43.6
34.6
22.4
27.2
17.1
24.6
19.2
28.6
33.7
18.3
21.0
29.9
21.1
24.2
15.0
21.7
16.0
10.7
31.3
31.0
20.5
23.1
28.0
23.0
24.1
25.2
29.4
25.6
24.6
19.4
12.2
17.7
22.5
19.2
17.3
19.7
20.0
17.9
15.4
24.9
18.1
17.3
21.2
16.0
74.6
33.7
48.9
47.8
13.4
26.3
11.8
24.3
30.6
27.6
7.9
31.3
16.2
20.9
21.1
22.1
12.6
7.2
10.2
17.5
15.4
24.7
13.0
17.7
9.8
7.1
12.7
16.7
7.5
11.5
8.7
1.0
16.3
5.0
6.0
16.6
13.1
21.4
17.8
7.0
15.0
19.0
23.7
18.1
15.5
13.2
20.6
24.2
28.9
22.0
15.3
17.4
10.9
19.0
14.3
31.5
12.8
20.1
19.8
35.2
26.6
27.6
1.2
12.4
12.7
2.7
7.4
3.5
8.3
19.4
13.5
10.2
6.2
12.1
17.9
20.7
14.0
11.0
17.8
8.1
15.4
22.3
20.8
29.9
23.8
28.8
12.3
31.1
24.0
24.5
10.1
19.5
23.5
Chinese Language and Culture 2,403
Italian Language and Culture* 92
Calculus BC 14,682
Japanese Language and Culture 647
Studio Art: 2-D Design 2,551
6 Spanish Language 34,788
Studio Art: Drawing 1,865
German Language and Culture 399
Computer Science A 3,370
Physics C: Mechanics 4,297
Spanish Literature and Culture 6,265
French Language and Culture 2,367
Physics C: Electricity and Magnetism 1,510
Microeconomics 8,010
8 Psychology 23,990
Comparative Government and Politics 1,539
Music Theory 1,523
Art History 4,354
Studio Art: 3-D Design 360
Latin 254
Human Geography 3,259
Physics B 11,867
5 Calculus AB 39,206
9 Statistics 22,875
Chemistry 15,890
1 English Language and Composition 64,005
10 European History 21,915
Macroeconomics 13,686
7 Biology 28,103
3 English Literature and Composition 50,627
2 United States History 59,522
World History 21,568
4 United States Government and Politics 39,593
Environmental Science 17,356
27.718.2
21.2
23.7
14.4
25.6
28.2
25.9
23.8
25.4
15.6
13.2
23.3
9.8
9.1
9
T H E 1 0 T H A N N U A L A P R E P O R T T O T H E N A T I O N · C A L I F O R N I A S U P P L E M E N T
A CLOSER LOOK AT EQUITY GAPS IN AP PART IC IPAT ION AND SUCCESS
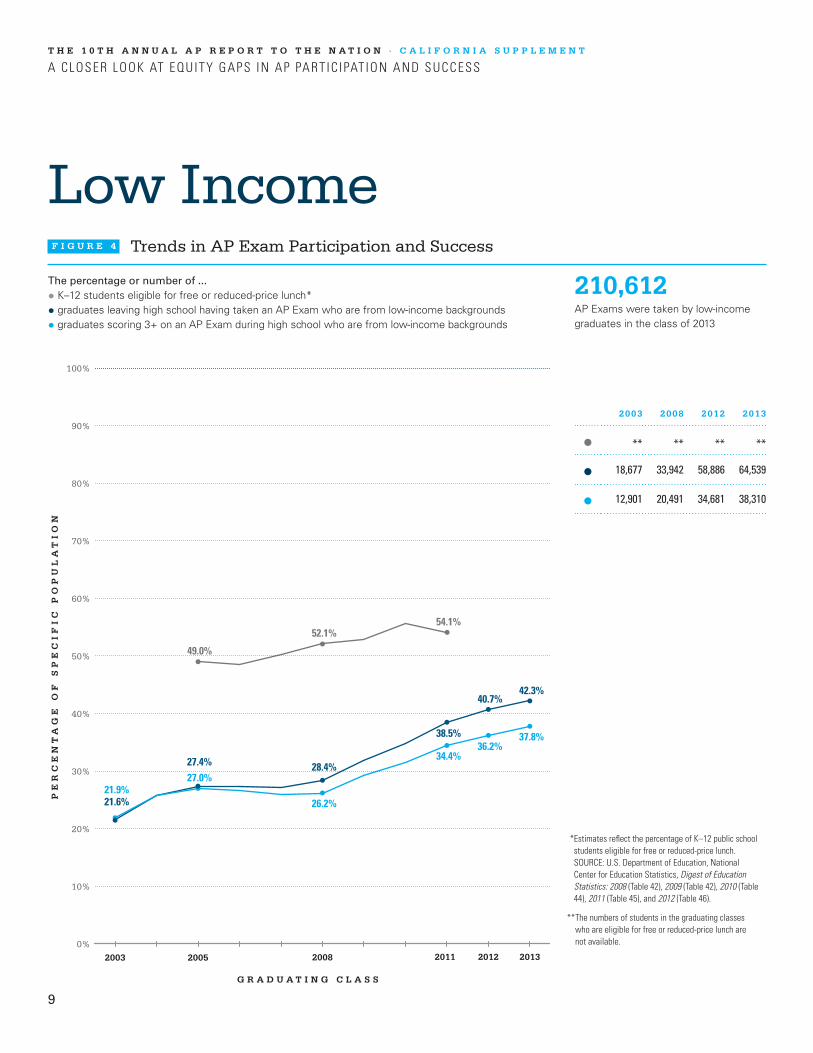
Low IncomeF I G U R E 4 Trends in AP Exam Participation and Success
210,612AP Exams were taken by low-income graduates in the class of 2013
The percentage or number of ...
• K–12 students eligible for free or reduced-price lunch*
• graduates leaving high school having taken an AP Exam who are from low-income backgrounds
• graduates scoring 3+ on an AP Exam during high school who are from low-income backgrounds
2003 2008 2012 2013
** ** ** **
18,677 33,942 58,886 64,539
12,901 20,491 34,681 38,310
2003 2005 2008 20122011 2013
PE
RC
EN
TA
GE
OF
SP
EC
IF
IC
PO
PU
LA
TI
ON
G R A D U A T I N G C L A S S
10%
20%
0%
30%
40%
50%
60%
70%
80%
90%
100%
49.0%
52.1%54.1%
21.6%
28.4%27.4%
38.5%
40.7%42.3%
21.9%26.2%
27.0%
34.4%36.2%
37.8%
* Estimates reflect the percentage of K–12 public school students eligible for free or reduced-price lunch. SOURCE: U.S. Department of Education, National Center for Education Statistics, Digest of Education Statistics: 2008 (Table 42), 2009 (Table 42), 2010 (Table 44), 2011 (Table 45), and 2012 (Table 46).
** The numbers of students in the graduating classes who are eligible for free or reduced-price lunch are not available.
10
T H E 1 0 T H A N N U A L A P R E P O R T T O T H E N A T I O N · C A L I F O R N I A S U P P L E M E N T
A CLOSER LOOK AT EQUITY GAPS IN AP PART IC IPAT ION AND SUCCESS
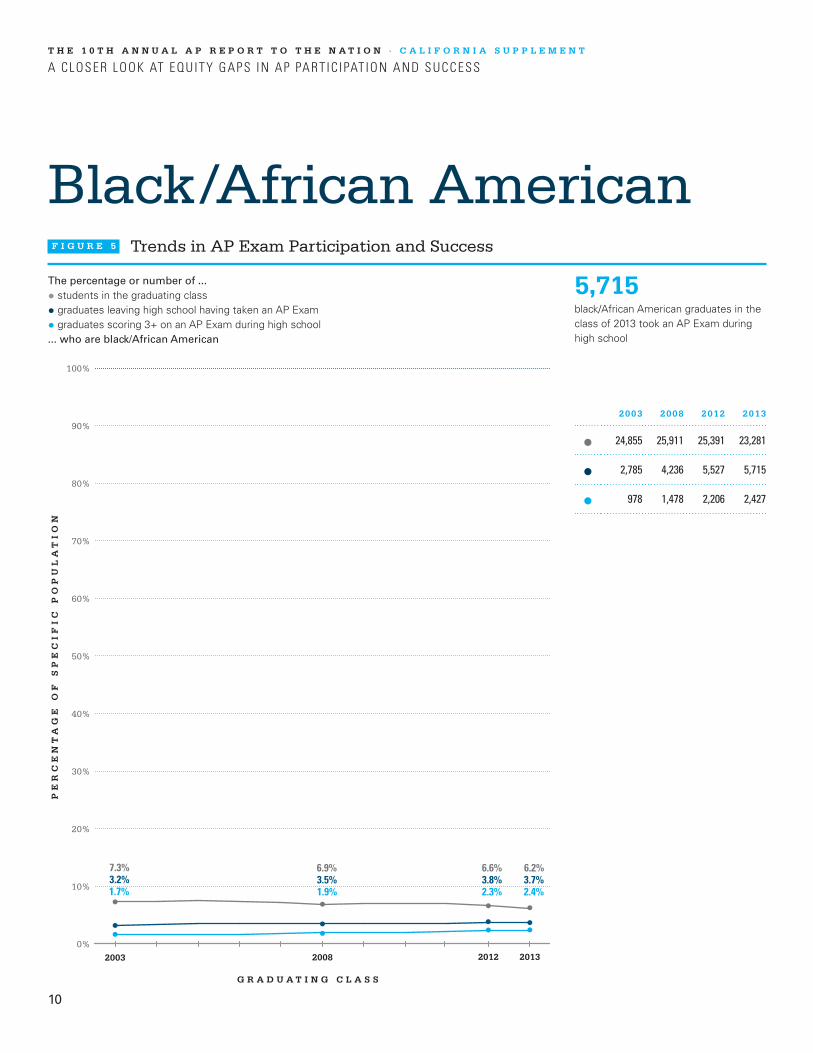
Black/African AmericanF I G U R E 5 Trends in AP Exam Participation and Success
5,715black/African American graduates in the class of 2013 took an AP Exam during high school
The percentage or number of ...
• students in the graduating class
• graduates leaving high school having taken an AP Exam
• graduates scoring 3+ on an AP Exam during high school... who are black/African American
2003 2008 2012 2013
24,855 25,911 25,391 23,281
2,785 4,236 5,527 5,715
978 1,478 2,206 2,427
2003 2008 2012 2013
PE
RC
EN
TA
GE
OF
SP
EC
IF
IC
PO
PU
LA
TI
ON
G R A D U A T I N G C L A S S
10%
20%
0%
30%
40%
50%
60%
70%
80%
90%
100%
7.3% 6.9% 6.6% 6.2%3.2% 3.5% 3.8% 3.7%1.7% 1.9% 2.3% 2.4%
11
T H E 1 0 T H A N N U A L A P R E P O R T T O T H E N A T I O N · C A L I F O R N I A S U P P L E M E N T
A CLOSER LOOK AT EQUITY GAPS IN AP PART IC IPAT ION AND SUCCESS
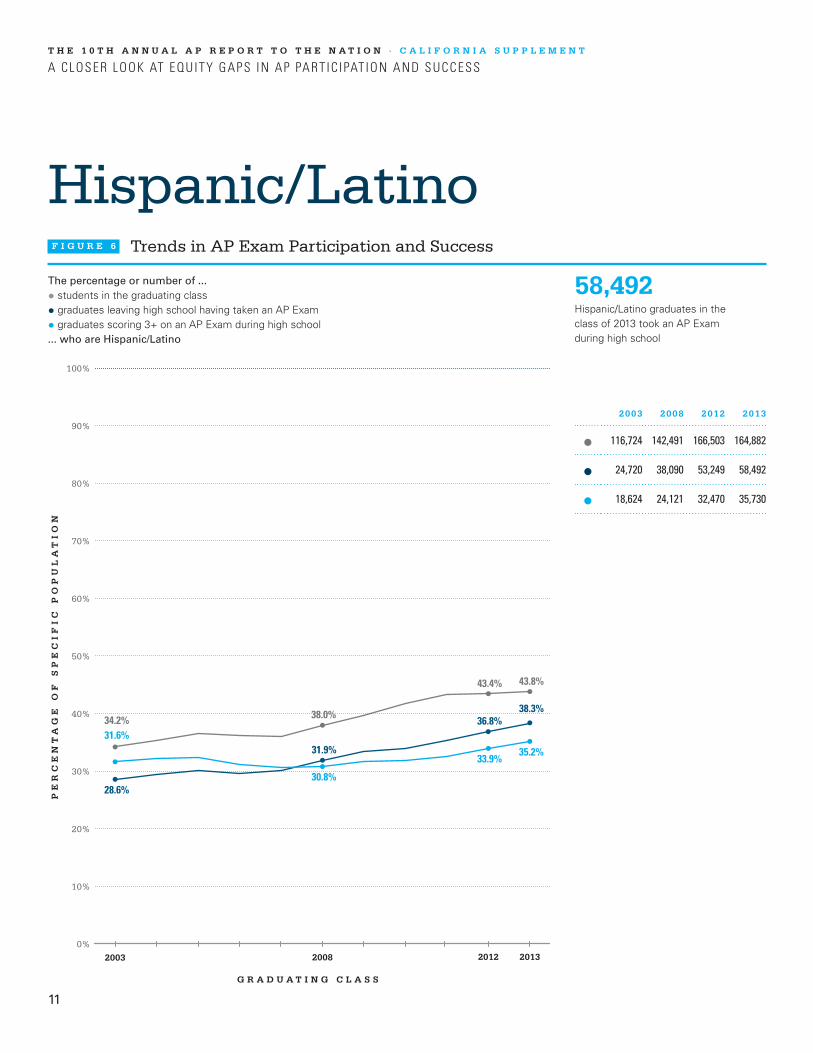
Hispanic/LatinoF I G U R E 6 Trends in AP Exam Participation and Success
58,492Hispanic/Latino graduates in the class of 2013 took an AP Exam during high school
The percentage or number of ...
• students in the graduating class
• graduates leaving high school having taken an AP Exam
• graduates scoring 3+ on an AP Exam during high school... who are Hispanic/Latino
2003 2008 2012 2013
116,724 142,491 166,503 164,882
24,720 38,090 53,249 58,492
18,624 24,121 32,470 35,730
2003 2008 2012 2013
PE
RC
EN
TA
GE
OF
SP
EC
IF
IC
PO
PU
LA
TI
ON
G R A D U A T I N G C L A S S
10%
20%
0%
30%
40%
50%
60%
70%
80%
90%
100%
34.2% 38.0%
43.4% 43.8%
28.6%
31.9%
36.8%38.3%
31.6%
30.8%
33.9%35.2%

12
T H E 1 0 T H A N N U A L A P R E P O R T T O T H E N A T I O N · C A L I F O R N I A S U P P L E M E N T
A CLOSER LOOK AT EQUITY GAPS IN AP PART IC IPAT ION AND SUCCESS
American Indian/ Alaska NativeF I G U R E 7 Trends in AP Exam Participation and Success
702American Indian/Alaska Native graduates in the class of 2013 took an AP Exam during high school
The percentage or number of ...
• students in the graduating class
• graduates leaving high school having taken an AP Exam
• graduates scoring 3+ on an AP Exam during high school... who are American Indian/Alaska Native
2003 2008 2012 2013
3,120 3,071 2,896 2,878
343 550 617 702
161 315 348 429
2003 2008 2012 2013
PE
RC
EN
TA
GE
OF
SP
EC
IF
IC
PO
PU
LA
TI
ON
G R A D U A T I N G C L A S S
10%
20%
0%
30%
40%
50%
60%
70%
80%
90%
100%
0.9% 0.8% 0.8% 0.8%0.4% 0.5% 0.4% 0.5%0.3% 0.4% 0.4% 0.4%
13
T H E 1 0 T H A N N U A L A P R E P O R T T O T H E N A T I O N · C A L I F O R N I A S U P P L E M E N T
A CLOSER LOOK AT EQUITY GAPS IN AP PART IC IPAT ION AND SUCCESS
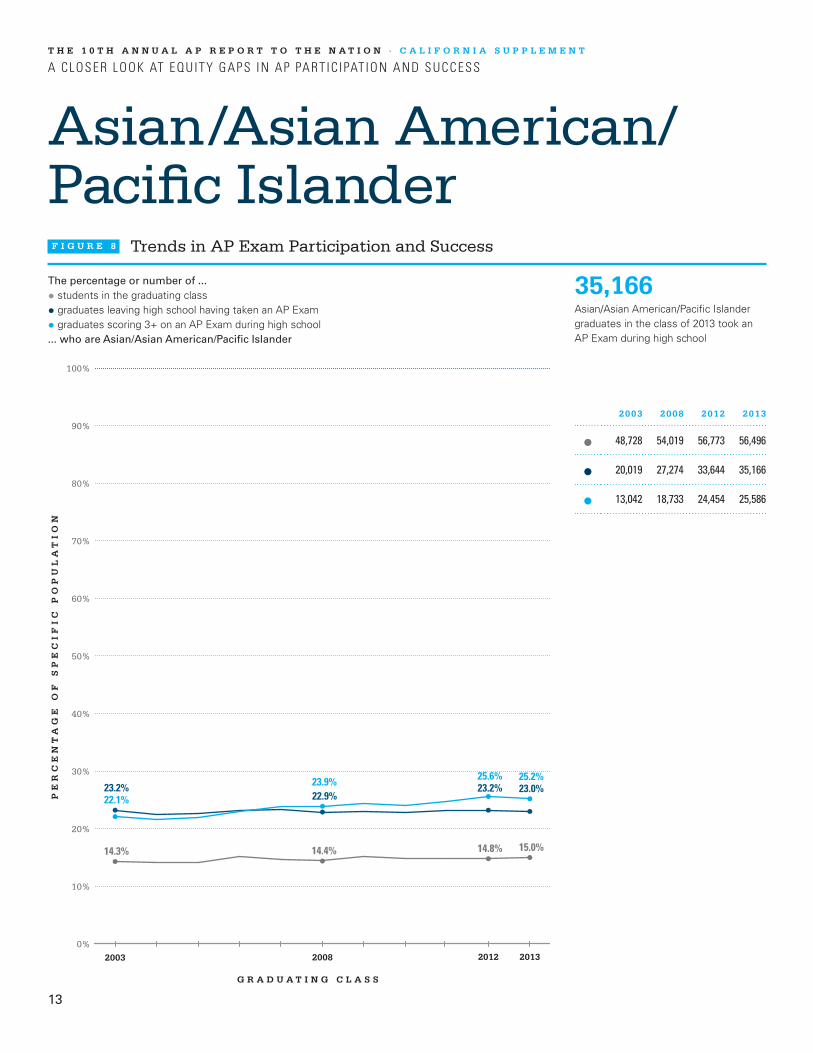
Asian/Asian American/ Pacific IslanderF I G U R E 8 Trends in AP Exam Participation and Success
35,166Asian/Asian American/Pacific Islander graduates in the class of 2013 took an AP Exam during high school
The percentage or number of ...
• students in the graduating class
• graduates leaving high school having taken an AP Exam
• graduates scoring 3+ on an AP Exam during high school... who are Asian/Asian American/Pacific Islander
2003 2008 2012 2013
48,728 54,019 56,773 56,496
20,019 27,274 33,644 35,166
13,042 18,733 24,454 25,586
2003 2008 2012 2013
PE
RC
EN
TA
GE
OF
SP
EC
IF
IC
PO
PU
LA
TI
ON
G R A D U A T I N G C L A S S
10%
20%
0%
30%
40%
50%
60%
70%
80%
90%
100%
14.3% 14.4% 14.8% 15.0%
23.2%22.9%
23.2% 23.0%22.1%
23.9% 25.6% 25.2%

14
T H E 1 0 T H A N N U A L A P R E P O R T T O T H E N A T I O N · C A L I F O R N I A S U P P L E M E N T
A CLOSER LOOK AT EQUITY GAPS IN AP PART IC IPAT ION AND SUCCESS
WhiteF I G U R E 9 Trends in AP Exam Participation and Success
43,392white graduates in the class of 2013 took an AP Exam during high school
The percentage or number of ...
• students in the graduating class
• graduates leaving high school having taken an AP Exam
• graduates scoring 3+ on an AP Exam during high school... who are white
2003 2008 2012 2013
144,664 141,011 126,050 121,735
31,746 39,080 41,069 43,392
21,798 27,521 29,985 31,927
2003 2008 2012 2013
PE
RC
EN
TA
GE
OF
SP
EC
IF
IC
PO
PU
LA
TI
ON
G R A D U A T I N G C L A S S
10%
20%
0%
30%
40%
50%
60%
70%
80%
90%
100%
42.4%
37.6%
32.8% 32.3%36.8%
32.7%
28.4% 28.4%
37.0% 35.1%
31.3% 31.5%

15
ABOUT THE COLLEGE BOARD
The College Board is a mission-driven not-for-profit
organization that connects students to college success
and opportunity. Founded in 1900, the College Board
was created to expand access to higher education.
Today, the membership association is made up of over
6,000 of the world’s leading educational institutions
and is dedicated to promoting excellence and equity in
education. Each year, the College Board helps more
than seven million students prepare for a successful
transition to college through programs and services in
college readiness and college success — including
the SAT®, and the Advanced Placement Program®. The
organization also serves the education community through
research and advocacy on behalf of students, educators,
and schools.
For further information, visit www.collegeboard.org.
© 2014 The College Board. College Board, Advanced Placement, Advanced Placement Program, AP, SAT and the acorn logo are registered trademarks of the College Board. AP Capstone and AP Potential are trademarks owned by the College Board. All other products and services may be trademarks of their respective owners. Visit the College Board on the Web: www.collegeboard.org.
apreport.collegeboard.org