ap statisticsfogertymath.pbworks.com/w/file/fetch/76581854/#4... · web viewstatistical inference...
TRANSCRIPT

AP Statistics
Review #4Statistical Inference
Name ___________________

AP Statistics Statistical Inference Review
IV. Statistical Inference: Estimating population parameters and testing hypotheses (30%-40%)Statistical inference guides the selection of appropriate models.
A. Estimation (point estimators and confidence intervals)
1. Estimating population parameters and margins of error
2. Properties of point estimators, including unbiasedness and variability
3. Logic of confidence intervals, meaning of confidence level and confidence intervals, and properties of confidence intervals.
4. Large sample confidence interval for a proportion
5. Large sample confidence interval for a difference between two Proportions
6. Confidence interval for a mean
7. Confidence interval for a difference between two means (unpaired and paired)
8. Confidence interval for the slope of a least-squares regression line
B. Test of significance
1. Logic of significance testing, null and alternative hypotheses; p-values;one- and two-sided tests
2. Concepts of Type I and Type II errors and concept of power
3. Large sample test for a proportion
4. Large sample test for a difference between two proportions
5. Test for a mean
6. Test for a difference between two means (unpaired and paired)
7. Chi-square test for goodness of fit, homogeneity of proportions and independence (one- and two-way tables)
8. Test for the slope of a least-squares regression line
Many of you have expressed confusion on getting some of the PANIC and PHANTOMS mixed up. Here is a quick review of the topics we’ve covered in Chapters 18-27.
Chapter 18 Sampling Distributions for Proportions: When we take multiple samples and find each sample’s p-
hat and graph them, we have created a sampling distribution for proportions. As long as certain conditions are met (namely randomness and at least 10 successes and 10 failures), we can use the Normal model to calculate a z-score and use our normal tables to find a probability of an event occurring. (Example from class: Coin Flipping Lab). From our formula sheet we know that:
Sampling Distributions for Means: When we take multiple samples and find each sample’s x-bar and graph them, we have created a sampling distribution for means. As long as certain conditions are met (namely randomness and either knowledge of Normality or the CLT when the sample size is large), we can use the Normal model to calculate a z-score and use our normal tables to find a probability of an event occurring. (Example from class: Rolling Dice). From our formula sheet we know that:
Chapter 19 When we have to estimate the standard deviation using sample data, then we have found the
“standard error”. A confidence interval is an estimate of the true population parameter (either proportions or means)
that is based on data collected from the population of interest. The margin of error (MoE) is the extent of the interval on either side of the sample statistic. The
MoE gives us a bit of leeway in our prediction. The general form of a CI:Sample Statistic +/- Margin of Error
When working with proportions data, we use the z* (infinity) line on the T-table. These values are called critical values.
PANIC PA
N
I
C
We are trying to estimate the true proportion of _____Randomization – either randomly chosen or randomly assigned10% condition – we’ve sampled less than 10% of the populationSuccess/Failure – we have at least 10 successes and 10 failuresIf the conditions are met, proceed with a 1-proportion z-interval
We are __% confident that the true proportion of _____ is between ___ and ___.
Using the TI for a 1-proportion z-interval - Stat:Tests:1-PropZInt Interpreting the confidence level… The “95% confidence” means that if we were take multiple
samples and calculate an interval for each sample, that approximately 95% of all of the intervals calculated would contain the true value. Nothing is special about THIS particular interval, the 95% is a long run probability about our method.
Be able to calculate a minimum sample size for a specific MoE. This is an algebra issue! If a previous value for p-hat isn’t given, then use 0.5 as a conservative estimate.
When we change the confidence level or the sample size, MoE changes. As the confidence level increases, the MoE also has to widen. As the sample size increases, the MoE gets smaller because a larger sample allows us to make more precise estimates.
Chapter 20
The mean of all the p-hats on the graph would equal the true proportion and the standard deviation of all the p-hats on the graph would equal the sq root of
pq/n
The mean of all the x-bars on the graph would equal the true population mean and the standard deviation
of all the x-bars on the graph would equal the true population standard deviation divided by square root
of n

When testing a hypothesis, we first have to determine our null and alternate hypotheses. The null hypothesis is a statement of “no difference, no change, nothing is going on.” The alternate hypothesis is a statement of change – either a decrease, an increase, or just plain ole different (not equal to)
When we make a decision about a hypothesis, we have to decide whether to reject the null hypothesis or not. After we’ve decided what our hypothesis is, we gather data and analyze it. If our data is consistent with the null (not far from what we expected), then we *do not reject Ho”. If our data is inconsistent with the null (really different from what we expected), then we *reject Ho”. When we reject the null, the probability of getting data like this is really low, so we say that the data indicates a “significant difference from what we expected.”
PHANTOMSP/H
A
NT
OM
S
Ho: p = ____ where p represents the true proportion of _____Ha: p <, >, ø ____Randomization – either randomly chosen or randomly assigned10% condition – we’ve sampled less than 10% of the populationSuccess/Failure – we have at least 10 successes and 10 failuresIf the conditions are met, proceed with a 1-proportion z-test
Obtain a p-value using our normal tables OR from your calculator.If the p-value is HIGH – do NOT reject HoIf the p-value is LOW – reject HoWe do/do not have evidence of _____
The p-value is a conditional probability. We start by assuming the null hypothesis is true – under this assumption, the p-value is the probability of obtaining similar data (or more extreme) IF the null is true. If the p-value is low, that indicates that data like this is rare when the Ho is true. *The p-value is NOT the probability of the null hypothesis being true!!!!*
One-sided vs. Two-sided – If we are testing less than (<) or greater than (>), we have a one-sided alternate. The p-value is then found using our normal tables. However, if we are testing “not equal to”, we have a two-sided alternate which means we have to take that one-sided pvalue and double it to account for both tails. If you are using the TI, the pvalue for a two sided test is automatically doubled and you don’t have to worry about it.
Be able to use your TI to run a 1-proportion z-test… Stat: Tests: 1propZTest A confidence interval can be used to test a hypothesis. If the null hypothesis is in the confidence
interval, we do NOT reject because the Ho is a plausible value. If the null hypothesis is NOT in the confidence interval, then we do reject Ho because it is outside our range of plausible values.
YOU CANNOT ACCEPT THE NULL HYPOTHESIS!!!!
Chapter 21 An Alpha level is also called the Significance Level of the test. Common alpha levels are 1%, 5%,
and 10%. The alpha level is the “cutoff” point for our p-value. A p-value that falls below alpha would lead to rejection of the null hypothesis and a p-value that is above the alpha level would not reject the null hypothesis.
Back before using calculators and computers, statisticians used the critical values from the T-table to help them make a decision about rejection. The critical value from the table was the “cutoff” point between the rejection region and the non-rejection region. If their test statistic (z-score) was more extreme than the critical value, then we would reject the null hypothesis.
Whenever we test a hypothesis, it is possible that we will make an error.o A Type I error is when we reject the null hypothesis and it was true – we take action and we
shouldn’t – we can control the Type I error because it is our alpha level.o A Type II error is when we don’t reject the null and it was false – we don’t take action and we
should – symbolically, a Type II error is called Betao The POWER of the test is when we reject the null and we were right! – we took action and we
were right – symbolically, the Power is 1-Beta There is a relationship between the Errors and Power. As we increase the alpha level (Type I error),
then the Type II error (beta) decreases, meaning that Power increases.

We would like a test with HIGH POWER.. that means we would like to make good decisions (DUH!). The easiest way to increase power and decrease our errors is to increase our sample size – KNOWLEDGE IS POWER!!
Power also increases the further apart the true value is from our hypothesized value.Chapter 22
PANIC PA
N
I
C
We are trying to estimate the true *difference* in the proportion of ____ between ____ and ____Randomization – either randomly chosen or randomly assigned – BOTH SAMPLES10% condition – we’ve sampled less than 10% of the population – BOTH SAMPLESSuccess/Failure – we have at least 10 successes and 10 failures – BOTH SAMPLESIndependent GroupsIf the conditions are met, proceed with a 2-proportion z-interval
We are __% confident that the true difference in the proportion of ____ between ___ and ___ lies within ____ and ____.
PHANTOMSP/H
ANT
OM
S
Ho: p1 = p2 where p1 and p2 represent the true proportion of _____Ha: p1 <, >, ø p2SAME AS ABOVEIf the conditions are met, proceed with a 2-proportion z-test
Obtain a p-value from your calculator.If the p-value is HIGH – do NOT reject HoIf the p-value is LOW – reject HoWe do/do not have evidence of _____
Be able to do the above PANIC and PHANTOMS using your TI – Stat: Tests: 2PropZTest or 2PropZInt Again, you can use a confidence interval to help you test a hypothesis. If the interval contains 0,
then there is no evidence of a difference between the groups. If the interval is all positive or all negative, then there is evidence that a difference exists.
Chapter 23 When working with means (quantitative data), you usually won’t know sigma (the population
standard deviation). In the rare chance that you DO know sigma (like when working with IQs or SAT data), you will use z-tests and intervals for means. However, a VAST majority of the time, you will NOT know sigma, so we have to do some extra estimating using S (the sample’s standard deviation). Since having this extra estimation means that we will have a little extra error, we can’t use the normal model, we have to use a model that allows for extra error. This model is called the T-distribution.
The T-distribution is a family of curves that is based on degrees of freedom. The T-distribution is still unimodal, symmetric, and bell-shaped, but it has much thicker “tails” than the Normal model. As the degrees of freedom increases (which is related to an increase in our sample size), the T-distribution looks more and more Normal-like.
When looking up a critical value on the table, make sure you use the DF line rather than the infinity line! For 1-sample means, the degrees of freedom is n-1. The table only goes through line 30 before it starts jumping around, so you can use the TSTAR program I gave you
PANIC PA
N
We are trying to estimate the true mean of ____Randomization – either randomly chosen or randomly assigned10% condition – we’ve sampled less than 10% of the populationNormality – Either we know the population was Normally distribution OR we have a large enough sample size (n>30) so that the Central Limit Theorem Applies OR we have the sample data and we *graph* it to check for normalityIf the conditions are met, proceed with a 1 sample t-interval with df = n-1

I
C We are __% confident that the true mean ____ is between ___ and ____
Be able to do the above PANIC using your TI – Stat: Tests: TIntervalChapter 23 (Cont)
Be able to calculate a minimum sample size for a specific MoE. This is an algebra issue! Since you don’t know the sample size, use the infinity line to get your critical value for your confidence level.
PHANTOMS P/H
A
NT
OM
S
Ho: mu = ____ where mu represents the true average of _____Ha: mu <, >, ø ____Randomization – either randomly chosen or randomly assigned10% condition – we’ve sampled less than 10% of the populationNormality – Either we know the population was Normally distribution OR we have a large enough sample size (n>30) so that the Central Limit Theorem Applies OR we have the sample data and we *graph* it to check for symmetry/outliersIf the conditions are met, proceed with a 1-sample t-test with df = n-1
Obtain a p-value using your calculator.If the p-value is HIGH – do NOT reject HoIf the p-value is LOW – reject HoWe do/do not have evidence of _____
Be able to do the above PHANTOMS using your TI – Stat: Tests: TTest
Chapter 24 PANIC
PA
N
I
C
We are trying to estimate the true *difference* in the mean ____ between ____ and ____Randomization – either randomly chosen or randomly assigned – BOTH SAMPLES10% condition – we’ve sampled less than 10% of the population – BOTH SAMPLESNormality – Either we know the population was Normally distribution OR we have a large enough sample size (n>30) so that the Central Limit Theorem Applies OR we have the sample data and we *graph* it to check for symmetry/outliers – BOTH SAMPLESIndependent GroupsIf the conditions are met, proceed with a 2-proportion t-interval with df coming from your TI
We are __% confident that the true difference in the mean ____ between ___ and ___ lies between ___ and ___
PHANTOMSP/H
ANT
OM
Ho: mu1 = mu2 where mu1 and mu2 represent the true average of _____Ha: mu1 <, >, ø mu2SAME AS ABOVEIf the conditions are met, proceed with a 2-proportion t-test with df coming from your TI
Obtain a p-value using your calculator.If the p-value is HIGH – do NOT reject Ho

S If the p-value is LOW – reject HoWe do/do not have evidence of _____
Be able to do the above PANIC and PHANTOMS using your TI – Stat:Tests:2sampTInt or 2sampTTest On your calculator, remember to always say NO to the Pooled? question. Again, you can use a confidence interval to help you test a hypothesis. If the interval contains 0,
then there is no evidence of a difference between the groups. If the interval is all positive or all negative, then there is evidence that a difference exists.
Chapter 25 In Chapter 24, one of the requirements of working with the 2 samples was that the data must be
independent groups. The reason for that was due to the standard deviations… Remember back in Chapter 16 that in order to combine two variables by adding or subtracting, we had to ADD the variances, but that ONLY worked for independent data…
However, not all data is independent. Sometimes we have dependent data, often called PAIRED data. Pairing actually allows us to do a much better job of seeing the differences between the data values because that difference becomes our focal point. Paired data occurs when we have data that is intentionally matched with a partner. Some examples of this would be a pre/post test, a taste test, etc. In a paired situation, we don’t really care about the two sets of data (the pre and the post test scores), we really want to know about the *differences* (or growth) between those two data values PER PERSON.
A Paired test or interval focuses on those differences only, so we really have a 1-sample t test or t-interval… we just have to write the start and finish a bit differently Do note that in a 2-sample test we want to know the “difference of the averages” but in a paired t-test we want to know the “average difference” – these are NOT the same thing!!!
PANIC PA
N
I
C
We are trying to estimate the true average *difference* of ____Paired Data – somehow matched/relatedRandomization – either randomly chosen or randomly assigned10% condition – we’ve sampled less than 10% of the populationNormality – Either we know the population was Normally distribution OR we have a large enough sample size (n>30) so that the Central Limit Theorem Applies OR we have the sample data and we *graph* it to check for symmetry/outliers (usually we have data– GRAPH the DIFFERENCES!!!)If the conditions are met, proceed with a paired t-interval with df = n-1
We are __% confident that the true mean difference of ____ is between ___ and ____ PHANTOMS
P/H
ANT
OM
S
Ho: mudiff = 0 where mu represents the true average of _____Ha: mudiff <, >, ø 0SAME AS ABOVEIf the conditions are met, proceed with a paired t-test with df = n-1
Obtain a p-value using your calculator.If the p-value is HIGH – do NOT reject HoIf the p-value is LOW – reject HoWe do/do not have evidence of _____
Be able to do the above PANIC and PHANTOMS using your TI – Stat: Tests: TInterval or TTest HUGE NOTE: When you subtract the two datasets to get your paired data, make sure you take note
of how you subtracted!!! For example, if I am analyzing your pre/post data for this class, I would probably want to do PostTest – PreTest so I would end up with positive values (a > test)… If I reversed that, I would have a < test.
Chapter 26

When working with categorical data that is provided in *counts*, then we have to use some new inference methods to deal with this data. This data must be in counts (like # of blue, orange, red, etc M&Ms), it cannot be in weights, percentages, etc. This type of data is measured using a Chi-Squared Distribution.
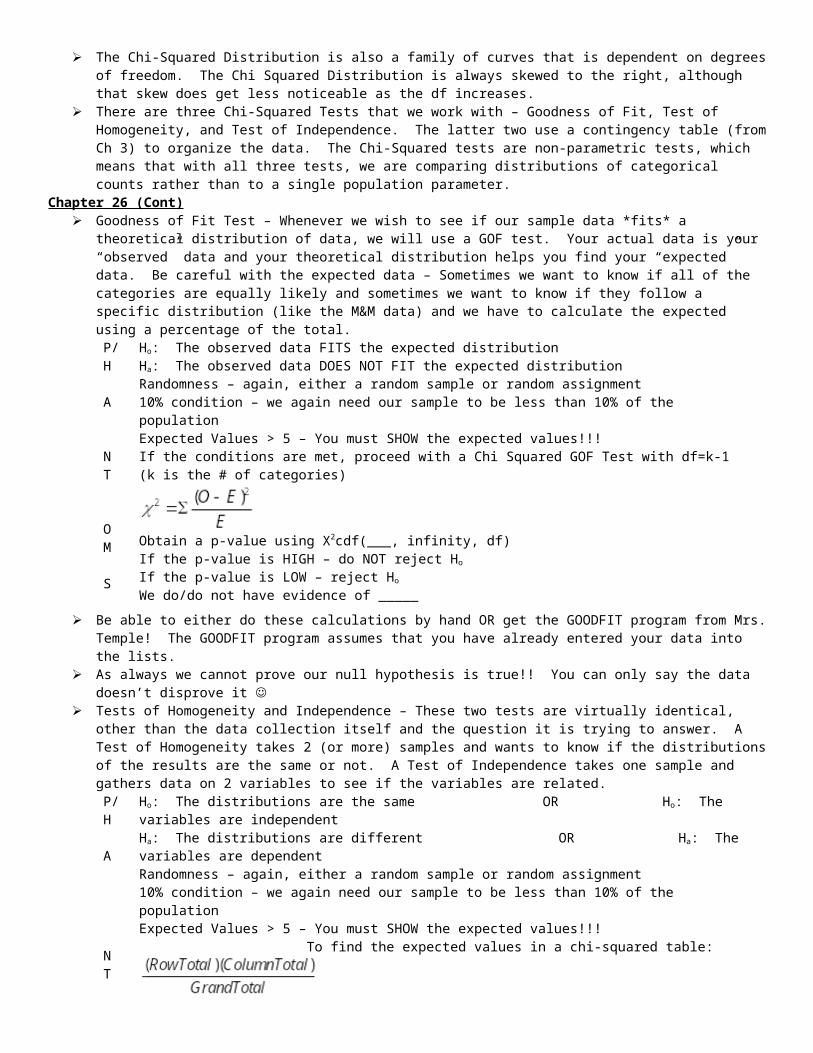
The Chi-Squared Distribution is also a family of curves that is dependent on degrees of freedom. The Chi Squared Distribution is always skewed to the right, although that skew does get less noticeable as the df increases.
There are three Chi-Squared Tests that we work with – Goodness of Fit, Test of Homogeneity, and Test of Independence. The latter two use a contingency table (from Ch 3) to organize the data. The Chi-Squared tests are non-parametric tests, which means that with all three tests, we are comparing distributions of categorical counts rather than to a single population parameter.
Chapter 26 (Cont) Goodness of Fit Test – Whenever we wish to see if our sample data *fits* a theoretical distribution
of data, we will use a GOF test. Your actual data is your “observed” data and your theoretical distribution helps you find your “expected” data. Be careful with the expected data – Sometimes we want to know if all of the categories are equally likely and sometimes we want to know if they follow a specific distribution (like the M&M data) and we have to calculate the expected using a percentage of the total.P/H
A
NT
OM
S
Ho: The observed data FITS the expected distributionHa: The observed data DOES NOT FIT the expected distributionRandomness – again, either a random sample or random assignment10% condition – we again need our sample to be less than 10% of the populationExpected Values > 5 – You must SHOW the expected values!!!If the conditions are met, proceed with a Chi Squared GOF Test with df=k-1 (k is the # of categories)
Obtain a p-value using X2cdf(___, infinity, df)If the p-value is HIGH – do NOT reject HoIf the p-value is LOW – reject HoWe do/do not have evidence of _____
Be able to either do these calculations by hand OR get the GOODFIT program from Mrs. Temple! The GOODFIT program assumes that you have already entered your data into the lists.
As always we cannot prove our null hypothesis is true!! You can only say the data doesn’t disprove it
Tests of Homogeneity and Independence – These two tests are virtually identical, other than the data collection itself and the question it is trying to answer. A Test of Homogeneity takes 2 (or more) samples and wants to know if the distributions of the results are the same or not. A Test of Independence takes one sample and gathers data on 2 variables to see if the variables are related.P/H
A
NT
OM
S
Ho: The distributions are the same OR Ho: The variables are independentHa: The distributions are different OR Ha: The variables are dependentRandomness – again, either a random sample or random assignment10% condition – we again need our sample to be less than 10% of the populationExpected Values > 5 – You must SHOW the expected values!!! To find the expected values in a chi-squared table:
If the conditions are met, proceed with a Chi Squared GOF Test with df=(#rows-1)(#columns-1)
Obtain a p-value using X2cdf(___, infinity, df) OR using your calculatorIf the p-value is HIGH – do NOT reject HoIf the p-value is LOW – reject HoWe do/do not have evidence of _____
Be able to do the above PHANTOMS using your TI – Enter your data into the matrix first!

Note: When choosing between the tests of Homogeneity or Independence, pay attention to the wording of the question!!! A test of Homogeneity would have words like “are they the same”, “is there evidence of a difference”, etc. A test of Independence would say things like “are the variables related”, “is there evidence of an association”, etc.
Chapter 27 When working with bivariate data (ordered pairs x, y), we can also test to see if there is a
relationship between the two variables. We’ve already explored scatterplots, regression lines, residual plots, etc in Chapters 7 and 8, so this chapter takes that information one step further and looks at the question of “Is there a statistically significant relationship between X and Y?”
Most of the time, in regression analysis, you will be given computer output, so make sure you look at your well-labeled regression output in your notes. When working with the computer output, you really want to focus on the slope line. That is the p-value you are interested in!
The S on the computer output refers to the standard deviation of the residuals. If this number is small, that indicates that the data isn’t very spread out. If s is large, the data is very scattered around the line.
Chapter 27 (Cont) Test for Slope – In a hypothesis test for the slope of a line, we are testing to see if a relationship exists.
P/H
A
NT
O
M
S
Ho: There is no linear relationship between X and Y (¼=0)Ha: There is a linear relationship between X and Y (could also be positive or negative) (¼ <,>,ø 0)Randomness – again, either a random sample or random assignmentLinearity of the scatterplot – do the points fit a fairly straight line?No pattern in the residuals – look at the residual plot*Note* Usually on the AP exam, it says “Assume the conditions necessary for inference are met”If the conditions are met, proceed with a t-test for slope with df=n-2
which is found on the computer output on the slope lineObtain a p-value using the computer output on the slope line – Remember that the computer output always uses a 2-sided pvalue, so you may need to divide by 2 if you are only doing > or <.If the p-value is HIGH – do NOT reject HoIf the p-value is LOW – reject HoWe do/do not have evidence of _____
We can also calculate an interval to estimate the true slope of the regression line.PA
NI
C
We wish to estimate the true slope of the line between X and Y (put in your context!!)Randomness – again, either a random sample or random assignmentLinearity of the scatterplot – do the points fit a fairly straight line?No pattern in the residuals – look at the residual plot*Note* Usually on the AP exam, it says “Assume the conditions necessary for inference are met”If the conditions are met, proceed with a t-interval for slope with df=n-2
slope and SE can be found on the computer output on the slope lineWe are ___% confident that the true slope of the line between X and Y is between ___ and ____.
In the rare case that you wish to do a t-test or t-interval for the slope by calculator rather than by using computer output, please see the instructions and screen shots in Chapter 27 of your textbook
2011B #5
2010 #5
2010 #3
2010 #5
2009B #3


2009 #5
2007 #4
2003 #5