ap statistics chapter 15: chapter 15: probability rules unit 4
TRANSCRIPT

AP Statistics
CHAPTER 15: PROBABILITY RULES
Unit 4

When two events A and B are disjoint, we can use the addition rule for disjoint events from Chapter 14:
P(A B) = P(A) + P(B)
However, when our events are not disjoint (not mutually exclusive), this earlier addition rule will double count the probability of both A and B occurring. Thus, we need the General Addition Rule.
Let’s look at a picture…
THE GENERAL ADDITION RULE

General Addition Rule: For any two events A and B,
P(A B) = P(A) + P(B) – P(A B)
The following Venn diagram shows a situation in which we would use the general addition rule:
THE GENERAL ADDITION RULE
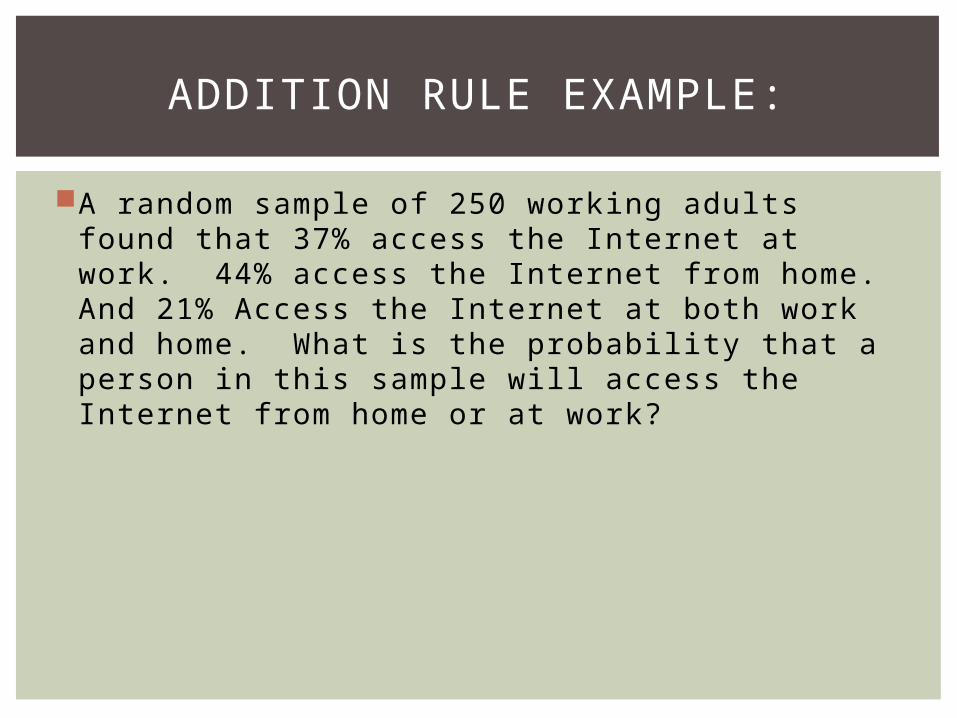
A random sample of 250 working adults found that 37% access the Internet at work. 44% access the Internet from home. And 21% Access the Internet at both work and home. What is the probability that a person in this sample will access the Internet from home or at work?
ADDITION RULE EXAMPLE:

Below is a Venn Diagram of a sample of 200 women who l ike yoga to re l ieve stress and who l ike running to re l ieve stress.
What is the probability that a woman likes running?
What is the probability that a woman likes running, but doesn’t like yoga?
What is the probability that a woman doesn’t like yoga and doesn’t like running?
What is the probability that a woman will like running or yoga, but not both?
ADDITION RULE EXAMPLE 2:
Running
0.25
Yoga
0.480.12

Back in Chapter 3, we looked at contingency tables and talked about conditional distributions.
When we want the probability of an event from a conditional distribution, we write P(B|A) and pronounce it “the probability of B given A.”
A probability that takes into account a given condition is called a conditional probability.
CONDITIONAL PROBABILITIES

To find the probability of the event B given the event A, we restrict our attention to the total outcomes in A. We then find the fraction of those outcomes in B that also occurred.
Note: P(A) cannot equal 0, since we know that A has occurred.
CONDITIONAL PROBABILITIES (CONT.)
P(B|A)P(A B)P(A)
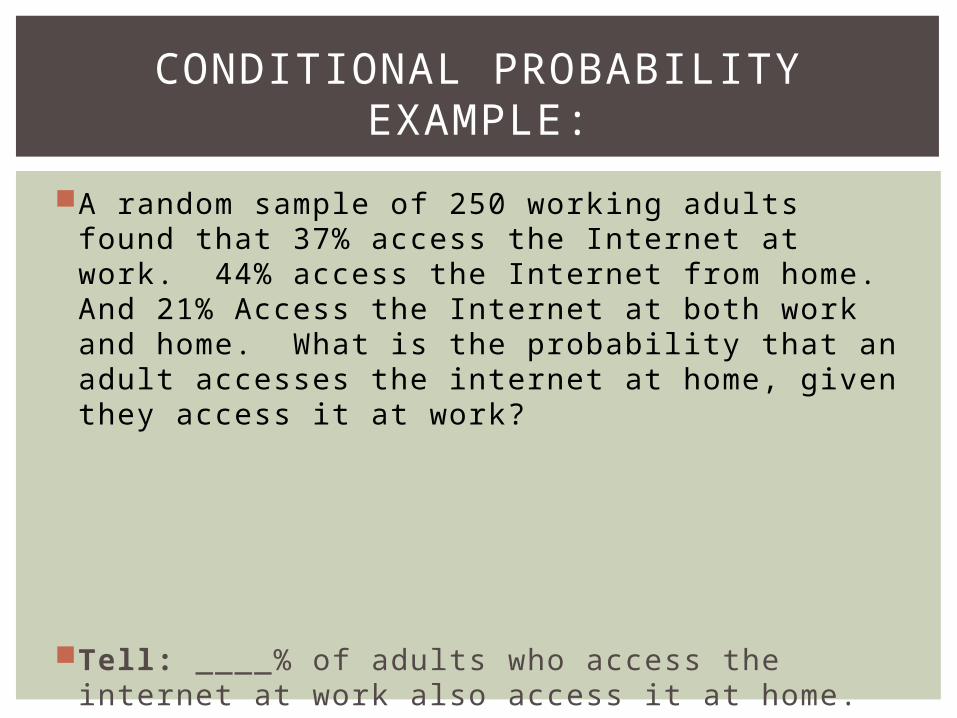
A random sample of 250 working adults found that 37% access the Internet at work. 44% access the Internet from home. And 21% Access the Internet at both work and home. What is the probability that an adult accesses the internet at home, given they access it at work?
Tell: ____% of adults who access the internet at work also access it at home.
CONDITIONAL PROBABILITY EXAMPLE:

When two events A and B are independent, we can use the multiplication rule for independent events from Chapter 14:
P(A B) = P(A) x P(B)
However, when our events are not independent, this earlier multiplication rule does not work. Thus, we need the General Multiplication Rule.
THE GENERAL MULTIPLICATION RULE
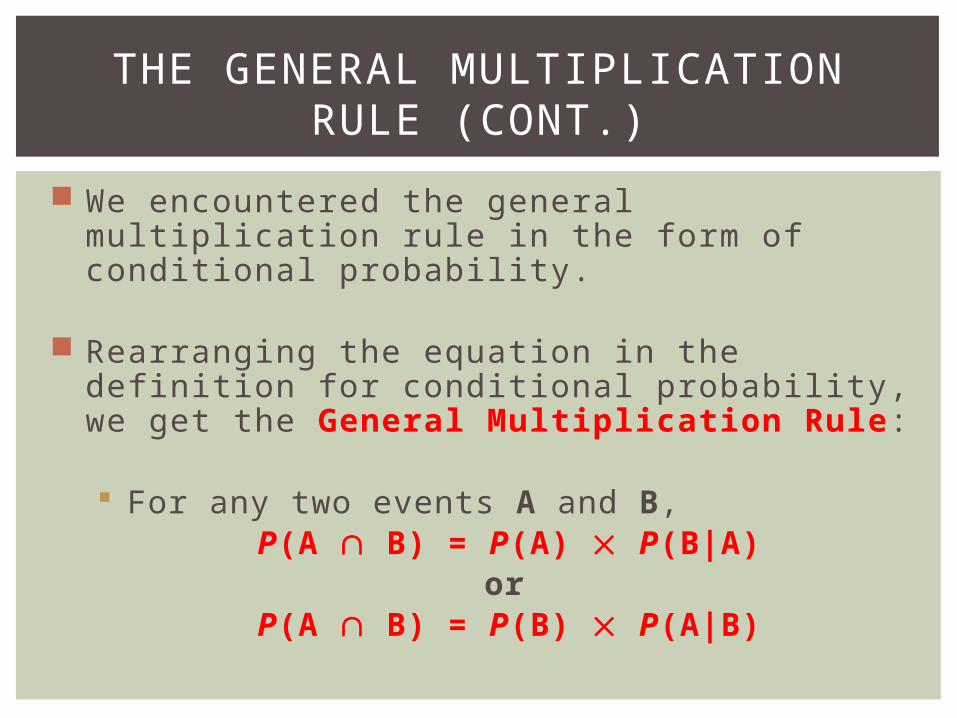
We encountered the general multiplication rule in the form of conditional probability.
Rearranging the equation in the definition for conditional probability, we get the General Multiplication Rule:
For any two events A and B, P(A B) = P(A) P(B|A)
orP(A B) = P(B) P(A|B)
THE GENERAL MULTIPLICATION RULE (CONT.)

Independence of two events means that the outcome of one event does not influence the probability of the other.
With our new notation for conditional probabilities, we can now formalize this definition:
Events A and B are independent whenever P(B|A) = P(B). (Equivalently, events A and
B are independent whenever P(A|B) = P(A).)
INDEPENDENCE

Earlier it was mentioned that 37% of working adults access the Internet at work. 44% access the Internet from home. And 21% Access the Internet at both work and home. Are accessing the internet from work and accessing
the internet from work independent? Are they disjoint?
INDEPENDENCE EXAMPLE:

Disjoint events cannot be independent! Well, why not?
Since we know that disjoint events have no outcomes in common, knowing that one occurred means the other didn’t.
Thus, the probability of the second occurring changed based on our knowledge that the first occurred.
It follows, then, that the two events are not independent.
Consider 2 disjoint events: getting an A in this course and getting a B in this course. These are disjoint because they have nothing in common. However, if you did earn an A in the course, does the affect your probability of earning a B? YES! Your probability of earning a B in the course is now 0. It cannot happen.
A common error is to treat disjoint events as if they were independent, and apply the Multiplication Rule for independent events—don’t make that mistake.
INDEPENDENT ≠ DISJOINT

The AAPOR is an association of about 1600 individuals who share an interest in public opinion and survey research. They report that typically as few as 10% of random phone calls result in a completed interview. Reasons are varied, but some of the most common include no answer, refusal to cooperate, and failure to complete the call.
Which of the following events are disjoint, independent, or neither?
A = Your phone # is randomly selected. B = You’re not at home at dinnertime when they call.
A = As a selected subject, you complete the interview. B = As a selected subject, you refuse to cooperate.
A = You are not at home when they call at 11 AM. B = You are employed full time.
EXAMPLES: INDEPENDENCE VS. DISJOINT
It’s much easier to think about independent events than to deal with conditional probabilities.
It seems that most people’s natural intuition for probabilities breaks down when it comes to conditional probabilities.
Don’t fall into this trap: whenever you see probabilities multiplied together, stop and ask whether you think they are really independent.
DEPENDING ON INDEPENDENCE

I t i s much eas ier to see condit ional probabi l i t ies us ing cont ingency tables :
•F ind the p robab i l i t y tha t a s tudent i s a ma le .
•F ind the p robab i l i t y tha t a s tudent i s no t a nurs ing ma jor.
•F ind the p robab i l i t y tha t a s tudent i s a female , g iven the s tudent i s a nurs ing ma jor.
•F ind the p robab i l i t y the s tudent i s ma le or a nurs ing ma jor.
•F ind the p robab i l i t y the s tudent i s female and no t a nurs ing ma jor.
TABLES AND CONDITIONAL PROBABILITIES
Nursing majors Non-Nursing Majors Total
Males 95 1015 1110
Females 700 1727 2427
Total 795 2742 3537

Create a contingency table for the following samples of textbook pages: 48% of pages had a data display 27% of pages had an equation 7% had both a data display and an equation
CREATE A CONTINGENCY TABLE

What is the probability that a randomly selected sample page with an equation also had a data display?
Are having an equation and have a data display disjoint events?
Are having an equation and having a data display independent events?
USING THE TABLE DETERMINE THE FOLLOWING:

Sampling without replacement means that once one individual is drawn it doesn’t go back into the pool.
We often sample without replacement, which doesn’t matter too much when we are dealing with a large population.
However, when drawing from a small population, we need to take note and adjust probabilities accordingly.
Drawing without replacement is just another instance of working with conditional probabilities.
DRAWING WITHOUT REPLACEMENT

In a box of cupcakes, there are five cupcakes with red icing, 4 with yellow icing, and 3 with green icing. If 2 of the cupcakes are randomly selected from the box (no peeking to see which color ), what is the probability that the fi rst cupcake has red icing and the second cupcake has green icing? What about the probability that the fi rst has red icing and the second has red icing? (The fi rst cupcake is not replaced before the second cupcake is selected).
DRAWING WITHOUT REPLACEMENT EXAMPLE

A tree diagram helps us think through conditional probabilities by showing sequences of events as paths that look like branches of a tree.
Making a tree diagram for situations with conditional probabilities is consistent with our “make a picture” mantra.
TREE DIAGRAMS

Figure 15.5 is a nice example of a tree diagram and shows how we multiply the probabilities of the branches together.
All the final outcomes are disjoint and must add up to one.
We can add the final probabilities to find probabilities of compound events.
TREE DIAGRAMS (CONT.)

What is the probability that a randomly selected student will be a binge drinker who has an alcohol related car accident?
What is the probability that a selected student has had an alcohol related car accident?
EXAMPLE USING TREE DIAGRAM

Reversing the conditioning of two events is rarely intuitive.
Suppose we want to know P(A|B), and we know
only P(A), P(B), and P(B|A).
We also know P(A B), since P(A B) = P(A) x P(B|A)
From this information, we can find P(A|B):
REVERSING THE CONDITIONING
P(A|B)P(A B)P(B)

Don’t use a simple probability rule where a general rule is appropriate: Don’t assume that two events are
independent or disjoint without checking that they are.
Don’t find probabilities for samples drawn without replacement as if they had been drawn with replacement.
Don’t reverse conditioning naively.
Don’t confuse “disjoint” with “independent.”
WHAT CAN GO WRONG?

The probability rules from Chapter 14 only work in special cases—when events are disjoint or independent.
We now know the General Addition Rule and General Multiplication Rule.
We also know about conditional probabilities and that reversing the conditioning can give surprising results.
RECAP

Venn diagrams, tables, and tree diagrams help organize our thinking about probabilities.
We now know more about independence—a sound understanding of independence will be important throughout the rest of this course.
RECAP (CONT.)

Day 1: # 1, 9, 13, 19, 31
Day 2: # 2, 6, 8, 12, 15, 23, 27, 33, 35
Day 3: # 4, 10, 16, 17, 21, 25, 29, 41
ASSIGNMENTS: PP. 361 – 365