apes climate change - wikispacesshswhitson.wikispaces.com/file/view/apes climate change.pdf... · 1...
TRANSCRIPT

1
APES January 6, 2011APES January 6, 2011
1) Climate Change and Ozone1) Climate Change and OzoneDepletionDepletion2) Practice AP Questions2) Practice AP Questions3) Vocabulary Words Due3) Vocabulary Words Due
tomorrow.tomorrow.
Chapter 20Chapter 20
Climate Change andClimate Change andOzone DepletionOzone Depletion
Chapter Overview QuestionsChapter Overview Questions
How have the earthHow have the earth’’s temperature ands temperature andclimate changed in the past?climate changed in the past?
How might the earthHow might the earth’’s temperature change ins temperature change inthe future?the future?
What factors influence the earthWhat factors influence the earth’’s averages averagetemperature?temperature?
What are some possible beneficial andWhat are some possible beneficial andharmful effects of a warmer earth?harmful effects of a warmer earth?
Chapter Overview Questions (contChapter Overview Questions (cont’’d)d)
How can we slow projected increases in theHow can we slow projected increases in theearthearth’’s temperature or adapt to suchs temperature or adapt to suchchanges?changes?
How have human activities depleted ozone inHow have human activities depleted ozone inthe stratosphere, and why should we care?the stratosphere, and why should we care?
Core Case Study: Studying a VolcanoCore Case Study: Studying a Volcanoto Understand Climate Changeto Understand Climate Change
NASA scientistNASA scientistcorrectly predictedcorrectly predictedthat the 1991that the 1991Philippines explosionPhilippines explosionwould cool thewould cool theaverage temperatureaverage temperatureof the earth by 0.5Cof the earth by 0.5Coo
over a 15 monthover a 15 monthperiod and then returnperiod and then returnto normal by 1995.to normal by 1995.
Figure 20Figure 20--11
Core Case Study: Studying a VolcanoCore Case Study: Studying a Volcanoto Understand Climate Changeto Understand Climate Change
The NASA model was correct.The NASA model was correct.
The success convince scientists and policyThe success convince scientists and policymakers that climate model projections should bemakers that climate model projections should betaken seriously.taken seriously.
Other climate models have shown that globalOther climate models have shown that globaltemperatures are likely to rise several degreestemperatures are likely to rise several degreesduring this century.during this century.

2
PAST CLIMATE AND THEPAST CLIMATE AND THEGREENHOUSE EFFECTGREENHOUSE EFFECT
Over the past 900,000 years, the troposphereOver the past 900,000 years, the tropospherehas experienced prolonged periods of globalhas experienced prolonged periods of globalcooling and global warming.cooling and global warming.
For the past 1,000 years, temperatures haveFor the past 1,000 years, temperatures haveremained fairly stable but began to riseremained fairly stable but began to riseduring the last century.during the last century.
PAST CLIMATE AND THEPAST CLIMATE AND THEGREENHOUSE EFFECTGREENHOUSE EFFECT
Figure 20Figure 20--22
Fig. 20-2a, p. 465
Thousands of years ago
Average temperature over past 900,000 years
Ave
rag
es
urf
ace
tem
pe
ratu
re(°
C)
Fig. 20-2b, p. 465
Ave
rag
es
urf
ace
tem
pe
ratu
re(°
C)
Year
Average temperature over past 130 years
Fig. 20-2c, p. 465
Average temperature over past10,000 years = 15°C (59°F)
Te
mp
era
ture
ch
an
ge
(C°
)
Temperature change over past 22,000 years
Agriculture established
End oflast iceage
Years ago
Fig. 20-2d, p. 465
Te
mp
era
ture
ch
an
ge
(C°
)
Temperature change over past 1,000 years
Year

3
How Do We Know WhatHow Do We Know WhatTemperatures Were in the Past?Temperatures Were in the Past?
Scientists analyzeScientists analyzetiny air bubblestiny air bubblestrapped in ice corestrapped in ice coreslearn about past:learn about past: tropospheretroposphere
compositioncomposition..
temperature trendstemperature trends..
greenhouse gasgreenhouse gasconcentrationsconcentrations..
solarsolar,, snowfallsnowfall, and, andforest fire activityforest fire activity..
Figure 20Figure 20--33
How Do We Know WhatHow Do We Know WhatTemperatures Were in the Past?Temperatures Were in the Past?
In 2005, an ice coreIn 2005, an ice coreshowed that COshowed that CO22
levels in thelevels in thetroposphere are thetroposphere are thehighest they havehighest they havebeen in 650,000been in 650,000years.years.
Figure 20Figure 20--44
Fig. 20-4, p. 466
Co
nc
en
tra
tio
no
fc
arb
on
dio
xid
ein
the
atm
os
ph
ere
(pp
m)
Va
ria
tio
no
fte
mp
era
ture
(C°
)fr
om
cu
rre
nt
lev
el
Thousands of years before present
End oflast ice age
Temperaturechange
Carbon dioxide
The Natural Greenhouse EffectThe Natural Greenhouse Effect
Three major factors shape the earthThree major factors shape the earth’’ssclimate:climate:
The sun.The sun.
Greenhouse effect that warms the earthGreenhouse effect that warms the earth’’s lowers lowertroposphere and surface because of thetroposphere and surface because of thepresence ofpresence of greenhouse gasesgreenhouse gases..
Oceans store COOceans store CO22 and heat, evaporate andand heat, evaporate andreceive water, move stored heat to other parts ofreceive water, move stored heat to other parts of
the world.the world.
Natural cooling process through water vapor inNatural cooling process through water vapor inthe troposphere (heat rises).the troposphere (heat rises).
Major Greenhouse GasesMajor Greenhouse Gases
The major greenhouse gases in the lowerThe major greenhouse gases in the loweratmosphere are water vapor, carbon dioxide,atmosphere are water vapor, carbon dioxide,methane, and nitrous oxide.methane, and nitrous oxide.
These gases have always been present in theThese gases have always been present in theearthearth’’s troposphere in varying concentrations.s troposphere in varying concentrations.
Fluctuations in these gases, plus changes inFluctuations in these gases, plus changes insolar output are the major factors causing thesolar output are the major factors causing the
changes inchanges in tropospherictropospheric temperature over thetemperature over thepast 400,000 years.past 400,000 years.
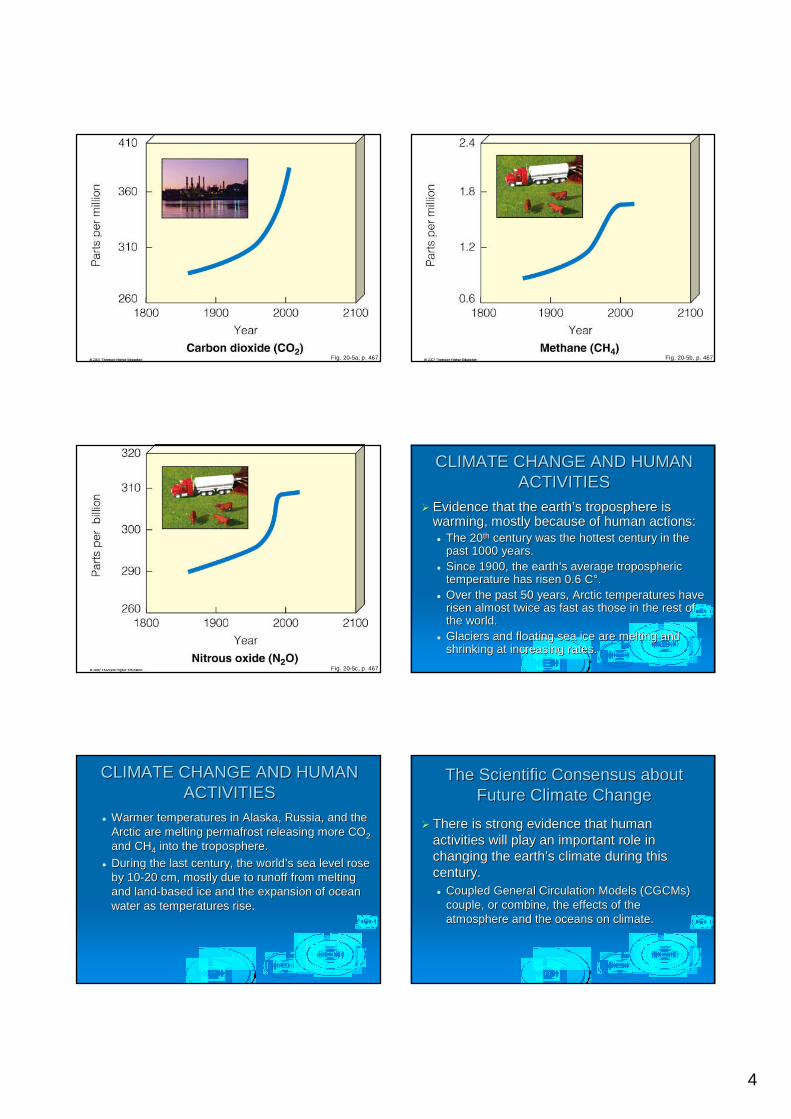
Major GreenhouseMajor GreenhouseGasesGases
Increases in averageIncreases in averageconcentrations of threeconcentrations of threegreenhouse gases in thegreenhouse gases in thetroposphere between 1860troposphere between 1860and 2004, mostly due toand 2004, mostly due tofossil fuel burning,fossil fuel burning,deforestation, anddeforestation, andagriculture.agriculture.
Figure 20Figure 20--55
4
Fig. 20-5a, p. 467 Fig. 20-5b, p. 467
Fig. 20-5c, p. 467
CLIMATE CHANGE AND HUMANCLIMATE CHANGE AND HUMANACTIVITIESACTIVITIES
Evidence that the earthEvidence that the earth’’s troposphere iss troposphere iswarming, mostly because of human actions:warming, mostly because of human actions: The 20The 20thth century was the hottest century in thecentury was the hottest century in the
past 1000 years.past 1000 years.
Since 1900, the earthSince 1900, the earth’’s averages average tropospherictropospherictemperature has risen 0.6 Ctemperature has risen 0.6 C°°..
Over the past 50 years, Arctic temperatures haveOver the past 50 years, Arctic temperatures haverisen almost twice as fast as those in the rest ofrisen almost twice as fast as those in the rest ofthe world.the world.
Glaciers and floating sea ice are melting andGlaciers and floating sea ice are melting andshrinking at increasing rates.shrinking at increasing rates.
CLIMATE CHANGE AND HUMANCLIMATE CHANGE AND HUMANACTIVITIESACTIVITIES
Warmer temperatures in Alaska, Russia, and theWarmer temperatures in Alaska, Russia, and the
Arctic are melting permafrost releasing more COArctic are melting permafrost releasing more CO22
and CHand CH44 into the troposphere.into the troposphere.
During the last century, the worldDuring the last century, the world’’s sea level roses sea level roseby 10by 10--20 cm, mostly due to runoff from melting20 cm, mostly due to runoff from meltingand landand land--based ice and the expansion of oceanbased ice and the expansion of ocean
water as temperatures rise.water as temperatures rise.
The Scientific Consensus aboutThe Scientific Consensus aboutFuture Climate ChangeFuture Climate Change
There is strong evidence that humanThere is strong evidence that humanactivities will play an important role inactivities will play an important role inchanging the earthchanging the earth’’s climate during thiss climate during thiscentury.century.
Coupled General Circulation Models (Coupled General Circulation Models (CGCMsCGCMs))couple, or combine, the effects of thecouple, or combine, the effects of theatmosphere and the oceans on climate.atmosphere and the oceans on climate.

5
CGCM of the EarthCGCM of the Earth’’s Climates Climate
SimplifiedSimplifiedmodel of majormodel of majorprocesses thatprocesses thatinteract tointeract todetermine thedetermine theaverageaveragetemperaturetemperatureand greenhouseand greenhousegas content ofgas content ofthethetroposphere.troposphere.
Figure 20Figure 20--66 Fig. 20-6, p. 469
Troposphere
Coolingfromincrease
AerosolsWarmingfromdecrease
Green-housegases
CO2removalby plantsandsoilorganisms
CO2 emissionsfrom landclearing,fires, and decay
Heat andCO2emissions
Heat andCO2 removal
Deep ocean
Long-termstorage
Land and soil biotoa
Natural and human emissions
Shallow ocean
Sun
Ice and snow cover
Sun
Stepped Art
Aerosols
Greenhousegases
Warmingfrom
decrease
Coolingfrom
increase
CO2 removalby plants and
soil organisms
CO2 emissionsfrom land
cleaning, fires,and decay
Heat andCO2 removal
Heat andCO2 emissions
Ice and snow cover
Natural and human emissions
Land and soil biotoa
Long-termstorage
Deep ocean
Shallow ocean
Troposphere
Fig. 20-6, p. 469
The Scientific Consensus aboutThe Scientific Consensus aboutFuture Climate ChangeFuture Climate Change
Measured andMeasured andprojected changesprojected changesin the averagein the averagetemperature of thetemperature of theatmosphere.atmosphere.
Figure 20Figure 20--77
Fig. 20-7, p. 470
Why Should We Be Concerned aboutWhy Should We Be Concerned abouta Warmer Earth?a Warmer Earth?
A rapid increase in the temperature of theA rapid increase in the temperature of thetroposphere during this century would give ustroposphere during this century would give uslittle time to deal with its harmful effects.little time to deal with its harmful effects.
As a prevention strategy scientists urge to cutAs a prevention strategy scientists urge to cutglobal COglobal CO22 emissions in half over the next 50emissions in half over the next 50years.years.
This could prevent changes in the earthThis could prevent changes in the earth’’s climates climatesystem that would last for tens of thousands ofsystem that would last for tens of thousands ofyears.years.

6
FACTORS AFFECTING THEFACTORS AFFECTING THEEARTHEARTH’’S TEMPERATURES TEMPERATURE
Some factors can amplify (positive feedback)Some factors can amplify (positive feedback)and some can dampen (negative feedback)and some can dampen (negative feedback)projected global warming.projected global warming.
There is uncertainty about how much COThere is uncertainty about how much CO22
and heat the oceans can remove from theand heat the oceans can remove from thetroposphere and how long the heat and COtroposphere and how long the heat and CO22
might remain there.might remain there.
Warmer temperatures create more cloudsWarmer temperatures create more cloudsthat could warm or cool the troposphere.that could warm or cool the troposphere.
Effects of HigherEffects of HigherCOCO22 Levels on PhotosynthesisLevels on Photosynthesis
Increased COIncreased CO22 in the troposphere canin the troposphere canincrease plant photosynthesis (PS) but:increase plant photosynthesis (PS) but: The increase in PS would slow as the plantsThe increase in PS would slow as the plants
reach maturity.reach maturity.
Carbon stored by the plants would be returned toCarbon stored by the plants would be returned tothe atmosphere as COthe atmosphere as CO22 when the plants die.when the plants die.
Increased PS decreases the amount of carbonIncreased PS decreases the amount of carbonstored in the soil.stored in the soil.
Tree growth may temporarily slow COTree growth may temporarily slow CO22 emissionsemissionsin the S. Hemisphere but is likely to increase COin the S. Hemisphere but is likely to increase CO22
emissions in the N. Hemisphere.emissions in the N. Hemisphere.
FACTORS AFFECTING THEFACTORS AFFECTING THEEARTHEARTH’’S TEMPERATURES TEMPERATURE
Aerosol and soot pollutants produced byAerosol and soot pollutants produced byhuman activities can warm or cool thehuman activities can warm or cool theatmosphere, but such effects will decreaseatmosphere, but such effects will decreasewith any decline in outdoor air pollution.with any decline in outdoor air pollution.
Warmer air can release methane gas storedWarmer air can release methane gas storedin bogs, wetlands, and tundra soils andin bogs, wetlands, and tundra soils andaccelerate global warming.accelerate global warming.
EFFECTS OF GLOBAL WARMINGEFFECTS OF GLOBAL WARMING
A warmer climate would have beneficial andA warmer climate would have beneficial andharmful effects but poor nations in the tropicsharmful effects but poor nations in the tropicswould suffer the most.would suffer the most.
Some of the worldSome of the world’’s floating ice and lands floating ice and land--based glaciers are slowly melting and arebased glaciers are slowly melting and arehelping warm the troposphere by reflectinghelping warm the troposphere by reflectingless sunlight back into space.less sunlight back into space.
EFFECTS OF GLOBAL WARMINGEFFECTS OF GLOBAL WARMING
Between 1979 and 2005, average Arctic seaBetween 1979 and 2005, average Arctic seaice dropped 20% (as shown in blue huesice dropped 20% (as shown in blue huesabove).above).
Figure 20Figure 20--88 Fig. 20-8, p. 474
Russia
Northpole
Greenland
Canada
Alaska (U.S.)
*

7
Rising Sea LevelsRising Sea Levels
During this centuryDuring this centuryrising seas levelsrising seas levelsare projected toare projected toflood lowflood low--lying urbanlying urbanareas, coastalareas, coastalestuaries, wetlands,estuaries, wetlands,coral reefs, andcoral reefs, andbarrier islands andbarrier islands andbeaches.beaches.
Figure 20Figure 20--1010 Fig. 20-10, p. 475
High ProjectionNew Orleans,Shanghai, andother low-lyingcities largelyunderwater
Year
Low Projection
MediumProjection
More than a third ofU.S. wetlands underwaterM
ea
nS
ea
-Lev
elR
ise
s(c
en
tim
ete
rs)
Rising Sea LevelsRising Sea Levels
Changes in average sea level over the pastChanges in average sea level over the past250,000 years based on data from ocean250,000 years based on data from oceancores.cores.
Figure 20Figure 20--99 Fig. 20-9, p. 475
He
igh
ta
bo
ve
or
be
low
pre
se
nt
sea
leve
l(m
ete
rs)
Today’s sea level
Years before present Present
He
igh
ta
bo
ve
or
be
low
pre
se
nt
sea
leve
l(f
ee
t)
Rising Sea LevelsRising Sea Levels
If seas levelsIf seas levelsrise by 9rise by 9--88cm88cmduring thisduring thiscentury, most ofcentury, most ofthe Maldivesthe Maldivesislands and theirislands and theircoral reefs willcoral reefs willbe flooded.be flooded.
Figure 20Figure 20--1111
Changing Ocean CurrentsChanging Ocean Currents
Global warming could alter ocean currentsGlobal warming could alter ocean currentsand cause both excessive warming andand cause both excessive warming andsevere cooling.severe cooling.
Figure 20Figure 20--1212

8
Fig. 20-12, p. 476
Warm, shallowcurrent
Cold, salty,deep current
EFFECTS OF GLOBAL WARMINGEFFECTS OF GLOBAL WARMING
A warmer troposphere can decrease theA warmer troposphere can decrease theability of the ocean to remove and store COability of the ocean to remove and store CO22
by decreasing the nutrient supply forby decreasing the nutrient supply forphytoplankton and increasing the acidity ofphytoplankton and increasing the acidity ofocean water.ocean water.
Global warming will lead to prolonged heatGlobal warming will lead to prolonged heatwaves and droughts in some areas andwaves and droughts in some areas andprolonged heavy rains and increased floodingprolonged heavy rains and increased floodingin other areas.in other areas.
Effects on Biodiversity:Effects on Biodiversity:Winners and LosersWinners and Losers
Possible effects ofPossible effects ofglobal warming onglobal warming onthe geographicthe geographicrange of beechrange of beechtrees based ontrees based onecological evidenceecological evidenceand computerand computermodels.models.
Figure 20Figure 20--1313 Fig. 20-13, p. 478
Presentrange
Overlap
Futurerange
Beech
EFFECTS OF GLOBAL WARMINGEFFECTS OF GLOBAL WARMING
In a warmer world, agricultural productivityIn a warmer world, agricultural productivitymay increase in some areas and decrease inmay increase in some areas and decrease inothers.others.
Crop and fish production in some areas couldCrop and fish production in some areas couldbe reduced by rising sea levels that wouldbe reduced by rising sea levels that wouldflood river deltas.flood river deltas.
Global warming will increase deaths from:Global warming will increase deaths from:
Heat and disruption of food supply.Heat and disruption of food supply.
Spread of tropical diseases to temperate regions.Spread of tropical diseases to temperate regions.
Increase the number of environmental refugees.Increase the number of environmental refugees.
DEALING WITH GLOBAL WARMINGDEALING WITH GLOBAL WARMING
Climate change is such a difficult problem toClimate change is such a difficult problem todeal with because:deal with because:
The problem is global.The problem is global.
The effects will last a long time.The effects will last a long time.
The problem is aThe problem is a longlong--termterm political issue.political issue.
The harmful and beneficial impacts of climateThe harmful and beneficial impacts of climatechange are not spread evenly.change are not spread evenly.
Many actions that might reduce the threat areMany actions that might reduce the threat arecontroversial because they can impactcontroversial because they can impact
economies and lifestyles.economies and lifestyles.

9
DEALING WITH GLOBAL WARMINGDEALING WITH GLOBAL WARMING
Two ways to deal with global warming:Two ways to deal with global warming:
MitigationMitigation that reduces greenhouse gasthat reduces greenhouse gas
emissions.emissions.
AdaptationAdaptation, where we recognize that some, where we recognize that somewarming is unavoidable and devise strategies towarming is unavoidable and devise strategies toreduce its harmful effects.reduce its harmful effects.
Fig. 20-14, p. 481
Cut fossil fuel use (especiallycoal)
Shift from coal tonatural gas
Improve energy efficiency
Shift to renewable energyresources
Transfer energy efficiency andrenewable energy technologiesto developing countries
Reduce deforestation
Use more sustainableagriculture and forestry
Limit urban sprawl
Reduce poverty
Slow population growth
Remove CO2 from smoke stackand vehicle emissions
Store (sequester)CO2 by planting trees
Sequester CO2 deep underground
Sequester CO2 in soil by usingno-till cultivationand taking cropland outof production
Sequester CO2 in the deep ocean
Repair leaky natural gas pipelinesand facilities
Use animal feeds that reduce CH4emissions by belching cows
Solutions
Global Warming
Prevention Cleanup
Solutions: Reducing the ThreatSolutions: Reducing the Threat
We can improve energy efficiency, rely moreWe can improve energy efficiency, rely moreon carbonon carbon--free renewable energy resources,free renewable energy resources,and find ways to keep much of the COand find ways to keep much of the CO22 weweproduce out of the troposphere.produce out of the troposphere.
Removing and Storing CORemoving and Storing CO22
Methods forMethods forremoving COremoving CO22
from thefrom theatmosphere oratmosphere orfromfromsmokestacks andsmokestacks andstoringstoring(sequestering) it.(sequestering) it.
Figure 20Figure 20--1515
Fig. 20-15, p. 482
Tree plantation
Coalpowerplant
Tanker deliversCO2 from plantto rigOil rig
CO2 is pumpeddown from rigfor deep oceandisposal
Spent oil reservoir isused for CO2 deposit
Abandonedoil field Crop field
Spent oil reservoir isused for Crop field
Switchgrass
= CO2 deposit
= CO2 pumping
CO2 deposit CO2 ispumped down toreservoir throughabandoned oil field
DEALING WITH GLOBAL WARMINGDEALING WITH GLOBAL WARMING
Governments can tax greenhouse gasGovernments can tax greenhouse gasemissions and energy use, increaseemissions and energy use, increasesubsidies and tax breaks for saving energy,subsidies and tax breaks for saving energy,and decrease subsidies and tax breaks forand decrease subsidies and tax breaks forfossil fuels.fossil fuels.
A crash program to slow and adapt to globalA crash program to slow and adapt to globalwarming now is very likely to cost less thanwarming now is very likely to cost less thanwaiting and having to deal with its harmfulwaiting and having to deal with its harmfuleffects later.effects later.
10
WHAT IS BEING DONE TO REDUCEWHAT IS BEING DONE TO REDUCEGREENHOUSE GAS EMISSIONS?GREENHOUSE GAS EMISSIONS?
Getting countries to agree on reducing theirGetting countries to agree on reducing theirgreenhouse emissions is difficult.greenhouse emissions is difficult.
A 2006 poll showed that 83% of AmericansA 2006 poll showed that 83% of Americanswant more leadership from federalwant more leadership from federalgovernment on dealing with global warming.government on dealing with global warming.
International Climate Negotiations:International Climate Negotiations:The Kyoto ProtocolThe Kyoto Protocol
Treaty on global warming which first phase wentTreaty on global warming which first phase wentinto effect January, 2005 with 189 countriesinto effect January, 2005 with 189 countries
participating.participating.
It requires 38 participating developed countries toIt requires 38 participating developed countries tocut their emissions of COcut their emissions of CO22, CH, CH44, and N, and N22O toO to5.2% below their 1990 levels by 2012.5.2% below their 1990 levels by 2012.
Developing countries were excluded.Developing countries were excluded.
•• The U.S. did not sign, but California and Maine areThe U.S. did not sign, but California and Maine areparticipating.participating.
•• U.S. did not sign because developing countries suchU.S. did not sign because developing countries suchas China, India and Brazil were excluded.as China, India and Brazil were excluded.
Moving Beyond the Kyoto ProtocolMoving Beyond the Kyoto Protocol
Countries could work together to develop aCountries could work together to develop anew international approach to slowing globalnew international approach to slowing globalwarming.warming.
The Kyoto Protocol will have little effect on futureThe Kyoto Protocol will have little effect on futureglobal warming without support and action by theglobal warming without support and action by the
U.S., China, and India.U.S., China, and India.
Actions by Some Countries, States,Actions by Some Countries, States,and Businessesand Businesses
In 2005, the EU proposed a plan to reduceIn 2005, the EU proposed a plan to reduceCOCO22 levels by 1/3levels by 1/3rdrd by 2020.by 2020.
California has adopted a goal of reducing itsCalifornia has adopted a goal of reducing itsgreenhouse gas emission to 1990 levels bygreenhouse gas emission to 1990 levels by2020, and 80% below by 2050.2020, and 80% below by 2050.
Global companies (BP, IBM, Toyota) haveGlobal companies (BP, IBM, Toyota) haveestablished targets to reduce theirestablished targets to reduce theirgreenhouse emissions 10greenhouse emissions 10--65% to 1990 levels65% to 1990 levelsby 2010.by 2010.
Fig. 20-16, p. 485
Reducing CO2 Emissions
• Drive a fuel-efficient car, walk, bike, carpool,and use mass transit
• Use energy-efficient windows
• Use energy-efficient appliances and lights
• Heavily insulate your house and seal all drafts
• Reduce garbage by recycling and reuse
• Insulate your hot water heater
• Use compact fluorescent bulbs
• Plant trees to shade your house during summer
• Set water heater no higher than 49°C (120°F)
• Wash laundry in warm or cold water
• Use low-flow shower head
• Buy products from companies that are trying to reducetheir impact on climate
• Demand that the government make climatechange an urgent priority
What Can You Do?
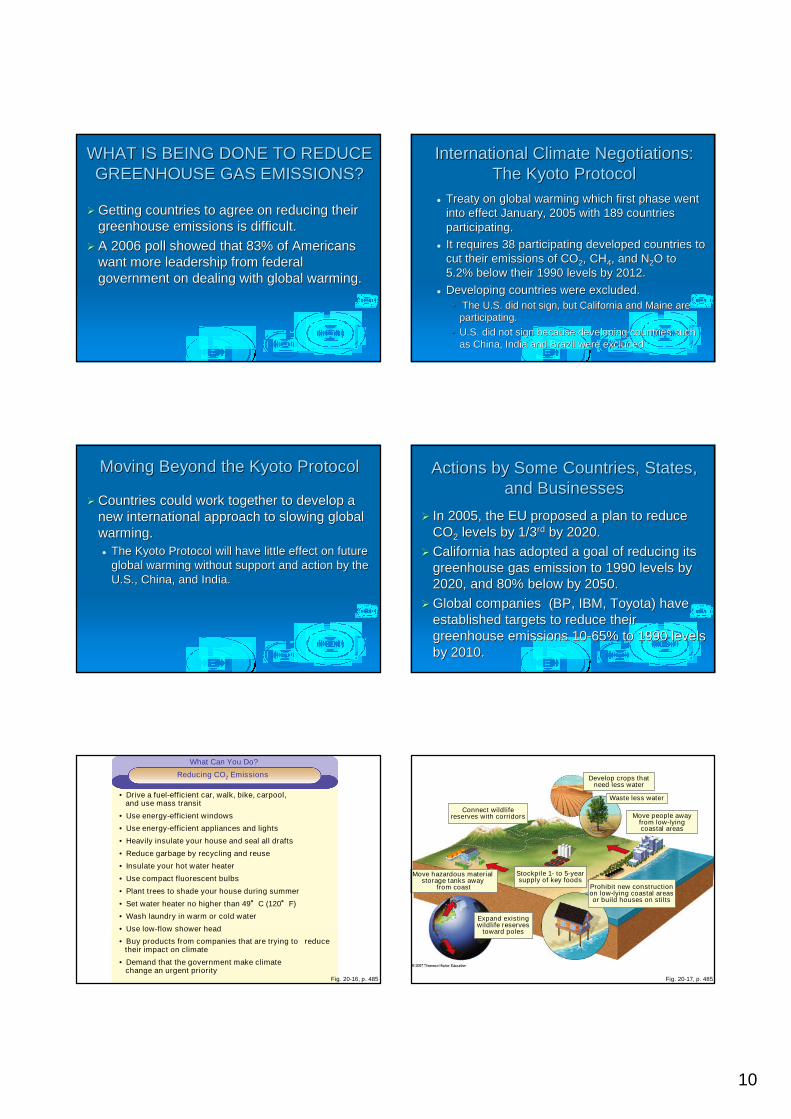
Fig. 20-17, p. 485
Move hazardous materialstorage tanks away
from coast
Connect wildlifereserves with corridors
Develop crops thatneed less water
Waste less water
Move people awayfrom low-lyingcoastal areas
Stockpile 1- to 5-yearsupply of key foods
Expand existingwildlife reserves
toward poles
Prohibit new constructionon low-lying coastal areasor build houses on stilts

11
OZONE DEPLETION IN THEOZONE DEPLETION IN THESTRATOSPHERESTRATOSPHERE
Less ozone in the stratosphere allows forLess ozone in the stratosphere allows formore harmful UV radiation to reach themore harmful UV radiation to reach theearthearth’’s surface.s surface.
The ozone layer keeps about 95% of the sunThe ozone layer keeps about 95% of the sun’’ssharmful UV radiation from reaching the earthharmful UV radiation from reaching the earth’’sssurface.surface.
Chlorofluorocarbon (CFCs) have lowered theChlorofluorocarbon (CFCs) have lowered the
average concentrations of ozone in theaverage concentrations of ozone in thestratosphere.stratosphere.
In 1988 CFCs were no longer manufactured.In 1988 CFCs were no longer manufactured.
Fig. 20-18, p. 486
A free oxygen atom pullsthe oxygen atom offthe chlorine monoxidemolecule to form O2.
Ultraviolet light hits a chlorofluorocarbon(CFC) molecule, such as CFCl3, breakingoff a chlorine atom andleaving CFCl2.
Sun
Repeatedmany times
The chlorine atomand the oxygen atomjoin to form a chlorinemonoxide molecule(ClO).
Summary of ReactionsCCl3F + UV Cl + CCl2FCl + O3 ClO + O2Cl + O Cl + O2
UV radiation
The chlorine atom attacksan ozone (O3) molecule,pulling an oxygen atom offit and leaving an oxygenmolecule (O2).
Once free, the chlorine atom is offto attack another ozone moleculeand begin the cycle again.
Cl
SunOnce free, the chlorineatom is off to attackanother ozone moleculeand begin the cycle again.
A free oxygen atom pullsthe oxygen atom offthe chlorine monoxidemolecule to form O2.
The chlorine atom andthe oxygen atom join toform a chlorine monoxidemolecule (ClO).
UV radiation
Cl Cl
ClC
F
The chlorine atom attacks anozone (O3) molecule, pullingan oxygen atom off it andleaving an oxygenmolecule (O2).
Cl
Cl
OO
O
Cl
ClO
ClO
OO
OO
Ultraviolet light hits a chlorofluorocarbon(CFC) molecule, such as CFCl3, breakingoff a chlorine atom and leaving CFCl2.
O
Fig. 20-18, p. 486
Stepped Art
OZONE DEPLETION IN THEOZONE DEPLETION IN THESTRATOSPHERESTRATOSPHERE
During fourDuring fourmonths of eachmonths of eachyear up to half ofyear up to half ofthe ozone in thethe ozone in thestratosphere overstratosphere overAntarctica and aAntarctica and asmaller amountsmaller amountover the Artic isover the Artic isdepleted.depleted.
Figure 20Figure 20--1919
OZONE DEPLETION IN THEOZONE DEPLETION IN THESTRATOSPHERESTRATOSPHERE
Since 1976, in Antarctica, ozone levels have markedlySince 1976, in Antarctica, ozone levels have markedlydecreased during October and November.decreased during October and November.
Figure 20Figure 20--2020
OZONE DEPLETION IN THEOZONE DEPLETION IN THESTRATOSPHERESTRATOSPHERE
Ozone thinningOzone thinning: caused by CFCs and other: caused by CFCs and otherozone depleting chemicals (ozone depleting chemicals (ODCsODCs).).
Increased UV radiation reaching the earthIncreased UV radiation reaching the earth’’sssurface from ozone depletion in the stratospheresurface from ozone depletion in the stratosphereis harmful to human health, crops, forests,is harmful to human health, crops, forests,
animals, and materials such as plastic andanimals, and materials such as plastic andpaints.paints.

12
Human Health• Worse sunburn• More eye cataracts• More skin cancers• Immune system suppression
Food and Forests
• Reduced yields for some crops• Reduced seafood supplies from reduced phytoplankton• Decreased forest productivity for UV-sensitive tree species
Wildlife
• Increased eye cataracts in some species• Decreased population of aquatic species sensitive to UV radiation• Reduced population of surface phytoplankton• Disrupted aquatic food webs from reduced phytoplankton
Air Pollution and Materials• Increased acid deposition• Increased photochemical smog• Degradation of outdoor paints and plastics
Global Warming• Accelerated warming because of decreased ocean uptake of CO2 fromatmosphere by phytoplankton and CFCs acting as greenhouse gases
Effects of Ozone Depletion
Natural Capital Degradation
Fig. 20-21, p. 488
Case Study: Skin CancerCase Study: Skin Cancer
Structure ofStructure ofthe humanthe humanskin andskin andrelationshiprelationshipbetweenbetweenradiationradiationand skinand skincancer.cancer.
Figure 20Figure 20--2222
Fig. 20-22, p. 489
This long-wavelength(low-energy) form of UVradiation causes aging ofthe skin, tanning, andsometimes sunburn. Itpenetrates deeply andmay contribute to skincancer.
This shorter-wavelength (high-energy) formof UV radiation causes sunburn, prematureaging, and wrinkling. It is largely responsiblefor basal and squamous cell carcinomasand plays a role in malignant melanoma.
Epidermis
Squamous CellCarcinoma
Basal CellCarcinoma
Melanoma
Sweatgland
Dermis
Squamouscells
Thin layer ofdead cells
Basal layer
Melanocytecells
Bloodvessels
UltravioletB
UltravioletA
Hair
Basal cell
PROTECTING THE OZONE LAYERPROTECTING THE OZONE LAYER
To reduce ozoneTo reduce ozonedepletion, wedepletion, wemust stopmust stopproducing allproducing allozoneozone--depletingdepletingchemicals.chemicals.
Figure 20Figure 20--2323
Fig. 20-23, p. 490
What Can You Do?
• Stay out of the sun, especially between 10 A.M. and 3 P.M.
• Do not use tanning parlors or sunlamps.
• When in the sun, wear protective clothing and sun–glasses that protect against UV-A and UV-B radiation.
• Be aware that overcast skies do not protect you.
• Do not expose yourself to the sun if you are takingantibiotics or birth control pills.
• Use a sunscreen with a protection factor of 15 or 30anytime you are in the sun if you have light skin.
• Examine your skin and scalp at least once a month formoles or warts that change in size, shape, or color orsores that keep oozing, bleeding, and crusting over. Ifyou observe any of these signs, consult a doctorimmediately.
Reducing Exposure to UV Radiation