apex mining co., inc.. it is some 950 km south-southeast from country’s capital, manila and about...
TRANSCRIPT

APEX MINING CO., INC.
Head Office: Unit 1704 17th Floor, Prestige Tower Condominium, F. Ortigas Jr. Road, Ortigas Center , Pasig City 1605 Tel. Nos.: 706-2805/706-2806 * Fax No.: 706-2804 Minesite: Maco, Compostela Valley
July 16, 2012 PHIL. STOCK EXCHANGE Disclosure Department Tower One and Exchange Plaza Ayala Triangle, Ayala Avenue Makati City Attention: Ms. Janet Encarnacion Head, Disclosure Dept. Dear Ms. Encarnacion; We are re-submitting herewith the final full Technical Report on the Re-Estimation of the Company’s Maco Mine Resources. The report submitted to the Exchange last April 12, 2012 was not the final report. Apex regrets having the error on the earlier disclosure as an earlier draft copy was inadvertently provided to the Exchange. The correct values are as follows: at 1.5g/t Au cutoff: Measured: 1,070,000 tonnes, at 5.0 g/t Au Indicated: 2,240,000 tonnes at 8.1 g/t Au Inferred: 3,270,000 tonnes at 4.7 g/t Au The abovementioned correct values are reflected in the final full report attached herewith.
Very truly yours, ROSANNA A. PARICA Corporate Information Officer

1
A RE-ESTIMATION OF THE 2011 RESOURCE OF MACO MINES LOCATED IN MACO, COMPOSTELA VALLEY PROVINCE,
SOUTHEASTERN MINDANAO ISLAND, PHILIPPINES
[Covered by MPSA No. 225-2005-XI and MPSA No. 234-2007-XI] By: TOMAS D. MALIHAN Exploration Results and Mineral Resource Estimation CP, PMRC BS Geol., Porphyry Copper-Gold, Epithermal Gold and Nickel Laterite
Exploration RAMON A. L. FLORES Exploration Results and Mineral Resource Estimation CP, PMRC BS Geol, PgDipRemote Sensing; R&DMgt; MEnvt&NatResMgt Prepared February 2012, reviewed and submitted MARCH 2012

ItFIrIIIItrItTIIIIIT
T
2.0 CERTIFICATES AND CONSENT OF CPs FOR TECHNICAL REPORTS
2.1 Gertification and Consent. We , Tomas D. ffralihan & Ramon A. L. Flores. do hereby certify:r That we are Licensed Geologists registered with the Professional
Regulation Cornmission of the Philippines.r We graduated and hold the following degrees:
o For T.D. Malihan (TDM):
- BSc in Geology (1971jo For R.A.L-Flores {RALF}:
- BSc in Geology (1981i- PgDip in Remote Sensing- PgDip in Research and Development Management- Master in Environrnent and Natural Resources
Managemento We hold the following Professional Qualifications and have been in
good standing with the following professional organization:o Member, Geological Society of the Philippines (GSP)
Accredited Competent Person iCP) of the Philippine MineralReporting Code (PMRC)/Geological Society of the Philippines(GSP)
. We have worked as Exploration Geologists {TDM and RALF) andMining Geologist {TDM) and, on occasion, as geologicalconsultants forover a total of 41 ffDM) and 31 {RALF) years since obtaining ourGeology degrees. We have extensive experience and knowhow in theevaluation of mining properties, in particular, exploration, evaluationand exploitation of porphyry copper-gold and epithermal gold veindeposits as well as nickel laterite deposits, and our experience is wellbeyond the minimum required by the PMRC and other equivalentreporting codes.
We are aware of the definition of "Cornpetent Person" as defined in thePhilippine Mineral Reporting Code (PMRC) and certify that by virtue ofour education, training, related work experience as well as affiliationswith the sole accredited professional arganizaticn for Geologists, thatwe fulfill the requirements for a 'Competent Person' set out by thePhitippine Mineral Reporting Code"

IT
tIIIIT
we are responsible for the content of the Technical report entifled
''A RE.ESTIMATION OF THE 2011 RESOURCE OF MACO MINESLOCATED IN MACO, COMPOSTELA VALLEY PROVINCE,sourHEASIERA/ MtNDANA? t9LAND, pHtLtpptNEs,, datedFebruary 2012.
we have no vested interest whatsoever in Apex Mining companywhich have engaged us to reestimate the previous resource estimatesprepared by the company's Technical staff and consultants for itsMaco Mines in Maco, compostera vailey province. For this task, wehave made the resource estimate conforming to the requiredguidelines set out by the philippine Mineral Reporting codewe have read the guidelines spelled out in the philippine MineralReporting code and this technicar report has been prepared inaccordance with the Code.we consent to the filing of the technical report with the philippine stockExchange and other reguratory government authorities and anypublication by them for regulatory and disclosure purposes, includingelectronic publication in the pubric company fires on their websitesaccessible by the public, of this Technical Report, in the form andcontext in which it appears.copies of this report are submitted both in hard copies and indigital file (pdf) format to the Apex management.
REPUBLTC OF THE PHtltPPtNES)MAKATT Ctry )ss.
i{AR z ? 2012
SUBSCRIBED AND swoRN BEFORE ME THts day of March, 2012, affiant
Doc No _frJtqPaqe No. l+Z
eoJk r'ro :#l'-Series of ZaQ.
llf,a. ESnffitr
Apnt N6. ll,{+S (ZOli's Rolt No.34562r,.t o .oo,l,u"*0"..
ryg. gll ooTirir)?iii,ii*ffi ;'l'lyj: g
1 r 1-z qiz] ry"uu crtr
AN
[8P t ifetime &iemU*iiirrli f,io. osafs

IlttrttIIItttrrIIiii!
2.3
2.2Scope of Work
Tomas D. Matitian & Ramon A.L Flores are two PMRC-accreditedCPs on Geology involved in this review and re-estimation of the MacoMine's 2011 resource. Their scope of work was to review, audit and, iffound in order, certify the work of Apex's Technical Staff and itsconsultant who prepared the resource estimates or if deemednecessary, to make a re-estimation of the said resource. For thisreport, these CPs were provided with information needed for thepreparation of this technical report. The criteria used in the resourceestimation is compliant with the Philippine Mineral Reporting Code(PMRC) as required by the Philippine Stock Exchange.
Reliance on Other ExpertsThese CPs has relied mainly on the exploration data gathered by
the technical staff and consultants of Apex including geologicalreports, plans, sections and statistical studies to arrive at the variousresource estimates. This review report, therefore, could only be asgood as the data provided to these CPs. The objective of this work is
Stock Exchange-prescribed format that meet the guidelinesset
2.4Sig
'(//// ------*--(,D. MALIHAN
P Explorafiffi-Msulfs and Mineral Resource Estimation,BS Geo/., Porphyry Copper-Goldand Epithermal Gold Exploration/Nickel Laterite ExplorationRegi stered Geologi st N o. 387
illlr. L- a . I Flr^Vl[fu1/.W, l\ Vrytx4 V t v/ )
RAMON A. L. FLORESExploration Resu/fs and Mineral Resource EstimationBS Geol PgDipRemofe Sensrng; R&DMgt; MEnvt&NatResMgtRegistered Geologist No. 807

5
3.0 EXECUTIVE SUMMARY Maco Mines (collective term) is situated within barangays Teresa and Masara in
the municipality of Maco, Compostela Valley Province, SE Mindanao Island, Philippines. It is some 950 km south-southeast from country’s capital, Manila and about 53 km northeast across Davao Gulf from Davao City, the premier city of Mindanao. The mineral properties are covered by MPSAs No. 225-2005-XI and MPSA No. 234-2007-XI which were granted by the Philippine government through the Department of Environment and Natural Resources on December, 2005 and June 2007, respectively. The minesite is accessible from Davao City partly via the sealed Pan- Philippine Highway over 74 km up to the town of Mawab, thence through 26 km of largely gravel-paved feeder road carved along the bank of Masara River leading upstream. The mine is presently owned by Apex Mining Company, Inc., a Philippine company listed in the Philippine Stock Exchange.
The geology of the area consists of the pre-Tertiary Masara Formation, overlain
in places by the Paleocene to Oligocene Hijo Formation, which is conformably overlain by the Lower Miocene Limpacan limestone. Lower to Middle Miocene intrusives occur as batholithic to stock-like intrusions. These are in turn, intruded by andesitic to dioritic porphyritic rocks occurring mostly as dikes. Pliocene to Pleistocene volcanic flows overlie in places the older rocks in the district.
Mineralization consists of mesothermal-epithermal gold-silver-base metal-bearing
quartz-calcite veins, gold-bearing porphyry copper deposits and pyrometasomatic skarn deposits that are spatially and temporally associated with the Philippine Fault system.
The current exploration program is based on capturing historical data and
creating a project wide GIS, a preliminary 3D geological model for the mine operations and vein systems and detailed surface mapping in the mine area. Recoveries average about 94% for 58 drillholes in 2011, and about 95% for face samples, and a dominant proportion of the holes had downhole surveys. More numerous and larger diameter HQ and NQ holes have comparable precision, while smaller diameter AQ holes have worse precision and suspected Au washed away. This implies a more conservative but more imprecise Au assays for smaller diameter drillholes. Available data shows 87% of Crew drillholes have downhole surveys while Apex drillholes have only about 19% with downhole surveys, although data is still being compiled at the moment.
A surface and underground drilling program was started in late 2009 to extend
known resources and to test the depth potential of vein and alteration systems identified through surface mapping and trenching, and to verify previous work. The known porphyry copper systems are currently being explored.

6
74 field duplicates (quarter splits) analyzed for Au were utilized, giving an Absolute Relative Deviation at the 90th percentile (ARD90) precision of +/-150%. 101 crushed duplicate pairs have an ARD90 of +/-68%. 94 pulp duplicate pairs have an ARD90 precision of +/- 40%. 26 pairs of fire assay repeats have an ARD90 precision of +/-1.8%.
Altogether, these indicate a natural geological variability of about 82%; field
splitting and crushing precision of 28%; 38% precision in splitting/ pulverization; and about 2% for analytical precision for fire assay.
The vein systems of the mine since 2006 up to 2011 have reportedly produced
approximately 830,000 tonnes of gold averaging 5.01 g/t Au. Re-estimation of the resource declared by Apex for Maco Mine used the
geostatistical technique wherein the top cuts were determined for each vein’s cumulative frequency histogram of assay values. Further, variogram ranges were used to classify resources: measured for those veins with both 1m composited face samples and drillhole intercepts and within the interpreted variogram range along strike; indicated up to twice of the variogram range as supported by geological continuity; and for inferred, the resource envelope of MacManus (2012) is used; all within the Apex supplied wireframe/ geological solid model current up to June 2011. Each vein’s average of specific gravity measurements were utilized, and if not available, the global average specific gravity was used. Ordinary Kriging was used to estimate 2.5x2.5x5m blocks, a size deemed suitable by Mine Operations staff. In this regard, the methodology adopted here appears to be more accurate than previous ones. In general, measured resources are marked both by composited face and drillhole samples. This was further modified due to geological considerations. For instance, vein systems in the “Dons” area were all considered appropriate up to indicated category only. Vein systems in the “Maligaya” area can have up to measured resources; however, 4 vein systems (codes 510, 520, 530 and 610) have no face samples hence resource classification for these four veins are up to indicated only.
The Mine’s categorized resources for the 16 major vein systems /41 individually-
considered epithermal veins (where the vein and their splits’ solids/wireframes are available) were determined. The pre-mining, undiluted resource in situ estimates are shown below:

7
At 3g/t Au cutoff, the total undiluted pre mining, in-situ resource is comprised of:
140,000 tonnes at 8.4 g/t Au as measured; 1,650,000 tonnes at 9.7g/t Au as indicated; and 3,100,000 tonnes at 5.6 g/t Au as inferred.
At 1.5g/tAu cutoff, the total undiluted pre mining, in-situ resource is comprised of:
1,070,000 tonnes of 5.0 g/t Au as measured; 2,240,000 tonnes of 8.1 g/t Au as indicated; and 3,270,000 tonnes of 4.7 g/t Au as inferred.
The resource estimates at 3g/t Au cutoff are understandably higher than the estimate of Malihan (2010) in terms of tonnage due to higher specific gravities used; and, in terms of grade, also higher due to the higher topcuts utilized in this study, as well as newer higher-grade intersections for some veins. It appears that 1.5% g/t Au is an appropriate cutoff as it closely matches the production grades. MacManus’ (2012) tonnages and more conservative grades for several veins were adopted for this cutoff.
The categorization of resources is deemed within acceptable limits as set forth in
the PMRC guidelines. The results of this work indicate that further improvements in precision can be
obtained through more appropriate field sampling, use of larger diameter (HQ and NQ) drillholes, more thorough homogenization in sample preparation and reduction (crushing, splitting, and pulverization), as well as analysis, and dust control. Increased reliability in the tonnages can be arrived at using more detailed vein width mapping and solid modeling; more specific gravity measurements; and positional surveying accuracy. Recoveries for all holes should be determined. The solids need only to be digitized where there is sufficient geological and assay basis. More rigorous statistical and geostatistical processing should be undertaken to further refine the results of this work. Further, delving into the historical records and current mine developments will enable the amount of material mined and gold grades produced per vein.
The resultant block model can be used to guide mine planning and scheduling,
as well as for exploration of additional resources in untested areas. Inferred and Indicated resources should be upgraded by further drilling and mine development sampling.

8
TABLE OF CONTENTS 1.0 TITLE PAGE 1 2.0 CERTIFICATION AND CONSENT OF CPs FOR TECHNICAL REPORTS 2
2.1 Certification and Consent 2 2.2 Scope of Work 4 2.3 Reliance on Other Experts 4 2.4 Signatures of CPs 4
3.0 EXECUTIVE SUMMARY 5 4.0 TABLE OF CONTENTS 8
4.1 List of Tables 13 4.2 List of Figures 13 4.3 List of Photographs 13
5.0 INTRODUCTION 14
5.1 Who commissioned the report 14 5.2 Purpose for which the report was prepared 14 5.3 Scope of Work or Terms of Reference 14 5.4 Duration of the preparation, including field visits and verification 14 5.5 Members of the technical report preparation team 15 5.6 Host company representative 15 5.7 Compliance of report with PMRC 15
6.0. RELIANCE ON OTHER EXPERTS OR CPs 16 7.0. TENEMENT AND MINERAL RIGHTS 17
7.1 Description of mineral rights 17 7.1.1 Location of area (Barangay, Municipality, Province) 17 7.1.2 Coordinate locations as per MGB 17 7.1.3 Number of claims and hectares covered 20 7.1.4 EP/MPSA/FTAA mode of agreement 21 7.1.5 Type of permit or agreement with government 21
7.2 History of mineral rights 21 7.3 Current owners of mineral rights 21 7.4 Validity of current mineral rights 21 7.5 Agreements with respect to mineral rights 22 7.6 Net revenue that may be derived from the project 22
7.6.1 Royalties, taxes, advances and similar payments 22 7.6.2 Receivables and payable sums to the company 22

9
8.0 GEOGRAPHIC FEATURES 23 8.1 Location and accessibility 23 8.2 Topography, physiography, drainage and vegetation 23 8.3 Climate, population 24
8.3.1 Climate 24 8.3.2 Population 25
8.3.2.1 Birth and Date Rates 25 8.3.2.2 Morbidity and Mortality Rate 25
8.4 Land Use 26 8.5 Socio Economic Environment 26 8.6 Environmental features 26
9.0 PREVIOUS WORK 27
9.1 History of previous work 28 9.2 Brief description of the essential work done by previous workers 31 9.3 Conclusions of each of the previous workers
10.0 HISTORY OF PRODUCTION 34
10.1 Production history of Apex Mines 34 10.2 Areas mined within the subject tenement area 34 10.3 General description of mining 34 10.4 Tonnage mined and sold 35
11.0 REGIONAL AND DISTRICT GEOLOGY 36
11.1 Regional Tectono-Geologic Setting of Masara Gold District 36 11.2 Stratigraphy 38 11.3 Structural Geology 39 11.4 Mineralization location(s) and general description 41
11.4.1 Gold-Base Metal Quartz Veins 41 11.4.2 Porphyry Copper-Gold Deposits 42 11.4.3 Sediment-hosted and Stratabound Gold Base Metal Veins 44 11.4.4 Gold-base metal skarns 44
11.5 Historical Geology 45 12.0 MINERAL PROPERTY GEOLOGY 47
12.1 Geological work undertaken by the company in the property 47 12.2 Rock types and their geological relationships 47 12.3 Description of various geological structures and their trends 48

10
13.0 MINERALIZATION IN THE MINERAL PROPERTY 49 13.1 Overview of the mineralization (as per reference reports) 49 13.2 Type of mineralization as mapped 50 13.3 Style of mineralization 50 13.4 Wall rock alteration, paragenesis 50 13.5 Geological structures 51 13.6 Localization of the deposit 51 13.7 Length, width, depth of mineralization 51 13.8 Element grade levels and patterns 51 13.9 Development of “ore shoots” 52 13.10 Continuity of mineralization 52
14.0 EXPLORATION 53
14.1 Geological work done 53 14.1.1 Geological data generated from mapping and surface sampling 53 14.1.2 Geological map and sections 53
14.1.2.1 Underground maps 53 14.1.2.2 Surface exploration maps 54
14.1.3 Sample location map 54 14.2 Surface sampling 54
14.2.1 Outcrop sampling 54 14.2.2 Trench sampling 54 14.2.3 Test pit sampling 54
14.3 Drilling and sampling 55 14.3.1 Type of drilling program 55 14.3.2 Drill site spacing, depth of drilling 56 14.3.3 Core logging 56 14.3.4 Drill Sample Method and Interval 56 14.3.5 Drill core photographs 57
14.4 Exploration Geochemistry 57 14.4.1 Description of geochemical survey type 57 14.4.2 Description of sampling and analytical methods employed 58 14.4.3 Definition of background, threshold and anomaly levels 58 14.4.4 Applied synthesis and interpretive techniques 59 14.4.5 Description of geochemical anomalies detected 59 14.4.6 Relation of geochemical findings to geology and mineralization 59

11
14.5 Application of Geophysics (by issuer or previous work) 59 14.5.1 Description of geophysical method used and objective of the survey 59 14.5.2 Description on whether a geophysical contractor, independent consultant
or an in-house staff was engaged in the conduct of the geophysical survey 59
14.5.3 Description of equipment used 59 14.5.4 Description on how Geophysical Survey was carried out 60 14.5.5 Description of interpretive tools used 60 14.5.6 Discussion on essential results with respect to the objective 60
14.6 Sample Preparation, Analyses and Security 60 14.6.1 Security and Chain of Custody of Samples 60 14.6.2 Preparation and assay facility 62
14.6.2.1 Sample preparation equipment 62 14.6.3 Sample preparation 66 14.6.4 Analytical methods used 68 14.6.5 Quality Assurance/Quality Control of sample preparation and analysis 71
14.6.5.1 Quality control procedures 72 14.6.5.2 Presentation of Quality Control Data/ Graphs 75 14.6.5.3 Field blanks 78 14.6.5.4 Laboratory blanks 78 14.6.5.5 Field duplicates/Quarter splits precision 78 14.6.5.6 Crushed duplicates/Splits precision 79 14.6.5.7 Pulp duplicates/Splits precision 80 14.6.5.8 Analytical repeats precision 80 14.6.5.9 Precision summary 81
14.6.6 Statement of the CP on the quality of sample security, preparation and analysis 81
15.0 MINERAL RESOURCES ESTIMATE 82
15.1 Mineral Resource Database used in the estimation of resources 82 15.2 Integrity of Exploration and Mineral Resources Database 82 15.3 Data verification and validation (limitations) 83 15.4 Top Cuts and Cut-off grades used in the estimations 83 15.5 Mineral Resource estimation method used 85 15.6 Mineral Resource categories used (PMRC/JORC) 88 15.7 Mineral Resources estimates 89
16.0 INTERPRETATION AND CONCLUSIONS 93
16.1 Synthesis of data 93 16.2 Adequacy of data, overall data integrity and areas of uncertainty 93 16.3 Overall conclusions by the CPs 94 16.4 Discussion on whether the completed project met the objectives set forth 94

12
17.0 RECOMMENDATIONS 95 18.0 REFERENCES 96 19.0 ACKNOWLEDGEMENT 98
13
4.1 List of tables
Table 5.5.1 List of Apex Team members involved in Maco Mines Resource Estimation 15
Table 7.1.2.1 Apex Tenements’ corner coordinates 17 Table 7.6.1.1 Taxes and Royalties 22 Table 8.3.2.1.1 Crude Birth and Date Rates Municipality of Maco,
Compostela Valley Province, 2000 to 2010 25 Table 8.3.2.2 Morbidity Rate and Number of Mortality per Cause
Municipality of Maco, Compostela Valley Province, 2009 25 Table 9.3.1 Previous resource estimates, and codes used to classify
and methodologies 32 Table 9.3.2 Global Resource Tonnage and Grade reported 33 Table 10.4.1 Tonnes mined and milled at Maco by Apex Mill
Production 35 Table 10.4.2 Apex Mill Production 35 Table 15.4.1 Top cuts adopted for each vein 84 Table 15.5.1 Strike and Dip of Each Vein used for Variography 86 Table 15.5.2 Modelled Variogram Parameters along strike 87 Table 15.7.1 Specific Gravity used per vein 89 Table 15.7.2 Mineral Resource Estimate per vein 91
4.2 List of Figures
Figure 7.1.2.1 Location of the Apex MPSA areas in the Masara Gold District 20
Figure 8.3.1.1 Climate Map of the Philippines (from http://www.pagasa.dost.gov.ph) 24
Figure 11.1.1 Regional Geological and Tectonic framework of the Masara Gold District (after Coller, 2011) 38
Figure 11.3.1 Geometry of the Masara Gold District with mineralized structures bounded by the PFZ (after Coller, 2011) 40
Figure 11.4.1.1 Location of Mineralized Vein Systems of Maco Mines (after Sheppard, 2011) 42
Figure 11.4.2.1 Porphyry Copper Gold Mineralization in relation to the Maco Gold Veins (after Coller, 2011) 43
Figure 13.1.1 Map of Masara Showing the Economic Vein Zones (after Coller, 2011) 49
Figure 14.4.1.1 Map showing the sampling points and the Au grade 58 Figure 14.6.5.1.1 Fire Assaying Order and Placement 74 Figure 14.6.5.5.1 ARD90 Precision for Field Duplicates/ Quarter Splits 79 Figure 14.6.5.6.1 ARD90 Precision of Crushed Duplicates 79 Figure 14.6.5.7.1 ARD90 Precision of Pulp Duplicates 80 Figure 14.6.5.8.1 ARD90 Precision of Analytical Repeats 80
4.3 List of Photographs
Photograph 14.6.2.1.1 Drying Oven used at Apex minesite laboratory 63 Photograph 14.6.2.1.2 Jaw Crusher at Apex minesite laboratory 64 Photograph 14.6.2.1.3 Rocklabs Ring Mill at Apex minesite laboratory 65

14
5.0 INTRODUCTION 5.1 Who commissioned the report preparation and to whom it should be
submitted Apex Mining Company, Inc (Apex), a Philippine Company listed in the
Philippines Stock Exchange (PSE) through Benoit de Galbert, commissioned this report as arranged by Apex’s President, Engr. Peregrino S. Resabal together with Mr. Colin Patterson.
5.2 Purpose for which the report was prepared
This report is made in compliance to the requirement of the Philippine Stock Exchange (PSE) to submit PMRC- compliant reports on the mineral resources disclosed by the Company from the results of its exploration works for the benefit of its stakeholders in particular and the investing public in general.
5.3 Scope of Work or Terms of Reference Apex Mining Company, Inc. has title to several mineral properties located in
the municipalities of Maco and Mabini in Compostela Valley Province in southeastern Mindanao covered by MPSA-225-XI-2005 and MPSA-234-XI-2007. This scope of work is only concerned with the gold mineralization within the 17 major/ 41 considered gold vein systems delimited within Maco Mines in the Apex tenement and, as yet, does not take into account the porphyry copper deposits identified within the property. In order to meet deadlines and to ensure a suitable check, only data collected during the 2011 exploration campaign have been considered in this report
5.4 Duration of the preparation, including field visits and verification
Work on resource estimation was commenced by the Apex geological team and their consultant starting June 2011 and the resource report became available in Jan 2012. The Apex geology team includes underground geologists, grade control geologists, exploration geologists, project and senior staff who have all worked at the site for at least 12 months. The consultant geologists who prepared the report upon which these CPs based their evaluation have spent at least 3 months at site.
As for the Competent Persons (CP) -Geology, Mr T. D. Malihan used to be
the Exploration Manager and Resident Geologist for Apex Mines and has about two years experience working at the site. Mr. R.A.L. Flores made at least three site visits during the last six months to gather more data and verify the data provided by the Apex Technical Staff.

15
Preparation was hurriedly done and with exceedingly short notice starting on 15 February 2012. Until submission, the duration included numerous correspondence by the CPs to various Apex company officers, staff, and consultants via phone calls, video and text messaging, and email as well as face-to-face meetings.
5.5 Members of the Apex technical report preparation team
Table 5.5.1 List of Apex Team members involved in Maco Mines Resource Estimation
Names involved in Resource Estimation
Position Affilliation
Scott McManus Consultant Skandus Bill Sheppard Consultant ASVI-TSG
Emma Arcilla Sr. Geologist – Operations Apex
Luz Barchachea GIS Specialist Apex Edgar Biego Autocad Operator Apex Marites Tuscano QAQC Officer Apex Narilyn Serad Data Checker Apex Paul Ortega Sr. Mine Geologist Apex Alex Diambrang UG Geologist Apex
5.6 Host company representative
The Host Company representative is Ms. Emma A. Arcilla, Senior Geologist for Operations.
5.7 Compliance of report with PMRC
The report follows the format outlined in the PSE Implementing Rules and Regulations (IRR) for the 2007 Philippine Mineral Reporting Code (PMRC). It also adopted the mineral resource classification as outlined in PMRC.

16
6.0 RELIANCE ON OTHER EXPERTS OR CPs The CPs relied on the data provided by Apex’s geological and resource estimation
staff and the company geological consultants for this report.

17
7.0 TENEMENT AND MINERAL RIGHTS 7.1 Description of mineral rights 7.1.1 Location of area (Barangay, Municipality, Province)
MPSA 225-2005-XI is located mainly within the barangays of Teresa and Masara, municipality of Maco, Compostela Valley Province, while MPSA 234-XI which is composed of six (6) different parcels is spread over the municipality of Maco and the adjoining municipality of Mabini. These various parcels are located as follows: Parcel-I I is largely located within Barangay Tagbaros with some portions extending into Barangay Mainit; Parcel-II is located entirely within Barangay Mainit; Parcel-III straddles barangays Masara, Mainit, and New Leyte while Parcel-IV is largely located within Barangay Teresa with some small portions extending into barangays Elizalde and New Barili; some portions to the south are located within the Municipality of Mabini; Parcel-V is located entirely within Mabini while Parcel-VI’s northern portion extends into Barangay New Barili, Maco with the southern portion extending into Mabini.
7.1.2 Coordinate locations as per MGB
MPSA 225-2005-XI is defined by the corner points with the following technical descriptions:
Table 7.1.2.1 Apex Tenements’ corner coordinates
Corner Lattitude Longitude 1 7° 23’ 00.81” 126° 01’ 14.76” 2 7° 23’ 10.58” 126° 01’ 14.76” 3 7° 23’ 10.58” 126° 02’ 13.46” 4 7° 23’ 00.81” 126° 02’ 13.46” 5 7° 23’00.81” 126° 02’ 18.35” 6 7° 23’ 11.16” 126° 02’ 28.72” 7 7° 22’ 22.82” 126° 03’ 17.13” 8 7° 22’ 21.48” 126° 03’ 15.80” 9 7° 22’ 21.48” 126° 03’ 21.67” 10 7° 21’ 42.41” 126° 03’ 21.67” 11 7° 21’ 42.41” 126° 02’ 42.55” 12 7° 21’ 48.41” 126° 02’ 42.55” 13 7° 22’ 17.36” 126° 02’ 13.45” 14 7° 21’ 32.92” 126° 02’ 13.45” 15 7° 21’ 32.92” 126° 01’ 53.89” 16 7° 21’ 42.69” 126° 01’ 53.89” 17 7° 21’ 42.69” 126° 02’ 03.67“ 18 7° 22’ 02.22” 126° 02’ 03.67” 19 7° 22’ 02.22” 126° 01’ 44.11” 20 7° 22’ 31.52” 126° 01’ 44.11” 21 7° 22’ 31.52” 126° 01’ 24.54” 22 7° 23’ 00.81” 126° 01’ 24.54”

18
The six (6) individual parcels that comprise the MPSA-234-2007-XI are specifically bounded by the geographic coordinates with the following technical descriptions: PARCEL- I
Corner Latitude Longitude 1 7° 24’ 00.00” 126° 00’ 30.00” 2 7° 24’ 30.00” 126° 00’ 30.00” 3 7° 24’ 30.00” 126° 01’ 00.00” 4 7° 24’ 00.00” 126° 01’ 00.00”
PARCEL- II
Corner Latitude Longitude 1 7° 24’ 00.00” 126° 01’ 17.28” 2 7° 24’ 19.53” 126° 01’ 17.28” 3 7° 24’ 19.49” 126° 01’ 33.56” 4 7° 24’ 01.80” 126° 01’ 33.56” 5 7° 24’ 00.00” 126° 01’ 30.00”
PARCEL- III
Corner Latitude Longitude 1 7° 23’ 10.58” 126° 01’ 55.33” 2 7° 23’ 32.51” 126° 01’ 33.50” 3 7° 23’ 42.27” 126° 01’ 33.52” 4 7° 23’ 42.25” 126° 01’ 43.30” 5 7° 23’ 32.48” 126° 01’ 43.28” 6 7° 23’ 15.71” 126° 02’ 00.00” 7 7° 24’ 01.74” 126° 02’ 00.00” 8 7° 24’ 01.71” 126° 02’ 12.69” 9 7° 24’ 21.24” 126° 02’ 12.74” 10 7° 24’ 21.23” 126° 02’ 19.45” 11 7° 23’ 30.00” 126° 02’ 19.33” 12 7° 23’ 30.00” 126° 03’ 00.00” 13 7° 23’ 14.34” 126° 03’ 00.00” 14 7° 22’ 57.28” 126° 02’ 42.84” 15 7° 23’ 11.16” 126° 02’ 28.72” 16 7° 23’ 00.81” 126° 02’ 18.35” 17 7° 23’ 00.81” 126° 02’ 13.46” 18 7° 23’ 10.58” 126° 02’ 13.46”

19
PARCEL- IV Corner Latitude Longitude 1 7° 22’ 30.00” 126° 00’ 00.00” 2 7° 23’ 00.00” 126° 00’ 00.00” 3 7° 23’ 00.00” 126° 00’ 34.73” 4 7° 23’ 10.58” 126° 00’ 34.75” 5 7° 23’ 10.58” 126° 01’ 14.76” 6 7° 23’ 00.81” 126° 01’ 14.76” 7 7° 23’ 00.81” 126° 01’ 24.54” 8 7° 22’ 31.52” 126° 01’ 24.54” 9 7° 22’ 31.52” 126° 01’ 44.11” 10 7° 22’ 02.22” 126° 01’ 44.11” 11 7° 22’ 02.22” 126° 02’ 03.67” 12 7° 21’ 42.69” 126° 02’ 03.67” 13 7° 21’ 42.69” 126° 01’ 53.89” 14 7° 21’ 32.92” 126° 01’ 53.89” 15 7° 21’ 32.99” 126° 01’ 44.20” 16 7° 21’ 13.45” 126° 01’ 44.15” 17 7° 21’ 13.64” 126° 00’ 25.91” 18 7° 22’ 12.23” 126° 00’ 26.04” 19 7° 22’ 12.23” 126° 00’ 30.00” 20 7° 22’ 30.00” 126° 00’ 30.00”
PARCEL- V
Corner Latitude Longitude 1 7° 20’ 30.00” 126° 02’ 42.68” 2 7° 21’ 42.41” 126° 02’ 42.55” 3 7° 21’ 42.41” 126° 03’ 21.67” 4 7° 21’ 23.00” 126° 03’ 21.95” 5 7° 21’ 23.02” 126° 03’ 12.20” 6 7° 21’ 13.25” 126° 03’ 12.18” 7 7° 21’ 13.23” 126° 03’ 21.96” 8 7° 20’ 30.00” 126° 03’ 21.80”
PARCEL VI
Corner Latitude Longitude 1 7° 20’ 05.33” 126° 00’ 00.00” 2 7° 22’ 00.00” 126° 00’ 00.00” 3 7° 22’ 00.00” 126° 00’ 06.46” 4 7° 20’ 05.32” 126° 00’ 06.204”

20
Figure 7.1.2.1 Location of the Apex MPSA areas in the Masara Gold District
7.1.3 Number of claims and hectares covered
The MPSA 225-2005-XI contract area covers six hundred seventy nine and two hundredths (679.02) hectares.
A large area of MPSA 234-2007-XI area lies within the municipality of
Maco covering a total of 1,194.97 hectares with the rest within the adjoining municipality of Mabini comprising 363.56 hectares. The total area of MPSA 234-2007-XI is one thousand five hundred fifty eight and fifty-three hundredths (1,558.53) hectares. This consists of six (6) individual parcels with the following respective areas:
Parcel 1 = 84.799 hectares Parcel 2 = 29.625 hectares Parcel 3 = 233.123 hectares Parcel 4 = 883.681 hectares Parcel 5 = 258.876 hectares Parcel 6 = 68.423 hectares ________________________________ TOTAL = 1,558.527 hectares

21
7.1.4 EP/MPSA/FTAA mode of agreement The areas covered by the two tenements are under MPSA contract
agreements.
7.1.5 Type of permit or agreement with government Mineral Production Sharing Agreement (MPSA).
7.2 History of mineral rights The subject mining property originally existed as contiguous load claims
comprising of 75 Declaration of Locations (DOLs) of nine (9) hectares each and a number of claim fractions of various shapes and sizes with a total area of 679.02 hectares. The claims, named ASA-24, et al, were originally staked for gold, copper, silver and other metallic minerals under the Philippine Bill of 1902. Prior to the approval of the Mineral Production Sharing Agreement Contract, the area was covered by Mining / Lode Lease Contracts (MLCs) Nos. V-83; V-95; V-96, V-97, V-124 and V-125 that were issued in 1994 to Apex Mining Company, Inc.
The MLCs were subsequently applied for Mineral Production Sharing
Agreement by Apex in 1998 denominated as APSA-242-XI. An amendment was later filed by Apex for the same APSA in January 2005.
The application was finally approved by the Philippine Government
represented by the Secretary of the Department of Environment and Natural Resources on December 15, 2005. This was denominated as MPSA-225- 2005-XI.
The MPSA 234-XI-2007 was originally applied for MPSA in 2005 denominated
as APSA-248-XI. It is composed of six individual parcels located adjacent to and around the MPSA-225-2005-XI. The application for MPSA was approved in June 2007 denominated as MPSA-234-2007-XI.
7.3 Current owners of mineral rights
Apex Mining Company, Inc. owns 100% of the mineral rights on the basis of MPSA contracts signed with the Philippine Government.
7.4 Validity of current mineral rights
The Mineral Production Sharing Agreement is valid for a 25-year term and renewable for another 25 years. The leases are issued under the Mining Act of 1995 (Republic Act No. 7942). Surface rights are held by the government and the mining leases are issued as agreements between the Philippines government and the Company.
MPSA No. 234-2007-XI expires in June 2032 while MPSA No. 225-2005-XI
expires in 2030.

22
7.5 Agreements with respect to mineral rights. Apex Mining Company, Inc. is the holder of two Mineral Production Sharing
Agreements with the government which was approved in 2005 and 2007, respectively.
7.6 For clarification of the net revenue that may be derived from the project,
the following are included:
7.6.1 Royalties, taxes, advances and similar payments paid or to be paid by the company to the mineral rights holder, joint venture partner(s), government, Indigenous People, local government, and others as shown below:
Table 7.6.1.1 Taxes and Royalties
Origin Royalty Act Excise Tax 2% Mining Act 1995 MOA with local people 1% plus provision of scholar
ships, health program, infrastructure and other social programs
IPRA 1997
Municipal Tax 1% of the gross sales Local Government Code RA 7160
7.6.2 Receivables and payable sums to the company and mineral rights
holder There are no other receivables or payables as the company has 100%
mineral rights on the property.

23
8.0 GEOGRAPHIC FEATURES
8.1 Location and accessibility The MPSA contract areas are bounded by longitudes 126˚ 00’ 00” to 126˚03’
21.8 E and latitudes 7˚ 20’ 05.33” to 7˚ 24’ 30” N. It is some 950 aerial kilometers south-southeast from Manila and about 53 aerial km northeast of Davao City across Davao Gulf. From Manila, the area can be reached fastest and most conveniently by taking one of the daily commercial flights to Davao City then, from Davao, by land through the concrete-sealed Pan Philippine (Maharlika) Highway by driving up north over a distance of some 74 km to the town of Mawab, Compostela Valley Province. From the Mawab highway junction, a 26-km of mostly gravel-paved road heads east- to southeastward following the Hijo-Masara river valley upstream. The Maco minesite is nestled at the upper reaches of Masara River within the adjoining barangays of Masara and Teresa in the Municipality of Maco, Compostela Valley Province.
8.2 Topography, physiography, drainage and vegetation
The contract areas occupy a generally rugged terrain with elevations ranging from about 500 to around 1300 m above sea level. The terrain is characterized by deeply incised, V-shaped river channels with dendritic to radial drainage patterns in an early mature stage of geomorphologic development. Some geomorphologic features in the area indicate some structural controls.
The area is situated at the headwater portions of Masara River, the most
dominant drainage system in the municipality of Maco. At its upstream portion, Masara is fed by its major tributaries consisting of Lumanggang, Bunlang, Malumon, Pag-asa-Kanarubi, Buena Tigbao, Wagas and Makausok creeks which drains the Contract area in a distinctly dendritic pattern. Masara River is one of the biggest tributaries of Hijo River, a major river system in Compostela Valley Province and Davao del Norte that drains also the municipalities of Mawab and Tagum. The Hijo River drains into the northern part of Davao Gulf.
Most of the areas within the tenement have been subjected to commercial
logging operations in the past and most of the large trees are now gone. What thrives now on the mountain slopes are predominantly secondary- growth trees along with a lush tropical shrubbery with diverse species of vines and grasses that form the present vegetation cover.

24
Traditional swidden farming (slash and burn) are practiced by the indigenous Mansaka mountain tribe along with migrants from the lowlands. These resulted in scattered patches of clearings on the mountain slopes that are planted to rice, corn, coffee, bananas and various other vegetables.
8.3 Climate, population
8.3.1 Climate
The climate in Compostela Valley, as in the rest of Davao del Norte, Davao Oriental provinces and the Caraga Region, belongs to Type IV climate system in the Modified Corona’s Classification used by Philippine Atmospheric, Geophysical and Astronomical Administration (PAGASA). Type IV is characterized by no clearly- defined dry season with rains experienced almost throughout the year. However, the highest rainfall, equivalent to monsoon season, is usually experienced from October to February with the rest of the year relatively dry. The average annual rainfall determined in the general area based from rainfall records provided by the local PAGASA monitoring station is about 3,300 mm.
Figure 8.3.1.1 Climate Map of the Philippines
(from http://www.pagasa.dost.gov.ph)

25
8.3.2 Population 8.3.2.1 Birth and Date Rates
The Crude Birth Rate of Maco increased from 17.93 births per 1000 population in 2000 to 20.58 births per 1000 in 2010, an increase of 2.65 births per 1000 population. The municipality’s Crude Death Rate, on the other hand, increased from 2.10 deaths per 1000 population to 3.90 deaths per 1000 population, an increase of 1.80 deaths per 1000 population over the same period (Table 8.3.2.1)
Table 8.3.2.1.1 Crude Birth and Date Rates Municipality of Maco, Compostela Valley Province, 2000 to 2010
Year
Population
Birth Death No. Rate/1000 No. Rate/ 1000
2000 65,181* 1,169 17.93 137 2.10 2001 66,936 1,036 15.48 140 2.09 2002 68,478 1,486 21.70 218 3.18 2003 70,056 1,402 20.01 122 1.74 2004 71,671 1,430 19.95 197 2.75 2005 73,322 1,545 21.07 334 4.56 2006 75,012 1,523 20.30 217 2.89 2007 70,906* 1,627 22.95 247 3.48 2008 71,736 1,571 21.90 246 3.42 2009 7,2575 1,326 18.27 285 3.93 2010 73,424 1,511 20.58 286 3.90 2011 79,283 1,339 287
*Actual population
8.3.2.2 Morbidity and Mortality Rate As far as the causes of morbidity and mortality incidence are
concerned, acute respiratory tract infection is consistently the principal cause of morbidity in the municipality. Pneumonia, on the other hand, ranked first as the leading cause of mortality (Table 8.3.2.2)
Table 8.3.2.2 Morbidity Rate and Number of Mortality per Cause
Municipality of Maco, Compostela Valley Province, 2009 Morbidity No. Mortality No
Acute Respiratory Infection 1,650 Pneumonia 58 Cerebrovascular Disease 1,199 Hypertensive Disease 23 Systemic Viral Infection 326 Malignant Neoplasm 15 Diarrhea and Gastroenteritis 319 Fetal Death in Uterus 19 Wounds (all forms) 306 PTB 16 Parasitism (all forms) 288 Ischemic Heart Disease 17 PTB 150 Unknown 20 Bronchitis 88 Transport Accident 14 Pneumonia 86 Other Form of Heart Disease 23 Source: Municipal Health Office. Maco

26
8.4 Land Use The present land use of the area is generally subsistence-type agricultural or swidden farming with patches of the mountain slopes cleared of forest cover and planted to rice, corn, coffee and various vegetables by the indigenous Mansaka tribe as well as by various settlers from the lowlands. The area has also been a traditional host to mining activities with Apex, North Davao and Hijo mines as the biggest mining operators in the district until about two decades ago when, due to low metal prices and other adverse factors, North Davao and Hijo mines were forced to shut down operations. Apex also barely survived the economic downturn. With the slowdown of large-scale mining, small-scale gold mining activities remained active in some parts of the Contract area which further intensified in recent years with the unprecedented rise in the price of gold in the world market. Most parts of the Contract Area is within the timberland classification with some portions classified as alienable and disposable.
8.5 Socio Economic Environment
There are 15 public schools offering purely primary courses, 15 public elementary schools, three (3) public secondary schools and two (2) private schools offering secondary courses. There are no private nor public schools offering college courses except for vocational/technical courses on computer offered by the Maco Institute of Technology which is located in Maco town proper. The computer courses are part of TESDA-assisted educational program.
The Maco Municipality operates a Main Public Health Center located at
Barangay Binuangan along with 12 satellite barangay health centers located at various barangays. The Local Government Unit (LGU) at present has a part-time physician holding clinic and medical consultations at Barangay Masara at certain days of each week. The clinic serves the 15 upland barangays of Maco situated along the stretches of the Hijo and Masara river valley.
Probably because of its proximity to Tagum City, the capital of Davao del
Norte which has a number of more advanced medical facilities, there are only few private health clinics found in the town of Maco. There are only five (5) private clinics (one with 12-bed capacity) and one (1) private dentist, nine (9) medical practitioners and nine (9) nurses, all situated in the town proper.
8.6 Environmental features
Lake Leonard National Park is a water-filled caldera and is the only National Park close to the MPSA contract areas of Apex.

27
9.0 PREVIOUS WORK 9.1 History of previous work
The following is the chronology of previous works over the Masara area:
1937 Discovery of gold deposits in the Masara river area by Davao Gold Mining Company, a subsidiary of Elizalde and Company (Elizalde). Davao Gold expanded its operations in the area until 1941 when the mine closed down with the outbreak of WW II;
1946 After the war, Elizalde and Company transferred successively the
Masara project to its other subsidiaries such as, Panaminas, Inc. and Masara Consolidated Mining Company until 1951, and Masara Mining Company from 1951 to 1952;
1952 Samar Mining Company (SAMICO), also an Elizalde’s subsidiary,
took over and continued developing Masara eventually acquiring full mining rights over the property in 1954;
1968 SAMICO stopped mining operations and entered into a Mines
Operating Agreement with INCO Mines. INCO, however, had to suspend operations indefinitely in the aftermath of a devastating landslide at the Masara area in 1971;
1973 Apex Mining Company (Apex) acquired the property from SAMICO;
1974 Apex closed down its copper mining operations due to the copper
price collapse in the world market and decided to focus its activities on gold exploration and development in the Masara district; gold mining operations thrived until 1989;
1990 Mining operations at Masara were suspended in the face of weak
gold prices combined with prolonged labor conflict. Local residents began small-scale mining of high-grade sections of the underground workings. Apex leased various parts of the property to small scale sub-contractors in exchange for royalties and rental payments.
The processing plant was also leased to sub-contractors who utilized parts of the plant for processing ore produced from their small-scale mining activities;

28
1995 Apex entered into an agreement with Base Metal Mineral Resources Corporation (BMMRC) giving the latter an option to evaluate the property. BMMRC operated the underground mine and the gold mill and equipment which it rented and took over the marketing and selling of the mine produce; BMMRC also pursued exploration efforts in the area;
1997 Apex-BMMRC agreement was terminated when BMMRC decided
to withdraw from the property; left on its own, Apex initiated development of the gold veins including those not previously worked by BMMRC;
2000 Apex stopped operations after incurring continuing losses due to
prolonged weakness of the gold market;
2003 Apex entered into separate operating agreements with Goldridge Mining Corporation, Viclode Mining Corporation and Mintricor Inc. Goldridge worked the Masara and Manganese veins while Viclode operated the various levels of the “Dons” veins area. Mintricor, on the other hand, initiated plans to re-work the mill tailings but was not able to advance to operating stage;
2005 On August 24, 2005, Crew Gold Corporation (Crew Gold) and its
local partner Mapula Creek Gold Corporation signed a Definitive Agreement with Apex to purchase the latter’s 72.8% shares in the company. The formal transfer of shares and ownership was completed on December 14, 2005. Crew Gold acquired and refurbished the Apex plant and commissioned it on December 2006;
2009 Crew Gold Corporation sold its total shares in Apex to Mindanao
Gold, a fully owned subsidiary of ASVI, a Malaysian company. 9.2 Brief description of the essential works done by previous workers
Since the discovery and operation of the gold-base metal quartz veins by Davao Gold Mining Company, the latter expanded its operations in the area by initially utilizing its nearby 250-tpd flotation-cyanidation plant. Exploration and development activities followed intermittently, undertaken by the other Elizalde and Co. subsidiaries that include Panaminas Inc., Masara Mining Co., and Samar Mining Co. (SAMICO).

29
By 1953, Davao Gold Mining Company had blocked sufficient gold reserves that warranted construction of a 70-tpd gold processing plant. However, it was only later in 1955 under SAMICO that the Masara Gold Project evolved into a producing mine with the construction and commissioning of a 250-tpd flotation / cyanidation plant.
The SAMICO-initiated exploration works resulted in the discovery of additional
copper deposits within the company’s tenement area which encouraged the management to decide to shift to copper mining and productions in 1957. The old gold mill was converted into a copper ore processing plant which operated at 1,000tpd capacity. The copper operation continued even after Apex Mining Company purchased the property from SAMICO in 1973. In late 1974, the price of copper in the world market collapsed and Apex eventually decided to suspend all copper mining activities in Masara. However, despite the downturn in the copper market, Apex persisted in carrying out systematic exploration programs, albeit intermittently, in the known gold- and copper-bearing areas from 1975 to 1978. The exploration campaign yielded a drill-delimited resource estimated at 89 Mmt averaging 0.40% Cu and 0.40 g/t Au for the combined Mapula, Kurayao and Teresa porphyry copper-gold deposits. The exploration efforts of Apex were also able to delineate an estimated 6,259,500 mt of epithermal-type gold-base metal quartz veins resource averaging 8.91 g/t Au for Masara Mines. Apex focused its activities in the Masara, Wagas and Hope vein areas where, from 1976 to 1989, the Company produced 573,022 oz of gold from about 3.5Mmt of gold ores extracted from these three veins.
In 1991, the mining operation was forced to stop due to festering labor
disputes compounded by prolonged depressed gold prices. Apex carried out only limited activities including small scale mining operations during most of the early 1990s.
In 1995, Base Metal Mineral Resources Corporation (BMMRC) signed a
Mines Operating Agreement (MOA) with Apex to evaluate and develop Masara Mines. BMMRC commissioned ACA Howe International Limited to appraise the potential of the 11 known major veins found in the property. ACA Howe came out with an estimated global (underground) reserves totaling 2.589 million tons averaging 6.21 g/t Au. BMMRC started initially at 350tpd milling rate using the old Apex Flotation/CIP Mill with a plan to eventually increase the milling rate to 1000tpd. However, in 1997, the MOA between BMMRC and Apex was terminated when BMMRC decided to give up its option on the property. Left on its own, Apex initiated exploration and development works on the veins including those not previously worked by BMMRC.
In 2000, Apex decided to stop its mining operation in the face of continuing
losses and prolonged uncertainty in the gold market.

30
In 2003 Apex entered into separate operating agreements with Goldridge Mining Corporation, Viclode Mining Corporation and Mintricor, Inc. Goldridge worked the Masara and Manganese veins while Viclode operated the various levels of the “Don” veins. Mintricor, on the other hand, initiated plans to re-work some of the tailings, however, for some reasons, it was never able to advance the project to operation stage;
On August 24, 2005, Crew Gold Corporation (Crew Gold) and its local
subsidiary, Mapula Creek Gold Corporation, signed with Apex a Definitive Agreement to purchase the latter’s 72.8% shares in the company. The formal transfer of shares and ownership was completed on December 14, 2005.
In 2005, Snowden was commissioned by Crew Gold to review and evaluate
the resource of Apex Mines and prepare an updated resource estimates for Apex. In its report to Crew Gold, Snowden concluded that there was substantial potential for new resources at Apex Mines that could sustain a viable gold mining operation beyond the 7.5 years projected mine life.
This was premised on Snowden’s observation that there were structures, both
old and “new”, not included in the first estimate and which, with additional exploration, could probably increase the resource / reserve, substantially.
Crew Gold carried out intensive exploration work program to evaluate the
contract area by surface mapping, surface and underground sampling. Also, as part of Snowden’s recommendation, Crew Gold also carried out an exhaustive drilling program to gather further information on the known gold veins and their continuance along strike and dip. This program also aimed to gather more subsurface data to justify elevating inferred resources into higher categories that would be useful to mine planners and the mining operation staff. The work program also included rehabilitation works of old underground workings, mine development and achieving production within 2006. In December 2006, Crew Gold refurbished and commissioned the Apex gold processing plant.

31
In November 2009, Crew Gold sold its rights to Mindanao Gold, a wholly owned subsidiary ASVI, a Malaysia-listed exploration and mining company. ASVI subsequently renamed Masara Mines as Maco Mines in recognition of the host municipality, Maco, rather than just the host barangay, Masara. The Maco Mine geological staff and its consultant firm ASVITSG, an ASVI subsidiary, have been working on the verification and confirmation of the resources declared by Crew Gold in the Maco Mine area and is also exploring aggressively to find additional resources within the known structures. The Team had been working to capture and verify all data for a geostatistically-based computer model of the deposit which could assist in better definition of ore shoot morphology and predictability. The exploration efforts were also geared in the identification and discovery of hitherto, unknown gold-bearing structures and porphyry copper deposits.
9.3 Conclusions of each of the previous workers
Table 9.3.1 presents a summary of the various resource estimates made for the Masara mines along with the classifications or codes and other notes. Citations in the text are in the references section, which may include other reports and communications cited elsewhere in this work.

32
Table 9.3.1 Previous resource estimates, and codes used to classify and methodologies
Year Author(s) Reserve or Resource Methodology
Applicable Code used to classify
Notes
2009 T Malihan Resource Review of T. Santos
PMRC Classifies and provides a report stating the 2009 Resource to be PMRC- compliant.
2009
T Santos Resource Long Section, Polygonal method (Avg Grade per block)
Categories used are based on USGS 1980 code but reported as NI 43-101 - compliant by Crew gold, and PMRC complaint by Apex to respective Stock Exchanges
Very conservative with most of the resource being readily converted to reserve. Reviewed by TD Malihan, CP Geology. Not compliant as no report presented.
2007 SMJensen and Petersen
Resource Long Section, Polygonal method (assigned Grade per block with a payability penalty)
Code is not specified but reported as NI 43-101- compliant by Crew gold
Conservative but then some inferred blocks go beyond the scope of the methodology stated to bulk out Inferred resources. Report is not suitable for a compliant format.
2006 S Dominy Resource Long Section, Polygonal method (assigned Grade per block with a payability penalty)
NI 43-101
2004 MGB Reserve Long Section, Polygonal method (Avg Grade per block)
Claims to be JORC-compliant but Snowden says it is not
2001 Apex Resource (stated as
reserve
Long Section, Polygonal method (assigned Grade per block with a playability penalty)
Roughly USGS 1980
SG 2.45 t/m3
1995 ACA Howe Reserve + Resources
Long Section, Polygonal method (Ave. Grade per block)
USGS 1980 SG 2.5 t/m3

33
Table 9.3.2 Global Resource Tonnage and Grade reported Number of veins
included in the resource
Global Resource Tonnage
Grade (g/t A u)
Apex, 2009 14 2.8 Mt 5.7
Crew, 2007 14 10.4Mt 6.1
Snowden, 2006 14 5.7 Mt 6.3
MGB, 2004 11 6.1 Mt 7.8
Apex, 2002 11 5.9 Mt 7.1
Howe, 1995 11 2.6 Mt 6.2
LMMCL, 1994 12 4.3 Mt 5.9

34
10.0 HISTORY OF PRODUCTION
10.1 Production History of Apex Mines From 1976 to 1989, Apex extracted 573,022 ounces of gold from about 3.5
Mmt of gold ores. In 1991, operations were forced to stop due to festering labor disputes
aggravated by prolonged depressed gold prices, Apex carried out only limited to small scale mining operations until 2000 when mining activity was finally suspended.
In 2003, Apex entered into separate operating agreements with three mining
contractors, Goldridge Mining Corporation, Viclode Mining Corporation and Mintricor Inc. Apex got a percentage of the contractors’ gold production as per contract agreement.
From 2005 when operation was revived under Crew Gold, and up to October
2009, Apex produced a total of 45,929 oz of Au and 150,707 oz of Ag. From November 2009 to 2011, Apex under ASVI (Mindanao Gold), produced
a total of 55,693 oz of Au and 270,070 oz Ag.
10.2 Areas mined within the Tenement Area The copper ores were mined from the Kurayao and Wagas areas while the
gold mined from the mid-1970s to 1980s was produced from the several vein systems within the tenement particularly from the Hope veins, the Don veins and the Wagas-Masarita veins.
Starting 2005, when Crew Gold took over, development and mining were
concentrated in the Maligaya and Malumon areas, wherein the Bonanza, Masara and Sandy vein systems were the major sources of gold ores.
10.3 General description of mining, ore beneficiation, concentrate, mineral
product market Several mining methods have been employed throughout the years of mining
operation in the Masara District. The first two decades of mining employed the conventional shrinkage method.
In the late 2000s, the ore was primarily extracted through cut-and-fill. In areas
where the vein is thin, conventional mining was done like modified shrinkage. In the middle of 2010, longhole mining was introduced.

35
Other mining methods, such as modified shrinkage method is used where it is applicable. Ore then goes through primary and secondary crushing before proceeding to a two-stage milling—rod mill and ball mill.
After grinding, the ore goes through the thickeners followed by gold and silver
recoveries by cyanide leaching and adsorption to activated carbon in the CIL tanks. The loaded carbon will then undergo stripping and the precious metals deposit onto steel wools, after which, recovered sludge will then be refined by smelting. The final product is doré which usually contains 14-20% Au, 75-80% Ag and 1-5% other elements.
10.4 Tonnage mined and metals sold
Table 10.4.1 Tonnes mined and milled at Maco by Apex Mill Production
Month / Year Tonnes Mined Tonnes
Milled Mill Head
Ore Au, g/t Waste Total Au Ag December 2006 13,129 4.07 66,379 79,508 1,529 4.29 18.72 2007 78,077 3.83 228,609 306,686 84,965 3.17 13.59 2008 166,971 4.59 85,642 252,613 171,760 4.59 20.99 2009 148,417 5.88 52,048 200,465 151,320 5.09 32.69 2010 214,650 5.24 117,678 332,328 192,586 4.92 30.78 2011 208,849 4.99 165,499 374,348 202,581 4.73 32.01 Total 830,003 5.01 715,855 1,545,948 804,741 4.65 27.52
Table 10.4.2 Apex Mill Production
Month/Year Bullion, Au oz Bullion, Ag oz December 2006 133.9 439.1 2007 7,228 21,790 2008 21,618 60,179 2009 20,727 79,968 2010 25,659 113,007 2011 26,256 146,294 Total 101,622 421,677

36
11.0 REGIONAL AND DISTRICT GEOLOGY 11.1 Regional Tectono-Geologic Setting of Masara Gold District
The Philippine archipelago comprises several tectono-stratigraphic terranes made up of mostly Cretaceous to Quaternary volcano-plutonic arcs derived from or generated by two oppositely-dipping subduction systems - the west-dipping Philippine Trench located on the east of the archipelago and the east dipping Manila Trench located on the west. Their compressive action exerts wrenching pressure and might have accounted for the archipelago’s seemingly twisted configuration. This wrenching tectonic force also accounts for the existence of the Philippine Fault, a +1200km structural break that runs from northwest to southeast across the entire length of the Philippine archipelago. Most of the tectonic earthquakes recorded in the country were generated along the Philippine Fault Zone attesting to its tectonic activity. The PFZ is also correlated with the formation of the major copper and gold deposits in the country and the more famous mineral districts in the Philippines are found along or within this zone suggesting that this prolific structure served as conduit where metal rich magma rose and formed the deposits that are known today. As a whole, the Philippine archipelago is a mosaic of largely Tertiary terranes built upon a variety of basement rocks from continental edges and fragments to oceanic lithosphere, marginal basins, and older arcs. The most famous of these terranes are the Luzon Central Cordillera arc and the Pacific Cordillera of Mindanao arc (PCA) which encompass the archipelago from the Eastern Mindanao gold-copper province to the Jose Panganiban-Paracale gold district in Camarines Norte in southern Luzon and the world famous Baguio-Mankayan Mineral District in the Central Cordillera of northern Luzon. These two arcs have similar tectonic, structural, and magmatic histories, and both are endowed with high concentration of gold and copper deposits.
The PCA has been subdivided into three (3) microblocks bounded by the
North-northwest sinistral faults, namely; Lianga and Cateel Faults and the Pujada Thrust. The bounding western shear is the main trace of the Philippine Fault. These microblocks roughly correspond to the three known gold-copper districts, namely: the Surigao District; the Central District, and; the Masara District.
Together, they comprise the Eastern Mindanao Gold-Copper Province (Michell
and Leach 1991) which is roughly 300 km. from north to south and compares in areal extent to the Central Cordillera arc of northern Luzon.

37
The Apex MPSA group is situated specifically at the southern PCA arc-terrane and along the early to mid-Tertiary calc-alkalic to high potassium diorite intrusive and co-magmatic andesite complex which is typical of the Masara Gold-Copper District. This volcano-plutonic arc is correlated to the subduction of the Eurasian Plate underneath the Philippine Sea Plate (PSP) along the segment of the Philippine trench.
The Masara District, which includes the known Masara-Hijo-Amacan copper-
gold deposits, is situated in what appears to be a dilational jog of the Philippine Fault Zone within caldera structures. It is underlain by a sequence, from oldest to youngest, of:
a) Pre-Cretaceous Basement Complex consisting of amphibolites,
schists and serpentinites, b) Cretaceous-Paleogene Sediments - Basic Volcanics (Masara
Formation) c) Paleogene-Oligocene Sediments d) Lower to Upper Miocene Limestone e) Pliocene to Pleistocene Volcanic Flows and Pyroclastics and f) Quaternary Alluvium
The older rock sequence (rocks units a to d) is intruded by:
a) Middle to Late Miocene quartz diorite stocks and dikes, b) Middle Miocene to Pliocene microdiorites, aplites and plagiophyric
andesites (Mercado et al,1984), and c) Pliocene to Pleistocene andesitic to dacitic volcanics such as plugs,
domes, hypabyssal - plagiophyric dikes and pyroclastics.
The oblique subduction and arc polarity reversal have generated large magnitude wrench faults, such as the Philippine Fault Zone (PFZ). This fault zone absorbs stresses from the opposed plate motions not accounted for by subduction and has created a long-lived extensional tectonic regime within which all the known major gold and copper districts are situated (Pubelier et. al.1991, and Quebral, 1994).
This early compressional tectonic regime generated the N-NW sinistral and
thrust faults with the NE extension being a favored trend of the early Miocene intrusives as in Amacan and Asiga.

38
The emplacement of diorite intrusives (i.e., the so-called Mati Diorite Complex in the district) along the structural trend of the PFZ, probably accounted for the source of hydrothermal fluid emanating from dioritic magma. The hydrothermal fluid, during the later dioritic intrusive phase, partially replaced the metasediments and volcanics and gave way to the gold and copper mineralization found in the district.
Figure 11.1.1 Regional Geological and Tectonic framework of the
Masara Gold District (after Coller, 2011)
11.2 Stratigraphy Apex’s MPSA contract area is underlain mainly by series of metasedimentary
and metavolcanic rocks which form the Cretaceous-Paleogene Masara Formation. This dominant formation is intruded by (a) Middle to Late Miocene quartz diorites occurring as mini-stocks, hybrid dikes, cupolas and apophyses; b) later microdiorite, aplite and feldspar porphyry dikes; (c) Pliocene to Pleistocene andesite to dacite plugs, domes and hypabyssal dikes; and (c) pre- and post-ore Plio-Pleistocene plagiophyric dikes.

39
The Masara Formation consists of highly indurated wackes with minor calcarenite/limestone intercalated with andesitic flows, flow breccias, and pyroclastics with minor basalt, thin-bedded tuffs, and sandstone (Mercado et al, 1984; Santos-Ynigo, 1982; Malicdem and Pena, 1967). The quartz diorite is light colored, phaneritic-porphyritic, and composed of plagioclase, quartz, hornblende, and minor pyroxene. On the other hand, the pre- and post-ore andesite to dacite porphyry dikes contain phenocrysts of plagioclase, quartz, hornblende, and biotite set in a granular matrix of sodic plagioclase and quartz.
11.3 Structural Geology
Mercado et al (1987) recognized major structural features in the area such as: a) a steep NE-dipping, NW-trending left-lateral strike-slip faults representing local sections of the Philippine Fault System;
b) a large Valles-type caldera (Sillitoe and Bonham, 1984) or volcanic center (Shimron, 1981; Esguerra, 1982), with the periphery apparently defined by a ring (crescentic) fault zone;
c) a less dominant set of second order NW and NE conjugate faults, and
b) a N-S system of gravity faults.
The thrust faults (mostly post-ore?) were recognized also as fairly distributed at the central area and where, toward the area’s perimeter, the thrusts generally dip away from the volcanic center. Thrusting movements definitely took place before the Pleistocene. A few minor sub-parallel sets of folds with northerly to north-northwesterly axes are found at Masara proper as well as southwest and west of Apex claims (Mercado et al, 1987).
The Masara gold-copper deposits have been inferred to be apparently
situated within a dilational jog, along a splay of the Philippine Fault and within or at the peripheries of the postulated Masara Caldera. The dilational jog mainly consists of NW to WSW- trending left-lateral strike slip faults that were later infilled by gold-base metal quartz veins and plutonic to hypabyssal intrusives.
The strong parallel structural pattern (i.e., major NW and NE conjugate
fractures) is probably the result of a left-lateral strike slip couple created by an approximately E-W trending primary compressive stress (sigma 1). The stress field responsible for this structural pattern must have had a maximum E-W compression with consequent maximum strain directed to the north, giving rise to the dominant second order NW and NE faults.
Slightly re-oriented pressures formed the less dominant set of second order
shears and minor north trending folds, while north striking central Masara fractures that were subsequently converted to high angle gravity faults arose from the relaxation of stress (Mercado et al, 1987).

40
This structural scenario would likely develop dilational portions along the
WSW-ENE portions of the NW to WSW-trending sinistral strike slip faults. The sudden relaxation of the E-W directed primary compressive stress could develop NS- to NNE-trending normal faults. This structural analysis is supported by the prolific occurrence of gold and base metals along the WSW-ENE bends of the vein systems. Similarly, the porphyry Cu-Au deposits are emplaced along NS to NNE-trending structures which are apparently controlled by thrust and normal faults.
Coller (2011) made an exhaustive study of the structural setting of the Masara
District in relation to the regional tectonic setting and the characteristics of the major vein systems found in the district (Fig. 4).
Figure 11.3.1 Geometry of the Masara Gold District with mineralized structures
bounded by the PFZ (after Coller, 2011)

41
11.4 Mineralization location(s) and general description At least four (4) mineralization styles were identified by previous workers in
the area such as: (a) gold-base metal quartz veins, (b) porphyry Cu-Au, (c) sediment-hosted and stratabound disseminated gold, and (d) base metal gold skarns. Apex has, so far, confirmed on the ground, most of the gold-base metal quartz veins and porphyry copper-gold deposits in the tenement area. 11.4.1 Gold-Base Metal Quartz Veins
At least 15 gold-base metal quartz vein systems are currently known, namely: the Bonanza-Masara, Sandy, Manganese, Jessie, Maria Inez, St. Benedict, St. Francis, St. Vincent, Don Fernando, Don Mario, Don Joaquin, Don Calixto, Masarita, and Wagas. These veins occur within the Masara Caldera. The veins strike NW to WSW, dip steeply to the northeast, range from about 1.0 to as much as 5.0 m. width, up to as much as 3,000 meters in strike length, spaced 100-500m. apart and form a distinct parallel vein pattern. The ore minerals consist of pyrite, sphalerite, galena, chalcopyrite, bornite, and fine gold while the gangue minerals are comprised mostly of quartz, calcite, clay and minor garnet, epidote, dolomite, rhodonite and rhodocrosite. The veins show both fissure-filling (cockade, colloidal banding, crustiform, drusy, vuggy) and replacement (selective replacement of calcareous beds) textures. The veins are observed to widen within the Masara Formation and thin/pinch within the diorite and andesite porphyry intrusives. High gold assays are usually associated with high base metal contents.
Vein alteration within and along the immediate wallrocks of the veins
consist of quartz, calcite, illite, illite-smectite, and relict (?) garnet/epidote. The upper levels of the vein systems usually show quartz, illite, illite-smectite, and calcite alteration superimposed on an older porphyry copper-related sericite-calcite-chlorite (SCC) or phyllic alteration.

42
The locations of the major epithermal veins in Masara are shown below:
Figure 11.4.1.1 Location of Mineralized Vein Systems of Maco Mines
(after Sheppard, 2011)
11.4.2 Porphyry Copper-Gold Deposits The mid-Miocene diorite intrusives and Pliocene andesite porphyry domes
and dykes have been attributed to the generation of Apex’s major porphyry copper-gold deposits (Mapula, Kurayao and Theresa) as well as that of North Davao’s (NMDC) similar class deposits (the Amacan porphyry copper gold, the Upper Tagbaros and the Panoraon deposits).
The Apex porphyry prospects, which are largely located within MPSA-234-
2007-XI to the west of the gold-base metal vein systems, consist of three (3) small diorite-hosted porphyry deposits namely, Mapula, Kurayao and Theresa. Mapula is a more fully-drilled prospect while Kurayao and Theresa are only partly drilled. The lateral and vertical extents of mineralization are apparently not well constrained. The hydrothermal alteration pattern is characterized by a small central prograde potassic to peripheral propyllitic zones. Phyllic and intermediate argillic assemblages overprint the latter and are the main outcropping alteration. NNW to NS mesothermal veins associated with the later argillic alteration overprint the porphyries.

43
The North Davao Mining Corporation (NDMC) deposits include the Amacan Mine, Upper Tagbaros and Panoraon deposits. The Amacan deposit is predominantly hosted in andesitic volcanics that were altered to propylitic and intermediate argillic assemblages while the Upper Tagbaros deposit, located just north of Lumanggang and south of Manat (Alcantara and Sons; ALSONS) prospect, is associated with generally argillic assemblages, silica/clay (illite) / pyrite +/- kaolinite and alunite indicating a shallow exposed system.
The Panoraon copper deposit, on the other hand, shows clay-pyrite
dominated alteration, accounting for the leached nature of the outcrops. The copper content may be high which is very significant for this type of alteration. The wide zone of silica-clay-pyrite altered volcanic is intruded by andesite and dacite prophyries. An NDMC report mentioned that the diamond drill holes bottomed into ‘ore’, indicating that the porphyry mineralization may be still open at depth.
Figure 11.4.2.1 Porphyry Copper Gold Mineralization in relation to the
Maco Gold Veins (after Coller, 2011)

44
11.4.3 Sediment-hosted and Stratabound Gold Base Metal Veins The sediment-hosted replacement gold-base metal veins are located
along the peripheries of the postulated Masara Caldera. Within the Apex tenement area, they are typified by the Bunlang (Fiesta) and Kanarubi veins. The Bunlang vein strikes ENE to WNW-dipping moderately to the NW or NE and was traced along strike for at least 450 meters. It is still open in the WNW, ENE and at depth. It occurs as selective jasperoidal replacement of limestone with gangue mineralogy comprising of quartz, calcite, dolomite, garnet (retrogradely altered to leucoxene), and kaolinite. The ore minerals consist of pyrite, sphalerite, galena and chalcopyrite. The vein was already mined by open pit method but its underground potential has yet to be fully explored.
The Kanarubi Vein (a.k.a Don Manuel Vein) strikes NNW, dips 40ºSW
and is 10-18m wide based on drill intercepts. The vein was traced for about 2.8 km and is hosted by highly altered and brecciated sandstone, siltstone, and mudstone. The Kanarubi Vein has yet to be fully explored and exploited.
Within the NDMC area, the vein systems are generally hosted in
(carbonate) sediments quite similar of the Hijo Mine deposit. These are localized in karsted limestone overlain by an altered andesitic core. Other areas with similar gold occurences as Hijo Mine include the Lost Horizon, Bunlang (west of Lake Leonard) and Mainit (5 km north of Apex).
Salient features of the sediment-hosted, replacement gold-base metal
vein deposit are:
• Intense brecciation and silicification of the limestone • Argillic alteration of the overlying andesite • Sulfides comprise mainly of very fine grained pyrite, marcasite, and
arsenopyrite • The mineralization is highly anomalous in As, Sb, and Hg
11.4.4 Gold-base metal skarns
Localized small bodies of gold-base metal skarn mineralization have been found occurring near Wagas, Don Calixto, Masarita, Lumanggang-Hitch and New Year veins where these structures intersect calcareous horizons of the Masara Formation.

45
It has been conjectured that there is a good possibility that gold-base metal skarn mineralization exists or could be encountered beneath the gold-base metal veins. The known skarn alteration and mineralization exhibits assemblage comprising of garnet, epidote, actinolite, chalcopyrite, magnetite, pyrite, sphalerite and galena.
11.5 Historical Geology The Masara Mineral District is one of the three (3) districts of Pacific Cordillera
Arc which share similar tectonic, geologic, structural and magmatic histories. Available regional geologic and stratigraphic data show that certain rock types and stages of formation reflect certain periods or epochs when various gold and copper mineralization formed. Hence, the similarity in metallogenic history of the districts is indicated.
The following chronology of geological events within the district is suggested:
1. Deposition of pre-Tertiary volcanics-sedimentary sequence.
2. Deposition of Paleogene volcaniclastics, andesites and inter-bedded
deep marine sediments. This period is marked by quiescence and uplift forming limestones, marine sediments and limited sub-terrestrial volcanic flows and pyroclastics. It is also postulated that major thrusting and dismemberment of the ophiolitic suite of rocks have occurred in the Paleocene-Eocene epochs.
3. During early Oligocene, further regression formed the conglomerates,
coal-bearing beds, and shallow marine sedimentary rocks in other areas while in the Masara district, wackes and minor calcarenite/limestone intercalated with andesitic flows, flow breccias, and pyroclastics with minor basalt, thin-bedded tuffs, and sandstone of the Masara Formation were deposited.
4. In the late Oligocene, arc volcanism in eastern Mindanao formed the
huge Masara–Hijo–Amacan caldera within which the Masara mineral district is nestled. The volcanic activity was believed to have waned in early Miocene (Mercado et al, 1987).

46
5. Subduction of the oceanic plate east of Mindanao produced magmatism and dioritic intrusions in the Middle Miocene. Much of the mineralization of the district can be attributed to this phase. Further, it is inferred that major strike-slip faulting, converging at the Philippine Fault Zone, produced the structural breaks in the earth’s crust through which magmas rose along with their metal-rich hydrothermal solutions.
6. The Late Miocene saw the deposition of tuffaceous sedimentary rocks
along the margin of the dioritic arc. A period of quiescence allowed the formation of limestone bodies in shallow marine conditions.
7. Continued subduction during the Pliocene produced further intrusion of various andesite porphyry dikes and sills that have been correlated with the epithermal system development and the postulated deeper- seated porphyry systems.
8. The development of the Philippine Trench in the Late Miocene (?)-
Pliocene produce dacitic and andesitic plugs from rising magmas along with the formation of volcanic cones and calderas (e.g., Lake Leonard) throughout the district. It is also associated with the development of shallow epithermal gold systems the volcanic centers which postdate the gold and copper mineralization.
9. The Pleistocene marked the deposition of sedimentary units including
minor limestone flanking the volcanic centers.

47
12.0 MINERAL PROPERTY GEOLOGY 12.1 Geological work undertaken by the company in the property including
scale of mapping and laboratory tests undertaken for the samples In 2005, Apex (under Crew Gold) embarked in an exhaustive exploration
campaign, drilling a total of 212 coring holes with an aggregate length of 43,760 meters until December 2007. In late 2009 up to present, another drilling campaign was started, with underground and surface drill rigs to test extension of known veins at depth and along strike.
Geophysical surveys were also done in the third quarter of 2006. This
included Induced Polarization (IP) and magnetic survey. Concurrent with geophysical survey was grid soil sampling at 25-meter grids along the IP gridline. A 1:2000 scale map was generated from these surveys.
The Company also undertook underground as well as surface mapping within
its tenement area. Underground mapping was concentrated in Bonanza-Masara and Sandy veins which were the focus of mining activities while surface mapping was concentrated in other priority vein systems such as the northern extension of Sandy vein and its split/s, Don Calixto and Maria Inez. The underground mapping works were compiled in 1:250 and 1:500 scale maps while the detailed and semi-detailed surface mapping were plotted and compiled in 1:500 and 1:1000 scale maps.
Representative sampling underground was done at more or less regular
intervals on the face of an active development drive. Raises and stopes were also sampled at regular intervals. Soil sampling, rock chip sampling and trenching were practiced in surface sampling.
Samples delivered to the lab were analyzed for gold and silver content using
Fire Assay (FA). Atomic absorption spectroscopy (AAS) was primarily used for base metal analysis however, in cases where gold contents could not be detected using FA, AAS was employed.
12.2 Rock types and their geological relationships
The area is underlain mainly by series of metasedimentary and metavolcanic rocks which comprise the Cretaceous-Paleogene Masara Formation. This dominant formation is intruded by (a) Middle to Late Miocene quartz diorites occurring as mini-stocks, hybrid dikes, cupolas and apophyses; (b) later microdiorite, aplite and feldspar porphyry dikes; (c) Pliocene to Pleistocene andesite to dacite plugs, domes and hypabyssal dikes; and (c) pre- and post-ore Plio-Pleistocene plagiophyric dikes.

48
W.A.Sheppard, ASVITSG consultant for Apex, recognized four principal rock suites in Maco Mines which he named A1, D1, D3 and D1AN. These rock suites became his basis for host rock modeling in the Maco Mine area and allowed establishment of a new foundation for further host rock studies. This, he opined, can be further developed and extended to provide i) greatly improved geological prediction for drillhole planning and ii) essential geological insights for future vein Au exploration.
In his rock suite classification, Sheppard has established that diorite
dominates the Sandy host rocks, diorite and mixed andesite-diorite dominate the Malumon area, andesites and minor diorites dominate the Masara and Bonanza host rocks; through this area a sub-parallel swarm of late porphyritic diorite (DIO3) dykes have intruded this area focused by the presence of the major Masara fault
12.3 Description of various geological structures and their trends
The major structural features defined within Apex’s MPSA area and its general vicinity consist of: 1) NW-trending, steep NE-dipping left lateral strike slip faults correlated with and representing the local segments of the Philippine Fault System; 2) a large Valles-type caldera or volcanic center, the periphery of which is defined by a ring fracture zone; 3) a north-south system of gravity faults, and; 4) a less dominant set of second order northwest-northeast conjugate faults. Post-ore thrust faults are fairly well-distributed central to the area; toward the area’s perimeter, the thrust fault generally dips away from the volcanic center.
A few minor sub-parallel sets of folds with northerly to north- northwesterly
axes are also found at Masara proper as well as west to southwest of the Apex tenement. The NW-trending fault system is most dominant near the caldera center and its structures have been generally paralleled, if not followed, by an inner set of major auriferous quartz veins. Some of the gold-bearing veins and the known porphyry copper-gold deposits follow the conjugate northeasterly faults and the peripheral ring fracture system.

49
13.0 MINERALIZATION IN THE PROPERTY
13.1 Overview of the mineralization At least three types of mineralization have been identified within the Apex
property. These are the (1) high-level epithermal gold / silver vein mineralization; (2) porphyry-related copper-gold mineralization; and (3) skarn mineralization.
The gold veins within the Apex claims are further classified into either “clean
ore” or “complex ore” with clean ore generally characterized by low sulfide contents occurring in generally clean-walled tensional structures. Complex ore, on the other hand, has higher sulfide content occurring in wider shear structures. Clean ore is typified by Don Fernando, Don Joaquin, Don Mario, St. Vincent. Don Calixto and St. Benedict while complex ore is represented by the veins along the so-called Maligaya-Malumon trend (Bonanza-Masara-Sandy vein and their splits). Ore produced from the Maria Inez, Manganese, and St. Francis veins are also considered complex.
Figure 13.1.1 Map of Masara Showing the Economic Vein Zones
(after Coller, 2011)

50
13.2 Type of mineralization as mapped The veins along the Maligaya-Malumon trend are generally gold-sulfide veins.
Quartz and the carbonates (calcite and rhodochrosite) are the principal gangue minerals with quartz more dominant than the latter. Common sulfide minerals are pyrite, sphalerite, galena and chalcopyrite with minor occurrence of bornite and covellite(?). Occurrence of the sulfides ranges from localized streaks to semi-massive mineralization.
Veins, however, may not be entirely composed of ore and gangue minerals.
As observed in Bonanza vein system, the term “vein” is generally characterized by ore minerals occurring in silicified breccias with presence of quartz vein materials. At times, veins may not be clearly differentiated from its wall rocks like that in the Masara Main Vein. However, the Masara split vein is primarily composed of massive sulfides, which is also observed in Sandy South Split. Fault vein or gangue +/- ore minerals is also common.
The vein deposits may well be readily classified as epithermal-type deposits
but mineral assemblages suggest that they are transition from epithermal to deep epithermal / high level porphyry system.
13.3 Style of mineralization
The veins are emplaced along pre-existing structures and fractures, which have been subjected to intense intra-mineral shearing and/or cataclastic deformation as seen from the widespread microscopic slip planes, deformed quartz-calcite grains in micro- to coarse brecciation and inter mineralization brecciation.
Veins exhibit characteristics typical of both replacement and fissure filling.
Alternating crustified bands of quartz-carbonate and sulfides, as well as cockade and comb structures points to multiple and sustained phases of mineralization.
13.4 Wall rock alteration and paragenesis
Alteration developed in the wall rocks nearest to the vein is generally silicic-sericitic-argillic grading out to propylitic. Silicic alteration, however, accompanies the propylitic alteration with decreasing intensity as you move further from the vein. The intensity and composition of silicic-sericitic-argillic alteration varies from one vein to another and may even be absent on some veins, as observed in the Masara and Masara HW Split. This can be attributed to the lithology of the host rock of the vein which is generally volcanics. In the Sandy vein, which is diorite-hosted, silicic-sericitic-argillic alteration is more pronounced and more widespread.

51
13.5 Geological structures The Maligaya-Malumon “trend” is primarily controlled by fault and fractures,
which is related to the regional strike-slip faulting /stress field through which, this part of Mindanao had been subjected throughout its tectonic history.
13.6 Localization of the deposit
Vein deposits generally occur in faults and fractures. Faults usually, but not necessarily, occur on or near a lithologic contact as observed in the Bonanza vein, where the vein has been noted to have developed near or at the contact between volcanics and diorite.
13.7 Length, width, depth of mineralization
Veins in Maco Mines have been traced along strikes of up to more than 1000 meters with splits at least 100 meters in length. Vein structures average from 1 to 1.5 meters in width, with swells reaching up to 3 meters or more. However, widths can also be wider on portions where the wallrocks contain significant gold values, such as the main Masara Vein. Mitchell and Leach (1991) described the veins in the project area to have a vertical depth of at least 400m. Deepest workings in the area are on the Don Fernando Vein, which reached 340 m below surface. The other veins were generally worked down to 100m to 300m below surface. The mineralization in most of the exploited veins remains open at depth.
13.8 Element grade levels and patterns No recent comprehensive study was done on the grades of other elements
and their possible relationship with each other. However, it has been noted in a number of occasions that while, generally, the Au content does not seem to have a direct relationship with copper content, the Au grade is commonly higher where copper content is high. As regards other base metals, galena appears to have a direct relationship with gold with higher grade ore shoots usually noted to contain appreciable galena with them. For the other base metals, the relationship with gold has not been clearly established.
Mercado et al (1987) noted some zoning patterns although not too well
defined. Apparently, base metal concentration on topmost to intermediate levels—previously L+4 (L690) to L+7 (L780)—is higher, as manifested in massive replacement lenses of sphalerite, galena and chalcopyrite, than those in the in L+4 (L690) down to Level 0 (Elev. 555). These were observed in Masara, Don Joaquin and St. Francis veins.
ASVI conducted an extensive review of these relationships in late 2010 in an
attempt to better understand the ‘ore shoot’ formation in the Apex vein system.

52
13.9 Development of ‘ore shoots’ Development and exploration have demonstrated the existence of discrete
high grade shoots within the current and historic structures. This is, however, considered typical in most epithermal gold vein deposits where homogeneity of gold mineralization is more of an exception rather than the rule. Nevertheless, each gold vein deposit is unique and understanding the individual vein characteristics would be invaluable in the success of any exploration for such type of deposits.
13.10 Continuity of mineralization
Previous geostatistical studies on the Sandy Vein had confirmed the down plunge grade continuity exceeding 70 m (Subong, Arriola & McManus, 2009)

53
14.0 EXPLORATION
14.1 Geological work done
14.1.1 Geological data generated from mapping and surface sampling Daily underground and surface exploration mapping activities
generates valuable geological data useful for both mine planning and mine operations. The data consists of rock types, weathering, oxidation, color, grain size, structures, texture, alteration, veining and mineralogy. All these data are plotted on plan maps and sections to show all relevant geologic features such as:
• Visible boundaries of ore and any other significant mineralization • Boundaries of major lithological units • Position and orientation of major structures such as folds, faults,
prominent joint sets and others • Alteration patterns • Major veins or vein sets • Geotechnical data such as degree of fracturing, rock hardness
and others as required by the engineers
Channel cut samples are collected across the mineralized zone, vein and alteration from outcrop, surface trench, and underground working. The sampling dimension is dictated by the mapped geology, structure and mineralogy and based on the individual geologic boundary that each feature would indicate to be a mineralization control. The usual sampling width, e.g., contact to contact of alteration zone or vein, is from at least 0.3m to maximum 1.5m continuous channel sampling from hanging wall to footwall.
14.1.2 Geological map and sections
The following geologic maps and sections are being produced and/or worked on a daily basis or on an as needed basis.
14.1.2.1 Underground Maps:
Level Maps (Scales 1:250, 1:500m, 1:1000m) Sections (Scales 1:250, 1:500m, 1:1000m) Geologic Face Maps (Scale 1:100) Vertical Longitudinal Plans (Scales 1:1000, 1:2000)

54
14.1.2.2 Surface exploration maps:
Area Geologic Maps (Scales 1:500, 1:1000) Area Geologic Sections (Scales 1:500, 1:1000)
14.1.3 Sample location map The level, face, and surface maps serve practically as the location plan
for the collected samples.
14.2 Surface sampling 14.2.1 Outcrop sampling
For outcrops, mostly measured channel cut sampling is conducted while grab sampling is seldom done and if ever, this is for indicative grades only. The intervals for sampling are marked out on the exposed mineralized zone, vein or rock exposure and based on the individually indicated geological boundary which indicates mineralization control.
Where mineralized structures are steep-dipping, the appropriate
sample is a horizontal channel along floor or wall (or if that is where the best outcrop is). Where there is no certainty as to the attitude of mineralized zone, a sample consisting of both horizontal and vertical channels, composited over selected horizontal intervals, are used.
14.2.2 Trench sampling
The procedure for trench sampling is the same as for sampling any continuous rock or mineralized exposure as that in outcrop. Intervals for sampling are marked out on the exposed mineralized zone, vein or rock exposure based on their indicated geological boundaries that are considered to be mineralization controls.
Where mineralized structures are steep-dipping, the appropriate
sample is a horizontal channel along the trench wall. Where there is no certainty as to the attitude of mineralized zone, a sample consisting of both horizontal and vertical channels composited over selected horizontal intervals, are used.
14.2.3 Test pit sampling
The procedure for test pit sampling is essentially the same as for sampling any continuous geologic exposure as that of the trench.

55
14.3 Drilling and sampling
14.3.1 Type of drilling program In recent years, Apex has undertaken two drilling campaigns. The first
campaign was done in late 2005 to 2007 (under Crew Gold) while the second campaign started in late 2009 (under ASVI–Mindanao Gold) and is still on-going.
In the 2005 campaign, a Resource Definition Diamond Drilling Program
was implemented upon the approval of the MPSA-225. The program concentrated on the delineation of the Masara-Bonanza-Sandy-Maria Inez veins which was followed from NW to SE over a strike length of approximately 2.5km along the Malumon River valley.
Several other vein systems were also targeted in this drilling program.
This includes the Don Fernando-Don Joaquin system, Bibak vein, Jessie vein, St. Benedict, Masarita and St. Francis vein. Drilling in St. Francis vein area was also aimed to check the porphyry mineralization of the area.
A total of 212 holes were drilled with 43,760 m of drillcores produced.
The drill holes were mostly collared at the surface with only five collared underground. Surface holes normally started with PQ size which is reduced to HQ after about 100m. Further reduction to NQ size is also resorted to if necessary to reach the target depth.
The current drilling program started late in 2009 with an underground
Kempe rig primarily aimed to provide the mine operations advance information on the vein being developed. By January of 2011, another Kempe rig and an LM55 rig were deployed underground plus a surface rig commissioned for surface drilling. In early 2012, another LM55 underground rig was commissioned. All of the rigs, except the Kempe rigs, starts drilling with HQ size cores, which are then reduced to NQ size when necessary. One surface rig is capable of air drilling for holes needing pre collars to at most 150m.
Based on 58 drillholes from 2011, an average of 94% recovery was
computed. Based on drillcore diameters, the coefficient of variation (CV) denoting precision of recovery of smaller AQ holes was about +/-32%, more imprecise than the comparable CVs of larger HQ (+/-11%) and NQ holes (+/-12%). The average recovery of AQ holes amount to 84% recovery only while there is 97% and 96% average recovery for HQ and NQ holes. Out of 212 holes, 184 (87%) had downhole surveys by Crew. Preliminary data of Apex holes reveal only 19% had been surveyed by downhole camera (n=78).

56
14.3.2 Drill site spacing, depth of drilling Drillsite spacing for the 2005 Resource Definition Core Drilling Program
was initially at 100m interval which was later on followed with in-fill drilling to reduce the drill spacing to 50m . Drilling depth was dependent upon the projected vein intercepts and ranged from about a hundred to three hundred meters.
The following were some of the drilling statistics recorded during this
drilling campaign: • Lowest elevation reached by a drillhole (MS-01) was 328 ASL
(MS-01) • Deepest drillhole was recorded by SB-03 at 420.10 m • Shallowest hole was 80.30m deep recorded by BV-03 • Average length per drillhole was 206.42 m • Average dip/inclination is -58°
The current drilling program is a combination of in-fill, resource
definition and production support drilling. Targets are relatively shallow and spacing are generally designed at 25m to 50m intervals. Exploratory holes are usually drilled deeper depending on target structures.
14.3.3 Core logging
Drill cores are fast logged at the drill site for initial interpretation. Once delivered at the core house, the cores are photographed after which, detailed logging is conducted and the lithology, mineralization, alteration, core recovery and geotechnical characteristics are recorded. The core log sheet is encoded together with the assay results and other drillhole data in a database for geological modeling and mine planning. The specific gravity is determined in the assay laboratory.
14.3.4 Drill sample method and interval
The geologist determines the sample intervals after geological logging of the hole. Sampling interval is determined by a lithological or stratigraphic boundary or when a significant change in mineralization or alteration style occurs. If a vein will be sampled, the hanging and foot wall of the vein will also be sampled. The minimum sampling width for vein zones is 0.30m while the maximum width is 1.00m. For the wallrocks, maximum sampling interval is 2.0m.

57
The sampled cores is cut into half (or a quarter if the sample is a duplicate) with one half left in the core box as reference while the other half sent to the assay lab for analysis. This is only applicable to PQ-, HQ-, and NQ- size cores while for AQ size drill cores, the whole core is sampled and sent to the lab.
14.3.5 Drill core photographs
Drill cores are photographed upon arrival in the core house. Previous practice takes photos only of wet core. In this latest drilling campaign, cores were also photographed dry. Photographs of dry cores aid the Engineering as significant fractures and veins may be hidden or obscured when cores are photographed wet. For geological purposes, however, wet photographs of cores bring out important geological features more clearly.
For better resolution, a core box is photographed on each half. Photos
are also taken on intervals where there are good intersections. Ideally, photography should be in an orientation such that shadows will
not be cast across the cores that may cause obstruction and poor image capture.
14.4 Exploration Geochemistry 14.4.1 Description of geochemical survey type: drainage, soil, rock,
vegetation, bogs, etc. The geochemical survey done in the Masara area, albeit scanty at
best, was the detailed grid soil sampling covering the Maligaya-Malumon area conducted in 2006 under the watch of Crew Gold. The report and the data from this survey, however could not be located in the company’s archive.
A soil sampling was done in middle of 2010 in MPSA-225 wherein 419
soil samples were collected in the area. Concurrently, soil sampling was also done in Parcels III and IV of MPSA-234.

58
Figure 14.4.1.1 Map showing the sampling points and the Au grade.
14.4.2 Description of sampling and analytical methods employed In conjunction with IP Resistivity survey, the soil grid geochemical
sampling method was simultaneously applied to test also the sulphide quartz vein systems and splits that are concealed under the study area. The end objective was to delimit any significant gold spatial dispersion patterns that could indicate the concealed gold-bearing veins or structures. Soil samples were collected at every 25m grid interval along the IP lines. All samples were analyzed only for gold using Fire Assay method. Geochemical results were plotted and compiled in a 1:2000 m scale base map.
14.4.3 Definition of background, threshold and anomaly levels for the
elements determined There were no available records to show whether or not the assay
results were treated and computed to define the background, threshold and anomaly levels for gold.

59
14.4.4 Application of synthesis and interpretive techniques (for single and multi element) to bring out significant geochemical features related to mineralization There were no indications whether or not statistical analysis was a preferred technique in the subsequent geochemical interpretation.
14.4.5 Description of geochemical anomalies detected
Several spatial distribution trends of soil gold values were apparently indicated based on the geophysical and geochemical base map on a scale of 1:2000. There are no indications if multivariate statistical methods were employed.
14.4.6 Relation of geochemical findings to geology and mineralization
Several spatial dispersion patterns of gold were delineated in the available base map. Apparently, there are no available interpretations reported to relate the findings with geology and mineralization of the surveyed area.
14.5 Applied Geophysics 14.5.1 Description of geophysical method used and objective of the survey
The Induced polarization (IP) and magnetic method was used to detect and test the earlier known major sulphide quartz vein systems that are concealed under the Maligaya-Malumon area for further geologic mapping, sampling and evaluation.
14.5.2 Description on whether a geophysical contractor, independent
consultant or an in-house staff was engaged in the conduct of the geophysical survey
The company contracted McPhar Geoservices Philippines Inc. in conducting the limited geophysical survey over the Maligaya-Malumon area in 2006.
14.5.3 Description of equipment used, its limitations and the survey parameters adopted
Equipment used was the McPhar P660 unit with ~ 2.5 kva motor generator with the following survey specifications:
Electrode Array : Dipole-Dipole Electrode Interval : 25 m Frequency : AC1 = 0.125 Hz ? AC2 = 2.50 Hz ? Separation, N : 1-5? (inclusive)

60
14.5.4 Description on how survey was carried out (design of stations with respect to mineralization trends)
Based on the available base map, the limited survey was undertaken covering two (2) adjacent areas namely; IP Area 1 over the Maligaya area and IP Area 2 over the Malumon area.
In the IP Area 1, the designed grid lay-out was 100m by 25m consisting
of three (3) 700 m.-gridlines with aggregate of 87 stations at 25m interval.. In the IP Area 2, the grid lay-out was 200m by 25m consisting of two (2) 700m-gridlines, one(1) 800m-gridline and one(1) 1,125km-gridline with aggregate of 137 stations at 25m interval.
The design grid lay-out followed the generally northwest strike trend on
surface of the major veins namely: Manganese, Masara and Bonanza in Maligaya area while Sandy, Jessie and Sandy main veins and splits in Malumon area.
14.5.5 Description of interpretive tools used
The data on this item were not reported.
14.5.6 Discussion of essential results with respect to the objectives No proper interpretations had been reported as to relate the findings with geology and mineralization of the surveyed area.
14.6 Sample Preparation, Analyses and Security
14.6.1 Security and Chain of Custody of Samples
Flow chart 14.6.1.1 shows the sample dispatching procedure for all mine and exploration samples delivered to the Apex in-house assay lab.

61
Flowchart 14.6.1.1 Sample dispatching flowchart

62
14.6.2 Preparation and assay facility During the time of Crew Gold (2005-09), the drill cores
produced from Crew’s drilling campaign were sent to the McPhar Laboratory in Manila for sample preparation and analyses. Crew Gold later established its own in-house laboratory at the minesite.
Apex’s onsite Assay laboratory has been carrying out the fire assaying
(FA) as well as AAS assays for Maco Mines. The lab also carries out its own internal QA/QC with a separate sample preparation lab that processes all the exploration samples sent to the lab. The lab has been adequately equipped with all the essential tools required in assaying. The major assaying equipment is described as follows:
14.6.2.1 Sample preparation equipment
Sample preparation equipment has been installed in the Apex on-site laboratory to perform various functions. These consist of:
1. DRYING OVEN– This is used to dry samples prior to their
preparation for assaying. All samples are dried as metal contents are reported in dry weights.
Drying Process:
1. Sample from the sample bag is loaded in the drying pan with its sample tag.
2. The sample in the pan is charged in the drying oven. 3. The drying oven is set at a temperature range of 120˚C
to 130˚C and drying time is 6 hours for the mine samples and 12 to 24 hours for the exploration samples.
4. When the sample is sufficiently dried, it is taken out using tongs or trolley.
5. After cooling, the sample will be crushed right away to minimize moisture drawn from the atmosphere before assaying.

63
Photograph 14.6.2.1.1 Drying Oven used at Apex minesite laboratory
2. JAW CRUSHER – a jaw crusher is used to reduce the size of the larger fragments of the samples rather rapidly.
Crushing Process: 1. The sample is fed to the top of the crusher. 2. The moving jaw will crushed the larger sample
fragments into smaller sizes. 3. The crushed sample materials are collected in a tray
placed at the bottom of the crusher. 4. The sample in the tray is transferred to the original pan. 5. The crusher and the pan is cleaned using compressed
air.

64
Photograph 14.6.2.1.2 Jaw Crusher at Apex minesite laboratory
3. BOYD CRUSHER–The Boyd crusher is designed to finely crush the sample to not more than 2mm sizes. Unlike in most jaw crushers, only one jaw is driven and the other is kept stationary. The stationary jaw is moved to adjust the bottom opening width. In Boyd crusher, both jaws move, one top driven, one bottom driven. Both jaws can be moved at the non-drive end to allow for variation in output size and jaw wear.
Crushing Process:
1. The sample is loaded at the top opening of the Boyd crusher.
2. The Boyd crusher crushes the sample finely before transferring to the Rotating Sample Divider via a vibrator feeder.
3. The Rotary Sample Divider which stands alongside with the BOYD crusher splits out the pre-set portion for pulverizing.
4. The split portion for pulverizing is taken out from the pan and transferred to the original container carrying the sample tag.
5. The crusher is cleaned using compressed air.

65
4. PULVERIZER– A Rocklabs Ring Mill is use to pulverize the samples to a fine grind of 90% passing -75 microns.
Pulverizing Process: 1. The sample is loaded in to the bowl (500g to a 1000g
bowl). 2. A pneumatic airbag presses the bowl. 3. The bowl rotates to grind the samples inside the bowl at
a pre-set timer depending on the classification of ore (7 to 10 min.)
4. The fine grind sample in the bowl is transferred to the original container.
5. The pulverizer is cleaned using compressed air.
Photograph 14.6.2.1.3 Rocklabs Ring Mill at Apex minesite laboratory

66
5. SPLITTER – Jones splitter is used to reduce the volume of samples prepared for pulverizing.
Splitting Process:
1. Samples in the pan is spread in the Jones Splitter and riffled immediately after crushing/pulverizing.
2. The samples in the right side is transferred to the original pan.
3. The samples in the left side will be discarded.(reject)
14.6.3 Sample preparation Flow chart 14.6.3.1 shows the present sample preparation procedure in
the on- site assay lab of Apex:

67
Flowchart 14.6.3.1 Sample preparation flowchart
Assay Sample
Drying
Crushing
Assay samples are submitted by the geology department in which sample preparation and assaying is done in the laboratory. The flowchart outlines the total sample preparation.
Drying‐Drying of mine samples is typically done for 6 hours at 120°C to 130°C in an oven specifically designed for drying rock samples. Oxide samples need longer time of drying which is about 12 to 24 hrs. at 120°C to 130°C.
Primary Crushing – (Jaw Crusher) samples above 2” will be crushed in a Jaw crusher to reduce the size of the sample to 1”.
Secondary Crusher
Secondary Crushing‐ (BOYD Crusher) sample size of 2” will be crushed in the BOYD crusher with automatic sample divider set at 50%. Half of the sample will be pulverized and the other half will go to coarse rejects.
Pulverizing – to further reduce the sample size to a fine grind of 90% passing 75microns the sample is pulverized in the Rocklabs grinding mill. For exploration samples, an LM2 Essa pulverizer is used.
Pulverizing
Scoop
Scoop – a scoop of 300 grams is taken from the pulverized samples for analysis/assaying.

68
14.6.4 Analytical methods used The main analytical method used for gold samples is fire assaying with
a detection limit of 0.500 g/t. For base metals, silver and gold with <0.5 g/t, AAS is used which has a detection limit of 0.033g/t for gold and 0.001% for base metals (Acut, 2009).
Flow chart 14.6.4.1 shows the steps undertaken when doing fire
assaying.

69
Flowchart 14.6.4.1 Fire assaying method
Oxides
Sulfides
Fusion
Cupellation
Fusion – 50g of sample is weighed in a crucible with flux and charge in the furnace with a temperature set at 1100˚C.
Cupellation – the lead button formed after fusion which collects all the precious metal (gold, silver and PGMs) is placed in an absorbent vessel (magnesia cupel) and fused at a temperature of 950˚C.
Parting – is process in which gold in the prill is separated from the silver by nitric acid which dissolves the silver but not the gold.
Acid Digestion
Parting
Weighing
AAS Aspiration
Weighing– the resulting prill from parting is annealed in the furnace to produce the gold. The gold is weighed in the micro balance.
Acid Digestion‐ the prill is digested in the hot plate with 1ml HCL and 1 ml Nitric Acid. Then the solution is diluted with 10ml distilled water.
AAS Reading‐ the prepared solution of gold is directly aspirated in the AAS.

70
The various stages in fire assaying are described as follows:
1. Fusion – a 50g sample is fused in the furnace with the aid of chemicals (litharge, soda ash, borax) termed as “Flux” at a temperature set at 1100°C. Silver is added in the flux mixture when silver is to be determined (1pc silver inquartz). The precious metal is collected by the lead in the flux and the slag is decanted. When the melt solidifies, the resulting lead button is pounded with a hammer to an appropriate cube.
2. Cupellation – the cubed lead button is charged in a magnesia cupel
into the furnace set at a temperature of 900°C. The lead is absorbed in the cupel leaving the button or “prill”.
3. Weighing – The “prill” or “dore” is weighed if silver is to be determined.
4. Finishing – there are several methods to choose from as the finishing technique depends on the grade ranges of the sample. This is the final step undertaken wherein gold is dissolved in the acid and the gold in the acid solution is determined. Some of the finishing that are employed are the following:
A. Gravimetric Method – the prill is placed in the porcelain crucible with nitric acid, the silver is dissolved but not the gold. After dissolution of the silver, the prill is annealed.
This method is very accurate method for gold determination of
high grade samples and is applied to samples with gold grade from 5g/t Au and up. Grades above 20 g/t Au is re analyzed by adding inquartz to ensure complete parting of silver from gold. The lower detection limit is 0.2 g/t Au with a precision of ± 0.02 g/t Au.
B. AAS Finish –the prill is dissolved in aqua regia and gold
solution is directly aspirated in the AAS.Lower detection limit is 0.01 g/t Au with a precision of±0.02 g/t Au. This method is used for samples with grade 5 g/t Au and below. Grades above 5 g/t Au will be re analyzed by gravimetric finish to confirm/check result.

71
C. AAS Finish- Organic Extraction – This method is used for sample leach in cyanide. The gold in from the acid solution is first extracted and concentrated into organic solvent before aspirating into AAS. The lower detection limit is 0.001 g/t Au with a precision of ± 0.002 g/t Au.
14.6.5 Quality Assurance /Quality Control of sample preparation and
analysis
Flow Chart 14.6.5.1 Quality Control of sample preparation and analysis
Assay
Crush/Split
Pulp/Split
Assay A
Assay B
Assay samples are submitted by geology in which sample preparation and assaying is done in the laboratory. The flowchart outlined the QC taken from each batch of sample delivery.
Coarse Duplicate‐ is taken from the 10th sample of every batch to determine if the particle size reduction is adequate. The duplicate is already assigned in the sample transmittal.
Pulp Duplicate – is taken from the 20th sample of every batch to determine homogeneity of sample split. The duplicate is already assigned in the sample transmittal.
Assaying by Primary Lab ‐ a 50 g of sample is taken for Sulfide samples by straight fire assay and 50 g is taken for Oxides by Fire/AAS finish as identified in the sample transmittal.
Check Assaying at secondary lab ‐ a duplicate pulp split is generated 2 samples in every batch and is sent to the secondary lab for checking.

72
The Apex’s Maco Mine’s Laboratory has appointed an Analytical Chemist with the sole role of implementing and monitoring the Lab’s internal and external QA/QC program. Previously Apex only relied on the Labs’ internal QA/QC program. Starting November 2010, the Apex Geology Department implemented its own program in addition to that of the Laboratory. A QAQC supervisor was also employed by the Geology Department to ensure that sampling procedures in dispatches are strictly followed.
Petersen and Jensen (2007) found that the internal Lab checks for
Crew Gold’s 2007 drilling program were appropriate. Subong and McManus (2009) reviewed the Labs internal QA/QC checks and found that the repeats sent to the McPhar lab for independent checks were within accepted confidence limits.
14.6.5.1 Quality control procedures
1. Standard Reference Materials–SRMs used in the assay laboratory are
purchased from reputable commercial laboratories. A certificate of analysis is issued by the lab together with the material. The type of ore and the grade ranges is selected to be more or less similar to that of the sample.
The standard Reference Material is inserted in the sample stream on a regular basis. For every batch of 25 samples, one (1) SRM is included. The number assigned for the SRM is in sequence with the sample for assay analysis. The ore type of the standard use and the grade ranges should be within that of the sample.
2. Blanks –Just like the SRM blanks are also purchased commercially as it may be hard to find materials void of gold values within the mineralized area of the mine.
The blank is inserted alongside with the batch of 25 samples. The assigned number of blank in the sample stream is identified in the sample transmittal.

73
3. Grind Checks- To test the product of crushing and pulverizing, the check is normally being done in the pulverized product since this is the final stage of the sample preparation. The required screen size which will achieve reproducible assay result over time is set at 90% of 75 microns.
The grind check is perform by screening two (2) samples for every batch of 25 samples. The procedure of the screening activity as follows:
1. Weigh 100g of dry pulp. 2. Wet sieve the pulp through the 200- mesh screen.
3. Dry the oversize 4. Weigh the oversize (W) 5. Calculate the weight of the undersize (100-W) 6. Weight the percentage passing the screen as: 100 (100g – W)/100= %.
4. Check Assaying – Check assaying requires sending selected samples to outside laboratory for re- assaying. The results will gage the reliability of the assaying performance of the primary laboratory.
Two (2) samples are selected from every batch of 25 samples. At the end of the month, the collected samples will be sent to the secondary laboratory for checking. The original pulp used in assaying in the primary lab will be divided into two and the other half will be the sample for check assaying.
5. Flux Test – This is performed in order to check the chemicals use in the assaying if free of gold values. A certificate of analysis is required from the supplier lab especially for the litharge.
One (1) crucible is assigned for every batch of sample as flux test. The crucible loaded with flux with the measure from the normal sample will be charged alongside for assaying and treated as with the normal samples.
Below is an illustration of the Order and Placement of samples in Fire Assaying: (Colored boxes are the QC/QA inserted)

74
Figure 14.6.5.1.1 Fire Assaying Order and Placement
Lab Blank- chemicals use in fire assaying (litharge,borax,soda
ash). Blank – commercial blank sample. Coarse Duplicate-Repeat of sample 10. Pulp Duplicate – Repeat of sample 20. SRM – commercial standard Reference Material.
Sample 18
Sample 19
Sample 20
Sample 2
Sample 16
Sample 5 Sample 6
Sample 10 Coarse Duplicate
Sample 8
Sample 13 Sample 14 Sample 15
Sample 12
Sample 9
Sample 4
Lab. Blank
Blank Sample 1
Sample 22
Sample 21 Pulp Duplicate
Sample 17
Sample 3
Sample 7
Sample 11
Sample 23 Sample 24
Sample 25
SRM
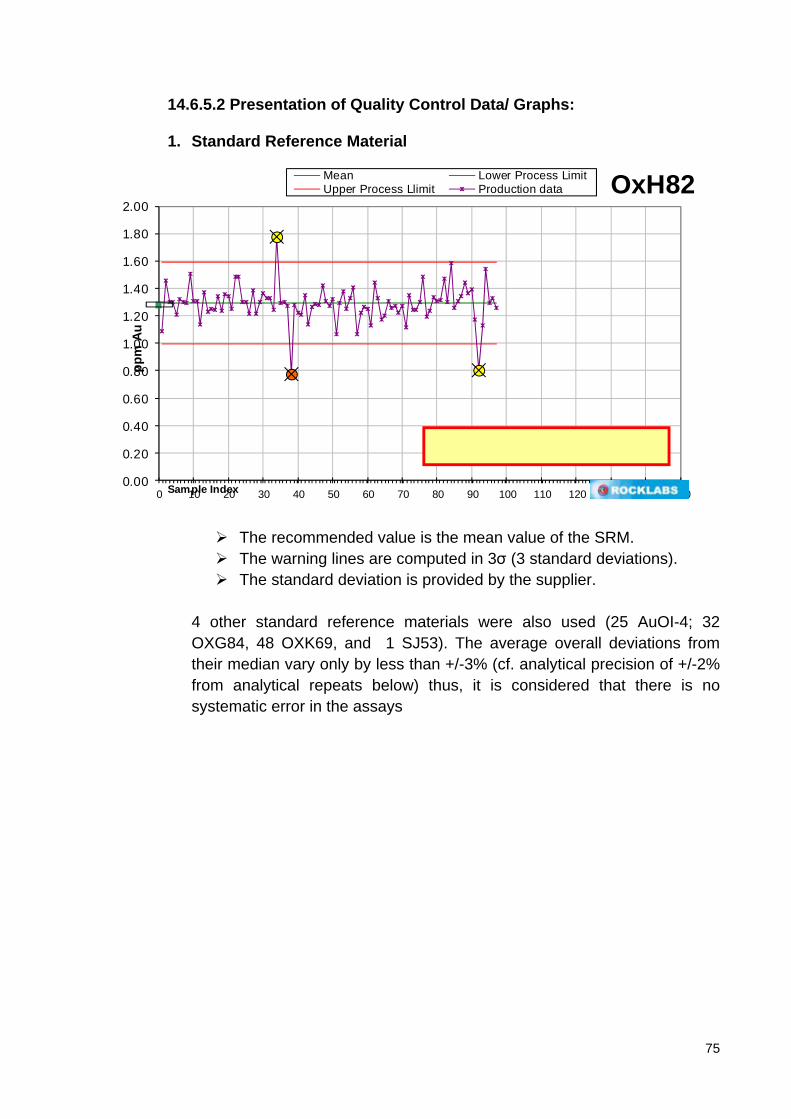
75
14.6.5.2 Presentation of Quality Control Data/ Graphs:
1. Standard Reference Material
0.00
0.20
0.40
0.60
0.80
1.00
1.20
1.40
1.60
1.80
2.00
0 10 20 30 40 50 60 70 80 90 100 110 120 130 140 150
ppm
Au
Sample Index
OxH82Mean Lower Process LimitUpper Process Llimit Production data
The recommended value is the mean value of the SRM. The warning lines are computed in 3σ (3 standard deviations). The standard deviation is provided by the supplier.
4 other standard reference materials were also used (25 AuOI-4; 32 OXG84, 48 OXK69, and 1 SJ53). The average overall deviations from their median vary only by less than +/-3% (cf. analytical precision of +/-2% from analytical repeats below) thus, it is considered that there is no systematic error in the assays

76
2. Grind Check
The recommended Value is set at 90% of the weight of sample through a screen of 200 mesh.
Action is required if the sample do not pass or equal to the recommended value.
3. Check Sample:

77
Assay A (original assays-APEX) is plotted on the Y-axis.
Assay B (Check assays – McPhar) is plotted on the X-axis.
4. Duplicates:

78
14.6.5.3 Field blanks 105 field blanks results were made available. 26 of these were
above the detection limit of 0.001 g/t Au. The average of those exceeding the detection limit is 0.01 g/t Au.
14.6.5.4 Laboratory blanks
105 laboratory blanks results were made available. 26 of these were above the detection limit of 0.001 g/t Au. The average of those exceeding the detection limit is 0.01 g/t Au.
14.6.5.5 Field duplicates/Quarter splits precision
74 quarter splits were analyzed by Apex and results compared with previous ones. Results show a total precision at Absolute Relative Deviation (ARD; (paired diff) /pair mean) at 90th percentile (ARD90) of 1.5 (or, +/-150%). This precision includes natural geological variability; field sampling/ splitting; crushing and splitting error; pulverizing and subsampling error; analytical error. Results are shown in Fig. 14.6.5.5.1 below:

79
ARD90 Precision of Field Duplicates/ Quarter Splits(n=74 pairs; ARD90 =1.50)
0
0.5
1
1.5
2
2.5
0 0.1 0.2 0.3 0.4 0.5 0.6 0.7 0.8 0.9 1
Cumulative Frequency
ARD
Au g
/t
Figure 14.6.5.5.1 ARD90 precision for Field Duplicates/ Quarter Splits
14.6.5.6 Crushed duplicates/Splits precision
Drilling and face samples are crushed to reduce sample particle size and volume, and to homogenize the sample. 101 paired splits of the undersized crushed material are analyzed, and results are compared with previous ones. Results show an ARD90 of +/-68%, consisting of errors due to crushing, pulverizing and analysis. Results are shown in Figure 14.6.5.6.1 below:
Figure 14.6.5.6.1 ARD90 Precision of Crushed Duplicates

80
14.6.5.7 Pulp duplicates/Splits precision
94 pairs of pulverized pulps were retrieved. The ARD90 result show error due to pulverizing and analysis, of +/-40%, as shown in the figure below:.
Figure 14.6.5.7.1 ARD90 Precision of Pulp Duplicates
14.6.5.8 Analytical repeats precision
26 pairs of analytical repeats were made available. The ARD90 result show a +/-2% error due to the analytical method as shown below:
Figure 14.6.5.8.1 ARD90 Precision of Analytical Repeats

81
14.6.5.9 Precision summary Based on the precision results shown above, it can be calculated
that Natural Geological Variation precision is +/-82%; field splitting and crushing precision is +/- 28%; +/- 38% precision in splitting/ pulverization; and about +/-2% in analytical precision.
14.6.6 Statement of the CPs on the quality of sample security, preparation
and analysis The Apex Resource Estimation Team and the company’s consultants
have demonstrated industry standard practices and continuing efforts in the safeguarding of the quality of samples, their preparation and analysis to come up with a valid and verifiable data base utilized in the resource estimation.

82
15.0 MINERAL RESOURCES ESTIMATE 15.1 Mineral Resource Database used in the estimation of resources
The data for the resource estimates have come from several sources listed below:
a) Face samples – channel rock chip samples across an ore drive face on every ore cut, on current mining areas. Au, Ag and variable Cu, Pb, Zn and SG values are available and nominal geology.
b) Face samples – channel rock chip samples in older areas expressed as a length weighted composite for the face (historical data for Dons/Saints). Au values and sample length are the only available data.
c) Crew diamond drilling of either HQ or NQ drilling (usually half core) and of variable recovery, with Au, Ag and variable Cu, Pb and Zn values. Nominal geology.
d) ASVI drilling of either HQ, NQ or AX of poor recovery and usually half core with Au, Ag and variable Cu, Pb, Zn and SG values. With nominal geology.
Certain drill holes have been logged in detail by Dr W. A. Sheppard,
ASVITSG consultant. Additional information has been provided for the geological interpretation
from mine level plans, face mapping, Drill photographs, limited surface mapping, a report from C.A. Angeles, Jr. (consultant) and the structural report from Dave Coller (consultant).
15.2 Integrity of Exploration and Mineral Resources Database
The data has been progressively improved over the last 18 months, with the implementation of Geo-Assay SQL Server database to minimize issues between lab and geology department and the retyping of results to and from Excel. This system also implemented an automated QAQC system that vastly improved the final assay result from the Maco-Apex laboratory as well as recording the QAQC history of the assays used in the resource.
A significant amount of data is still handled in spreadsheets, but a new
GeoDatabase is being designed in SQL server to store data and remove inadvertent changes to core data after it had been checked and signed off.
Manual verification of all historical data was carried out over a 3-month
period in 2010-2011. Gems user security ensures that Gems data is removed several levels from
malicious and inadvertent changes.

83
All data is protected under the Apex Maco site IT back up plan. All data are currently overseen by the Senior GIS officer and the Senior
Project Geologist.
15.3 Data verification and validation (limitations) Data verification and validation has been run using validation methods
(automatic) and by printing sections. Verification has been run by referring to original certificates or data and against printed reports. Errors found are immediately rectified and updated in the database.
There are still issues in the data but these are now considered minimal and
expectedly within confidence limits. Verification of drill results have had limited testing via twinning and then by
face sampling from ore drives and later mining. Generally the results are not always a good match, but in all three methods, it is clear when the sample is in a mineralized structure and whether it is high or low grade.
Where issues are identified, re-sampling is immediately initiated. In a
particular case, the Geology team identified an issue with contaminated litharge due to its QA/QC procedures and was able to identify bad batches and rectify the issue as well as work with the lab to put in place new measures at the lab to identify the issue early.
Recently, C. A. Angeles Jr., during a review visit, noted an assay value in
ASVI drilling that appeared not to match the expected value based on observed geology. This resulted in a review of the intercept and re-assaying.
The Geology team is constantly monitoring its own practice and work to
ensure good verification and validation of geological inputs into the resource. 15.4 Top Cuts and Cut-off grades used in the estimations
Top cuts for each of the 41 veins considered were established by making cumulative frequency charts, and the top cut was established mainly in the upper >95 percentile of the distribution, and where there is a significant gap or inflection in the cumulative frequency and gold grade scatterplot. All values exceeding the top cut were assigned the value of the topcut.

84
Considering the precision of the data, as well as current practices and preference of Apex mine operations staff, consultants and corporate executives, and to be consistent and comparable with the two most recent estimates, a 3.0g/t Au cutoff and a 1.5g/t Au cutoff were used. These two cutoffs are sufficiently different from one another given the precision of the data, and for this reason both are deemed appropriate considering the total precision of the data as shown earlier.
The top cuts of each vein are shown below:
Table 15.4.1 Top cuts adopted for each vein
VEIN NAME MAJOR VEIN
SYSTEM vein
number VEIN/ arc
code TOPCUTS g/tAu Maria Inez Split 1 1 710 2.52 Maria Inez Main 2 720 2.60 Masarita (east) 3 810 11.31 Wagas 3 4 910 11.46 Don Calixto 4 5 1010 15.81 Don Calixto 6 1020 28.43 Don Calixto 7 1030 60.71 Don Calixto 8 1040 14.67 Don Fernando 5 9 1110 21.74 Don Fernando 10 1120 46.00 Don Fernando 11 1130 8.13 Don Joaquin Split 6 12 1210 57.99 Don Joaquin Split 13 1220 7.76 Don Joaquin Main 14 1230 151.41 Don Mario Split 7 15 1320 34.43 Don Mario Main 16 1330 33.25 St. Vincent Main 8 17 1410 17.79 St. Francis Main 9 18 1510 67.82 St. Francis Split 19 1520 12.82 St. Francis Split 20 1530 5.47 St. Francis Split 21 1540 14.37 St. Raphael 11 22 1710 3.42 Bonanza Main North Extension 12 23 110 10.93 Bonanza Hanging Wall Split (HWS) North Ext. 24 115 19.20 Bonanza Main (West) 25 120 27.19 Bonanza-2 26 125 none Bonanza Main (East) 27 130 59.74 Bonanza HWS Ramp 1 28 140 75.72 Bibak Split 13 29 215 18.04 Bibak Main 30 220 40.06 Masara Main (West) 14 31 310 31.16 Masara HWS 32 315 50.70 Masara Main (East) 33 320 52.45 Bonanza HWS Ramp 2 34 330 18.96 SS1 15 35 410 19.18 SSV 36 420 50.65 Sandy Main Vein 37 430 80.73 Sandy Split (North side) 38 440 none Masara or BHWS ext (?) 16 39 510 none Sandy split (?) 40 520 9.42 Sandy main (?) 41 530 9.39

85
15.5 Mineral Resource estimation method used Unlike previous estimates, this work utilized the geostatistical method. This
method is considered as there is an objective basis for establishing the parameters/ neighborhood of the search ellipse in estimating locations within the resource envelope, Further, geostatistical methods, particularly in ordinary kriging, the method’s estimate honors real data encountered, and also by the inherent weighting of the real data points’ locations and values, effectively declusters any closely- sampled positions.
The geostatistical method utilizes the variogram (strictly speaking, the semi-
variogram), which is a chart that measures (one half) of the average squared differences of pairs of values at a given distance separation or what is referred to as “lags.” As can be intuitively appreciated, each sample pair’s difference in assays are expected to be larger as the distance (or lags) is increased. There is a point where the observed differences tend to plateau or level off, and the distance where this is seen is called the “range.” Beyond this range, the average differences begin to level off, and this part of the variogram is referred to as the “sill.”
The plot of the differences vs. lag distance typically is fitted with a smooth
line called the “model.” The model often has a rapid increase at short distances, then curves and levels off. For this estimation, fitted spherical models are used. The fitted models then are used as basis for the weighting assigned to data points.
Of particular importance in the fitted model is the intersection of the model
with the Y axis, at distance equal to zero distance. The projection of the first three lags towards this Y intercept is called the “nugget.” The nugget is reflective of the total precision of the dataset at the same location, or at zero distance.
To obtain a good fit, the nugget effect, model type, range and sill are used
for different models. The resulting fitted model(s) are utilized by the technique to assign the weights of sample assays in the estimation of a particular point.
For this work, the vein directions and dips are used to orient the variogram;
across the strike of the vein, along the strike of the vein, and downdip. The individual directions utilized are as follows:

86
Table 15.5.1 Strike and Dip of Each Vein used for Variography
VEIN NAME MAJOR VEIN
SYSTEM vein
number VEIN/ arc code
STRIKE AZIMUTH
VERTICAL DIP ANGLE/ DIR
Maria Inez Split 1 1 710 103 80NE Maria Inez Main 2 720 103 85NE Masarita (east) 3 810 132 84NE Wagas 3 4 910 93 78SW Don Calixto 4 5 1010 78 75SE Don Calixto 6 1020 90 56S Don Calixto 7 1030 82 71SE Don Calixto 8 1040 76 68SE Don Fernando 5 9 1110 110 70NE Don Fernando 10 1120 122 78NE Don Fernando 11 1130 105 71NE Don Joaquin Split 6 12 1210 90 73N Don Joaquin Split 13 1220 74 79SE Don Joaquin Main 14 1230 105 71NE Don Mario Split 7 15 1320 82 87SE Don Mario Main 16 1330 110 88SW St. Vincent Main 8 17 1410 124 80NE St. Francis Main 9 18 1510 115 83NE St. Francis Split 19 1520 103 89NE St. Francis Split 20 1530 68 88SE St. Francis Split 21 1540 103 86NE St. Raphael 11 22 1710 115 79NE Bonanza Main North Extension 12 23 110 115 70NE Bonanza Hanging Wall Split (HWS) North Ext. 24 115 140
72NE
Bonanza Main (West) 25 120 125 70NE Bonanza-2 26 125 125 70NE Bonanza Main (East) 27 130 145 74NE Bonanza HWS Ramp 1 28 140 120 57NE Bibak Split 13 29 215 150 81NE Bibak Main 30 220 150 81NE Masara Main (West) 14 31 310 140 80NE Masara HWS 32 315 145 80NE Masara Main (East) 33 320 130 75NE Bonanza HWS Ramp 2 34 330 140 68NE SS1 15 35 410 110 80NE SSV 36 420 105 68NE Sandy Main Vein 37 430 125 78NE Sandy Split (North side) 38 440 120 85NE Masara or BHWS ext (?) 16 39 510 135 69NE Sandy split (?) 40 520 135 85NE Sandy main (?) 41 530 130 82NE

87
The variogram parameters used in the search along strike (major axis) after modeling are as follows (range rounded up to the next highest meter):
Table 15.5.2 Modelled Variogram Parameters along strike
VEIN NAME
MAJOR VEIN
SYSTEM
vein numbe
r
VEIN/ arc code
PRIMARYNUGGET
HIGHEST SILL
NUGGET/ SILL
RATIO
LONGEST RANGE
(m) Maria Inez Split 1 1 710 0.20 0.45 0.44 8 Maria Inez Main 2 720 0.15 0.25 0.60 8 Masarita (east) 2 3 810 0.20 0.32 0.63 8 Wagas 3 4 910 0.10 0.31 0.32 7 Don Calixto 4 5 1010 0.25 0.43 0.58 8 Don Calixto 6 1020 0.20 0.44 0.45 8 Don Calixto 7 1030 0.30 0.44 0.68 5 Don Calixto 8 1040 0.20 0.37 0.54 5 Don Fernando 5 9 1110 0.18 0.37 0.49 8 Don Fernando 10 1120 0.28 0.48 0.58 9 Don Fernando 11 1130 0.23 0.38 0.61 5 Don Joaquin Split 6 12 1210 0.23 0.39 0.59 9 Don Joaquin Split 13 1220 0.08 0.15 0.53 10 Don Joaquin Main 14 1230 0.28 0.45 0.62 11 Don Mario Split 7 15 1320 0.20 0.34 0.59 9 Don Mario Main 16 1330 0.20 0.36 0.56 8 St. Vincent Main 8 17 1410 0.30 0.47 0.64 8 St. Francis Main 9 18 1510 0.30 0.44 0.68 9 St. Francis Split 19 1520 0.20 0.29 0.69 5 St. Francis Split 20 1530 0.05 0.30 0.17 8 St. Francis Split 21 1540 0.30 0.48 0.63 8 St. Raphael 11 22 1710 0.08 0.19 0.42 8 Bonanza Main North Extension 12 23 110 0.20
0.50
0.40
9
Bonanza Hanging Wall Split (HWS) North Ext. 24 115 0.30
0.70
0.43
7
Bonanza Main (West) 25 120 0.45 0.59 0.76 9 Bonanza-2 26 125 0.30 0.78 0.38 6 Bonanza Main (East) 27 130 0.40 0.58 0.69 7
Bonanza HWS Ramp 1 28 140 0.30
0.60
0.50
5 Bibak Split 13 29 215 0.60 0.90 0.66 3 Bibak Main 30 220 0.55 0.80 0.69 6 Masara Main (West) 14 31 310 0.60 0.69 0.87 7 Masara HWS 32 315 0.50 0.70 0.71 8 Masara Main (East) 33 320 0.45 0.66 0.68 10 Bonanza HWS Ramp 2 34 330 0.38 0.46 0.83 6 SS1 15 35 410 0.40 0.63 0.63 8 SSV 36 420 0.45 0.66 0.68 6 Sandy Main Vein 37 430 0.50 0.63 0.79 8 Sandy Split (North side) 38 440 0.45 0.96 0.47 4 Masara or BHWS ext (?) 16 39 510 0.23 0.40 0.58 9 Sandy split (?) 40 520 0.30 0.84 0.35 9 Sandy main (?) 41 530 0.10 0.34 0.29 6

88
Face sample assays were composited using the midpoint and at 1m intervals. Practicably, 1m down the hole samples are used for drilling data. With these regularized data and search parameters, ordinary kriging is undertaken.
Considering the actual mining being undertaken, the composited samples,
and geological continuity downdip, the consensus of Apex mine staff was to utilize a 2.5x2.5x5m block size, the same block size as done by MacManus (2012).
For ordinary kriging, the search angle used is 45 degrees along the strike
direction, and a search corridor of 50meters wide adopted, and constrained within the vein solid/wireframe. For kriging, a minimum of 1 and maximum of 75 data points was used. The search was initially extended up to 500m along strike (when possible) but only within the solid/wireframe of each vein, Initially, for the downdip direction, a search of 10 times the variogram range was used; all these were then limited to the extent of the inferred resource envelope as determined by MacManus (2012); see below.
Apex provided a wireframe/ solid model of each of the veins. Initially this
was utilized, and upon review, it became apparent that a significant part of the supplied wireframe/ solid model had little geological basis to be used. Thus the resource envelope of MacManus (2012) was used instead, and involved a recalculation and reclassification for all 41 veins which entailed a significant amount of additional time.
The block model, to be volumetrically correct, had utilized the percentage of
the solid/wireframe enclosed by the 2.5x2.5x5m block.
15.6 Mineral Resource categories used Categories used are:
Measured – With face and drillhole data (particularly for the Maligaya area veins), and 100% of the interpreted variogram range along the strike of the vein. Indicated – volumes of rocks covered by the variogram range up to twice the interpreted variogram range along the strike of the vein. There is enough geological support and understanding that there is a reasonable degree of expectation that these blocks are mineralized.
Inferred - For blocks extending to the resource limits as adopted by MacManus, 2012 (at about 200m along the strike, and about 50 meters downdip) where there is supporting shoot, vein or structural interpretation.

89
Results of the geostatistical estimation using ordinary kriging from the interpreted variogram parameters enabled the calculation of the following resources and their classification; data is rounded to nearest 10,000 tonnes and nearest 0.1g/t Au given the uncertainties or indadequacies in the specific gravities used as well as precision of the assay data:
15.7 Mineral Resources Estimates
The average of specific gravity measurements were used for each vein. For veins with no specific gravity determinations, the overall average of specific gravity where available was used, equivalent to 2.62. The specific gravity used per vein are as follows:
Table 15.7.1 Specific Gravity used per vein
VEIN NAME MAJOR VEIN
SYSTEM vein
number VEIN/ arc
code Specific Gravity Maria Inez Split 1 1 710 2.52 Maria Inez Main 2 720 2.60 Masarita (east) 2 3 810 2.62 Wagas 3 4 910 2.62 Don Calixto 4 5 1010 2.62 Don Calixto 6 1020 2.62 Don Calixto 7 1030 2.62 Don Calixto 8 1040 2.62 Don Fernando 5 9 1110 2.62 Don Fernando 10 1120 2.62 Don Fernando 11 1130 2.62 Don Joaquin Split 6 12 1210 2.62 Don Joaquin Split 13 1220 2.62 Don Joaquin Main 14 1230 2.62 Don Mario Split 7 15 1320 2.62 Don Mario Main 16 1330 2.62 St. Vincent Main 8 17 1410 2.62 St. Francis Main 9 18 1510 2.62 St. Francis Split 19 1520 2.62 St. Francis Split 20 1530 2.62 St. Francis Split 21 1540 2.62 St. Raphael 11 22 1710 2.62 Bonanza Main North Extension 12 23 110 2.58 Bonanza Hanging Wall Split (HWS) North Ext. 24 115 2.64 Bonanza Main (West) 25 120 2.63 Bonanza-2 26 125 2.62 Bonanza Main (East) 27 130 2.60 Bonanza HWS Ramp 1 28 140 2.62 Bibak Split 13 29 215 2.58 Bibak Main 30 220 2.62 Masara Main (West) 14 31 310 2.66 Masara HWS 32 315 2.75 Masara Main (East) 33 320 2.66 Bonanza HWS Ramp 2 34 330 2.62 SS1 15 35 410 2.64 SSV 36 420 2.74 Sandy Main Vein 37 430 2.64 Sandy Split (North side) 38 440 2.62 Masara or BHWS ext (?) 16 39 510 2.62 Sandy split (?) 40 520 2.57 Sandy main (?) 41 530 2.54
90
It has to be noted that the veins in the “Dons” area are considered to be up to indicated category only due to the paucity, if any, of face samples; thus, any initial measured category had to be downgraded to indicated.
Most of the other veins in the “Maligaya” area had face samples and thus
contain measured category; however, four veins (code 510,520, 530 and 610) had no face samples thus are categorized up to indicated class only. The more grade conservative estimate of MacManus (2012), as well as his tonnages were used for several veins (115,120, 130, 140, 310, 315, 320, 330, 405, 410, 420, 430), considering the better match for production grades at 1.5g/T cutoff.
Note tonnages are rounded to the nearest 10,000 tonnes. For categories
where the tonnages are less than 10,000 tonnes, and to avoid zeroes, a nominal value to the nearest 1,000 tonnes or 100 tonnes is used.
Individual categorized resources per vein are shown in the following table:

91
Table 15.7.2 Mineral Resource Estimate per vein (1 of 2)
VEIN NAME (DONS AREA)
MAJOR VEIN SYSTEMS
Vein number
VEIN/ arc code
3g/t Au cutoff 1.5 g/t Au cutoff
Mea
sure
d To
nnes
Mea
sure
d G
rade
Indi
cativ
e To
nnes
Indi
cativ
e G
rade
Infe
rred
To
nnes
Infe
rred
G
rade
Mea
sure
d To
nnes
Mea
sure
d G
rade
Indi
cativ
e To
nnes
Indi
cativ
e G
rade
Infe
rred
To
nnes
Infe
rred
G
rade
Maria Inez Split 1 1 710 30,000 7.6 90,000 7.5 40,000 6.0 150,000 5.4
Maria Inez Main 2 720 30,000 5.7 80,000 4.8 50,000 4.5 180,000 3.3
Masarita (east) 2 3 810 10,000 5.2 *1000 4.1 20,000 4.0 10,000 3.1
Wagas 3 4 910 10,000 5.5 20,000 6.4 20,000 4.3 30,000 4.8
Don Calixto 4 5 1010 *3,000 6.3 *5000 6.4 *4,000 5.8 *4,000 6.1
Don Calixto 6 1020 30,000 7.8 40,000 8.9 40,000 7.1 40,000 8.6
Don Calixto 7 1030 70,000 8.6 30,000 8.5 80,000 8.0 40,000 8.1
Don Calixto 8 1040 *4,000 6.0 *1000 3.5 10,000 4.9 *4,000 2.9
Don Fernando 5 9 1110 60,000 6.9 30,000 7.2 70,000 6.3 30,000 7.1
Don Fernando 10 1120 70,000 9.3 20,000 9.2 90,000 7.9 20,000 8.6
Don Fernando 11 1130 10,000 4.5 30,000 8.0 20,000 3.6 70,000 4.2
Don Joaquin Split 6 12 1210 110,000 8.9 50,000 12.8 120,00
0 8.5 60,000 11.0
Don Joaquin Split 13 1220 *2,000 5.4 *2000 6.0 *2,000 5.4 *2,000 6.0
Don Joaquin Main 14 1230 480,000 12.6 30,000 6.3 580,00
0 10.6 50,000 4.9
Don Mario Split 7 15 1320 40,000 8.2 40,000 4.5 60,000 6.5 100,000 3.3
Don Mario Main 16 1330 110,000 6.4 10,000 4.0 140,00
0 5.5 10,000 3.5
St. Vincent Main 8 17 1410 30,000 6.2 10,000 4.8 40,000 4.8 20,000 3.1
St. Francis Main 9 18 1510 320,000 11.8 30,000 10.0 340,00
0 11.2 30,000 9.8
St. Francis Split 19 1520 10,000 5.9 10,000 4.4
St. Francis Split 20 1530 *2,000 3.4 *<100 3.1 *4,000 2.8 *200 2.3
St. Francis Split 21 1540 20,000 5.2 *2000 4.9 30,000 4.4 10,000 3.2
St. Raphael 11 22 1710 *<100 3.4 1,330,000 3.9 *4,000 2.1 *100 3.9

92
Table 15.7.2 Mineral Resource Estimate per vein (2 of 2)
VEIN NAME (Maligaya Area)
MAJOR VEIN SYSTEMS
Vein number
VEIN/ arc code
3g/t Au cutoff 1.5 g/t Au cutoff
Mea
sure
d To
nnes
Mea
sure
d G
rade
Indi
cativ
e To
nnes
Indi
cativ
e G
rade
Infe
rred
To
nnes
Infe
rred
G
rade
Mea
sure
d To
nnes
M
easu
red
Gra
de
Indi
cativ
e To
nnes
Indi
cativ
e G
rade
Infe
rred
To
nnes
In
ferr
ed
Gra
de
Bonanza Main North Extension 12 23 110 *200 4.1 *<200 4.9 90,000 9.9 *500 2.9 *1,000 3.0 190,000 5.6 **Bonanza Hanging Wall Split (HWS) North Ext. 24 115 *5,000 8.1 *3,000 5.7 30,000 5.9 60,000 4.0 10,000 5.2 190,000 2.6
**Bonanza Main (West) 25 120 20,000 7.9 10,000 6.7 10,000 3.4 110,000 4.0 40,000 5.9 20,000 2.5
Bonanza-2 26 125 *1,000 4.3 *100 3.1 *1000 4.2 10,000 1.9
**Bonanza Main (East) 27 130 20,000 9.2 20,000 6.2 10,000 4.2 90,000 3.9 50,000 5.8 50,000 2.4
**Bonanza HWS Ramp 1 28 140 10,000 10.0 20,000 9.7 60,000 9.7 180,000 5.5 50,000 7.1 90,000 7.4
Bibak Split 13 29 215 *100 8.5 *<100 5.7 *2000 4.0 *100 7.7 *300 4.6 *2,000 4.0
Bibak Main 30 220 10,000 9.8 10,000 7.5 100,000 12.
3 10,000 7.8 20,000 6.6 140,000 9.5
**Masara Main (West) 14 31 310 *2,000 4.8 20,000 6.5 50,000 14.
4 50,000 4.8 30,000 5.7 60,000 12.
1
**Masara HWS 32 315 10,000 12.3 10,000 7.9 *500 11.
3 20,000 7.4 20,000 8.5 *4,000 3.2
**Masara Main (East) 33 320 30,000 7.8 20,000 6.2 110,000 5.5 140,000 6.5 60,000 6.0 210,000 4.1
**Bonanza HWS Ramp 2 34 330 3,000 3.5 10,000 4.9 40,000 4.0 90,000 3.5 20,000 4.1 50,000 3.6
**SS1 15 35 410 10,000 4.9 10,000 4.5 10,000 3.8 30,000 4.9 20,000 4.6 10,000 3.5
**SSV 36 420 20,000 4.0 10,000 7.6 *4000 4.3 50,000 4.0 40,000 6.1 60,000 2.4
**Sandy Main Vein 37 430 20,000 5.4 50,000 7.5 130,000 5.6 240,000 5.4 100,000 6.2 230,000 4.0
Sandy Split (North side) 38 440 *200 6.6 *200 5.3 *2000 7.3 *400 6.6 *700 5.1 *2,000 7.3
Masara or BHWS ext (?) 16 39 510 10,000 7.3 90,000 7.1 10,000 5.9 150,000 5.3
Sandy split (?) 40 520 10,000 5.8 110,000 3.6 10,000 4.6 200,000 3.0
Sandy main (?) 41 530 10,000 6.1 410,000 4.9 10,000 4.6 740,000 3.7 **utilized MacManus(2012) Measured Category tonnes and grades for 1.5g/T cutoff
TOTAL 140,000 8.4 1,650,000 9.7 3,100,000 5.6 1,070,000 5.0 2,240,000 8.1 3,270,000 4.7

93
16.0 INTERPRETATION AND CONCLUSIONS 16.1 Synthesis of data
This work has estimated all veins with complete solids/ wireframes with geological confidence using all assays available as of end December 2011. The estimates herein enable direct comparability with previous results and show higher grades and tonnages due to the specific gravity utilized and the top cuts made.
The categorization of resources enables the valuation of the individual veins
and collectively from the measured and indicated tonnages and grades.
16.2 Adequacy of data, overall data integrity and areas of uncertainty Data made available can be considered largely adequate, however there are
significant areas of uncertainty which downgraded categorization of resources into classes of lower confidence. This is evident for veins which lack face samples due to lack of mine development work, and where drill intersections are far in between.
There is lack of QAQC information on the earlier samples, including that
from the Crew sampling. However, subsequent samples with QAQC information numerically dominate the available dataset.
There is lack of down the hole surveys for positional accuracy. This
uncertainty is considered in the tonnage reporting units of at least 10,000 tonnes and the downgrading of measured resources to indicated when there are no surveyed face samples available.
There is also lack of recovery information for drillholes prior to 2011. While
larger diameter holes (HQ and NQ) dominate over smaller (AQ) ones, the poorer recovery and larger imprecision in AQ holes make the assays from AQ holes possibly lower than the actual value, as there may be to gold loss during the smaller diameter, lower volume drilling; leading to a possible lower, and more conservative reported Au values for these holes.
The assays have integrity, and these have undergone close scrutiny by the
mine staff and Apex’s consultants, and subjected to software validation.

94
16.3 Overall conclusions by the CPs There are no systematic errors in the assay results used. The precision
errors are largely attributable to natural geologic variation, followed by sampling and preparation stages, and least by laboratory analysis.
Low-level contamination (~0.01g/t Au) is suspected due to about 25%
exceedances above detection in the blanks. The resource estimation in this report is more realistic as appropriate
average specific gravities were used for each vein, and top cuts were performed based on each vein’s actual data distribution.
16.4 Discussion on whether the completed project met the objectives set forth.
It is deemed by the undersigned CPs that despite the very tight time constraints and (RALF’s) unfavorable personal circumstances in the production of this report, the overall objective has been attained, which is to provide a resource estimate for the various considered veins, at a level which is arguably superior yet still comparable with previous estimates, and in conformity with production data.
This work has also established and quantified the quality of assay data used
in the resource estimation, and these provide the basis to adopt appropriate procedures utilized to establish an appropriate block size, and permit the use of suitable cutoffs which enable comparison of previous results and consistent with current and proposed values.

95
17.0 RECOMMENDATIONS As much as possible during drilling, larger diameter holes (HQ and NQ) be used as these produce more precise and accurate Au assays. Focus should be in improving drilling recovery to over 95%. All drillholes should have down the hole surveys for positional accuracy.
The suspected low-level contamination for Au assays would be best addressed
by adequate dust control. Apart from dust control, precision errors can be minimized by improved and
repeated riffle splitting and avoidance of any coning and quartering; optimized increase in crushing and pulverizing time; and increased amount of pulverized material below 200 mesh, up to 95% passing if practical. Instead of scooping, riffle splitting using a jones splitter of appropriate size is recommended for pulverized materials prior to assaying.
In the ensuing resource estimation, an adequate amount of time should be
devoted for the following: Geological models/ solids should be updated to reflect detailed widths and to
extend only within proximity of drilling intersections and face sampling. More specific gravity measurements should be obtained in various portions of
each vein. This will result in a more reliable tonnage estimate. A more rigorous top cut selection procedure (per percentile) be adopted for more
realistic Au mean grades. An optimized lognormal transform be made as appropriate for each vein’s data distribution.
Utilize data from other elements analyzed to improve ore processing. Upgrade Inferred and Indicated resources to Measured Category though more
infill drilling and sampling. Grade and tonnage reconciliations be undertaken using mining and production
data to determine more confidently the remaining in-situ resources; adjust mining cutoff grades; and use more appropriate mining methods as warranted to maximize resource value.

96
18.0 REFERENCES Arcilla E.A. and Subong, E., 2010, Variogram Parameters - Maximum Continuity and Search
Ellipse Parameters for Apex Mine, Maco, Mindanao, Philippines. (Internal Company Memorandum Report).
BMG-MNR, 1986. Geology and Mineral Resources of the Philippines Volume II Mineral
Resources: 463 pp. Coller, D., 2011, Tectonics and structural controls of the Masara vein system (Consultant’s
internal Report to Apex). Corbert, G., 2004. “Epithermal Au-Ag – The Magmatic Connection Comparisons between East
and West Pacific rim”. Proceedings of the Ishihara Symposium: Granites and Associated Metallogenesis.
Dominy, S.C., 2006. “Masara Gold Project, Philippines: Independent Review and Resource
Estimate” Consultants report, Snowden Mining Associates, London for Crew Gold. Gervasio, F.C.. 1966, A study of tectonics of the Philippine Archipelago, Phil. Geol., v20, no. 2,
pp. 51-75. Jensen, S. M. and Petersen, J. S., 22 May 2007. Technical Report on the April 2007 Resource
Estimate for the Masara Gold Operations, the Philippines. Langlands, J.G. and Lewis, A.M. 1995. “Masara Gold Mine Project Philippines: Assessment and
Recalculation of Ore Reserves”. Consultants report by A C A Howe International for London Fiduciary Trust PLC.
Lodrigueza, L.A. and Estoque, J.C., 1976. “Geological Report Of The Masara Gold and Copper
Deposits” Apex Exploration and Mining, Internal Report. Malihan, T. D., 2009. “Certification: Resource Estimate Review of Maco Mines” Consultant
Report to Apex Mines. Malihan, T. D., 21 April 2009. A Review of the 2009 Resource Estimate of the Gold Vein
Deposits of the Maco Mines in Maco, Compostela Valley Province, Mindanao Island, Philippines.
MacManus, S., 2012. Apex Mining, Inc., Internal Resource Estimate (Consultant’s Internal
Report to Apex). Mercado A.C., Estoque J., Lodrigueza, L., Rebillon, F., 1987. Geology and Ore Deposits of
Masara, Davao del Norte, Philippines. Paper presented to Pacific Rim Congress ’87. Mitchell, A.H.G. and Leach. T.M., 1991. Epithermal gold in the Philippines: Island Arc
metallogenesis, geothermal systems, and geology. Academic Press Limited, 457 pp.

97
Osbucan, A. B. and Caupers, D. 2008a. “Maco gold project – Feasibility Study Volume 1” Apex
Mining internal report. ______. 2008b. “Maco gold project – Feasibility Study Volume 2” Apex Mining internal report. Philippine Mineral Reporting Code for Reporting of Exploration Results, Mineral Resources and
Ore Reserves (The PMRC). 1 July 2007. Philippines, 1995. “An Act Instituting a New System of Mineral Resources Exploration,
Development, Utilization, and Conservation” Laws Republic Act No. 7942 http://www.mgb.gov.ph/lpbt.aspx?ptyid=1&title=Republic Act.
______, 1997. “An Act to recognize, Protect and Promote the Rights of Indigenous Cultural
Communities/Indigenous Peoples, Creating a National Commission on Indigenous Peoples, Establishing Implementing Mechanisms, Appropriating Funds Thereof, and For Other Purposes” Laws Republic Act No. 8371 http://www.mgb.gov.ph/lpbt.aspx?ptyid=1&title=Republic Act.
Pubellier, M., R. Quebral, C. Rangin, B., 1996. The onset of movement on the Philippine Fault in
eastern Mindanao; A transition from a collision to a strike slip movement. Tectonics, V.15, No. 4, pp. 713-726.
Santos, T. 2009. “2009 MACO Resource Estimate” No Report, set of Vertical long sections
(ACAD) and associated spreadsheets. Apex Mining, Maco. Sheppard, W.A., 2011, A geological review of Maco Mine, Mindanao, Southern Philippines
(Consultant’s Internal Report to Apex). Sillitoe, R. and Gappe Jr. I., November 1984. Philippine Porphyry Copper deposits: Geologic
Setting and Characteristics. CCOP Technical Publication 14. Bangkok, 89 pages. Subong, E, Arriola, E and McManus, S. 2009. “Maximum Continuity and Search Ellipse
Parameters for Apex Mine, Maco, Mindanao, Philippines”. ASVITSG and APEX mining internal Report.
The Philippine Stock Exchange., 10 December 2009. Implementing Rules and Regulations for
the Philippine Mineral Reporting Code.

98
19.0 ACKNOWLEDGEMENT The Authors-CPs wish to thank the Board of Directors, Officers, and Management of Apex Mining Company, Inc., its Geological and Resource Estimation as well as Laboratory Staff, and its consultants for giving them the opportunity to review and evaluate the previous work done, and for providing the necessary exploration and mining data needed in this report’s preparation, which enabled the reestimation of the Au resources of each vein considered.