aphenomenologicalanalysisofeco-evolutionarycoupling · vitor h. sanches, dhyan v. h. kuraoka, pedro...
TRANSCRIPT

arX
iv:1
705.
0439
1v1
[ph
ysic
s.bi
o-ph
] 1
1 M
ay 2
017
A phenomenological analysis of eco-evolutionary coupling
under dilution.
Vitor H. Sanches, Dhyan V. H. Kuraoka, Pedro R. de Almeida, Carla Goldman ∗
May 11, 2017
Abstract
Evolutionary dynamics experienced by mixed microbial populations of cooperators and cheaters
has been examined in experiments in the literature using a protocol of periodic dilution to
investigate the properties of resilience and adaptability to environmental changes. Data de-
picted on an appropriate phase diagram indicate, among other features, a stable equilibrium
point at which cooperators and cheaters coexist [A. Sanchez, J. Gore, PLOs Biology, 11 (4),
e1001547 (2013)]. We present here a phenomenological analysis of these data focusing on an
eco-evolutionary-game perspective. To that end, we work on an extension of the model pro-
posed by Tao and Cressman Y. Tao, R. Cressman, Bull. Math. Biol. 69, 1377 - 1399 (2007).
It´ s original version takes into account changes of the total population density while the
individuals experience pairwise Prisoner´s Dilemma game. The extension devised here con-
tains a dilution factor to be conform with the experimental procedure, in addition of a term
accounting for Allee effects. Differently from other descriptions proposed in similar contexts,
however, the model here does not account for assortative encounters, group or kin selection.
Nonetheless, it describes surprisingly well both qualitatively and quantitatively the features of
the observed phase diagram. We discuss these results in terms of the behavior of an effective
payoff matrix defined accordingly.
Keywords: eco-evolutionary dynamics; game theory; cooperation; dilution
∗Email: [email protected]. Instituto de Fısica - Universidade de Sao Paulo, CEP 05508-090, Sao Paulo-SP, Brasil.
1

1 Introduction
Ecological and evolutionary dynamics taking place at similar timescale may drive certain interact-
ing populations of individuals to an eco-evolutionary feedback, a situation under which ecological
limitations may control evolutionary changes and vice-versa [1]. Microbes have always been consid-
ered as promising candidates to exhibit eco-evolutionary cyclic process although the experimental
confirmation of such expectations occurred only a few years ago investigating mixed population
of budding yeast Saccharomyces cerevisiae [2]. The individuals in these populations that posses
the gene SUC2 cooperate since they codify for the production of invertase, an important enzyme
to the process of the hydrolysis of sucrose into fructose and glucose, helping yeast to improve the
use of the sucrose present in the medium. The other individuals considered in the experiments,
the ”cheaters”, do not have the gene SUC2. Despite of this, cheaters may still be benefited by the
products, sucrose and fructose left available in the medium by the cooperators, as a public good,
avoiding in this way the cost of production. Data released from these experiments show the behav-
ior of the fraction (frequency) p(t) of cooperators present in the sample at each time t, analyzed as
a function of the total population density N(t). In special, one can identify in these data a stable
coexistence equilibrium reached by the two populations in the long-time regime. These results drew
considerable attention in the literature due to the their relevance in the context of the dilemma of
cooperation in biology [3].
In another set of related experiments [4] one examined questions regarding changes on resilience
of single populations consisting only of the referred cooperators subject to dilution, the strength
of which has been used as a controlling parameter. According to the authors, this procedure shall
be equivalent to produce changes on the intrinsic mortality rate of the population since it consists
on a periodic removal of a certain number of individuals in proportion to the quantity present at
each instant of time. The evolution of the single population of cooperators was examined there
under these conditions for diverse initial population sizes and different values of a defined dilution
factor θ which also determines the behavior of the observed equilibrium points. A turning point
bifurcation is identified in these data, occurring at the value of θ for which these equilibrium points
coalesce [4].
2

Traditionally, such questions regarding the evolution of cooperation in competing populations
have being addressed theoretically based on evolutionary game theory [5] coupled to classical models
from ecology (Lotka-Volterra) to take into account variations of the size N of the entire population
under environment constraints, see for example [6], [7], [8]. This kind of formulation extends the
dynamics described by the replicator equation conceived on the basis of evolutionary game theory
for pairwise encounters, to describe exclusively evolutionary aspects of populations of constant sizes
[9].
In general terms, the long-time behavior observed in the experimental data in [2] has been
predicted by some of these eco-evolutionary models [6], [7]. Yet, coexistence of cooperators and
cheaters has been achieved using the Prisoner´s Dilemma Game (PDG) in such context only under
favorable conditions for assortative encounters [10] or cooperation among individuals in groups of
all possible sizes.
Conversely, the eco-evolutionary model proposed in Ref.[11] has been conceived in the absence of
structured populations, kin selection, or assortative encounters. Yet, limitations of resources are not
described by Lotka-Volterra equations, but are introduced directly into the elements of the payoff
matrix that defines the game, expressing rewards and costs in terms of resources exchanged between
each pair of individuals. The dynamic payoffs constructed in this way set conditions under which
the population composed of two defined types of individuals is driven to a stable coexistence. The
nature of both the competition investigated by the model and the predicted equilibrium, however,
show no correspondence with the system investigated in the experiments mentioned above.
A rather simple model has been proposed by the same authors of the experiments to explain
their data. It is based entirely on Lotka-Volterra equations expressing competition for external
resources but in the absence of a game. Because there are indications in the data suggesting that
the maximum per-capita growth rate (or intrinsic growth rate) differs for each population, such
differences are introduced into their model as the only way to distinguish cooperators from cheaters.
In addition, the authors assume that these intrinsic growth rates change when population reaches
a certain critical density N = NC , introduced as an external input. Thus, the complete model
devised there comprises four equations to describe the time variation of the densities of cooperators
3

and cheaters, two of them for total population density values N < NC and the other two with
different parameters, for N > NC . Dilution is not explicitly introduced into these equations but it
is implemented in the numerical simulation for studying the dynamics.
Here, we resume the more traditional eco-evolutionary view on the basis of the model introduced
by Tao and Cressman (TC) [12]. This model has been formulated originally to study stochastic
effects on the evolution of competitive populations. Its deterministic limit accounts for variations
of the total density N through Lotka-Volterra dynamics while individuals experience pairwise PDG
in the absence of assortative encounters, group or kin selection. The long time dynamics of this
model does not predict stability of cooperators, as expected. In the present work, we extend the
deterministic version of this model to proceed into a phenomenological analysis of the aforemen-
tioned experiments. We explicitly introduce into the original TC model an extra factor to account
for the dilution protocol. Also in addition to a Lotka-Volterra contribution that enters in the orig-
inal formulation as a N -dependent background fitness, we take into account Allee effects [13] and
differences on the intrinsic growth rates of each population which, however, are conserved along
the entire dynamics.
In Section 2 we explain our model and argue that it meets the requirements to describe specifici-
ties of the experiments. The analysis presented in Section 3 indicate that both its equilibrium and
dynamic properties reproduce remarkably well the details reported in both experimental works [2]
and [4]. The consistence between these two phenomenologycal studies suggests that the model is
surprisingly robust. To our knowledge, this is the first time that eco-evolutionary feedback resulting
in coexistence is predicted on the basis of the original pairwise PDG. The analysis presented in
Section 4 in terms of the properties of an effective game defined accordingly, allows us to understand
the maintenance of cooperation in the long time regime in terms of a Nash equilibrium between
two competing populations that depends on N . Concluding remarks are in Section 5.
4

2 Eco-evolutionary model with dilution
We consider the time evolution of well mixed microbial populations of interacting cooperators
and defectors (cheaters). Let ni(t) be the density (number of individuals per unit volume) of
cooperators (i = 1) and cheaters (i = 2) present in the mixture of fixed volume at each time t.
Then N(t) = n1(t) + n2(t) is the total population density and pi(t) = ni(t)/N(t), i = 1, 2 the
corresponding frequencies. We express the time variation of individual densities as
·
n1 = n1
{(
NA− 1
)
[(a11p1 + a12p2 + λ(1− βN)]− ν}
·
n2 = n2
{(
NA− 1
)
[(a21p1 + a22p2) + δ(1− βN)]− ν}
(1)
The curly brackets include the total fitness of each population. The dependence of the fitness on β
and on the parameters aij, i, j = 1, 2 comprise precisely the original model proposed in Ref. [12].
β can be interpreted as the inverse of carrying capacity of the system. Thus, the factor (1 − βN)
in each of the equations above represents the usual Lotka-Volterra factor imposing limitations on
population growth at relative high values of N , due to environment constraints. As noticed by the
authors [12] it can be ascribed, in the context, to a background fitness for both populations. The
payoff matrix elements aij are constants representing the effects on fitness due to the interactions
between any pair of individuals that play a game chosen to coicide with the Prisoner’s Dilemma
Game (PDG). Each aij is interpreted as the reward for each individual, either a cooperator (Co) or
a cheater (Ch), that undergoes pairwise disputes. Following the usual representation [9] the PDG
payoff matrix is expressed as:
Co Ch
Co B − C −C
Ch B 0
(2)
with B,C > 0 and B > C. The constant B is a measure of the benefit received by a player in
disputes (encounters) with a cooperator. In the present case, it corresponds to the benefit after
using the considered substances (fructose and glucose). C is a measure of the total cost associated
5
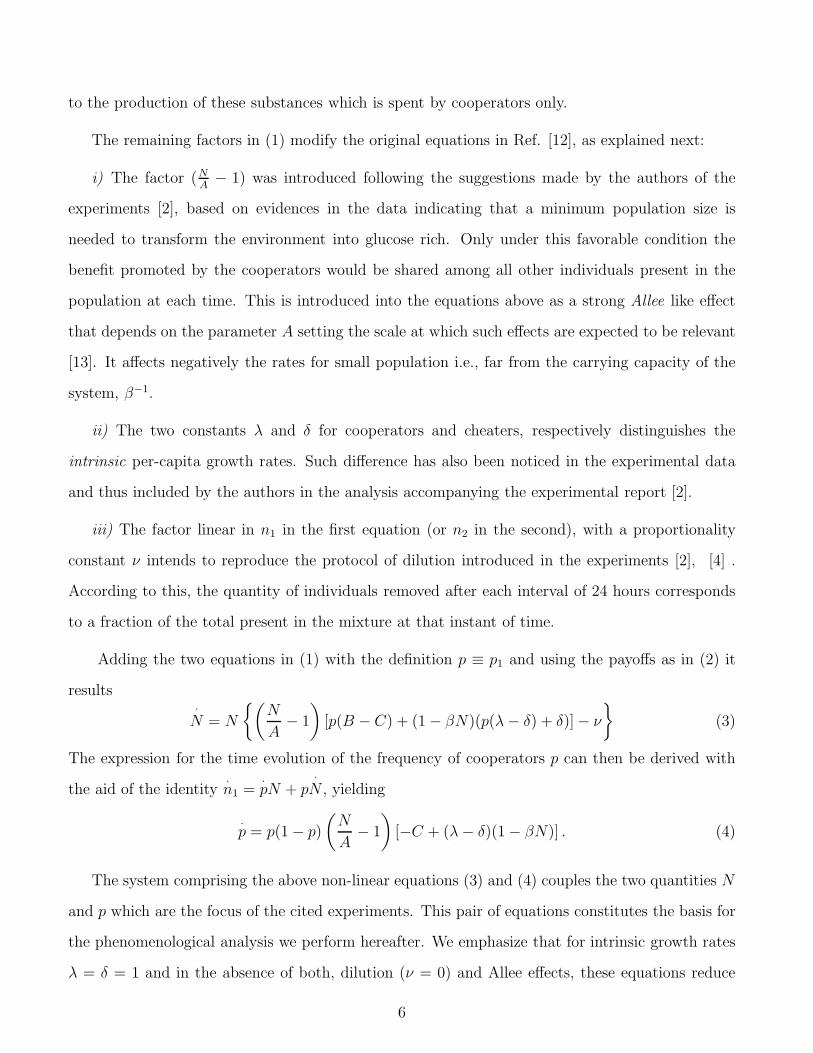
to the production of these substances which is spent by cooperators only.
The remaining factors in (1) modify the original equations in Ref. [12], as explained next:
i) The factor (NA− 1) was introduced following the suggestions made by the authors of the
experiments [2], based on evidences in the data indicating that a minimum population size is
needed to transform the environment into glucose rich. Only under this favorable condition the
benefit promoted by the cooperators would be shared among all other individuals present in the
population at each time. This is introduced into the equations above as a strong Allee like effect
that depends on the parameter A setting the scale at which such effects are expected to be relevant
[13]. It affects negatively the rates for small population i.e., far from the carrying capacity of the
system, β−1.
ii) The two constants λ and δ for cooperators and cheaters, respectively distinguishes the
intrinsic per-capita growth rates. Such difference has also been noticed in the experimental data
and thus included by the authors in the analysis accompanying the experimental report [2].
iii) The factor linear in n1 in the first equation (or n2 in the second), with a proportionality
constant ν intends to reproduce the protocol of dilution introduced in the experiments [2], [4] .
According to this, the quantity of individuals removed after each interval of 24 hours corresponds
to a fraction of the total present in the mixture at that instant of time.
Adding the two equations in (1) with the definition p ≡ p1 and using the payoffs as in (2) it
results·
N = N
{(
N
A− 1
)
[p(B − C) + (1− βN)(p(λ− δ) + δ)]− ν
}
(3)
The expression for the time evolution of the frequency of cooperators p can then be derived with
the aid of the identity·
n1 =·
pN + p·
N , yielding
·
p = p(1− p)
(
N
A− 1
)
[−C + (λ− δ)(1− βN)] . (4)
The system comprising the above non-linear equations (3) and (4) couples the two quantities N
and p which are the focus of the cited experiments. This pair of equations constitutes the basis for
the phenomenological analysis we perform hereafter. We emphasize that for intrinsic growth rates
λ = δ = 1 and in the absence of both, dilution (ν = 0) and Allee effects, these equations reduce
6

to the deterministic version of the equations proposed by Tao and Cressman [12]. These same
conditions are necessary (but not sufficient) for this model to reduce to the deterministic equations
of Frey and col. [8] to examine the transient behavior of cooperators 1.
3 Analysis
The non-trivial equilibrium points of the dynamics described by Equations (3) and (4), denoted as
(N(i), p(i)), i = 1, 2, 3 are listed below:
p(1) = 0 N±
(1) =A2β
[
(
1A+ β
)
±√
(
1A− β
)2 − 4 βνAδ
]
(a)
p(2) = 1 N±
(2) =A2β
[
(
1+(B−C)/λA
+ β)
±√
(
1+(B−C)/λA
− β)2
− 4 βνAλ
]
(b)
p(3) =1B
(
ν
(N(3)/A)−1− Cδ
λ−δ
)
N(3) =1β
(
1− Cλ−δ
)
(c)
(5)
In addition, the dynamics may drive the entire population to extinction since N = 0 is also
an equilibrium for all p ∈ [0, 1]. The nature of each of these non-trivial points (N(i), p(i)) shall
be determined, as usual, by linear analysis of Eqs. (3) and (4) examining the properties of the
corresponding eigenvalues of the Jacobian matrix:
J |(N(i),p(i))=
∂·
N∂N
∂·
N∂p
∂·
p∂N
∂·
p∂p
(N(i),p(i))
(6)
evaluated at each of these points (N(i), p(i)). If not otherwise specified, ν shall be taken as a
controlling parameter in the analysis of the two equilibrium points at the line p = p(1) = 1.
The numerical values for the remaining parameters are adjusted phenomenologically by identi-
fying each one of the equilibrium points observed in [2], namely {(5.96 × 10⁴, 1), (516, 1), (5.78×
104, 0.086)} with the corresponding expressions in the set {(N+(2), 1), (N
−
(2), 1), (N(3), p(3))} (5). The
1The two sets of equations coincide if, in addition to the conditions stated in the text, both the strength of
selection s and the global birth fitness function introduced in Ref. [8] are taken equal to the unity.
7

Table 1: Parameters used in the simulation
Parameter Numerical Value
B 5.0799
C 1.00
λ 150.54
δ 1.6369
A 348.145
two points located at p = 1 indicate two monomorphic equilibria, and the one internal characterize
coexistence of the two populations. This procedure set the values of the parameters that will be
used in the subsequent analysis. The results are compiled in Table 1.Using these parameters, we
notice that N±
(1) assume complex values, from what we conclude that the predicted equilibria at
(N+(1), 0) and (N−
(1), 0) are meaningless in the present context.
The numerical value for β is specified separately considering the two experiments. For the single
population case [4], we found β = 5.831 × 10⁻⁶. This has been obtained using the parameters in
Table 1 and adjusting the two monomorphic equilibrium {(N+(2), 1), (N
−
(2), 1)} at the respective
experimental points {(1.75 × 10⁵, 1), (1.5 × 10³, 1)}. For the experiments performed with both
cooperators and cheaters [2], the two-population case, we found β = 1.7185× 10⁻⁵. These results
are in consonance with the analysis performed by the authors of the experiments: their data indicate
that the carrying capacity of the system with isolated population of cooperators is larger than the
carrying capacity for the mixture of cooperators and cheaters. In turn, this suggests that under
these experimental conditions, the cooperators are more efficient in using the available resources in
the absence of cheaters.
3.1 The single population case
We shall now examine the data from the experiments reported in Ref. [4]. In these experiments
one observes the properties of yeast populations of cooperators, in the absence of the cheaters,
with respect to changes in the considered dilution factor θ. From the perspective of the present
8

model, this corresponds to fix p = 1 in the above equations and then examine the behavior of the
solutions under changes on ν.
Notice first that for p = 1 (absence of cheaters) one has∂
·
p
∂N= 0. Thus, the corresponding
eigenvalues of J |(N(i),p(i)), i = 1, 2 are real. Each of the two equilibrium points at p = 1, i.e.
(N±
(2), 1), represents a monomorphic equilibrium such that(
∂·
N∂N
)
(N+(2)
,1)
= −∆2N+(2) < 0
(
∂·
N∂N
)
(N−
(2),1)
= +∆2N−
(2) > 0(7)
with ∆2 ≡√
(
1+(B−C)/λA
− β)2
− 4 βνAλ
. From this we conclude that (N+(2), 1) is stable (attracting)
whereas (N−
(2), 1) is unstable (repelling) equilibrium point.
We then examine the behavior of N+(2) and N−
(2), Eqs. (5 (b)) as functions of the dilution ν,
the remaining parameters fixed as in Table 1. The results are shown in Figure 1. The shape
of the curves reproduces the referred experimental study in which one identifies a turning point
bifurcation [14]. Our results predict this bifurcation and explain its origin as occurring at a value
of ν for which ∆2 = 0 so that the points (N+(2), 1) and (N−
(2), 1) coalesce.
Figure 1: The behavior of the equilibrium points (N+(2), 1) (solid) and (N−
(2), 1) (dashed) as the parameter ν changes.
Let us now examine the time evolution of the density of cooperators n1(t) for p = 1, as solutions
9

to
·
n1 = n1
{(n1
A− 1
)
[(B − C) + (1− βn1)λ]− ν}
. (8)
Numerical results for n1(t), obtained from this equation using ν = 507.21 and ν = 2480.0 (corre-
sponding to the experimental θ = 750 and θ = 1400, respectively) are shown in Figures. 2(a)
and 2(b) for several initial population densities n1(0). In Figure 2(a) we see that the trajecto-
ries initiating at relative high densities approach the stable equilibrium point (N+(2), 1), whereas
the populations initiating at densities below the unstable equilibrium point (N−
(2), 1) go extinct.
Because N−
(2) increases with ν (see expression (5) (b)) we explain in this way the data indicating
that increasing ν may drive population to extinction even for those high initial values for which it
would have been survived if ν were lower, see Figure 2(b).
(a) ν = 507.21 (b) ν = 2480.0.
Figure 2: Time evolution n1(t) of single populations of yeast cooperators according to Eqs. (1) for p = 1. Population
go extinct if initial conditions n1(0) are chosen below N−
(2) (dashed); otherwise population is driven to the stable
equilibrium N+(2) (solid)
The results in Figures 1 and 2 suggest that the model proposed here describes very accurately
the behavior of the single populations of cooperator yeast, as studied in [4]. In turn, this supports
the idea that the analytical results for N+(2) and N−
(2) as functions of the parameters may be useful
to foresee the conditions leading to the critical slowing down of these populations under external
perturbations, as expressed in the experiments through the dilution protocol.
10

3.2 The two population case
We use the numerical values in Table 1, also β = 1.7185× 10⁻⁵ as specified above, and ν = 73.9 to
proceed into the phenomenological analysis of the experimental data in Ref. [2]. A global view of
the N × p phase space of the model, Eqs. (3) and (4), can be achieved by means of the nullclines
represented in Figure 3. The N-nullclines are obtained from the solutions to the equation (3) for·
N = 0, which are: i) the line N = 0 (not represented) and ii) the curve defined by the set of points
(N, p) satisfying(
N
A− 1
)
[p(B − C) + (1− βN)(p(λ− δ) + δ)]− ν = 0. (9)
A trace of this curve is shown in Figure 3 (solid). The p-nullclines also depicted on the same
figure (dashed) correspond to the solutions to the equation·
p = 0, resulting p = 0 , p = 1, N = A
and N = (λ− δ − C)/(β(λ− δ)).
Figure 3: The set of N -nullclines (solid) and the p-nullclines (dashed) represented on the (N × p) phase diagram.
The entire set of equilibrium points predicted by the model are depicted at the encounters
of the p-nullclines with the N -nullclines. It is worth noticing in these results that the shape of
curve defined by the set of points satisfying (9), seems to approach very well the trace of the
curve identified by the authors of the experiments as a separatrix [2]. In fact, our results indicate
that starting from values above this curve and for p < 1 the population is driven to the internal
11

equilibrium at (N(3), p(3)) representing coexistence of cheaters and cooperators. This is illustrated
in Figure 4, which shows the outcomes of numerical solutions to (3) and (4) for the time evolution
N(t) and p(t), represented parametrically on the phase diagram N× p for several initial conditions
(N(0), p(0)).
Figure 4: Time evolution of mixed populations of yeast represented parametrically on the (N × p) phase space for
diverse initial conditions (N(0), p(0)). The arrows point to the direction of the dynamics as the time increases. The
two points used as references are N3 = 57800 and β−1 = 58190 (indicated).
The complete phase diagram of the model is represented in Figure 5. These results should be
compared qualitatively and also quantitatively with the corresponding diagrams obtained experi-
mentally for the two population case.
The nature of the internal equilibrium point (N(3), p(3)) shall be disclosed through the eigen-
values Γ± of the Jacobian matrix J |(N(3),p(3))(6) evaluated at the referred point. Defining Q(3) =
(
N(3)
A− 1
)
, we write
J |(N(3),p(3))=
N(3)
Q(3)
[ ν
A− β(λp(3) + δ(1− p(3)))(Q(3))
2]
N(3)Q(3)B
−βp(3)(1− p(3))Q(3)(λ− δ) 0
(10)
and the corresponding eigenvalues as Γ± = X ± 12
√∆, where
12

Figure 5: The complete phase diagram of the model. The insert shows the field near the internal equilibrium point
represented by the simulated trajectories that illustrate the spiraling dynamics following different initial conditions.
X =N(3)
2Q(3)
[ ν
A− β(λp(3) + δ(1− p(3)))(Q(3))
2]
∆ =
(
N(3)
Q(3)
[ ν
A− β(λp(3) + δ(1− p(3)))(Q(3))
2]
)2
− 4N(3)p(3)(1− p(3))Bβ(λ− δ)(Q(3))2
(11)
Since p = p(3) is the only non-trivial equilibrium solution for the frequency of cooperators (i.e.,
different from p = 0 or p = 1), it is suggestive to look for the conditions under which (N(3), p(3))
exhibit properties of an attractive node as identified in the experimental data, and also as suggested
in Figure 5 (see insert). This requires ∆ < 0 and X < 0. Indeed, these two conditions are fulfilled
by the numerical choices for the parameters as in Table 1.
In retrospective, this means that by identifying the coordinates of the equilibrium points pre-
dicted by the model with the corresponding experimental, one concludes that the internal equilib-
rium point predicted theoretically is an attractive node, precisely as observed. We can also obtain
from our results that in contrast to the equilibrium points at p = 1 there is no bifurcation associated
with (N(3), p(3)) since it remains attractive for all positive ν.
13
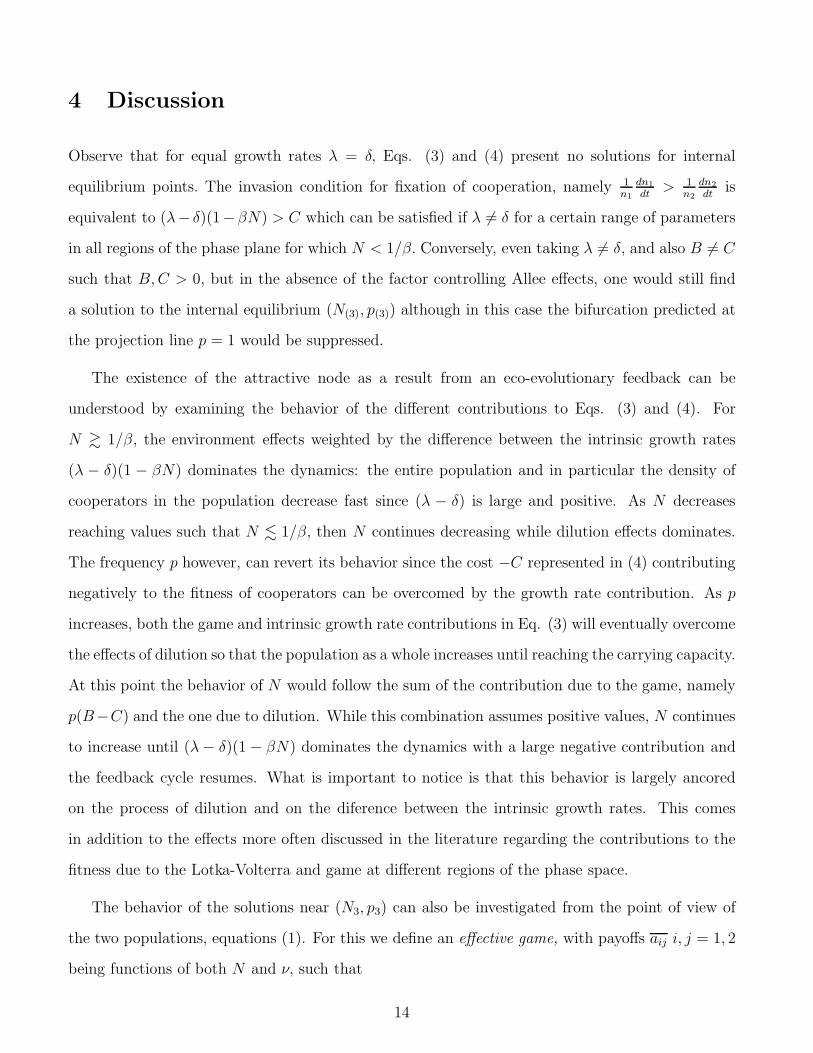
4 Discussion
Observe that for equal growth rates λ = δ, Eqs. (3) and (4) present no solutions for internal
equilibrium points. The invasion condition for fixation of cooperation, namely 1n1
dn1
dt> 1
n2
dn2
dtis
equivalent to (λ− δ)(1−βN) > C which can be satisfied if λ 6= δ for a certain range of parameters
in all regions of the phase plane for which N < 1/β. Conversely, even taking λ 6= δ, and also B 6= C
such that B,C > 0, but in the absence of the factor controlling Allee effects, one would still find
a solution to the internal equilibrium (N(3), p(3)) although in this case the bifurcation predicted at
the projection line p = 1 would be suppressed.
The existence of the attractive node as a result from an eco-evolutionary feedback can be
understood by examining the behavior of the different contributions to Eqs. (3) and (4). For
N & 1/β, the environment effects weighted by the difference between the intrinsic growth rates
(λ − δ)(1 − βN) dominates the dynamics: the entire population and in particular the density of
cooperators in the population decrease fast since (λ − δ) is large and positive. As N decreases
reaching values such that N . 1/β, then N continues decreasing while dilution effects dominates.
The frequency p however, can revert its behavior since the cost −C represented in (4) contributing
negatively to the fitness of cooperators can be overcomed by the growth rate contribution. As p
increases, both the game and intrinsic growth rate contributions in Eq. (3) will eventually overcome
the effects of dilution so that the population as a whole increases until reaching the carrying capacity.
At this point the behavior of N would follow the sum of the contribution due to the game, namely
p(B−C) and the one due to dilution. While this combination assumes positive values, N continues
to increase until (λ− δ)(1 − βN) dominates the dynamics with a large negative contribution and
the feedback cycle resumes. What is important to notice is that this behavior is largely ancored
on the process of dilution and on the diference between the intrinsic growth rates. This comes
in addition to the effects more often discussed in the literature regarding the contributions to the
fitness due to the Lotka-Volterra and game at different regions of the phase space.
The behavior of the solutions near (N3, p3) can also be investigated from the point of view of
the two populations, equations (1). For this we define an effective game, with payoffs aij i, j = 1, 2
being functions of both N and ν, such that
14
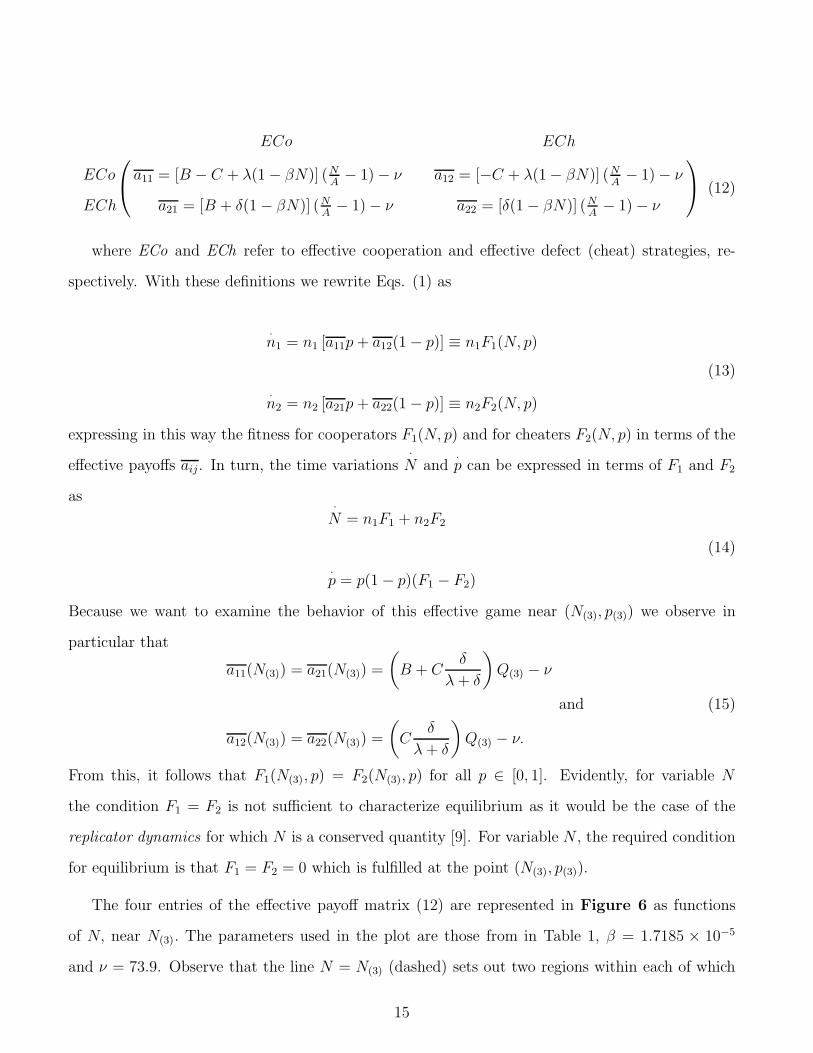
ECo ECh
ECo a11 = [B − C + λ(1− βN)] (NA− 1)− ν a12 = [−C + λ(1− βN)] (N
A− 1)− ν
ECh a21 = [B + δ(1− βN)] (NA− 1)− ν a22 = [δ(1− βN)] (N
A− 1)− ν
(12)
where ECo and ECh refer to effective cooperation and effective defect (cheat) strategies, re-
spectively. With these definitions we rewrite Eqs. (1) as
·
n1 = n1 [a11p+ a12(1− p)] ≡ n1F1(N, p)
·
n2 = n2 [a21p+ a22(1− p)] ≡ n2F2(N, p)
(13)
expressing in this way the fitness for cooperators F1(N, p) and for cheaters F2(N, p) in terms of the
effective payoffs aij. In turn, the time variations·
N and·
p can be expressed in terms of F1 and F2
as·
N = n1F1 + n2F2
·
p = p(1− p)(F1 − F2)
(14)
Because we want to examine the behavior of this effective game near (N(3), p(3)) we observe in
particular that
a11(N(3)) = a21(N(3)) =
(
B + Cδ
λ+ δ
)
Q(3) − ν
a12(N(3)) = a22(N(3)) =
(
Cδ
λ+ δ
)
Q(3) − ν.
and (15)
From this, it follows that F1(N(3), p) = F2(N(3), p) for all p ∈ [0, 1]. Evidently, for variable N
the condition F1 = F2 is not sufficient to characterize equilibrium as it would be the case of the
replicator dynamics for which N is a conserved quantity [9]. For variable N , the required condition
for equilibrium is that F1 = F2 = 0 which is fulfilled at the point (N(3), p(3)).
The four entries of the effective payoff matrix (12) are represented in Figure 6 as functions
of N, near N(3). The parameters used in the plot are those from in Table 1, β = 1.7185 × 10⁻⁵
and ν = 73.9. Observe that the line N = N(3) (dashed) sets out two regions within each of which
15

the effective payoffs characterize different games. For N & N3 the inequalities a21(N) > a11(N) >
a22(N) > a12(N) hold so that in this region the effective game corresponds to a PDG for which the
effective defect is an ESS (Evolutionary Stable Strategy), the dominant strategy for both players.
In the region for which N . N(3) one has a11(N) > a21(N) > a12(N) > a22(N) corresponding to
a Harmony game for which the dominant strategy for both players is the effective cooperation, the
ESS in this case. At N = N(3) , one has a11(N(3)) = a21(N(3)) and a12(N(3)) = a22(N(3)) indicating
that both effective defect and effective cooperation are Nash equilibria at the coexistence condition
but none of these is an ESS.
Figure 6: Effective payoffs aij i, j = 1, 2 as functions of N , near N3 (dashed). The regions where the strategies
characterize different games are explicitly indicated. For Harmony game it is limited by N3 and the solution N to
a12 = a21 (left dotted). For PD Game it is limited by N3 and the solution N to a11 = a22 (right dotted).
A similar analysis has been performed in Ref. [11]. Although the eco-evolutionary model
there has also been conceived in the absence of structured populations, the correspondence to our
analysis is not immediate because their dynamic payoff matrix has been defined a priori, directly
in terms of the resources exchanged between pairs of individuals. The effective matrix built up
here comprises the original game, the dilution factor and the ecological effects, what allowed us to
evaluate separately each contribution to the dynamics discussed here.
16

5 Conclusions
The phenomenological analysis presented above suggests that the dilution process introduced into
the considered experiments primarily to examine properties of resilience of the populations under
changing environments, may be crucial for observing coexistence of cooperators and cheaters in the
mixed population of yeast. The analytical results have been achieved in terms of parameters strictly
related to the populations traits or to their interactions with the environment. The strength of
dilution is a control parameter. We believe that this study can be useful to make further predictions
on the properties of such systems under different conditions. For example, it shall be of interest to
examine the limits for population extinction by analyzing the behavior of the N-nullcline Eq.(9),
with respect to changes in the diverse parameters. This curve appears to approach very well the
trace of the separatrix identified in the data.
The analysis of the defined effective game offers an alternative to understand the outcomes of
the dynamics in terms of the nature of strategies that change within each region of the considered
phase space.
6 Acknowledgements
The financial support from Fundacao de Amparo a Pesquisa do Estado de Sao Paulo (FAPESP),
Brazil under Grant No. 2015/17395-3 is gratefully acknowledged.
References
[1] D.M. Post, E.P. Palkovacs, Eco-evolutionary feedbacks in community and ecosystem ecology:
interactions between the ecological theatre and the evolutionary play, Phil.Trans. R.Soc. B
364, 1629 - 1640 (2009).
[2] A. Sanchez, J. Gore, Feedback between population and evolutionary dynamics determines the
fate of social microbial populations, PLOs Biology, 11 (4), e1001547 (2013).
17

[3] B. Allen, M.A. Nowak, Cooperation and the fate of microbial societies, PLOs Biology, 11 (4):
e1001549. doi:10.1371/journal.pbio.1001549 (2013).
[4] L. Dai, D. Vorslen, K. S. Korolev, J. Gore, Generic indicators for loss of resilience before a
tipping point leading to population collapse, Science 336, 1175 - 1177 (2012).
[5] M.A. Nowak, K. Sigmund, Evolutionary dynamics of biological games, Science 33, 793 - 799
(2004).
[6] C. Hauert, J. Y. Wakano, M. Doebeli, Ecological public good games: cooperation and bifur-
cation, Teor. Pop. Biol. 73, 257 - 263 (2008).
[7] F. Zhang, C. Hui, Eco-evolutionary feedback and the invasion of cooperation in prisioner´s
dilemma games, PLoS ONE 6 (11), e27523 (2011).
[8] J. Cremer, A. Melbinger, E. Frey, Evolutionary and population dynamics: a coupled approach,
Phys. Rev. E 84, 051921 (2011).
[9] M. A. Nowak, Evolutionary dynamics: exploring the equations of life, Harvard Univ. Press
2006.
[10] T. C. Bergstrom, The algebra of assortative encounters and the evolution of cooperation, Intl.
Game Theo. Rev. 5 (3) 211 - 228 (2003).
[11] R. J. Requejo, J. Camacho, Coexistence of cooperators and defectors in well mixed populations
mediated by limiting resources, Phys. Rev. Lett. 108, 038701 (2012).
[12] Y. Tao, R. Cressman, Stochastic fluctuations through intrinsic noise in evolutionary game
dynamics, Bull. Math. Biol. 69, 1377 - 1399 (2007).
[13] P. A. Stephens, W. J. Sutherland, Consequences of the Allee effect for behaviour, ecology and
conservation, TREE 14, 401-405 (1999).
[14] G. Iooss, D. D. Joseph, Elementary stability and bifurcation theory 2a Ed. (1989) Springer
Verlag Undergraduate Texts in Mathematics.
18