api is the only national trade association representing...
TRANSCRIPT

Congress of the United States, House of Representatives
Committee on Energy and Commerce Subcommittee on Energy
“Part II: Powering America: Defining Reliability in a Transforming Electricity Industry”
Testimony of:
Marty Durbin, Executive Vice President and Chief Strategy Officer
American Petroleum Institute October 3, 2017
Chairman Upton, Ranking Member Rush and members of the subcommittee, thank you for the
opportunity to testify today. My name is Marty Durbin, and I am Executive Vice President and Chief
Strategy Officer for the American Petroleum Institute (API).1 The increased use of natural gas in electric
power generation has not only enhanced the reliability of the overall system, but it has also provided
significant environmental and consumer benefits. The abundance, affordability, low-emissions profile
and flexibility of natural gas and natural gas-fired generating units make natural gas a fuel of choice. API
understands that the bulk power system will continue to rely on multiple fuels, including natural gas,
nuclear, coal, hydro, wind and solar, as projected by the Energy Information Administration.
1 API is the only national trade association representing all facets of the oil and natural gas industry, which supports 10.3 million U.S. jobs and nearly 8 percent of the U.S. economy. API’s more than 625 members include large integrated companies, as well as exploration and production, refining, marketing, pipeline, and marine businesses, and service and supply firms. They provide most of the nation’s energy and API member operations, and investments have added billions of dollars in economic value throughout the nation.

2
Source: 2017 Annual Energy Outlook, U.S. Energy Information Administration
We also agree that energy policy should be focused on ensuring the reliability and resilience of the
nation’s electrical grid at a reasonable cost, which reason and research tell us can be best achieved by
allowing markets to determine the fuel mix of the generation portfolio.
What is Reliability?
Reliability means the continued operation of the electric grid and is achieved through adequate amounts
of “essential reliability services” or “attributes,” which keep the electric grid in balance. In general,
however, reliability goes beyond just the operational aspects of the grid and extends to the entire
national electric system and the ability of its constituent parts to operate. This includes long-term
reliable access to fuel for generators, the stability of the fuel supply, the abundance of the resource
supply, where it’s sourced, the reliability of its production and transportation, and its long-term
affordability.
Grid operators have the responsibility of maintaining the operational reliability of the electric grid.
Generation owners are responsible for maintaining the integrity of their generating equipment and for
ensuring they have adequate fuel supply contracts (and contracts for other operating supplies, such as
water) and a portfolio of options in place so they have the ability to meet all their capacity and energy
obligations under a wide range of scenarios. The natural gas industry has responsibility for ensuring the
reliable operation of the natural gas supply chain and that customers receive their contracted
commodity.

3 It is clear that natural gas generation has exceptional performance characteristics and attributes that
can provide a full range of essential reliability services needed by the electric grid to maintain reliability.
One important advantage of natural gas generation is its ability to ramp quickly and to cycle on and off
in a short amount of time to meet the more rapidly changing levels of load due to increasing amounts of
variable renewable energy resources on the grid. With respect to overall reliability, natural gas as a fuel
supply is also exceptionally reliable, and the natural gas industry has a long history of providing reliable
and continuous supplies to its customers, even in times of adversity, such as extreme weather events.
As noted in a report from the Massachusetts Institute of Technology:2
“The natural gas network has few single points of failure that can lead to a system-wide
propagating failure. There are a large number of wells, storage is relatively widespread,
the transmission system can continue to operate at high pressure even with the failure of
half of the compressors, and the distribution network can run unattended and without
power...” 3
In addition to pipeline contracts, dual-fuel capability, and other logistical factors, the geographically
diverse production of natural gas and nationwide, interconnected pipeline network that transports the
large majority of natural gas, significantly enhances system reliability and redundancy. Further, fuel
supply risk is reduced as a result of numerous storage facilities across the nation. This extensive national
network of natural gas storage facilities, many underground, makes them much less susceptible to
extreme weather events and other natural disasters. Moreover, the existence of many operators, each
2 Natural Gas Council, Natural Gas Systems: Reliable & Resilient, July 2017, pages 6. 3 MIT, Lincoln Laboratory, “Interdependence of the Electricity Generation System and the Natural Gas System and Implications for Energy
Security,” May 15, 2013)

4 making individual decisions, creates a diversity of operating practices and decisions, decreasing the
likelihood of large-scale, multisystem outages.
Natural Gas Generation Is Reliable
With respect to the reliability attributes of generation facilities, a recent PJM system reliability study
states “Portfolios composed of up to 86 percent natural gas-fired resources maintained operational
reliability.4 Thus, this analysis did not identify an “upper bound for natural gas.”5
Reliability is derived from a diversity of attributes in generation, not a diversity of fuel sources. PJM’s
report notes, “More diverse [fuel] portfolios are not necessarily more reliable.”6
Essential components of reliable supply resources include the ability for that resource to ramp up and
down quickly; to keep pace with demand; to provide frequency response and reactive power to
maintain grid stability; to provide energy consistently at baseload levels; to maintain fuel security
through storage or transport contracts; to possess multiple sources of fuel; and to utilize domestically
produced fuel. Natural gas generation provides all of these attributes. Figure 1 illustrates the reliability
attributes of various resources.
4 PJM, “PJM’s Evolving Resource Mix and System Reliability,” March 2017 5 Ibid 6 Ibid

5
Figure 1. Reliability Attributes and Technology
Source: Brattle Group, Diversity of Attributes
A prime example of how ramping and cycling abilities are needed to maintain grid stability can be found
in California. Figure 2 plots average net load profiles that have been averaged across seven days around
March 31 to smooth out daily variations. Net load refers to load minus variable renewable generation
and represents the load needed to be served by dispatchable generation. Due to the large amount of
variable renewable generation, primarily solar, on the California grid, there is a frequent need for
flexible dispatchable generation to be able to quickly ramp up and down in response to changes in net
load, particularly when the sun starts to get low in the sky while the system is still in peak load
conditions.

6
Figure 2. California Hourly Net Load - March 28 to April 3, 2013-2016
Source: Meredith Fowlie, The Duck has Landed.
Other regions are also starting to see higher penetrations of variable renewable energy resources and
natural gas generation’s flexibility will be increasingly needed to maintain grid reliability and stability.7
Natural Gas Supplies are Reliable and Resilient
Included in the appendix is a recent Natural Gas Council white paper highlighting the historical reliability
of natural gas:
“The physical operations of natural gas production, transmission and distribution
make the system inherently reliable and resilient. Disruptions to natural gas service
are rare. When they do happen, a disruption of the system does not necessarily result
7 Wind generation in ERCOT is reaching almost 40% of total demand at times; https://www.platts.com/latest-news/electric-power/houston/ercot-sets-record-wind-output-friday-21339374 and in SPP over 50%: https://www.spp.org/about-us/newsroom/spp-sets-north-american-record-for-wind-power/

7
in an interruption of scheduled deliveries of natural gas supply because the natural
gas system has many ways of offsetting the impact of disruptions.”8
The extensive national pipeline system prevents local disruptions, such as construction and maintenance
or extreme weather events, from creating widespread disruptions. Also adding to the system’s integrity
and redundancy is the widespread use of compressor units powered by natural gas, rather than
electricity, which significantly enhances the ability to move supply even during power outages.
Hurricane Harvey offers a clear example of the resiliency of the modern natural gas system. While
natural gas systems were shut down in the Houston area and large parts of the gulf, the geographic
diversity of the natural gas operations kept supplies flowing and prices stable. This is highlighted in the
Bloomberg article included in the appendix and in Figure 3 below, which shows stable natural gas prices
at several hubs for the weeks affected by Hurricane Harvey.
8 Natural Gas Council, Natural Gas Systems: Reliable & Resilient, July 2017, pages 6.

8
Figure 3. U.S. Natural Gas Prices
Source: Platts
The Polar Vortex during the winter of 20149 is used by some as a cautionary tale against placing too
much reliance on natural gas and an argument for increased on-site fuel. The fact, however, is that
during the Polar Vortex, those with firm transportation contracts received their natural gas. It isn’t
commonly known that the limited incidents of natural gas supply interruptions were a result of
interruptible contracts, not weather-related factors. The use of these contracts was an economic
9 Polar Vortex-like events include: January 6th though January 9th, 2014; January 22nd through January 28th, 2014; February 9th
through February 13th; and February 25th through February 28th, 2014

9 decision made by generation owners, not an indication of whether or not the natural gas supply
infrastructure is reliable or not, as is often implied.10
The Polar Vortex winter presented broad challenges and was a learning experience for all forms of
generation.11 As a result, many regions took steps to ensure similar issues would not reoccur. For
example, PJM developed its Capacity Performance plan, which requires generators to be able to deliver
energy when emergency conditions exist. Generators are rewarded for meeting the increased standards
for deliverability and are penalized when they do not. PJM puts a premium on resources that are
dependable and available. As a result, more natural gas-fired plants have secured firm transportation
contracts or added dual fuel capabilities to ensure reliability.
Government regulation and industry standards codify another layer of resiliency. The Transportation
Security Administration (TSA) Pipeline Security Guidelines (Guidelines) support the development and
implementation of a risk-based corporate security program by pipeline operators to address and
document their organization’s policies and procedures for managing security-related threats, incidents,
and responses. The Guidelines include progressive security measures facilities may use, based on the
characteristics of their particular facility and the threat level determined through their risk assessment.
Under the guidelines, operators should develop and implement a corporate security plan customized to
most effectively mitigate security risks to the company’s critical assets. Such plans are comprehensive in
scope; systematically developed; and risk-based, reflecting the security environment.
10 Partly, this economic decision was influenced by the inability of merchant generators to receive full cost recovery for higher priced firm transport contracts from the wholesale electricity markets. This issue has been and continues to be examined by the RTOs and FERC, and some pricing reforms have already been implemented. 11 All types of generating units experienced outages for various cold-related issues, for example, frozen coal piles and cooling water systems. See PJM reports: https://www.gpo.gov/fdsys/pkg/CHRG-113shrg87851/html/CHRG-113shrg87851.htm and http://www.pjm.com/~/media/library/reports-notices/weather-related/20140509-analysis-of-operational-events-and-market-impacts-during-the-jan-2014-cold-weather-events.ashx

10 The many guidelines and standards that govern natural gas operators’ management of cybersecurity
include: TSA Pipeline Security Guidelines, National Institute of Standards and Technology (NIST)
Framework for Improving Critical Infrastructure Cybersecurity, Department of Energy (DOE)
Cybersecurity Capability Maturity Model (C2M2), ISA/IEC 62443 Series of Standards on Industrial
Automation and Control Systems Security, INGAA Control Systems Cyber Security Guidelines, and API
Standard 1164 Pipeline SCADA Security. Also, information sharing of cyber threats is another key
defense through the Oil and Natural Gas Information Sharing and Analysis Center (ISAC) and through the
Department of Homeland Security’s National Cybersecurity and Communications Integration Center
(NCCIC) and Industrial Control System Computer Emergency Readiness Team (ICS-CERT).
In addition, the National Critical Infrastructure Prioritization Program (NCIPP) categorizes high priority
critical infrastructure as either level 1 or level 2 based on the consequences to the nation in terms of
four factors—fatalities, economic loss, mass evacuation length, and degradation of national security. To
date, no oil or natural gas assets are designated as level 1 (the highest level).12 Additionally, the
Presidential Policy Directive (PPD) 21 (2013) required the Department of Homeland Security to identify
critical infrastructure “where a cybersecurity incident could reasonably result in catastrophic regional or
national effects on public health or safety, economic security, or national security.” The PPD 21 list of
“Section 9 Critical Infrastructure at Greatest Risk” does not include any upstream natural gas companies
or assets.13 For a more detailed discussion of natural gas system reliability and resiliency, please see the
recent Natural Gas Council white paper on the topic included in the appendix.
12 The list of L1/L2 infrastructure is classified, but the Department of Homeland Security has confirmed that no oil and natural gas assets are on the list. 13 The list of “Section 9” entities is classified; however, API is not aware of any member companies that are on the list.

11
Abundant Natural Gas Reduces Electricity Costs
Natural gas-fired power plants are one of the most cost-effective forms of generation to build and
operate. This has resulted in significant wholesale electricity cost reductions. As an example, since 2008,
average annual wholesale power prices in PJM have decreased by almost 50 percent. Market forces
have driven these price reductions, thereby reducing costs for consumers and driving additional
economic activity.
Figure 4 shows the PJM West Hub electricity prices along with Henry Hub natural gas prices over the
past twelve years.
Figure 4. Wholesale Power and Natural Gas Prices
Source: NYMEX and ICE
Competitive markets work by eliminating inefficiencies in the system, thereby driving down prices for
customers. Competitive forces in natural gas markets have resulted in the shale gas boom currently
providing numerous benefits to the nation. Over the last decade, the natural gas industry has enhanced

12 efficiencies and reduced costs. As shown in Figure 5, rig counts have fallen drastically while natural gas
production has continued to rise. This is due to technological innovations driven by market competition.
The same market forces simultaneously improve reliability and resiliency as those become necessary
attributes in order to remain competitive.
Figure 5. Natural Gas Production Efficiency
Source: EIA and Baker Hughes
These market-driven increases in efficiencies have resulted in extensive new supplies of natural gas
being developed at lower prices than before, further increasing the reliability and resiliency of the
supply.
The economics of lower commodity price production levels are measured in IHS-Markit’s 2016 report
“Shale Gas Reloaded: The Evolving View of North American Natural Gas Resources and Costs.” The
report identifies 1,400 Tcf of natural gas in the U.S. Lower 48 and Canada that is economically and

13 technically recoverable at breakeven prices of $4/MMBTU with more than half (approximately 800 Tcf)
of this resource base recoverable at prices of $3/MMBTU.14
Source: Data from EIA and IHS-Markit, February 2016
The size of IHS-Markit’s resource base and their cost of recovery suggest two conclusions. First, there is
sufficient natural gas to meet future demand, even when exports are taken into account. Specifically,
the estimated production potential, even at the $3/MMBTU level (roughly 800 Tcf) dwarfs U.S. natural
gas demand and expected exports. In 2015, total U.S. natural gas consumption was about 27 Tcf, and
EIA forecasts natural gas consumption to range between 32.27 Tcf in the Reference Case to 38.33 Tcf by
2050 in the High Oil and Gas Resource and Technology (High Resource) scenario.15 Adding natural gas
exports to the story doesn’t materially change the answer as those do not cross 1 Tcf in any scenario by
2050,16 which is the last year of EIA’s forecast.
14 IHS-Markit, “North America’s Unconventional Natural Gas Resource Base Continues to Expand in Volume and Decrease in Cost.” February 23, 2016. 15 EIA Annual Energy Outlook 2016, Table: Energy Consumption by Sector and Source. 16 Ibid
Figure 6. Recoverable Reserves

14 This massive supply figure and relatively low level of exports can, according to IHS, assuage any concerns
about export demand pulling prices upward. Clearly, the U.S can be well positioned to be a critical global
supplier of natural gas to our allies in Europe and elsewhere and can do so without affecting domestic
affordability.
Second, the 800 Tcf of natural gas production that is economical in the $3-$4/MMBTU range (as shown
in the IHS-Markit report) explains the sustained low price forecasts in the EIA Annual Energy Outlook’s
High Resource case. Because the industry has shown its ability to maintain, and even increase, high
production levels in lower commodity price environments, the High Resource case price series showing
sub $4/MMBTU in the foreseeable future is likely the most representative of current market dynamics.
Each year, for the AEO, EIA conducts a base case analysis and then several alternative scenarios, one of
which is the High Resource scenario. In the past few years, EIA has underestimated the impact of
technology on natural gas production and the industry’s ability to lower production costs.
Consequently, the EIA has underestimated the size of the resource base in the High Resource case, as
well as the Reference case. Figure 7 compares actual U.S. natural gas production to a range of EIA
reference cases in previous AEOs as well as EIA’s the High Resource scenario.

15
Figure 7. U.S. Dry Natural Gas Production, AEO 2012-2015 Projections & Actuals
Source: EIA, Annual Energy Outlooks 2012 – 2015; Actual Production
Figure 8 maps the corresponding price trajectories for both EIA’s Reference Case and High Resource
scenario (the former making the upper bound and the latter the lower bound of the chart). The lower
bound of the series shows a steady natural gas price forecast within the $3-$4/MMBTU range, which has
proven to be sustainable due to the industry’s track record of reducing production costs.
20
21
22
23
24
25
26
27
28
2012 2013 2014 2015
Trill
ion
Cu
bic
Fee
t
U.S. Dry Natural Gas ProductionAEO 2012-2015 Projections & Actuals
Range of Reference Cases Range of High Resource Cases Actual Production

16 Figure 8. EIA AEO 2017 Projection: Henry Hub Spot Price (Reference Case and High Supply Case Range)
Source: EIA, Annual Energy Outlook, 2017
Natural gas is well positioned to provide a reliable and low-cost source of fuel for electric generation for
the foreseeable future, according to both IHS and EIA, and many other natural gas resource base
experts.
Natural gas abundance also reduces emissions. Total U.S. electrical sector emissions are down below
1990 levels mainly due to the influx of natural gas generation (1,831 million metric tons in 1990).17
17 EIA
0.0
1.0
2.0
3.0
4.0
5.0
6.0
2015 2020 2025 2030 2035 2040
20
16
$/M
MB
tu
EIA AEO 2017 Projection: Henry Hub Spot Price(Reference Case and High Supply Case Range)
17
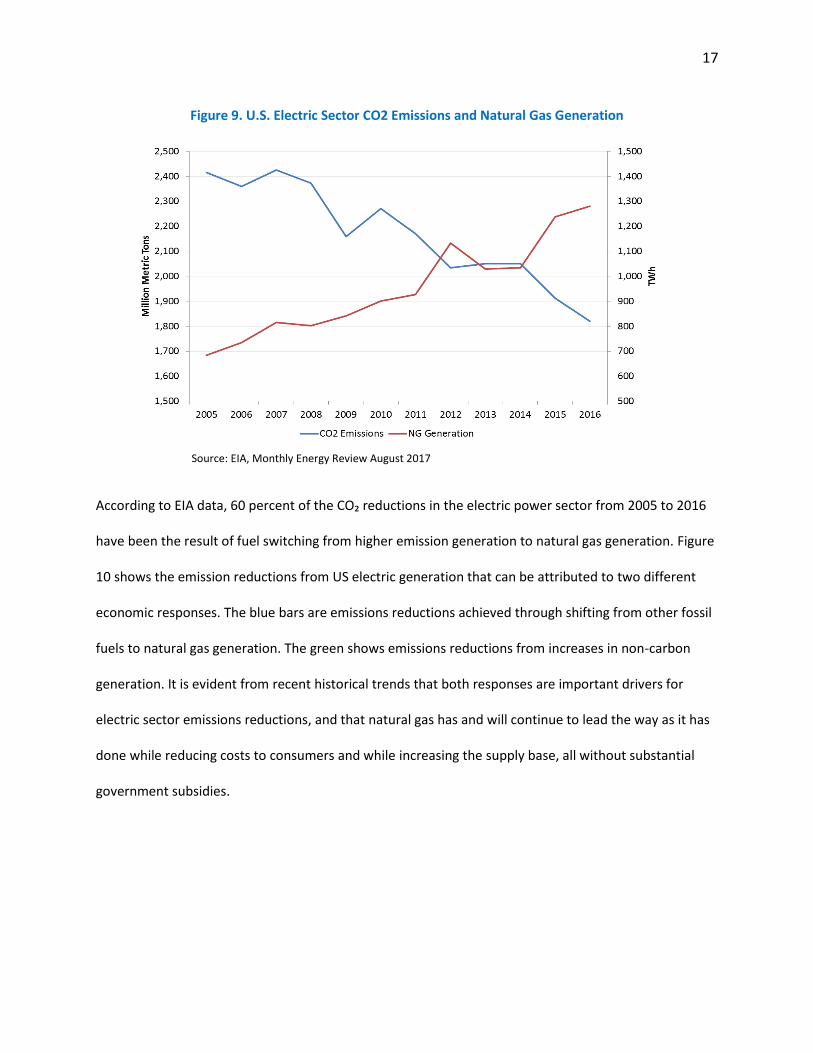
Figure 9. U.S. Electric Sector CO2 Emissions and Natural Gas Generation
Source: EIA, Monthly Energy Review August 2017
According to EIA data, 60 percent of the CO₂ reductions in the electric power sector from 2005 to 2016
have been the result of fuel switching from higher emission generation to natural gas generation. Figure
10 shows the emission reductions from US electric generation that can be attributed to two different
economic responses. The blue bars are emissions reductions achieved through shifting from other fossil
fuels to natural gas generation. The green shows emissions reductions from increases in non-carbon
generation. It is evident from recent historical trends that both responses are important drivers for
electric sector emissions reductions, and that natural gas has and will continue to lead the way as it has
done while reducing costs to consumers and while increasing the supply base, all without substantial
government subsidies.

18
Figure 10. Electric Sector CO2 Emissions Reductions
DOE Recommendations
Some of the recommendations in the recent DOE Staff Report on Electricity Markets and Reliability were
directed at FERC, especially with regard to wholesale electricity market reforms. API has submitted
comments to FERC dockets on numerous occasions, discussing the need to adapt wholesale electricity
markets to the changing economics of the electric industry and the nature of the electric grid. The most
recent comments were in response to a technical conference in May 2017 on state policies and these
policies’ effects on wholesale electricity market price formation. In those comments, API once again
outlines a series of principles that should be adhered to in order to preserve and promote the much-
needed and benefits-creating competitive nature of the wholesale electricity markets. These principles
are:
• Efficient market design will result in price formation that matches the demand for essential
reliability services and performance attributes with the supply.

19
• Energy market price caps should be lifted to a level sufficient to allow efficient price formation.
Concurrent with this, FERC should require each RTO/ISO to settle all smart meters in its
footprint on a five-to-fifteen minute basis, which would allow consumers and their retailers to
react to the price information in the real-time market thus enhancing demand sector elasticity.
• Ideally, market-clearing prices should reflect the costs of all units that are called to operate,
including start-up and no load costs.
• The market-clearing price should reflect the costs of all units that run including block-loaded or
ramping units, operating reserves, units providing voltage support or reactive power, or units
run in response to reliability events or needs.
• Prices in energy and ancillary service markets should reflect shortage or emergency situations to
provide needed investment signals and to reinforce real-time reliability in the face of increased
variable output of intermittent renewables.
• Price formation should enable all reasonable and supportable costs incurred in unexpected
circumstances, particularly when such costs are incurred in response to operator directives.18
Much has already been done with respect to gas-electric coordination through the FERC’s Natural Gas –
Electric Coordination initiative.19 All of the changes agreed to in that process by both the electric and
natural gas industries have now been implemented. For example, the natural gas industry added
additional opportunities for customers to access natural gas pipeline capacity throughout the day. Talks
between the two industries continue to progress and, as mentioned earlier, it is important that any
further changes are market-based and benefit from the free and competitive market nature of the
natural gas system, and are fully supported by both industries.
18 Comments of the American Petroleum Institute, FERC Docket No. AD17-11-000, June 22, 2017. 19 https://www.ferc.gov/industries/electric/indus-act/electric-coord.asp

20
Conclusion
Market forces, public policy, and environmental policy are driving the ongoing shift in our nation’s
power generation mix. Natural gas generation is an important and growing part of that mix. Collectively,
the environmental advantages, reliability, and affordability of natural gas generation are unmatched by
any other form of power generation. Natural gas has earned its market share in the electricity
generation space and has provided, and can continue to provide, reliable, low-cost fuel for electricity
generation and cost savings to consumers.
The natural gas industry stands ready to work with all stakeholders to ensure that our nation’s electrical
grid is reliable, safe, and resilient. We urge policymakers to recognize that a free and competitive
market-based approach is the best way to ensure that our nation’s electricity needs are met affordably,
reliably and in the most environmentally responsible way possible.

21
Summary
Natural gas is a domestically produced, abundant, reliable and low-cost energy resource that lowers
energy costs for consumers and spurs economic growth and opportunity for our nation. Natural gas
enhances the reliability, decreases the cost, and lowers the environmental impact of the nation’s
electric system because:
• Natural gas generation enhances the flexibility of the electricity grid. Natural gas generation is
flexible and fast ramping, and able to cycle off and on in a short period of time. This helps maintain
stability and reliability on an electric grid increasingly experiencing net load volatility due to the
increase in variable renewable energy resources.
• Natural gas will remain a stable and low-cost fuel. According to EIA, based on the past and
expected future technical innovations, production growth, and the size of the resource, natural gas
prices will remain stable and low for years to come, providing a reliable source of fuel for electric
generation.
• Natural gas’ low cost helps to drive down wholesale electricity costs. Low-cost natural gas
continues to provide significant cost savings which may up free up funds for additional investment in
other things, such as infrastructure, which, in turn, enhances reliability.
• The increased use of natural gas in power generation has lowered emissions. New, clean and
efficient natural gas generation has grown considerably as a part of the electric generation mix,
which has reduced electric sector emissions to levels not seen since 1990. In 2016, carbon dioxide
emissions from power generation were at nearly 30-year lows.
• The natural gas system is reliable and resilient. Its geographic diversity in terms of supply provides
for multiple flows in all directions across the country. Natural gas companies follow a rigorous set of

22
guidelines and standards and, due to the market-based nature of the industry, have a vested
interest in keeping the product reliably flowing to all their customers.