apic country report india 2013
DESCRIPTION
Chemistry related documentTRANSCRIPT
Indian Petrochemical Industry
2013 Asia Petrochemical Industry Conference
May 09-10 2013, Taipei, Taiwan
1
Indian Petrochemical Industry
Review of 2012 & Outlook for 2013
APIC 2013
Country Paper from India
Prepared by
Chemicals & Petrochemicals Manufacturers’ Association
Flat No 708, 7th Floor, Kailash Building,
26, Kasturba Gandhi Marg,
New Delhi – 110001, INDIA
Phone: 91-11-43612198, Fax: 91-11-43598338,
Website: [email protected]
Indian Petrochemical Industry
2013 Asia Petrochemical Industry Conference
May 09-10 2013, Taipei, Taiwan
2
Content
SECTION 1 ........................................................................................................ 5
THE INDIAN ECONOMY: REVIEW OF 2012 & OUTLOOK FOR 2013 .................................... 6
THE INDIAN ECONOMY SNAPSHOT ........................................................................... 6
REVIEW OF 2012 ................................................................................................ 6
THE BALANCE OF PAYMENT .................................................................................. 9
INDUSTRIAL PERFORMANCE ................................................................................ 11
OUTLOOK FOR 2013: INDIA ................................................................................. 11
SECTION 2 ...................................................................................................... 13
PETROCHEMICAL INDUSTRY IN INDIA ..................................................................... 14
PETROCHEMICAL INDUSTRY REVIEW OF 2012 & OUTLOOK FOR 2013 ............................ 15
POLYMERS ...................................................................................................... 15
POLYOLEFINS .................................................................................................. 16
VINYL’S: PVC ................................................................................................... 17
STYRENICS ...................................................................................................... 17
A. POLYSTYRENE........................................................................................... 17
B. ACRYLONITRILE-BUTADIENE-STYRENE (ABS) ..................................................... 18
C. STYRENE-ACRYLONITRILE (SAN) .................................................................... 18
OLEFINS (INCLUDING BUTADIENE, STYRENE, EDC & VCM) ........................................... 19
A. ETHYLENE & PROPYLENE ............................................................................. 19
B. BUTADIENE .............................................................................................. 20
C. STYRENE ................................................................................................. 20
D. EDC & VCM ............................................................................................... 21
FIBRE INTERMEDIATES ....................................................................................... 21
SYNTHETIC FIBRES ............................................................................................ 23
AROMATICS – PARAXYLENE ................................................................................. 24
SURFACTANTS ................................................................................................. 25
SYNTHETIC RUBBER .......................................................................................... 26
CARBON BLACK FEEDSTOCK & CARBON BLACK ........................................................ 27
OTHER KEY PETROCHEMICALS ............................................................................. 28
OUTLOOK FOR THE OVERALL INDIAN PETROCHEMICAL INDUSTRY ................................ 30
SECTION 3 ...................................................................................................... 32
DEMAND SUPPLY BALANCE: POLYMERS (KT) ............................................................ 33
DEMAND SUPPLY BALANCE: OLEFINS (KT)............................................................... 35
DEMAND SUPPLY BALANCE: ABS, SAN, PX & SURFACTANTS (KT) .................................. 36
DEMAND SUPPLY BALANCE: FIBRE INTERMEDIATES (KT) ............................................. 37

Indian Petrochemical Industry
2013 Asia Petrochemical Industry Conference
May 09-10 2013, Taipei, Taiwan
3
DEMAND SUPPLY BALANCE: SYNTHETIC FIBRES (KT) ................................................. 38
DEMAND SUPPLY BALANCE: ELASTOMERS (KT)......................................................... 40
DEMAND SUPPLY BALANCE: CARBON BLACK & CBFS (KT) ........................................... 41
DEMAND SUPPLY BALANCE: OTHER KEY PETROCHEMICALS (KT) ................................... 42
Indian Petrochemical Industry
2013 Asia Petrochemical Industry Conference
May 09-10 2013, Taipei, Taiwan
4
Table
TABLE 1: ESTIMATED GROWTH OF THE INDIAN ECONOMY IN 2011-12 ........................................... 8 TABLE 2: BALANCE OF PAYMENTS SUMMARY ...................................................................... 9 TABLE 3: INDIA’S GDP GROWTH PROJECTION – 2013 - 14 .................................................... 12 TABLE 4: POLYMER DEMAND SUPPLY ............................................................................ 15 TABLE 5: POLYOLEFIN DEMAND IN INDIA ACTUAL & PROJECTED................................................ 16 TABLE 6: PVC DEMAND SUPPLY ................................................................................. 17 TABLE 7: POLYSTYRENE DEMAND SUPPLY ....................................................................... 17 TABLE 8: ABS DEMAND SUPPLY ................................................................................. 18 TABLE 9: SAN DEMAND SUPPLY ................................................................................. 18 TABLE 10: ETHYLENE & PROPYLENE NET AVAILABILITY ......................................................... 19 TABLE 11: BUTADIENE DEMAND SUPPLY......................................................................... 20 TABLE 12: STYRENE DEMAND SUPPLY ........................................................................... 20 TABLE 13: EDC & VCM IMPORT INTO INDIA .................................................................... 21 TABLE 14 : FIBRE INTERMEDIATE DEMAND SUPPLY (KT) ........................................................ 22 TABLE 15: DEMAND SUPPLY BALANCE OF SYNTHETIC FIBRE (KT) .............................................. 23 TABLE 16: PARAXYLENE DEMAND SUPPLY ....................................................................... 25 TABLE 17: DEMAND & SUPPLY OF LAB & EO (KT) ............................................................. 25 TABLE 18: DEMAND SUPPLY BALANCE OF PBR, SBR, NBR & EPDM (KT) .................................... 26 TABLE 19: DEMAND SUPPLY BALANCE OF CBFS & CARBON BLACK (KT)....................................... 27 TABLE 20: DEMAND SUPPLY BALANCE OF BENZENE, TOLUENE, MX & OX ..................................... 28 TABLE 21: SEGMENT-WISE DEMAND FOR PETROCHEMICALS (KT) ............................................... 31
Figure
FIGURE 1: QUARTERLY GDP GROWTH RATE AT CONSTANT 2004-05 PRICES..................................... 7 FIGURE 2: INFRASTRUCTURE PERFORMANCE (% GROWTH) ...................................................... 11 FIGURE 3: PER CAPITA POLYMER CONSUMPTION VS PER CAPITA GDP ~ 2010 ................................. 14 FIGURE 4: AGGREGATE PETROCHEMICAL DEMAND (ALL KEY SEGMENTS – MMT) ................................ 30
Indian Petrochemical Industry
2013 Asia Petrochemical Industry Conference
May 09-10 2013, Taipei, Taiwan
5
Section 1
The Indian Economy
Indian Petrochemical Industry
2013 Asia Petrochemical Industry Conference
May 09-10 2013, Taipei, Taiwan
6
The Indian Economy: Review of 2012 & Outlook for 2013
The Indian Economy Snapshot
The economy of India is the tenth-largest in the world by nominal GDP and the third
largest by purchasing power parity (PPP). The country is one of the G-20 major
economies and a member of BRICS. On a per capita income basis, India ranked 140th by
nominal GDP and 129th by GDP (PPP) in 2011, according to the IMF. India is the
nineteenth largest exporter and tenth largest importer in the world.
India currently accounts for 1.5% of world trade as of 2007 according to the World Trade
Statistics of the WTO in 2006, which valued India's total merchandise trade (counting
exports and imports) at $294 billion and India's services trade at $143 billion. Thus,
India's global economic engagement in 2006 covering both merchandise and services
trade was of the order of $437 billion, up by a record 72% from a level of $253 billion in
2004. India's total trade in goods and services has reached a share of 43% of GDP in
2005–06, up from 16% in 1990–91.[22] In the year 2010–11 India's total merchandisee
trade (counting exports and imports) stands at $ 606.7 billion and is currently the 9th
largest in the world. During 2011–12, India's foreign trade grew by an impressive 30.6%
to reach $ 792.3 billion (Exports-38.33% & Imports-61.67%).
Review of 2012
Following the slowdown induced by the global financial crisis in 2008-09, the Indian
economy responded strongly to fiscal and monetary stimulus and achieved a growth rate
of 8.6 per cent and 9.3 per cent respectively in 2009-10 and 2010-11, but due to a
combination of both external and domestic factors, the economy decelerated growing at
6.2 percent and an estimated 5 percent in 2011-12 and 2012-13 respectively.
Question arises that why has the economy slowed down so rapidly despite recovering
strongly from the global financial crisis? There are number of reasons responsible for
slowdown. First, the boost to demand given by monetary and fiscal stimulus following
the crisis was large. Final consumption grew at an average of over 8 per cent annually
between 2009-10 and 2011-12. The result was strong inflation and a powerful monetary
response that also slowed consumption demand. Second, starting in 2011-12, corporate
and infrastructure investment started slowing both as a result of investment bottlenecks as
well as the tighter monetary policy. Thirdly, even as the economy slowed, it was hit by
two additional shocks: a slowing global economy, weighed down by the crisis in the Euro
area and uncertainties about fiscal policy in the United States, and a weak monsoon, at
least in its initial phase.
The third quarter of 2012 has seen a positive approach from the government to restore the
economy to 7–8 per cent growth rate. The government is committed to fiscal
consolidation. This along with demand compression and augmented agricultural
production should lead to lower inflation, giving the RBI the requisite flexibility to
Indian Petrochemical Industry
2013 Asia Petrochemical Industry Conference
May 09-10 2013, Taipei, Taiwan
7
reduce policy rates. Lower interest rates could provide an additional fillip to investment
activity for the industry and services sectors, especially if some of the regulatory,
bureaucratic, and financial impediments to investment are eased. It is hoped that the
government will carry out reforms including fiscal consolidation and regaining investor
confidence.
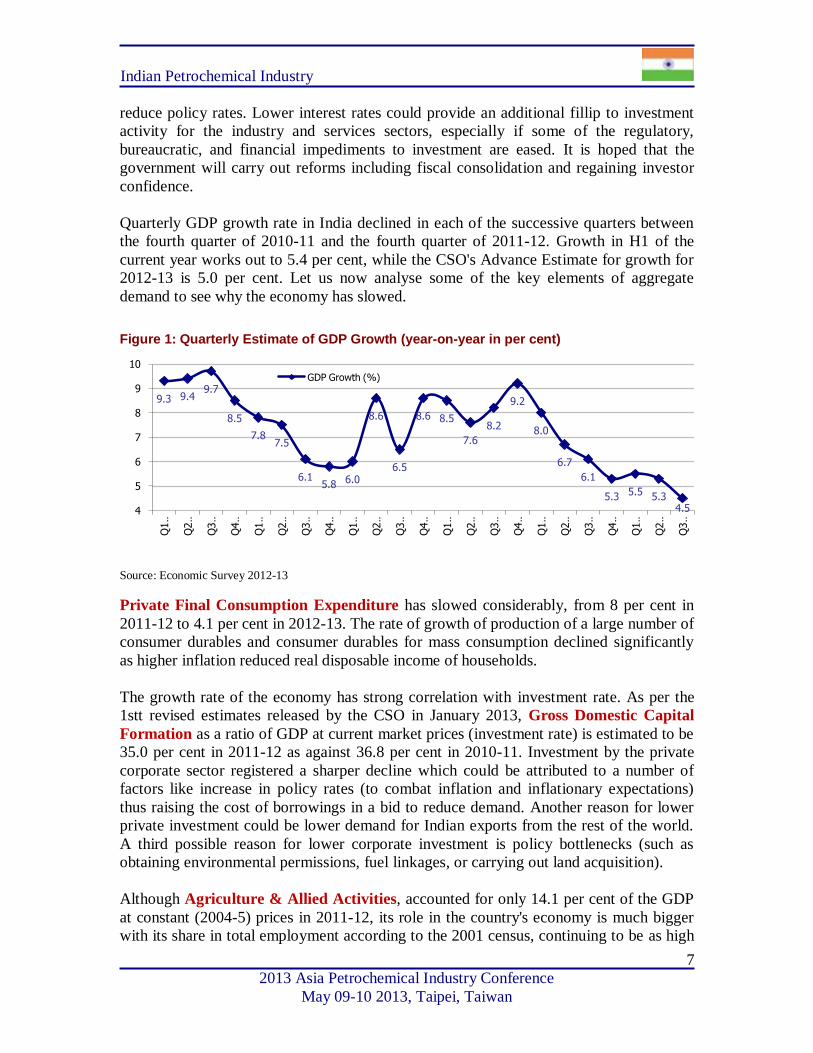
Quarterly GDP growth rate in India declined in each of the successive quarters between
the fourth quarter of 2010-11 and the fourth quarter of 2011-12. Growth in H1 of the
current year works out to 5.4 per cent, while the CSO's Advance Estimate for growth for
2012-13 is 5.0 per cent. Let us now analyse some of the key elements of aggregate
demand to see why the economy has slowed.
Figure 1: Quarterly Estimate of GDP Growth (year-on-year in per cent)
Source: Economic Survey 2012-13
Private Final Consumption Expenditure has slowed considerably, from 8 per cent in
2011-12 to 4.1 per cent in 2012-13. The rate of growth of production of a large number of
consumer durables and consumer durables for mass consumption declined significantly
as higher inflation reduced real disposable income of households.
The growth rate of the economy has strong correlation with investment rate. As per the
1stt revised estimates released by the CSO in January 2013, Gross Domestic Capital
Formation as a ratio of GDP at current market prices (investment rate) is estimated to be
35.0 per cent in 2011-12 as against 36.8 per cent in 2010-11. Investment by the private
corporate sector registered a sharper decline which could be attributed to a number of
factors like increase in policy rates (to combat inflation and inflationary expectations)
thus raising the cost of borrowings in a bid to reduce demand. Another reason for lower
private investment could be lower demand for Indian exports from the rest of the world.
A third possible reason for lower corporate investment is policy bottlenecks (such as
obtaining environmental permissions, fuel linkages, or carrying out land acquisition).
Although Agriculture & Allied Activities, accounted for only 14.1 per cent of the GDP
at constant (2004-5) prices in 2011-12, its role in the country's economy is much bigger
with its share in total employment according to the 2001 census, continuing to be as high
9.3 9.49.7
8.5
7.87.5
6.15.8 6.0
8.6
6.5
8.6 8.5
7.6
8.2
9.2
8.0
6.7
6.1
5.3 5.5 5.34.54
5
6
7
8
9
10
Q1 …
Q2 …
Q3 …
Q4 …
Q1 …
Q2 …
Q3 …
Q4 …
Q1 …
Q2 …
Q3 …
Q4 …
Q1 …
Q2 …
Q3 …
Q4 …
Q1 …
Q2 …
Q3 …
Q4 …
Q1 …
Q2 …
Q3 …
GDP Growth (%)
Indian Petrochemical Industry
2013 Asia Petrochemical Industry Conference
May 09-10 2013, Taipei, Taiwan
8
as 58.2 per cent. The performance of Indian agriculture is still heavily dependent on
rainfall and south west monsoon (June to September), comprising 75 per cent of total
annual rainfall, substantially affects production and productivity of agriculture. During
2011-12, total food grains production reached an all-time high of 259.32 million tonnes.
However, the production of 2012-13 kharif crops is likely to be adversely affected by
deficiency in the south-west monsoon and the resultant acreage losses. Output is expected
to decline in all major crops.
Overall Industrial performance, as reflected by the IIP continued to moderate from Q1
of 2011-12 with growth turning negative in Q1 of 2012-13, before improving to 2.1 per
cent in Q3 of 2012-13. The Mining sector contraction in 2012-13 was largely because of
decline in natural gas and crude petroleum output. Manufacturing, which is the dominant
sector in industry, also witnessed deceleration in growth, as did the electricity sector.
There was, however, a sharp pick-up in growth in October 2012 with manufacturing
growth improving to 9.8 per cent, the highest recorded since June, 2011.
Country estimates for 2012 show a deceleration in Services growth in some major
countries. For example, in 2012 it decelerated to 0.5 per cent from 0.9 per cent (in 2011)
in the USA; 8.1 per cent in 2012 from 9.4 per cent (in 2011) in China; and 6.6 per cent in
FY 2012-13 from 8.2 per cent (in FY 2011-12) in India.
The share of services in India’s GDP at factor cost (at current prices) increased from 33.3
per cent in 1950-1 to 56.5 per cent in 2012-13 as per Advance Estimates. Including
construction, the share would increase to 64.8 per cent in 2012-13. With an 18 per cent
share - trade, hotels, and restaurants as a group is the largest contributor to GDP among
the various services sub-sectors, followed by financing, insurance, real estate, and
business services with a 16.6 per cent share. Both these services showed perceptible
improvement in their shares over the years. Community, social, and personal services
with a share of 14 per cent is in third place. Construction, a borderline services inclusion,
is at fourth place with an 8.2 per cent share.
The Net Invisibles Balance (in which net service exports and remittances are prominent)
usually offsets the trade deficit. However, it also declined in dollar terms in H1 of 2012-
13 relative to H1 of 2011- 12. The increased outflow of investment income to foreigners
has also played a part in reducing net invisibles. As a result of the widening of the trade
deficit and moderation in net invisibles surplus, the CAD worsened to 4.6 per cent of
GDP during H1 of 2012-13 as compared to 4.0 per cent of GDP in H1 of 2011-12.
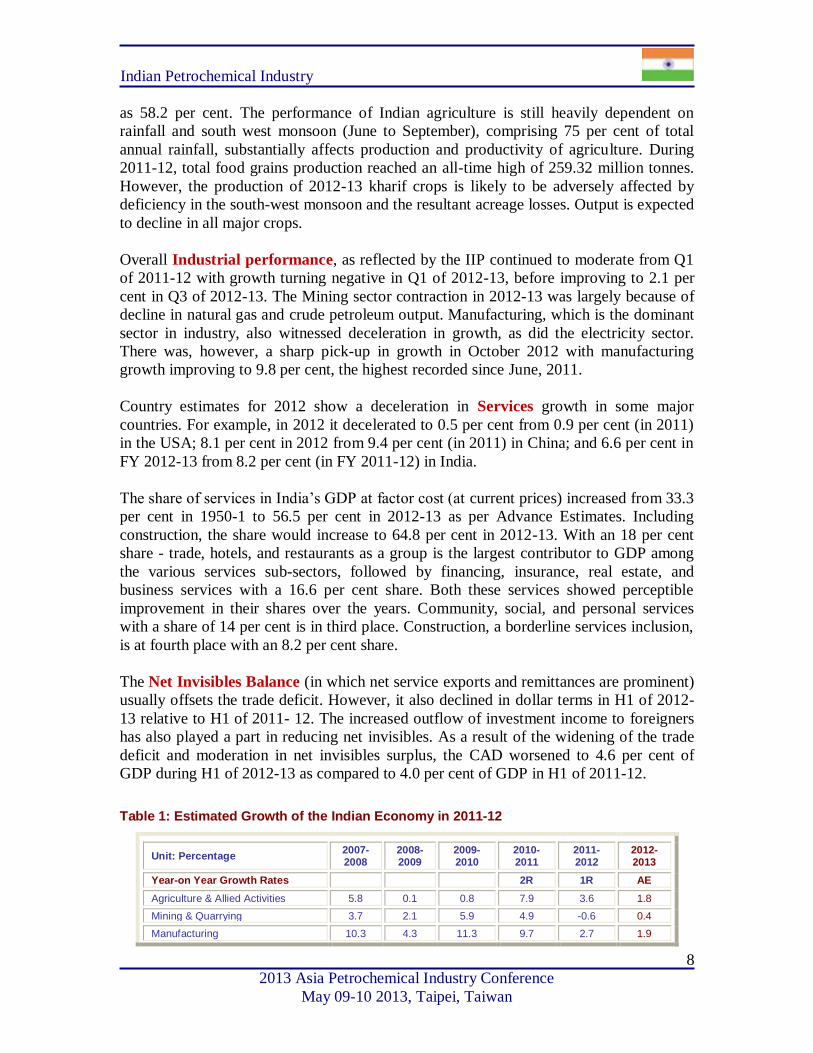
Table 1: Estimated Growth of the Indian Economy in 2011-12
Unit: Percentage 2007-2008
2008-2009
2009-2010
2010-2011
2011-2012
2012-2013
Year-on Year Growth Rates 2R 1R AE
Agriculture & Allied Activities 5.8 0.1 0.8 7.9 3.6 1.8
Mining & Quarrying 3.7 2.1 5.9 4.9 -0.6 0.4
Manufacturing 10.3 4.3 11.3 9.7 2.7 1.9
Indian Petrochemical Industry
2013 Asia Petrochemical Industry Conference
May 09-10 2013, Taipei, Taiwan
9
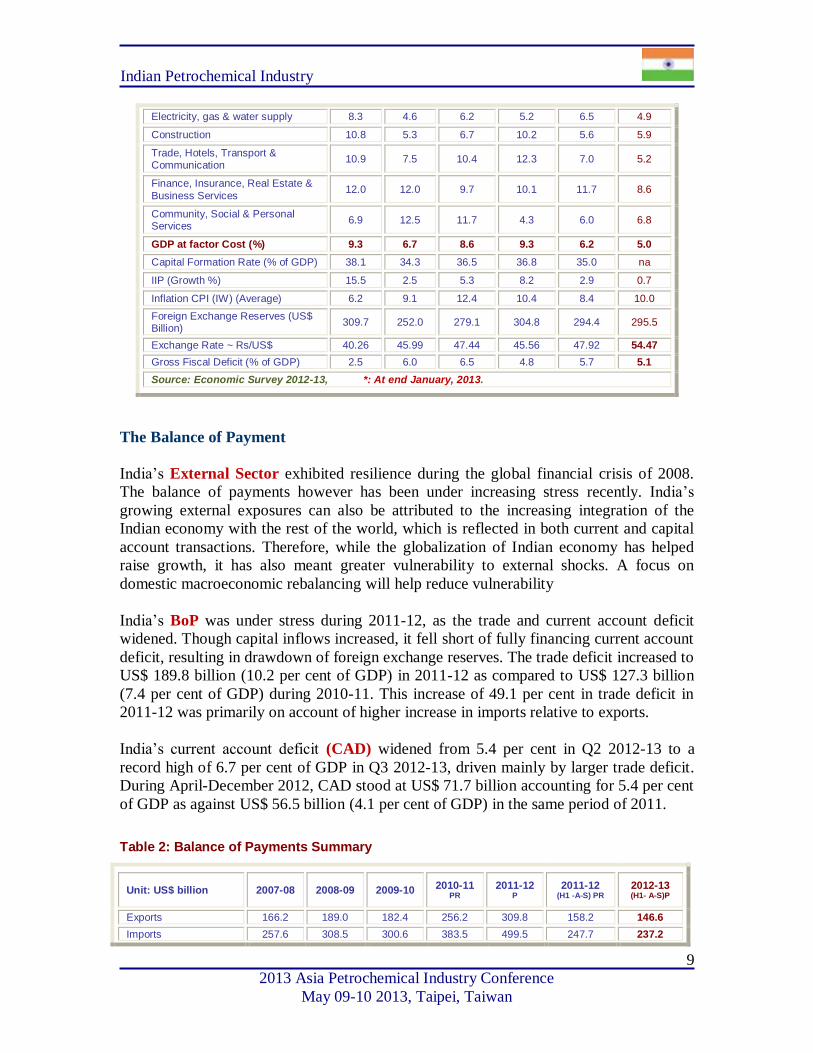
Electricity, gas & water supply 8.3 4.6 6.2 5.2 6.5 4.9
Construction 10.8 5.3 6.7 10.2 5.6 5.9
Trade, Hotels, Transport & Communication
10.9 7.5 10.4 12.3 7.0 5.2
Finance, Insurance, Real Estate &
Business Services 12.0 12.0 9.7 10.1 11.7 8.6
Community, Social & Personal Services
6.9 12.5 11.7 4.3 6.0 6.8
GDP at factor Cost (%) 9.3 6.7 8.6 9.3 6.2 5.0
Capital Formation Rate (% of GDP) 38.1 34.3 36.5 36.8 35.0 na
IIP (Growth %) 15.5 2.5 5.3 8.2 2.9 0.7
Inflation CPI (IW) (Average) 6.2 9.1 12.4 10.4 8.4 10.0
Foreign Exchange Reserves (US$ Billion)
309.7 252.0 279.1 304.8 294.4 295.5
Exchange Rate ~ Rs/US$ 40.26 45.99 47.44 45.56 47.92 54.47
Gross Fiscal Deficit (% of GDP) 2.5 6.0 6.5 4.8 5.7 5.1
Source: Economic Survey 2012-13, *: At end January, 2013.
The Balance of Payment
India’s External Sector exhibited resilience during the global financial crisis of 2008.
The balance of payments however has been under increasing stress recently. India’s
growing external exposures can also be attributed to the increasing integration of the
Indian economy with the rest of the world, which is reflected in both current and capital
account transactions. Therefore, while the globalization of Indian economy has helped
raise growth, it has also meant greater vulnerability to external shocks. A focus on
domestic macroeconomic rebalancing will help reduce vulnerability
India’s BoP was under stress during 2011-12, as the trade and current account deficit
widened. Though capital inflows increased, it fell short of fully financing current account
deficit, resulting in drawdown of foreign exchange reserves. The trade deficit increased to
US$ 189.8 billion (10.2 per cent of GDP) in 2011-12 as compared to US$ 127.3 billion
(7.4 per cent of GDP) during 2010-11. This increase of 49.1 per cent in trade deficit in
2011-12 was primarily on account of higher increase in imports relative to exports.
India’s current account deficit (CAD) widened from 5.4 per cent in Q2 2012-13 to a
record high of 6.7 per cent of GDP in Q3 2012-13, driven mainly by larger trade deficit.
During April-December 2012, CAD stood at US$ 71.7 billion accounting for 5.4 per cent
of GDP as against US$ 56.5 billion (4.1 per cent of GDP) in the same period of 2011.
Table 2: Balance of Payments Summary
Unit: US$ billion 2007-08 2008-09 2009-10 2010-11 PR
2011-12 P
2011-12 (H1 -A-S) PR
2012-13 (H1- A-S)P
Exports 166.2 189.0 182.4 256.2 309.8 158.2 146.6
Imports 257.6 308.5 300.6 383.5 499.5 247.7 237.2
Indian Petrochemical Industry
2013 Asia Petrochemical Industry Conference
May 09-10 2013, Taipei, Taiwan
10
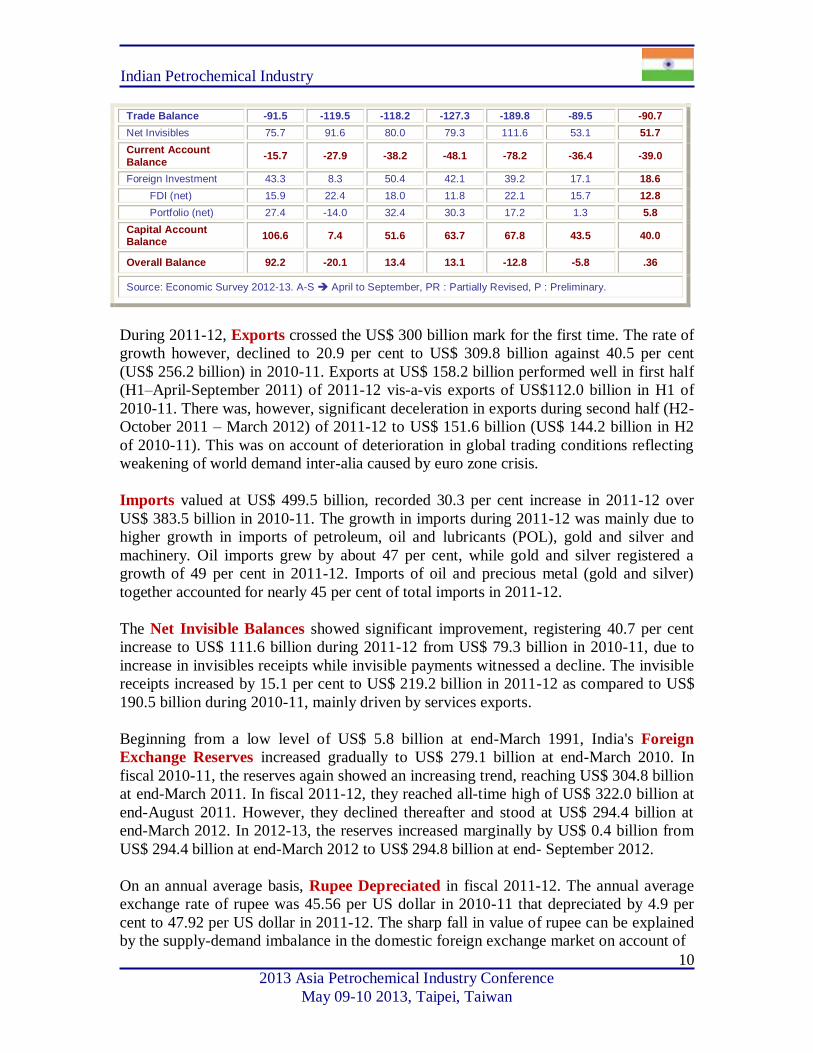
Trade Balance -91.5 -119.5 -118.2 -127.3 -189.8 -89.5 -90.7
Net Invisibles 75.7 91.6 80.0 79.3 111.6 53.1 51.7
Current Account
Balance -15.7 -27.9 -38.2 -48.1 -78.2 -36.4 -39.0
Foreign Investment 43.3 8.3 50.4 42.1 39.2 17.1 18.6
FDI (net) 15.9 22.4 18.0 11.8 22.1 15.7 12.8
Portfolio (net) 27.4 -14.0 32.4 30.3 17.2 1.3 5.8
Capital Account Balance
106.6 7.4 51.6 63.7 67.8 43.5 40.0
Overall Balance 92.2 -20.1 13.4 13.1 -12.8 -5.8 .36
Source: Economic Survey 2012-13. A-S April to September, PR : Partially Revised, P : Preliminary.
During 2011-12, Exports crossed the US$ 300 billion mark for the first time. The rate of
growth however, declined to 20.9 per cent to US$ 309.8 billion against 40.5 per cent
(US$ 256.2 billion) in 2010-11. Exports at US$ 158.2 billion performed well in first half
(H1–April-September 2011) of 2011-12 vis-a-vis exports of US$112.0 billion in H1 of
2010-11. There was, however, significant deceleration in exports during second half (H2-
October 2011 – March 2012) of 2011-12 to US$ 151.6 billion (US$ 144.2 billion in H2
of 2010-11). This was on account of deterioration in global trading conditions reflecting
weakening of world demand inter-alia caused by euro zone crisis.
Imports valued at US$ 499.5 billion, recorded 30.3 per cent increase in 2011-12 over
US$ 383.5 billion in 2010-11. The growth in imports during 2011-12 was mainly due to
higher growth in imports of petroleum, oil and lubricants (POL), gold and silver and
machinery. Oil imports grew by about 47 per cent, while gold and silver registered a
growth of 49 per cent in 2011-12. Imports of oil and precious metal (gold and silver)
together accounted for nearly 45 per cent of total imports in 2011-12.
The Net Invisible Balances showed significant improvement, registering 40.7 per cent
increase to US$ 111.6 billion during 2011-12 from US$ 79.3 billion in 2010-11, due to
increase in invisibles receipts while invisible payments witnessed a decline. The invisible
receipts increased by 15.1 per cent to US$ 219.2 billion in 2011-12 as compared to US$
190.5 billion during 2010-11, mainly driven by services exports.
Beginning from a low level of US$ 5.8 billion at end-March 1991, India's Foreign
Exchange Reserves increased gradually to US$ 279.1 billion at end-March 2010. In
fiscal 2010-11, the reserves again showed an increasing trend, reaching US$ 304.8 billion
at end-March 2011. In fiscal 2011-12, they reached all-time high of US$ 322.0 billion at
end-August 2011. However, they declined thereafter and stood at US$ 294.4 billion at
end-March 2012. In 2012-13, the reserves increased marginally by US$ 0.4 billion from
US$ 294.4 billion at end-March 2012 to US$ 294.8 billion at end- September 2012.
On an annual average basis, Rupee Depreciated in fiscal 2011-12. The annual average
exchange rate of rupee was 45.56 per US dollar in 2010-11 that depreciated by 4.9 per
cent to 47.92 per US dollar in 2011-12. The sharp fall in value of rupee can be explained
by the supply-demand imbalance in the domestic foreign exchange market on account of
Indian Petrochemical Industry
2013 Asia Petrochemical Industry Conference
May 09-10 2013, Taipei, Taiwan
11
slowdown in FII inflows, strengthening of US dollar in the international market due to
the safe haven status of US Treasuries and heightened risk aversion and deleveraging due
to the euro area crisis that impacted financial markets across emerging market economies.
Apart from the global factors, there were several domestic factors that have added to the
weakening trend of the rupee, which include increasing current account deficit, high
inflation.
The room to increase exports in the short run is limited, as they are dependent upon the
recovery and growth of partner countries, especially in industrial economies. This may
take time. The main focus has to be on curbing imports, mainly by making oil prices
more market determined, and curbing imports of gold. At the same time, further measures
to ease the inflow of remittances and steps to diversify software exports could help
reduce financing needs. Greater emphasis on FDI including opening up sectors further
can help increase the quantum of safe financing.
Industrial Performance
The index of industrial production (IIP) with 2004-5 as base is the leading indicator for
industrial performance in the country. Overall industrial performance, as reflected by the
IIP continued to moderate from Q1 of 2011-12 with growth turning negative in Q1 of
2012-13, before improving to 2.1 per cent in Q3 of 2012-13. The moderation in industrial
growth, particularly in the manufacturing sector, is largely attributed to sluggish growth
of investment, squeezed margins of the corporate sector, deceleration in the rate of
growth of credit flows and the fragile global economic recovery.
India's industrial output expanded for the first time in three months in January 13, lifted
by higher consumer goods output, mainly non-durables. The data corroborates broad
expectations that the consumption demand is showing signs of bottoming out, though the
third consecutive monthly decline in capital goods production does not bode well for
investment sentiments.
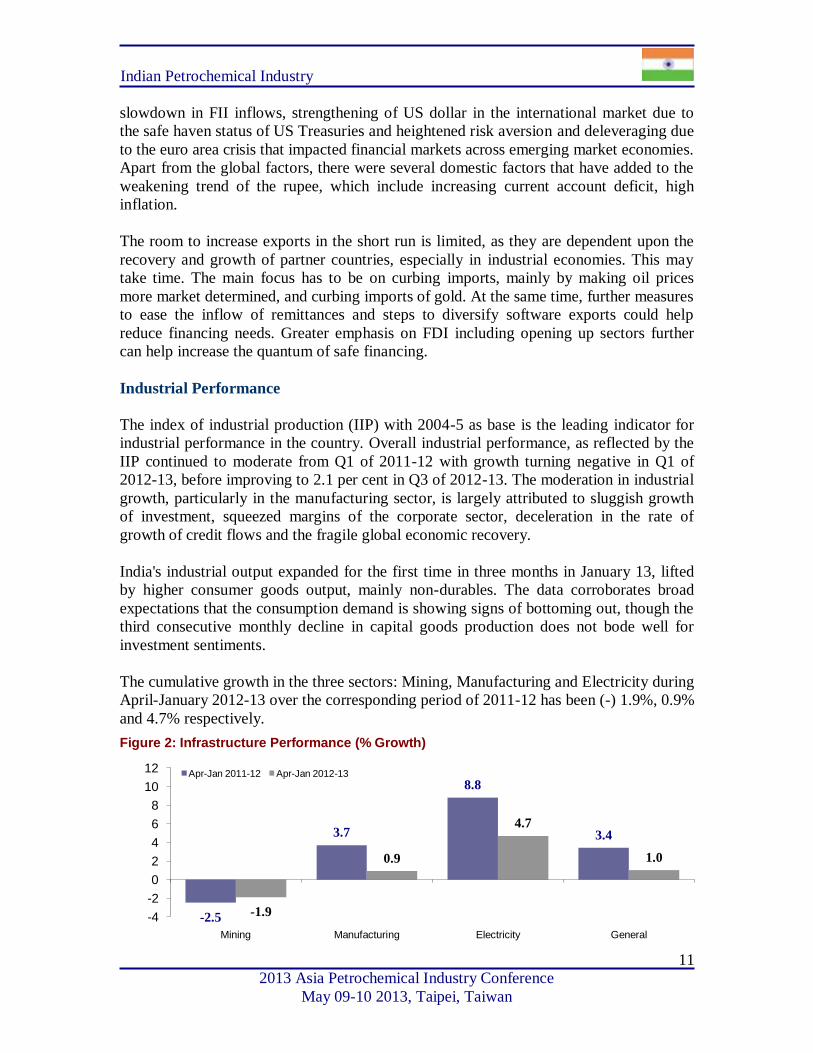
The cumulative growth in the three sectors: Mining, Manufacturing and Electricity during
April-January 2012-13 over the corresponding period of 2011-12 has been (-) 1.9%, 0.9%
and 4.7% respectively.
Figure 2: Infrastructure Performance (% Growth)
-2.5
3.7
8.8
3.4
-1.9
0.9
4.7
1.0
-4
-2
0
2
4
6
8
10
12
Mining Manufacturing Electricity General
Apr-Jan 2011-12 Apr-Jan 2012-13

Indian Petrochemical Industry
2013 Asia Petrochemical Industry Conference
May 09-10 2013, Taipei, Taiwan
12
Outlook for 2013: India
Indian economy was bogged down by the global slowdown in 2012 but is expected to
come back on growth path with the help of government policies and reforms. The
government is committed to fiscal consolidation. This along with demand compression
and augmented agricultural production should lead to lower inflation, giving the RBI the
requisite flexibility to reduce policy rates. Lower interest rates could provide an
additional fillip to investment activity for the industry and services sectors, especially if
some of the regulatory, bureaucratic, and financial impediments to investment are eased.
Given such a scenario, where all the three major sectors of the economy perform better in
2013- 14 as compared to 2012-13, the overall economy is expected to grow in the range
of 6.1 to 6.7 per cent in 2013-14.
The existence of well-developed and efficient financial markets is critical for achieving
real economic growth. The country now has a vibrant and transparent financial market in
terms of market efficiency, transparency, and price discovery process.
Economic growth though important cannot be an end in itself. The Twelfth Five Year
Plan, with its focus on 'Faster, More Inclusive and Sustainable Growth', puts the growth
debate in the right perspective. The government's targeted policies for the poor, with the
prospect of fewer leakages, can help better translate outlays into outcomes.
With the Twelfth Plan's focus on 'environmental sustainability', India is on the right track.
However, the challenge for India is to make the key drivers and enablers of growth – be it
Infrastructure, the transportation sector, housing, or sustainable agriculture – grow
sustainably. This leads us to the most vital issue of raising additional resources for
meeting the need for economic growth with greater environmental sustainability.
Table 3: India’s GDP Growth Projection – 2013 - 14
Agencies 2013-14
Economic Survey 2012-13 6.1% - 6.7%
IMF-WEO - Jan 2013 5.9%
World Bank 6.0%
United Nations 6.1%
Moody's – Mar 2013 6.2%
CRISIL – Jan 2013 6.7%
Credit Suisse – Feb 2013 6.7%
Indian Petrochemical Industry
2013 Asia Petrochemical Industry Conference
May 09-10 2013, Taipei, Taiwan
13
Section 2
Indian Petrochemical Industry
Indian Petrochemical Industry
2013 Asia Petrochemical Industry Conference
May 09-10 2013, Taipei, Taiwan
14
Petrochemical Industry in India
Petrochemicals play a vital role in the functioning of virtually all key sectors of economy
which includes agriculture, infrastructure, healthcare, textiles and consumer durables.
Polymers provide critical inputs which enable other sector to grow. Petrochemical
products cover the entire spectrum of daily use items ranging from clothing, housing,
construction, furniture, automobiles, household items, toys, agriculture, horticulture,
irrigation, and packaging to medical appliances.
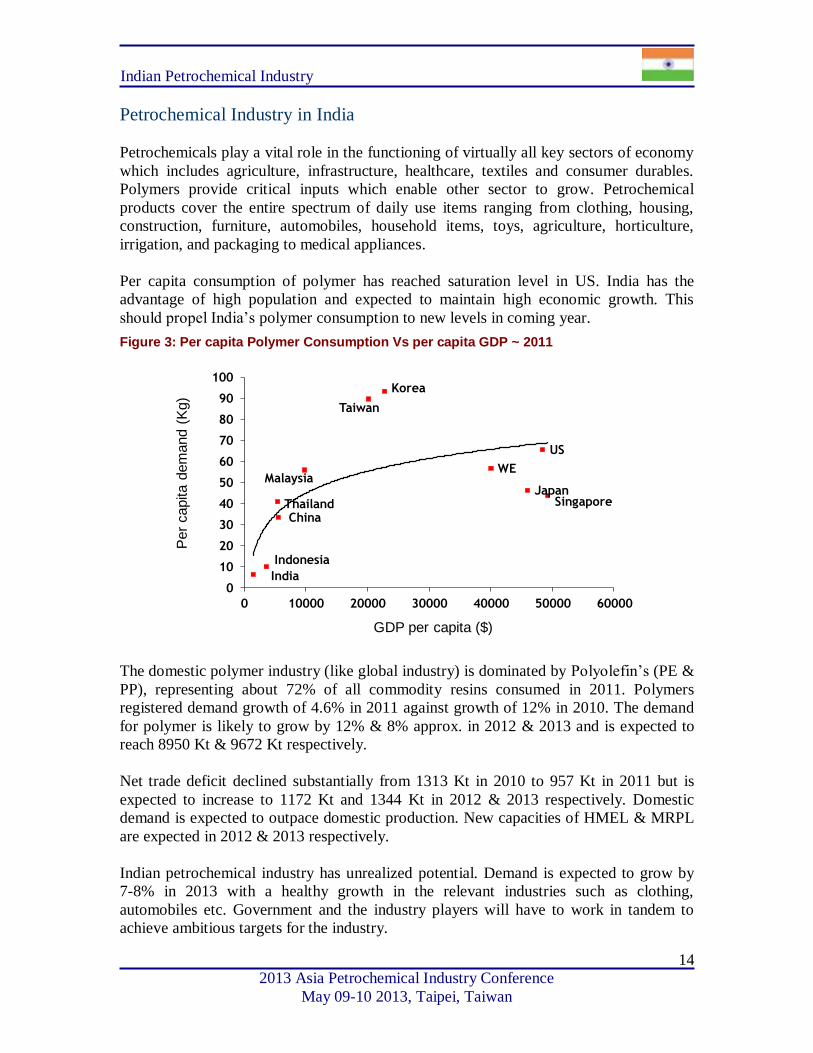
Per capita consumption of polymer has reached saturation level in US. India has the
advantage of high population and expected to maintain high economic growth. This
should propel India’s polymer consumption to new levels in coming year.
Figure 3: Per capita Polymer Consumption Vs per capita GDP ~ 2011
The domestic polymer industry (like global industry) is dominated by Polyolefin’s (PE &
PP), representing about 72% of all commodity resins consumed in 2011. Polymers
registered demand growth of 4.6% in 2011 against growth of 12% in 2010. The demand
for polymer is likely to grow by 12% & 8% approx. in 2012 & 2013 and is expected to
reach 8950 Kt & 9672 Kt respectively.
Net trade deficit declined substantially from 1313 Kt in 2010 to 957 Kt in 2011 but is
expected to increase to 1172 Kt and 1344 Kt in 2012 & 2013 respectively. Domestic
demand is expected to outpace domestic production. New capacities of HMEL & MRPL
are expected in 2012 & 2013 respectively.
Indian petrochemical industry has unrealized potential. Demand is expected to grow by
7-8% in 2013 with a healthy growth in the relevant industries such as clothing,
automobiles etc. Government and the industry players will have to work in tandem to
achieve ambitious targets for the industry.
Indonesia
India
ChinaThailand
Malaysia
Korea
Taiwan
SingaporeJapan
US
WE
0
10
20
30
40
50
60
70
80
90
100
0 10000 20000 30000 40000 50000 60000
Per
capita d
em
and (
Kg)
GDP per capita ($)
Indian Petrochemical Industry
2013 Asia Petrochemical Industry Conference
May 09-10 2013, Taipei, Taiwan
15
Petrochemical Industry Review of 2012 & Outlook for 2013
Polymers
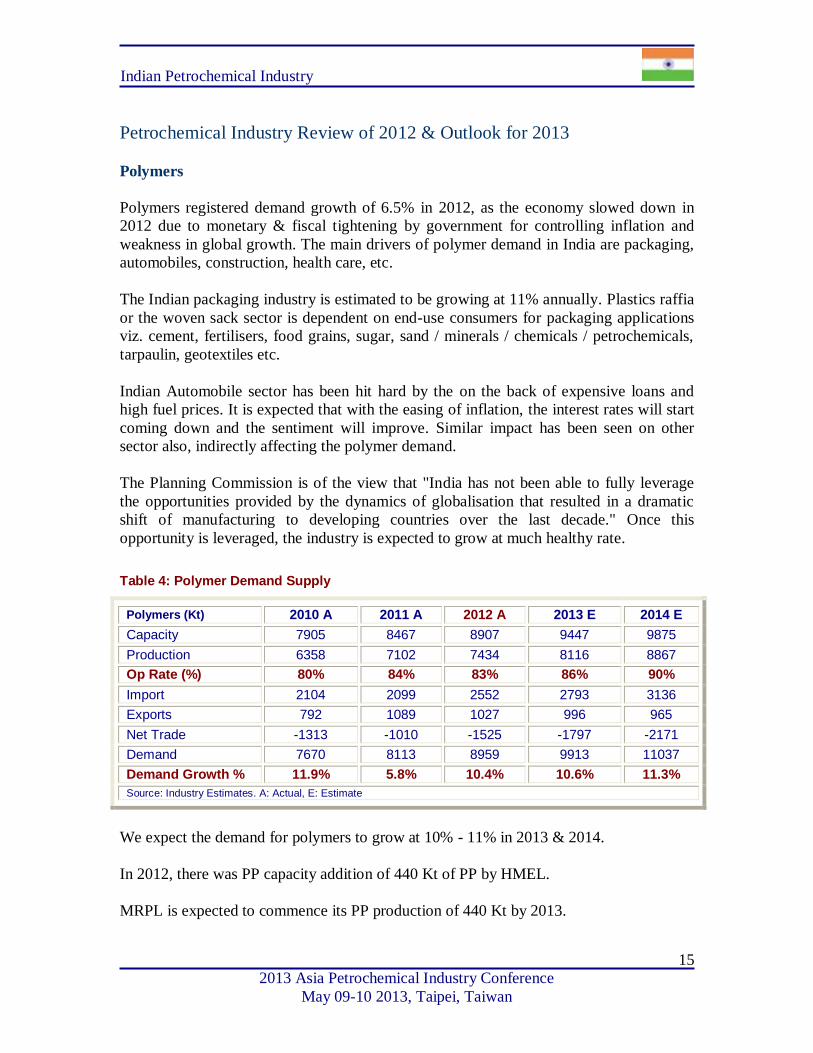
Polymers registered demand growth of 6.5% in 2012, as the economy slowed down in
2012 due to monetary & fiscal tightening by government for controlling inflation and
weakness in global growth. The main drivers of polymer demand in India are packaging,
automobiles, construction, health care, etc.
The Indian packaging industry is estimated to be growing at 11% annually. Plastics raffia
or the woven sack sector is dependent on end-use consumers for packaging applications
viz. cement, fertilisers, food grains, sugar, sand / minerals / chemicals / petrochemicals,
tarpaulin, geotextiles etc.
Indian Automobile sector has been hit hard by the on the back of expensive loans and
high fuel prices. It is expected that with the easing of inflation, the interest rates will start
coming down and the sentiment will improve. Similar impact has been seen on other
sector also, indirectly affecting the polymer demand.
The Planning Commission is of the view that "India has not been able to fully leverage
the opportunities provided by the dynamics of globalisation that resulted in a dramatic
shift of manufacturing to developing countries over the last decade." Once this
opportunity is leveraged, the industry is expected to grow at much healthy rate.
Table 4: Polymer Demand Supply
Polymers (Kt) 2010 A 2011 A 2012 A 2013 E 2014 E
Capacity 7905 8467 8907 9447 9875
Production 6358 7102 7434 8116 8867
Op Rate (%) 80% 84% 83% 86% 90%
Import 2104 2099 2552 2793 3136
Exports 792 1089 1027 996 965
Net Trade -1313 -1010 -1525 -1797 -2171
Demand 7670 8113 8959 9913 11037
Demand Growth % 11.9% 5.8% 10.4% 10.6% 11.3%
Source: Industry Estimates. A: Actual, E: Estimate
We expect the demand for polymers to grow at 10% - 11% in 2013 & 2014.
In 2012, there was PP capacity addition of 440 Kt of PP by HMEL.
MRPL is expected to commence its PP production of 440 Kt by 2013.
Indian Petrochemical Industry
2013 Asia Petrochemical Industry Conference
May 09-10 2013, Taipei, Taiwan
16
RIL, Chemplast & DCW is expected to debottleneck its PVC capacity to the tune of 100
Kt in 2013 and further by 100 Kt in 2014.
Operating rate is expected to increase from 83% in 2012 to 86% in 2013 and expected to
touch 90% remain in 2014.
Import dependency remained high at 28% in 2012 and is expected to remain at same
level for next two years. PP exports was around 837 Kt in 2012, PE and PVC imports
were very high. PE imports in 2012 were approx. 1323 Kt and PVC imports remained
high at 989 Kt in 2012.
In 2012 there was net trade deficit of 1525 Kt. Trade deficit is expected to be 1797 Kt in
2013 and 2171 Kt in 2014. Trade deficit is expected to increase from 2012 levels as
domestic demand is in excess of domestic production capacity especially for PVC and
PE.
Polyolefins
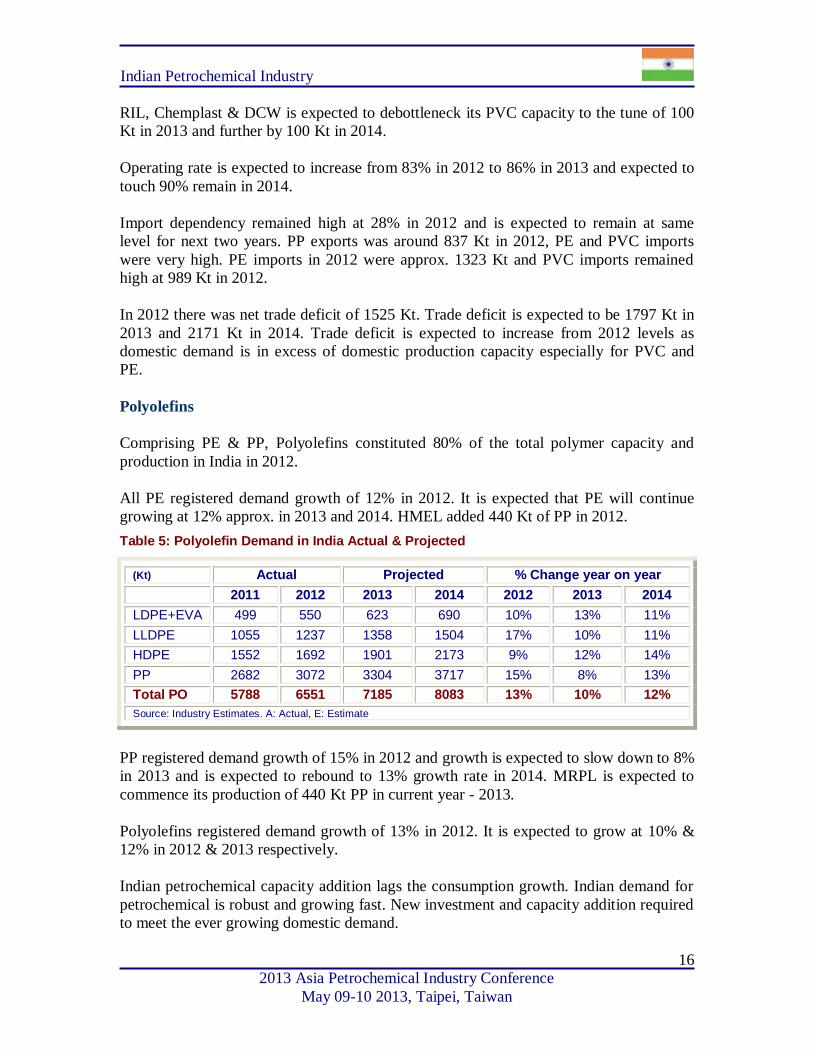
Comprising PE & PP, Polyolefins constituted 80% of the total polymer capacity and
production in India in 2012.
All PE registered demand growth of 12% in 2012. It is expected that PE will continue
growing at 12% approx. in 2013 and 2014. HMEL added 440 Kt of PP in 2012.
Table 5: Polyolefin Demand in India Actual & Projected
(Kt) Actual Projected % Change year on year
2011 2012 2013 2014 2012 2013 2014
LDPE+EVA 499 550 623 690 10% 13% 11%
LLDPE 1055 1237 1358 1504 17% 10% 11%
HDPE 1552 1692 1901 2173 9% 12% 14%
PP 2682 3072 3304 3717 15% 8% 13%
Total PO 5788 6551 7185 8083 13% 10% 12%
Source: Industry Estimates. A: Actual, E: Estimate
PP registered demand growth of 15% in 2012 and growth is expected to slow down to 8%
in 2013 and is expected to rebound to 13% growth rate in 2014. MRPL is expected to
commence its production of 440 Kt PP in current year - 2013.
Polyolefins registered demand growth of 13% in 2012. It is expected to grow at 10% &
12% in 2012 & 2013 respectively.
Indian petrochemical capacity addition lags the consumption growth. Indian demand for
petrochemical is robust and growing fast. New investment and capacity addition required
to meet the ever growing domestic demand.
Indian Petrochemical Industry
2013 Asia Petrochemical Industry Conference
May 09-10 2013, Taipei, Taiwan
17
Vinyl’s: PVC
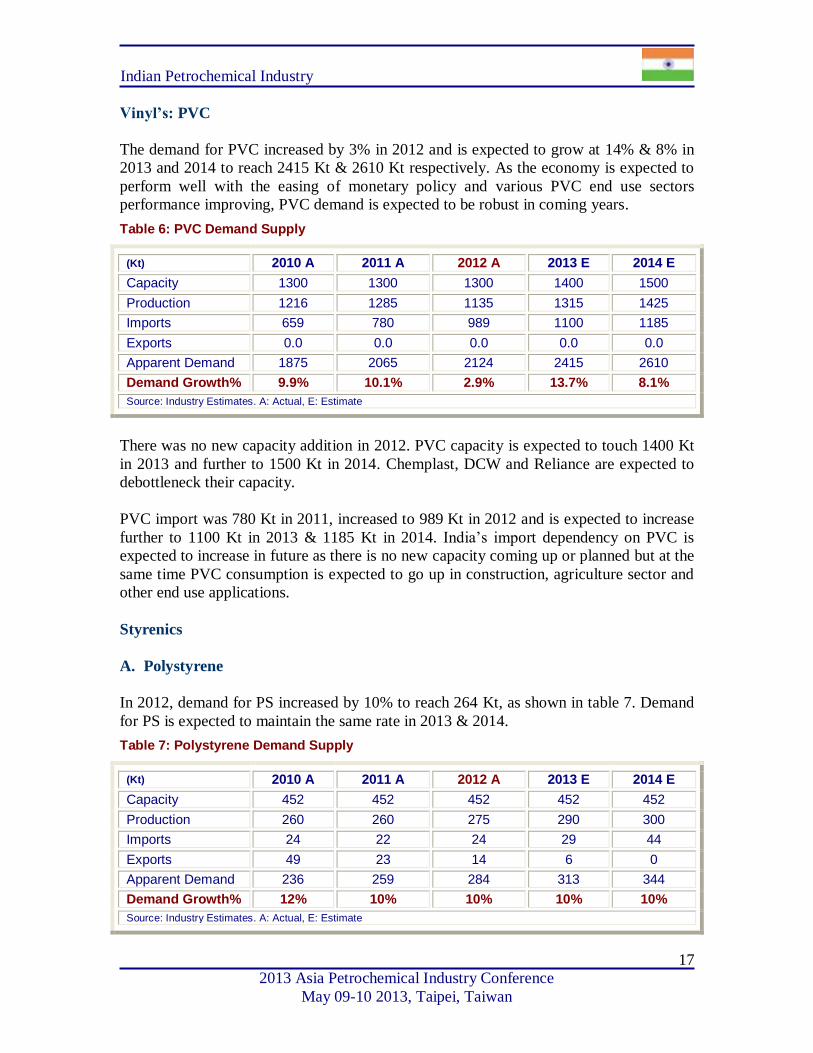
The demand for PVC increased by 3% in 2012 and is expected to grow at 14% & 8% in
2013 and 2014 to reach 2415 Kt & 2610 Kt respectively. As the economy is expected to
perform well with the easing of monetary policy and various PVC end use sectors
performance improving, PVC demand is expected to be robust in coming years.
Table 6: PVC Demand Supply
(Kt) 2010 A 2011 A 2012 A 2013 E 2014 E
Capacity 1300 1300 1300 1400 1500
Production 1216 1285 1135 1315 1425
Imports 659 780 989 1100 1185
Exports 0.0 0.0 0.0 0.0 0.0
Apparent Demand 1875 2065 2124 2415 2610
Demand Growth% 9.9% 10.1% 2.9% 13.7% 8.1%
Source: Industry Estimates. A: Actual, E: Estimate
There was no new capacity addition in 2012. PVC capacity is expected to touch 1400 Kt
in 2013 and further to 1500 Kt in 2014. Chemplast, DCW and Reliance are expected to
debottleneck their capacity.
PVC import was 780 Kt in 2011, increased to 989 Kt in 2012 and is expected to increase
further to 1100 Kt in 2013 & 1185 Kt in 2014. India’s import dependency on PVC is
expected to increase in future as there is no new capacity coming up or planned but at the
same time PVC consumption is expected to go up in construction, agriculture sector and
other end use applications.
Styrenics
A. Polystyrene
In 2012, demand for PS increased by 10% to reach 264 Kt, as shown in table 7. Demand
for PS is expected to maintain the same rate in 2013 & 2014.
Table 7: Polystyrene Demand Supply
(Kt) 2010 A 2011 A 2012 A 2013 E 2014 E
Capacity 452 452 452 452 452
Production 260 260 275 290 300
Imports 24 22 24 29 44
Exports 49 23 14 6 0
Apparent Demand 236 259 284 313 344
Demand Growth% 12% 10% 10% 10% 10%
Source: Industry Estimates. A: Actual, E: Estimate
Indian Petrochemical Industry
2013 Asia Petrochemical Industry Conference
May 09-10 2013, Taipei, Taiwan
18
B. Acrylonitrile-Butadiene-Styrene (ABS)
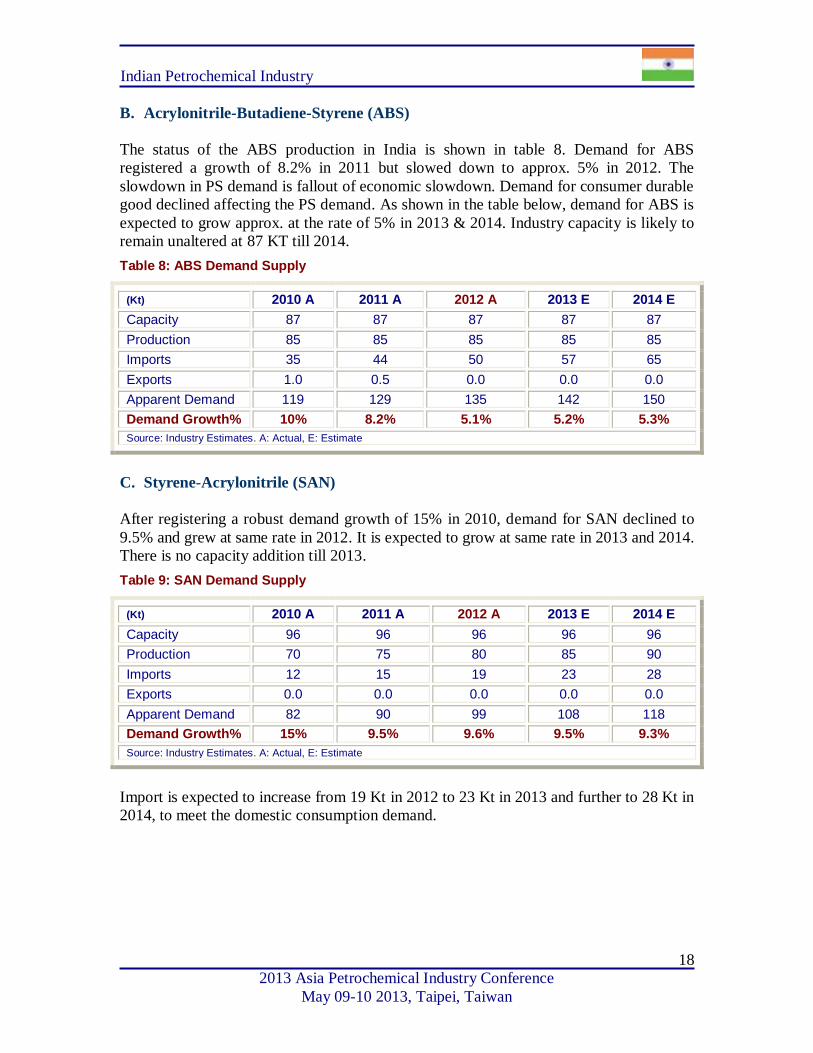
The status of the ABS production in India is shown in table 8. Demand for ABS
registered a growth of 8.2% in 2011 but slowed down to approx. 5% in 2012. The
slowdown in PS demand is fallout of economic slowdown. Demand for consumer durable
good declined affecting the PS demand. As shown in the table below, demand for ABS is
expected to grow approx. at the rate of 5% in 2013 & 2014. Industry capacity is likely to
remain unaltered at 87 KT till 2014.
Table 8: ABS Demand Supply
(Kt) 2010 A 2011 A 2012 A 2013 E 2014 E
Capacity 87 87 87 87 87
Production 85 85 85 85 85
Imports 35 44 50 57 65
Exports 1.0 0.5 0.0 0.0 0.0
Apparent Demand 119 129 135 142 150
Demand Growth% 10% 8.2% 5.1% 5.2% 5.3%
Source: Industry Estimates. A: Actual, E: Estimate
C. Styrene-Acrylonitrile (SAN)
After registering a robust demand growth of 15% in 2010, demand for SAN declined to
9.5% and grew at same rate in 2012. It is expected to grow at same rate in 2013 and 2014.
There is no capacity addition till 2013.
Table 9: SAN Demand Supply
(Kt) 2010 A 2011 A 2012 A 2013 E 2014 E
Capacity 96 96 96 96 96
Production 70 75 80 85 90
Imports 12 15 19 23 28
Exports 0.0 0.0 0.0 0.0 0.0
Apparent Demand 82 90 99 108 118
Demand Growth% 15% 9.5% 9.6% 9.5% 9.3%
Source: Industry Estimates. A: Actual, E: Estimate
Import is expected to increase from 19 Kt in 2012 to 23 Kt in 2013 and further to 28 Kt in
2014, to meet the domestic consumption demand.
Indian Petrochemical Industry
2013 Asia Petrochemical Industry Conference
May 09-10 2013, Taipei, Taiwan
19
Olefins (including Butadiene, Styrene, EDC & VCM)
A. Ethylene & Propylene
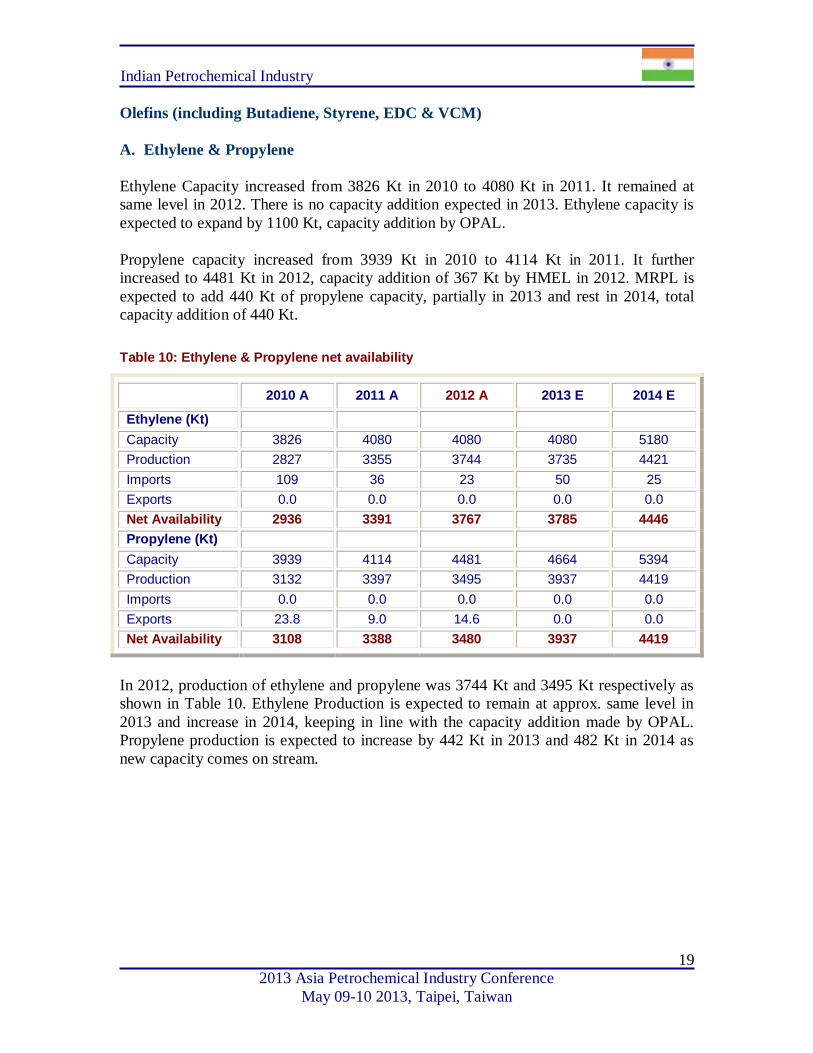
Ethylene Capacity increased from 3826 Kt in 2010 to 4080 Kt in 2011. It remained at
same level in 2012. There is no capacity addition expected in 2013. Ethylene capacity is
expected to expand by 1100 Kt, capacity addition by OPAL.
Propylene capacity increased from 3939 Kt in 2010 to 4114 Kt in 2011. It further
increased to 4481 Kt in 2012, capacity addition of 367 Kt by HMEL in 2012. MRPL is
expected to add 440 Kt of propylene capacity, partially in 2013 and rest in 2014, total
capacity addition of 440 Kt.
Table 10: Ethylene & Propylene net availability
2010 A 2011 A 2012 A 2013 E 2014 E
Ethylene (Kt)
Capacity 3826 4080 4080 4080 5180
Production 2827 3355 3744 3735 4421
Imports 109 36 23 50 25
Exports 0.0 0.0 0.0 0.0 0.0
Net Availability 2936 3391 3767 3785 4446
Propylene (Kt)
Capacity 3939 4114 4481 4664 5394
Production 3132 3397 3495 3937 4419
Imports 0.0 0.0 0.0 0.0 0.0
Exports 23.8 9.0 14.6 0.0 0.0
Net Availability 3108 3388 3480 3937 4419
In 2012, production of ethylene and propylene was 3744 Kt and 3495 Kt respectively as
shown in Table 10. Ethylene Production is expected to remain at approx. same level in
2013 and increase in 2014, keeping in line with the capacity addition made by OPAL.
Propylene production is expected to increase by 442 Kt in 2013 and 482 Kt in 2014 as
new capacity comes on stream.
Indian Petrochemical Industry
2013 Asia Petrochemical Industry Conference
May 09-10 2013, Taipei, Taiwan
20
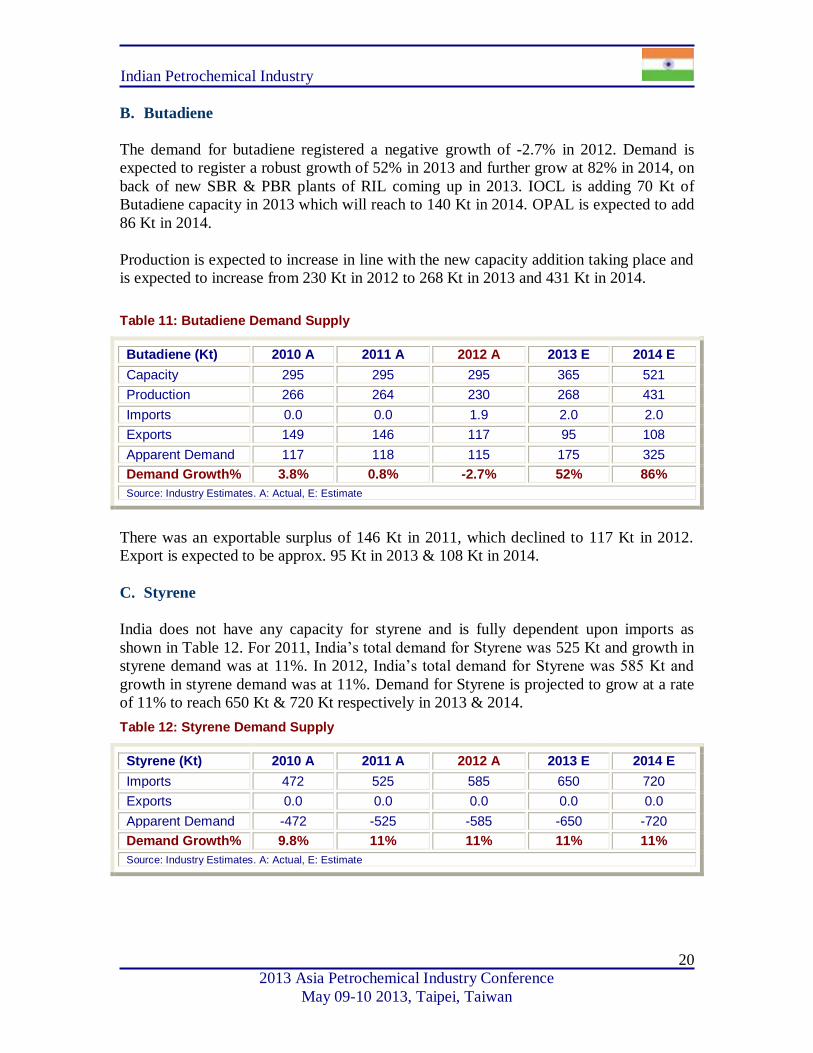
B. Butadiene
The demand for butadiene registered a negative growth of -2.7% in 2012. Demand is
expected to register a robust growth of 52% in 2013 and further grow at 82% in 2014, on
back of new SBR & PBR plants of RIL coming up in 2013. IOCL is adding 70 Kt of
Butadiene capacity in 2013 which will reach to 140 Kt in 2014. OPAL is expected to add
86 Kt in 2014.
Production is expected to increase in line with the new capacity addition taking place and
is expected to increase from 230 Kt in 2012 to 268 Kt in 2013 and 431 Kt in 2014.
Table 11: Butadiene Demand Supply
Butadiene (Kt) 2010 A 2011 A 2012 A 2013 E 2014 E
Capacity 295 295 295 365 521
Production 266 264 230 268 431
Imports 0.0 0.0 1.9 2.0 2.0
Exports 149 146 117 95 108
Apparent Demand 117 118 115 175 325
Demand Growth% 3.8% 0.8% -2.7% 52% 86%
Source: Industry Estimates. A: Actual, E: Estimate
There was an exportable surplus of 146 Kt in 2011, which declined to 117 Kt in 2012.
Export is expected to be approx. 95 Kt in 2013 & 108 Kt in 2014.
C. Styrene
India does not have any capacity for styrene and is fully dependent upon imports as
shown in Table 12. For 2011, India’s total demand for Styrene was 525 Kt and growth in
styrene demand was at 11%. In 2012, India’s total demand for Styrene was 585 Kt and
growth in styrene demand was at 11%. Demand for Styrene is projected to grow at a rate
of 11% to reach 650 Kt & 720 Kt respectively in 2013 & 2014.
Table 12: Styrene Demand Supply
Styrene (Kt) 2010 A 2011 A 2012 A 2013 E 2014 E
Imports 472 525 585 650 720
Exports 0.0 0.0 0.0 0.0 0.0
Apparent Demand -472 -525 -585 -650 -720
Demand Growth% 9.8% 11% 11% 11% 11%
Source: Industry Estimates. A: Actual, E: Estimate

Indian Petrochemical Industry
2013 Asia Petrochemical Industry Conference
May 09-10 2013, Taipei, Taiwan
21
D. EDC & VCM
Almost the entire production of EDC and VCM in India are consumed captively by the
polymer manufacturers for production of PVC and hence, PVC manufacturers who do
not have facilities for captive production of EDC and VCM have to rely entirely on
imports to meet their demand for PVC building blocks viz. EDC and VCM.
Table 13: EDC & VCM Import into India
EDC (Kt) 2010 A 2011 A 2012 A 2013 E 2014 E
Capacity 365 365 365 365 365
Production 365 365 365 365 365
Imports 239 263 290 365 400
Exports 0.0 0.0 0.0 0.0 0.0
Apparent Demand 604 628 655 730 765
Growth (%) 3.7% 4.0% 4.4% 11.5% 4.8%
VCM (Kt) 2010 A 2011 A 2012 A 2013 E 2014 E
Capacity 856 856 856 961 961
Production 840 870 870 966 966
Imports 375 385 395 450 500
Exports 0.0 0.0 0.0 0.0 0.0
Apparent Demand 1215 1255 1265 1416 1466
Growth (%) 27.9% 3.3% 0.8% 11.9% 3.5%
Source: Industry Estimates. A: Actual, E: Estimate
EDC & VCM registered nominal growth of 4.4% & 0.8% in 2012, in line with the PVC
growth of 3% in 2012. EDC & VCM is expected to register demand growth of approx.
12% in 2013 and then further decline to approx. 4% - 5% in 2014.
For the year 2012, while imports of EDC increased to 290 Kt, VCM imports increased to
395 Kt, as shown in Table 13. EDC imports expected to increase to 365 Kt & 400 Kt in
2012 & 2013 respectively. VCM imports expected to reach 500 Kt by 2013.
Fibre Intermediates
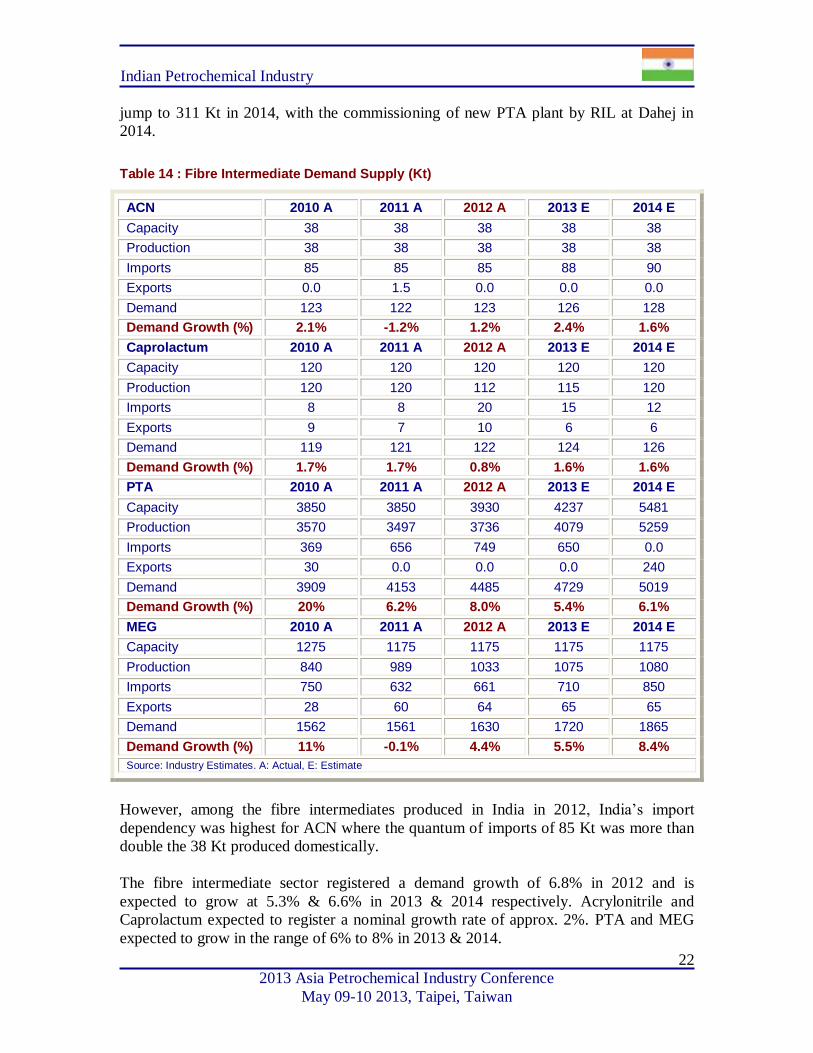
In 2012, the combined production of fibre intermediates viz. ACN, Caprolactum, PTA
and MEG reached 4919 Kt of which PTA and MEG constituted 76% and 21%
respectively with ACN and Caprolactum together accounting for the remaining 4% as
shown in Table 14.
PTA and MEG constituted 49% and 53% of the total 1515 Kt fibre intermediates
imported in to India in 2012. Fibre intermediates exported from India in 2012was 74 Kt
and is expected to remain approx. same in 2013. Fibre intermediate export is expected to
Indian Petrochemical Industry
2013 Asia Petrochemical Industry Conference
May 09-10 2013, Taipei, Taiwan
22
jump to 311 Kt in 2014, with the commissioning of new PTA plant by RIL at Dahej in
2014.
Table 14 : Fibre Intermediate Demand Supply (Kt)
ACN 2010 A 2011 A 2012 A 2013 E 2014 E
Capacity 38 38 38 38 38
Production 38 38 38 38 38
Imports 85 85 85 88 90
Exports 0.0 1.5 0.0 0.0 0.0
Demand 123 122 123 126 128
Demand Growth (%) 2.1% -1.2% 1.2% 2.4% 1.6%
Caprolactum 2010 A 2011 A 2012 A 2013 E 2014 E
Capacity 120 120 120 120 120
Production 120 120 112 115 120
Imports 8 8 20 15 12
Exports 9 7 10 6 6
Demand 119 121 122 124 126
Demand Growth (%) 1.7% 1.7% 0.8% 1.6% 1.6%
PTA 2010 A 2011 A 2012 A 2013 E 2014 E
Capacity 3850 3850 3930 4237 5481
Production 3570 3497 3736 4079 5259
Imports 369 656 749 650 0.0
Exports 30 0.0 0.0 0.0 240
Demand 3909 4153 4485 4729 5019
Demand Growth (%) 20% 6.2% 8.0% 5.4% 6.1%
MEG 2010 A 2011 A 2012 A 2013 E 2014 E
Capacity 1275 1175 1175 1175 1175
Production 840 989 1033 1075 1080
Imports 750 632 661 710 850
Exports 28 60 64 65 65
Demand 1562 1561 1630 1720 1865
Demand Growth (%) 11% -0.1% 4.4% 5.5% 8.4%
Source: Industry Estimates. A: Actual, E: Estimate
However, among the fibre intermediates produced in India in 2012, India’s import
dependency was highest for ACN where the quantum of imports of 85 Kt was more than
double the 38 Kt produced domestically.
The fibre intermediate sector registered a demand growth of 6.8% in 2012 and is
expected to grow at 5.3% & 6.6% in 2013 & 2014 respectively. Acrylonitrile and
Caprolactum expected to register a nominal growth rate of approx. 2%. PTA and MEG
expected to grow in the range of 6% to 8% in 2013 & 2014.
Indian Petrochemical Industry
2013 Asia Petrochemical Industry Conference
May 09-10 2013, Taipei, Taiwan
23
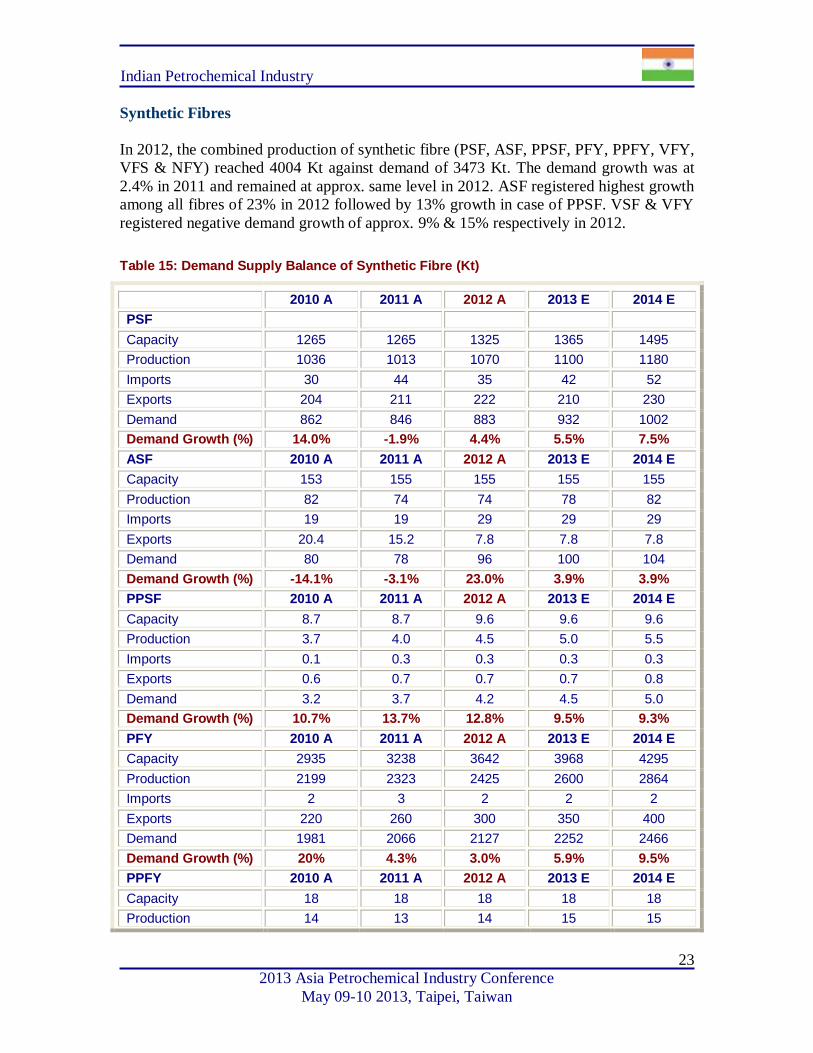
Synthetic Fibres
In 2012, the combined production of synthetic fibre (PSF, ASF, PPSF, PFY, PPFY, VFY,
VFS & NFY) reached 4004 Kt against demand of 3473 Kt. The demand growth was at
2.4% in 2011 and remained at approx. same level in 2012. ASF registered highest growth
among all fibres of 23% in 2012 followed by 13% growth in case of PPSF. VSF & VFY
registered negative demand growth of approx. 9% & 15% respectively in 2012.
Table 15: Demand Supply Balance of Synthetic Fibre (Kt)
2010 A 2011 A 2012 A 2013 E 2014 E
PSF
Capacity 1265 1265 1325 1365 1495
Production 1036 1013 1070 1100 1180
Imports 30 44 35 42 52
Exports 204 211 222 210 230
Demand 862 846 883 932 1002
Demand Growth (%) 14.0% -1.9% 4.4% 5.5% 7.5%
ASF 2010 A 2011 A 2012 A 2013 E 2014 E
Capacity 153 155 155 155 155
Production 82 74 74 78 82
Imports 19 19 29 29 29
Exports 20.4 15.2 7.8 7.8 7.8
Demand 80 78 96 100 104
Demand Growth (%) -14.1% -3.1% 23.0% 3.9% 3.9%
PPSF 2010 A 2011 A 2012 A 2013 E 2014 E
Capacity 8.7 8.7 9.6 9.6 9.6
Production 3.7 4.0 4.5 5.0 5.5
Imports 0.1 0.3 0.3 0.3 0.3
Exports 0.6 0.7 0.7 0.7 0.8
Demand 3.2 3.7 4.2 4.5 5.0
Demand Growth (%) 10.7% 13.7% 12.8% 9.5% 9.3%
PFY 2010 A 2011 A 2012 A 2013 E 2014 E
Capacity 2935 3238 3642 3968 4295
Production 2199 2323 2425 2600 2864
Imports 2 3 2 2 2
Exports 220 260 300 350 400
Demand 1981 2066 2127 2252 2466
Demand Growth (%) 20% 4.3% 3.0% 5.9% 9.5%
PPFY 2010 A 2011 A 2012 A 2013 E 2014 E
Capacity 18 18 18 18 18
Production 14 13 14 15 15
Indian Petrochemical Industry
2013 Asia Petrochemical Industry Conference
May 09-10 2013, Taipei, Taiwan
24
2010 A 2011 A 2012 A 2013 E 2014 E
Imports 1.4 1.5 1.7 1.7 1.7
Exports 1.1 1.2 2.3 2.3 2.3
Demand 14 14 13 14 15
Demand Growth (%) -11% -2.2% -2.0% 5.2% 5.2%
VSF 2010 A 2011 A 2012 A 2013 E 2014 E
Capacity 419 419 419 419 419
Production 304 321 331 341 351
Imports 14 22 14 14 14
Exports 57 70 96 96 96
Demand 261 273 249 259 269
Demand Growth (%) 4.4% 4.6% -8.8% 4.0% 4.0%
VFY 2010 A 2011 A 2012 A 2013 E 2014 E
Capacity 80 76 76 76 76
Production 41 42 43 43 43
Imports 13 12.3 5.1 5.1 5.1
Exports 5.4 6.2 6.5 6.5 6.5
Demand 49 49 41 41 41
Demand Growth (%) 2.1% -0.6% -15.3% 0.3% 0.3%
NFY 2010 A 2011 A 2012 A 2013 E 2014 E
Capacity 54 63 63 71 71
Production 45 41 42 46 51
Imports 15.0 20.0 20.0 18.0 15.0
Exports 2.0 2.0 2.0 3.0 3.0
Demand 58 59 60 61 63
Demand Growth (%) 3.6% 1.7% 1.7% 1.7% 3.3%
Source: Industry Estimates. A: Actual, E: Estimate
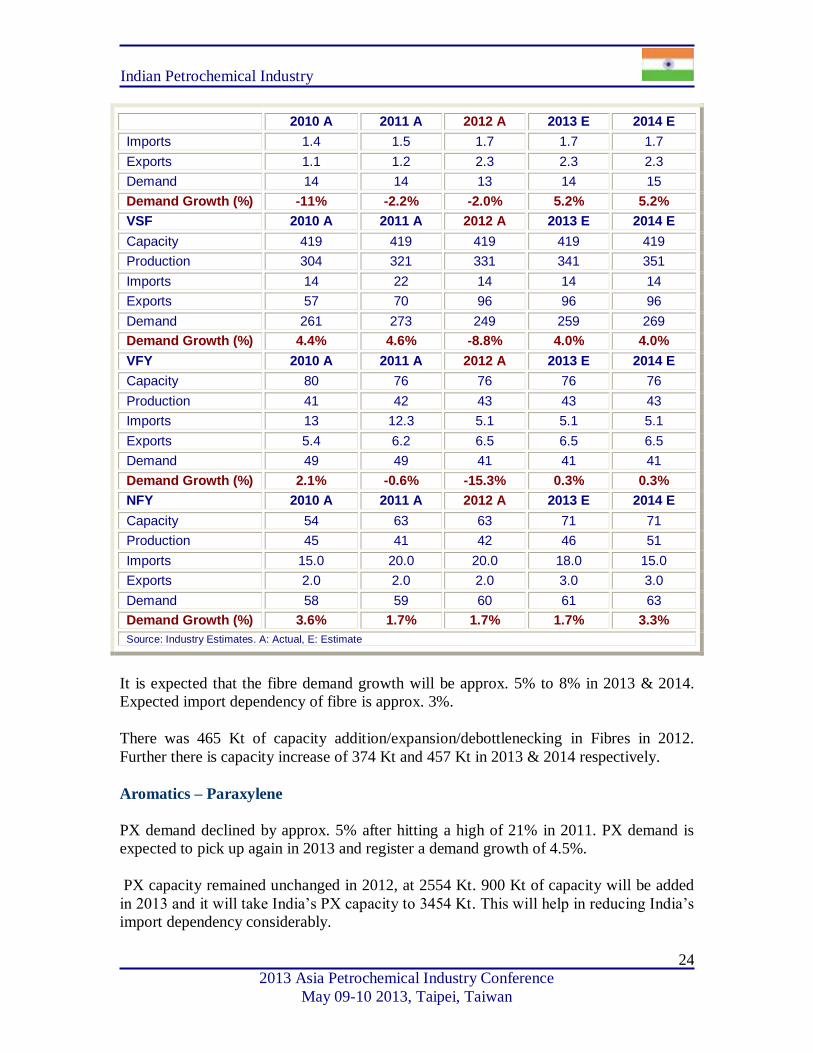
It is expected that the fibre demand growth will be approx. 5% to 8% in 2013 & 2014.
Expected import dependency of fibre is approx. 3%.
There was 465 Kt of capacity addition/expansion/debottlenecking in Fibres in 2012.
Further there is capacity increase of 374 Kt and 457 Kt in 2013 & 2014 respectively.
Aromatics – Paraxylene
PX demand declined by approx. 5% after hitting a high of 21% in 2011. PX demand is
expected to pick up again in 2013 and register a demand growth of 4.5%.
PX capacity remained unchanged in 2012, at 2554 Kt. 900 Kt of capacity will be added
in 2013 and it will take India’s PX capacity to 3454 Kt. This will help in reducing India’s
import dependency considerably.
Indian Petrochemical Industry
2013 Asia Petrochemical Industry Conference
May 09-10 2013, Taipei, Taiwan
25
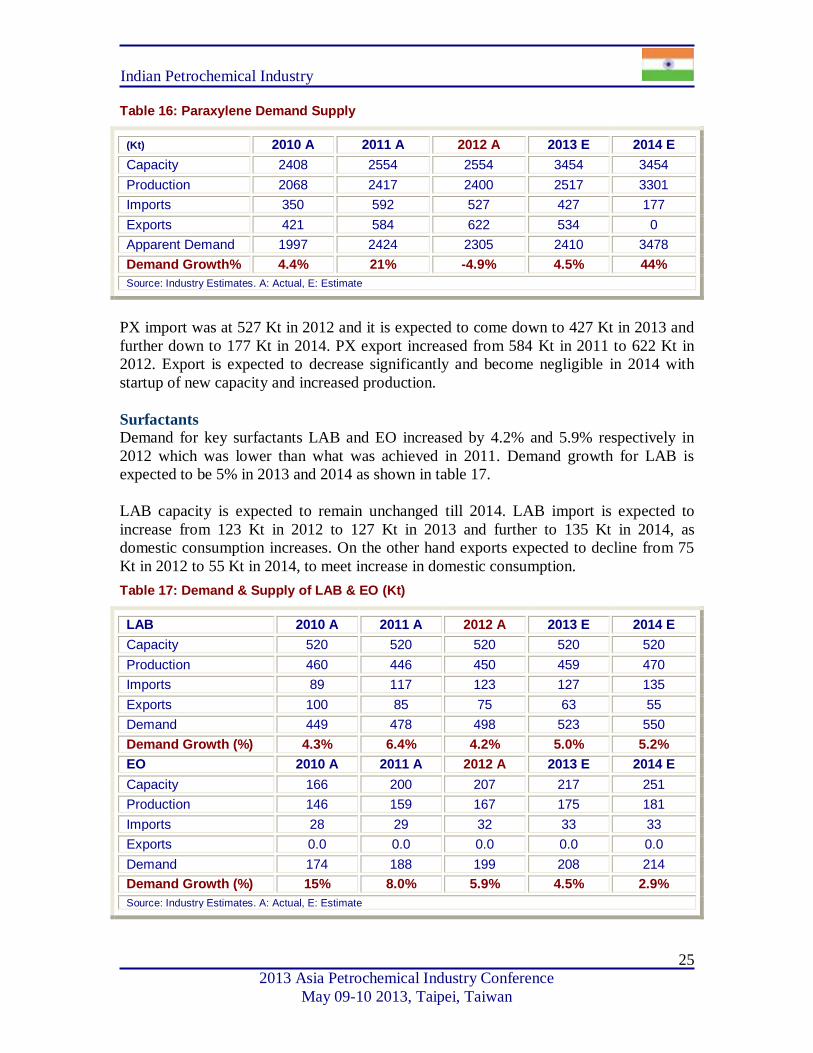
Table 16: Paraxylene Demand Supply
(Kt) 2010 A 2011 A 2012 A 2013 E 2014 E
Capacity 2408 2554 2554 3454 3454
Production 2068 2417 2400 2517 3301
Imports 350 592 527 427 177
Exports 421 584 622 534 0
Apparent Demand 1997 2424 2305 2410 3478
Demand Growth% 4.4% 21% -4.9% 4.5% 44%
Source: Industry Estimates. A: Actual, E: Estimate
PX import was at 527 Kt in 2012 and it is expected to come down to 427 Kt in 2013 and
further down to 177 Kt in 2014. PX export increased from 584 Kt in 2011 to 622 Kt in
2012. Export is expected to decrease significantly and become negligible in 2014 with
startup of new capacity and increased production.
Surfactants
Demand for key surfactants LAB and EO increased by 4.2% and 5.9% respectively in
2012 which was lower than what was achieved in 2011. Demand growth for LAB is
expected to be 5% in 2013 and 2014 as shown in table 17.
LAB capacity is expected to remain unchanged till 2014. LAB import is expected to
increase from 123 Kt in 2012 to 127 Kt in 2013 and further to 135 Kt in 2014, as
domestic consumption increases. On the other hand exports expected to decline from 75
Kt in 2012 to 55 Kt in 2014, to meet increase in domestic consumption.
Table 17: Demand & Supply of LAB & EO (Kt)
LAB 2010 A 2011 A 2012 A 2013 E 2014 E
Capacity 520 520 520 520 520
Production 460 446 450 459 470
Imports 89 117 123 127 135
Exports 100 85 75 63 55
Demand 449 478 498 523 550
Demand Growth (%) 4.3% 6.4% 4.2% 5.0% 5.2%
EO 2010 A 2011 A 2012 A 2013 E 2014 E
Capacity 166 200 207 217 251
Production 146 159 167 175 181
Imports 28 29 32 33 33
Exports 0.0 0.0 0.0 0.0 0.0
Demand 174 188 199 208 214
Demand Growth (%) 15% 8.0% 5.9% 4.5% 2.9%
Source: Industry Estimates. A: Actual, E: Estimate

Indian Petrochemical Industry
2013 Asia Petrochemical Industry Conference
May 09-10 2013, Taipei, Taiwan
26
EO capacity increased form 200 Kt in 2011 to 207 Kt in 2012 and further to 217 Kt in
2013. Debottlenecking of EO capacity by RIL in 2012 happened and further
debottlenecking expected in 2013 and 2014.
Demand growth for EO is expected to be at 4.5% & 2.9% in 2013 and 2014.
Synthetic Rubber
In 2012, synthetic rubber demand grew at 12% and is expected to grow at 6% - 7% in
2013 and 2014.
Table 18: Demand Supply Balance of PBR, SBR, NBR & EPDM (Kt)
PBR 2010 A 2011 A 2012 A 2013 E 2014 E
Capacity 74 74 74 114 114
Production 77 78 78 83 118
Imports 58 81 89 93 73
Exports 0.6 0.6 0.1 0.3 4.8
Demand 134 158 167 176 186
Demand Growth (%) 9.5% 18% 5.4% 5.3% 6.0%
SBR 2010 A 2011 A 2012 A 2013 E 2014 E
Capacity 20 20 20 280 280
Production 18 18 18 77 300
Imports 152 170 204 175 69
Exports 0 0 0 18 120
Demand 170 188 222 234 249
Demand Growth (%) 15% 11% 18% 5.6% 6.2%
NBR 2010 A 2011 A 2012 A 2013 E 2014 E
Capacity 20 20 20 20 20
Production 17 17 17 17 17
Imports 11 14 16 18 21
Exports 0 0 0 0 0
Demand 28 31 33 35 38
Demand Growth (%) 12% 11% 6.5% 6.1% 8.6%
EPDM 2010 A 2011 A 2012 A 2013 E 2014 E
Capacity 10 10 10 10 10
Production 0 0 0 0 0
Imports 25 29 33 36 40
Exports 0 0 0 0 0
Demand 25 29 33 36 40
Demand Growth (%) 42% 19% 14% 8.1% 11%
Source: Industry Estimates. A: Actual, E: Estimate
Indian Petrochemical Industry
2013 Asia Petrochemical Industry Conference
May 09-10 2013, Taipei, Taiwan
27
As shown in Table 18 above, SBR demand registered a robust growth of 18% in 2012,
followed by EPDM demand growth of 14%. PBR/NBR/SBR demand is expected to grow
at 6% in 2013 and 2014. EPDM demand is expected to grow at 8.1% and 11%
respectively in 2013 and 2014.
Public sector petroleum refining company Indian Oil Corporation (IOC) plans to set up a
120 Kt styrene butadiene rubber (SBR) manufacturing facility at Panipat in partnership
with Taiwan's TSRC Corporation and Japan's Marubeni Corporation in 2013. Reliance is
expected to add PBR capacity of 40 Kt and SBR capacity of 150 Kt in 2013.
This will help in meeting domestic consumption which was earlier dependent on imports,
thus bringing down imports considerably from 204 Kt in 2012 to 69 Kt in 2014.
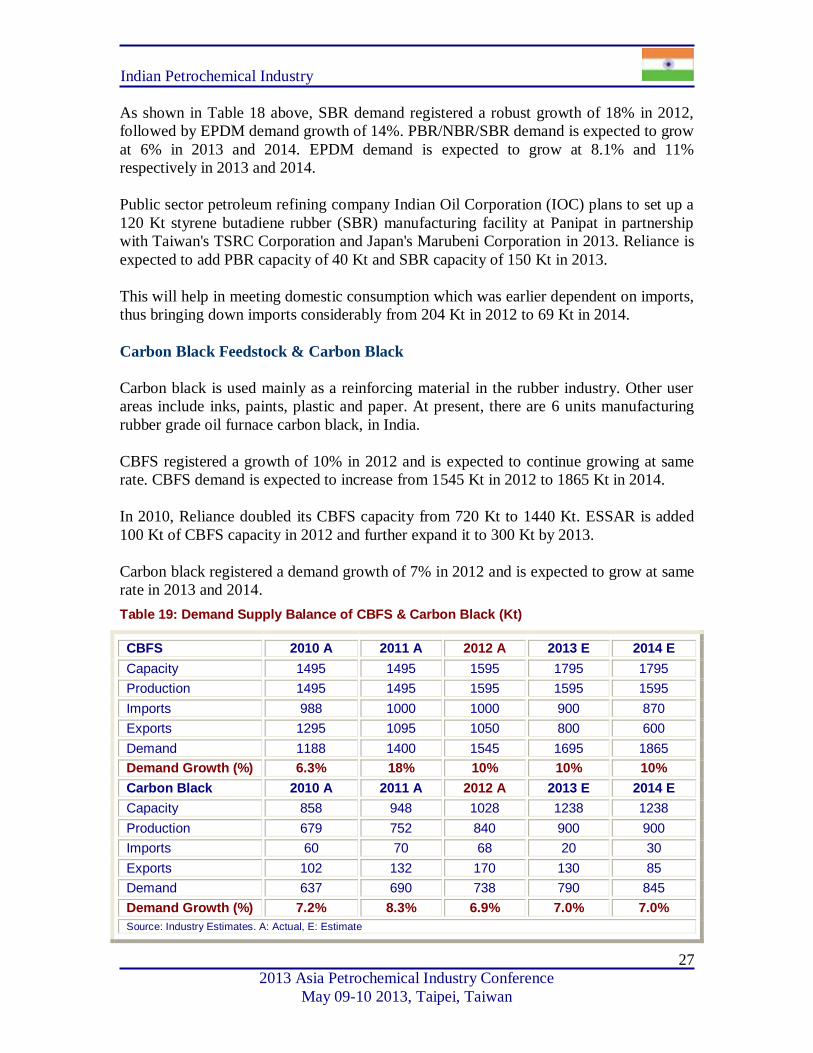
Carbon Black Feedstock & Carbon Black
Carbon black is used mainly as a reinforcing material in the rubber industry. Other user
areas include inks, paints, plastic and paper. At present, there are 6 units manufacturing
rubber grade oil furnace carbon black, in India.
CBFS registered a growth of 10% in 2012 and is expected to continue growing at same
rate. CBFS demand is expected to increase from 1545 Kt in 2012 to 1865 Kt in 2014.
In 2010, Reliance doubled its CBFS capacity from 720 Kt to 1440 Kt. ESSAR is added
100 Kt of CBFS capacity in 2012 and further expand it to 300 Kt by 2013.
Carbon black registered a demand growth of 7% in 2012 and is expected to grow at same
rate in 2013 and 2014.
Table 19: Demand Supply Balance of CBFS & Carbon Black (Kt)
CBFS 2010 A 2011 A 2012 A 2013 E 2014 E
Capacity 1495 1495 1595 1795 1795
Production 1495 1495 1595 1595 1595
Imports 988 1000 1000 900 870
Exports 1295 1095 1050 800 600
Demand 1188 1400 1545 1695 1865
Demand Growth (%) 6.3% 18% 10% 10% 10%
Carbon Black 2010 A 2011 A 2012 A 2013 E 2014 E
Capacity 858 948 1028 1238 1238
Production 679 752 840 900 900
Imports 60 70 68 20 30
Exports 102 132 170 130 85
Demand 637 690 738 790 845
Demand Growth (%) 7.2% 8.3% 6.9% 7.0% 7.0%
Source: Industry Estimates. A: Actual, E: Estimate
Indian Petrochemical Industry
2013 Asia Petrochemical Industry Conference
May 09-10 2013, Taipei, Taiwan
28
Phillips Carbon Black Ltd is expected to expand its capacity by 80 Kt in 2013. Himadri
Chemicals & Industries Limited acquired SNF plant at Vapi, commissioned production of
Carbon Black (50 Kt) in 2009 and further added 40 Kt capacity in 2010. It is expected to
further add 50 Kt capacity in 2013. Continental is expected to add 80 Kt capacity in 2012
& 2013, thus taking its total capacity from 65 Kt in 2011 to 225 Kt in 2013.
In line with the increase in capacity, domestic production of Carbon Black is expected to
increase from 840 Kt in 2012 to 900 Kt in 2013.
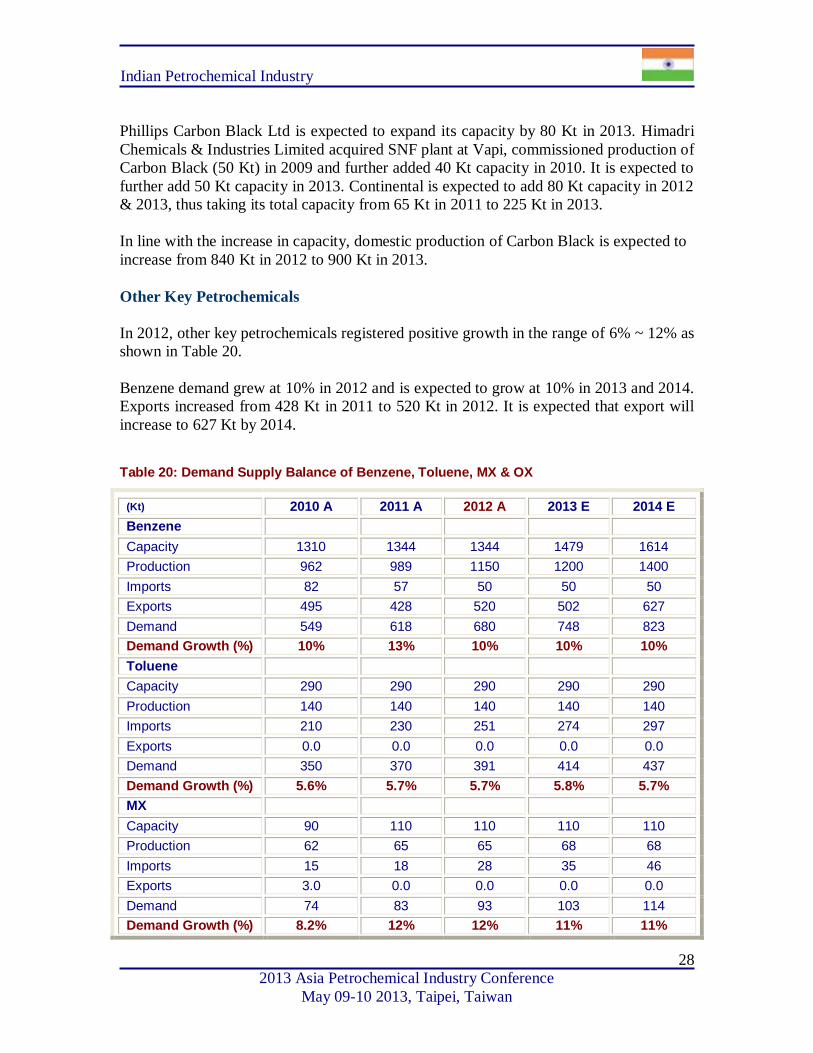
Other Key Petrochemicals
In 2012, other key petrochemicals registered positive growth in the range of 6% ~ 12% as
shown in Table 20.
Benzene demand grew at 10% in 2012 and is expected to grow at 10% in 2013 and 2014.
Exports increased from 428 Kt in 2011 to 520 Kt in 2012. It is expected that export will
increase to 627 Kt by 2014.
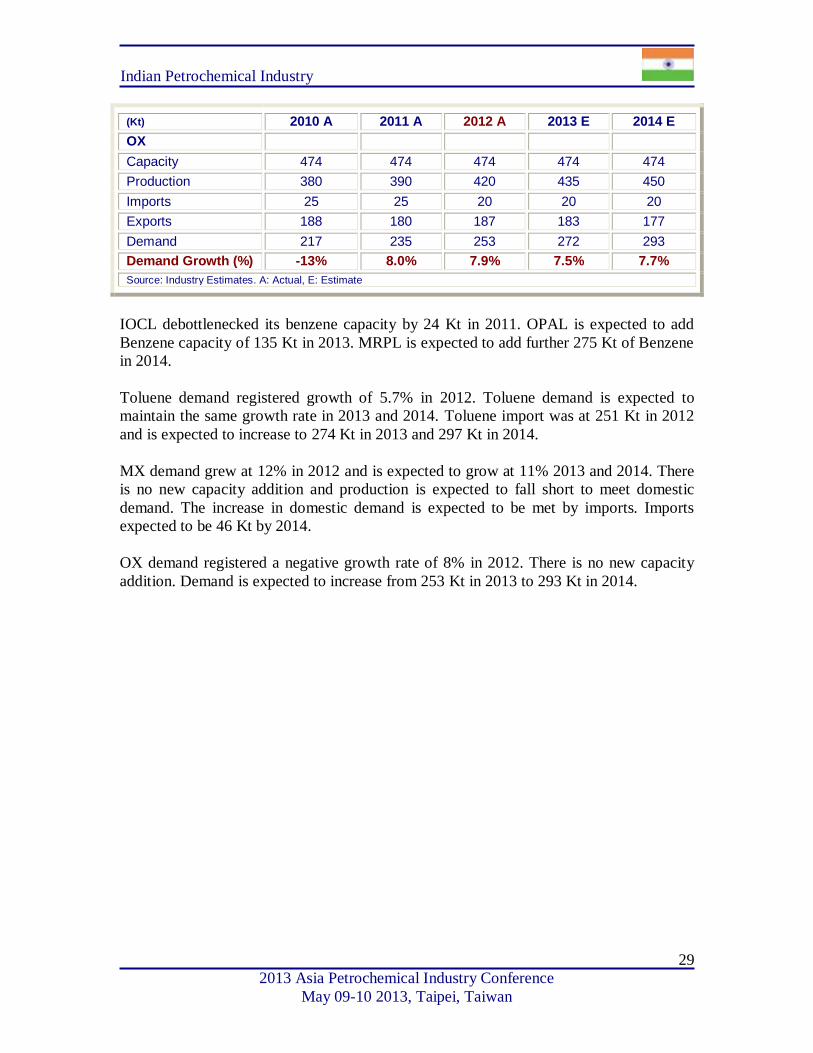
Table 20: Demand Supply Balance of Benzene, Toluene, MX & OX
(Kt) 2010 A 2011 A 2012 A 2013 E 2014 E
Benzene
Capacity 1310 1344 1344 1479 1614
Production 962 989 1150 1200 1400
Imports 82 57 50 50 50
Exports 495 428 520 502 627
Demand 549 618 680 748 823
Demand Growth (%) 10% 13% 10% 10% 10%
Toluene
Capacity 290 290 290 290 290
Production 140 140 140 140 140
Imports 210 230 251 274 297
Exports 0.0 0.0 0.0 0.0 0.0
Demand 350 370 391 414 437
Demand Growth (%) 5.6% 5.7% 5.7% 5.8% 5.7%
MX
Capacity 90 110 110 110 110
Production 62 65 65 68 68
Imports 15 18 28 35 46
Exports 3.0 0.0 0.0 0.0 0.0
Demand 74 83 93 103 114
Demand Growth (%) 8.2% 12% 12% 11% 11%
Indian Petrochemical Industry
2013 Asia Petrochemical Industry Conference
May 09-10 2013, Taipei, Taiwan
29
(Kt) 2010 A 2011 A 2012 A 2013 E 2014 E
OX
Capacity 474 474 474 474 474
Production 380 390 420 435 450
Imports 25 25 20 20 20
Exports 188 180 187 183 177
Demand 217 235 253 272 293
Demand Growth (%) -13% 8.0% 7.9% 7.5% 7.7%
Source: Industry Estimates. A: Actual, E: Estimate
IOCL debottlenecked its benzene capacity by 24 Kt in 2011. OPAL is expected to add
Benzene capacity of 135 Kt in 2013. MRPL is expected to add further 275 Kt of Benzene
in 2014.
Toluene demand registered growth of 5.7% in 2012. Toluene demand is expected to
maintain the same growth rate in 2013 and 2014. Toluene import was at 251 Kt in 2012
and is expected to increase to 274 Kt in 2013 and 297 Kt in 2014.
MX demand grew at 12% in 2012 and is expected to grow at 11% 2013 and 2014. There
is no new capacity addition and production is expected to fall short to meet domestic
demand. The increase in domestic demand is expected to be met by imports. Imports
expected to be 46 Kt by 2014.
OX demand registered a negative growth rate of 8% in 2012. There is no new capacity
addition. Demand is expected to increase from 253 Kt in 2013 to 293 Kt in 2014.
Indian Petrochemical Industry
2013 Asia Petrochemical Industry Conference
May 09-10 2013, Taipei, Taiwan
30
Outlook for the Overall Indian Petrochemical Industry
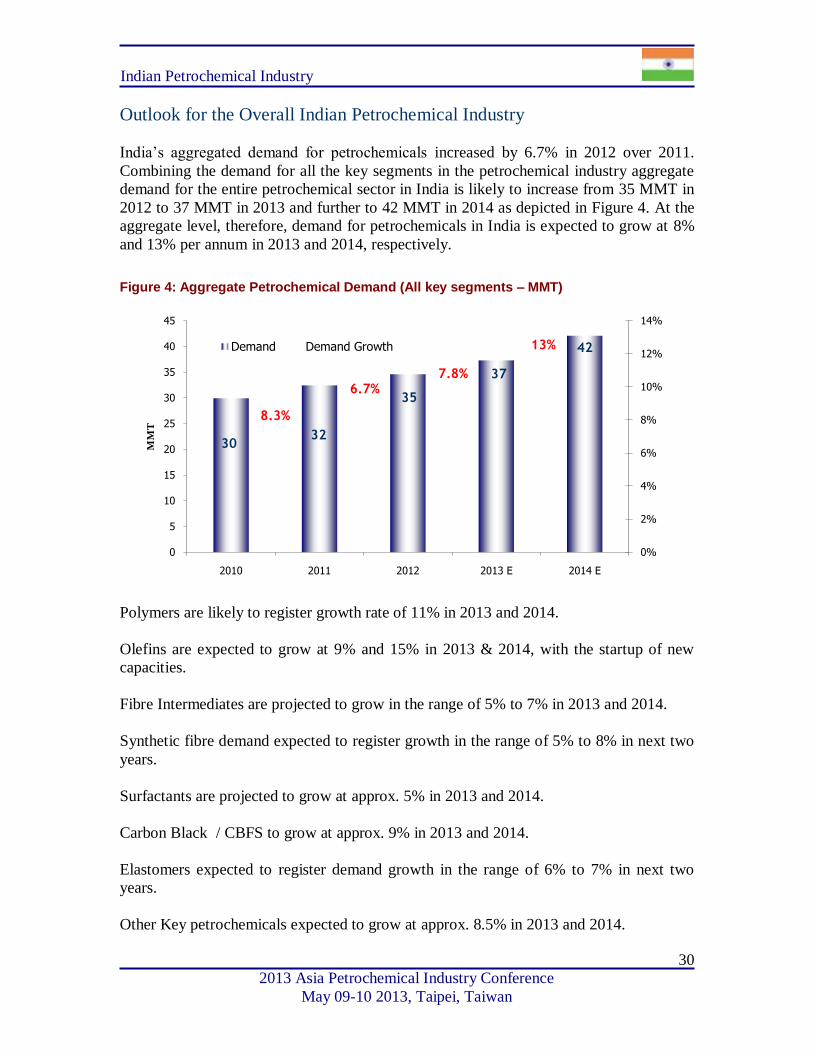
India’s aggregated demand for petrochemicals increased by 6.7% in 2012 over 2011.
Combining the demand for all the key segments in the petrochemical industry aggregate
demand for the entire petrochemical sector in India is likely to increase from 35 MMT in
2012 to 37 MMT in 2013 and further to 42 MMT in 2014 as depicted in Figure 4. At the
aggregate level, therefore, demand for petrochemicals in India is expected to grow at 8%
and 13% per annum in 2013 and 2014, respectively.
Figure 4: Aggregate Petrochemical Demand (All key segments – MMT)
Polymers are likely to register growth rate of 11% in 2013 and 2014.
Olefins are expected to grow at 9% and 15% in 2013 & 2014, with the startup of new
capacities.
Fibre Intermediates are projected to grow in the range of 5% to 7% in 2013 and 2014.
Synthetic fibre demand expected to register growth in the range of 5% to 8% in next two
years.
Surfactants are projected to grow at approx. 5% in 2013 and 2014.
Carbon Black / CBFS to grow at approx. 9% in 2013 and 2014.
Elastomers expected to register demand growth in the range of 6% to 7% in next two
years.
Other Key petrochemicals expected to grow at approx. 8.5% in 2013 and 2014.
3032
35
37
42
8.3%
6.7%7.8%
13%
0%
2%
4%
6%
8%
10%
12%
14%
0
5
10
15
20
25
30
35
40
45
2010 2011 2012 2013 E 2014 E
MM
T
Demand Demand Growth
Indian Petrochemical Industry
2013 Asia Petrochemical Industry Conference
May 09-10 2013, Taipei, Taiwan
31
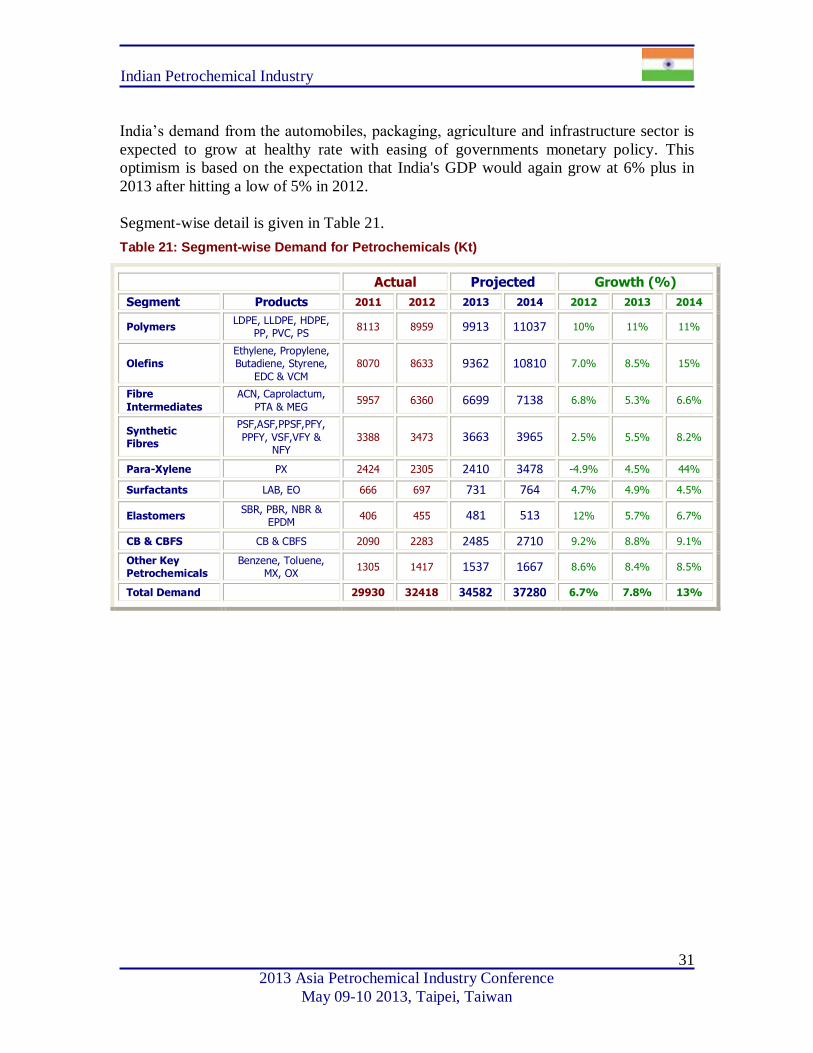
India’s demand from the automobiles, packaging, agriculture and infrastructure sector is
expected to grow at healthy rate with easing of governments monetary policy. This
optimism is based on the expectation that India's GDP would again grow at 6% plus in
2013 after hitting a low of 5% in 2012.
Segment-wise detail is given in Table 21.
Table 21: Segment-wise Demand for Petrochemicals (Kt)
Actual Projected Growth (%)
Segment Products 2011 2012 2013 2014 2012 2013 2014
Polymers LDPE, LLDPE, HDPE,
PP, PVC, PS 8113 8959 9913 11037 10% 11% 11%
Olefins Ethylene, Propylene, Butadiene, Styrene,
EDC & VCM
8070 8633 9362 10810 7.0% 8.5% 15%
Fibre
Intermediates
ACN, Caprolactum,
PTA & MEG 5957 6360 6699 7138 6.8% 5.3% 6.6%
Synthetic Fibres
PSF,ASF,PPSF,PFY,
PPFY, VSF,VFY & NFY
3388 3473 3663 3965 2.5% 5.5% 8.2%
Para-Xylene PX 2424 2305 2410 3478 -4.9% 4.5% 44%
Surfactants LAB, EO 666 697 731 764 4.7% 4.9% 4.5%
Elastomers SBR, PBR, NBR &
EPDM 406 455 481 513 12% 5.7% 6.7%
CB & CBFS CB & CBFS 2090 2283 2485 2710 9.2% 8.8% 9.1%
Other Key Petrochemicals
Benzene, Toluene, MX, OX
1305 1417 1537 1667 8.6% 8.4% 8.5%
Total Demand 29930 32418 34582 37280 6.7% 7.8% 13%

Indian Petrochemical Industry
2013 Asia Petrochemical Industry Conference
May 09-10 2013, Taipei, Taiwan
32
Section 3
Statistical Appendix
Indian Petrochemical Industry
2013 Asia Petrochemical Industry Conference
May 09-10 2013, Taipei, Taiwan
33
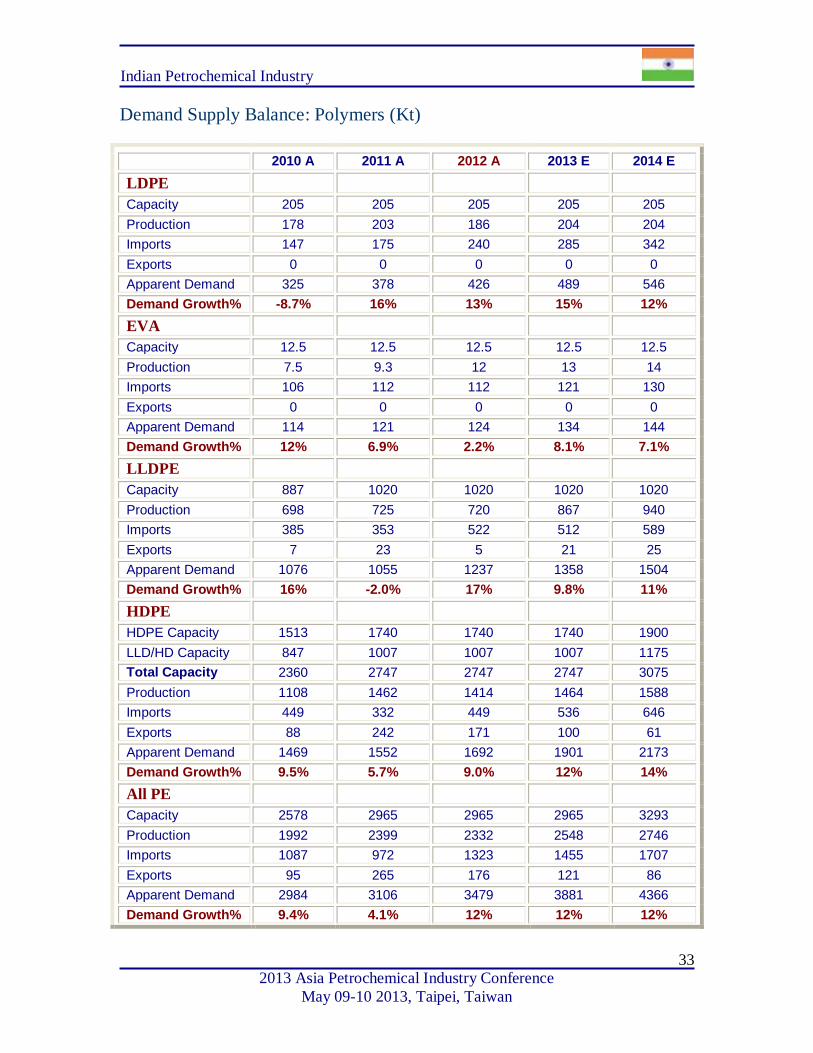
Demand Supply Balance: Polymers (Kt)
2010 A 2011 A 2012 A 2013 E 2014 E
LDPE
Capacity 205 205 205 205 205
Production 178 203 186 204 204
Imports 147 175 240 285 342
Exports 0 0 0 0 0
Apparent Demand 325 378 426 489 546
Demand Growth% -8.7% 16% 13% 15% 12%
EVA
Capacity 12.5 12.5 12.5 12.5 12.5
Production 7.5 9.3 12 13 14
Imports 106 112 112 121 130
Exports 0 0 0 0 0
Apparent Demand 114 121 124 134 144
Demand Growth% 12% 6.9% 2.2% 8.1% 7.1%
LLDPE
Capacity 887 1020 1020 1020 1020
Production 698 725 720 867 940
Imports 385 353 522 512 589
Exports 7 23 5 21 25
Apparent Demand 1076 1055 1237 1358 1504
Demand Growth% 16% -2.0% 17% 9.8% 11%
HDPE
HDPE Capacity 1513 1740 1740 1740 1900
LLD/HD Capacity 847 1007 1007 1007 1175
Total Capacity 2360 2747 2747 2747 3075
Production 1108 1462 1414 1464 1588
Imports 449 332 449 536 646
Exports 88 242 171 100 61
Apparent Demand 1469 1552 1692 1901 2173
Demand Growth% 9.5% 5.7% 9.0% 12% 14%
All PE
Capacity 2578 2965 2965 2965 3293
Production 1992 2399 2332 2548 2746
Imports 1087 972 1323 1455 1707
Exports 95 265 176 121 86
Apparent Demand 2984 3106 3479 3881 4366
Demand Growth% 9.4% 4.1% 12% 12% 12%
Indian Petrochemical Industry
2013 Asia Petrochemical Industry Conference
May 09-10 2013, Taipei, Taiwan
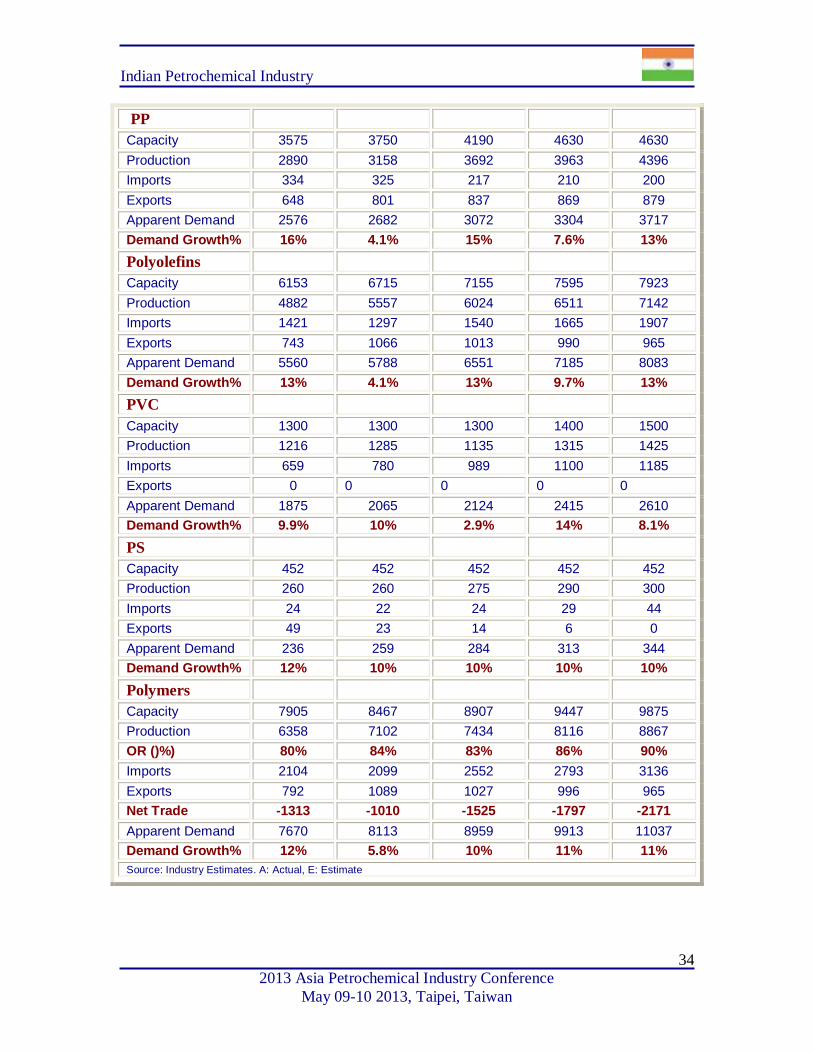
34
PP
Capacity 3575 3750 4190 4630 4630
Production 2890 3158 3692 3963 4396
Imports 334 325 217 210 200
Exports 648 801 837 869 879
Apparent Demand 2576 2682 3072 3304 3717
Demand Growth% 16% 4.1% 15% 7.6% 13%
Polyolefins
Capacity 6153 6715 7155 7595 7923
Production 4882 5557 6024 6511 7142
Imports 1421 1297 1540 1665 1907
Exports 743 1066 1013 990 965
Apparent Demand 5560 5788 6551 7185 8083
Demand Growth% 13% 4.1% 13% 9.7% 13%
PVC
Capacity 1300 1300 1300 1400 1500
Production 1216 1285 1135 1315 1425
Imports 659 780 989 1100 1185
Exports 0 0 0 0 0
Apparent Demand 1875 2065 2124 2415 2610
Demand Growth% 9.9% 10% 2.9% 14% 8.1%
PS
Capacity 452 452 452 452 452
Production 260 260 275 290 300
Imports 24 22 24 29 44
Exports 49 23 14 6 0
Apparent Demand 236 259 284 313 344
Demand Growth% 12% 10% 10% 10% 10%
Polymers
Capacity 7905 8467 8907 9447 9875
Production 6358 7102 7434 8116 8867
OR ()%) 80% 84% 83% 86% 90%
Imports 2104 2099 2552 2793 3136
Exports 792 1089 1027 996 965
Net Trade -1313 -1010 -1525 -1797 -2171
Apparent Demand 7670 8113 8959 9913 11037
Demand Growth% 12% 5.8% 10% 11% 11%
Source: Industry Estimates. A: Actual, E: Estimate
Indian Petrochemical Industry
2013 Asia Petrochemical Industry Conference
May 09-10 2013, Taipei, Taiwan
35
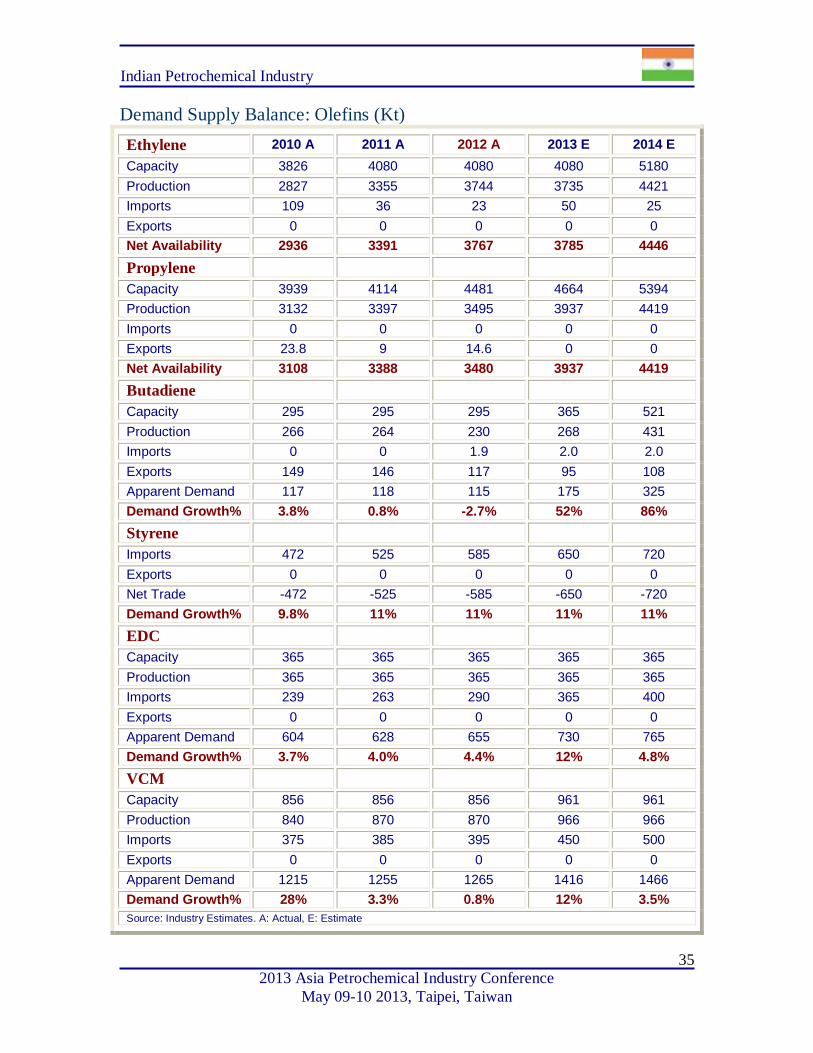
Demand Supply Balance: Olefins (Kt)
Ethylene 2010 A 2011 A 2012 A 2013 E 2014 E
Capacity 3826 4080 4080 4080 5180
Production 2827 3355 3744 3735 4421
Imports 109 36 23 50 25
Exports 0 0 0 0 0
Net Availability 2936 3391 3767 3785 4446
Propylene
Capacity 3939 4114 4481 4664 5394
Production 3132 3397 3495 3937 4419
Imports 0 0 0 0 0
Exports 23.8 9 14.6 0 0
Net Availability 3108 3388 3480 3937 4419
Butadiene
Capacity 295 295 295 365 521
Production 266 264 230 268 431
Imports 0 0 1.9 2.0 2.0
Exports 149 146 117 95 108
Apparent Demand 117 118 115 175 325
Demand Growth% 3.8% 0.8% -2.7% 52% 86%
Styrene
Imports 472 525 585 650 720
Exports 0 0 0 0 0
Net Trade -472 -525 -585 -650 -720
Demand Growth% 9.8% 11% 11% 11% 11%
EDC
Capacity 365 365 365 365 365
Production 365 365 365 365 365
Imports 239 263 290 365 400
Exports 0 0 0 0 0
Apparent Demand 604 628 655 730 765
Demand Growth% 3.7% 4.0% 4.4% 12% 4.8%
VCM
Capacity 856 856 856 961 961
Production 840 870 870 966 966
Imports 375 385 395 450 500
Exports 0 0 0 0 0
Apparent Demand 1215 1255 1265 1416 1466
Demand Growth% 28% 3.3% 0.8% 12% 3.5%
Source: Industry Estimates. A: Actual, E: Estimate

Indian Petrochemical Industry
2013 Asia Petrochemical Industry Conference
May 09-10 2013, Taipei, Taiwan
36
Demand Supply Balance: ABS, SAN, PX & Surfactants (Kt)
2010 A 2011 A 2012 A 2013 E 2014 E
ABS
Capacity 87 87 87 87 87
Production 85 85 85 85 85
Imports 35 44 50 57 65
Exports 1.0 0.5 0 0 0
Apparent Demand 119 129 135 142 150
Demand Growth% 10% 8.2% 5.1% 5.2% 5.3%
SAN
Capacity 96 96 96 96 96
Production 70 75 80 85 90
Imports 12 15 19 23 28
Exports 0 0 0 0 0
Apparent Demand 82 90 99 108 118
Demand Growth% 15% 9.5% 9.6% 9.5% 9.3%
PX
Capacity 2408 2554 2554 3454 3454
Production 2068 2417 2400 2517 3301
Imports 350 592 527 427 177
Exports 421 584 622 534 0
Apparent Demand 1997 2424 2305 2410 3478
Demand Growth% 4.4% 21% -4.9% 4.5% 44%
LAB
Capacity 520 520 520 520 520
Production 460 446 450 459 470
Imports 89 117 123 127 135
Exports 100 85 75 63 55
Apparent Demand 449 478 498 523 550
Demand Growth% 4.3% 6.4% 4.2% 5.0% 5.2%
EO
Capacity 166 200 207 217 251
Production 146 159 167 175 181
Imports 28 29 32 33 33
Exports 0 0 0 0 0
Apparent Demand 174 188 199 208 214
Demand Growth% 15% 8.0% 5.9% 4.5% 2.9%
Source: Industry Estimates. A: Actual, E: Estimate
Indian Petrochemical Industry
2013 Asia Petrochemical Industry Conference
May 09-10 2013, Taipei, Taiwan
37
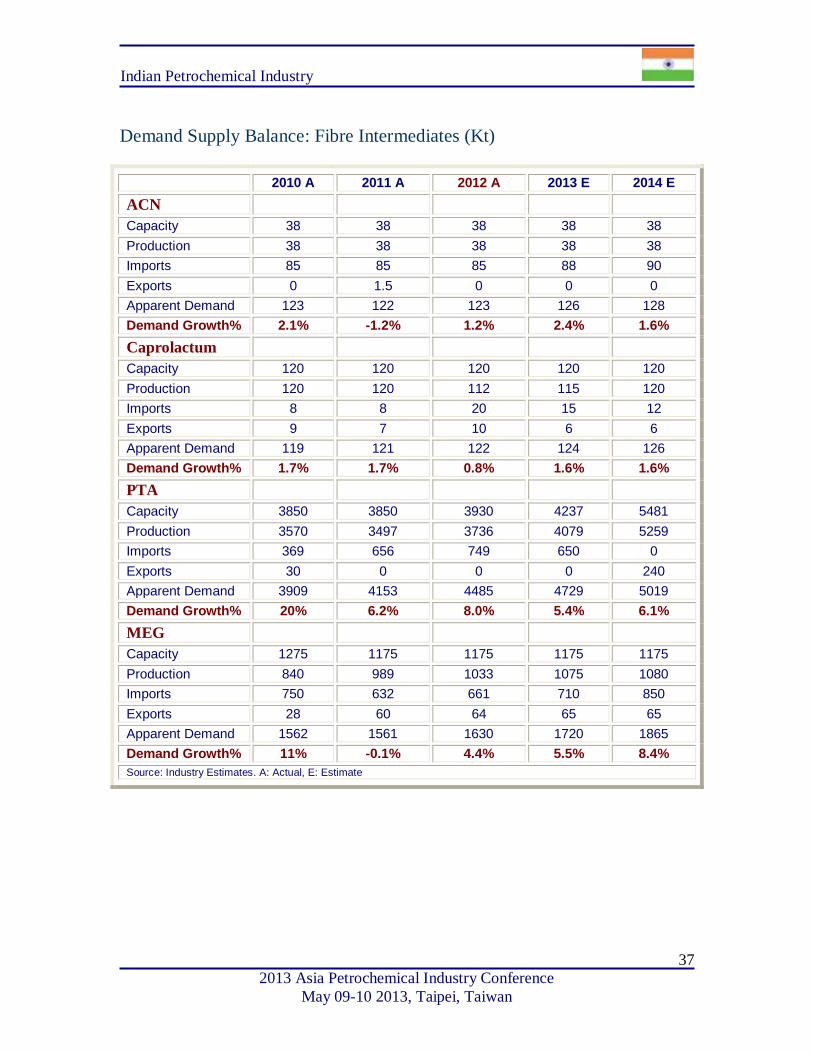
Demand Supply Balance: Fibre Intermediates (Kt)
2010 A 2011 A 2012 A 2013 E 2014 E
ACN
Capacity 38 38 38 38 38
Production 38 38 38 38 38
Imports 85 85 85 88 90
Exports 0 1.5 0 0 0
Apparent Demand 123 122 123 126 128
Demand Growth% 2.1% -1.2% 1.2% 2.4% 1.6%
Caprolactum
Capacity 120 120 120 120 120
Production 120 120 112 115 120
Imports 8 8 20 15 12
Exports 9 7 10 6 6
Apparent Demand 119 121 122 124 126
Demand Growth% 1.7% 1.7% 0.8% 1.6% 1.6%
PTA
Capacity 3850 3850 3930 4237 5481
Production 3570 3497 3736 4079 5259
Imports 369 656 749 650 0
Exports 30 0 0 0 240
Apparent Demand 3909 4153 4485 4729 5019
Demand Growth% 20% 6.2% 8.0% 5.4% 6.1%
MEG
Capacity 1275 1175 1175 1175 1175
Production 840 989 1033 1075 1080
Imports 750 632 661 710 850
Exports 28 60 64 65 65
Apparent Demand 1562 1561 1630 1720 1865
Demand Growth% 11% -0.1% 4.4% 5.5% 8.4%
Source: Industry Estimates. A: Actual, E: Estimate

Indian Petrochemical Industry
2013 Asia Petrochemical Industry Conference
May 09-10 2013, Taipei, Taiwan
38
Demand Supply Balance: Synthetic Fibres (Kt)
PSF 2010 A 2011 A 2012 A 2013 E 2014 E
Capacity 1265 1265 1325 1365 1495
Production 1036 1013 1070 1100 1180
Imports 30 44 35 42 52
Exports 204 211 222 210 230
Apparent Demand 862 846 883 932 1002
Demand Growth% 14% -1.9% 4.4% 5.5% 7.5%
ASF
Capacity 153 155 155 155 155
Production 82 74 74 78 82
Imports 19 19 29 29 29
Exports 20.4 15.2 7.8 7.8 7.8
Apparent Demand 80 78 96 100 104
Demand Growth% -14% -3.1% 23% 3.9% 3.9%
PPSF
Capacity 8.7 8.7 9.6 9.6 9.6
Production 3.7 4.0 4.5 5.0 5.5
Imports 0.1 0.3 0.3 0.3 0.3
Exports 0.6 0.7 0.7 0.7 0.8
Apparent Demand 3.2 3.7 4.2 4.5 5.0
Demand Growth% 11% 14% 13% 9.5% 9.3%
PFY
Capacity 2935 3238 3642 3968 4295
Production 2199 2323 2425 2600 2864
Imports 2 3 2 2 2
Exports 220 260 300 350 400
Apparent Demand 1981 2066 2127 2252 2466
Demand Growth% 20% 4.3% 3.0% 5.9% 9.5%
PPFY
Capacity 18 18 18 18 18
Production 14 13 14 15 15
Imports 1.4 1.5 1.7 1.7 1.7
Exports 1.1 1.2 2.3 2.3 2.3
Apparent Demand 14 14 13 14 15
Demand Growth% -11% -2.2% -2.0% 5.2% 5.2%
VSF
Capacity 419 419 419 419 419
Production 304 321 331 341 351
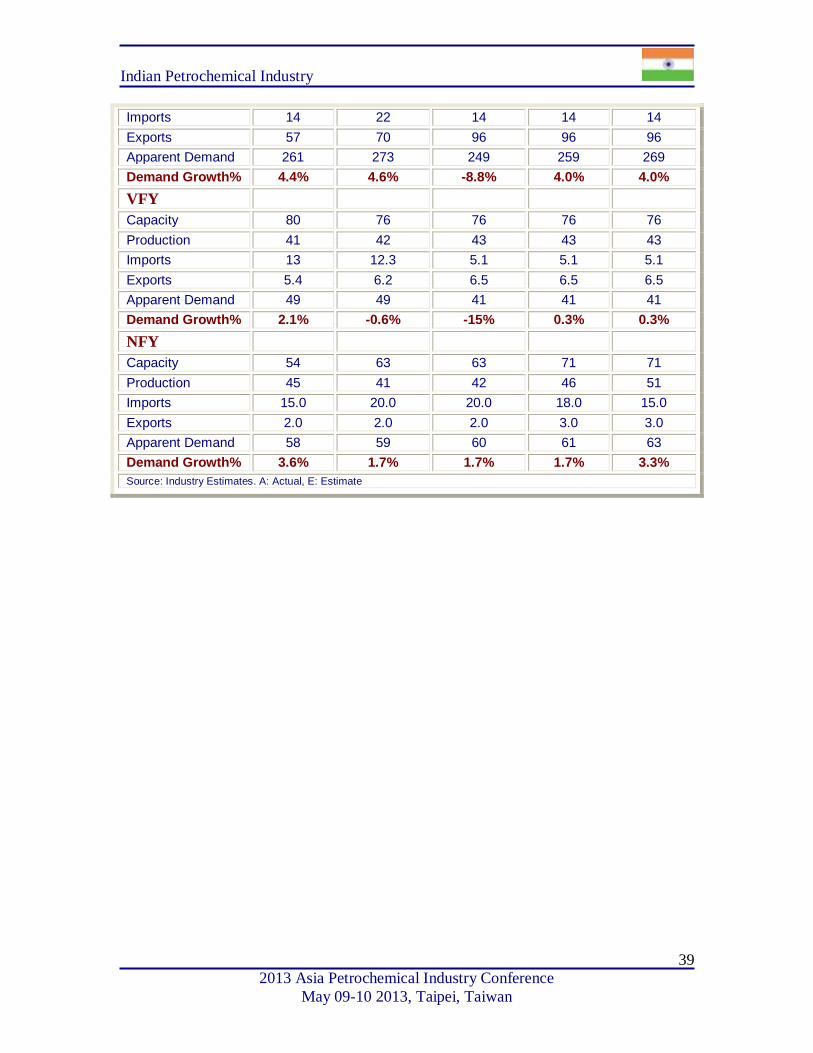
Indian Petrochemical Industry
2013 Asia Petrochemical Industry Conference
May 09-10 2013, Taipei, Taiwan
39
Imports 14 22 14 14 14
Exports 57 70 96 96 96
Apparent Demand 261 273 249 259 269
Demand Growth% 4.4% 4.6% -8.8% 4.0% 4.0%
VFY
Capacity 80 76 76 76 76
Production 41 42 43 43 43
Imports 13 12.3 5.1 5.1 5.1
Exports 5.4 6.2 6.5 6.5 6.5
Apparent Demand 49 49 41 41 41
Demand Growth% 2.1% -0.6% -15% 0.3% 0.3%
NFY
Capacity 54 63 63 71 71
Production 45 41 42 46 51
Imports 15.0 20.0 20.0 18.0 15.0
Exports 2.0 2.0 2.0 3.0 3.0
Apparent Demand 58 59 60 61 63
Demand Growth% 3.6% 1.7% 1.7% 1.7% 3.3%
Source: Industry Estimates. A: Actual, E: Estimate
Indian Petrochemical Industry
2013 Asia Petrochemical Industry Conference
May 09-10 2013, Taipei, Taiwan
40
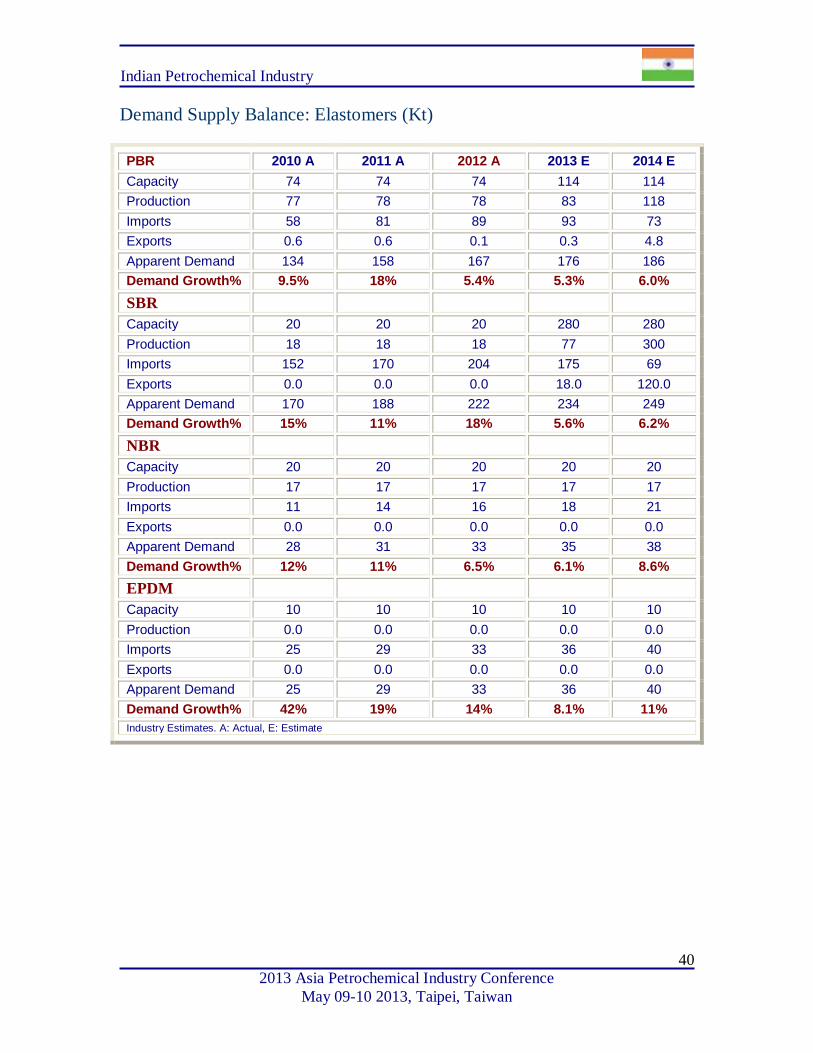
Demand Supply Balance: Elastomers (Kt)
PBR 2010 A 2011 A 2012 A 2013 E 2014 E
Capacity 74 74 74 114 114
Production 77 78 78 83 118
Imports 58 81 89 93 73
Exports 0.6 0.6 0.1 0.3 4.8
Apparent Demand 134 158 167 176 186
Demand Growth% 9.5% 18% 5.4% 5.3% 6.0%
SBR
Capacity 20 20 20 280 280
Production 18 18 18 77 300
Imports 152 170 204 175 69
Exports 0.0 0.0 0.0 18.0 120.0
Apparent Demand 170 188 222 234 249
Demand Growth% 15% 11% 18% 5.6% 6.2%
NBR
Capacity 20 20 20 20 20
Production 17 17 17 17 17
Imports 11 14 16 18 21
Exports 0.0 0.0 0.0 0.0 0.0
Apparent Demand 28 31 33 35 38
Demand Growth% 12% 11% 6.5% 6.1% 8.6%
EPDM
Capacity 10 10 10 10 10
Production 0.0 0.0 0.0 0.0 0.0
Imports 25 29 33 36 40
Exports 0.0 0.0 0.0 0.0 0.0
Apparent Demand 25 29 33 36 40
Demand Growth% 42% 19% 14% 8.1% 11%
Industry Estimates. A: Actual, E: Estimate

Indian Petrochemical Industry
2013 Asia Petrochemical Industry Conference
May 09-10 2013, Taipei, Taiwan
41
Demand Supply Balance: Carbon Black & CBFS (Kt)
2010 A 2011 A 2012 A 2013 E 2014 E
Carbon Black
Capacity 858 948 1028 1238 1238
Production 679 752 840 900 900
Imports 60 70 68 20 30
Exports 102 132 170 130 85
Apparent Demand 637 690 738 790 845
Demand Growth% 7.2% 8.3% 6.9% 7.0% 7.0%
CBFS
Capacity 1495 1495 1595 1795 1795
Production 1495 1495 1595 1595 1595
Imports 988 1000 1000 900 870
Exports 1295 1095 1050 800 600
Apparent Demand 1188 1400 1545 1695 1865
Demand Growth% 6.3% 18% 10% 10% 10%
Industry Estimates. A: Actual, E: Estimate
Indian Petrochemical Industry
2013 Asia Petrochemical Industry Conference
May 09-10 2013, Taipei, Taiwan
42
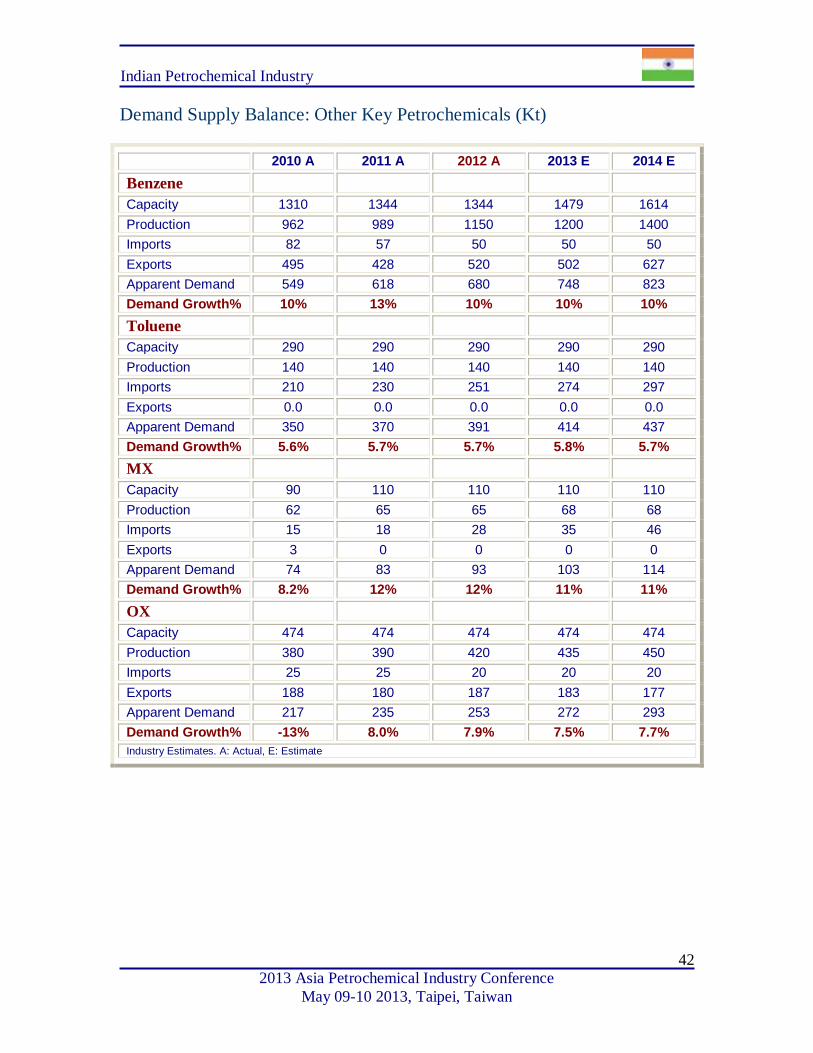
Demand Supply Balance: Other Key Petrochemicals (Kt)
2010 A 2011 A 2012 A 2013 E 2014 E
Benzene
Capacity 1310 1344 1344 1479 1614
Production 962 989 1150 1200 1400
Imports 82 57 50 50 50
Exports 495 428 520 502 627
Apparent Demand 549 618 680 748 823
Demand Growth% 10% 13% 10% 10% 10%
Toluene
Capacity 290 290 290 290 290
Production 140 140 140 140 140
Imports 210 230 251 274 297
Exports 0.0 0.0 0.0 0.0 0.0
Apparent Demand 350 370 391 414 437
Demand Growth% 5.6% 5.7% 5.7% 5.8% 5.7%
MX
Capacity 90 110 110 110 110
Production 62 65 65 68 68
Imports 15 18 28 35 46
Exports 3 0 0 0 0
Apparent Demand 74 83 93 103 114
Demand Growth% 8.2% 12% 12% 11% 11%
OX
Capacity 474 474 474 474 474
Production 380 390 420 435 450
Imports 25 25 20 20 20
Exports 188 180 187 183 177
Apparent Demand 217 235 253 272 293
Demand Growth% -13% 8.0% 7.9% 7.5% 7.7%
Industry Estimates. A: Actual, E: Estimate