apm funded volunteer research project report 2016 ... · pdf fileec sig 2016 research report...
TRANSCRIPT
EC SIG 2016 Research Report V1.0 Page 1 of 19
APM funded volunteer research project report
2016
Developing A Tool to Improve Project
Productivity
- by Enabling Project Practitioners to Identify and
address Human and Organisational Dynamics
Parag Gogate, Rod Willis & Carole Osterweil
APM Enabling Change SIG

EC SIG 2016 Research Report V1.0 Page 2 of 19
Contents
1.0 Introduction 6
1.1 Background 6
1.3 Research Objectives 6
1.4 Key Research Outputs 6
1.6 Research Methodology 8
Stage1 - Recruitment of sponsoring organisations 8
Stage 2 – Sponsor interviews 9
Stage 3 - Online data collection 10
Stage 4 – Testing the tool for suitability & robustness 10
2.0 Theory Underpinning Research 11
3.0 Research findings 12
4.0 Case Study 1 15
5.0 Case study 2 16
6.0 Guidance for Project Practitioners 17
7.0 References & Further Reading 18
APPENDIX 1 19

EC SIG 2016 Research Report V1.0 Page 3 of 19
Acknowledgements
● APM for approving the proposal and funding the volunteer research
● APM’s Enabling Change SIG for sponsoring the research
● The research team of Parag Gogate, Rod Willis and Carole Osterweil, who between them have given over 60 days! on a voluntary basis to carry out the research
● The 20 sponsors at 14 leading organisations who participated in the research and the 174 individuals who completed the online survey
● Rod Willis of Assentire for making the Innovation Audit available to all free of charge through a Creative Commons License https://creativecommons.org/licenses/
EC SIG 2016 Research Report V1.0 Page 4 of 19
About the Team
Parag Gogate is a committee member of the Enabling Change Specific Interest Group (SIG) and leads the
Research & Innovation theme. He is the Managing Consultant & Director of Ambition Group, a specialist
organisational change consultancy working with organisations, teams and individuals to improve change
capability and maturity.
He is passionate about helping organisations, teams and individuals improve their change capability and
agility and has been involved with multitude of strategic business transformation programmes and
projects in multi-national, complex and fast changing business environments.
https://www.linkedin.com/in/paraggogate/
http://www.ambitiongroup.co.uk/
Rod Willis is co-founder of Assentire Ltd and creator of the ‘Innovation Audit 3.0’, a framework designed
to enhance collaboration through agile learning practice. He integrates ‘HC Analytics’ with ‘Continuous
Improvement’ and ‘Agile Learning’ strategies to bring about lasting behavioural change across
organisations.
Rod is an APECS Executive Coach, He spent over 25 years in HiTech, working in Blue-Chip companies,
establishing high performing multi-cultural teams. His philosophy is one of Continuous Improvement
guided by Appreciative Inquiry and Peer-Coaching. His passion Accelerating Collaboration Everywhere™.
https://www.linkedin.com/in/roderickwillis/
http://www.innovationaudit.net
Carole Osterweil is the founder of Visible Dynamics, a boutique consultancy that uses ideas from
neuroscience to work with directors and change teams wanting to make a step function change in their
ability to deliver at the same time as reducing their stress levels.
She is one of a handful of coaches working with Cranfield University, the Project Academy, and PA
Consulting to support the UK government’s drive to increase senior change, project and programme
management capability.
https://uk.linkedin.com/in/caroleosterweil
http://www.visibledynamics.co.uk/
EC SIG 2016 Research Report V1.0 Page 5 of 19
About the Enabling Change SIG
The SIG was established in January 2014 to improve the change capability of organisations,
teams and individuals.
The Enabling Change SIG is a highly collaborative SIG, supporting and enabling the change
agenda across other SIGs, reaching out to SIG and APM members through the Branches, and
participating in change related discussions across the APM.
We have a balanced focus on internal and external activities, establishing and developing
partnerships with other relevant organisations and groups in order to ensure that we are at the
forefront of thought leadership on change-specific topics.
Our mission
The Enabling Change SIG’s mission is to 'improve the change capability of organisations, teams
and individuals'.
How we work
The Enabling Change SIG aims to develop and sustain individual practitioner, team and
organisational change capability by facilitating access to and exploration of change methods,
standards, case studies and good practices.
We have a growing collection of reference material on our website, and are in the process of
producing an introductory Guide publication.
We foster “Change Practitioner Groups”: communities of senior change practitioners in public
and private sectors, academics and authors who wish to share their knowledge and experience,
explore and address challenges and opportunities for enhancing the change capability of their
organisations, teams and individuals.
We also conduct innovative research to support our work and generally advance the body of
knowledge relating to enabling change.
Further information on our work can be found on the APM’s website by clicking on the following
link:
https://www.apm.org.uk/community/enabling-change-sig/
EC SIG 2016 Research Report V1.0 Page 6 of 19
1.0 Introduction
This report provides a summary of the research project that was undertaken, approved and
funded by the APM’s volunteer research fund. The project was sponsored by the Enabling
Change SIG and the timelines for completion were from May 2015 to May 2016.
The following sections provide background into the research, overall objectives, outputs and the
methodology followed. It also provides a brief overview of the theory underpinning the research,
findings and a couple of case studies on how the tool has been used in practice.
1.1 Background
The challenge of understanding and addressing the people and organisation dynamics associated
with project delivery, (e.g. resistance to change) has been a recurring theme for APM members.
Interest in this subject was confirmed at the APM’s Great Change Debate, March 2015.
The Enabling Change SIG recognised an opportunity to develop a tool based on evidence and
research that will take the APM closer to achieving its 2020 Vision.
Rod Willis (creator of Innovation Audit) agreed to collaborate with the SIG in a research project
to tailor this diagnostic tool to the needs of the APM membership and to create ‘norm’ tables as
part of this project.
The committee took this action forward by applying to the Volunteer Research Fund for financial support which was approved by the APM and culminated in this summary report.
1.3 Research Objectives
The main objectives of this research project were to:
● Provide a means of measurement and diagnosis
● Enable project practitioners to quickly explore and identify potential behavioural
obstacles at the team / organisational level
● Provide useful indicators for further exploration so necessary action can be taken to
minimise the impact of behavioural obstacles and to maximise productivity
1.4 Key Research Outputs
The principal output from this study is a diagnostic tool available through the APM Enabling
Change SIG that can be used by practitioners to measure the human dynamics for their own
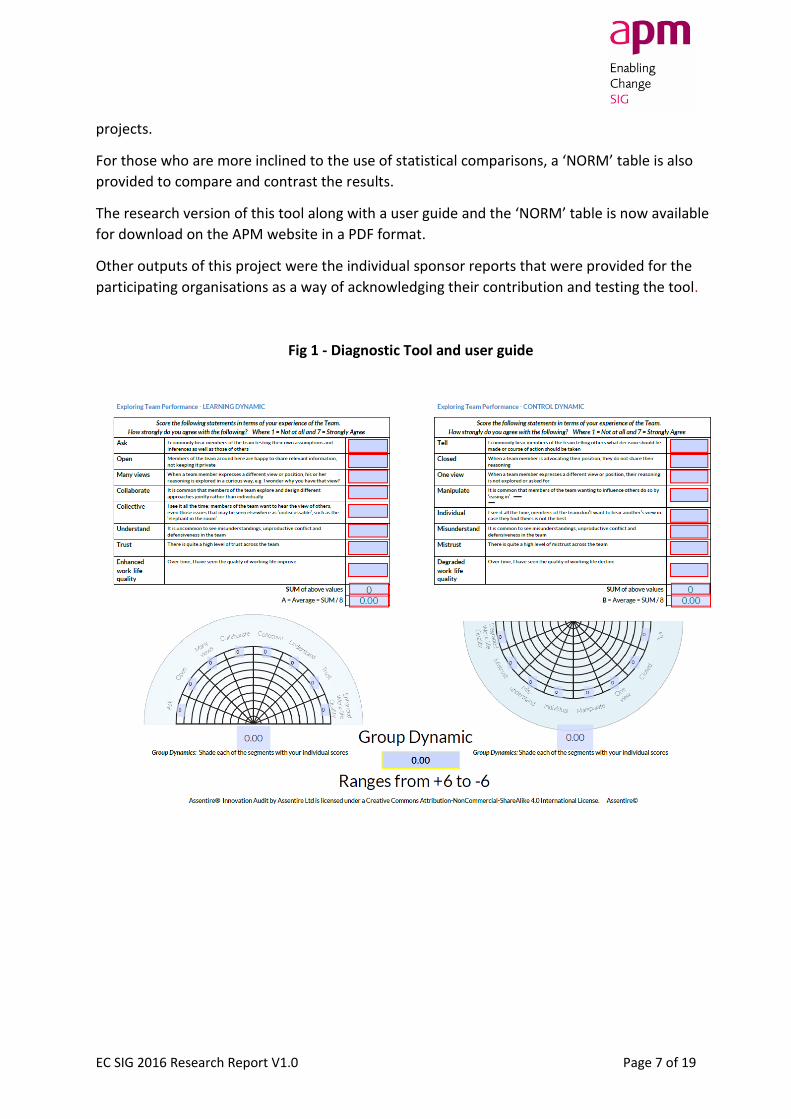
EC SIG 2016 Research Report V1.0 Page 7 of 19
projects.
For those who are more inclined to the use of statistical comparisons, a ‘NORM’ table is also
provided to compare and contrast the results.
The research version of this tool along with a user guide and the ‘NORM’ table is now available
for download on the APM website in a PDF format.
Other outputs of this project were the individual sponsor reports that were provided for the
participating organisations as a way of acknowledging their contribution and testing the tool.
Fig 1 - Diagnostic Tool and user guide

EC SIG 2016 Research Report V1.0 Page 8 of 19
Fig 2 - ‘NORM’ tables document
1.6 Research Methodology
The research was structured as a four-stage exercise:
Stage 1 - Recruitment of sponsoring organisations
Stage 2 – Sponsor interviews
Stage 3 - Online data collection
Stage 4 – Testing the tool for suitability and robustness
Stage1 - Recruitment of sponsoring organisations
Recruitment ran from July 2015 – December 2015 and focussed on announcements to the APM
Community, to members of the Enabling Change SIG and to the research team’s personal

EC SIG 2016 Research Report V1.0 Page 9 of 19
networks.
Our target was to recruit fifteen organisations who were currently delivering projects and each
with a ‘committed sponsor’ who would:
● Identify a single project to be the focus of the research and ● Recruit a minimum of 20 people working on this project to complete the online survey
Our ideal sample size was to get returns from 200 people, and we recognised that we needed a
minimum of 100 for the data to be statistically meaningful.
Recruitment closed when we had sponsors from fourteen leading organisations on board. These
ranged from global concerns to smaller enterprises operating in the UK. Industries represented
included financial services, technology, logistics, professional services, transportation,
infrastructure, engineering, facilities management and defence.
The recruitment process focussed on an in-depth interview to:
1. Build the participants’ understanding of the space that the tool would explore 2. Set out the principles informing the research, namely:
a. confidentiality for sponsors, organisations and individuals; and b. maximising value for sponsors, their organisations and the APM community
3. Enable sponsors to make an informed choice about whether to proceed to Stage 2 and which project / change programme to focus the research on
Of the fourteen sponsors we met in Stages 1 and 2, three quarters were leading major business
transformation projects and around two thirds were looking to improve their organisation’s
project / change management capability.
Stage 2 – Sponsor interviews
Face to face interviews were
conducted primarily to familiarise
participants with the online survey
questionnaire (see stage 3) as well as
to understand their organisational
contexts.
This was done using a set of
interactive cards and a sorting
exercise to explore organisational
mind-sets at play, an approach
inspired by the work of Vlatka Hlupic
(The Management Shift, 2014).
EC SIG 2016 Research Report V1.0 Page 10 of 19
Stage 3 - Online data collection
Of the fourteen organisations we spoke to, nine proceeded to Stage 3 and completed the online
survey. The survey comprised the 26 questions from the Innovation Audit.
The survey asks the individual to score 16 items relating to the Group Dynamic and 10 items
relating to the Group Environment, (see Section 2). It uses a scale of 1- 7; 1 being ‘I Strongly
Disagree’ and a 7 being ‘I strongly agree’. This meant a score of 4 was neither agree nor disagree.
The online survey also provided a confidential vehicle for individuals to offer written feedback on
how the change / project was being run.
Stage 4 – Testing the tool for suitability & robustness
This stage comprised creating the ‘Norm Group’ and testing the tool for suitability and
robustness through feedback to sponsoring organisations.
In line with our principles we offered each of the nine organisations a confidential feedback
report and a sense-making feedback meeting. This allowed sponsors to gain maximum value
from participating in the research. It also allowed us to experiment with different ways of
presenting the data.
Our promise of confidentiality means that we cannot make sponsor reports available here;
however, case studies from two organisations have been made available in the following
sections as a guide.
Overall, the online survey gathered responses from 174 participants across nine different
organisations.
EC SIG 2016 Research Report V1.0 Page 11 of 19
2.0 Theory Underpinning Research
According to The Evolution of Project Auditing 2015 Global Benchmark Study:
“A better understanding and management of social dynamics (why people behave as they do)
provides the greatest opportunity for improving project delivery”
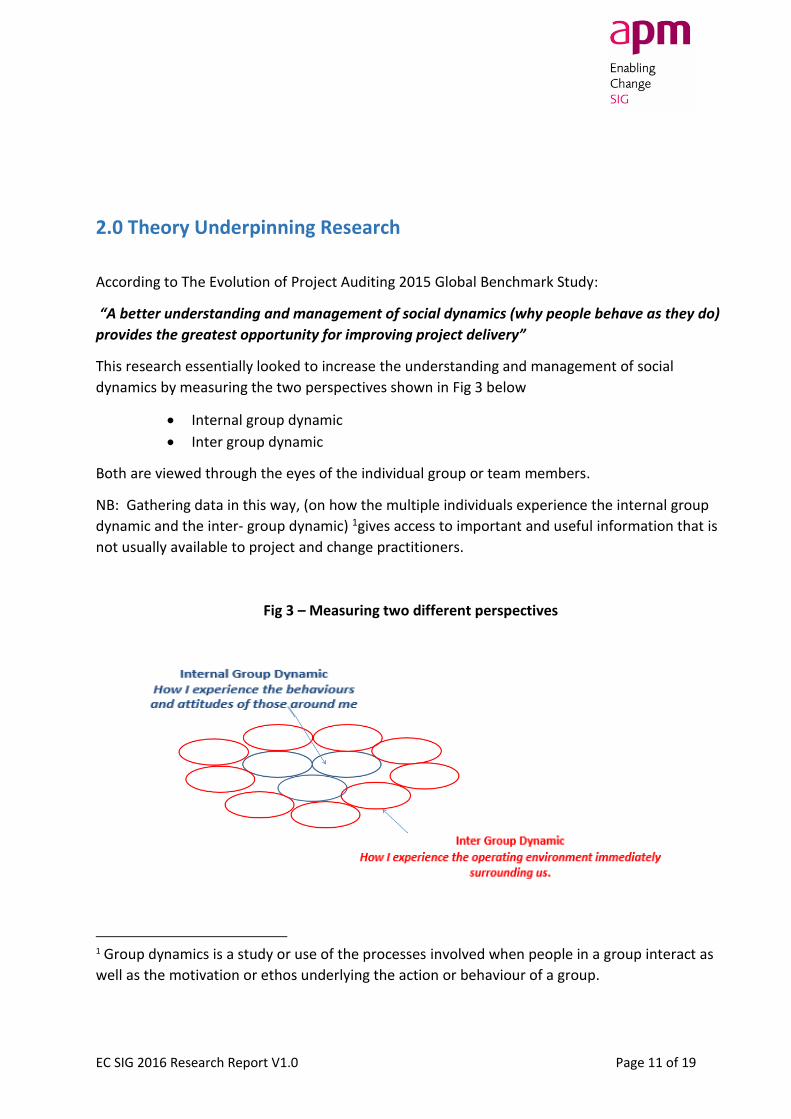
This research essentially looked to increase the understanding and management of social
dynamics by measuring the two perspectives shown in Fig 3 below
• Internal group dynamic
• Inter group dynamic
Both are viewed through the eyes of the individual group or team members.
NB: Gathering data in this way, (on how the multiple individuals experience the internal group
dynamic and the inter- group dynamic) 1gives access to important and useful information that is
not usually available to project and change practitioners.
Fig 3 – Measuring two different perspectives
1 Group dynamics is a study or use of the processes involved when people in a group interact as
well as the motivation or ethos underlying the action or behaviour of a group.
EC SIG 2016 Research Report V1.0 Page 12 of 19
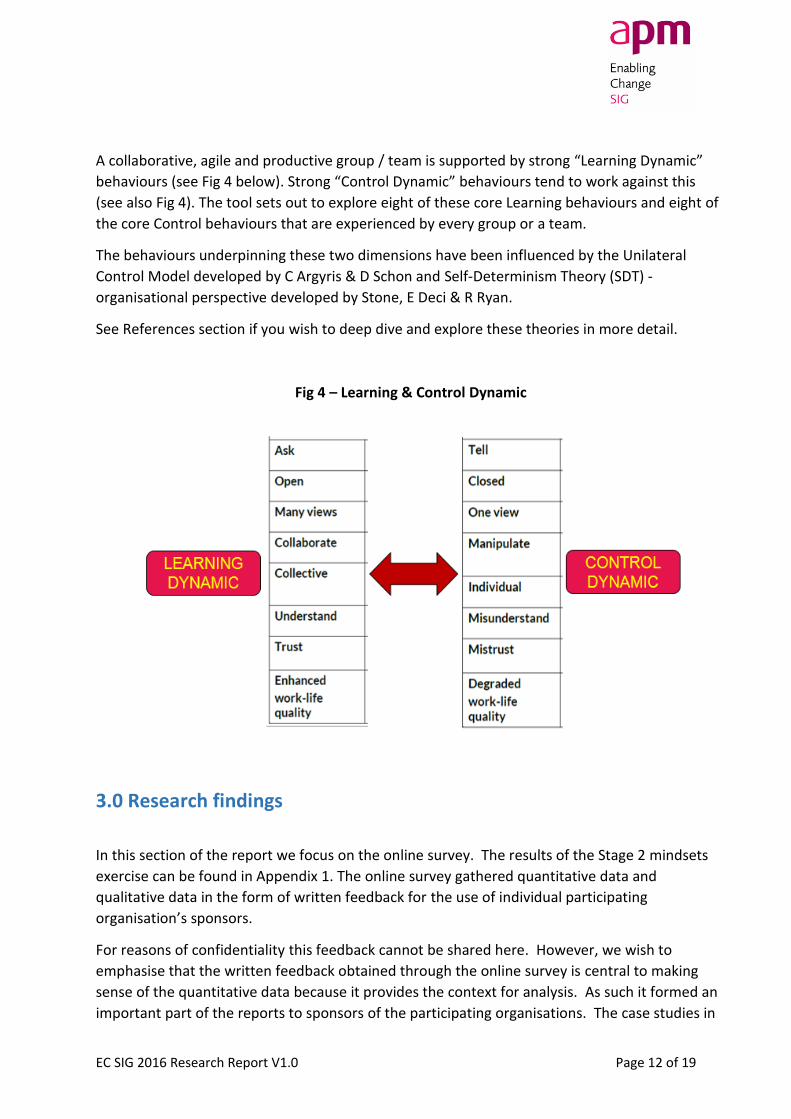
A collaborative, agile and productive group / team is supported by strong “Learning Dynamic”
behaviours (see Fig 4 below). Strong “Control Dynamic” behaviours tend to work against this
(see also Fig 4). The tool sets out to explore eight of these core Learning behaviours and eight of
the core Control behaviours that are experienced by every group or a team.
The behaviours underpinning these two dimensions have been influenced by the Unilateral
Control Model developed by C Argyris & D Schon and Self-Determinism Theory (SDT) -
organisational perspective developed by Stone, E Deci & R Ryan.
See References section if you wish to deep dive and explore these theories in more detail.
Fig 4 – Learning & Control Dynamic
3.0 Research findings
In this section of the report we focus on the online survey. The results of the Stage 2 mindsets
exercise can be found in Appendix 1. The online survey gathered quantitative data and
qualitative data in the form of written feedback for the use of individual participating
organisation’s sponsors.
For reasons of confidentiality this feedback cannot be shared here. However, we wish to
emphasise that the written feedback obtained through the online survey is central to making
sense of the quantitative data because it provides the context for analysis. As such it formed an
important part of the reports to sponsors of the participating organisations. The case studies in
EC SIG 2016 Research Report V1.0 Page 13 of 19
Section 4 give insight into how written feedback adds value.
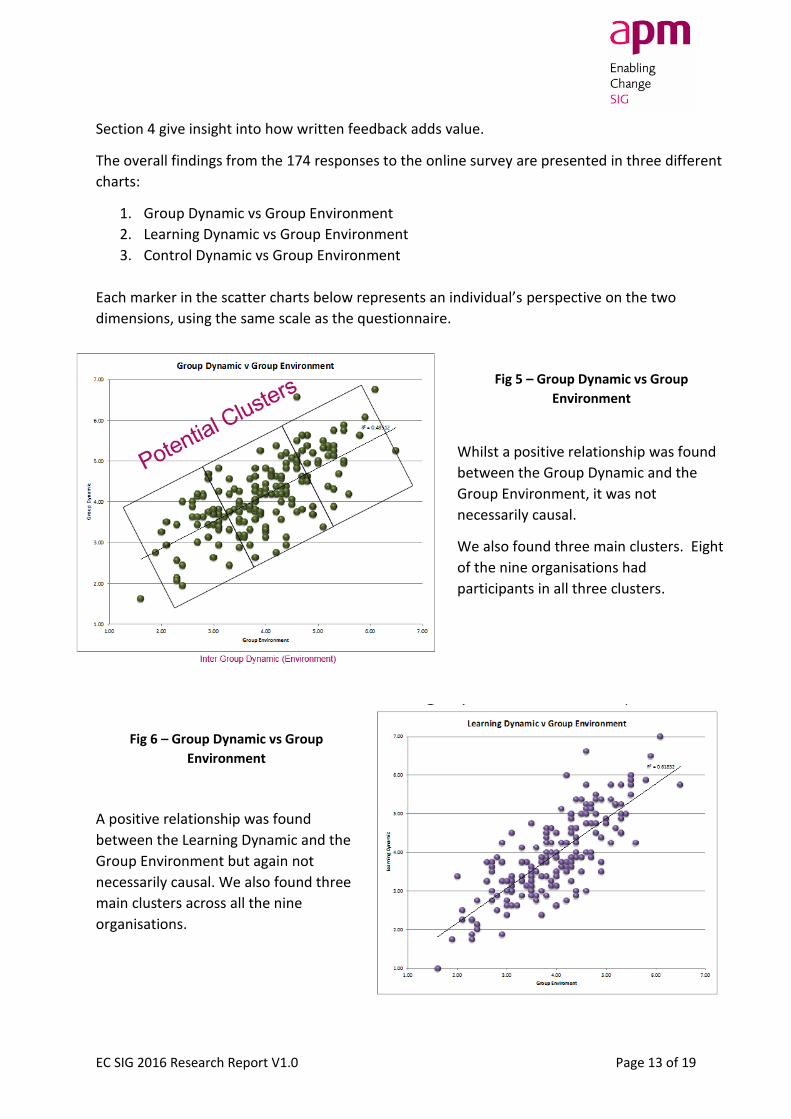
The overall findings from the 174 responses to the online survey are presented in three different
charts:
1. Group Dynamic vs Group Environment
2. Learning Dynamic vs Group Environment
3. Control Dynamic vs Group Environment
Each marker in the scatter charts below represents an individual’s perspective on the two
dimensions, using the same scale as the questionnaire.
Fig 5 – Group Dynamic vs Group
Environment
Whilst a positive relationship was found
between the Group Dynamic and the
Group Environment, it was not
necessarily causal.
We also found three main clusters. Eight
of the nine organisations had
participants in all three clusters.
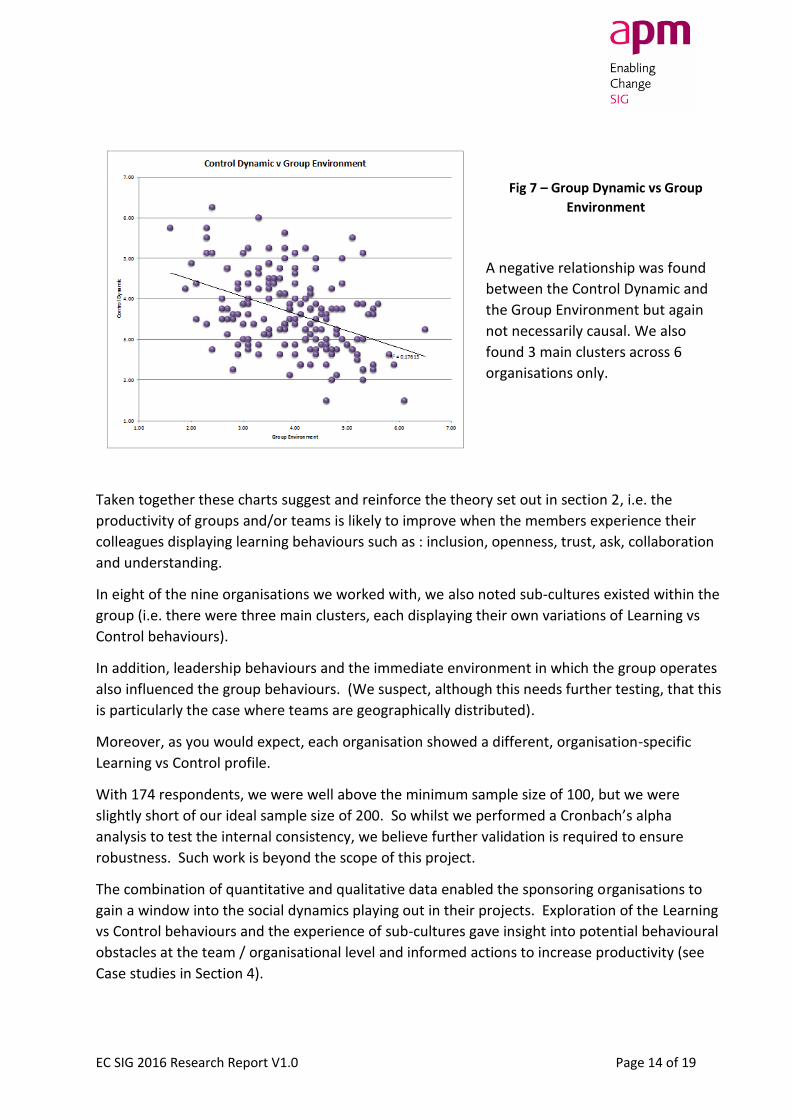
Fig 6 – Group Dynamic vs Group
Environment
A positive relationship was found
between the Learning Dynamic and the
Group Environment but again not
necessarily causal. We also found three
main clusters across all the nine
organisations.
EC SIG 2016 Research Report V1.0 Page 14 of 19
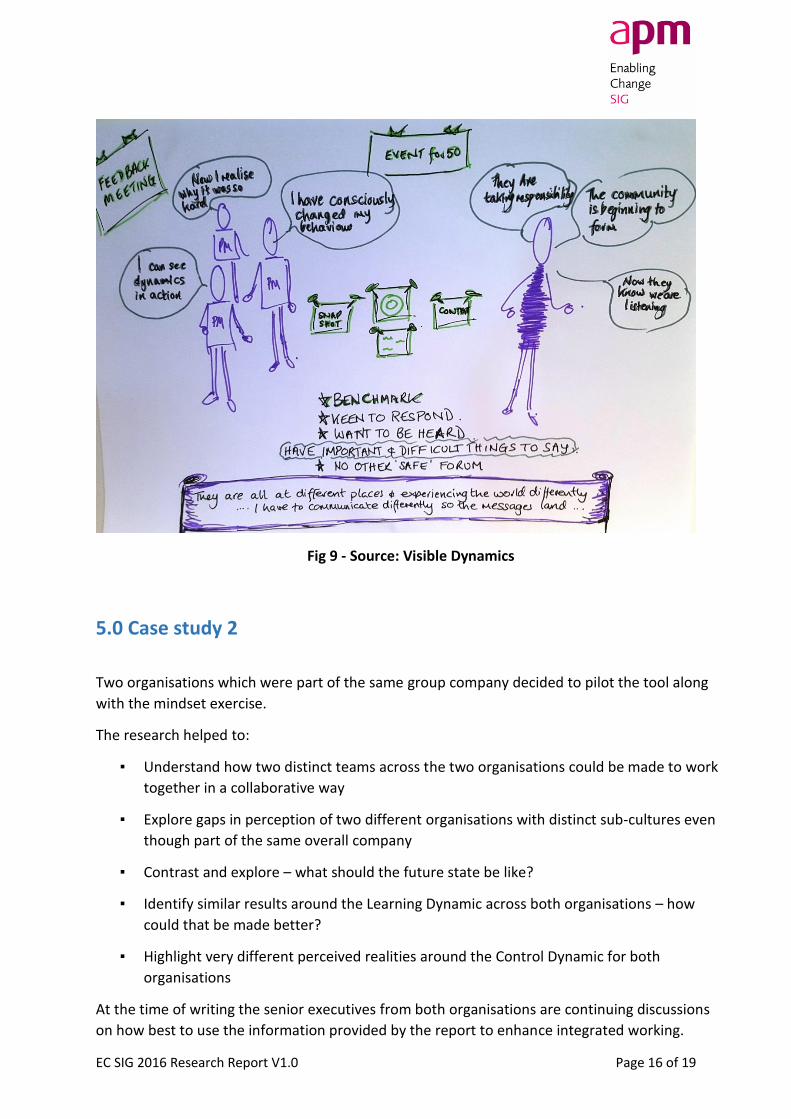
Fig 7 – Group Dynamic vs Group
Environment
A negative relationship was found
between the Control Dynamic and
the Group Environment but again
not necessarily causal. We also
found 3 main clusters across 6
organisations only.
Taken together these charts suggest and reinforce the theory set out in section 2, i.e. the
productivity of groups and/or teams is likely to improve when the members experience their
colleagues displaying learning behaviours such as : inclusion, openness, trust, ask, collaboration
and understanding.
In eight of the nine organisations we worked with, we also noted sub-cultures existed within the
group (i.e. there were three main clusters, each displaying their own variations of Learning vs
Control behaviours).
In addition, leadership behaviours and the immediate environment in which the group operates
also influenced the group behaviours. (We suspect, although this needs further testing, that this
is particularly the case where teams are geographically distributed).
Moreover, as you would expect, each organisation showed a different, organisation-specific
Learning vs Control profile.
With 174 respondents, we were well above the minimum sample size of 100, but we were
slightly short of our ideal sample size of 200. So whilst we performed a Cronbach’s alpha
analysis to test the internal consistency, we believe further validation is required to ensure
robustness. Such work is beyond the scope of this project.
The combination of quantitative and qualitative data enabled the sponsoring organisations to
gain a window into the social dynamics playing out in their projects. Exploration of the Learning
vs Control behaviours and the experience of sub-cultures gave insight into potential behavioural
obstacles at the team / organisational level and informed actions to increase productivity (see
Case studies in Section 4).

EC SIG 2016 Research Report V1.0 Page 15 of 19
4.0 Case Study 1
The organisation in this case study was undergoing a major transformation impacting over 1,000
staff members. The organisation was also working towards building a strong and proud
community of over 100 project professionals (Figure 8).
The organisation was keen to understand how this diagnostic tool could help them accelerate
building the community.
Fig 8 - Source: Visible Dynamics
The research team carried out the sponsor interview, mindsets exercise and online survey using
the diagnostic tool to provide a bespoke report to the organisation.
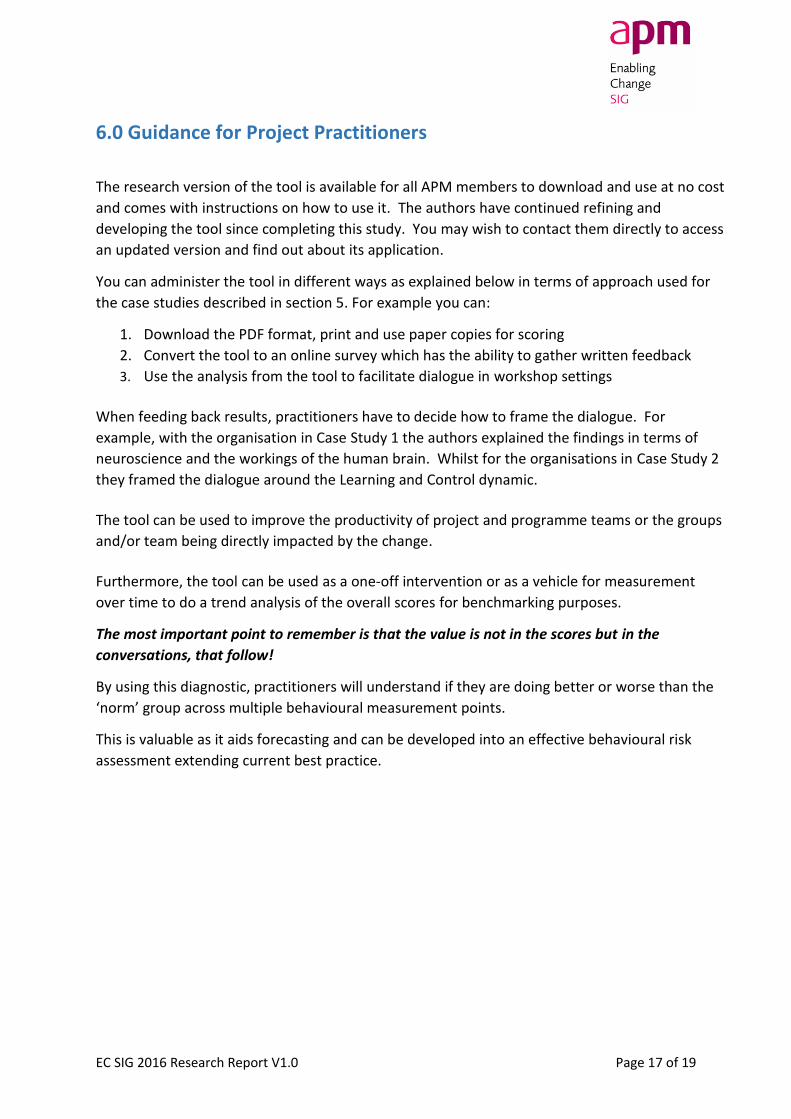
Feedback to this case study’s sponsor was followed by a facilitated feedback event with 50
members of the project community.
Figure 9 illustrates how the tool provided a common language and framework for members of
the project community to articulate and explore the issues. The tool provided a window into the
behaviours, thoughts and feelings of colleagues. It led to a significant change in the way
community members were engaging with the project and the way the sponsor was leading it.
EC SIG 2016 Research Report V1.0 Page 16 of 19
Fig 9 - Source: Visible Dynamics
5.0 Case study 2
Two organisations which were part of the same group company decided to pilot the tool along
with the mindset exercise.
The research helped to:
▪ Understand how two distinct teams across the two organisations could be made to work
together in a collaborative way
▪ Explore gaps in perception of two different organisations with distinct sub-cultures even
though part of the same overall company
▪ Contrast and explore – what should the future state be like?
▪ Identify similar results around the Learning Dynamic across both organisations – how
could that be made better?
▪ Highlight very different perceived realities around the Control Dynamic for both
organisations
At the time of writing the senior executives from both organisations are continuing discussions
on how best to use the information provided by the report to enhance integrated working.
EC SIG 2016 Research Report V1.0 Page 17 of 19
6.0 Guidance for Project Practitioners
The research version of the tool is available for all APM members to download and use at no cost
and comes with instructions on how to use it. The authors have continued refining and
developing the tool since completing this study. You may wish to contact them directly to access
an updated version and find out about its application.
You can administer the tool in different ways as explained below in terms of approach used for
the case studies described in section 5. For example you can:
1. Download the PDF format, print and use paper copies for scoring
2. Convert the tool to an online survey which has the ability to gather written feedback
3. Use the analysis from the tool to facilitate dialogue in workshop settings
When feeding back results, practitioners have to decide how to frame the dialogue. For
example, with the organisation in Case Study 1 the authors explained the findings in terms of
neuroscience and the workings of the human brain. Whilst for the organisations in Case Study 2
they framed the dialogue around the Learning and Control dynamic.
The tool can be used to improve the productivity of project and programme teams or the groups
and/or team being directly impacted by the change.
Furthermore, the tool can be used as a one-off intervention or as a vehicle for measurement
over time to do a trend analysis of the overall scores for benchmarking purposes.
The most important point to remember is that the value is not in the scores but in the
conversations, that follow!
By using this diagnostic, practitioners will understand if they are doing better or worse than the
‘norm’ group across multiple behavioural measurement points.
This is valuable as it aids forecasting and can be developed into an effective behavioural risk
assessment extending current best practice.

EC SIG 2016 Research Report V1.0 Page 18 of 19
7.0 References & Further Reading
http://www.innovationaudit.net
The Evolution of Project Auditing, 2015 Global Benchmark Study (report); http://www.brooke-
institute.com/research-tools/initiatives/
Wider reading
Argyris, C., 1991. Teaching smart people how to learn.
Coghlan, D., 1993. A person-centred approach to dealing with resistance to change. Leadership &
Organization Development Journal, 14(4), pp.10-14.
Hlupic, V., 2014. The Management Shift is Achievable Now: A Call for Action. In The Management
Shift (pp. 173-188). Palgrave Macmillan UK
Huibers,S., 2015, The Evolution of Project Auditing, 2015 Global Benchmark Study, Institute of
Internal Auditors in the Netherlands and Management Innovation Centre
Kegan, R. and Lahey, L.L., 2009. Immunity to change: How to overcome it and unlock potential in
yourself and your organization. Harvard Business Press. Vancouver
Laloux, F., 2014. Reinventing Organisations. Nelson Parker: Brüssel.
Mintzberg, H., 2013. Simply managing: What managers do—and can do better. Berrett-Koehler
Publishers.
Schein, E.H., 2006. Organizational culture and leadership (Vol. 356). John Wiley & Sons.
Vancouver
Stone, D.N., Deci, E.L. and Ryan, R.M., 2009. Beyond talk: Creating autonomous motivation
through self-determination theory. Journal of General Management, 34(3), p.75.Vancouver
EC SIG 2016 Research Report V1.0 Page 19 of 19
APPENDIX 1
As described in Section 3, the organisational mindsets exercise was used to explore the context
in each of the participating organisations.
This exercise was very experiential in nature and we did not log or analyse the conversations that
took place. Nevertheless, we did observe some patterns and these are presented here.
However, these observations are not statistically valid, they are merely presented as a guide.
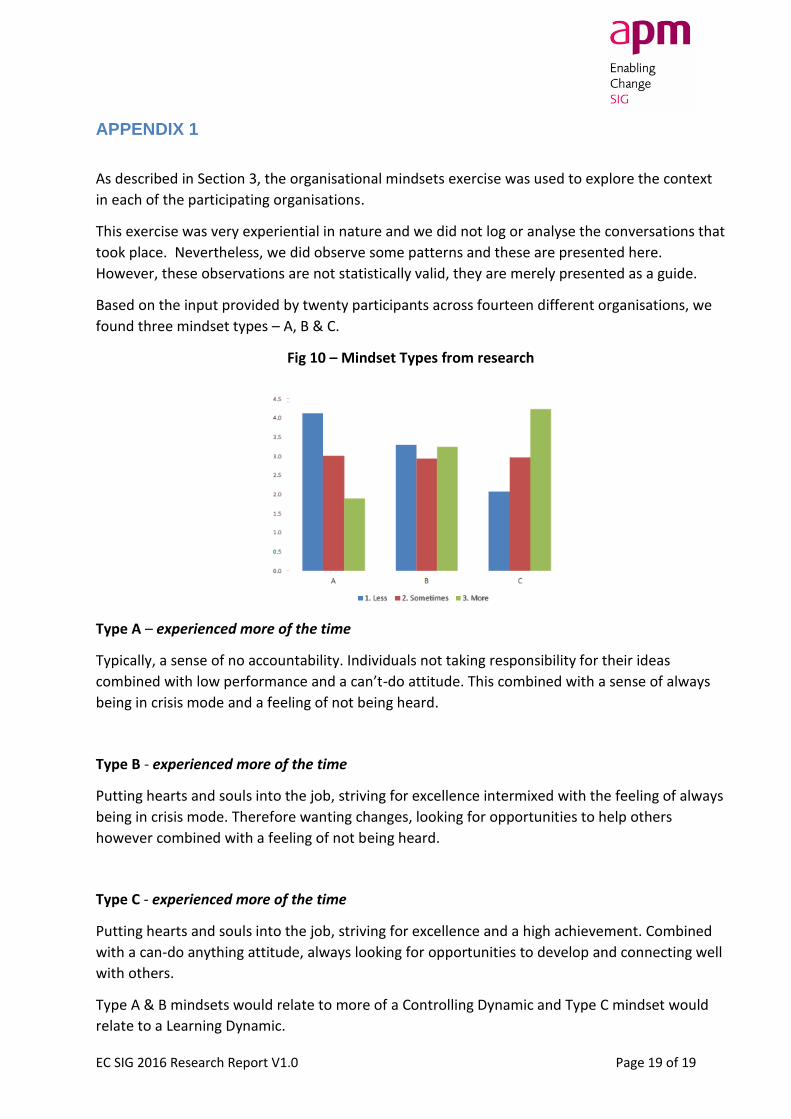
Based on the input provided by twenty participants across fourteen different organisations, we
found three mindset types – A, B & C.
Fig 10 – Mindset Types from research
Type A – experienced more of the time
Typically, a sense of no accountability. Individuals not taking responsibility for their ideas
combined with low performance and a can’t-do attitude. This combined with a sense of always
being in crisis mode and a feeling of not being heard.
Type B - experienced more of the time
Putting hearts and souls into the job, striving for excellence intermixed with the feeling of always
being in crisis mode. Therefore wanting changes, looking for opportunities to help others
however combined with a feeling of not being heard.
Type C - experienced more of the time
Putting hearts and souls into the job, striving for excellence and a high achievement. Combined
with a can-do anything attitude, always looking for opportunities to develop and connecting well
with others.
Type A & B mindsets would relate to more of a Controlling Dynamic and Type C mindset would
relate to a Learning Dynamic.