apmp supplementary comparison report of absorbed dose rate …i)-s2/... · 2017-03-07 · apmp...
TRANSCRIPT

Metrologia 54 (2017) Tech. Suppl. 06003
1/30
APMP supplementary Comparison Report of absorbed dose rate
in tissue for beta radiation
(BIPM KCDB: APMP.RI(I)-S2)
M. Katoa, T. Kurosawa
a, N. Saito
a, T. B. Kadni
b, I.J. Kim
c, B.C. Kim
c, C.-Y. Yi
c,
V. Pungkund and C.-H. Chu
e
aNational Metrology Institute of Japan, AIST, 1-1-1 Umezono Tsukuba, 305-8568 Japan
bMalaysian Nuclear Agency, Bangi, 43000 Kajang, Selangor Darul Ehsan, Malaysia
cKorea Research Institute of Standards and Science, 1 Doryong-Dong Yusong-Gu Deajeon
305-340, Korea
dOffice of Atoms for Peace, 16 Vibhavadi Rangsit Road, Laadyaw, Chatuchak, Bangkok 10900,
Thailand
eInstitute of Nuclear Energy Research, No 1000, Wuhua Rd., Jiaan Village, Longtan Township,
Taoyuan County, 32546, Taiwan
Abstract
The supplementary comparison of absorbed dose rate in tissue for beta radiation
(APMP.RI(I)-S2) was performed with five national metrology institutes in 2013 and
2014. Two commercial thin window ionization chambers were used as transfer
instruments and circulated among the participants. Two of the NMIs measured the
calibration coefficients of the chambers in reference fields produced from Pm-147,
Kr-85 and Sr-90/Y-90, while the other three measured those only in Sr-90/Y-90
beta-particle field. The degree of equivalence for the participants was determined and
this comparison verifies the calibration capabilities of the participating laboratories. In
addition, most of the results of this comparison are consistent with another
international comparison (EUROMET.RI(I)-S2) reported before this work.
1. Introduction
The personal dose equivalent and directional dose equivalent are used as the
operational quantities in the field of radiation protection. For weakly penetrating
radiation including beta-particle radiation, personal dose equivalent and directional

Metrologia 54 (2017) Tech. Suppl. 06003
2/30
dose equivalent are specified as dose equivalent in soft tissue at the depth of 0.07 mm
and that in ICRU sphere at the depth of 0.07 mm, respectively [1-3]. Since the dose
equivalent is defined to be a product of the absorbed dose and the radiation quality
factor, calibration laboratories disseminate the absorbed dose rate in tissue at the depth
of 0.07 mm for beta-particle fields, 𝐷𝑡,𝛽̇ (0.07). This supplementary comparison was
performed in order to establish the degree of equivalence of 𝐷𝑡,𝛽̇ (0.07) among the
participating National Metrology Institutes (NMIs) and support the calibration and
measurement capabilities for the quantity.
Until now, no comparisons for 𝐷𝑡,𝛽̇ (0.07) have been performed within the scope of
the APMA while a EUROMET comparison has taken place in 2004-2007 [4] and
several bilateral comparisons have performed between the LPRI (LNE-LNHB) and
PTB (1996), PTB and VNIM (1999/2001), NIST and PTB (2001) and LPRI
(LNE-LNHB) and VNIM (2001) [4].
Two thin-window chambers of different type were used as transfer standards for the
comparison. The calibration coefficients of the transfer instruments have been obtained
by each participant. Five laboratories have been taken part in the comparison: NMIJ
(Japan), INER (Taiwan), KRISS (Korea), Nuclear Malaysia (Malaysia) and OAP
(Thailand). The contact persons of the laboratories are listed in Table 1.
The comparison was arranged by the NMIJ as a pilot laboratory. In this comparison,
there was a star-shaped circulation of the transfer chambers among the participants.
The transfer chambers were sent back to the NMIJ for stability tests after each
measurement of the calibration coefficients in participating laboratory. Each
participant should provide the calibration coefficients of the transfer chambers in terms
of the absorbed dose rate in tissue for one or three of the beta-particle radiations:
Sr-90/Y-90, Kr-85 and Pm-147. The schedule of the comparison is shown in Table 2.
The comparison was scheduled to begin in January 2013 and completed in January
2014.
2. Procedure
2.1 Transfer chambers
The two thin-window chambers of different type were used as transfer standards for
the comparison, as listed in Table 3. The signal connections of the chambers are a
tri-axial BNT plug for the Magna chamber and a BNC with a 4-mm ‘banana’ plug for

Metrologia 54 (2017) Tech. Suppl. 06003
3/30
the CE-II chamber. The reference point of these chambers is the front surface of the
detector case. The chambers were tested in the NMIJ for 5 months before they were
delivered to the first participant to ensure stable performance of the chambers.
The chambers were circulated without an electrometer. A collecting voltage listed in
Table 3 was applied at each laboratory. Appling a negative voltage for the Magna
chamber or a positive voltage for the CE-II chamber results that the measured current is
positive. This voltage was applied at least 30 minutes before starting measurements. A
pre-irradiation of at least 30 minutes was also made before the measurements. The
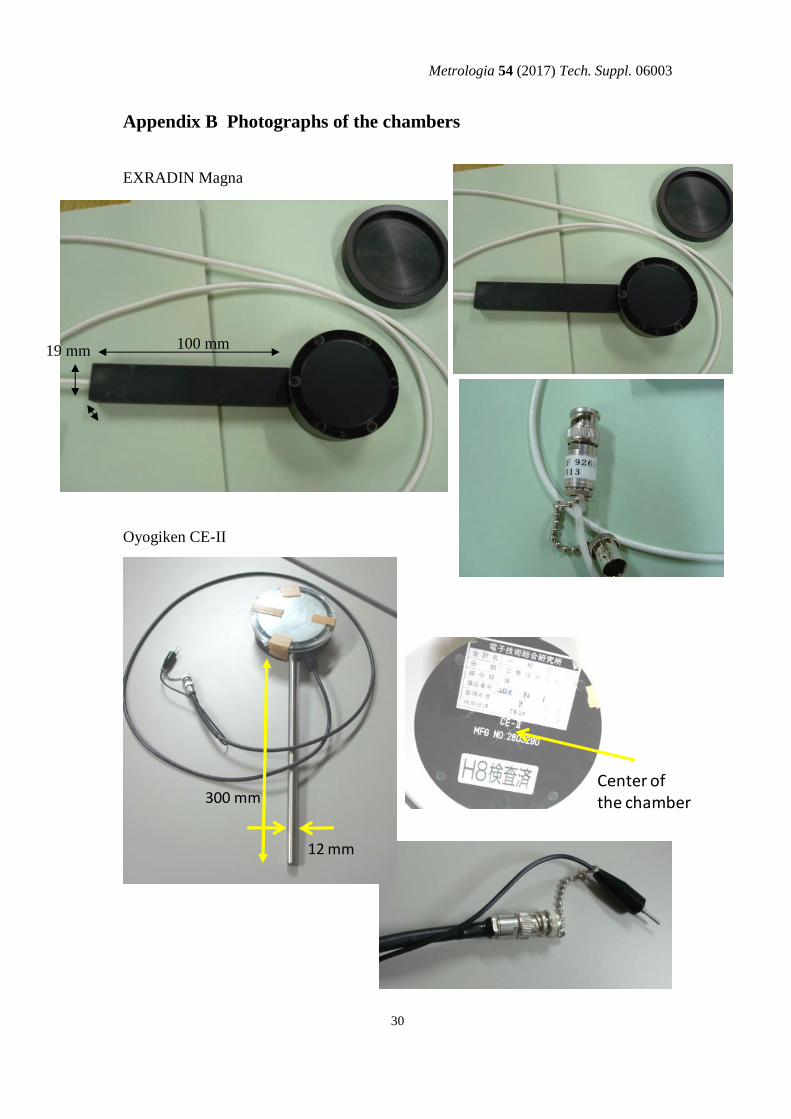
leakage current was measured before and after each measurement. Photographs of each
chamber are presented in appendix B. Plastic cover of each chamber for protecting its
entrance window was removed during the measurements. The Magna chamber is
supported by its stem, 100 mm in length, 19 mm wide and 10 mm deep (in the beam
direction). The CE-II is likewise supported by its cylindrical stem, 300 mm long and
12 mm in diameter. All stated dimensions are indicated in the Appendix B. The
chambers were transported in an air tight box of around 500 mm height, 635 mm width,
305 mm depth, and weighing about 8 kg.
2.2 Reference conditions
The reference conditions for the chamber calibrations are as follows:
1. Field size at the reference point: larger than 15 cm in diameter.
2. The variation of the dose rate over the field size at the calibration distance
should be less than ± 5 % for 90
Sr + 90
Yand 85
Kr, and less than ± 10 % for 147
Pm.
3. Air temperature, pressure and relative humidity of T = 293.15 K, P =
1013.25 hPa and h = 65 %.
4. The calibration coefficients for the transfer chambers should be given in terms
of the absorbed dose rate in tissue per current, in units of mGy/(h A).
5. The values of the half-lives that have been presented in ISO 6980-1:2006 [1]:
(10523 35) days for Sr-90 / Y-90
(3915 3) days for Kr-85
(958.2 8) days for Pm-147
6. Calibration distances are 30 cm for Sr-90/Y-90 and Kr-85, and 20 cm for
Pm-147.
7. Beam flattening filters are set at 10 cm of the source-to-filter distance. The
material and dimensions of the filters followed the ISO6980-1:2006 [1].

Metrologia 54 (2017) Tech. Suppl. 06003
4/30
2.3 Beta-particle fields
Each participant calibrated the transfer chambers in one or three beta-particle
reference fields. The reference fields in which each participant calibrated the transfer
chambers are listed in Table 4. The standard instrument and/or the source of its
traceability of the participant laboratories are also listed in the table. Three participant
laboratories used the primary extrapolation chambers for realizing their reference
absorbed dose rate values. The others have the standard beta-particle radiation fields
which is traceable to the primary standard of PTB.
3 Analysis of the results
3.1 Quantity to be measured by the participants
The calibration coefficient for a transfer chamber measured by a laboratory i, xi, is
given by the following equation.
𝑥𝑖 =𝐷�̇�(0.07)
(|𝐼𝑐+|+|𝐼𝑐
−|)/2 (1)
where 𝐷�̇�(0.07) is the conventional true value of the absorbed dose rate in tissue at the
depth of 0.07 mm during the calibration measurement, Ic+
is the ionization current
measured in one of the ionization chambers corrected to the current at the reference
conditions with the positive applied voltage, and Ic- is that with the negative applied
voltage. The participant laboratories corrected the difference in ionization currents due
to the air density to obtain Ic+ and Ic
-.
3.2 Reference value and the degree of equivalence
The reference value CE of the comparison and the degree of equivalence were
determined by the method described as follows. The analysis method is based on the
references [4-9].
1) Using the generalized least-squares method [4,5], a candidate for CE, 𝐶�̃�, is given as
𝐶�̃� =(∑ 𝑥𝑖
𝑁𝑖=1 ∑ [𝑐𝑜𝑣−1]𝑖𝑗
𝑁𝑗=1 )
(∑ ∑ [𝑐𝑜𝑣−1]𝑖𝑗𝑁𝑗=1
𝑁𝑖=1 )
⁄ (2)
The [cov-1
] is the inverse matrix of the covariance matrix [cov]. The elements of [cov],
[cov]ij = rij ui,corr uj,corr for i=1, …, N and j=1, …, N where rij is the correlation
coefficient [6,7] between xi and xj, and ui,corr (uj,corr) are the corrected uncertainty of the

Metrologia 54 (2017) Tech. Suppl. 06003
5/30
calibration coefficient given by the equation(3) [4].
𝑢𝑖,corr = √𝑢𝑖2 + 𝑣rep2 (3)
where ui is the standard uncertainty of xi reported by the participants and vrep is the
standard deviation of the repeated measurements performed at the NMIJ (see detail in
session 4). The W value of air and mass electron stopping powers which are needed to
derive 𝐷�̇�(0.07) were considered as the factors of the correlation.
2) The candidate of the reference value, 𝐶�̃�, was examined by the chi-square testing
with the manner presented by Douglas and Steele [5]. If the set of the N calibration
results was not consistent, to find a consistent subset of N-1 results, one value of xi was
omitted and 𝐶�̃� were determined again. In this comparison, all the calibration results
for the magna chamber in Kr-85 and Pm-147 radiation fields and those for the CE-II
chamber in Sr-90/Y-90 and Kr-85 radiation fields were consistent. One of the
calibration coefficient of the magna chamber in Sr-90/Y-90 field was not statistically
consistent with the others. The calibration coefficients of the CE-II chamber in Pm-147
field in which only two participants have performed the measurements were not
statistically consistent so that the reference value of the calibration coefficient of the
CE-II chamber in Pm-147 field could not be determined.
3) The reference value, CE, and the uncertainty of the reference value, u(CE), were
determined by the equations with the number of the consistent results, Ncons [4,8].
𝐶𝐸 =(∑ 𝑥𝑖
𝑁𝑐𝑜𝑛𝑠𝑖=1 ∑ [𝑐𝑜𝑣−1]𝑖𝑗
𝑁𝑐𝑜𝑛𝑠𝑗=1 )
(∑ ∑ [𝑐𝑜𝑣−1]𝑖𝑗𝑁𝑐𝑜𝑛𝑠𝑗=1
𝑁𝑐𝑜𝑛𝑠𝑖=1 )
⁄ (4)
1
𝑢2(𝐶𝐸)=
1
(∑ ∑ [𝑐𝑜𝑣−1]𝑖𝑗𝑁𝑐𝑜𝑛𝑠𝑗=1
𝑁𝑐𝑜𝑛𝑠𝑖=1
) (5)
4) The degree of equivalence of each laboratory i relative to CE , Di, is given by
Di =xi - CE. The uncertainty of Di, u(Di), is given by 𝑢(𝐷𝑖) = √𝑢𝑛,corr2 − 𝑢(𝐶𝐸)2 in
the case xi was used to determine CE. If xi was not used to determine CE, 𝑢(𝐷𝑖) =
√𝑢𝑛,corr2 + 𝑢(𝐶𝐸)2 [9].

Metrologia 54 (2017) Tech. Suppl. 06003
6/30
3.3 Evaluation of the ratio between this comparison results and the EUROMET
comparison
The calibration results with BIPM has not been in available until now. The only
regional comparison result is that of EUROMET.R(I)-S2. To evaluate the ratio
between the results of the APMP participant laboratory and the EUROMET
comparison reference value, Ri, E, the APMP comparison results were analyzed by the
following method. This is a similar analysis that presented in ref [10], but partly
reformed for this study.
The NMIJ had made the comparisons in the EUROMET program therefore the ratios
of the calibration coefficient measured at the NMIJ in the EUROMET comparison to
the reference value, RNMIJ,E, was used for the evaluation. Ri, E is given by the following
equation.
Ri, E = Ri, NMIJ RNMIJ,E. (6)
In this equation, Ri, NMIJ is the ratio of the calibration coefficient between one of the
participants i and the NMIJ. RNMIJ,E is listed in Table 5. Ri,NMIJ is expressed by the
equation (7).
𝑅𝑖,𝑁𝑀𝐼𝐽 = (𝑥𝑖,𝑘1
𝑥NMIJ,𝑘1+
𝑥𝑖,𝑘2
𝑥NMIJ,𝑘2) ×
1
2 (7)
where, k1 and k2 refer the transfer chambers Magna and CE-II, respectively.
The uncertainty of Rn, E was estimated based on the following model equation derived
from the equation (6).
𝑅𝑖,E =1
2× (
𝑥𝑖,𝑘1×𝐼NMIJ,𝑘1
𝐷NMIJ,𝑘1+
𝑥𝑖,𝑘2×𝐼NMIJ,𝑘2
𝐷NMIJ,𝑘2) ×
𝐷NMIJ,E
𝐼NMIJ,E×
1
𝑥𝑅 (8)
In the equation (8), DNMIJ,k1 (DNMIJ,k2) and DNMIJ,E are 𝐷�̇�(0.07) at the NMIJ in the
APMP comparison and that in the EUROMET comparison, respectively. INMIJ,k1
(INMIJ,k2) and INMIJ,E are the ionization current from a transfer chamber measured at the
NMIJ in the APMP comparison and that in the EUROMET comparison, respectively.
xR is the reference value of the EUROMET comparison. Since DNMIJ,k1 and DNMIJ,k2 are
nearly equal to each other, the equation can be described as follows.
𝑅𝑖,𝐸 =1
2× (𝑥𝑛,𝑘1𝐼NMIJ,𝑘1 + 𝑥𝑛,𝑘2𝐼NMIJ,𝑘2) ×
1
𝐷NMIJ,𝑘
𝐷NMIJ,E
𝐼NMIJ,E×
1
𝑥𝑅 (9)
The correlations among the input quantities were taken into account in the uncertainty
estimation.

Metrologia 54 (2017) Tech. Suppl. 06003
7/30
4. Results
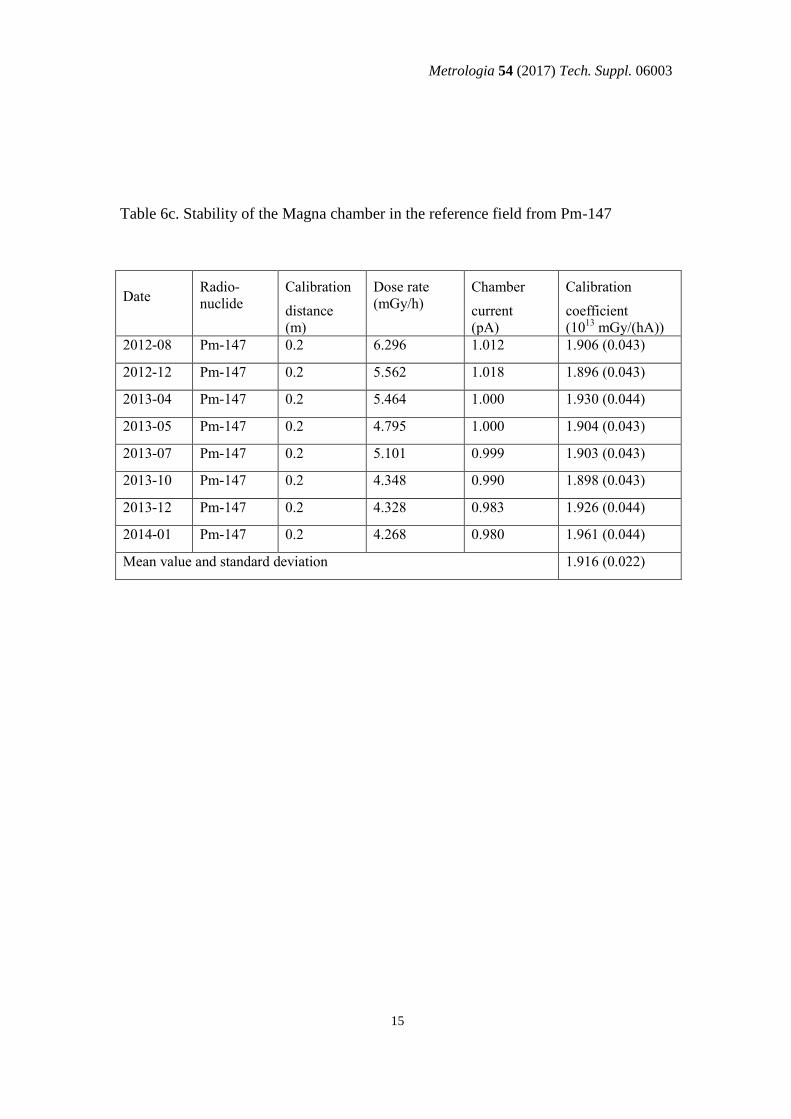
Tables 6 and 7 list the data of the calibration coefficients of the transfer chambers
measured at the NMIJ for the stability tests. The mean values of the calibration
coefficients and the standard deviation are given as the calibration coefficients of the
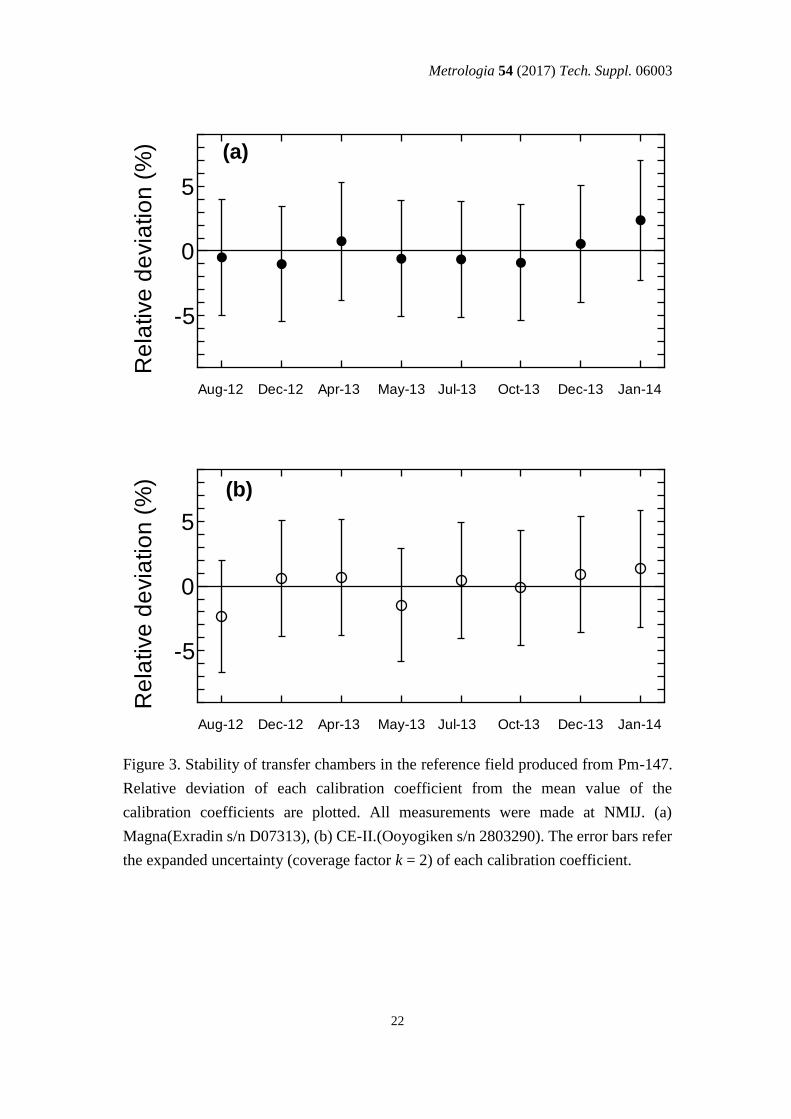
NMIJ. In figures 1, 2 and 3, the deviation of each calibration coefficient measured at
the NMIJ are plotted in relative scale for the reference field produced from Sr-90/Y-90,
Kr-85, and Pm-147, respectively. The calibration coefficients were well reproduced
within the uncertainties for any reference field.
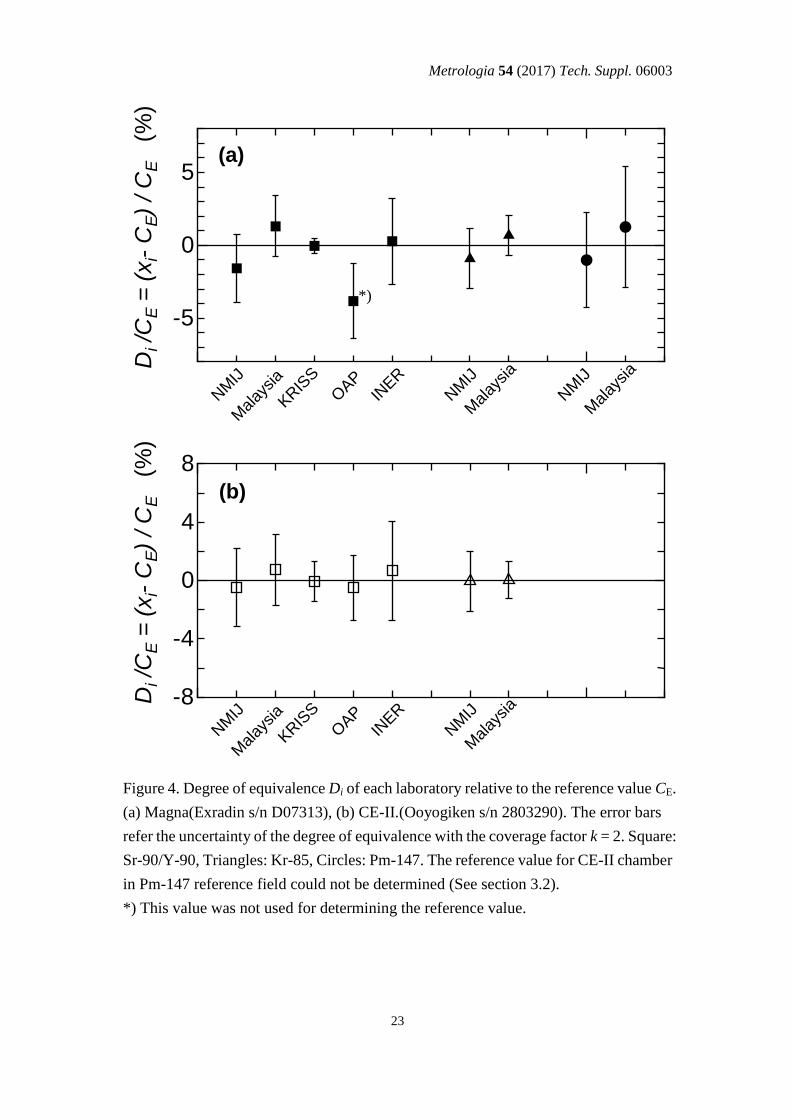
The calibration coefficients for the transfer chambers, Magna and CE-II measured by
the participants are given in Tables 8, 9 and 10. The detailed uncertainty budgets for all
the participants are given in the Appendix A. For each chamber, the reference value
and its uncertainty were evaluated. Fig 4 shows the degree of equivalence for each
laboratory. The reference value of CE-II chamber in Pm-147 field is not shown
because the calibration coefficients from the participants were not statistically
consistent.
Table 11 and Fig. 5 show the ratio of the calibration coefficient between participants
and the reference value of the EUROMET comparison. The value of the NMIJ plotted
in Fig. 5 is the value listed in Table 5. The results of all the participants for Sr-90/Y-90
and Kr-85 agreed with the EUROMET reference value within the uncertainty. For
Pm-147, the value of one participant (Nuclear Malaysia) is significantly higher than
the EUROMET reference value. It could have been caused by that the dose rate in their
Pm-147 reference field was much lower than the other reference fields (See Tables 8, 9
and 10).
5. Conclusion
The supplementary comparison of absorbed dose to tissue standards has been carried
out among five laboratories. The two transfer chambers were circulated among them
and each laboratory was asked to provide the calibration coefficients and associated
uncertainties. The reproducibility of the measurements with the transfer chambers
were confirmed through repeated measurements made at the NMIJ. The results of the
most of the calibration coefficients were consistent within the uncertainties. Even if
one of the calibration coefficients of the two chambers reported by a participant was
statistically inconsistent, the other calibration coefficient was surely consistent.
Metrologia 54 (2017) Tech. Suppl. 06003
8/30
Besides, most of the APMP comparison results agreed with the EUROMET reference
value within the stated uncertainty. This comparison verified the calibration and
measurement capability of the participating laboratories.
References
[1] International Organization for Standardization. ISO 6980-1: 2006, Nuclear energy
-Reference beta-particle radiation – Part 1: Methods of production
[2] International Organization for Standardization. ISO 6980-2: 2004, Nuclear energy
-Reference beta-particle radiation – Part 2: Calibration fundamentals related to
basic quantities characterizing the field
[3] International Organization for Standardization. ISO 6980-3, 2006, Nuclear energy
-Reference beta-particle radiation – Part 3: Calibration of are and personal
dosemeters and determination of their response as a function of energy and angle
of incidence
[4] Behrens, K. et al, International comparison of extrapolation chamber
measurements of the absorbed dose rate in tissue for beta radiation, Metrologia 44,
06003 (2007)
[5] Douglas R.J. and Steele A.G. Pair-difference chi-squared statistics for Key
Comparisons, Metrologia 43, 89 (2006)
6 International Organization of Standards, Switzerland, Guide to the Expression of
Uncertainty in Measurement, (1995)
7 Joint Committee for Guides in Metrology, Evaluation of measurement data - Guide
to the Expression of Uncertainty in Measurement, JCGM100:2008 (2008)
[8] Elster C. and Link A., Analysis of key comparison data: assessment of current
methods for determining a reference value, Meas. Sci. Technol. 12, 1431-1438
(2001)
[9] Maurice G. Cox, The evaluation of key comparison data: determining the largest
consistent subset, Metrologia 44, 187-200 (2007)
[10] Burns D.T. and Allisy-Roberts P.J., The evaluation of degrees of equivalence in
regional dosimetry comparisons, CCRI(I)/07-04 (2007)

Metrologia 54 (2017) Tech. Suppl. 06003
9/30
Tables
Table 1. Participating laboratories and their contact persons for the APMP.RI(I)-S2
supplementary comparison
Participating Laboratory Acronym or Abbreviation,
Country
Contact Person
National Metrology Institute of Japan NMIJ, Japan Masahiro Kato
Norio Saito
Institute of Nuclear Energy Research INER, Taiwan Chien-Hau Chu
Korea Research Institute of Standards and
Science KRISS, Korea Chul-Young Yi
Malaysian Nuclear Agency Nuclear Malaysia, Malaysia Taiman Bin Kadni
Office for Atoms for peace OAP, Thailand Vithit Pungkun

Metrologia 54 (2017) Tech. Suppl. 06003
10/30
Table 2: Schedule of APMP.RI(I)-S2 comparison
Participant
Date of chambers
leaving NMIJ for
participant
Measurement duration at
the laboratory
Date of chambers leaving
NMIJ - Stability test
Nuclear Malaysia 7-Jan-2013 21-Jan-2013 to
25-Jan-2013 28-Jan-2013
NMIJ Stability test
KRISS 3-Jun-2013 17-Jul-2013 to
21-Jul-2013 24-Jun-2013
NMIJ Stability test
OAP 28-Oct-2013 11-Nov-2013 to
15-Nov-2013 18-Nov-2013
NMIJ Stability test
INER 15-Dec-2013 6-Jan 2014 to
10-Jan-2014 27-Jan-2014
NMIJ Stability test -

Metrologia 54 (2017) Tech. Suppl. 06003
11/30
Table 3. Main characteristics of the transfer chambers
Supplier EXRADIN OYOGIKEN
Model Magna CE-II
Serial number D070313 2803290
Outer diameter (mm) 53,4 130
Outer depth (mm) 20,8 39
Diameter of the
collecting electrode
(mm)
- 79
depth of the collecting
volume (mm)
8 9,5
window foil material Conductive Kapton
film
Al coated
polyethylene-tere
phthalate
windows thickness 0,001 inch,
3,86 mg/cm2
25 m,
3,54 mg/cm2
Volume (cm3) 3,0 60
Cable length (m) 1,2 -
Stem length (mm) 100 300
Stem size or diameter
(mm)
19 x 10 12 in diamter
Cable connection Tri-axial (BNT) Signal: BNC
HV: banana plug
Outer electrode Ground Ground
Middle electrode Negative -250 V/
Positive +250 V
NG
Inner electrode Current
measurement
(Negative -250 V/
Positive +250 V)
Current
measurement
(Ground)
banana plug NG Positive +400 V/
Negative -400 V
Measured current Positive/Negative Positive/Negative

Metrologia 54 (2017) Tech. Suppl. 06003
12/30
Table 4. Standard traceability and reference fields in which each participant calibrated
the transfer chambers.
Participant Standard traceability
Reference fields
90Sr/
90Y
85Kr
147Pm
NMIJ Primary extrapolation
chamber
yes yes yes
INER Primary extrapolation
chamber
yes no no
KRISS Primary extrapolation
chamber
yes no no
Nuclear Malaysia, Beta radiation field
traceable to PTB, Germany
yes yes yes
OAP Beta radiation field
traceable to PTB, Germany
yes no no

Metrologia 54 (2017) Tech. Suppl. 06003
13/30
Table 5. Ratios of the calibration coefficient measured by NMIJ to the reference value
reported in EUROMET.RI(I)-S2 [4].
Radionuclide RNMIJ,E Expanded uncertainty
(k=2)
90Sr/
90Y 1.004 0.017
85Kr 0.998 0.019
147Pm 1.005 0.046

Metrologia 54 (2017) Tech. Suppl. 06003
14
Table 6. Stability of the transfer chamber, Magna, in the beta-particle reference fields.
Table 6a. Stability of the Magna chamber in the reference field from Sr-90/Y-90
Table 6b. Stability of the Magna chamber in the reference field from Kr-85
Date Radio-
nuclide
Calibration
distance
(m)
Dose rate
(mGy/h)
Chamber
current
(pA)
Calibration
coefficient
(1013
mGy/(hA))
2012-08 Kr-85 0.3 91.82 2.404 3.820 (0.053)
2012-12 Kr-85 0.3 89.72 2.318 3.871 (0.054)
2013-04 Kr-85 0.3 88.44 2.310 3.829 (0.054)
2013-05 Kr-85 0.3 86.95 2.261 3.846 (0.054)
2013-07 Kr-85 0.3 86.88 2.265 3.836 (0.054)
2013-10 Kr-85 0.3 84.89 2.234 3.800 (0.053)
2013-12 Kr-85 0.3 84.34 2.179 3.871 (0.054)
2014-01 Kr-85 0.3 83.25 2.172 3.834 (0.054)
Mean value and standard deviation 3.838 (0.024)
Date Radio-
nuclide
Calibration
distance
(m)
Dose rate
(mGy/h)
Chamber
current
(pA)
Calibration
coefficient
(1013
mGy/(hA))
2012-08 Sr-90/Y-90 0.3 35.06 1.012 3.463 (0.046)
2012-12 Sr-90/Y-90 0.3 34.85 1.018 3.424 (0.045)
2013-04 Sr-90/Y-90 0.3 34.54 1.000 3.455 (0.046)
2013-05 Sr-90/Y-90 0.3 34.50 1.000 3.451 (0.046)
2013-07 Sr-90/Y-90 0.3 34.34 0.999 3.437 (0.045)
2013-10 Sr-90/Y-90 0.3 34.13 0.990 3.447 (0.046)
2013-12 Sr-90/Y-90 0.3 34.05 0.983 3.465 (0.046)
2014-01 Sr-90/Y-90 0.3 33.91 0.980 3.460 (0.046)
Mean value and standard deviation 3.450 (0.014)
Metrologia 54 (2017) Tech. Suppl. 06003
15
Table 6c. Stability of the Magna chamber in the reference field from Pm-147
Date Radio-
nuclide
Calibration
distance
(m)
Dose rate
(mGy/h)
Chamber
current
(pA)
Calibration
coefficient
(1013
mGy/(hA))
2012-08 Pm-147 0.2 6.296 1.012 1.906 (0.043)
2012-12 Pm-147 0.2 5.562 1.018 1.896 (0.043)
2013-04 Pm-147 0.2 5.464 1.000 1.930 (0.044)
2013-05 Pm-147 0.2 4.795 1.000 1.904 (0.043)
2013-07 Pm-147 0.2 5.101 0.999 1.903 (0.043)
2013-10 Pm-147 0.2 4.348 0.990 1.898 (0.043)
2013-12 Pm-147 0.2 4.328 0.983 1.926 (0.044)
2014-01 Pm-147 0.2 4.268 0.980 1.961 (0.044)
Mean value and standard deviation 1.916 (0.022)

Metrologia 54 (2017) Tech. Suppl. 06003
16
Table 7 Stability of the transfer chamber, CE-II, in the beta-particle reference fields.
Table 7a. Stability of the CE-II chamber in the reference field from Sr-90/Y-90
Date Radio-
nuclide
Calibration
distance
(m)
Dose rate
(mGy/h)
Chamber
current
(pA)
Calibration
coefficient
(1011
mGy/(hA))
2012-08 Sr-90/Y-90 0.3 35.10 18.97 18.50 (0.24)
2012-12 Sr-90/Y-90 0.3 34.82 18.81 18.51 (0.24)
2013-04 Sr-90/Y-90 0.3 34.56 18.41 18.77 (0.25)
2013-05 Sr-90/Y-90 0.3 34.50 18.36 18.50 (0.25)
2013-07 Sr-90/Y-90 0.3 34.35 18.39 18.50 (0.25)
2013-10 Sr-90/Y-90 0.3 34.17 18.10 18.50 (0.25)
2013-12 Sr-90/Y-90 0.3 34.04 17.99 18.50 (0.25)
2014-01 Sr-90/Y-90 0.3 33.92 18.02 18.50 (0.25)
Mean value and standard deviation 18.50 (0.16)
Table 7b. Stability of the CE-II chamber in the reference field from Kr-85
Date Radio-
nuclide
Calibration
distance
(m)
Dose rate
(mGy/h)
Chamber
current
(pA)
Calibration
coefficient
(1011
mGy/(hA))
2012-08 Kr-85 0.3 91.52 48.06 19.04 (0.26)
2012-12 Kr-85 0.3 90.23 46.89 19.25 (0.27)
2013-04 Kr-85 0.3 88.31 46.13 19.14 (0.27)
2013-05 Kr-85 0.3 86.93 45.25 19.21 (0.27)
2013-07 Kr-85 0.3 86.99 45.16 19.26 (0.27)
2013-10 Kr-85 0.3 85.10 44.83 18.98 (0.26)
2013-12 Kr-85 0.3 84.64 44.53 19.01 (0.26)
2014-01 Kr-85 0.3 83.46 43.65 19.12 (0.27)
Mean value and standard deviation 19.13 (0.11)

Metrologia 54 (2017) Tech. Suppl. 06003
17
Table 7c. Stability of the CE-II chamber in the reference field from Pm-147
Date Radio-
nuclide
Calibration
distance
(m)
Dose rate
(mGy/h)
Chamber
current
(pA)
Calibration
coefficient
(1011
mGy/(hA))
2012-08 Pm-147 0.2 6.162 6.827 9.03 (0.20)
2012-12 Pm-147 0.2 5.906 6.352 9.30 (0.21)
2013-04 Pm-147 0.2 5.364 5.765 9.31 (0.21)
2013-05 Pm-147 0.2 4.804 5.275 9.11 (0.20)
2013-07 Pm-147 0.2 5.119 5.515 9.28 (0.21)
2013-10 Pm-147 0.2 4.502 4.877 9.23 (0.21)
2013-12 Pm-147 0.2 4.467 4.791 9.33 (0.21)
2014-01 Pm-147 0.2 4.232 4.515 9.37 (0.21)
Mean value and standard deviation 9.24 (0.12)

Metrologia 54 (2017) Tech. Suppl. 06003
18
Table 8. The calibration coefficients (N) of the transfer chambers for 90
Sr+90
Y reference
field in the APMP RI(I)-S2 supplementary comparison.
Participant EXRADIN (S/N 3025) OYOGIKEN (S/N 2340)
Dese rate
(mGy/h) N (mGy/(h A))
Relative standard
uncertainty (%)
Dese rate
(mGy/h) N (mGy/(h A))
Relative standard
uncertainty (%)
NMIJ 34.42* 3.450 1013 1.29 34.56* 1.873 10
12 1.29
Nuclear Malaysia 32.44 3.551 1013 1.16 32.44 1.896 10
12 1.16
KRISS 95.995 3.504 1013 0.59 95.969 1.881 10
12 0.59
OAP 134.99 3.371 1013** 1.07 134.99 1.873 10
12 1.06
INER 59.61 3.515 1013 1.56 59.61 1.895 10
12 1.65
Reference value CE 3.505 1013
0.64 1.882 1012 0.78
* These are mean values. See detail in Tables 6 and 7.
** The value is not statically consistent with the others and is not used for estimating the CE.
Table 9. The calibration coefficients (N) of the transfer chambers for 85
Kr reference
field in the APMP RI(I)-S2 supplementary comparison.
Participant EXRADIN (S/N 3025) OYOGIKEN (S/N 2340)
Dese rate
(mGy/h) N (mGy/(h A))
Relative standard
uncertainty (%)
Dese rate
(mGy/h) N (mGy/(h A))
Relative standard
uncertainty (%)
NMIJ 87.04* 3.838 1013 1.35 87.15* 1.913 10
12 1.34
Nuclear Malaysia 96.25 3.900 1013 1.10 96.25 1.915 10
12 1.07
Reference value CE 3.875 1013
1.06 1.914 1012
1.03
* These are mean values. See detail in Tables 6 and 7.
Table 10. The calibration coefficients (N) of the transfer chambers for 147
Pm reference
field in the APMP RI(I)-S2 supplementary comparison.
Participant EXRADIN (S/N 3025) OYOGIKEN (S/N 2340)
Dese rate
(mGy/h) N (mGy/(h A))
Relative standard
uncertainty (%)
Dese rate
(mGy/h) N (mGy/(h A))
Relative standard
uncertainty (%)
NMIJ 5.02* 1.916 1013 2.30 5.07* 9.243 10
11 2.26
Nuclear Malaysia 0.68 1.960 1013 2.56 0.68 9.981 10
11 1.68
Reference value CE 1.935 1013
1.94 -
* These are mean values. See detail in Tables 6 and 7.

Metrologia 54 (2017) Tech. Suppl. 06003
19
Table 11. Combined comparison ratios between participants and the EUROMET.RI(I)
supplementary comparison, Ri, E.
Radionuclide Participant Ri, E Expanded
uncertainty
(k=2)
90Sr+90Y Nuclear Malaysia 1.024 0.027
KRISS 1.014 0.021
OAP 0.992 0.024
INER 1.019 0.030
85Kr Nuclear Malaysia 1.009 0.025
147Pm Nuclear Malaysia 1.057 0.050

Metrologia 54 (2017) Tech. Suppl. 06003
20
Figure 1. Stability of transfer chambers in the reference field produced from
Sr-90/Y-90. Relative deviation of each calibration coefficient from the mean value of
the calibration coefficients are plotted. All measurements were made at NMIJ. (a)
Magna(Exradin s/n D07313), (b) CE-II.(Ooyogiken s/n 2803290). The error bars refer
the expanded uncertainty (coverage factor k = 2) of each calibration coefficient.
-5
0
5
Aug-12 Dec-12 Apr-13 May-13 Jul-13 Oct-13 Dec-13 Jan-14
Re
lative
de
via
tio
n (
%)
-5
0
5
Aug-12 Dec-12 Apr-13 May-13 Jul-13 Oct-13 Dec-13 Jan-14
Re
lative
de
via
tio
n (
%)
(a)
-5
0
5
Aug-12 Dec-12 Apr-13 May-13 Jul-13 Oct-13 Dec-13 Jan-14
Re
lative
de
via
tio
n (
%)
(b)

Metrologia 54 (2017) Tech. Suppl. 06003
21
Figure 2. Stability of transfer chambers in the reference field produced from Kr-85.
Relative deviation of each calibration coefficient from the mean value of the
calibration coefficients are plotted. All measurements were made at NMIJ. (a)
Magna(Exradin s/n D07313), (b) CE-II.(Ooyogiken s/n 2803290). The error bars refer
the expanded uncertainty (coverage factor k = 2) of each calibration coefficient.
-5
0
5
Aug-12 Dec-12 Apr-13 May-13 Jul-13 Oct-13 Dec-13 Jan-14
Re
lative
de
via
tio
n (
%)
-5
0
5
Aug-12 Dec-12 Apr-13 May-13 Jul-13 Oct-13 Dec-13 Jan-14
Re
lative
de
via
tio
n (
%)
(a)
-5
0
5
Aug-12 Dec-12 Apr-13 May-13 Jul-13 Oct-13 Dec-13 Jan-14
Re
lative
de
via
tio
n (
%)
(b)
-5
0
5
Aug-12 Dec-12 Apr-13 May-13 Jul-13 Oct-13 Dec-13 Jan-14
Re
lative
de
via
tio
n (
%)
Metrologia 54 (2017) Tech. Suppl. 06003
22
Figure 3. Stability of transfer chambers in the reference field produced from Pm-147.
Relative deviation of each calibration coefficient from the mean value of the
calibration coefficients are plotted. All measurements were made at NMIJ. (a)
Magna(Exradin s/n D07313), (b) CE-II.(Ooyogiken s/n 2803290). The error bars refer
the expanded uncertainty (coverage factor k = 2) of each calibration coefficient.
-5
0
5
Aug-12 Dec-12 Apr-13 May-13 Jul-13 Oct-13 Dec-13 Jan-14
Re
lative
de
via
tio
n (
%)
-5
0
5
Aug-12 Dec-12 Apr-13 May-13 Jul-13 Oct-13 Dec-13 Jan-14
Re
lative
de
via
tio
n (
%)
(a)
(b)
Metrologia 54 (2017) Tech. Suppl. 06003
23
Figure 4. Degree of equivalence Di of each laboratory relative to the reference value CE.
(a) Magna(Exradin s/n D07313), (b) CE-II.(Ooyogiken s/n 2803290). The error bars
refer the uncertainty of the degree of equivalence with the coverage factor k = 2. Square:
Sr-90/Y-90, Triangles: Kr-85, Circles: Pm-147. The reference value for CE-II chamber
in Pm-147 reference field could not be determined (See section 3.2).
*) This value was not used for determining the reference value.
-5
0
5
NM
IJ
Malay
sia
KRIS
S
OAP
INER
Di /
CE =
(x
i- C
E)
/ C
E
NM
IJ
NM
IJ
Malay
sia
Malay
sia
(%)
-8
-4
0
4
8
NM
IJ
Malay
sia
KRIS
S
OAP
INER
Di /
CE =
(x
i- C
E)
/ C
E
NM
IJ
Malay
sia
(%)
(a)
(b)
*)

Metrologia 54 (2017) Tech. Suppl. 06003
24
Figure 5. Ratio of the calibration coefficient for each participating laboratory relative
to the reference value in the EUROMET.RI(I)-S2. The error bars refer the expanded
uncertainty of the ratio of the calibration coefficient with the coverage factor k = 2.
Open square: Sr-90/Y-90, Open triangles: Kr-85, Open circles: Pm-147.
0.9
1
1.1
NM
IJ
Malay
sia
KRIS
S
OAP
INER
Ra
tio
of th
e c
alib
ratio
n c
oe
ffic
ien
t
NM
IJ
Malay
sia
Malay
sia
NM
IJ

Metrologia 54 (2017) Tech. Suppl. 06003
25
Appendix A
NMIJ Uncertainty budget
Uncertainty associated with the standard
Sr-90+Y-90 Kr-85 Pm-147
Component Relative standard uncertainty (%)
W-value 0.18 0.18 0.18
Ratio of the mass-electronic stopping
power in ICRU tissue to air 0.60 0.60 0.60
Air density at the reference conditions 0.04 0.04 0.04
Effective are of the collecting electrode 0.2 0.2 0.2
Effect of humidity 0.1 0.1 0.1
Effect of bremsstrahlung 0.2 0.2 0.2
Backscatter effect 0.3 0.3 0.3
Radial non-uniformity 0.25 0.4 0.8
Limiting value of the slope of the
corrected current versus chamber depth 0.75 0.76 1.79
Reference absorbed dose rate to tissue 1.09 1.13 2.11
Uncertainty associated with the calibration of the transfer chambers
Sr-90+Y-90 Kr-85 Pm-147
Component Relative standard uncertainty (%)
Reference absorbed dose rate to tissue 1.09 1.13 2.11
Attenuation and scattering of beta
particles in the air path 0.3 0.4 0.49
Radioactive decay 0.1 0.1 0.1
Corrected ionization current by the
transfer chamber Magna / CE-II 0.61 / 0.60 0.62 / 0.60 0.73 /0.61
Calibration coefficient of Magna /
CE-II 1.29 / 1.29 1.35 / 1.34 2.29 /2.25

Metrologia 54 (2017) Tech. Suppl. 06003
26
Nuclear Malaysia Uncertainty budget
Uncertainty associated with the calibration of the transfer chambers
Sr-90+Y-90 Kr-85 Pm-147
Component Relative standard uncertainty (%)
absorbed dose rate to tissue 1.05 1 1.3
Radioactive decay 0.333 0.077 0.835
Corrected ionization current by the
transfer chamber Magna / CE-II 0.38 / 0.37 0.46 /0.36 2.03 /0.66
Calibration coefficient of Magna /
CE-II 1.16 / 1.16 1.10 / 1.07 2.56 / 1.68

Metrologia 54 (2017) Tech. Suppl. 06003
27
KRISS Uncertainty budget
Uncertainty associated with the standard
Sr-90+Y-90
Component Relative standard uncertainty (%)
W-value 0.15
Ratio of the mass-electronic stopping
power in ICRU tissue to air 0.25
Air density at the reference conditions 0.01
Effective are of the collecting electrode 0.01
Effect of humidity 0.08
Effect of bremsstrahlung 0.08
Backscatter effect 0.10
Radial non-uniformity 0.13
Limiting value of the slope of the corrected
current versus chamber depth 0.44
Reference absorbed dose rate to tissue 0.58
Uncertainty associated with the calibration of the transfer chambers
Sr-90+Y-90
Component Relative standard uncertainty (%)
Reference absorbed dose rate to tissue 0.58
Radioactive decay 0.00
Corrected ionization current by the transfer
chamber Magna / CE-II 0.06 / 0.06
Calibration coefficient of Magna / CE-II 0.59 / 0.59

Metrologia 54 (2017) Tech. Suppl. 06003
28
OAP Uncertainty budget
Uncertainty associated with the calibration of the transfer chambers
Sr-90+Y-90
Component Relative standard uncertainty (%)
Reference absorbed dose rate to tissue 0.912
Radioactive decay 0.19
Transmission factor 0.51
Corrected ionization current by the transfer
chamber Magna / CE-II 0.08 / 0.07
Calibration coefficient of Magna / CE-II 1.07 / 1.06
Metrologia 54 (2017) Tech. Suppl. 06003
29
INER Uncertainty budget
Uncertainty associated with the standard
Sr-90+Y-90
Component Relative standard uncertainty (%)
W-value 0.09
Ratio of the mass-electronic stopping
power in ICRU tissue to air 0.68
Air density at the reference conditions 0.01
Effective are of the collecting electrode 0.01
Effect of humidity 0.06
Effect of bremsstrahlung 0.25
Backscatter effect 0.35
Radial non-uniformity 0.25
Limiting value of the slope of the corrected
current versus chamber depth 0.60
Reference absorbed dose rate to tissue 1.04
Uncertainty associated with the calibration of the transfer chambers
Sr-90+Y-90
Component Relative standard uncertainty (%)
Reference absorbed dose rate to tissue 1.04
Attenuation and scattering of beta particles
in the air path 0.45
Radioactive decay 0.20
Transmission factor 0.30
Corrected ionization current by the transfer
chamber Magna / CE-II 1.02 /1.15
Calibration coefficient of Magna / CE-II 1.56 /1.65
Metrologia 54 (2017) Tech. Suppl. 06003
30
Appendix B Photographs of the chambers
EXRADIN Magna
Oyogiken CE-II
19 mm 100 mm
12 mm
300 mmCenter of the chamber