apo a-1 mimetic peptide, l-4f prevents insulin resistance ... · apo a-1 mimetic peptide, l-4f...
TRANSCRIPT
Apo A-1 mimetic peptide, L-4F prevents insulin resistance through
increased HO-1 and pAMPK in obese mice
Stephen J. Peterson1,2, George Drummond1, Dong Hyun Kim1, Ming Li1,
Vincenzo Positano3, Luca Vanella1, Francesco Piccolomini1, Luigi F. Rodella1,
Amalia Gastaldelli3, Claudia Kusmic3, Antonio L'Abbate3,4, Attallah Kappas1,5,
and Nader G. Abraham1,2
Departments of Pharmacology1 and Medicine2, New York Medical College,
Valhalla, NY, 10595, 3CNR Institute of Clinical Physiology and 4Scuola Superiore
Sant’Anna, Pisa, Italy
and 1,5The Rockefeller University, NY 10021
Abbreviated Title: L-4F moderates obesity and diabetes
Address correspondence and reprint requests to:
Dr Attallah Kappas, The Rockefeller University, 1230 York Avenue, NY, NY
10021, Tel: 212-327-8494 Or Dr. Nader G. Abraham, Professor of Pharmacology
and Medicine, New York Medical College, Valhalla, NY 10595, Tel: (914) 594-
4132, FAX: 914 594-4119 E-mail: [email protected]
1
by on July 28, 2010 w
ww
.jlr.orgD
ownloaded from
ABSTRACT
We investigated the mechanisms by which L-4F, an apolipoprotein A-1
mimetic peptide, reduces obesity and diabetes in obese (ob) diabetic mice. We
hypothesized that L-4F reduces vascular dysfunction via an increase in pAMPK
and pAKT in both ob diabetic mice and human stem cells. Mice, ob and lean,
were fed a normal diet until 9 weeks of age, when all ob mice had established
diabetes treated with L-4F. Food intake, blood insulin, glucose levels, adipocyte
stem cells and pAMPK, pAKT, SREBP-1 and insulin receptors were determined.
Subcutaneous fat tissue (SAT) and visceral adipose tissue (VAT) by magnetic
resonance imaging (MRI). MRI showed that both SAT and VAT global volumes
decreased in ob-L-4F-treated animals (p<0.05 compared to ob controls). L-4F
treatment decreased hepatic lipid content, increased adipocytes of small cell size
(p<0.05), increased insulin sensitivity (p<0.04) and phosphorylation of insulin
receptors. L-4F treatment decreased nuclear expression of SREBP-1 (p<0.01).
L-4F-mediated increased levels of pAKT and pAMPK was prevented by
LY294002 resulting in a significant increase in serum glucose levels, p<0.001.
The anti-obesity effects of L-4F are manifest by a decrease in visceral fat content
and reciprocal increases in HO-1, adiponectin, pAMPK, pAKT, restoration of
vascular function and phosphorylation of insulin receptors.
Supplementary key words: Diabetes; adiponectin; adiposity; apolipoprotein A-I
mimetic peptides; heme oxygenase-1; insulin receptor; insulin sensitivity;
pAMPK; obesity; endothelial dysfunction
2
by on July 28, 2010 w
ww
.jlr.orgD
ownloaded from

Abbreviations: ApoA-1, apolipoprotein A-1; HO, heme oxygenase; LDL; low
density lipoprotein; HDL, High density lipoprotein; CVD; Cardiovascular disease;
LMW, low molecular weight; HMW, high molecular weight; MSC, mesenchymal
stem cells.
3
by on July 28, 2010 w
ww
.jlr.orgD
ownloaded from

INTRODUCTION
Apolipoprotein A1 mimetic peptides, synthesized from either D (D-4F) or L
(L-4F) amino acids enhance the ability of high density lipoprotein (HDL) to protect
low density lipoprotein (LDL) against oxidation in atherosclerotic animals (1-3).
Prior studies show that oral administration of D-4F can reduce atherosclerotic
disease independent of cholesterol levels (2, 3). Treatment with D-4F causes
HDL to become anti-inflammatory, stimulates HDL-mediated cholesterol efflux
and reverses cholesterol transport from macrophages (1, 2). L-4F and D-4F
improve vascular function and restore the balance between nitric oxide (NO) and
superoxide (O2-) anions and increase HO-1 and peNOS levels (4-7). Using a
sickle cell disease model, Ou et al. demonstrated that apolipoprotein A1 can
improve vasoreactivity in LDL-receptor null mice (5). These data indicate an
antioxidant effect of apolipoprotein A1, D-4F.
Insulin resistance is the hallmark of type 2 diabetes and its associated
cardiovascular disease (CVD) (8, 9). Once hyperglycemia is established, an
increase in ROS occurs resulting in a progressive deterioration in vascular
function and an elevation of the levels of inflammatory cytokines by adipose
tissue (10). Obesity is also a risk factor for CVD and diabetes in humans and in
animals (11, 12). Obesity and hyperglycemia are independent predictors of
cardiovascular disease (13, 14). Obesity and diabetes are strongly associated
with endothelial dysfunction (6, 15-19) as manifested by increases in lipolysis,
hepatic triglyceride secretion and the sterol-regulatory element binding protein-1
(SREBP-1) (20). SREBPs are major transcription factors that regulate genes
4
by on July 28, 2010 w
ww
.jlr.orgD
ownloaded from
involved in fatty acid and cholesterol synthesis and are regulated by pAMPK and
pAKT in ob mice (20). Additionally, activation of the endocannabinoid receptor-1
(CB1 receptor), a regulatory protein linked to abnormal glucose levels and
obesity, was shown to increase the hepatic lipogenic transcription factor,
SREBP-1, and fatty acid synthesis (21). In visceral adipose tissue, increased
CB1 receptor activity leads to a decrease in adiponectin and an increase in
lipogenesis both of which contribute to insulin resistance.
Hyperglycemia has been linked to endothelial cell injury and vascular
dysfunction through decreases in pAKT, HO-1 and peNOS (6, 15, 22, 23).
pAMPK and pAKT are required for increased levels of peNOS to prevent the
detrimental perturbations associated with elevated levels of insulin, shear stress
and VEGF (24-27). In addition, chronic increased expression of the HO-1-
adiponectin-axis decreased obese-mediated inflammation, TNF and, IL-6 levels
and increased insulin sensitivity (12, 28, 29) pAKT is required for vascular
homeostasis, appropriate levels of pAKT are needed for normal vascular function
(30), presumably through crosstalk with pAMPK in vascular cells (31-33).
Induction of HO-1 protein is associated with a marked increase in the
serum levels of adiponectin and a decrease in the levels of the inflammatory
cytokines IL-1, IL-6, and TNF (12, 34). A spectrum of agents have been shown to
be potent inducers of HO-1 in endothelial cells including apolipoprotein A-1, D-
and L-4F peptides, probucol, simvastatin, and lovastatin (6, 12, 35-39). In the
present study we examined the mechanism of Apo A1-mimetic, L-4F, on vascular
5
by on July 28, 2010 w
ww
.jlr.orgD
ownloaded from

expression of pAMPK and AKT, insulin receptor phosphorylation in relation to
visceral fat and adipogenesis and vascular function in obese diabetic mice.
6
by on July 28, 2010 w
ww
.jlr.orgD
ownloaded from
MATERIALS AND METHODS
Animal protocols
Male obese (ob) mice (B6v-Lep ob/J) were purchased from Harlan
(Chicago, IL) at the age of 7 weeks and used at 8 weeks of age. Age- and sex-
matched lean mice (B6.V, lean, Harlan, Chicago, IL) served as controls. Mice
were fed a normal chow diet and had free access to water. Body weight of ob
and lean mice at the beginning of the treatment were 34±5 g and 26± 3 g,
respectively. Glucose levels were (248±21 and 126±14mg/dL) for ob and lean
mice respectively. Glucose monitoring was performed using an automated
analyzer (Life scan Inc., Milpitas, CA). Beginning at 9 weeks of age when all ob
mice had established diabetes, L-4F (i.e. Ac-D-W-F-K-A-F-Y-D-K-V-A-E-K-F-K-
E-A-F-NH2) synthesized from L-amino acids as previously described (40) was
injected at a dose of 200 μg/100 gm daily in 200 μl vehicle ), or vehicle (ABCT:
ammonium bicarbonate buffer at pH 7.4 containing 0.01% Tween20) were
administered intraperitoneally (i.p.) for 6 weeks. Blood was collected (50-100 μl)
from the tail vein of anesthetized ob mice following administration of either L-4F
or vehicle. L-4F treated ob mice were divided into two groups, one treated with L-
4F and the P13 kinase AKT inhibitor, LY294002, (cell signaling, Technology,
Boston, MA) 2-(4-morpholinyl)-8-phenyl-4H-1-benzopyran-4-HCl), which was
dissolved in DMSO and diluted with PBS and injected i.p. at a dose of 100 mg/kg,
three times a week for the last three weeks of the study (41). The second group
of ob-L-4F-treated mice were treated with the same volume of vehicle
(PMSO+PBS) without LY294002. Six groups of animals were studied: A) lean, B)
7
by on July 28, 2010 w
ww
.jlr.orgD
ownloaded from
lean-L-4F, C) lean-L-4F-LY-294002, D) ob control, E) ob-L-4F, and F) ob-L-4F-
LY294002. Food intake did not change in the mice in any treatment group. The
Animal Care and Use Committee of New York Medical College approved all
experiments.
Magnetic resonance imaging (MRI) and magnetic resonance spectroscopy
(MRS)
Subcutaneous fat tissue (SAT) and visceral fat tissue (VAT) were
determined by MRI while hepatic fat was determined by magnetic resonance
spectroscopy (MRS). Mice were imaged in a GE (USA) excite 1.5T scanner
using a knee coil with a T1-weighted spin-echo pulse sequence (TEC 9.0 ms,
TR=540ms, NEX=4, FOVO 8 x8 cm), image size 224X192 pixels. The whole
chest and abdomen of each mouse were covered with axial slices (thickness 3
mm, no spacing). Acquired images underwent semi-automatic segmentation of
SAT and VAT using the previously validated HIPPO FAT® tool (42-44).
The software computed three masks (background, fat, and non-fat
tissues) using a fuzzy clustering segmentation. After this step, external and
internal SAT boundaries were defined by an active contour algorithm that
exploited the previously computed masks as external force maps. A third contour
was computed surrounding the area where VAT was present together with other
tissues. VAT itself was assessed by the automated analysis of the signal
histogram in the visceral region previously defined, by identifying the second
peak of the signal histogram. This provided whole body volume (including the
8
by on July 28, 2010 w
ww
.jlr.orgD
ownloaded from

skeletal and soft tissues), total fat, SAT, and VAT volumes, as well as VAT/SAT
ratio and fat/body volume ratio.
Liver lipid measurements
Localized 1H Magnetic Resonance Spectroscopy (MRS) of the liver was
acquired on a 1.5 T magnetic resonance imaging scanner (EXCITE, General
Electric, USA). The liver slice with the largest gross dimensions was chosen for
the MRS study. MRS for water and fat quantification was accomplished using a
point resolved spectroscopy sequence. After line broadening, phase and
baseline correction, the peak area of the water at 4.77 ppm, and fat resonance
(FR) at 1.40 ppm were measured. Quantification of the fat content was done by
comparing the area of the FR with that of the unsuppressed water. Spectroscopic
data were processed using the NUTS software. Hepatic fat percentage was
calculated by dividing FR by the sum of FR and peak area of water. This
technique is highly reproducible, with a coefficient of variation less than 2% when
slices were studied on eight separate occasions.
Determination of HO-1, adipocyte cell size, SREBP-1, HO-1 and CB1
Subcutaneous adipose tissue and renal, liver and aortic visceral fat tissue
collected from untreated ob mice and L-4F-treated ob mice (n=8 mice per group)
were prepared for morphological analysis. Samples were fixed in 4%
paraformaldehyde for 24h, cut into small pieces and embedded in paraffin for
9
by on July 28, 2010 w
ww
.jlr.orgD
ownloaded from
histological analysis. The samples were cut by microtome (5 μm thick), mounted
on D-polylisinated glass slides, deparaffinizated in xylene and stained with
haematoxylin and eosin for the evaluation of adipocyte size or processed for CB-
1 or HO-1 immunohistochemistry. Immunostaining for CB-1 was carried out using
a goat polyclonal anti-CB-1 and SREB1 primary antibodies (7) (Santa Cruz
Biotechnology, Santa Cruz, CA) and HO-1 immunostaining was carried out using
a rabbit polyclonal anti-HO-1 primary antibody (Stressgen Bio reagents, Victoria,
BC, Canada). For each experimental group, five sections per animal were
stained. Sections were immersed in 3% hydrogen peroxide and diluted in
methanol for 30 min to quench endogenous peroxidase activity. The sections
were pre-incubated with 3% horse serum for 60 min followed by primary
antibody anti-CB-1 diluted 1:125 for 2 h at 37°C. The sections were then washed
in TBS (0.1 M), incubated 30 min at room temperature, with biotinylated horse
anti-goat immunoglobulin (Vector Laboratories, Burlingame, CA) and then
incubated for 30 min at room temperature with avidin-biotin-horseradish
peroxidase complex (ABC complex, Vector Laboratories, Burlingame, CA). The
reaction product was visualized using hydrogen peroxide and diaminobenzidine
(DAB) (Sigma) as the chromogen. All slides were dehydrated and mounted in
DPX (Sigma, St. Louis, USA). Negative controls primary antibody with non-
immune serum, revealed no signal.
10
by on July 28, 2010 w
ww
.jlr.orgD
ownloaded from

Evaluation of CB-1 and HO-1 immunoassaying analysis
CB-1 and HO-1 staining intensity was computed as integrated optical
density (IOD). Digitally fixed images of the slices (n=5 per animal) at 20X
magnification were analyzed using an optical microscope (Olympus, Germany)
equipped with an image analyzer (Image Pro Plus, Immagini e Computer, Milan,
Italy). For quantitative analysis, IOD was calculated for arbitrary areas,
measuring three fields with the same area for each section.
.
Evaluation of adipocyte size analysis
Digital images of adipose tissue sections were captured using a light
microscope (Olympus, Germany) at 20X magnification. For each group, three
fields from each of five different haematoxylin-eosin stained sections per animal
were analyzed. Individual adipocyte areas (µm2) within each field were
determined using image analysis software (Image Pro Plus, Immagini e
Computer, Milan, Italy). For the quantitative analysis, adipocyte areas were
calculated in arbitrary fields, measuring fifty adipocytes for each section.
Western blot analysis of liver, kidney and adipocyte stem cells for HO-1,
AMPK, pAMPK, AKT, pAKT and insulin receptor phophorylation
At sacrifice, subcutaneous and visceral fat in the abdomen (the visible
mesenteric fat, fat around the liver, fat around the kidney and fat around the
spleen) were dissected free, pooled for each mouse and used to isolate
adipocyte stem cells. Specimens were stored at -140°C until assayed. Frozen
11
by on July 28, 2010 w
ww
.jlr.orgD
ownloaded from

liver, kidney, heart and fat tissues were pulverized under liquid nitrogen and
placed in a homogenization buffer (mmol/l: 10 phosphate buffer, 250 sucrose, 1
EDTA, 0.1 PMSF and 0.1% v/v tergitol, pH 7.5). Homogenates were centrifuged
at 27,000xg for 10 min at 4ºC, supernatant was isolated and protein levels were
visualized by immunoblotting with antibodies. Antibodies against, AMPK, pAMPK,
AKT, and pAKT were obtained from Cell Signaling Technology, Inc. (Beverly,
MA). Antibodies were prepared by dilution of HO-1, pAMPK, pAKT and insulin
receptor as we described previously (12, 28, 29).
Glucose tolerance test
After a 12 hour fast, mice were injected i.p. with glucose (2.0g/kg body
weight). Blood samples were taken at various time points (0-120 min), for
measurement of blood glucose levels.
Human bone marrow-derived mesenchymal stem cells and adipocytes
Frozen bone marrow mononuclear cells were purchased from Allcells
(Allcells, Emeryville, CA). After thawing the cells, mononuclear cells were
cultured as previously described (12, 28, 29).
Adipogenic differentiation of human MSCs and effect of L-4F
Adipogenic differentiation of human MSCs was induced by incubation in
an adipogenesis induction medium (DMEM-high glucose (45, 46), supplemented
with 10 µg/mL of insulin, 1 µmol/L of dexamethasone, 0.2 mmol/L of
12
by on July 28, 2010 w
ww
.jlr.orgD
ownloaded from
indomethacin, 10% FBS and 1% antibiotic–antimycotic solution). The medium
was changed every 3-4 days (45, 46), in the presence of vehicle alone or vehicle
containing L-4F. At 50% confluence, L-4F and vehicle solutions were added,
HO-1 , adiponectin, pAMPK and adipogenesis was measured using oil red O as
previously described (12). MSC-derived adipocytes were treated with 7.5 μM
LY294002, a dose effective in inhibiting P 1-3 Kinase/AKT (47).
Measurement of fiber diameter and fat deposits
Serial sections (8 μm thick) were cut by cryostat and stained with
hematoxylin-eosin, for morphological evaluation (measurement of diameter) and
with Oil Red O staining for the analysis of fat deposits. Digital images were taken
using a light microscope (Olympus Germany) and then analyzed with a software
program (Image-Pro Plus 4.5.1, Milan Italy). Ten fibers from each muscle slice
were randomly selected to estimate fiber diameter; fat deposits were evaluated
through measurement of the percentage of Oil Red O stained area in 5 fields per
randomly selected muscle sections. A total of 5 sections per animal were
analyzed.
Adipocyte mesenchymal stem cell isolation from SAT and VAT of lean, ob
and ob L-4F treated mice
To isolate mouse adipocyte mesenchymal stem cells (AMSC), adipose
tissues were washed with phosphate-buffered saline (PBS) and digested at 37°C
for 30 min with 0.075% type II collagenase (48). At 50% confluence, L-4F was
13
by on July 28, 2010 w
ww
.jlr.orgD
ownloaded from
added as indicated in figures legends and HO-1 or adipogenesis was measured
using oil red O staining (12).
Statistical analyses
Statistical significance between experimental groups was determined by
the Fisher method of analysis of multiple comparisons (p<0.05 was regarded as
significant). For comparison between treatment groups, the null hypothesis was
tested by either a single-factor ANOVA for multiple groups or unpaired t test for
two groups. Data are presented as mean ± SE except for cell size and IOD for
SREBP-1 and CB1 which are presented as mean ± SD. Differences between
experimental groups were evaluated with ANOVA with Bonferroni corrections.
Statistical significance was set at p<0.05.
14
by on July 28, 2010 w
ww
.jlr.orgD
ownloaded from

RESULTS
L-4F treatment reduces weight gain and fat content
We examined the effect of L-4F treatment on body weight and fat
appearance. As seen in Figure 1, L-4F-treatment visibly reduced weight gain in
ob mice. The final weights after 6 weeks of either vehicle or L-4F treatment were
(53±2.9 g and 43.2±1.7 g, respectively, p<0.05). The L-4F mediated reduction of
weight gain was reversible. When L-4F was discontinued at week 10, ob mice
gained weight at a faster rate than ob vehicle treated animals (data not shown).
As seen in Figure 1, visceral fat in obese mice was decreased by L-4F treatment.
Effect of L-4F on fat content determined by magnetic resonance imaging
(MRI)
Visual inspection and dissection of visceral fat around various organs and
dissection of subcutaneous fat provide semi-quantitative estimates of fat content.
MRI was used to quantify SAT and VAT. As seen on Figure 2, global SAT and
global VAT were significantly decreased, p<0.05 and p<0.01, respectively. The
decrease in visceral fat was accompanied by a significant increase in adiponectin
levels and a decrease in the levels of the inflammatory cytokine IL-1 ß. Prior to
treatment, adiponectin levels in the ob mice were 2.73±0.51 μg/ml compared to
4.76±0.93 μg/ml (p<0.029) in lean animals. L-4F treatment resulted in a
significant increase (p<0.01) in the levels of serum adiponectin to 6.14±1.49
μg/ml in the ob mice. Obese mice exhibited a significant increase in serum IL-1β
15
by on July 28, 2010 w
ww
.jlr.orgD
ownloaded from

levels (123±29 pg/ml) when compared to age-matched lean controls (48±31
pg/ml), p<0.05. L-4F treatment resulted in a significant (p<0.01) decrease in
serum IL-1 levels in the ob mice (39±26 pg/ml) compared to untreated ob to
levels seen in the lean mice confirming previous data (29).
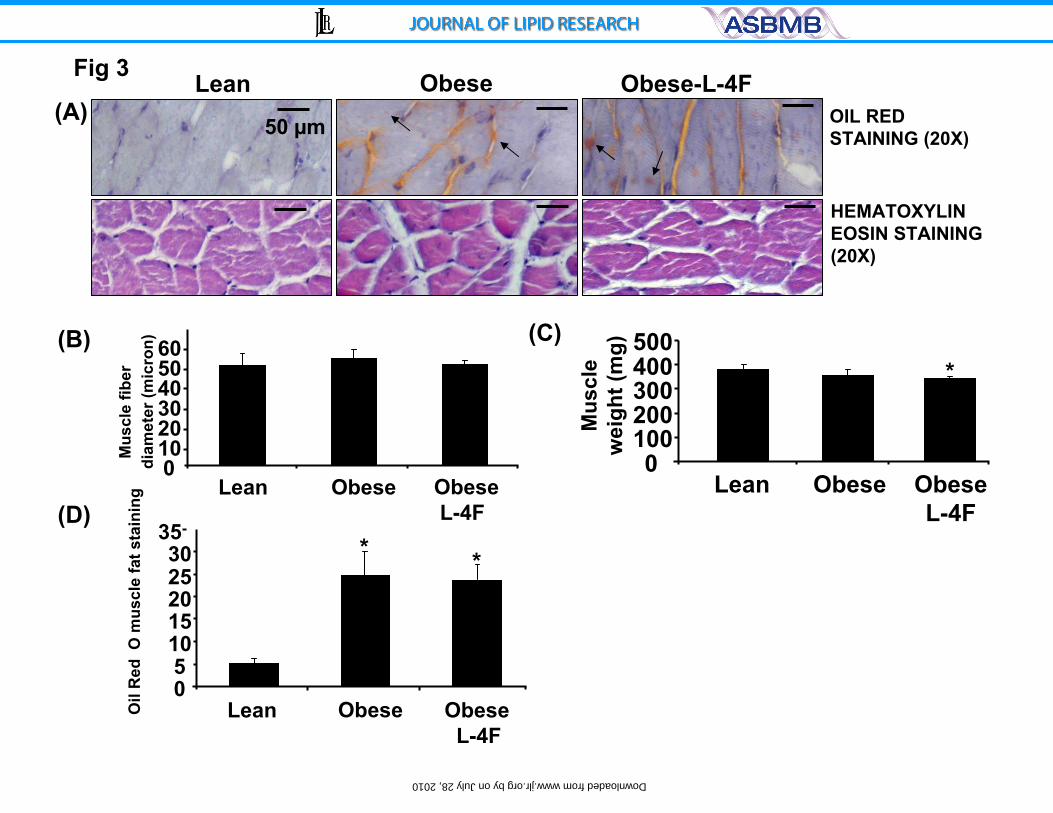
L-4F treatment did not affect muscle weight or intramuscular Oil Red O
staining
The weight of gastrocnemius muscle in lean mice, untreated ob mice, and
L-4F-treated ob mice was 393±46 mg, 350±52 mg, and 356±48 mg, respectively
(Figure 3). As shown in Figure 3, L-4F treatment did not affect muscle fiber, fat
content or muscle diameter. The diameters of muscle fibers for the lean, ob
untreated, and L-4F treated mice were 50±4.7 µm, 53±4 µm and 51±4 µm,
respectively (Figure 3B). Intramuscular lipid droplets were several fold higher in
ob compared to lean mice (p<0.005) but were not different in ob mice treated
with L-4F when compared to untreated ob mice (Figure 3D).
Effect of L-4F on adipocyte size and expression of CB1 and HO-1
Histological examination of SAT and VAT revealed that adipocyte cell size
was significantly decreased (Figure 4). Adipocyte cell size in the subcutaneous
fat of control ob mice was 52±14 µm2 X100 (Figure 4A). Adipocyte cell size was
significantly lower in L-4F-treated ob mice, 42±11 µm2X100, (p<0.05). A similar
reduction was seen with L-4F treatment in adipocyte cell size in visceral fat
surrounding aortic tissue (Figure 4B). Adipocyte cell size was proportionally lower
16
by on July 28, 2010 w
ww
.jlr.orgD
ownloaded from
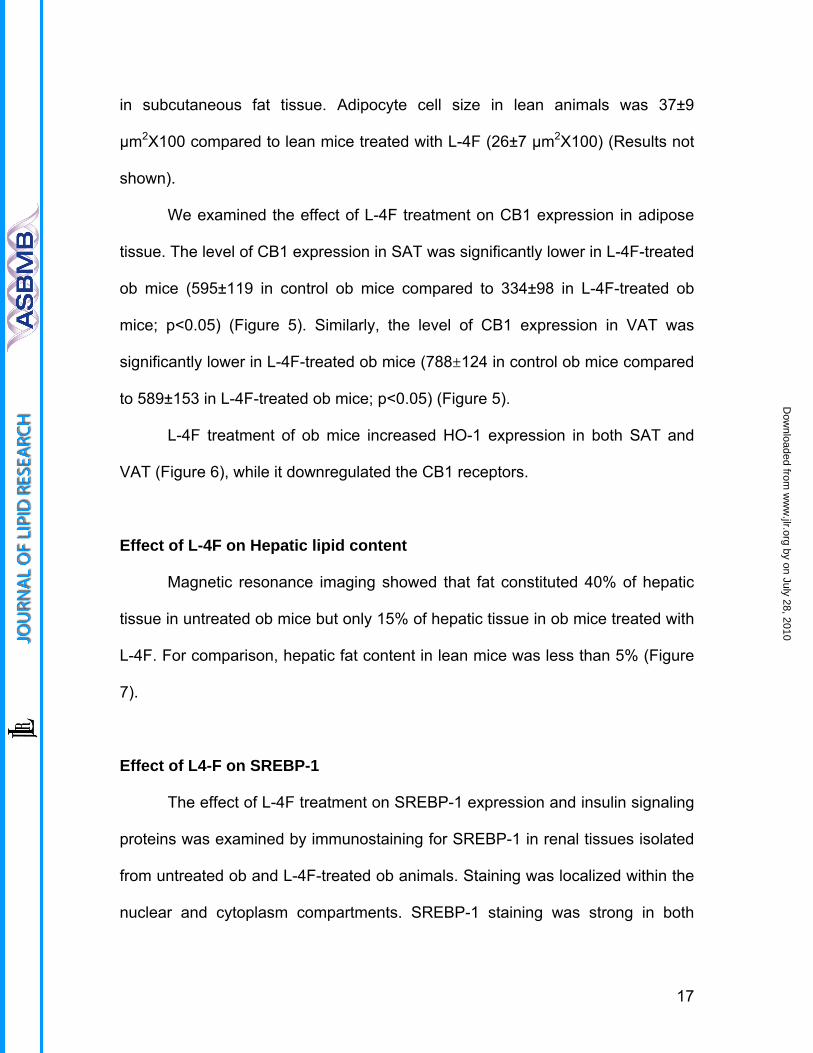
in subcutaneous fat tissue. Adipocyte cell size in lean animals was 37±9
µm2X100 compared to lean mice treated with L-4F (26±7 µm2X100) (Results not
shown).
We examined the effect of L-4F treatment on CB1 expression in adipose
tissue. The level of CB1 expression in SAT was significantly lower in L-4F-treated
ob mice (595±119 in control ob mice compared to 334±98 in L-4F-treated ob
mice; p<0.05) (Figure 5). Similarly, the level of CB1 expression in VAT was
significantly lower in L-4F-treated ob mice (788±124 in control ob mice compared
to 589±153 in L-4F-treated ob mice; p<0.05) (Figure 5).
L-4F treatment of ob mice increased HO-1 expression in both SAT and
VAT (Figure 6), while it downregulated the CB1 receptors.
Effect of L-4F on Hepatic lipid content
Magnetic resonance imaging showed that fat constituted 40% of hepatic
tissue in untreated ob mice but only 15% of hepatic tissue in ob mice treated with
L-4F. For comparison, hepatic fat content in lean mice was less than 5% (Figure
7).
Effect of L4-F on SREBP-1
The effect of L-4F treatment on SREBP-1 expression and insulin signaling
proteins was examined by immunostaining for SREBP-1 in renal tissues isolated
from untreated ob and L-4F-treated ob animals. Staining was localized within the
nuclear and cytoplasm compartments. SREBP-1 staining was strong in both
17
by on July 28, 2010 w
ww
.jlr.orgD
ownloaded from

compartments in kidney from ob mice untreated (Figure 8, right panel). Optical
density analysis of immunohistochemical staining provided quantification of the
changes in SREBP-1 expression (Figure 8). The levels of SREBP-1 were
increased (p<0.001) in untreated ob mice when compared to lean animals.
SREBP-1 levels were decreased to levels of lean animals after L-4F treatment
(Figure 8). Western blot analysis showed that SREBP-1 was increased in the
nuclear fraction of untreated ob mice and L-4F treatment prevented this SREBP-
1 translocation to the nuclear compartment (data not shown).
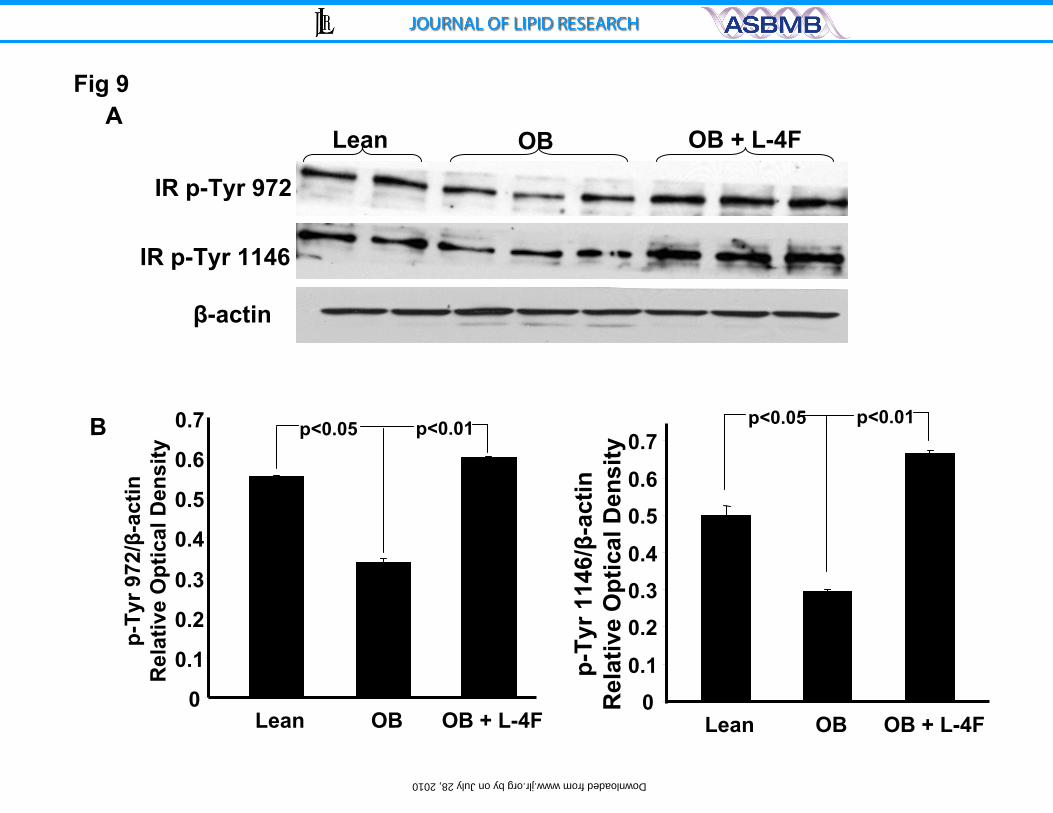
Effect of L-4F on liver insulin receptor phosphorylation
Visceral fat depots drain into the portal circulation resulting in the elevation
of the levels of free fatty acids, which has been implicated in the genesis of
impaired insulin-signaling and decreased phosphorylation of the insulin receptor.
We therefore examined the effect of L-4F treatment on liver insulin receptor
phosphorylation in untreated ob and lean mice. Phosphorylation of insulin
receptors at sites Tyr-972 and Tyr-1146 was examined as seen in Figure 9,
insulin phosphorylation at sites 972 and 1146 was significantly decreased in
untreated ob mice compared to lean animals and restored by L-4F treatment.
Densitometry analysis showed that L-4F treatment increased the ratio of P-Tyr
972 and Tyr-1146 in L-4F-treated ob mice compared to untreated ob mice
(p<0.01) and the resulting levels were equal to or greater than those in lean mice
(Figure 9).
18
by on July 28, 2010 w
ww
.jlr.orgD
ownloaded from

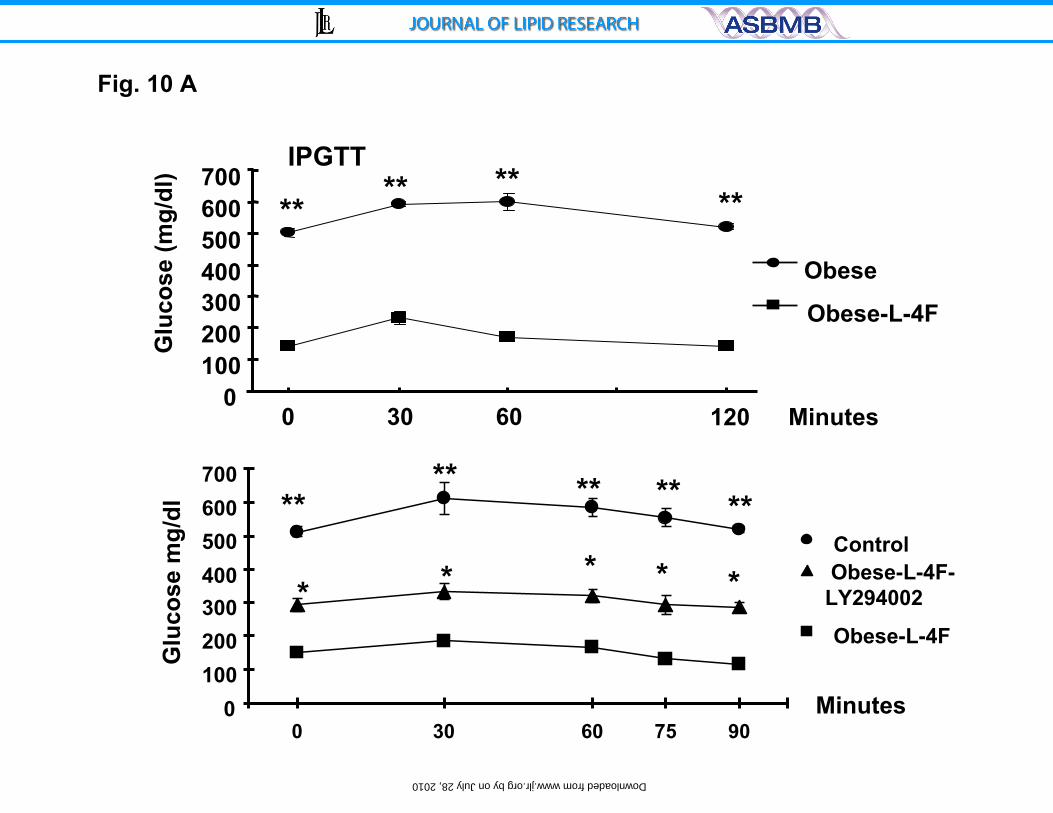
Effect of AKT kinase inhibition on glucose levels.
Plasma glucose levels in ob mice treated with vehicle were significantly
higher than those in ob mice treated with L-4F at all time points during the
glucose tolerance test. Blood glucose levels in vehicle treated ob mice were
significantly (p<0.001) elevated after glucose administration at all time points
(Figure 10A, upper panel). To clarify the role of pAKT and pAMPK as a down
stream signal in insulin sensitivity, we examined the effect of LY294002 inhbition
of pAKT by administration on glucose levels. As seen in Figure 10A, lower panel,
LY294002 prevented the L-4F anti hyperglycemic effect resulting in increased
glucose levels compared to L-4F treated ob mice.
Effect of L-4F on aorta AKT, pAKT, AMPK and pAMPK
As seen in Figure 10B, AKT in aorta tissue isolated from untreated ob
mice was no different from that in lean mice or ob mice treated with L-4F.
However, there were significant decreases in both pAKT and pAMPK in ob mice.
L-4F treatment increased both pAKT and pAMPK protein levels compared to
untreated ob mice. Densitometry analysis showed that pAKT were increased
significantly in ob mice treated with L-4F, compared to non-treated ob mice,
p<0.04. Similar effects were seen on pAMPK signal protein (data not shown).
Additionally, as seen in Figure 10 B, LY294002 administration prevented the
increase in L-4F induced phosphorylation of not only AKT and AMPK. The
19
by on July 28, 2010 w
ww
.jlr.orgD
ownloaded from

amount of non phosphorylated AKT or AMPK was unaffected by either L-4F or
LY294002 treatment.
Effect of L-4F and inhibitors of AKT on adipogenesis
We also examined the effect of inhibition of pAKT by LY294002 on
adipogenesis. As shown, (Figure 11A), treatment with LY294002 (7.5μM)
increased oil red O staining in L-4F treated cells. LY294002 alone did not
significantly affect cell viability (data not shown). L-4F increased the number of
small adipocyte cells in a dose-dependent manner (data not shown). Addition of
LY294002 decreased the number of small lipid droplets and increased the
number of large lipid droplets. L-4F in combination with LY294002 significantly
increased the total adipocyte number and decreased the average cell size (data
not shown). Figure 11B shows the levels of adipocytes cultured in the presence
and absence of L4-F. L4-F significantly decreased adipogenesis (p<0.05) as
measured by oil red O staining. Incubation of LY294002 with L4F prevented the
L4F mediated decrease in oil red O staining.
Figure 11 C shows the effect of the quantitative expression of oil red O
staining. Measurement of the size of the oil red O adipocytes, demonstrated that
L4F-treatment significantly increased the number of small oil red O, (p< 0.01),
compared to control (untreated adipose cultures). In contrast to L4F, LY294002
decreased oil red O staining. This was reversed by the addition of L-4F (Figure
11D).
20
by on July 28, 2010 w
ww
.jlr.orgD
ownloaded from

DISCUSSION
In this report, we demonstrate that the Apo-A1, mimetic peptide, L-4F,
decreased adipogenesis and improved adiposity. This is manifest by a decrease
in both SAT and VAT, a decrease in hepatic lipid content and the presence of
increased numbers of adipocytes with smaller cell size. MRI and MRS showed
that treatment with L-4F resulted in a decrease in visceral fat and improvement in
vascular dysfunction as determined by the increased levels of pAMPK, pAKT and
phosphorylation of insulin receptors. Thus, L-4F appears capable of
reprogramming vascular tissue and adipocytes in a manner that results in the
expression of a new phenotype that contains adipocytes of reduced cell size and
restored insulin sensitivity. Four observations substantiate this conclusion.
Firstly, the L-4F mediated prevention of visceral and subcutaneous fat
accumulation, measured by MRI, is consistent with the observed decrease in
hepatic lipid content. The decrease in lipid content is also consistent with the
finding that L-4F treatment produced an elevation of the phosphorylation of
insulin receptors at multiple sites. The increased phosphorylation of insulin
receptors is a response to the increase in pAMPK and pAKT crosstalk and insulin
receptor phosphorylation (Figure 9). The decrease in visceral and subcutaneous
fat levels was paralleled by an increase in the number of smaller adipocytes
which are considered “healthy” insulin sensitive adipocytes (49). Thus, L-4F acts
by preventing adipocytes from increasing in size rather than facilitating the death
of larger adipocytes which appear to die off as their size increases (50). The
action of L-4F can be considered beneficial in that lipid droplets are of smaller
21
by on July 28, 2010 w
ww
.jlr.orgD
ownloaded from

size (Figure 4) and the hepatic lipid content (Figure 7) is reduced in agreement
with a previous report (51). Abdominal fat mass is strongly predictive of
cardiovascular risk (12, 28, 29, 52), which may be a result of obesity mediated
systemic inflammation. Inflammatory cytokines TNF, IL-6 are and IL-1, markedly
elevated in the obese rodent and the human (12, 29, 53-55). There is a direct
proportionality of the degree of visceral adiposity and the endothelial dysfunction
(12, 13, 29, 52).
Secondly, L-4F treatment decreased serum IL-1β, CB1 receptor and
nuclear levels of SREBP-1 levels. The metabolic syndrome and obesity are
characterized by increased serum levels of inflammatory cytokines such as IL-1β,
which decrease insulin sensitivity (56, 57). CB1 receptors in mice increase
hepatic lipogenic transcription factor SREBP-1 and fatty acid synthesis (21).
Therefore, the L-4F mediated decreases in the levels of IL-1β and CB1 receptors
may contribute to the observed increase in insulin sensitivity.
Thirdly, L-4F administration has been shown to increase HO-1 protein
levels and adiponectin both in vitro and in vivo. Decreased levels of serum
adiponectin are the result of an increase in the levels of ROS and H2O2, thereby,
contributing to the pathogenesis of insulin resistance (58, 59). Previous studies
have shown that increased levels of HO-1 protein caused a marked increase in
serum adiponectin levels in Zucker ob rats and ob mice (12, 28, 29). An increase
in adiponectin levels is regarded as an indicator of an improvement in the
metabolic syndrome which, in turn, leads to increased insulin sensitivity and a
subsequent decrease in arterial disease and heart disease (49, 57, 60-63). This
22
by on July 28, 2010 w
ww
.jlr.orgD
ownloaded from

supports the concept that expansion of adipogenesis leads to an increased
number of adipocytes of smaller cell size; smaller adipocytes are considered to
be healthy, insulin sensitive adipocyte cells that are capable of producing
adiponectin (49). While increases in obesity and diabetes are considered risk
factors for cardiovascular complications (57), improvement in the diabetic
phenotype, including increases in insulin sensitivity and glucose tolerance, may
occur through increased pre-adipocyte differentiation and increased adiponectin
secretion (49, 64).
Fourthly, increases in HO-1 protein and adiponectin levels have been
reported to be associated with an increase in pAKT and pAMPK and an
improvement in glucose tolerance. Inhibition of pAKT and pAMPK by LY294002,
reversed glucose tolerance and insulin sensitivity (Figure 10A,B). Activated
AMPK and PI3K/AKT signaling participates in regulation of cell survival and
protects against oxidative stress (22, 65-67). Activation of pAMPK and pAKT,
increases phosphorylation of a number of target molecules resulting in an
increase in glucose transport and fatty acid oxidation (68, 69). We previously
reported that LY294002 inhibition of the AKT pathway prevented increased
expression of HO-1 from providing cell protection against ROS (47). Since pAKT
and pAMPK act as fuel sensors in the regulation of energy balance at both the
cellular and whole body levels, their involvement in the action of L-4F provides an
insight into how L-4F may act as an anti-diabetic and anti-obesity agent. This
novel effect of L-4F on the HO-1-adiponectin-pAKT-pAMPK functional module
i.e., an increase in HO-1, an increase in adiponectin and the subsequent
23
by on July 28, 2010 w
ww
.jlr.orgD
ownloaded from

increase in pAKT and pAMPK, provide a mechanistic basis for L-4F-mediated
increases in insulin receptors phosphorylation and vascular protection. Since
insulin resistance is an independent risk factor for the development of vascular
dysfunction and NO availability (70-72), L-4F-mediated improvement in vascular
function, improved glucose tolerance and insulin sensitivity, appears to require
an increase in the phosphorylation of insulin receptors.
The increase in pAMPK and pAKT as a result of L-4F treatment may be a
direct result of increased adiponectin levels. pAMPK is known to be a
downstream signal for adiponectin (73, 74). L-4F-mediated increase in pAKT and
pAMPK is essential for restoration of vascular function. Others have suggested
that pAMPK can be a therapeutic target for the amelioration of endothelial
dysfunction, and of vascular disease (75-77). Induction of the AMPK-AKT system
is considered an important metabolic response to attenuate ROS-mediated
endothelial dysfunction (75). Thus, there appears a temporal relationship
between increased levels of HO expression, adiponectin and pAMPK/pAKT that
affords protection against endothelial dysfunction resulting in improved vascular
function in the obese diabetic mouse. In addition, the present study is of
considerable interest from a clinical and basic science perspective, highlighting
the importance of L-4F as a means of reducing adipogenesis. L4F offers
potential as a therapeutic means, to address the metabolic derangements
associated with obesity, the metabolic syndrome and insulin resistant diabetes.
24
by on July 28, 2010 w
ww
.jlr.orgD
ownloaded from

ACKNOWLEDGEMENTS
This work was supported by NIH grants DK068134, HL55601 and
HL34300 (NGA) the Beatrice Renfield Foundation (AK), the CNR Medical
Department and Cardiopulmonary Project and the Scuola Sant’Anna. The
authors are indebted to Ms Daniele DeMarchi and Dr. Alessandro Pingipore for
their valuable help in the acquisition of MR data.
Send reprint requests to: Dr Attallah Kappas, The Rockefeller University, 1230
York Avenue, NY, NY 10021, Tel: 212-327-8494; Dr. Nader G. Abraham,
Professor of Pharmacology and Medicine, New York Medical College, Valhalla,
NY 10595, E-mail: [email protected]
25
by on July 28, 2010 w
ww
.jlr.orgD
ownloaded from

FIGURE LEGENDS
Figure 1: Effect of L-4F on body weight and visceral fat content in lean and ob
mice. A) Effect of L-4F administration on body appearance; B) Examples of
subcutaneous and visceral fat and C) Dissected fat from lean and ob mice.
Representative photographs showing one mouse from each group after 6 weeks
of treatment n=8.
Figure 2) Effect of L-4F treatment on Global SAT and VAT as measured by MRI.
Global fat was increased in ob mice compared to ob-L-4F-treated mice, * p<0.01,
n=3.
Figure 3) Effect of L-4F on gastrocnemius, muscle fibril diameter and muscle
weight. A) Hematoxylin Eosin staining of gastrocnemius and oil red O staining
within myofibril interstitial space in muscle cross section, small arrow indicates
extracellular fat deposit and large arrow indicates intracellular fat deposits. A-lean,
B-ob fat, C-ob fat L-4F. The mean diameter of myofibril of the lean versus obese
p<0.05; B) muscle fibril diameter, arrow indicates transverse cut muscle fibers
and C) muscle weight were measured as described in the methods section. The
results are expressed mean ± SE, n=4. D) oil red o muscle fat staining showing
increased staining in ob mice and not reduced by L-4F *p<0.005.
26
by on July 28, 2010 w
ww
.jlr.orgD
ownloaded from
Figure 4: A) Haematoxylin-eosin staining of subcutaneous (A) and visceral (B)
fat in ob and L-4F treated ob mice. Bar 50 μm. Quantitative analysis of adipocyte
size in subcutaneous fat and visceral fat surrounding the aorta of ob or L4F
treated ob mice are displayed. Data are expressed as means ± S.D. * P < 0.05
vs. ob.
Figure 5: A) Immunohistochemistry staining for CB-1 receptor of subcutaneous
fat (a-ob and b-ob-L-4F) and visceral fat surrounding aorta (c, obese and d,
obese-L-4F) of ob and L-4F treated ob mice. Arrows indicate CB-1
immunoreactivity. Bar.50 μm and B): Integrated optical density of CB-1
expression in subcutaneous fat and visceral fat surrounding aorta of ob or L-4F
treated ob mice is displayed. Data are expressed as means ± S.D. * P < 0.05 vs.
obese mice.
Figure 6: A) Immunohistochemistry staining for HO-1 of subcutaneous fat and
visceral fat surrounding aorta of ob or L-4F treated ob mice. Arrows indicate HO-
1 immunoreactivity. Bar.50 μm and B) Integrated optical density of HO-1
expression in subcutaneous fat and visceral fat surrounding aorta of ob or L-4F
treated ob mice. Data are expressed as means ± S.D. * P < 0.05 SAT and VAT.
27
by on July 28, 2010 w
ww
.jlr.orgD
ownloaded from

Figure 7. Effect of L-4F on percentage of fat in the liver of ob mice
measured by MRS. Analysis of lipid content and percent of fat increases was
calculated as described in the methods section, *p<0.01 vs. obese, n=3.
Figure 8. Effect of L-4F treatment on SREBP-1 measured by
Immunohistochemsitry in ob and lean mice. A positive SREBP-1 cytoplasmic
compartment staining is observed in the kidney of lean (A), ob (B) and ob mice
treated with L-4F (C). *p<0.04 ob vs. ob-L-4F, n=6. SREBP-1 increased in
nuclear compartments compared to lean. The increase in SREBP-1 was
decreased by treatment with L-4F (Magnification X 400).
Figure 9A and B. Effect of L-4F on insulin receptor phosphorylation. A)
Western blot and densitometry analysis of insulin receptor phosphorylation and
actin proteins in liver of lean, ob and ob-treated with L-4F and B) Effect of
diabetes and L-4F treatment on liver phosphorylation of insulin receptors (upper
panel) Tyr 972 and Tyr 1146. Quantitative densitometry evaluation of p-Tyr 972
and Tyr 1146 and actin proteins ratio was determined. Representative
Immunoblots are shown, (n= 5).
Figure 10 A and B. Effect of HO-1 expression on glucose tolerance and
pAMPK and Adiponectin. A) Effect of LY294002 (three times/week for three
weeks, administered by intraperitoneal injection on glucose tolerance (IPGTT)
tests in obese, L-4F-obese, were performed as described in the methods. The
28
by on July 28, 2010 w
ww
.jlr.orgD
ownloaded from

results are expressed mean ± SE, n=3 and B) Western blot of HO-1, adiponectin,
pAKT, pAMPK and actin proteins in kidney of ob, ob-treated with L-4F and ob-
treated with L-4F and LY294002. Representative Immunoblots are shown, (n= 4).
Figure 11: Effect of LY294002 on L-4F-mediated MSC-derived adipogenesis.
A) Adipogenesis was measured as the relative absorbance of oil red O at day 10
after inducing adipogenesis as described in Methods. Results are mean±SE,
n=4; *p<0.01 vs. control medium; #p<0.005 vs. high glucose. B) Measurement of
lipid droplet size. C) Scan of lipid size D) comparison of the number of small
lipids.
29
by on July 28, 2010 w
ww
.jlr.orgD
ownloaded from

REFERENCES
1. Navab, M., G. M. Anantharamaiah, S. T. Reddy, S. Hama, G. Hough, V. R.
Grijalva, A. C. Wagner, J. S. Frank, G. Datta, D. Garber, and A. M.
Fogelman. 2004. Oral D-4F causes formation of pre-beta high-density
lipoprotein and improves high-density lipoprotein-mediated cholesterol
efflux and reverse cholesterol transport from macrophages in
apolipoprotein E-null mice. Circulation 109: 3215-3220.
2. Navab, M., G. M. Ananthramaiah, S. T. Reddy, B. J. Van Lenten, B. J.
Ansell, G. C. Fonarow, K. Vahabzadeh, S. Hama, G. Hough, N.
Kamranpour, J. A. Berliner, A. J. Lusis, and A. M. Fogelman. 2004. The
oxidation hypothesis of atherogenesis: the role of oxidized phospholipids
and HDL. J. Lipid Res. 45: 993-1007.
3. Navab, M., G. M. Anantharamaiah, S. T. Reddy, B. J. Van Lenten, G.
Hough, A. Wagner, K. Nakamura, D. W. Garber, G. Datta, J. P. Segrest, S.
Hama, and A. M. Fogelman. 2003. Human apolipoprotein AI mimetic
peptides for the treatment of atherosclerosis. Curr. Opin. Investig. Drugs
4: 1100-1104.
4. Ou, Z., J. Ou, A. W. Ackerman, K. T. Oldham, and K. A. Pritchard, Jr.
2003. L-4F, an apolipoprotein A-1 mimetic, restores nitric oxide and
superoxide anion balance in low-density lipoprotein-treated endothelial
cells. Circulation 107: 1520-1524.
30
by on July 28, 2010 w
ww
.jlr.orgD
ownloaded from
5. Ou, J., Z. Ou, D. W. Jones, S. Holzhauer, O. A. Hatoum, A. W. Ackerman,
D. W. Weihrauch, D. D. Gutterman, K. Guice, K. T. Oldham, C. A. Hillery,
and K. A. Pritchard, Jr. 2003. L-4F, an apolipoprotein A-1 mimetic,
dramatically improves vasodilation in hypercholesterolemia and sickle cell
disease. Circulation 107: 2337-2341.
6. Kruger, A. L., S. Peterson, S. Turkseven, P. M. Kaminski, F. F. Zhang, S.
Quan, M. S. Wolin, and N. G. Abraham. 2005. D-4F induces heme
oxygenase-1 and extracellular superoxide dismutase, decreases
endothelial cell sloughing, and improves vascular reactivity in rat model of
diabetes. Circulation 111: 3126-3134.
7. Peterson, S. J., D. Husney, A. L. Kruger, R. Olszanecki, F. Ricci, L. F.
Rodella, A. Stacchiotti, R. Rezzani, J. A. McClung, W. S. Aronow, S.
Ikehara, and N. G. Abraham. 2007. Long-term treatment with the
apolipoprotein A1 mimetic Peptide increases antioxidants and vascular
repair in type I diabetic rats. J Pharmacol. Exp. Ther. 322: 514-520.
8. Morino, K., S. Neschen, S. Bilz, S. Sono, D. Tsirigotis, R. M. Reznick, I.
Moore, Y. Nagai, V. Samuel, D. Sebastian, M. White, W. Philbrick, and G.
I. Shulman. 2008. Muscle specific IRS-1 Ser->Ala transgenic mice are
protected from fat-induced insulin resistance in skeletal muscle. Diabetes.
9. Danial, N. N., L. D. Walensky, C. Y. Zhang, C. S. Choi, J. K. Fisher, A. J.
Molina, S. R. Datta, K. L. Pitter, G. H. Bird, J. D. Wikstrom, J. T. Deeney,
K. Robertson, J. Morash, A. Kulkarni, S. Neschen, S. Kim, M. E.
31
by on July 28, 2010 w
ww
.jlr.orgD
ownloaded from

Greenberg, B. E. Corkey, O. S. Shirihai, G. I. Shulman, B. B. Lowell, and
S. J. Korsmeyer. 2008. Dual role of proapoptotic BAD in insulin secretion
and beta cell survival. Nat. Med. 14: 144-153.
10. Wellen, K. E. and G. S. Hotamisligil. 2003. Obesity-induced inflammatory
changes in adipose tissue. J Clin. Invest 112: 1785-1788.
11. Weisberg, S. P., D. Hunter, R. Huber, J. Lemieux, S. Slaymaker, K. Vaddi,
I. Charo, R. L. Leibel, and A. W. Ferrante, Jr. 2006. CCR2 modulates
inflammatory and metabolic effects of high-fat feeding. J Clin. Invest 116:
115-124.
12. Li, M., D. H. Kim, P. L. Tsenovoy, S. J. Peterson, R. Rezzani, L. F.
Rodella, W. S. Aronow, S. Ikehara, and N. G. Abraham. 2008. Treatment
of obese diabetic mice with a heme oxygenase inducer reduces visceral
and subcutaneous adiposity, increases adiponectin levels, and improves
insulin sensitivity and glucose tolerance. Diabetes 57: 1526-1535.
13. Eckel, R. H., D. A. York, S. Rossner, V. Hubbard, I. Caterson, S. T. St
Jeor, L. L. Hayman, R. M. Mullis, and S. N. Blair. 2004. Prevention
Conference VII: Obesity, a worldwide epidemic related to heart disease
and stroke: executive summary. Circulation 110: 2968-2975.
14. Tounian, P., Y. Aggoun, B. Dubern, V. Varille, B. Guy-Grand, D. Sidi, J. P.
Girardet, and D. Bonnet. 2001. Presence of increased stiffness of the
32
by on July 28, 2010 w
ww
.jlr.orgD
ownloaded from

common carotid artery and endothelial dysfunction in severely obese
children: a prospective study. Lancet 358: 1400-1404.
15. Kruger, A. L., S. J. Peterson, M. L. Schwartzman, H. Fusco, J. A. McClung,
M. Weiss, S. Shenouda, A. I. Goodman, M. S. Goligorsky, A. Kappas, and
N. G. Abraham. 2006. Up-regulation of heme oxygenase provides
vascular protection in an animal model of diabetes through its antioxidant
and antiapoptotic effects. J Pharmacol. Exp. Ther. 319: 1144-1152.
16. Abraham NG and A. Kappas. 2008. Pharmacological and clinical aspects
of heme oxygenase. Pharmacol. Rev. 60: 79-127.
17. Steinberg, H. O., H. Chaker, R. Leaming, A. Johnson, G. Brechtel, and A.
D. Baron. 1996. Obesity/insulin resistance is associated with endothelial
dysfunction. Implications for the syndrome of insulin resistance. J. Clin.
Invest 97: 2601-2610.
18. Yudkin, J. S., M. Kumari, S. E. Humphries, and V. Mohamed-Ali. 2000.
Inflammation, obesity, stress and coronary heart disease: is interleukin-6
the link? Atherosclerosis 148: 209-214.
19. Zhang, F., J. I. Kaide, L. Yang, H. Jiang, S. Quan, R. Kemp, W. Gong, M.
Balazy, N. G. Abraham, and A. Nasjletti. 2004. CO modulates pulmonary
vascular response to acute hypoxia: relation to endothelin. Am. J Physiol
Heart Circ. Physiol 286: H137-H144.
33
by on July 28, 2010 w
ww
.jlr.orgD
ownloaded from

20. Porstmann, T., B. Griffiths, Y. L. Chung, O. Delpuech, J. R. Griffiths, J.
Downward, and A. Schulze. 2005. PKB/Akt induces transcription of
enzymes involved in cholesterol and fatty acid biosynthesis via activation
of SREBP. Oncogene 24: 6465-6481.
21. Osei-Hyiaman, D., M. DePetrillo, P. Pacher, J. Liu, S. Radaeva, S. Batkai,
J. Harvey-White, K. Mackie, L. Offertaler, L. Wang, and G. Kunos. 2005.
Endocannabinoid activation at hepatic CB1 receptors stimulates fatty acid
synthesis and contributes to diet-induced obesity. J Clin. Invest 115: 1298-
1305.
22. Di Noia, M. A., D. S. Van, F. Palmieri, L. M. Yang, S. Quan, A. I. Goodman,
and N. G. Abraham. 2006. Heme oxygenase-1 enhances renal
mitochondrial transport carriers and cytochrome C oxidase activity in
experimental diabetes. J Biol. Chem. 281: 15687-15693.
23. Li, M., S. Peterson, D. Husney, M. Inaba, K. Guo, E. Terada, T. Morita, K.
Patil, A. Kappas, S. Ikehara, and N. G. Abraham. 2007. Interdiction of the
diabetic state in NOD mice by sustained induction of heme oxygenase:
possible role of carbon monoxide and bilirubin. Antioxid. Redox Signal. 9:
855-863.
24. Zhang, Y., T. S. Lee, E. M. Kolb, K. Sun, X. Lu, F. M. Sladek, G. S.
Kassab, T. Garland, Jr., and J. Y. Shyy. 2006. AMP-activated protein
kinase is involved in endothelial NO synthase activation in response to
shear stress. Arterioscler. Thromb. Vasc. Biol. 26: 1281-1287.
34
by on July 28, 2010 w
ww
.jlr.orgD
ownloaded from
25. Fleming, I., C. Schulz, B. Fichtlscherer, B. E. Kemp, B. Fisslthaler, and R.
Busse. 2003. AMP-activated protein kinase (AMPK) regulates the insulin-
induced activation of the nitric oxide synthase in human platelets. Thromb.
Haemost. 90: 863-871.
26. Reihill, J. A., M. A. Ewart, D. G. Hardie, and I. P. Salt. 2007. AMP-
activated protein kinase mediates VEGF-stimulated endothelial NO
production. Biochem. Biophys. Res. Commun. 354: 1084-1088.
27. Fleming, I., B. Fisslthaler, M. Dixit, and R. Busse. 2005. Role of PECAM-1
in the shear-stress-induced activation of Akt and the endothelial nitric
oxide synthase (eNOS) in endothelial cells. J. Cell Sci. 118: 4103-4111.
28. Kim, D. H., A. P. Burgess, M. Li, P. L. Tsenovoy, F. Addabbo, J. A.
McClung, N. Puri, and N. G. Abraham. 2008. Heme oxygenase-mediated
increases in adiponectin decrease fat content and inflammatory cytokines,
tumor necrosis factor-alpha and interleukin-6 in Zucker rats and reduce
adipogenesis in human mesenchymal stem cells. J Pharmacol. Exp. Ther.
325: 833-40.
29. Peterson, S. J., G. Drummond, K. D. Hyun, M. Li, A. L. Kruger, S. Ikehara,
and N. G. Abraham. 2008. L-4F treatment reduces adiposity, increases
adiponectin levels and improves insulin sensitivity in obese mice. J Lipid
Res 49: 1658-1669.
35
by on July 28, 2010 w
ww
.jlr.orgD
ownloaded from
30. Sun, J. F., T. Phung, I. Shiojima, T. Felske, J. N. Upalakalin, D. Feng, T.
Kornaga, T. Dor, A. M. Dvorak, K. Walsh, and L. E. Benjamin. 2005.
Microvascular patterning is controlled by fine-tuning the Akt signal. Proc.
Natl. Acad. Sci. U. S. A 102: 128-133.
31. Sambuceti, G., S. Morbelli, L. Vanella, C. Kusmic, C. Marini, M. Massollo,
C. Augeri, M. Corselli, C. Ghersi, B. Chiavarina, L. Rodella, A. L'Abbate, G.
Drummond, N. G. Abraham, and F. Frassoni. 2009. Diabetes impairs the
vascular recruitment of normal stem cells by oxidant damage reversed by
increases in pAMPK, heme oxygenase-1 and adiponectin. Stem Cells
[Eahead of Pub].
32. Kovacic, S., C. L. Soltys, A. J. Barr, I. Shiojima, K. Walsh, and J. R. Dyck.
2003. Akt activity negatively regulates phosphorylation of AMP-activated
protein kinase in the heart. J. Biol. Chem. 278: 39422-39427.
33. Kronke, G., A. Kadl, E. Ikonomu, S. Bluml, A. Furnkranz, I. J. Sarembock,
V. N. Bochkov, M. Exner, B. R. Binder, and N. Leitinger. 2007. Expression
of heme oxygenase-1 in human vascular cells is regulated by peroxisome
proliferator-activated receptors. Arterioscler. Thromb. Vasc. Biol. 27:
1276-1282.
34. L'Abbate, A., D. Neglia, C. Vecoli, M. Novelli, V. Ottaviano, S. Baldi, R.
Barsacchi, A. Paolicchi, P. Masiello, G. Drummond, J. McClung, and N.
Abraham. 2007. Beneficial effect of heme oxygenase-1 expression in
36
by on July 28, 2010 w
ww
.jlr.orgD
ownloaded from
myocardial ischemia-reperfusion increases adiponectin in mildly diabetic
rats. Am. J. Phyisiol. Heart Circ. Physiol. 293: H3532-H3541.
35. Heinecke, J. W. 2006. Lipoprotein oxidation in cardiovascular disease:
chief culprit or innocent bystander? J. Exp. Med. 203: 813-816.
36. Oberle, S., A. Abate, N. Grosser, A. Hemmerle, H. J. Vreman, P. A.
Dennery, H. T. Schneider, D. Stalleicken, and H. Schroder. 2003.
Endothelial protection by pentaerithrityl trinitrate: bilirubin and carbon
monoxide as possible mediators. Exp. Biol. Med. (Maywood. ) 228: 529-
534.
37. Grosser, N., K. Erdmann, A. Hemmerle, G. Berndt, U. Hinkelmann, G.
Smith, and H. Schroder. 2004. Rosuvastatin upregulates the antioxidant
defense protein heme oxygenase-1. Biochem. Biophys. Res. Commun.
325: 871-876.
38. Grosser, N., A. Hemmerle, G. Berndt, K. Erdmann, U. Hinkelmann, S.
Schurgerc, N. Wijayanti, S. Immenschuh, and H. Schroder. 2004. The
antioxidant defense protein heme oxygenase 1 is a novel target for statins
in endothelial cells. Free Radic. Biol. Med. 37: 2064-2071.
39. Lee, T. S., C. C. Chang, Y. Zhu, and J. Y. Shyy. 2004. Simvastatin
induces heme oxygenase-1: a novel mechanism of vessel protection.
Circulation 110: 1296-1302.
37
by on July 28, 2010 w
ww
.jlr.orgD
ownloaded from
40. Navab, M., G. M. Anantharamaiah, S. Hama, D. W. Garber, M. Chaddha,
G. Hough, R. Lallone, and A. M. Fogelman. 2002. Oral administration of
an Apo A-I mimetic Peptide synthesized from D-amino acids dramatically
reduces atherosclerosis in mice independent of plasma cholesterol.
Circulation 105: 290-292.
41. Hu, L., J. Hofmann, and R. B. Jaffe. 2005. Phosphatidylinositol 3-kinase
mediates angiogenesis and vascular permeability associated with ovarian
carcinoma. Clin. Cancer Res 11: 8208-8212.
42. Positano, V., A. Gastaldelli, A. M. Sironi, M. F. Santarelli, M. Lombardi,
and L. Landini. 2004. An accurate and robust method for unsupervised
assessment of abdominal fat by MRI. J Magn Reson. Imaging 20: 684-689.
43. Demerath, E. W., K. J. Ritter, W. A. Couch, N. L. Rogers, G. M. Moreno, A.
Choh, M. Lee, K. Remsberg, S. A. Czerwinski, W. C. Chumlea, R. M.
Siervogel, and B. Towne. 2007. Validity of a new automated software
program for visceral adipose tissue estimation. Int. J Obes. (Lond) 31:
285-291.
44. Bonekamp, S., P. Ghosh, S. Crawford, S. F. Solga, A. Horska, F. L.
Brancati, A. M. Diehl, S. Smith, and J. M. Clark. 2008. Quantitative
comparison and evaluation of software packages for assessment of
abdominal adipose tissue distribution by magnetic resonance imaging. Int.
J Obes. (Lond) 32: 100-111.
38
by on July 28, 2010 w
ww
.jlr.orgD
ownloaded from

45. Novikoff, A. B., P. M. Novikoff, O. M. Rosen, and C. S. Rubin. 1980.
Organelle relationships in cultured 3T3-L1 preadipocytes. J Cell Biol. 87:
180-196.
46. Tondreau, T., N. Meuleman, A. Delforge, M. Dejeneffe, R. Leroy, M.
Massy, C. Mortier, D. Bron, and L. Lagneaux. 2005. Mesenchymal stem
cells derived from CD133-positive cells in mobilized peripheral blood and
cord blood: proliferation, Oct4 expression, and plasticity. Stem Cells 23:
1105-1112.
47. Salinas, M., R. Diaz, N. G. Abraham, C. M. Ruiz De Galarreta, and A.
Cuadrado. 2003. Nerve growth factor protects against 6-
hydroxydopamine-induced oxidative stress by increasing expression of
heme oxygenase-1 in a phosphatidylinositol 3-kinase-dependent manner.
J Biol. Chem. 278: 13898-13904.
48. Lee, R. H., B. Kim, I. Choi, H. Kim, H. S. Choi, K. Suh, Y. C. Bae, and J. S.
Jung. 2004. Characterization and expression analysis of mesenchymal
stem cells from human bone marrow and adipose tissue. Cell Physiol
Biochem. 14: 311-324.
49. Kim, J. Y., W. E. van de, M. Laplante, A. Azzara, M. E. Trujillo, S. M.
Hofmann, T. Schraw, J. L. Durand, H. Li, G. Li, L. A. Jelicks, M. F. Mehler,
D. Y. Hui, Y. Deshaies, G. I. Shulman, G. J. Schwartz, and P. E. Scherer.
2007. Obesity-associated improvements in metabolic profile through
expansion of adipose tissue. J Clin. Invest 117: 2621-2637.
39
by on July 28, 2010 w
ww
.jlr.orgD
ownloaded from

50. Kim, J. Y., W. E. van de, M. Laplante, A. Azzara, M. E. Trujillo, S. M.
Hofmann, T. Schraw, J. L. Durand, H. Li, G. Li, L. A. Jelicks, M. F. Mehler,
D. Y. Hui, Y. Deshaies, G. I. Shulman, G. J. Schwartz, and P. E. Scherer.
2007. Obesity-associated improvements in metabolic profile through
expansion of adipose tissue. J. Clin. Invest 117: 2621-2637.
51. Basu, R., U. B. Pajvani, R. A. Rizza, and P. E. Scherer. 2007. Selective
downregulation of the high molecular weight form of adiponectin in
hyperinsulinemia and in type 2 diabetes: differential regulation from
nondiabetic subjects. Diabetes 56: 2174-2177.
52. Williams, I. L., P. J. Chowienczyk, S. B. Wheatcroft, A. Patel, R. Sherwood,
A. Momin, A. M. Shah, and M. T. Kearney. 2006. Effect of fat distribution
on endothelial-dependent and endothelial-independent vasodilatation in
healthy humans. Diabetes Obes. Metab 8: 296-301.
53. Bastard, J. P., M. Maachi, J. T. Van Nhieu, C. Jardel, E. Bruckert, A.
Grimaldi, J. J. Robert, J. Capeau, and B. Hainque. 2002. Adipose tissue
IL-6 content correlates with resistance to insulin activation of glucose
uptake both in vivo and in vitro. J. Clin. Endocrinol. Metab 87: 2084-2089.
54. Maachi, M., L. Pieroni, E. Bruckert, C. Jardel, S. Fellahi, B. Hainque, J.
Capeau, and J. P. Bastard. 2004. Systemic low-grade inflammation is
related to both circulating and adipose tissue TNFalpha, leptin and IL-6
levels in obese women. Int. J. Obes. Relat Metab Disord. 28: 993-997.
40
by on July 28, 2010 w
ww
.jlr.orgD
ownloaded from
55. Hingorani, A. D., J. Cross, R. K. Kharbanda, M. J. Mullen, K. Bhagat, M.
Taylor, A. E. Donald, M. Palacios, G. E. Griffin, J. E. Deanfield, R. J.
MacAllister, and P. Vallance. 2000. Acute systemic inflammation impairs
endothelium-dependent dilatation in humans. Circulation 102: 994-999.
56. Muse, E. D., T. K. Lam, P. E. Scherer, and L. Rossetti. 2007.
Hypothalamic resistin induces hepatic insulin resistance. J Clin. Invest
117: 1670-1678.
57. Lazar, M. A. 2005. How obesity causes diabetes: not a tall tale. Science
307: 373-375.
58. Kondo, H., I. Shimomura, Y. Matsukawa, M. Kumada, M. Takahashi, M.
Matsuda, N. Ouchi, S. Kihara, T. Kawamoto, S. Sumitsuji, T. Funahashi,
and Y. Matsuzawa. 2002. Association of adiponectin mutation with type 2
diabetes: a candidate gene for the insulin resistance syndrome. Diabetes
51: 2325-2328.
59. Fasshauer, M., J. Klein, S. Neumann, M. Eszlinger, and R. Paschke. 2001.
Adiponectin gene expression is inhibited by beta-adrenergic stimulation
via protein kinase A in 3T3-L1 adipocytes. FEBS Lett 507: 142-146.
60. Bahia, L., L. G. Aguiar, N. Villela, D. Bottino, A. F. Godoy-Matos, B.
Geloneze, M. Tambascia, and E. Bouskela. 2006. Relationship between
adipokines, inflammation, and vascular reactivity in lean controls and
obese subjects with metabolic syndrome. Clinics. 61: 433-440.
41
by on July 28, 2010 w
ww
.jlr.orgD
ownloaded from

61. Han, S. H., M. J. Quon, J. A. Kim, and K. K. Koh. 2007. Adiponectin and
cardiovascular disease: response to therapeutic interventions. J Am. Coll.
Cardiol. 49: 531-538.
62. Fontana, L., J. C. Eagon, M. E. Trujillo, P. E. Scherer, and S. Klein. 2007.
Visceral fat adipokine secretion is associated with systemic inflammation
in obese humans. Diabetes 56: 1010-1013.
63. Iwashima, Y., T. Horio, Y. Suzuki, S. Kihara, H. Rakugi, K. Kangawa, T.
Funahashi, T. Ogihara, and Y. Kawano. 2006. Adiponectin and
inflammatory markers in peripheral arterial occlusive disease.
Atherosclerosis 188: 384-390.
64. Yamauchi, T., Y. Nio, T. Maki, M. Kobayashi, T. Takazawa, M. Iwabu, M.
Okada-Iwabu, S. Kawamoto, N. Kubota, T. Kubota, Y. Ito, J. Kamon, A.
Tsuchida, K. Kumagai, H. Kozono, Y. Hada, H. Ogata, K. Tokuyama, M.
Tsunoda, T. Ide, K. Murakami, M. Awazawa, I. Takamoto, P. Froguel, K.
Hara, K. Tobe, R. Nagai, K. Ueki, and T. Kadowaki. 2007. Targeted
disruption of AdipoR1 and AdipoR2 causes abrogation of adiponectin
binding and metabolic actions. Nat. Med. 13: 332-339.
65. Hardie, D. G. 2003. Minireview: the AMP-activated protein kinase
cascade: the key sensor of cellular energy status. Endocrinology 144:
5179-5183.
42
by on July 28, 2010 w
ww
.jlr.orgD
ownloaded from
66. Skurk, C., H. Maatz, H. S. Kim, J. Yang, M. R. Abid, W. C. Aird, and K.
Walsh. 2004. The Akt-regulated forkhead transcription factor FOXO3a
controls endothelial cell viability through modulation of the caspase-8
inhibitor FLIP. J Biol. Chem 279: 1513-1525.
67. Hardie, D. G. 2007. AMP-activated protein kinase as a drug target. Annu.
Rev. Pharmacol. Toxicol. 47: 185-210.
68. Kurth-Kraczek, E. J., M. F. Hirshman, L. J. Goodyear, and W. W. Winder.
1999. 5' AMP-activated protein kinase activation causes GLUT4
translocation in skeletal muscle. Diabetes 48: 1667-1671.
69. Stoppani, J., A. L. Hildebrandt, K. Sakamoto, D. Cameron-Smith, L. J.
Goodyear, and P. D. Neufer. 2002. AMP-activated protein kinase activates
transcription of the UCP3 and HKII genes in rat skeletal muscle. Am J
Physiol Endocrinol. Metab 283: E1239-E1248.
70. Duncan, E., P. Crossey, S. Walker, N. Anilkumar, L. Poston, G. Douglas,
V. Ezzat, S. Wheatcroft, A. M. Shah, and M. Kearney. 2008. The effect of
endothelium specific insulin resistance on endothelial function in vivo.
Diabetes.
71. Kawakami, A., M. Osaka, M. Tani, H. Azuma, F. M. Sacks, K. Shimokado,
and M. Yoshida. 2008. Apolipoprotein CIII links hyperlipidemia with
vascular endothelial cell dysfunction. Circulation 118: 731-742.
43
by on July 28, 2010 w
ww
.jlr.orgD
ownloaded from

72. Kearney, M. T., E. R. Duncan, M. Kahn, and S. B. Wheatcroft. 2008.
Insulin resistance and endothelial cell dysfunction: studies in mammalian
models. Exp. Physiol 93: 158-163.
73. Ouchi, N., H. Kobayashi, S. Kihara, M. Kumada, K. Sato, T. Inoue, T.
Funahashi, and K. Walsh. 2004. Adiponectin stimulates angiogenesis by
promoting cross-talk between AMP-activated protein kinase and Akt
signaling in endothelial cells. J Biol. Chem. 279: 1304-1309.
74. Ouchi, N., R. Shibata, and K. Walsh. 2006. Cardioprotection by
adiponectin. Trends Cardiovasc. Med. 16: 141-146.
75. Schulz, E., J. Dopheide, S. Schuhmacher, S. R. Thomas, K. Chen, A.
Daiber, P. Wenzel, T. Munzel, and J. F. Keaney, Jr. 2008. Suppression of
the JNK pathway by induction of a metabolic stress response prevents
vascular injury and dysfunction. Circulation 118: 1347-1357.
76. Chen, K., M. T. Kirber, H. Xiao, Y. Yang, and J. F. Keaney, Jr. 2008.
Regulation of ROS signal transduction by NADPH oxidase 4 localization. J.
Cell Biol. 181: 1129-1139.
77. Murabito, J. M., M. J. Keyes, C. Y. Guo, J. F. Keaney, Jr., R. S. Vasan, R.
B. D'Agostino, Sr., and E. J. Benjamin. 2008. Cross-sectional relations of
multiple inflammatory biomarkers to peripheral arterial disease: The
Framingham Offspring Study. Atherosclerosis.
44
by on July 28, 2010 w
ww
.jlr.orgD
ownloaded from

Lean Lean-L-4F Obese Obese-L-4FFig 1
(B)
(C)
(A)
by on July 28, 2010 www.jlr.org Downloaded from

Control obese
ObeseL-4F
SAT VAT
0
5
10
15
20
obese Obese-L-4F
Glo
bal V
AT
*
TRANSVERSE SECTION
Fig 2
01020
304050
obese Obese-L-4F
Glo
bal S
AT
*
by on July 28, 2010 www.jlr.org Downloaded from
Lean Obese Obese-L-4F
50 µm
HEMATOXYLIN EOSIN STAINING (20X)
OIL REDSTAINING (20X)
* *
051015202530
Lean Obese ObeseL-4F
Oil
Red
O m
uscl
e fa
t sta
inin
g
*
0100200300400500
Lean Obese ObeseL-4F
Mus
cle
wei
ght (
mg)
(A)
(B) (C)
35
0102030405060
Lean Obese ObeseL-4F
Mus
cle
fiber
diam
eter
(mic
ron)
Fig 3
(D)
by on July 28, 2010 www.jlr.org Downloaded from

50 μm
Adipocyte size of Subcutaneous and Visceral Fat
0
10
20
30
40
50
60
Obese L-4F
Adi
pocy
te s
ize
(mm
2X1
00) ∗
05
1015202530354045
Adi
pocy
te s
ize
(mm
2 X1
00)
Obese L-4F
∗Visceral aorta
Fat L-4F
Fig 4
Subcutaneous Fat
Subcutaneous Fat L-4F
Visceral aortaFat
A
B
by on July 28, 2010 www.jlr.org Downloaded from

SAT SAT-L-4F
Bar. 50 μm
a bVAT VAT-L-4F
c d
0
200
400
600
800
Obese-SAT Obese-SAT-L-4F
CB
1 IO
D in
SA
T
*C
B1
IOD
in V
AT
0200400600800
1000
Obese-VAT Obese-L-4F-VAT
*
Fig 5
A
B
by on July 28, 2010 www.jlr.org Downloaded from

50 um0
1020304050607080
Obese L-4F
*
HO
-1 IO
D (V
AT)
SAT SAT- L4F
VAT VAT- L4F
Fig 6
020406080
100120140
Obese L-4F
*H
O-1
IOD
(SA
T)
A B
by on July 28, 2010 www.jlr.org Downloaded from

Lean
Obese
Obese-L-4F
05
101520253035404550
Lean Obese Obese-L-4F
% F
at in
Liv
er
*
Fig 7
by on July 28, 2010 www.jlr.org Downloaded from

SREBP-1
C
B
A
00.51.01.52.02.53.0
% n
ucle
ar e
xpre
ssio
n
lean obese L-4F
*
#
05
1015202530
% c
ytop
lasm
icex
pres
sion
lean obese L-4F
N.S. N.S.
Fig 8
by on July 28, 2010 www.jlr.org Downloaded from
IR p-Tyr 972
IR p-Tyr 1146
β-actin
0
0.1
0.2
0.3
0.4
0.5
0.6
0.7
Lean OB OB + L-4F
p-Ty
r 972
/β-a
ctin
Rel
ativ
e O
ptic
al D
ensi
ty
p<0.05 p<0.01
00.1
0.20.30.4
0.50.6
0.7
Lean OB OB + L-4F
p-Ty
r 114
6/β-
actin
Rel
ativ
e O
ptic
al D
ensi
ty
p<0.05 p<0.01
Lean OB OB + L-4F
Fig 9A
B
by on July 28, 2010 www.jlr.org Downloaded from
0100200300400500600700
0 30 60 75 90
Glu
cose
mg/
dl
Control
Obese-L-4F
Obese-L-4F-LY294002
IPGTT
0100200300400500600700
0 30 60 120
Obese
Obese-L-4F
Minutes
Glu
cose
(mg/
dl)
* * ** *
** ** ** ** **
** **** **
Minutes
Fig. 10 A
by on July 28, 2010 www.jlr.org Downloaded from
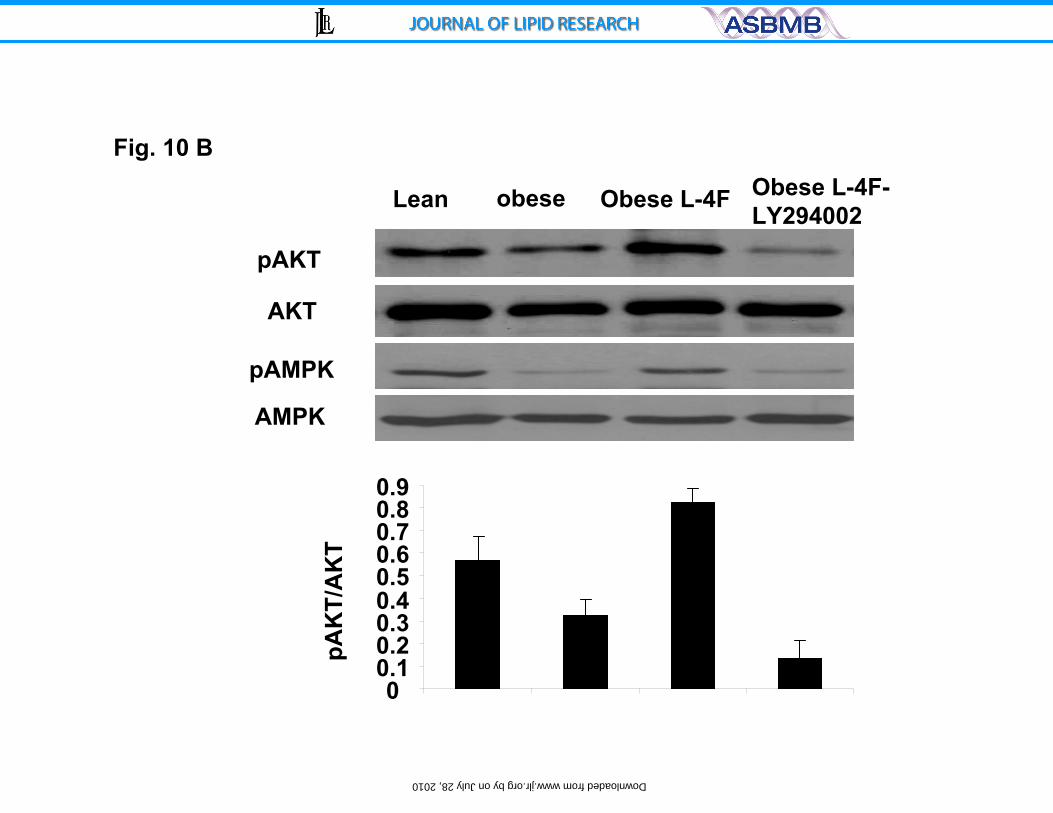
Fig. 10 B
AMPK
Lean obese Obese L-4F-LY294002
Obese L-4F
pAMPK
pAKT
AKT
00.10.20.30.40.50.60.70.80.9
pAK
T/A
KT
by on July 28, 2010 www.jlr.org Downloaded from

Fig 11
L-4FLY294002
LY294002
OD
=490
OIL
RED
O
00.010.020.030.040.050.060.07
Control L-4F
*
Control L-4F
LY2940002 L-4F-LY2940002
A
Control
L-4FLY2940002
L-4F
P<0.03
020406080
100120140
Control LY294002
L-4F-LY294002
L-4F
Num
ber o
f Sm
all L
ipid
Dro
plet
s
B
C
D
by on July 28, 2010 www.jlr.org Downloaded from