app builder debugging applications
TRANSCRIPT
8/14/2019 App Builder Debugging Applications
http://slidepdf.com/reader/full/app-builder-debugging-applications 1/88
BluePhoenix A ppBuilder 2.1 .0.
Debugging A pplicat ions Guide

8/14/2019 App Builder Debugging Applications
http://slidepdf.com/reader/full/app-builder-debugging-applications 2/88
BluePhoenix AppBuilder 2.1.0.Document TitleApril, 2003
Corporate HeadquartersBluePhoenix Solutions
Vlierwerf 7B4704 SB RoosendaalThe Netherlands+31 (0) 165 399 401+31 (0) 165 396 308 fax
USA HeadquartersBluePhoenix Solutions USA, Inc.8000 Regency ParkwayCary, NC 27511United States+1 919.380.5100+1 919.380.5111 fax
www.bluephoenixsolutions.com
© 1992-2003 BluePhoenix Solutions
All rights reserved.
BluePhoenix is a trademark of BluePhoenix Solutions. All other product and company namesmentioned herein are for identification purposes only and are the property of, and may be trademarksof, their respective owners.
Portions of this product may be covered by U.S. Patent Numbers 5,495,222 and 5,495,610 and variousother non-U.S. patents.The software supplied with this document is the property of BluePhoenix Solutions, and is furnishedunder a license agreement. Neither the software nor this document may be copied or transferred by anymeans, electronic or mechanical, except as provided in the licensing agreement.
BluePhoenix Solutions has made every effort to ensure that the information contained in this documentis accurate; however, there are no representations or warranties regarding this information, includingwarranties of merchantability or fitness for a particular purpose. BluePhoenix Solutions assumes noresponsibi li ty for errors or omissions that may occur in this document. The information in thisdocument is subject to change without prior notice and does not represent a commitment byBluePhoenix Solutions or its representatives.
8/14/2019 App Builder Debugging Applications
http://slidepdf.com/reader/full/app-builder-debugging-applications 3/88
Table of Contents i
TABLE OFCONTENTS
Table of Contents
AppBuilder 2.1.0 Debugging Applications Guide
1 Int roduct ion . . . . . . . . . . . . . . . . . . . . . . . . . . . . . . . . . . . . . . . . . . . . . . . . . . . . . . . . . . . . . . . . . . . . . . . . . . 1-1
RuleView Start Sett ings . . . . . . . . . . . . . . . . . . . . . . . . . . . . . . . . . . . . . . . . . . . . . . . . . . . . . . . . . . . . . . . . . 1-2
2 Debugging Java Applicat ions . . . . . . . . . . . . . . . . . . . . . . . . . . . . . . . . . . . . . . . . . . . . . . . . 2-1
Installing RuleView . . . . . . . . . . . . . . . . . . . . . . . . . . . . . . . . . . . . . . . . . . . . . . . . . . . . . . . . . . . . . . . . . . . . 2-1
Running RuleView . . . . . . . . . . . . . . . . . . . . . . . . . . . . . . . . . . . . . . . . . . . . . . . . . . . . . . . . . . . . . . . . . . . . . 2-1
Understanding the RuleView Interface . . . . . . . . . . . . . . . . . . . . . . . . . . . . . . . . . . . . . . . . . . . . . . . . . . . . 2-5Terminology . . . . . . . . . . . . . . . . . . . . . . . . . . . . . . . . . . . . . . . . . . . . . . . . . . . . . . . . . . . . . . . . . . . . . . 2-6Pull-down Menu . . . . . . . . . . . . . . . . . . . . . . . . . . . . . . . . . . . . . . . . . . . . . . . . . . . . . . . . . . . . . . . . . . 2-8Toolbar . . . . . . . . . . . . . . . . . . . . . . . . . . . . . . . . . . . . . . . . . . . . . . . . . . . . . . . . . . . . . . . . . . . . . . . . . . 2-9Rule Hierarchy . . . . . . . . . . . . . . . . . . . . . . . . . . . . . . . . . . . . . . . . . . . . . . . . . . . . . . . . . . . . . . . . . . . 2-10View Hierarchy . . . . . . . . . . . . . . . . . . . . . . . . . . . . . . . . . . . . . . . . . . . . . . . . . . . . . . . . . . . . . . . . . . . 2-10Rule Source Code Listing . . . . . . . . . . . . . . . . . . . . . . . . . . . . . . . . . . . . . . . . . . . . . . . . . . . . . . . . . . 2-12Output Panel . . . . . . . . . . . . . . . . . . . . . . . . . . . . . . . . . . . . . . . . . . . . . . . . . . . . . . . . . . . . . . . . . . . . 2-13Status Bar . . . . . . . . . . . . . . . . . . . . . . . . . . . . . . . . . . . . . . . . . . . . . . . . . . . . . . . . . . . . . . . . . . . . . . . 2-14Look and Feel . . . . . . . . . . . . . . . . . . . . . . . . . . . . . . . . . . . . . . . . . . . . . . . . . . . . . . . . . . . . . . . . . . . . 2-14RuleView Actions . . . . . . . . . . . . . . . . . . . . . . . . . . . . . . . . . . . . . . . . . . . . . . . . . . . . . . . . . . . . . . . . . 2-15
Debugging Rules with RuleView . . . . . . . . . . . . . . . . . . . . . . . . . . . . . . . . . . . . . . . . . . . . . . . . . . . . . . . . 2-16Starting to Debug . . . . . . . . . . . . . . . . . . . . . . . . . . . . . . . . . . . . . . . . . . . . . . . . . . . . . . . . . . . . . . . . . 2-17Pausing Execution . . . . . . . . . . . . . . . . . . . . . . . . . . . . . . . . . . . . . . . . . . . . . . . . . . . . . . . . . . . . . . . . 2-18Viewing and Modifying Variables . . . . . . . . . . . . . . . . . . . . . . . . . . . . . . . . . . . . . . . . . . . . . . . . . . . 2-18Data Actions . . . . . . . . . . . . . . . . . . . . . . . . . . . . . . . . . . . . . . . . . . . . . . . . . . . . . . . . . . . . . . . . . . . . . 2-21Saving and Restoring a View . . . . . . . . . . . . . . . . . . . . . . . . . . . . . . . . . . . . . . . . . . . . . . . . . . . . . . . . 2-22Using a Breakpoint . . . . . . . . . . . . . . . . . . . . . . . . . . . . . . . . . . . . . . . . . . . . . . . . . . . . . . . . . . . . . . . . 2-23Using a Watchpoint . . . . . . . . . . . . . . . . . . . . . . . . . . . . . . . . . . . . . . . . . . . . . . . . . . . . . . . . . . . . . . . 2-26Stepping . . . . . . . . . . . . . . . . . . . . . . . . . . . . . . . . . . . . . . . . . . . . . . . . . . . . . . . . . . . . . . . . . . . . . . . . . 2-29Handling Exceptions . . . . . . . . . . . . . . . . . . . . . . . . . . . . . . . . . . . . . . . . . . . . . . . . . . . . . . . . . . . . . . 2-29Processing Multiple Threads . . . . . . . . . . . . . . . . . . . . . . . . . . . . . . . . . . . . . . . . . . . . . . . . . . . . . . . . 2-30
Troubleshooting . . . . . . . . . . . . . . . . . . . . . . . . . . . . . . . . . . . . . . . . . . . . . . . . . . . . . . . . . . . . . . . . . . . . . . 2-31
8/14/2019 App Builder Debugging Applications
http://slidepdf.com/reader/full/app-builder-debugging-applications 4/88
ii AppBuilder 2.1.0 Debugging Applications Guide
3 D ebugging C A pplicat ions . . . . . . . . . . . . . . . . . . . . . . . . . . . . . . . . . . . . . . . . . . . . . . . . . . . . 3-1
Running RuleView . . . . . . . . . . . . . . . . . . . . . . . . . . . . . . . . . . . . . . . . . . . . . . . . . . . . . . . . . . . . . . . . . . . . 3-1Getting Ready to Debug . . . . . . . . . . . . . . . . . . . . . . . . . . . . . . . . . . . . . . . . . . . . . . . . . . . . . . . . . . . . 3-2Starting RuleView . . . . . . . . . . . . . . . . . . . . . . . . . . . . . . . . . . . . . . . . . . . . . . . . . . . . . . . . . . . . . . . . . 3-3Exit ing RuleView . . . . . . . . . . . . . . . . . . . . . . . . . . . . . . . . . . . . . . . . . . . . . . . . . . . . . . . . . . . . . . . . . . 3-3
Understanding the RuleView Interface . . . . . . . . . . . . . . . . . . . . . . . . . . . . . . . . . . . . . . . . . . . . . . . . . . . . 3-4Pull-down Menu . . . . . . . . . . . . . . . . . . . . . . . . . . . . . . . . . . . . . . . . . . . . . . . . . . . . . . . . . . . . . . . . . . 3-5Toolbar . . . . . . . . . . . . . . . . . . . . . . . . . . . . . . . . . . . . . . . . . . . . . . . . . . . . . . . . . . . . . . . . . . . . . . . . . . 3-6Process Selector, Rule Stack, and Search . . . . . . . . . . . . . . . . . . . . . . . . . . . . . . . . . . . . . . . . . . . . . . . 3-6Window Areas . . . . . . . . . . . . . . . . . . . . . . . . . . . . . . . . . . . . . . . . . . . . . . . . . . . . . . . . . . . . . . . . . . . . 3-6Status Bar . . . . . . . . . . . . . . . . . . . . . . . . . . . . . . . . . . . . . . . . . . . . . . . . . . . . . . . . . . . . . . . . . . . . . . . . 3-8RuleView Actions . . . . . . . . . . . . . . . . . . . . . . . . . . . . . . . . . . . . . . . . . . . . . . . . . . . . . . . . . . . . . . . . . . 3-8
Debugging with RuleView . . . . . . . . . . . . . . . . . . . . . . . . . . . . . . . . . . . . . . . . . . . . . . . . . . . . . . . . . . . . . . 3-9Finding and Viewing Rule Source . . . . . . . . . . . . . . . . . . . . . . . . . . . . . . . . . . . . . . . . . . . . . . . . . . . . 3-9Edit ing Contents of a Value . . . . . . . . . . . . . . . . . . . . . . . . . . . . . . . . . . . . . . . . . . . . . . . . . . . . . . . . . 3-9Stepping Through a Rule . . . . . . . . . . . . . . . . . . . . . . . . . . . . . . . . . . . . . . . . . . . . . . . . . . . . . . . . . . 3-10Tracing the Execution . . . . . . . . . . . . . . . . . . . . . . . . . . . . . . . . . . . . . . . . . . . . . . . . . . . . . . . . . . . . . 3-10
Using Action Points . . . . . . . . . . . . . . . . . . . . . . . . . . . . . . . . . . . . . . . . . . . . . . . . . . . . . . . . . . . . . . . 3-11Setting and Clearing a Breakpoint . . . . . . . . . . . . . . . . . . . . . . . . . . . . . . . . . . . . . . . . . . . . . . . . . . . 3-11Restrictions . . . . . . . . . . . . . . . . . . . . . . . . . . . . . . . . . . . . . . . . . . . . . . . . . . . . . . . . . . . . . . . . . . . . . . 3-14Setting and Clearing a Skippoint . . . . . . . . . . . . . . . . . . . . . . . . . . . . . . . . . . . . . . . . . . . . . . . . . . . . 3-15
RuleView Window Sett ings (C Only) . . . . . . . . . . . . . . . . . . . . . . . . . . . . . . . . . . . . . . . . . . . . . . . . . . . . 3-16
4 Debugging Dist r ibuted (Remote) Appl icat ions . . . . . . . . . . . . . . . . . . . . . . 4-1
Debugging in a Distributed Application . . . . . . . . . . . . . . . . . . . . . . . . . . . . . . . . . . . . . . . . . . . . . . . . . . . 4-2
Distr ibuted RuleView Commands . . . . . . . . . . . . . . . . . . . . . . . . . . . . . . . . . . . . . . . . . . . . . . . . . . . . . . . . 4-3
Configuring Distributed RuleView . . . . . . . . . . . . . . . . . . . . . . . . . . . . . . . . . . . . . . . . . . . . . . . . . . . . . . . 4-4
Adding and Editing Breakpoints . . . . . . . . . . . . . . . . . . . . . . . . . . . . . . . . . . . . . . . . . . . . . . . . . . . . . . . . . 4-5
5 Debugging Batch Applicat ions . . . . . . . . . . . . . . . . . . . . . . . . . . . . . . . . . . . . . . . . . . . . . . 5-1
Batch RuleView Commands and Function Keys . . . . . . . . . . . . . . . . . . . . . . . . . . . . . . . . . . . . . . . . . . . . 5-2
Batch RuleView Panels . . . . . . . . . . . . . . . . . . . . . . . . . . . . . . . . . . . . . . . . . . . . . . . . . . . . . . . . . . . . . . . . . 5-3
Breakpoint Display . . . . . . . . . . . . . . . . . . . . . . . . . . . . . . . . . . . . . . . . . . . . . . . . . . . . . . . . . . . . . . . . . . . . 5-4
View Display . . . . . . . . . . . . . . . . . . . . . . . . . . . . . . . . . . . . . . . . . . . . . . . . . . . . . . . . . . . . . . . . . . . . . . . . . 5-5
Field Display . . . . . . . . . . . . . . . . . . . . . . . . . . . . . . . . . . . . . . . . . . . . . . . . . . . . . . . . . . . . . . . . . . . . . . . . . . 5-6
Save Display . . . . . . . . . . . . . . . . . . . . . . . . . . . . . . . . . . . . . . . . . . . . . . . . . . . . . . . . . . . . . . . . . . . . . . . . . . 5-7
Data Display . . . . . . . . . . . . . . . . . . . . . . . . . . . . . . . . . . . . . . . . . . . . . . . . . . . . . . . . . . . . . . . . . . . . . . . . . . 5-8
Source Code Display . . . . . . . . . . . . . . . . . . . . . . . . . . . . . . . . . . . . . . . . . . . . . . . . . . . . . . . . . . . . . . . . . . . 5-9
8/14/2019 App Builder Debugging Applications
http://slidepdf.com/reader/full/app-builder-debugging-applications 5/88
Table of Contents iii
6 Debugging CICS and IMS Applicat ions . . . . . . . . . . . . . . . . . . . . . . . . . . . . . . . . . 6-1
Mainframe RuleView Panels . . . . . . . . . . . . . . . . . . . . . . . . . . . . . . . . . . . . . . . . . . . . . . . . . . . . . . . . . . . . . 6-2
Mainframe RuleView Commands and Function Keys . . . . . . . . . . . . . . . . . . . . . . . . . . . . . . . . . . . . . . . . 6-2
Rule Selection List: HPR0 . . . . . . . . . . . . . . . . . . . . . . . . . . . . . . . . . . . . . . . . . . . . . . . . . . . . . . . . . . . . . . . 6-3
Mainframe RuleView Breakpoint Selection . . . . . . . . . . . . . . . . . . . . . . . . . . . . . . . . . . . . . . . . . . . . . . . . 6-4Mainframe RuleView Source Code Display . . . . . . . . . . . . . . . . . . . . . . . . . . . . . . . . . . . . . . . . . . . . . . . . 6-4
Mainframe RuleView View Display . . . . . . . . . . . . . . . . . . . . . . . . . . . . . . . . . . . . . . . . . . . . . . . . . . . . . . . 6-5Compacted and Expanded Modes . . . . . . . . . . . . . . . . . . . . . . . . . . . . . . . . . . . . . . . . . . . . . . . . . . . . 6-5Other View Display Commands . . . . . . . . . . . . . . . . . . . . . . . . . . . . . . . . . . . . . . . . . . . . . . . . . . . . . . 6-7
Mainframe RuleView Test Data Maintenance . . . . . . . . . . . . . . . . . . . . . . . . . . . . . . . . . . . . . . . . . . . . . . 6-7
Mainframe RuleView Test Data Input . . . . . . . . . . . . . . . . . . . . . . . . . . . . . . . . . . . . . . . . . . . . . . . . . . . . . 6-8
Index
8/14/2019 App Builder Debugging Applications
http://slidepdf.com/reader/full/app-builder-debugging-applications 6/88
iv AppBuilder 2.1.0 Debugging Applications Guide
8/14/2019 App Builder Debugging Applications
http://slidepdf.com/reader/full/app-builder-debugging-applications 7/88
AppBuilder 2.1.0 Debugging Applications Guide 1-1
CHAPTER
1INTRODUCTION
AppBuilder 2.1.0 Debugging Applications Guide
Debugging is the process of finding and fixing execution time errors (when the application attempts toperform a prohibited task) and design logic errors (with correct code but not what was intended). Whenthe application is executed, it can be monitored and debugged one statement at a time with the help ofthe AppBuilder debugger called RuleView. With a few optional settings, the debugger can startautomatically when the application is executed. This guide explains how to use the RuleView debuggersfor debugging an application.
You can examine the contents of the views attached to your rules, set breakpoints, skippoints, andwatchpoints (depending on whether you are working in C or Java), and look at the value of variables asyou step through execution one statement at a time. There are two versions of the RuleView debugger,one for C and one for Java, with only slight differences between them. Each version of the RuleViewdebugger is given its own section:
Chapter 2, “Debugging Java Appli cations”
• Chapter 3, “Debugging C Applications”
Prerequisites include basic application development experience and familiarity with MicrosoftWindows. The readership of this guide would include consultants and customers who understanddistr ibuted environments and who would be famili ar with the concepts of distr ibuted applicati ons, butmay not know how to implement these types of applications with the BluePhoenix AppBuilder product.Some experience with debugging applications is assumed.
Debugging Distributed Applications
RuleView supports distr ibuted applications debugging. No addit ional modules or configurati on i srequired to enable this feature. You should start the main rule on the client as usual, and AppBuilderrun-time support and RuleView take care of remote calls. Such calls look as if they are simple localsubrule call s.

8/14/2019 App Builder Debugging Applications
http://slidepdf.com/reader/full/app-builder-debugging-applications 8/88
1-2 Introduction
RuleView Start Settings
RuleView Start Settings
To use RuleView debugger, you must set a value in the initiali zation (INI) fi le for the ConstructionWorkbench. For the Java version, the operational setting is DEBUG_START in the TEST section of theappbuilder.ini fi le (located in the JAVA/RT directory of your AppBuilder installation). For theC version, the operati onal setting is HPSRT_DEBUG_START in the AE Runt ime section of thehps.ini file (in the directory where AppBuilder is installed). The values, the same for both settings,are QUERY, TRUE, or FALSE.
If set to QUERY, which is the default, the system prompts you and allows you decide whether to startRuleView when the application is run. If you select QUERY, the dialog box allows you to choose to startRuleView or not.
If set to TRUE, the system always starts RuleView when the application is run, without asking.
If set to FALSE, the system does not start RuleView when the application i s run. This setting is always seton production client workstations. These sett ings work whether you start the application from theConstruction Workbench or start it directly.

8/14/2019 App Builder Debugging Applications
http://slidepdf.com/reader/full/app-builder-debugging-applications 9/88
AppBuilder 2.1.0 Debugging Applications Guide 2-1
CHAPTER
2DEBUGGING JA VA APPLICATIONS
AppBuilder 2.1.0 Debugging Applications Guide
You can debug your Java applicati on locally with AppBuilder RuleView for Java. This section explainsthe available functions in the RuleView interface for Java application development. Before debugging theapplication, be sure to verify the syntax and logic of the individual rules and solve any preparationproblems. The process of verification is explained in the Developing Applicati ons Guide and thetroubleshooting section cover preparation problems in the Deploying Applications Guide . This sectiondiscusses using RuleView for Java to look at rules deployed as Java applications. For information ondebugging C applications, refer to Chapter 3, “Debugging C Applications” .(There are differencesbetween the RuleView for Java and the RuleView for C.)
The basic steps in using RuleView for Java are:
• Installing RuleView
• Running RuleView
• Understanding the RuleView Interface
• Debugging Rules with RuleView
• Troubleshooting
Installing RuleView The RuleView for Java source debugger is built on top of the Java Platform Debugger Architecture(JPDA) from Sun Microsystems and it requires that the JPDA be installed on the developmentworkstation. Make sure you have the following prerequisites:
1. The Java development ki t (JDK) version 1.3 or higher from Sun Microsystems must be installed onyour machine.
2. The Java Platform Debugger Architecture (JPDA) version 1.0 is required to run RuleView.
3. For JDK 1.3, you should add jdk1.3\l ib\ tools.jar in your CLASSPATH environment variable.
Running RuleViewAfter creating, verifying, and preparing rules, debug the application using RuleView. To set RuleView torun automatically, be sure the settings are correct i n the Construction Workbench, asdescribed in“Getting Ready to Debug” . When you are ready to execute the program in debug mode, refer to“Starting RuleView” . To exit the debugger or the application, refer to “Exit ing RuleView” .
8/14/2019 App Builder Debugging Applications
http://slidepdf.com/reader/full/app-builder-debugging-applications 10/88
2-2 Debugging Java Applications
Running RuleView
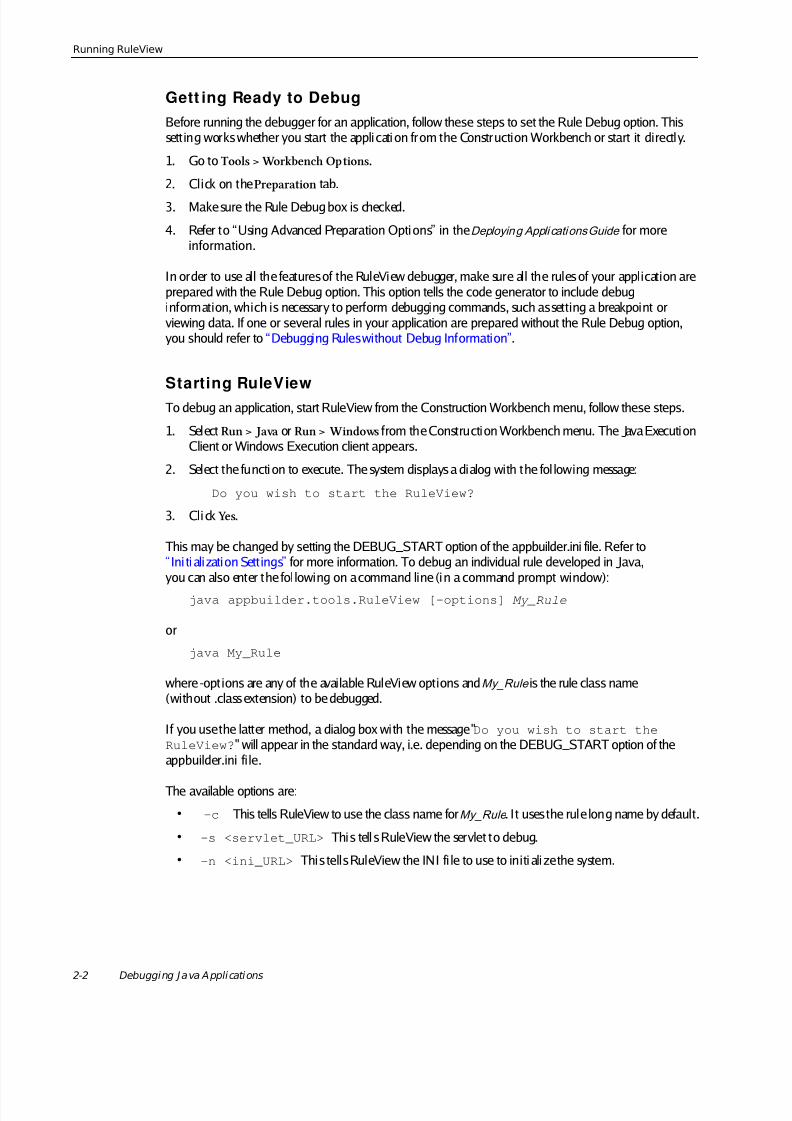
Gett ing Ready to DebugBefore running the debugger for an application, follow these steps to set the Rule Debug option. Thissett ing works whether you start the applicati on from the Construction Workbench or start it directly.
1. Go to Tools > Workbench Options .
2. Click on the Preparation tab.
3. Make sure the Rule Debug box is checked.
4. Refer to “Using Advanced Preparation Options” in the Deploying Appli cations Guide for moreinformation.
In order to use all the features of the RuleView debugger, make sure all the rules of your application areprepared with the Rule Debug option. This option tells the code generator to include debuginformation, which is necessary to perform debugging commands, such as setting a breakpoint orviewing data. If one or several rules in your application are prepared without the Rule Debug option,you should refer to “Debugging Rules without Debug Information” .
Starting RuleViewTo debug an application, start RuleView from the Construction Workbench menu, follow these steps.
1. Select Run > Java or Run > Windows from the Construction Workbench menu. The Java ExecutionClient or Windows Execution client appears.
2. Select the function to execute. The system displays a dialog with the fol lowing message:
Do you wish to start the RuleView?
3. Cli ck Yes.
This may be changed by setting the DEBUG_START option of the appbuilder.ini file. Refer to“Ini tialization Sett ings” for more information. To debug an individual rule developed in Java,you can also enter the fol lowing on a command line (in a command prompt window):
java appbuilder.tools.RuleView [-options] My_Rule
or
java My_Rule
where -opt ions are any of the available RuleView options and My_Rule is the rule class name(without .class extension) to be debugged.
If you use the latter method, a dialog box with the message " Do you wish to start theRuleView? " will appear in the standard way, i.e. depending on the DEBUG_START option of theappbuilder.ini file.
The available options are:
• -c This tells RuleView to use the class name for My_Rule . It uses the rule long name by default.
• -s <servlet_URL> This tell s RuleView the servlet to debug.
• -n <ini_URL> This tells RuleView the INI fi le to use to initi alize the system.
8/14/2019 App Builder Debugging Applications
http://slidepdf.com/reader/full/app-builder-debugging-applications 11/88
Running RuleView
AppBuilder 2.1.0 Debugging Applications Guide 2-3
Saving and Restoring SettingsCurrently RuleView can store debug session information and several user interface settings. To savesettings, use File > Save Settings Now or File > Save Settings on Exit menu items.
User interface settings are somewhat global; one settings file is saved for a user (if your operating systemssupports different home directories for different users, such as Window NT does, for example).RuleView settings are stored in a file named ruleview.ini in your user directory. Window location,window size, and other parameters can be stored and loaded automatically upon start.
Debug session information currently includes breakpoints that were set during the session andexceptions at which you want the program to break. Invalid breakpoints (out of date ones) are removedautomatically. While interface settings are saved only by request (Save Settings Now or Save Settings onExit), debug session information i s saved each time you exit RuleView and restored each time it is started
on the same main rule.
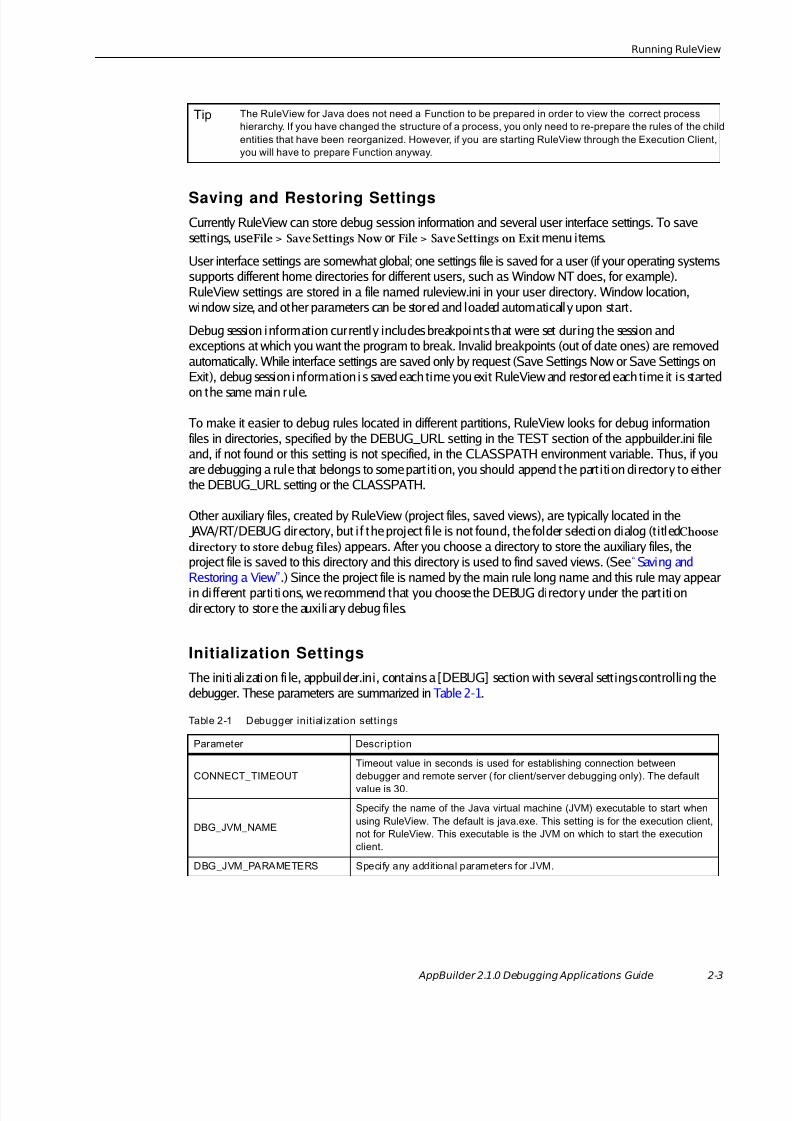
To make it easier to debug rules located in different partitions, RuleView looks for debug informationfiles in directories, specified by the DEBUG_URL setting in the TEST section of the appbuilder.ini fileand, if not found or this setting is not specified, in the CLASSPATH environment variable. Thus, if youare debugging a rule that belongs to some part ition, you should append the part ition directory to eitherthe DEBUG_URL setting or the CLASSPATH.
Other auxiliary files, created by RuleView (project files, saved views), are typically located in theJAVA/RT/DEBUG directory, but i f the project fi le is not found, the folder selecti on dialog (t itled Choosedirectory to store debug files ) appears. After you choose a directory to store the auxiliary files, theproject file is saved to this directory and this directory is used to find saved views. (See “Saving andRestoring a View” .) Since the project file is named by the main rule long name and this rule may appearin different parti ti ons, we recommend that you choose the DEBUG directory under the part iti ondirectory to store the auxiliary debug files.
Initialization SettingsThe initialization fi le, appbuilder.ini, contains a [DEBUG] section with several sett ings controlling thedebugger. These parameters are summarized in Table 2-1 .
Tip The RuleView for Java does not need a Function to be prepared in order to view the correct processhierarchy. If you have changed the structure of a process, you only need to re-prepare the rules of the childentities that have been reorganized. However, if you are starting RuleView through the Execution Client,you will have to prepare Function anyway.
Table 2-1 Debugger initialization settings
Parameter Description
CONNECT_TIMEOUTTimeout value in seconds is used for establishing connection betweendebugger and remote server ( for client/server debugging only). The defaultvalue is 30.
DBG_JVM_NAME
Specify the name of the Java virtual machine (JVM) executable to start whenusing RuleView. The default is java.exe. This setting is for the execution client,not for RuleView. This executable is the JVM on which to start the executionclient.
DBG_JVM_PARAMETERS Specify any additional parameters for JVM.
8/14/2019 App Builder Debugging Applications
http://slidepdf.com/reader/full/app-builder-debugging-applications 12/88
2-4 Debugging Java Applications
Running RuleView
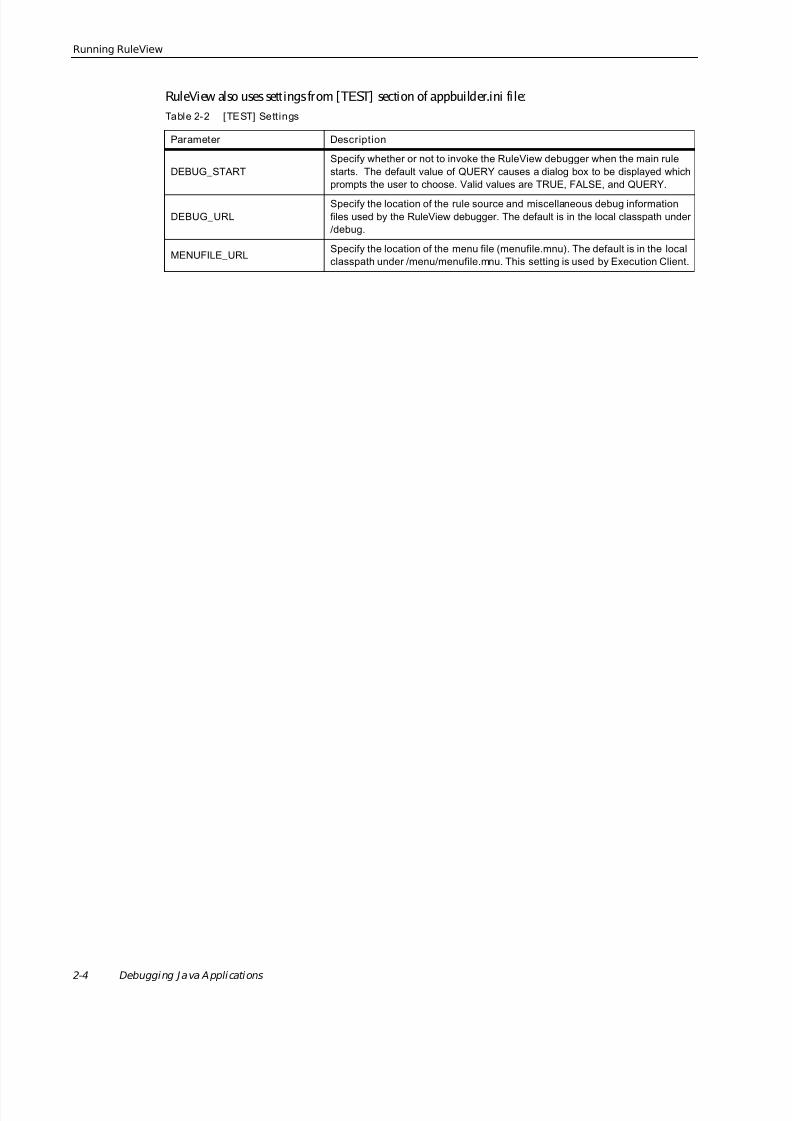
RuleView also uses sett ings from [TEST] section of appbuilder.ini fi le:Table 2-2 [TEST] Sett ings
Parameter Description
DEBUG_STARTSpecify whether or not to invoke the RuleView debugger when the main rulestarts. The default value of QUERY causes a dialog box to be displayed whichprompts the user to choose. Valid values are TRUE, FALSE, and QUERY.
DEBUG_URLSpecify the location of the rule source and miscellaneous debug informationfiles used by the RuleView debugger. The default is in the local classpath under/debug.
MENUFILE_URLSpecify the location of the menu file (menufile.mnu). The default is in the localclasspath under /menu/menufile.mnu. This setting is used by Execution Client.

8/14/2019 App Builder Debugging Applications
http://slidepdf.com/reader/full/app-builder-debugging-applications 13/88
Understanding the RuleView Interface
AppBuilder 2.1.0 Debugging Applications Guide 2-5
Exiting RuleView
Exit t he Application
To exit the application, from the pull-down menu select File > Exit application or press Alt+F4 . Thisterminates the application being debugged and, for Java applications, terminates the target Java vir tualmachine (JVM), and exits from RuleView. Before performing this action, RuleView displays a dialogasking Do you want to close this debugging session? to which you can respond Yes or No.
You can also click on the X button in the upper right corner of the RuleView window. This is the same asExit application .
Exit RuleView Only
To exit RuleView, from the pull-down menu select File > Exit RuleView or press Ctrl+F4 . This exitsfrom RuleView without the application (that i s being debugged) terminating. The applicati on continuesto execute.
When Finished
When the application you are debugging is terminated, you can exit RuleView using Ctrl+F4 , File > Exit
RuleView or by clicking on the X button in the upper right corner of the RuleView window. These threeways are completely equivalent. RuleView is not terminated automatically upon application terminationin order to give you a chance to view the application trace, if it is necessary. (For information on thetrace output , refer to “Output Panel” ).
Understanding t he RuleView InterfaceRuleView is a Rules Language source code debugger that has its own graphical user interface. Once youbecome familiar with the user interface you can perform the debugging operations. The interface ofRuleView for Java is slightly different from that of RuleView for C. It contains the following sections:
• Pull-down Menu
• Toolbar
• Rule Hierarchy
• View Hierarchy
• Rule Source Code Listing
• Output Panel
• Status Bar
• Look and Feel
A summary of all the keyboard shortcuts is given in RuleView Actions . The window for RuleView forJava is shown in Figure 2-1 . Use the RuleView window to find where problems are in the source code.

8/14/2019 App Builder Debugging Applications
http://slidepdf.com/reader/full/app-builder-debugging-applications 14/88
2-6 Debugging Java Applications
Understanding the RuleView Interface
Figure 2-1 RuleView for Java window
Terminology
Call Stack
When an application runs, it executes local procedures and rules, beginning with its root rule. If the rootrule uses another rule, the second rule is added to the list of rules and procedures that are currentlyexecuting, which is called the call stack. The second rule can use another rule or call a local procedure,which is added as well to the stack. The rule or procedure at the top of the stack is called the executingrule (procedure). When the executing rule (procedure) finishes, it is removed from the stack. Each itemof the call stack list is called stack frame. The currently executing rule or procedure corresponds to thetop stack frame. The first stack frame in the list, called the bottom stack frame, refers to the main rule,the rule that began the execution. Each stack frame has a level, the number in the sequence. You do nothave to deal with the stack frame levels; that is the duty of the debugger.
The data of the local procedures are stored in the stack frame. This protects them from being changedor damaged by other local procedures or from the rule. Thus, each local procedure on the stack has itsown instances of its variables. Except for its own local variables, all global variables (which you havecreated in the rule hierarchy or declared in the rule which this procedure belongs to) can be accessedfrom the local procedure. Al l these variables are called visible vari ables . RuleView displays only visiblevariables at any call stack level.
Also, the stack frame holds information about the cur rent locati on in rule source, that is to say, a rule li nethat is to be executed next. Each stack frame has its own current location.
Rule SourceCode Listing
Toolbar Call Stack Selector
View Hierarchy (or Data View)
Rule Hierarchy (or Tree View)
Current line(highlighted)
Status Bar Output Panel
Search
ThreadSelector
8/14/2019 App Builder Debugging Applications
http://slidepdf.com/reader/full/app-builder-debugging-applications 15/88
Understanding the RuleView Interface
AppBuilder 2.1.0 Debugging Applications Guide 2-7
In order to distinguish stack frames easily, they are given names . The name of the stack frame coincideswith name of the corresponding rule or procedure. The stack name is the same as the name of the ruleor procedure that this stack corresponds to. For example, the stack of a rule named MAIN_RULE hasaname "MAIN_RULE" and a stack of a local procedure PROC1 is named "PROC1". I f there are severalprocedures with the same name or some procedure is called recursively, there are several stack frameson the stack with the same name. They are distinguished by their levels, which is seen by the placementof the stack frames in the stack combo box. The top stack frame (the stack frame of the executing rule
or procedure) is the top element of the combo box.
Thread
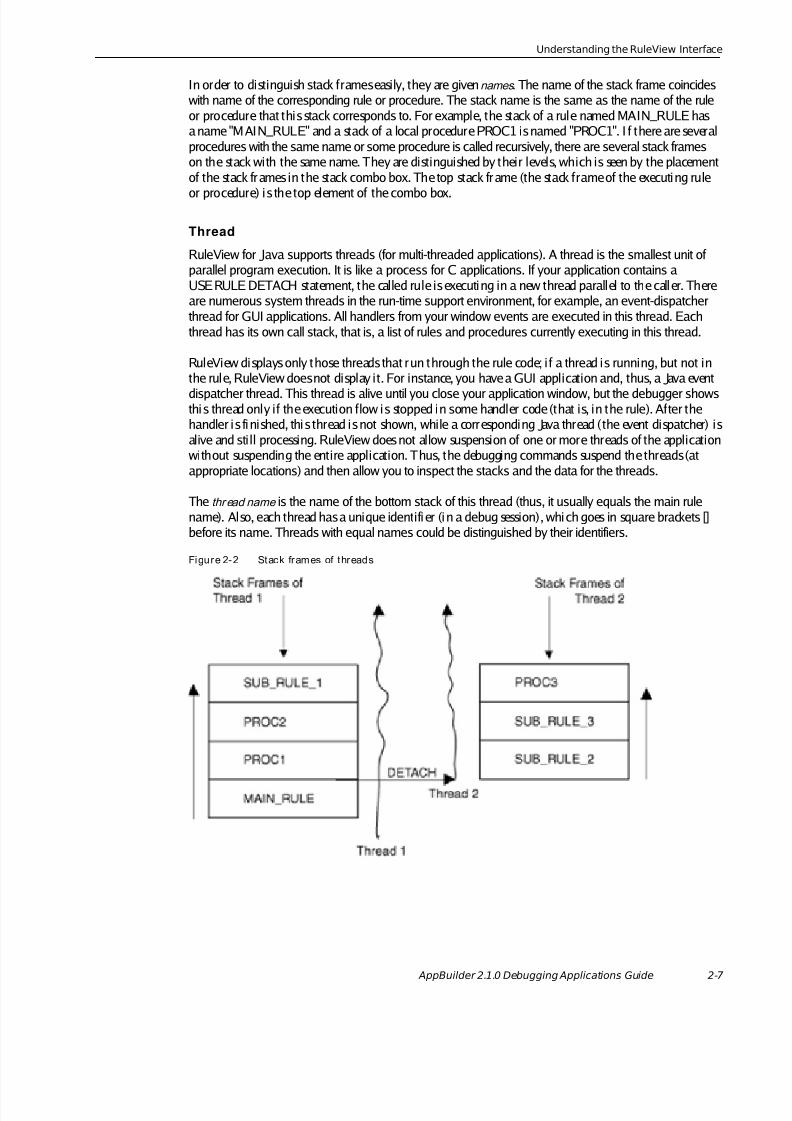
RuleView for Java supports threads (for multi-threaded applications). A thread is the smallest unit ofparallel program execution. It is like a process for C applications. If your application contains aUSERULE DETACH statement, the called rule is executing in a new thread parallel to the caller. Thereare numerous system threads in the run-time support environment, for example, an event-dispatcherthread for GUI applications. All handlers from your window events are executed in this thread. Eachthread has its own call stack, that is, a list of rules and procedures currently executing in this thread.
RuleView displays only those threads that run through the rule code; i f a thread is running, but not inthe rule, RuleView does not display it. For instance, you have a GUI application and, thus, a Java eventdispatcher thread. This thread is alive until you close your application window, but the debugger showsthis thread only if the execution flow is stopped in some handler code (that is, in the rule). After thehandler is fi nished, thi s thread is not shown, while a corresponding Java thread (the event dispatcher) isalive and sti ll processing. RuleView does not allow suspension of one or more threads of the applicationwithout suspending the entire application. Thus, the debugging commands suspend the threads (atappropriate locations) and then allow you to inspect the stacks and the data for the threads.
The thr ead name is the name of the bottom stack of this thread (thus, it usually equals the main rulename). Also, each thread has a unique identifi er (i n a debug session), which goes in square brackets []before its name. Threads with equal names could be distinguished by their identifiers.
Figure 2-2 Stack frames of threads
8/14/2019 App Builder Debugging Applications
http://slidepdf.com/reader/full/app-builder-debugging-applications 16/88
2-8 Debugging Java Applications
Understanding the RuleView Interface
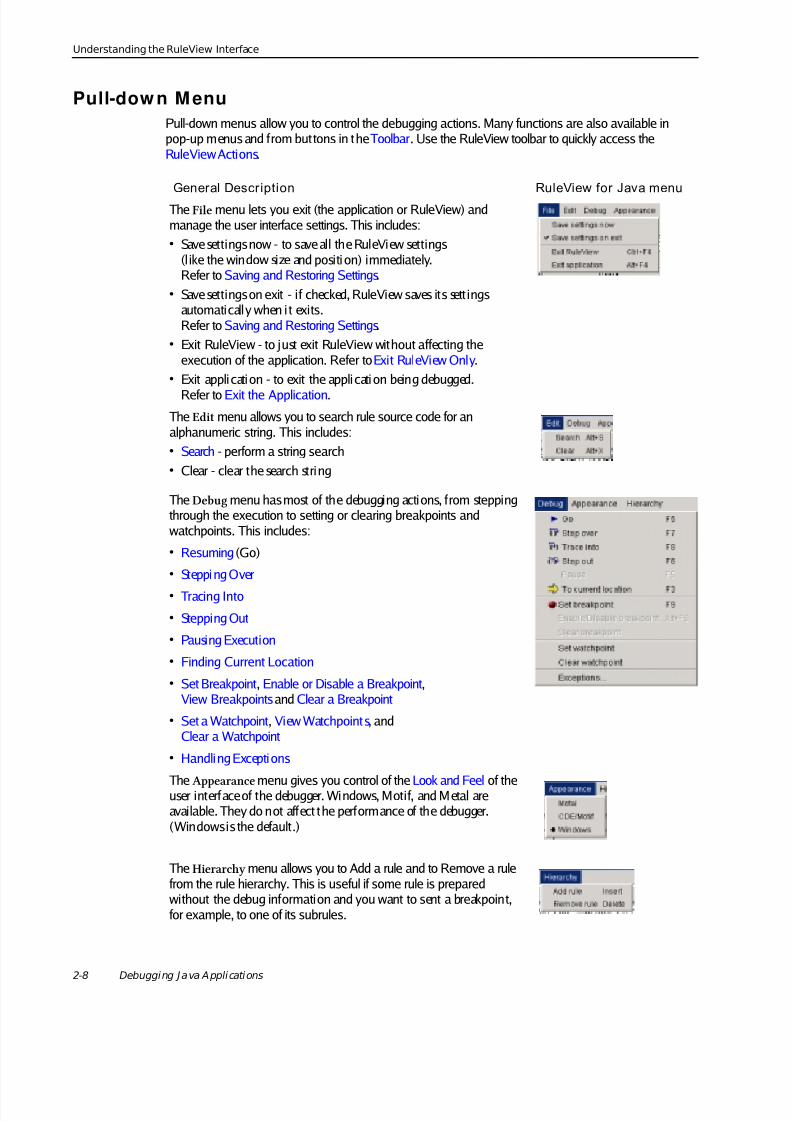
Pull-dow n M enuPull-down menus allow you to control the debugging actions. Many functions are also available inpop-up menus and from buttons in the Toolbar . Use the RuleView toolbar to quickly access theRuleView Actions .
General Description RuleView for Java menu
The File menu lets you exit (the application or RuleView) andmanage the user interface settings. This includes:• Save settings now - to save all the RuleView settings
(l ike the window size and positi on) immediately.Refer to Saving and Restoring Settings .
• Save settings on exit - if checked, RuleView saves its sett ingsautomatically when i t exits.Refer to Saving and Restoring Settings .
• Exit RuleView - to just exit RuleView without affecting theexecution of the application. Refer to Exit RuleView Only .
• Exit application - to exit the applicati on being debugged.Refer to Exit the Application .
The Edit menu allows you to search rule source code for analphanumeric string. This includes:• Search - perform a string search• Clear - clear the search string
The Debug menu has most of the debugging actions, from steppingthrough the execution to setting or clearing breakpoints andwatchpoints. This includes:
• Resuming (Go)
• Stepping Over
• Tracing Into
• Stepping Out
• Pausing Execution
• Finding Current Location
• Set Breakpoint , Enable or Disable a Breakpoint ,View Breakpoints and Clear a Breakpoint
• Set a Watchpoint , View Watchpoints , andClear a Watchpoint
• Handling Exceptions
The Appearance menu gives you control of the Look and Feel of theuser interface of the debugger. Windows, Motif, and Metal areavailable. They do not affect the performance of the debugger.(Windows is the default.)
The Hierarchy menu allows you to Add a rule and to Remove a rulefrom the rule hierarchy. This is useful if some rule is preparedwithout the debug information and you want to sent a breakpoint,for example, to one of its subrules.

8/14/2019 App Builder Debugging Applications
http://slidepdf.com/reader/full/app-builder-debugging-applications 17/88
Understanding the RuleView Interface
AppBuilder 2.1.0 Debugging Applications Guide 2-9
ToolbarSeveral functions can be run by cli cking the buttons in the toolbar. These same functions are available inpop-up menus and from buttons in the Pull-down Menu . Use the RuleView toolbar to quickly access theRuleView Actions .
Figure 2-3 RuleView for Java toolbar
Thread SelectorThis combo box contains all the threads that are executing in your application, as described in Thread .
Threads are not ordered. However, when RuleView gains control after finishing a debugging operati on,the thread currently selected (current thread) is one where last event occurred (breakpoint hit, stepfinishes, Watchpoint triggered, etc.).
You may choose any thread from the combo box to view its call stack. When you change the currentthread, the call stack combo box automatically is updated to reflect the change and displays the selectedthread stack frames. Similarly, the Rule Hierarchy selects the rule corresponding to the currently selectedcall stack frame in the current thread.
Call Stack SelectorThis combo box contains the call stack of the current thread. When RuleView updates this call stackcombo, the currently selected item is the topmost stack frame, that is, the current stack frame or stackframe of the currently executing procedure or rule.
You can switch between stack frames to see the corresponding set of visible variables and currentlocation in rule source. The current location is highlighted green in the rule source window. When youchange the current stack frame, the rule hierarchy is automatically updated to display the rule this stackframe corresponds to and vice versa: when you click on some rule in the rule hierarchy, the call stackcombo box is updated to display the topmost stack frame corresponding to this rule is selected. Itdepends on the current location whether it is a rule's frame or a procedure's one. If there is nocorresponding stack frame, this combo box is disabled (grayed).
There is a special case to the use of stack frames. When they are associated with a rule that has nodebugger information, such frames cannot access data and have no location except a procedure they
represent in a stack. They are used only to display call stack structure. However, they are associated witha rule and, as with usual frames, affect rule hierarchy selection pointing to their rule. The source code li stand data views are cleared for these frames. They are also highlighted with color.
SearchThe search engine allows you to search for an alphanumeric string in the rule source code. The sourcecode search engine is a text field to the right of the Rule Stack combo box. (See Figure 2-3 .) Type thestr ing to look for and either press Alt-S or select Edit > Search. If found, the first source line containingthe string is selected. For a repeated search and to find the next occurrence of that string, press Alt-S inthe source code window. To clear the search field, select Edit > Clear . For advanced search features, click
Go
Step over Trace into
Step out Set breakpointClear breakpointPause
Thread Selector Call Stack Selector Search Field
To currentlocation
Enable/Disable breakpoint

8/14/2019 App Builder Debugging Applications
http://slidepdf.com/reader/full/app-builder-debugging-applications 18/88
2-10 Debugging J ava Applications
Understanding the RuleView Interface
on a button to the right of search text edit field with a glass icon. "Search: source code listing" appears. Itincludes forward and backward search capabilities with the possibility to perform case-sensitive search(by default, search is case-insensitive).
Rule HierarchyThe rule hierarchy is displayed in the upper right corner of the window. The rule hierarchy shows thenames and levels of rules in the application. The rule hierarchy tree reflects rule state during execution.There are three possible states:
• Rule is loaded. The rule is displayed using the normal tree node styles (which strongly depend on the current lookand feel). Such a rule being selected displays its source code with executable lines highlighted. If therule is in the current call stack, the data are also displayed.
• Rule is not loaded. The rule is highlighted with color; it looks li ke disabled text. Such a rule displays only its source codewith no difference between executable and other lines.
• Loaded rule compiled with no debug information. The rule is displayed as in the case of the rule not loaded, but using italic font. Rules of this kind donot provide any information.
You may add or remove rules from the hierarchy using the Hierarchy menu items. To display the sourcecode in the rule source window, click on the desired rule name in the hierarchy. Refer to Figure 2-1 forthe location of the rule hierarchy and the rule source code listing.
Construction-time and built-at-run-time hierarchies might differ. In order to improve performance,RuleView constructs a rules hierarchy step by step; this means that subrules of a rule are added to ahierarchy only when a rule is being loaded. However, i f you need some rule to appear in a hierarchybefore its parent is executed, you can click on the parent rule in the Rules hierarchy. This forces RuleViewto load all the subrules of the selected rule, if debug information for i t is available. If i t is not available,you can add subrules manually or perform a trace into the commands until the subrule you need isexecuted and then i t is added to the hierarchy automatically.
View HierarchyThis area is an advanced tabbed pane that contains four information tabs:
• Rule Data Tab
• Watches Tab
• Breakpoint Tab
• Watchpoint Tab
If any value is too long to display in the tab, only the beginning is displayed and provided with a toolt ipthat shows the complete value. Refer to Figure 2-1 for the location of the view hierarchy window.
You can detach any of these tabs into a separate window. This helps you view the information frommulti ple tabs at one glance. To detach a tab, right-double-click on i ts header. The new window appearsthat contains the information for that tab. To attach it back to the tabs simply close the window. Eachtool in this area is operated via its own pop-up menu.

8/14/2019 App Builder Debugging Applications
http://slidepdf.com/reader/full/app-builder-debugging-applications 19/88
Understanding the RuleView Interface
AppBuilder 2.1.0 Debugging Applications Guide 2-11
Rule Data Tab
This tab, displayed by default, di splays all the rule data variables (views and fields) associated with thestack frame currently displayed in the Call Stack combo box. If the rule being displayed is not loaded(Call Stack combo box disabled), the view hierarchy (or data view) tab is blank. The data variableincludes the name and the value as shown in Figure 2-4 .
Fi gu re 2-4 Ru le dat a t ab
If your rule handles a large amount of data, it could slow down RuleView performance, since RuleViewreads rule data each time the application stops. If you are not interested in all the visible variables, youcould use Watches Tab instead of this Rule Data Tab, since it lets you specify a subset of views or fields towatch.
RuleView displays variable values using the system default format. The two settings used to format thedate and time are available in the [NC] section of the appbuilder.ini fi le. DATE variables are formattedaccording to the value of the DEFAULT_DATE_FORMAT sett ing. TIME vari ables are formattedaccording to the DEFAULT_TIME_FORMAT setting. The date and time formatting is set for the entireRuleView window including the Watches Tab .
Watches Tab
This tab displays variables you wanted to watch. If your application contains a lot of data, it isinconvenient to view all the variables at one time. More frequently, you need to watch values of severalvariables of interest. With watches, you can add variables to the Watches tab using the pop-up menu onthe Rule Data tab view or field (see “Viewing and Modifying Variables” for more information) andselecting Add Watch . The variable you select is added to the Watches tab. Displaying the full names ofthe variable is very difficult, so only short names are displayed, as in the All Data tab. In addition, everyvariable has a toolti p displaying the complete name. Refer to Figure 2-5 for an example.
Fi gu re 2-5 Wat ches tab
The Watches tab displays names differently from the Rule Data tab because of the possibility of namesclashing. For example, in the Watches tab, it is possible to have the same variable names but they wouldbe of different types. In order to distinguish such variables, the complete specification of the variablename displays as a tooltip for the variable in the Watches window:
<rule name>#<stack frame name>:<variable name>
View name
Data variable value
Data variable name
View name
Data variable value
Data variable name

8/14/2019 App Builder Debugging Applications
http://slidepdf.com/reader/full/app-builder-debugging-applications 20/88
2-12 Debugging J ava Applications
Understanding the RuleView Interface
Expand non-leaf nodes to see the value of the fields of previously selected views. This is a tree display,where you can browse through the view by expanding or collapsing branches of the tree.
Breakpoint Tab
This tool displays all the breakpoints for the current debug session. Each row in the breakpoint tabconsists of:
• Check box that displays and controls the breakpoint’s status. If a breakpoint is enabled, the box ischecked; otherwise the box is unchecked.
• Str ing of the following format:
{ <RULE_NAME>, at line <LINE_NUMBER> }
where <RULE_NAME> is the name of the rule where the breakpoint is set and <LINE_NUMBER>is the breakpoint target li ne.
Fi gu re 2-6 B reak po in ts tab
Watchpoint Tab
This tab displays all the watchpoints for the current debug session.
Fi gu re 2-7 Wat ch po in ts tab
Each row in the list consists of a str ing with the following format
<fldSpec>::=<name>.<fldSpec> | <name>[<index>].<fldSpec> | <name>
where <name> is a name of view or field, and <index> is an index of occurs view element whichrepresents a data object this watchpoint is targeted to.
Rule Source Code ListingThe rule source code listing window displays the Rules Language source code for rules that are beingexecuted. Thi s area shows the rule currently selected either by the execution f low, the rule hierarchywindow, or the Rule Stack combo box selection. The position of the currently selected line is highlightedgreen. The execution pointer marks the line that is executed next for that rule, in the context of a giventhread. Refer to Figure 2-1 for the location of the rule source code li sti ng window.
Check shows thatbreakpoint is enabled.
Rule name and linenumber at whichbreakpoint is set.
Watchpoint list.
8/14/2019 App Builder Debugging Applications
http://slidepdf.com/reader/full/app-builder-debugging-applications 21/88
Understanding the RuleView Interface
AppBuilder 2.1.0 Debugging Applications Guide 2-13
Use the rule source code listing window to set breakpoints, perform text searches, and monitor theexecution of the current rule.
Output PanelThe output panel informs you of different events that have occurred during the debug session. It alsodisplays a rule trace and informational messages, for example, that the rule source is being loaded.
There are two tabs on this panel—Messages and Errors/Warnings. The Messages tab is selected bydefault and displays informational messages. The Errors/Warnings tab displays messages that describesany error situation, for example, when rule source code is not found and thus cannot be loaded. Whensuch an error occurs, RuleView automatically switches to this tab. Refer to Figure 2-1 for the location ofthe output panel.
Right clicking on the Output panel opens a pop-up menu that provides these functions:
Clear this panel – This clears the contents of the selected tab.
Clear all panels – This clears the contents of all the tabs.
Save this panel – This saves the contents of the selected tab to a file (which you name and of which youspecify the location). The default location is the AppBuilder Java debug directory.
Save all panels – This saves the contents of all the tabs to a file (which you name and of which you specifythe location). The contents of each tab is saved into a separate section, delimited with the name of thetag in brackets (for example, [Messages]).

8/14/2019 App Builder Debugging Applications
http://slidepdf.com/reader/full/app-builder-debugging-applications 22/88
2-14 Debugging J ava Applications
Understanding the RuleView Interface
Figure 2-8 Example of al l tabs saved
Stat us Bar
The status bar contains the following items. Refer to Figure 2-1 for the location of the status bar.
• Status tells the status of the RuleView debugger. Refer to Table 2-3 .
• Rule Name is the long name of the current rule (the rule being displayed).
• Line Number is the currently selected line number in the source code window.
Look and FeelChanging the look and feel is available for the Java version only. There are different options for the lookand feel of the user interface for the RuleView debugger. Select from the choices in the Appearance pull-
Table 2-3 RuleView Status
Status Description
ReadyThe application is stopped and RuleView is ready to accept commands from the
user.Starting The RuleView application is starting.
Executing The rule being debugged is running.
Finished The RuleView application is finished.
Contents of Messages Tab
Contents of Errors/Warnings Tab
From a Save all tabs command:

8/14/2019 App Builder Debugging Applications
http://slidepdf.com/reader/full/app-builder-debugging-applications 23/88
Understanding the RuleView Interface
AppBuilder 2.1.0 Debugging Applications Guide 2-15
down menu. The choices are illustrated in Figure 2-9 . There is no difference in the functionali ty ofRuleView in any of these versions. They only change the look and feel of the interface. If you are morecomfortable with the Common Desktop Environment (CDE)/Motif or Metal version of the interface,select either of them. The default is the Windows look and feel.
Figure 2-9 Sample of each look and feel option
RuleView Actions
For a summary of the debug actions that can be performed from RuleView for Java, see Table2-4 .Table 2-4 RuleView for Java action summary
Ac ti on Menu Com man d Toolb ar B ut to n Ac cel erator Button
Continueexecution Debug Go Run F5
Pauseexecution Debug Pause Pause
Find current location Debug Current Location Current Location F3
Traceinto Debug Step into Trace into F8
Step over Debug Step over Step over F7
Step outDebug Step out Step out F6
Set breakpoint Debug Set breakpoint Set breakpoint F9
Clear breakpoint Debug Clear breakpoint Clear breakpoint F9
Enable breakpoint Debug Enable breakpoint Alt+F9
Disable breakpoint Debug Disable breakpoint Alt+F9
Break at Exceptions Debug Exceptions...
Set watchpoint Debug andright-click
Set Watchpoint Set watchpoint
Windows look and feel
CDE/Motif look and feel
Metal look and feel

8/14/2019 App Builder Debugging Applications
http://slidepdf.com/reader/full/app-builder-debugging-applications 24/88
2-16 Debugging J ava Applications
Debugging Rules with RuleView
Debugging Rules w ith RuleView
You can debug individual rules locally, standalone Java applications with RuleView, or a distributed Javaapplication. For distributed applications, as long as RuleView is running in the Execution Client and thedebug environment i s configured correctly, RuleView handles remote calls automatically.
With RuleView, you can perform the following debugging tasks:
• Starting to Debug
• Pausing Execution
• Viewing and Modifying Variables (of any field within a view)
• Saving and Restoring a View
• Using a Breakpoint
• Using a Watchpoint
• Stepping (one statement at a time)
• Handling Exceptions
To know where you are in the application, use Finding Current Location . For a quick summary of thedebug functions that can be performed and the part of the RuleView interface that is used to performthat action, see Table2-4 .
Removewatchpoint Debug andright-click
Remove Watchpoint
Add watches Right-click Add Watch
Remove watches Right-click Remove Watch .
Modify value Right-click Modify value
Set variable to null Right-click Set to NULL
Add rule to hierarchy Hierarchy Add Rule
Remove rule from hierarchy Hierarchy Remove Rule
Perform Search Edit Search
Clear Search Edit Clear
Change look-and-feel Appearance LookAndFeel
Save Settings File Save Settings
Exit application File Exit application Alt+F4
Exit RuleView File Exit RuleView Ctrl+F4
Note Set/Clear/Enable or Disable breakpoint buttons on toolbar appears only if this action is applicable tocurrently selected line of rule source code. For example, if a breakpoint is set to currently selected line, Setbreakpoint button will not appear on the toolbar.
Table 2-4 RuleView for Java action summary (Continued)

8/14/2019 App Builder Debugging Applications
http://slidepdf.com/reader/full/app-builder-debugging-applications 25/88
Debugging Rules with RuleView
AppBuilder 2.1.0 Debugging Applications Guide 2-17
Starting to D ebug
Starting the ApplicationWhen RuleView starts, it displays its window and suspends the application just before main ruleinitializati on. It allows you to set breakpoints (but not watchpoints). No threads, call stack and data areavailable at this time, because the application has not been started yet. You may resume the applicationin two ways – continue the execution (see “Resuming” ) or issue the trace into command (see“Tracing Into” ), which stops the application again before the first rule line is executed but after the ruleinitialization so that the threads, call stack, and rule data are available.
Refer to “Starting RuleView” .
Closing the ApplicationRefer to “Exiting RuleView” .
Navigating t o the RulesThe rule source code listing area shows the source code of the rule. The position of the currently selectedline is highlighted green in the RuleView for Java. The execution pointer marks the line that is executednext for that rule, in the context of a given thread.
If you want to find a particular part of the code in this window, use the search engine. It helps you find aparticular string of text in any line of code in that rule.

8/14/2019 App Builder Debugging Applications
http://slidepdf.com/reader/full/app-builder-debugging-applications 26/88
2-18 Debugging J ava Applications
Debugging Rules with RuleView
Finding Current Location
To make it easier to find the exact source code line which is executed next, you can request the currentlocation of the executed code in RuleView. Use Debug > Current Location menu or press F3. Thi s bringsyou back to the rule and call stack frame displaying the rule source li ne which i s to be executed next. Thisis performed for the currently selected thread and the threads combo box is not affected by this
command.
Resuming
The Go or Run command ( F5, Go toolbar button, or Debug > Go menu item) resumes the previouslysuspended application. For Java, all Java vir tual machine (JVM) threads are resumed unt il a breakpointis reached or a watchpoint is triggered or an exception is thrown. RuleView prints an informationalmessage when a watchpoint is triggered and displays a message box when an exception is thrown.Whilethe application or rule executes, only the pause command or set and remove breakpointcommands remain active.
Pausing ExecutionIf you want to stop the executing of a rule without setting a breakpoint, you can pause the execution.Topause means to stop execution of the rule being debugged when one of the threads reaches the nextexecutable line in the rule. To pause, press the Pause toolbar button or from the pull-down menu selectDebug > Pause . This is usually helpful to stop execution in an infinite (or extremely long) loop or in anevent handler in a GUI application.
When you are done pausing, you can tell the debugger to continue the execution. To continue, press F5 or press the Run toolbar button or from the pull-down menu, select Debug > Go .
View ing and M odifying Variables
RuleView displays visible variables of all types (except OBJECT, unless it is included in a VIEW) for acurrent stack frame in vi ew hierarchy. Refer to Figure 2-1 for thelocati on of the view hierarchy. The viewhierarchy window contains several types of debugging data:
• Rule Data
• Watches Data
This data may change dynamically as the rule data are involved in dynamically set view operations (suchas append, insert, delete, etc.).
Working with Occurring Views
For Rule data, changes to an occurr ing view, if it is opened, changes the number of its elements. If anyelement of an occurr ing view is expanded, then exactly this element remains expanded unless it isdeleted. For example, if the element number 4 is expanded and elements 1 through 3 are deleted, then anew element is inserted before the first element. The result is that element number 4 becomes the secondelement and remains expanded.
In the Watches tab, any watch (a variable being watched) is associated with the sequence if the indices areused to access the variable. Thus the contents of a watch change as a dynamically set view operation isperformed. If after any sequence of operations there is no such element, the watch is deleted.

8/14/2019 App Builder Debugging Applications
http://slidepdf.com/reader/full/app-builder-debugging-applications 27/88
Debugging Rules with RuleView
AppBuilder 2.1.0 Debugging Applications Guide 2-19
Rule Dat a
The Rule Data helps to browse all data accessible from the current context. The Rule Data tab consists ofa table that di splays the accessible rule data according to the view (input view or output view forexample) to which the data belongs. These include rule global variables (including input and outputviews), current procedure local variables, and current rule local variables unless they are hidden by
procedure data. If the current context changes (for example, you switched to another call stack frame),this table is updated using the new context.
Data displayed in the Rule Data panel are ordered. The fol lowing table shows the order:
• rule input view
• rule output view
• rule window view
• input view and output view of sub-rules
• input view and output view of components
• views of all sections of reports attached to the rule
• rule global views (sorted alphabeti cally)
• rule work views (sorted alphabetically)
• rule and procedure data, declared in DCL section (sorted alphabetically + views go before fields)
Figure 2-10 Rule Data actions
The table consists of two columns. The Name column displays the variable name using different iconsfor views and fields and reflects the structure of the data hierarchy. The Value column di splays thecurrent value of this variable. You can right-click on any value in the data and get a pop-up menu.The actions that are allowed are:
• Modify Value
• Set a Watchpoint
• Clear a Watchpoint• Add Watch
• Set to NULL
• Backup (see Saving and Restoring a View )
To modi fy the value, the display changes and allows you to edit the value in the window. To add a watch(add a variable to watch), the Watches tab appears and allows you to add a new watch.
Actions possible fromthe Rule Data tab
8/14/2019 App Builder Debugging Applications
http://slidepdf.com/reader/full/app-builder-debugging-applications 28/88
2-20 Debugging J ava Applications
Debugging Rules with RuleView
Some of these actions may not be allowed for particular variables. For example you cannot modify avalue or set a watchpoint for a view, so these menu items are grayed out. Also, only views can be saved orrestored, but not fields.
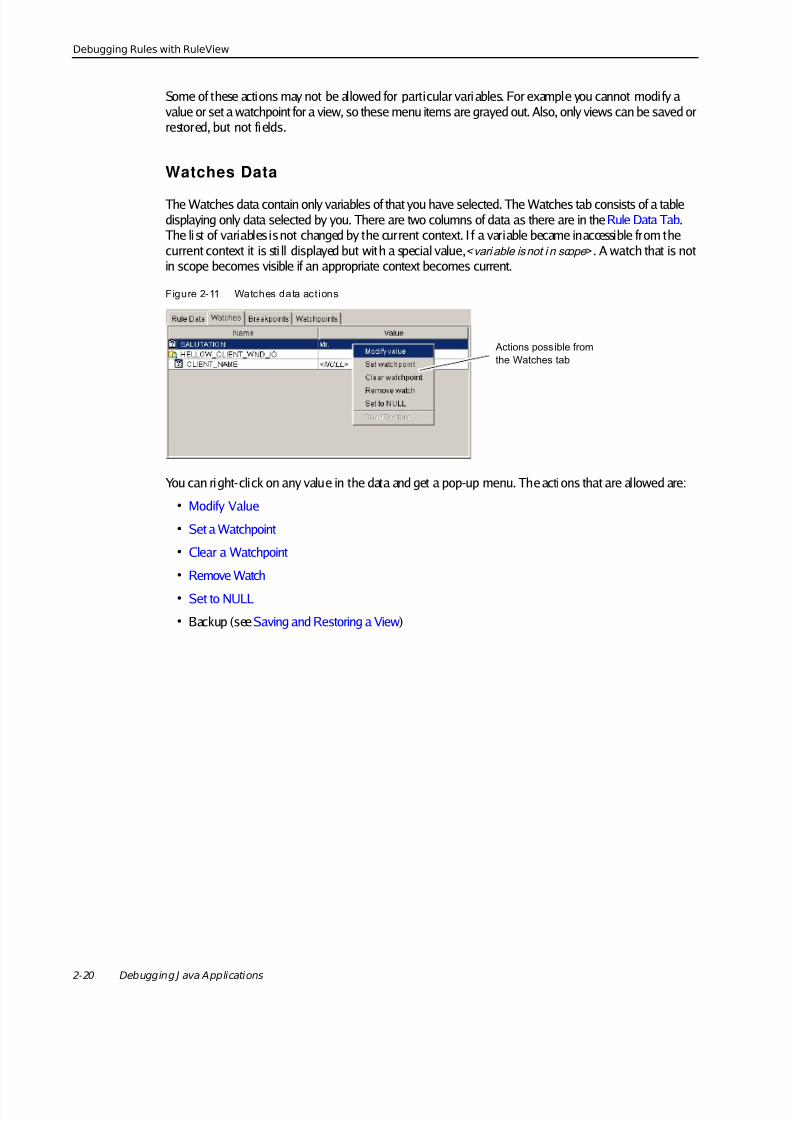
Watches Data
The Watches data contain only variables of that you have selected. The Watches tab consists of a tabledisplaying only data selected by you. There are two columns of data as there are in the Rule Data Tab . The li st of variables is not changed by the current context. I f a variable became inaccessible from thecurrent context it is sti ll displayed but with a special value, <vari able is not i n scope> . A watch that is notin scope becomes visible if an appropriate context becomes current.
Figure 2-11 Watches data actions
You can right-click on any value in the data and get a pop-up menu. The actions that are allowed are:
• Modify Value
• Set a Watchpoint
• Clear a Watchpoint
• Remove Watch
• Set to NULL
• Backup (see Saving and Restoring a View )
Actions poss ible fromthe Watches tab
8/14/2019 App Builder Debugging Applications
http://slidepdf.com/reader/full/app-builder-debugging-applications 29/88
Debugging Rules with RuleView
AppBuilder 2.1.0 Debugging Applications Guide 2-21
Dat a ActionsIn either the Rule Data tab or the Watches tab or both, you can modify variable data. The actions areavailable from the pop-up menu from inside the tables on these tabs. Each action is described in turn.
M odify ValueThere are two ways to modify the value of a field in either the Rule Data tab or the Watches tab.
• Right-click on the line and select Modify value in the pop-up menu.
• Left click the specif ic variable in the Value column.
If this variable can be edited (if it is a field and is in the scope) then the cell in the table becomes editableand a value may be entered or edited. After editing is complete, commit the result by pressing Enter orselect another vari able. If editing is not complete and the debugger state has changed, then editing iscanceled.
If an edited value is incorrect (for example, if you entered a non-digit for any numeric type or a date andtime value that does not fi t the format mask), then an error message appears asking whether to continueediting or to cancel. Press Yes to continue editing or No to leave the editor without committing thechanges.
Set to NU LLTo assign a NULL value to a field use the Set to NULL i tem in the pop-up menu. You can do this forfields in the Rule Data tab or the Watches tab. NULL is the initial value of any field.
This operation is similar to the Clear statement in the Rules Language. (Refer to the Rules LanguageReference Gui de .) A NULL value is also a special value that can be retrieved from a database. It isdisplayed as <NULL> and italicized to distinguish it from the same str ing value.
Add WatchTo add a watch to the table, select Add watch in the pop-up menu by right-clicking in the Rule Data tab.A new watch is created and the table on the Watches tab displays this watch.
Remove Wat chTo remove a watch from the table, select Remove watch in the pop-up menu by right-clicking in theWatches tab. If the variable being watched is a view, then removing the watch removes the view alongwith its subviews and fields. If you remove any subview or file of a watch, it is temporari ly removed untilits closest containing view is collapsed and expanded again.
8/14/2019 App Builder Debugging Applications
http://slidepdf.com/reader/full/app-builder-debugging-applications 30/88
2-22 Debugging J ava Applications
Debugging Rules with RuleView
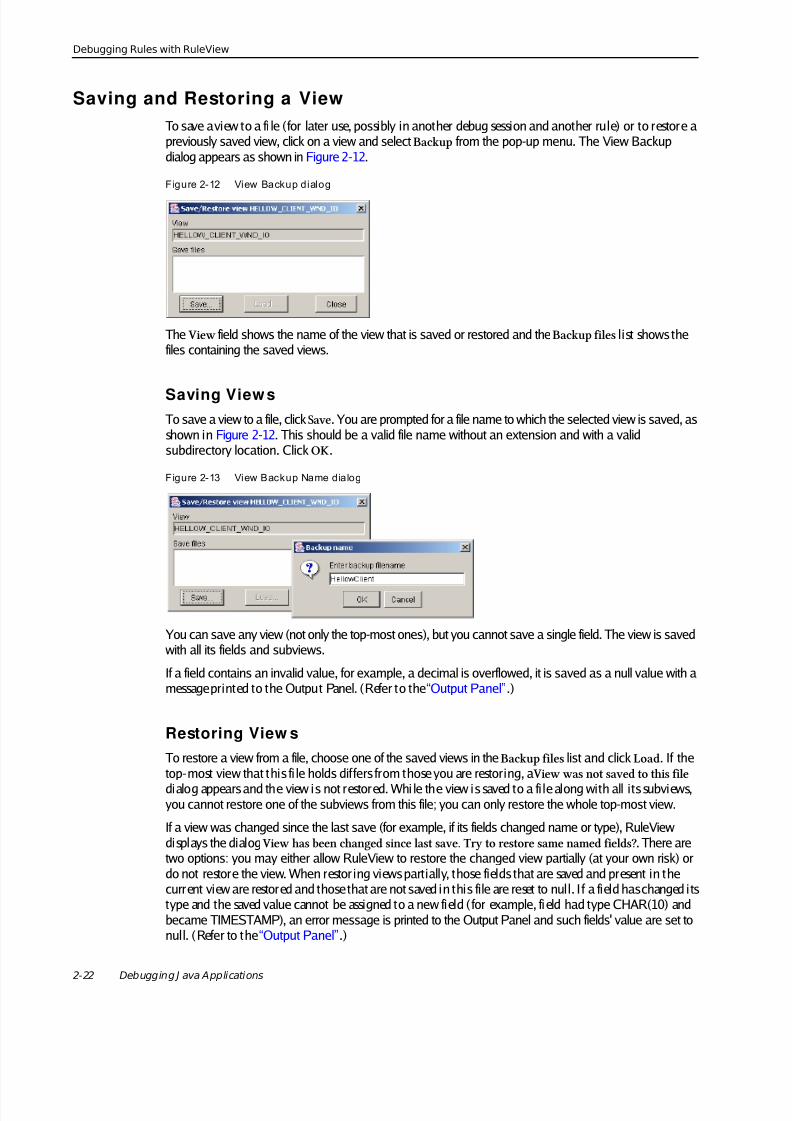
Saving and Restoring a ViewTo save a view to a fi le (for later use, possibly in another debug session and another rule) or to restore apreviously saved view, click on a view and select Backup from the pop-up menu. The View Backupdialog appears as shown in Figure 2-12 .
Figure 2-12 View Backup dialog
The View field shows the name of the view that is saved or restored and the Backup files list shows thefiles containing the saved views.
Saving View sTo save a view to a file, click Save . You are prompted for a file name to which the selected view is saved, asshown in Figure 2-12 . This should be a valid file name without an extension and with a validsubdirectory location. Click OK.
Figure 2-13 View Backup Name dialog
You can save any view (not only the top-most ones), but you cannot save a single field. The view is savedwith all its fields and subviews.
If a field contains an invalid value, for example, a decimal is overflowed, it is saved as a null value with amessage printed to the Output Panel. (Refer to the “Output Panel” .)
Restoring View sTo restore a view from a file, choose one of the saved views in the Backup files list and click Load . If thetop-most view that this fi le holds differs from those you are restoring, a View was not saved to this file dialog appears and the view is not restored. Whi le the view is saved to a fi le along with all its subviews,you cannot restore one of the subviews from this file; you can only restore the whole top-most view.
If a view was changed since the last save (for example, if its fields changed name or type), RuleViewdisplays the dialog View has been changed since last save. Try to restore same named fields? . There aretwo options: you may either allow RuleView to restore the changed view partially (at your own risk) ordo not restore the view. When restor ing views partially, those fields that are saved and present in thecurrent view are restored and those that are not saved in this file are reset to null. If a field has changed i tstype and the saved value cannot be assigned to a new field (for example, field had type CHAR(10) andbecame TIMESTAMP), an error message is printed to the Output Panel and such fields' value are set tonull. (Refer to the “Output Panel” .)

8/14/2019 App Builder Debugging Applications
http://slidepdf.com/reader/full/app-builder-debugging-applications 31/88
Debugging Rules with RuleView
AppBuilder 2.1.0 Debugging Applications Guide 2-23
Using a BreakpointOf course, stepping and t racing through each li ne of code is not always practical. This is precisely whyRuleView allows you to break (or halt) the execution of the application at a specific line in your sourcecode. The way you set such a stopping point is by defining a breakpoint . When you set a breakpoint on aline and then let the application run, RuleView automatically regains control just before the breakpointline is executed, enabling you to examine the contents of relevant views or change the values of fields.When you set a breakpoint at the selected location in the source code window, when any thread of theapplication reaches this location, execution is suspended and this location is highlighted green. To runthe application up to the next breakpoint, select Debug > Go , click the icon on the toolbar, or press F5.The Breakpoint tab provides the following operations:
• Set Breakpoint
• Enable or Disable a Breakpoint
• Clear a Breakpoint
• View Breakpoints
This feature is available both in suspended and unsuspended modes. Breakpoints remain active until
they are removed by the clear breakpoint command and they apply to any command. That is, if theexecution reaches a breakpoint with the step over command, execution is suspended and step over isautomatically canceled.
Remember that some Stepping apply to breakpoints.
Breakpoint DataThe Breakpoints tab consists of a checklist of breakpoints that you can enable or disable. You can right-click on any breakpoint and get a pop-up menu. The actions that are allowed are:
• Set Breakpoint
• Clear a Breakpoint
• Enable or Disable a Breakpoint
Figure 2-14 Breakpoints data actions
Set BreakpointThis sets a breakpoint at the currently highlighted location in the source code window or at specifiedli ne. This means that when any thread of the application being debugged reaches this location, executionis suspended and this location i s highlighted in green. This command i s available both in suspended andunsuspended modes.
Breakpoints can be set on the source code lines that are NOT grayed. However, while the rule is notloaded, the entire source is grayed, but you can still set a breakpoint on any line and no control on such
Actions possib le fromthe Breakpoints tab
8/14/2019 App Builder Debugging Applications
http://slidepdf.com/reader/full/app-builder-debugging-applications 32/88
2-24 Debugging J ava Applications
Debugging Rules with RuleView
breakpoints is performed until the rule loads. If some breakpoints are positioned on invalid lines, theyare moved automatically to the next executable line. If there is no line available, the breakpoint isremoved. This applies to every breakpoint (restored from the previous session or currently set), but ifyou try to set a breakpoint (by double-clicking on the rule source line, for example) on a line that is notexecutable, and there are no executable lines below, a message is printed to the Output Panel stating thatsuch a breakpoint cannot be set.
To set a breakpoint with RuleView for Java, you can do any of the following:
• With the rule displayed in the rule source window, double-click the line of code on which you wantto set a breakpoint. (This is a toggle, so if you do it again, it disables and then clears the breakpoint.)
The line of code shows a red dot in the left margin, indicati ng an active breakpoint has been added.An entry is added to the Breakpoints tab with its check box checked.
• With the rule displayed in the rule source window, click the Set breakpoint toolbar button, press F9,or from the pull-down menu, select Debug > Set breakpoint .
The line of code shows a red dot in the left margin, indicati ng an active breakpoint has been added.An entry is added to the Breakpoints tab with its check box checked.
• In the Breakpoints tab, right-click and select Set breakpoint from the pop-up menu. The AddBreakpoint Dialog appears. Fil l it out and click OK.
The line of code shows a red dot in the left margin, indicati ng an active breakpoint has been added.An entry is added to the Breakpoints tab with its check box checked.
Some Stepping apply to breakpoints. To continue running the application, select Debug > Run from theRuleView menu. To turn off the breakpoint, but leave it there for later user, refer to “Enable or Disable aBreakpoint” .
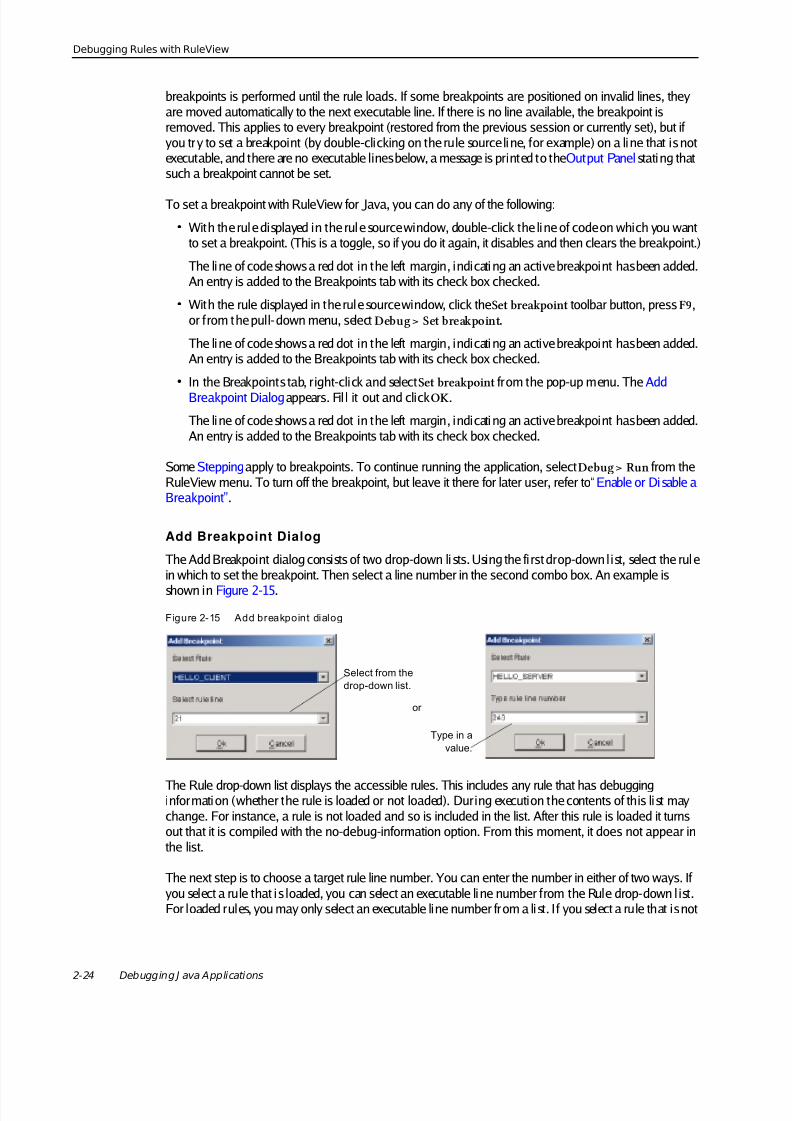
Add Breakpoint Dialog
The Add Breakpoint dialog consists of two drop-down li sts. Using the first drop-down l ist, select the rulein which to set the breakpoint. Then select a line number in the second combo box. An example isshown in Figure 2-15 .
Figure 2-15 Add breakpoint dialog
The Rule drop-down list displays the accessible rules. This includes any rule that has debugginginformation (whether the rule is loaded or not loaded). During execution the contents of this list maychange. For instance, a rule is not loaded and so is included in the list. After this rule is loaded it turnsout that it is compiled with the no-debug-information option. From this moment, it does not appear inthe list.
The next step is to choose a target rule line number. You can enter the number in either of two ways. Ifyou select a rule that is loaded, you can select an executable line number from the Rule drop-down l ist.For loaded rules, you may only select an executable line number from a list. If you select a rule that is not
Select from thedrop-down list.
Type in avalue.
or
8/14/2019 App Builder Debugging Applications
http://slidepdf.com/reader/full/app-builder-debugging-applications 33/88
Debugging Rules with RuleView
AppBuilder 2.1.0 Debugging Applications Guide 2-25
loaded, you can type in an editable field the target rule line number. There are two types of errormessages concerning this input method.
• Invali d format message – this occurs when a non-integer value is entered
• Invalid line number – if the value is less than 1 or greater than the maximum line number
When done, click OK.
Enable or Disable a BreakpointWhen a breakpoint is set to a line in a rule, it can be disabled and therefore ignored by the debugger.With this feature, you can set breakpoints and disable them for some debugging activity and enablethem again later. The status (of whether a breakpoint is enabled) is a toggle. There are several ways toenable or disable a breakpoint.
• With the rule displayed in the rule source window, press Alt-F9 or from the pull -down menu selectDebug > Enable/disable breakpoint . (This menu i s not available if there is no breakpoint on theselected line.)
• In the Breakpoints tab, right-click and click on the check box by the breakpoint to enable or disable.
If the box is checked, the breakpoint is enabled. If the box is not, the breakpoint is disabled.• Double-click on the source li ne. If done repeatedly, double-clicking the same line with a breakpoint
disables a breakpoint, then clears the breakpoint, then adds an enabled breakpoint, etc.
Clear a BreakpointTo remove a breakpoint that was previously set at the currently highlighted line in the source codewindow, you can do any of several operations. To clear a breakpoint in RuleView for Java:
• With the rule displayed in the rule source window, double-click the line of code on which you wantto clear a breakpoint. (This is a toggle, so if you do it again, it sets the breakpoint.)
• With the rule displayed in the rule source window, click the Clear breakpoint toolbar button, pressF9, or from the pull-down menu, select Debug > Clear breakpoint .
• In the Breakpoints tab, right-click on the breakpoint and select Clear breakpoint from the pop-upmenu.
You may select more than one line at a time. In other words, you may clear several or all of thebreakpoints. The system removes the red dot from the left margin, indicating that there is now nobreakpoint. The entry in the Breakpoints tab is removed. This command is available both in suspendedand unsuspended modes. To continue running the application, select Debug > Run or the Go buttonfrom the toolbar or press F5.
View Breakpoints
The locati on of a breakpoint is indicated in the rule source code li sti ng window by a red dot to the left ofthe line of code in which it is set. When a breakpoint is removed, the red dot disappears.
To see a list of the active breakpoints (including their rule long names), open the Breakpoints tab.

8/14/2019 App Builder Debugging Applications
http://slidepdf.com/reader/full/app-builder-debugging-applications 34/88
2-26 Debugging J ava Applications
Debugging Rules with RuleView
RestrictionsBecause each breakpoint is attached to a line number rather than to a particular Rules Languagestatement, if you change a rule you must verify that the points are still in the correct positions beforedebugging.
For example, if you set a breakpoint on l ine 10 and then add a line of code before line 10, the system
attaches the breakpoint to the new line of code. You must manually clear the breakpoint and create anew breakpoint on line 11. Refer to “Using a Breakpoint” for procedures on setting and clearingbreakpoints.
The following Rules Language statements cannot include breakpoints or watchpoints:
• Comment lines
• Blank lines
• Any li nes that include the following statements:
• CASE (but you can set a breakpoint on a CASEOF statement)
• Any type of END (ENDDO, ENDIF, and so forth)
• ELSE• DCL
• Local variable declarations (between DCL and ENDDCL)
For more information on these statements, refer to the Rules Language Reference Guid e. Any rule sourcecode line that cannot include a breakpoint is displayed gray.
Using a WatchpointOne feature that is only available with the RuleView for Java is the ability to set a watchpoint.A watchpoint allows you to control the value of a vari able (fi eld) . It is possible to set a watchpoint on avariable of any type (except OBJECT type) and the debugger suspends execution flow after each variablemodification and di splays a message box with the event description. Using watchpoints (regardless ofhow many) in the debugger may decrease your application execution speed. If you are concerned wi thexecution speed, do not use watchpoints. The possible actions with watchpoints are:
• Set a Watchpoint
• Clear a Watchpoint
• View Watchpoints
This feature is implemented in RuleView for Java only. A watchpoint allows you to control modificationof a variable (fi eld). You can set a watchpoint on any type of variable except OBJECT types, which arenot supported by RuleView. The debugger suspends execution f low after each variable modification.
Watchpoint DataThe Watchpoints tab consists of a checklist of watchpoints you can add or remove. You can right-clickon any watchpoint and get a pop-up menu. The actions that are allowed are:
• Set a Watchpoint
• Clear a Watchpoint

8/14/2019 App Builder Debugging Applications
http://slidepdf.com/reader/full/app-builder-debugging-applications 35/88
Debugging Rules with RuleView
AppBuilder 2.1.0 Debugging Applications Guide 2-27
Figure 2-16 Watchpoint data actions
Set a WatchpointYou may set watchpoints on any selected vari able that is visible. A watchpoint can be set only for fields.For views, this menu item is disabled. To set a watchpoint with RuleView for Java, you can do any of thefollowing:
• With the pop-up menu in either the Rule Data tab or Watches data tab, select Set watchpoint .• From the pull-down menu or Watchpoint tab, select Debug > Set watchpoint . The Add Watchpoint
Dialog appears. Fil l it out and click OK.
Add Watchpoint Dialog
Figure 2-17 Add watchpoint dialog
The Select rule drop-down contains a list of currently registered rules (this includes the rules that havebeen loaded and the ones not loaded yet, but does not contain loaded rules with no debug information).Select one to outline the rule data scope. Use the next two edit fields ( Enter procedure and Entervariable ) to select the procedure and the data object for the watchpoint.
In this Add dialog you can select a rule, then enter a procedure name and a field specifi cation. Together,these fully represent any fi eld in the application. A field specificati on, that is then shown in theWatchpoints tab has the fol lowing format:
<fldSpec>::=<name>.<fldSpec> | <name>[<index>].<fldSpec> | <name>
where <name> is a name of view or field, and <index> i s an index of occurs view element. Rememberthat the field format string is case insensitive, so it does not distinguish upper or lower case letters.
Actions poss ible fromthe Watchpoints tab
8/14/2019 App Builder Debugging Applications
http://slidepdf.com/reader/full/app-builder-debugging-applications 36/88
2-28 Debugging J ava Applications
Debugging Rules with RuleView
The possible result s of this operation (printed to the Output Panel ) are:
• New watchpoint is set for <fieldSpec> - if the watchpoint is successfully set.
• Watchpoint for < fldSpec> already set - if the watchpoint already exists.
• Watchpoint could not be set - some error occurred. This should not appear in normal operation;if you cannot find out what happened, contact Customer Support .
Press OK to set the watchpoint.
Example
For example, assuming we have the following view structure:
Str VARCHAR(10); V VIEW CONTAINS Str; Arr VIEW CONTAINS V(25);
To set a watchpoint to STR OF V OF ARR(5) you should type ARR[5].V.Str .
Clear a WatchpointWith the pop-up menu in either the Rule Data tab or the Watches data tab, you may removewatchpoints for selected vari ables. To remove a watchpoint from a field, select Clear watchpoint . Awatchpoint can be set and removed only for fields. For views, this menu item is disabled.
To remove a watchpoint from currently visible field, ri ght-click to the field in the data table and selectthe watchpoint you wish to remove, then click Clear from the pop-up menu.
To remove a watchpoint, switch to the Watchpoints tab and click Remove or click Remove All to removeall the watchpoints.
Another way is to select Debug > Clear Watchpoint menu. A list of watchpoints is displayed. You can
select arbitrary subset of a list and press Remove or Remove All .
Possible results of operation (printed to the Output Panel ):
• Watchpoint for < fldSpec> is removed. - if the watchpoint was successfully removed.
• Watchpoint for < flsSpec> is not set. - if t he watchpoint was not set.
• Watchpoint for <fldSpec> could not be removed. - some error occurred. This should not appear innormal operation; if you cannot find out what happened, contact Customer Support .
View WatchpointsTo see a list of the active watchpoints, click on the Watchpoints tab.
8/14/2019 App Builder Debugging Applications
http://slidepdf.com/reader/full/app-builder-debugging-applications 37/88
Debugging Rules with RuleView
AppBuilder 2.1.0 Debugging Applications Guide 2-29
SteppingYou can debug rule source code one line at a time using these stepping mechanisms:
• Tracing Into
• Stepping Over
• Stepping Out
A new feature of RuleView is command buffering. You may request several Trace Into, Step Over, StepOut, and Go commands by pressing the toolbar buttons or the corresponding accelerated menu i tems.(They are not disabled when the application you are debugging is unsuspended). They are executed inthe appropri ate order. If any event occurs and not all commands can be executed, you are prompted tocontinue execution or to discard all the commands in the queue.
Tracing IntoThis command steps to the next valid (executable) rule line at any call stack level. RuleView resumes theapplication being debugged (as the Continue Execution command does) and suspends it when any
thread reaches the next valid line in any rule in the hierarchy. The execution might stop in the otherthread, that is, the new current thread may be other than the old one.
Use F8 or the Step into toolbar button or the Debug > Step into menu to do the same.
Stepping OverThis command steps to the next valid (executable) rule line without stopping in any subrule orprocedure (that is, it stops at this or the caller stack frame). Unlike trace into, step over takes intoaccount the thread for which it is performed. A step over can be finished in that thread where it wasstarted. If this thread i s destroyed before the step finishes, the step over is cancelled automatically.
Use F7 or the Step over toolbar button or the Debug > Step over menu to do the same.
Stepping OutThis command steps out of the current subrule or procedure. More precisely, this command resumesapplication execution and suspends it at the next valid (executable) line in the upper stack frame of thesame thread. If the thread is destroyed before it reaches the upper stack frame level, the execution isstopped at the next valid line in any thread, just as the TracingInto command does.
Use F6 or the Step out toolbar button or the Debug > Step out menu to do the same.
Handling ExceptionsRuleView can suspend an application just before an exception is thrown and display a message boxcontaining the exception class name and exception message. You can decide the exceptions at which youwant the application to break. The Exceptions dialog ( Debug > Exceptions ) lets you specify these. Thisdialog allows you to manage the list of exceptions at which the execution of the application should break.
Also, the content of this dialog is saved between debugging sessions (saved along with breakpoints).
To add or remove or set the handling of exceptions, select Debug > Exceptions .

8/14/2019 App Builder Debugging Applications
http://slidepdf.com/reader/full/app-builder-debugging-applications 38/88
2-30 Debugging J ava Applications
Debugging Rules with RuleView
Figure 2-18 Exceptions handling dialog
In the Exceptions dialog, select one or more of the exceptions from the list. You may use the Select all button or click on one or more of the items in the list while holding the Ctrl key or Alt key. When youhave selected the items you want to break at, click Break at selected . To remove any break settings youhave previously set, simply select the items and click Ignore selected .
To add an exception to the list, click Add and enter the full name of the exception in the dialog. Theexception class name is verified to comply with Java naming standards, but the class existenceverification is not performed.
To remove an exception from the list, with the item or items in the list selected, click Remove . You areasked to confirm the removal with a dialog.
If you want to modify the spelling of the exception name, remove it and then add it back again with the
correct spelling.When you are done with adding, removing, and setting exceptions, click OK to continue. If you clickCancel , any settings you changed in this dialog are ignored except added or removed exceptions.Remember that this dialog manages only notification of an exceptional situation; it has no affect onexception handling. After you resume the application, the normal exception handling procedure isexecuted, resulting in execution-time support messages, etc.
Processing M ultiple ThreadsAlso, RuleView for Java supports threads (for multi-threaded applications). A thread is the smallest unit
of parallel program execution. RuleView displays only those threads that run through the rule code; if areal thread is running, but not in the rule, RuleView does not display it.
For instance, you have a GUI application and, thus, a Java event dispatcher thread. This thread is aliveuntil you close your application window, but the debugger shows this thread only if execution flow isstopped in some handler code (that is, in the rule). After the handler is finished, this thread is not shown,while a corresponding Java thread (the event dispatcher) is alive and still running. RuleView does notallow suspension of one or more threads of the application without suspending the entire application.
1. Select one or more exceptions
from the list .
2. Set whether tobreak or not.
If adding, enter the full class name.
If removing, you are asked toconfirm removal.

8/14/2019 App Builder Debugging Applications
http://slidepdf.com/reader/full/app-builder-debugging-applications 39/88
Troubleshooting
AppBuilder 2.1.0 Debugging Applications Guide 2-31
Thus, the debugging commands suspend the threads (at appropriate locati ons) and then allow you toinspect the stacks and the data for all threads.
The thread name is the name of the bottom-most stack of this thread (thus, it usually equals the mainrule name). However, there could be several threads with the same name. In order to distinguish them, aunique thread identifier is introduced. It is shown in square brackets to the left of thread name.
The stack name is equal to the name of the rule or procedure that this stack corresponds to. For example,the stack of a rule named MAIN_RULE has a name "MAIN_RULE" and a stack of a local procedurePROC1 is named "PROC1".
TroubleshootingIf you are having problems with RuleView, it may be because of either:
• Known Issues
• Java Interpreter Crash• Loop Stepping Over
• Video Card Incompatibiliti es with Java
• Common Problems
• Local Vari ables Not Displayed
• Debugger Not Stepping into Subrules
• Pause Execution Command Not Working
• Debugging Rules without Debug Information
• Debug Information or Rule Source are Inconsistent with Generated Rule Code
• RuleView not Displaying Rules Properly
Be sure to check this short list before asking for assistance.
Known IssuesThe following issues are known and are being resolved.
Java Interpreter Crash
Java interpreter crashes sometimes when trying to debug a rule that has several threads. Most frequentlyit is caused by a pause request in RuleView.
Loop Stepping Over
RuleView steps over some loops (when an end-user is performing step over command). For example itdoes not stop inside the loop. This happens for loops that have a body that consists of one line only.

8/14/2019 App Builder Debugging Applications
http://slidepdf.com/reader/full/app-builder-debugging-applications 40/88
2-32 Debugging J ava Applications
Troubleshooting
Video Card Incompatibilities w ith Java
Crashes in java.exe may occur on Dell 600 machines running Windows 2000 equipped with Rage 128Pro video card with driver version 5.0.0.96 or lower; this happens when running multiple Javaappli cati ons that display windows (for example, when you run an applicati on and then debug it with theRuleView for Java debugger, or WebSphere adminclient and a GUI Java application). Updating the videodriver to version 5.0.0.115 (this is what you get when you chose to update the video driver as detected by
Internet Explorer update or Windows update) should solve this problem. We have not seen this problemwith Windows NT.
Common Problems
Local Variables Not Displayed
Local variables are objects or object pointers. The RuleView debugger does not support object or objectpointers inspection.
Debugger Not Stepping into Subrules
Make sure that you have prepared these rules with debug information.
Pause Execution Com mand N ot Working
Pause command stops execution flow only when it reaches a valid rule line, so if you are debugging aGUI application, the debugger is stopped only after some handler within a rule is called.
Debugging Rules w ithout D ebug Information
It is possible to debug an application with one or several rules prepared with no debug info usingRuleView. However, the absence of debug information prevents you from stopping execution i n such arule and viewing its variables.
Also, since information on subrules of such rule is not available either, you cannot force them to appearin a hierarchy by clicking on the parent rule. You must add subrules manually or wait until these rulesare executed and then they are added to the hierarchy automatically.
The source code for subrules is available anyway.
Debug Information or Rule Source are Inconsistent with Generated Rule Code
When RuleView loads the debug information of a rule, it verifies if it is consistent with the generatedrule code. Debug info may become inconsistent if you, for example, copy latest version of generated ruleon another machine, but didn't take debug information class. To inform you of such a situation, an errormessage is printed to the Output Panel :
Debug info inconsistent with rule. Please, reprepare this rule.
Such rule is treated as one without debug information (see “Debugging Rules without DebugInformation” ).
Rule source consistency is also verified. If the rule source code RuleView loaded is newer or older thanshould be, the following message is printed to the Output Panel :
8/14/2019 App Builder Debugging Applications
http://slidepdf.com/reader/full/app-builder-debugging-applications 41/88
Troubleshooting
AppBuilder 2.1.0 Debugging Applications Guide 2-33
Rule source code is inconsistent with rule debug info; locationsreported might be invalid. Please, reprepare this rule.
This is only a warning message and does not prevent debugging this rule.
RuleView not Displaying Rules Properly
RuleView depends upon auxiliary files generated during preparation to locate rules used in theapplication. I f the function being debugged has not been super prepared, or if rules have been added orremoved since the last super prepare, RuleView may not be able to display the rule hierarchy properly.Consequently, it may not be possible to view the source code for some rules.
Statem ent Triggered Watchpoint Selected w ith Green not Red
When watchpoint is triggered, RuleView usually stops at the next line, highlighting a line wherewatchpoint was triggered with Red. However, under certain circumstances, it might stop at the same lineand in this case green overlays red. This usually happens inside loops and procedures.
8/14/2019 App Builder Debugging Applications
http://slidepdf.com/reader/full/app-builder-debugging-applications 42/88
2-34 Debugging J ava Applications
Troubleshooting

8/14/2019 App Builder Debugging Applications
http://slidepdf.com/reader/full/app-builder-debugging-applications 43/88
AppBuilder 2.1.0 Debugging Applications Guide 3-1
CHAPTER
3DEBUGGING C APPLICATIONS
AppBuilder 2.1.0 Debugging Applications Guide
You can debug your C application locally with AppBuilder RuleView for C. This topic explains theavailable functions in the RuleView interface for C Language application development. Beforedebugging the application, be sure to verify the syntax and logic of the individual rules and solve anypreparation problems. The process of verification is explained in the Developing Applicati ons Guide andthe troubleshooting section cover preparation problems in the Deploying Appli cati ons Guide . This topicdiscusses using RuleView for C to look at rules deployed as C applications. For information on RuleViewfor Java, refer to Chapter 2, “Debugging Java Appli cations” . (There are differences between the RuleView
for Java and the RuleView for C.)
The basic steps in using RuleView for C are:
• Running RuleView
• Debugging with RuleView
• RuleView Window Settings (C Only)
Running RuleViewAfter creating, verifying, and preparing rules, debug the application using RuleView. To set RuleView torun automatically, be sure the settings are correct i n the Construction Workbench, asdescribed inGett ing Ready to Debug .
When you are ready to execute the program in debug mode, refer to Starting RuleView .
To exit the debugger or the application, refer to Exit ing RuleView .
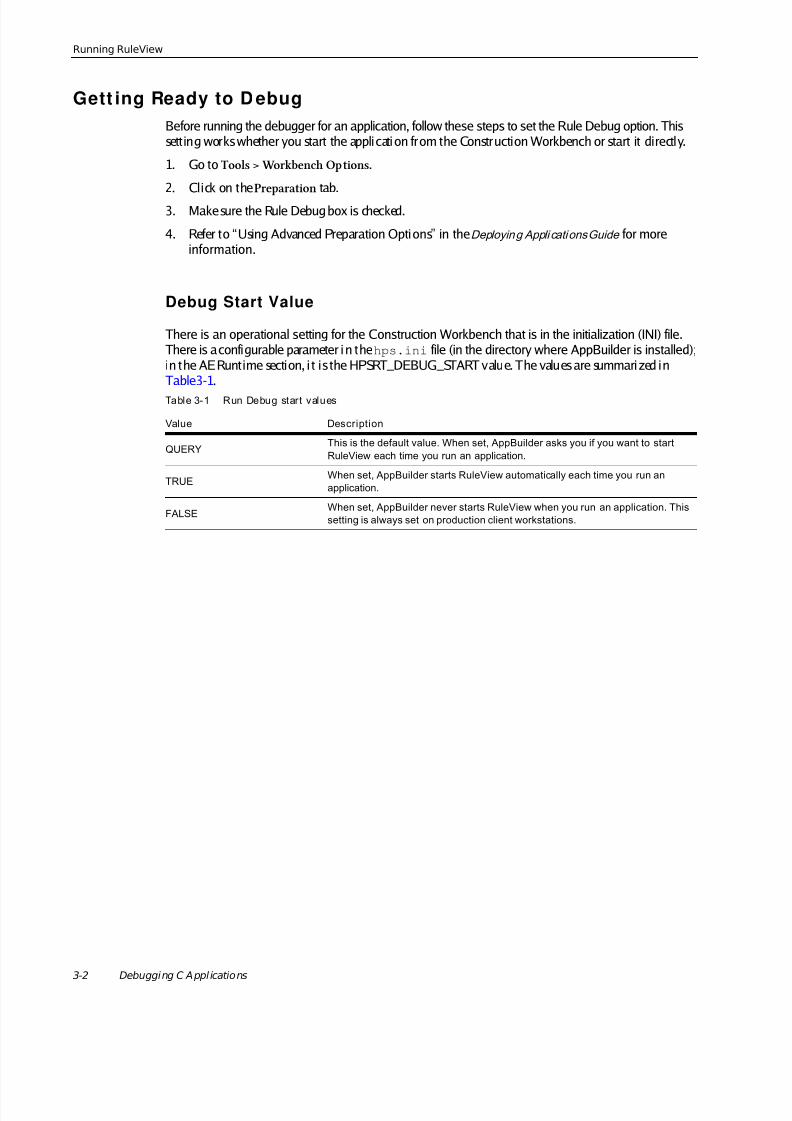
8/14/2019 App Builder Debugging Applications
http://slidepdf.com/reader/full/app-builder-debugging-applications 44/88
3-2 Debugging C Appl ications
Running RuleView
Gett ing Ready to D ebugBefore running the debugger for an application, follow these steps to set the Rule Debug option. Thissett ing works whether you start the applicati on from the Construction Workbench or start it directly.
1. Go to Tools > Workbench Options .
2. Click on the Preparation tab.
3. Make sure the Rule Debug box is checked.
4. Refer to “Using Advanced Preparation Options” in the Deploying Appli cations Guide for moreinformation.
Debug Start Value
There is an operational setting for the Construction Workbench that is in the initialization (INI) file.There is a configurable parameter i n the hps.ini file (in the directory where AppBuilder is installed);in the AERuntime section, i t is the HPSRT_DEBUG_START value. The values are summari zed inTable3-1 .Table 3-1 Run Debug start values
Value Description
QUERYThis is the default value. When set, AppBuilder asks you if you want to startRuleView each time you run an application.
TRUEWhen set, AppBuilder starts RuleView automatically each time you run anapplication.
FALSEWhen set, AppBuilder never starts RuleView when you run an application. Thissetting is always set on production client workstations.
8/14/2019 App Builder Debugging Applications
http://slidepdf.com/reader/full/app-builder-debugging-applications 45/88
Running RuleView
AppBuilder 2.1.0 Debugging Applications Guide 3-3
Starting RuleViewTo debug an application, start RuleView from the Construction Workbench menu, follow these steps.
1. Select Run > Windows from the Construction Workbench menu. The Windows Execution clientappears.
2. Select the function to execute. If you have set the Debug Start Value set to QUERY, the systemdisplays a dialog with the following message:
Do you wish to start the RuleView?
3. Click Yes.
To debug an individual rule developed in C, open the rule object in a window in ConstructionWorkbench. Right-click and from the menu select Debug Rule .
By default, AppBuilder prompts you to start RuleView when you run your application. In addit ion, youcan configure AppBuilder to always or never use RuleView by selecting the Rule debug option on thePreparation tab of the Workbench Options window. Refer to “UsingAdvanced Preparation Options” inthe Deploying Applications Guide for more information. You can also change the
HPSRT_DEBUG_START statement in the AERuntime section of the hps.ini file. Refer to theConfiguri ng Communicati ons Guide for more instructions on editing the INI file from the ManagementConsole.
You can start RuleView even if you select No from the dialog that asks if you want to run RuleView. Youcan later press Alt+Pause to start RuleView while the application is conversing awindow. The RuleViewwindow appears but remains inactive until you perform an acti on in the application window that endsthe converse. Then the application stops and RuleView becomes active. This only works if you selectedNo from the dialog; you cannot press Alt+Pause if the value of the run-time start debug variable is set toFalse .
Exiting RuleViewTo exit the application, from the pull-down menu select File > Exit application or press Alt+F4 . Thisterminates the application being debugged and exits from RuleView.
To exit RuleView, from the pull-down menu select File > Exit RuleView or press Ctrl+F4 . This exitsfrom RuleView without the application (that i s being debugged) terminating. The applicati on continuesto execute.
You can also cli ck on the X in the upper ri ght corner of the RuleView window. This is the same as exiti ngthe application, that is, it causes the debugger Java virtual machine (JVM) to terminate and RuleView toexit.

8/14/2019 App Builder Debugging Applications
http://slidepdf.com/reader/full/app-builder-debugging-applications 46/88
3-4 Debugging C Appl ications
Understanding the RuleView Interface
Understanding the RuleView InterfaceRuleView is a Rules Language source code debugger that has its own graphical user interface. Once youbecome familiar with the user interface you can perform the debugging operations. It contains thefollowing sections:
• Pull-down Menu
• Toolbar
• Window Areas
• Status Bar
• RuleView Actions
The window for RuleView is shown in Figure 3-1 . Use the RuleView window to find where problems arein the source code.
Fi gu re 3-1 Ru leVi ew f or C wi nd ow
Rule SourceCode Listing
View Hierarchy (or Data View)
Rule Hierarchy (or Tree View)
Toolbar
Status Bar
Process Selector, RuleStack, and Search

8/14/2019 App Builder Debugging Applications
http://slidepdf.com/reader/full/app-builder-debugging-applications 47/88
Understanding the RuleView Interface
AppBuilder 2.1.0 Debugging Applications Guide 3-5
Pull-down MenuPull-down menus allow you to control the debugging actions. Many of these functions are available inright-click menus and from buttons in the Toolbar . Use the RuleView toolbar to quickly access theRuleView Actions .
General Description RuleView for C menuThe File menu lets you exit theapplication being debugged or justexit RuleView without affecting theexecution of the application.
The Edit menu lets you perform asearch or clear the current search.
The Debug menu has most of thedebugging actions, from steppingthrough the execution to sett ing orclearing action points. Besidesbreakpoints and you can also setskippoints.
This menu allows you to set the filteron views currently displaying.
This menu allows you to set filters forobjects currently di splaying in thehierarchy.

8/14/2019 App Builder Debugging Applications
http://slidepdf.com/reader/full/app-builder-debugging-applications 48/88
3-6 Debugging C Appl ications
Understanding the RuleView Interface
Toolbar
Several functions can be run by clicking the buttons in the toolbar. Use the RuleView toolbar to quicklyaccess the RuleView Actions .
Figure 3-2 RuleView for C toolbar
Process Selector, Rule St ack , and Sea rch
When an application runs, it executes rules, beginning with its root rule . If the root rule uses anotherrule, the second rule is added to the list of rules that are currently executing, which is called therulestack. The second rule can i tself use another rule, which is added as well. The rule at the top of thestack is called the executi ng ru le . When the executing rule finishes, it is removed from the stack. Whenyou select a rule from the stack combo box, the rule source code li sting window di splays the source codeof the selected rule and the view hierarchy window shows its associated views.
The application described in the preceding paragraph has only one process, which has the name of theroot rule, and its Rule Stack holds all of the application’s rules. If your application contains aUSERULEDETACH statement, the detached rule has a separate process that RuleView displaysconcurrently with the root process. In other words, if you have multiple processes, multiple processcontexts are displayed. In the C version, the process is assigned a system identifier (HPSID) as well asbeing named according to its root rule. If the same (detached) rule is used more than once, multipleinstances of the process can be distinguished by their unique system numbers.
Refer to Figure 3-1 for the location of the combo boxes. The Rule Stack combo box shows all thecurrently available rules for the current thread. Choose one in the combo box to see the correspondingsource code and available data. The Thread combo box shows all currently available threads. It is used toswitch between threads and to view corresponding source code, available stacks and their data. TheSearch window allows you to search for an alphanumeric string in the rule source code. The source codesearch engine is a text f ield to the right of the Rule Stack combo box. Type the string to look for and pressEnter . The first source line containing the string being searched is selected. For a repeated search to findthe next occurrence of that string, press F3 in the source code window.
Window AreasThe window areas include:
• Rule Hierarchy
• View Hierarchy
• Rule Source Code Listing
Go
Step
Trace
Skip
Set breakpoint
Set skippoint
Process selector
Rule Stack combo box
Search

8/14/2019 App Builder Debugging Applications
http://slidepdf.com/reader/full/app-builder-debugging-applications 49/88
Understanding the RuleView Interface
AppBuilder 2.1.0 Debugging Applications Guide 3-7
Rule HierarchyThe rules, components, and windows associated with the application being run are shown in theRuleHierarchy (or TreeView) window. The rules are displayed in a tree format, with each rule displayedas the child of the rule that uses it. You can browse through the view by expanding or collapsingbranches of the tree. Components and windows are distinguished from rules by different icons. TheRuleHi erarchy is in the upper ri ght corner of the window. Click on the tree item to see the source codecorresponding to that item. Use the Hierarchy pull-down menu to select which elements are displayed inthe Rule Hierarchy window. Refer to Figure 3-1 for the locati on of the Rule Hierarchy window.
To display the source code for a rule in the rule source window, double-click on the rule in the RuleHierarchy window or select the rule in the Rule Hierarchy window and press Enter .
View HierarchyThis area displays the views associated with the rule currently displayed in the rule source window. If therule being displayed is not loaded, the view hierarchy (or data view) window is blank. This is in theupper left corner of the RuleView window. It displays all the data available in the current stack. Expandnon-leaf nodes to see the value of the fields of previously selected views. This is a tree display, where youcan browse through the view by expanding or collapsing branches of the tree. Refer to Figure 3-1 for thelocation of the view hierarchy window.
Rule Source Code ListingThe rule source code listing window displays the Rules Language source code for rules that are beingexecuted. This area shows the rule currently selected either by the execution flow, the Rule Hierarchywindow, or the Rule Stack combo box selection. The position of the currently selected line is indicatedby an arrow (called the execution pointer) in the RuleView interface. The execution pointer marks theline that is executed next for that rule, in the context of a given process. Refer to Figure 3-1 for thelocation of the rule source code listing window.
Use the rule source window to set breakpoints and skippoints, perform text searches, and monitorexecution of the current rule. Color is used to highlight comments, keywords, symbols, and breakpoints.Icons on the left edge of the rule source window identify source line properties. A colored-bar cursorindicates the selected line within the source code, and is used to specify the target line for adjustingbreakpoints and skippoints. Addi tionally, the cursor indicates the progress of text searches.
Note RuleView depends upon auxiliary files generated during preparation to locate rules used in the application.If the function being debugged has not been super prepared, or if rules have been added or removed sincethe last super prepare, RuleView may not be able to display the rule hierarchy properly. Consequently, itmay not be possible to view the source code for some rules.

8/14/2019 App Builder Debugging Applications
http://slidepdf.com/reader/full/app-builder-debugging-applications 50/88
3-8 Debugging C Appl ications
Understanding the RuleView Interface
Stat us Bar
The status bar at the bottom of the window displays relevant information about the state of theexecution of the rule or applicati on. The status bar identifies the following items.
• Process identifies the process context displayed in the window.
• Status tells whether the application is stopped (and RuleView is active) or running (and RuleView isinactive).
• Mode is the way RuleView is executing the process: step (stop at each line) or go (run until it hits abreakpoint).
• System I D is the unique number that differentiates multiple instances of a process. This number isalso displayed in brackets before the process name in the process selector on the toolbar.
Refer to Figure 3-1 for the locati on of the status bar.
RuleView ActionsFor a summary of the debug actions that can be performed from RuleView for C, see Table3-2 .Table 3-2 RuleView for C action summary
Ac ti on Menu Command Toolbar Bu tt on Ac cel erat or Butt on
Continueexecution Debug Go Run F5
Pauseexecution Debug Pause Pause
Step over Debug Step over Step over F7
Step into Debug Step into Step into F8
Step out Debug Step out Step out F6
Set breakpoint Debug Set breakpoint Set breakpoint F9
Clear breakpoint Debug Clear breakpoint Clear breakpoint
Set watchpoint Right-click Set Watchpoint
Removewatchpoint Right-click Remove Watchpoint
Clear all watchpoints Debug Clear watchpoint
Exit application File Exit application Alt+F4
Exit RuleView File Exit rule view Ctrl+F4
Add or remove watches Right-click Add Watch
Modify value Right-click Modify value .

8/14/2019 App Builder Debugging Applications
http://slidepdf.com/reader/full/app-builder-debugging-applications 51/88
Debugging with RuleView
AppBuilder 2.1.0 Debugging Applications Guide 3-9
Debugging w ith RuleView
You can debug individual rules locally, standalone C applications with RuleView, or a distributed Capplicati on with Distr ibuted RuleView. For distributed applicati ons, as long as RuleView is running inthe Execution Client and the debug environment is configured correctly, RuleView starts automaticallywhen your application calls a remote rule. For debugging a distributed application, refer to the sectionChapter 4, “ Debugging Distr ibuted (Remote) Applications” .
With RuleView, you can perform the following debugging tasks:
• Finding and Viewing Rule Source (and any rule in its data universe)
• Editing Contents of a Value (of any field within a view)
• Stepping Through a Rule (one statement at a time)
• Tracing the Execution
• Using Action Points (to break on any line of rule source code or skip a step)
• RuleView Window Settings (C Only)
For a quick summary of the debug functions that can be performed and the part of the RuleViewinterface that is used to perform that action, see Table3-2 .
Finding and View ing Rule SourceThe rule source code listing area shows the source code of the rule. The position of the currently selectedline is indicated by an arrow (called the execution pointer) in the RuleView interface. The executionpointer marks the line that is executed next for that rule, in the context of a given process. By default , theRule Hierarchy , View Hierarchy , and Rule Source Code Listing windows open when you run RuleView.You can change the look and feel of the rule source; refer to “RuleView Window Sett ings (C Only)” .
If you want to find a part icular part of the code in this window, use the Process Selector, Rule Stack, andSearch faciliti es in the toolbar. The search engine helps you find a particular str ing of text in any line ofcode in that rule.
Editing Contents of a Value
Use the view hierarchy Value edit control, located above the View Hierarchy , to enter or modify data forfields (variables) used by the displayed rule. When you click on a field node within the tree, the value ofthe field is displayed in the Value edit control.
To edit the value of a field, select the field and click on the Value edit control and double-click on thefield. Or select the field and type. To commit the change, move the keyboard focus out of the Value editfield (for example, select another field node or click on a different part of the window). Or press Enter .To abandon the change, press Esc. If you continue execution while editing a field value, the changes arecancelled automatically.
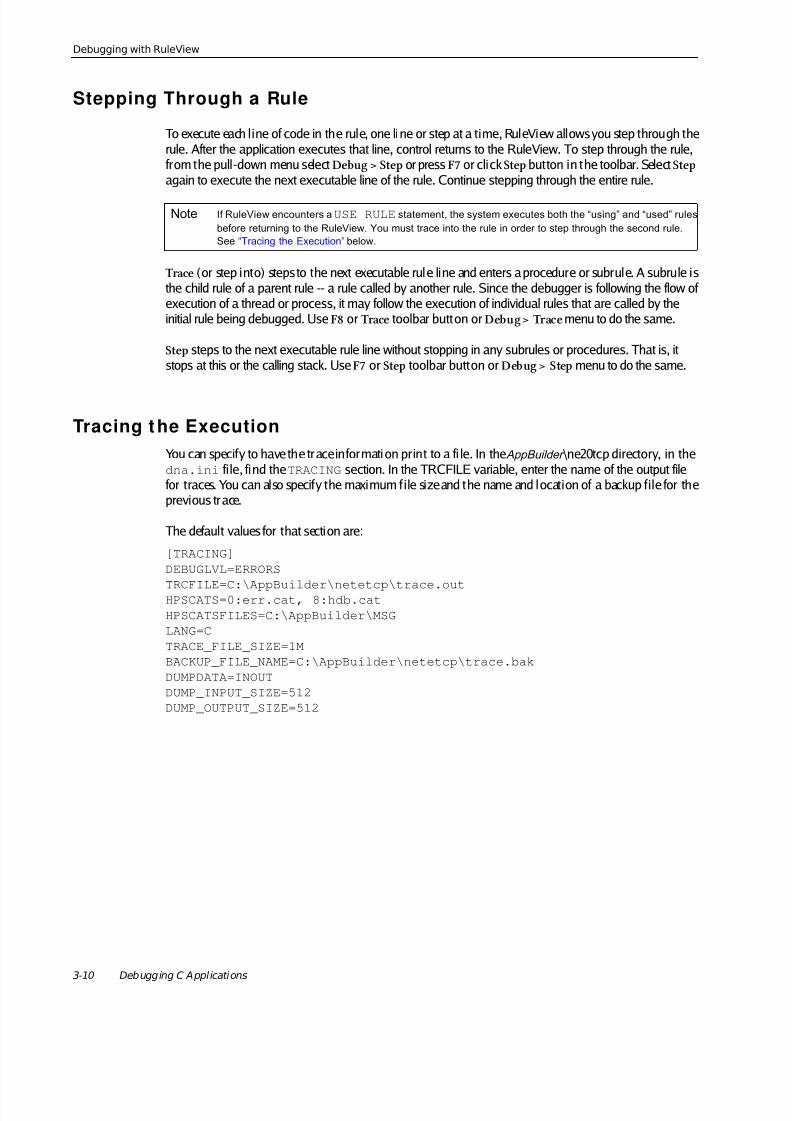
8/14/2019 App Builder Debugging Applications
http://slidepdf.com/reader/full/app-builder-debugging-applications 52/88
3-10 Debugging C Applications
Debugging with RuleView
Stepping Through a Rule
To execute each line of code in the rule, one line or step at a time, RuleView allows you step through therule. After the application executes that line, control returns to the RuleView. To step through the rule,from the pull-down menu select Debug > Step or press F7 or click Step button in the toolbar. Select Stepagain to execute the next executable line of the rule. Continue stepping through the entire rule.
Trace (or step into) steps to the next executable rule line and enters a procedure or subrule. A subrule isthe child rule of a parent rule -- a rule called by another rule. Since the debugger is following the flow ofexecution of a thread or process, it may follow the execution of individual rules that are called by theinitial rule being debugged. Use F8 or Trace toolbar button or Debug > Trace menu to do the same.
Step steps to the next executable rule line without stopping in any subrules or procedures. That is, itstops at this or the calling stack. Use F7 or Step toolbar button or Debug > Step menu to do the same.
Tracing t he ExecutionYou can specify to have the trace information print to a fi le. In the AppBuilder \ne20tcp directory, in thedna.ini file, find the TRACING section. In the TRCFILE variable, enter the name of the output filefor traces. You can also specify the maximum file size and the name and location of a backup file for theprevious trace.
The default values for that section are:
[TRACING]DEBUGLVL=ERRORS
TRCFILE=C:\AppBuilder\netetcp\trace.outHPSCATS=0:err.cat, 8:hdb.catHPSCATSFILES=C:\AppBuilder\MSGLANG=CTRACE_FILE_SIZE=1MBACKUP_FILE_NAME=C:\AppBuilder\netetcp\trace.bakDUMPDATA=INOUTDUMP_INPUT_SIZE=512DUMP_OUTPUT_SIZE=512
Note If RuleView encounters a USE RULE statement, the system executes both the “using” and “used” rulesbefore returning to the RuleView. You must trace into the rule in order to step through the second rule.See “Tracing the Execution” below.

8/14/2019 App Builder Debugging Applications
http://slidepdf.com/reader/full/app-builder-debugging-applications 53/88
Debugging with RuleView
AppBuilder 2.1.0 Debugging Applications Guide 3-11
Using Action PointsThere are action points that let you stop or skip or evaluate variables at certain points (or lines of code).These include:
• Setting and Clearing a Breakpoint
• Setting and Clearing a Skippoint
• RuleView Window Settings (C Only)
Setting and Clearing a BreakpointOf course, stepping and t racing through each li ne of code is not always practical. This is precisely whyRuleView allows you to break (or halt) the execution of the application at a specific line in your sourcecode, called a breakpoint. When you set a breakpoint on a line and then let the application run,RuleView automatically regains control just before the breakpoint line is executed, enabling you toexamine the contents of relevant views or change the values of fields. When you set a breakpoint at theselected location in the source code window, when any thread of the application (or rule) reaches this
location, execution is suspended and has the pointer. To run the application up to the next breakpoint,select Debug > Go , click the icon on the toolbar, or press F5.
This feature is available both in suspended and unsuspended modes. Breakpoints remain active untilthey are removed by the clear breakpoint command and they affect any command. That is, if theexecution reaches a breakpoint with the step over command, execution is suspended and step over isautomatically canceled.
Remember that some Restrictions apply to breakpoints.
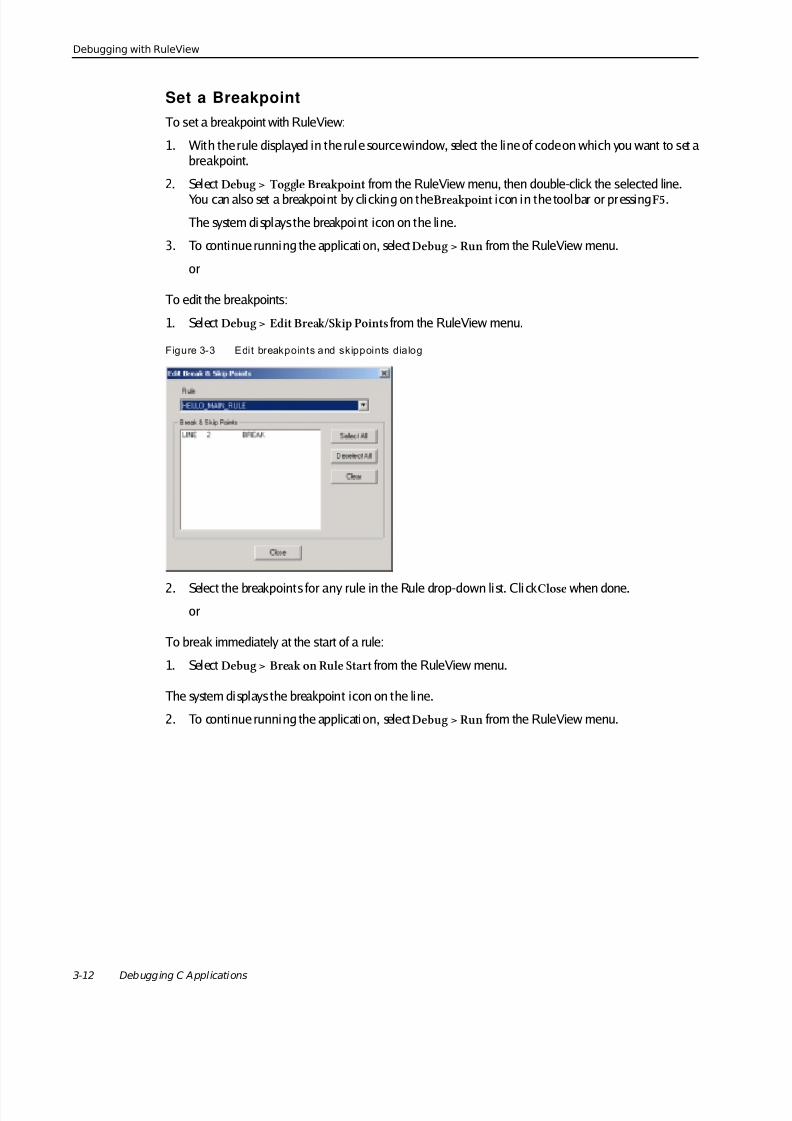
8/14/2019 App Builder Debugging Applications
http://slidepdf.com/reader/full/app-builder-debugging-applications 54/88
3-12 Debugging C Applications
Debugging with RuleView
Set a BreakpointTo set a breakpoint with RuleView:
1. With the rule displayed in the rule source window, select the line of code on which you want to set abreakpoint.
2. Select Debug > Toggle Breakpoint from the RuleView menu, then double-click the selected line.You can also set a breakpoint by clicking on the Breakpoint icon in the toolbar or pressing F5.
The system displays the breakpoint icon on the line.
3. To continue running the application, select Debug > Run from the RuleView menu.
or
To edit the breakpoints:
1. Select Debug > Edit Break/Skip Points from the RuleView menu.
Figure 3-3 Edit breakpoints and skippoints dialog
2. Select the breakpoints for any rule in the Rule drop-down list. Cli ck Close when done.or
To break immediately at the start of a rule:
1. Select Debug > Break on Rule Start from the RuleView menu.
The system displays the breakpoint icon on the line.
2. To continue running the application, select Debug > Run from the RuleView menu.
8/14/2019 App Builder Debugging Applications
http://slidepdf.com/reader/full/app-builder-debugging-applications 55/88
Debugging with RuleView
AppBuilder 2.1.0 Debugging Applications Guide 3-13
Clear a Breakpoint
To clear a breakpoint in RuleView:
1. With the rule displayed in the rule source window, select the line of code on which you want to cleara breakpoint.
2. Select Debug > Toggle Breakpoint from the RuleView menu, then double-click the selected line.The display color changes to identify that the breakpoint has been removed.
or
1. Select Edit Break/Skip Points from the Debug menu and de-select the break point for the rule thatyou want to clear. Click Close when done.
To continue running the application, select Debug > Run or the toolbar, or press F5.
Clear All Breakpoints
To clear all the breakpoints throughout an application, select Edit Break/Skip Points from the Debug menu and de-select all the break points for each rule.
Remember that some Restrictions apply to breakpoints.

8/14/2019 App Builder Debugging Applications
http://slidepdf.com/reader/full/app-builder-debugging-applications 56/88
3-14 Debugging C Applications
Debugging with RuleView
Restrictions
Because each breakpoint or skippoint is attached to a line number rather than to a particular RulesLanguage statement, if you change a rule you must verify that the action points are still in the correctpositions before debugging.
For example, if you set a breakpoint on l ine 10 and then add a line of code before line 10, the systemattaches the breakpoint to the new line of code. You must manually clear the breakpoint and create anew breakpoint on line 11. Refer to Setting and Clearing a Breakpoint , Setting and Clearing a Skippoint ,and RuleView Window Settings (C Only) for procedures on setting and clearing action points.
The fol lowing Rules Language statements cannot include action points:
• Comment lines
• Blank lines
• Any li nes that include the following statements:
• CASE (but you can set a breakpoint on a CASEOF statement)
• Any type of END (ENDDO, ENDIF, and so forth)• WHILE
• ELSE
• DCL
• Local variable declarations (between DCL and ENDDCL)
In addition to these, do not use skippoints with the following statements:
• CASEOF – A skippoint placed on the last li ne of a case causes execution to continue into the nextcase.
• SQL ASIS
• WHILE loops – If you place a skippoint on a line that generates the condit ion that terminates aWHILE loop, an infinite loop results.

8/14/2019 App Builder Debugging Applications
http://slidepdf.com/reader/full/app-builder-debugging-applications 57/88
Debugging with RuleView
AppBuilder 2.1.0 Debugging Applications Guide 3-15
Setting and Clearing a Skippoint
In the C version, RuleView enables you to skip a line of code and move execution to the next li ne,ignoring rule logic. The way you do this is by defining a skippoint . For example, you could skip overaCONVERSE statement to avoid conversing the window, but still execute subsequent statements in therule.
Remember that some Restrictions apply to skippoints.
Set or Clear Sk ippoint
To set or to clear a skippoint from RuleView, follow these steps.
1. Display the rule in the rule source window.
2. Select the line of code on which you want to set (or clear) a skippoint .
3. Select Debug > Toggle Skippoint from the pull-down menu. You can also set a breakpoint bypressing F10 or by clicking on the Skip icon in the toolbar. The system displays the skip icon on theline.
4. To set or clear skippoints throughout an application, select Debug > Edit Break/Skip Points fromthe RuleView menu and select or de-select skip points.
Clear All Skippoints
To clear all the breakpoints throughout an application, select Edit Skippoints from the Debug menu.
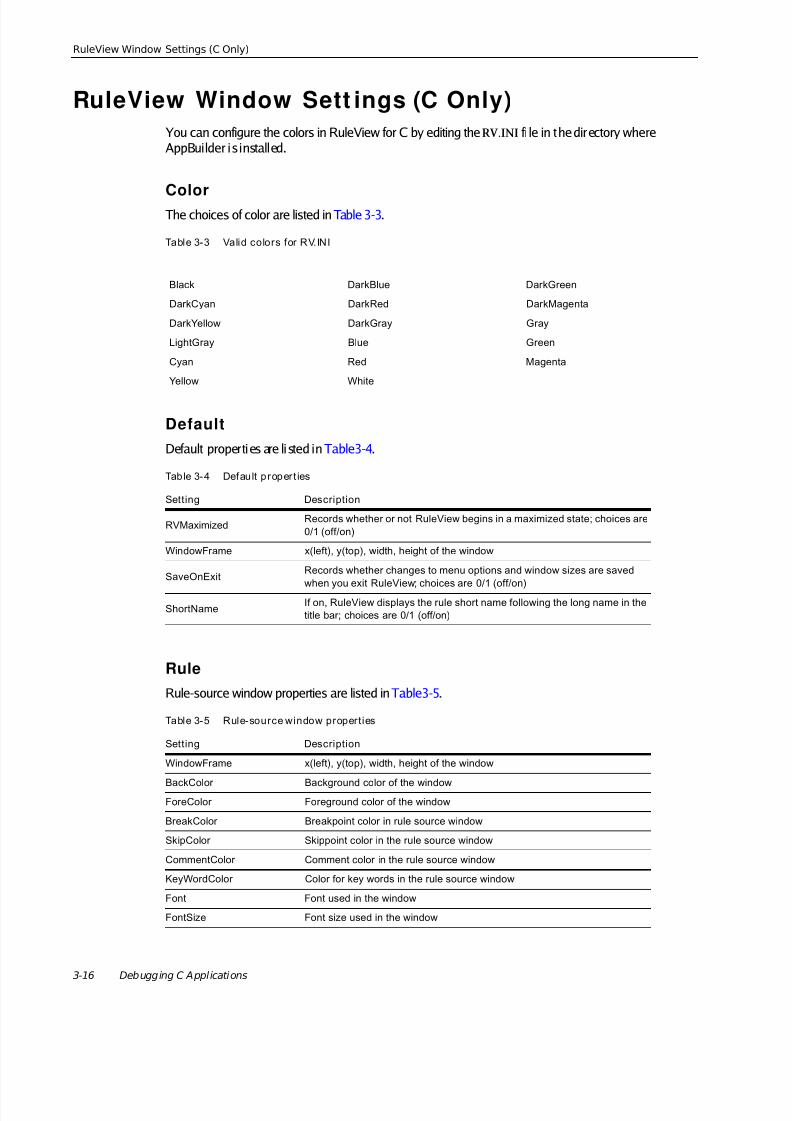
8/14/2019 App Builder Debugging Applications
http://slidepdf.com/reader/full/app-builder-debugging-applications 58/88
3-16 Debugging C Applications
RuleView Window Settings (C Only)
RuleView Window Sett ings (C Only)You can configure the colors in RuleView for C by editing the RV.INI fi le in the directory whereAppBuilder is installed.
ColorThe choices of color are listed in Table 3-3 .
DefaultDefault properties are li sted in Table3-4 .
RuleRule-source window properties are listed in Table3-5 .
Table 3-3 Valid colors for RV.INI
Black DarkBlue DarkGreen
DarkCyan DarkRed DarkMagenta
DarkYellow DarkGray Gray
LightGray Blue Green
Cyan Red Magenta
Yellow White
Table 3-4 Default p roper t ies
Setting Description
RVMaximizedRecords whether or not RuleView begins in a maximized state; choices are0/1 (off/on)
WindowFrame x(left), y(top), width, height of the window
SaveOnExitRecords whether changes to menu options and window sizes are savedwhen you exit RuleView; choices are 0/1 (off/on)
ShortNameIf on, RuleView displays the rule short name following the long name in thetitle bar; choices are 0/1 (off/on)
Table 3-5 Rule-source window properties
Setting Description
WindowFrame x(left), y(top), width, height of the window
BackColor Background color of the windowForeColor Foreground color of the window
BreakColor Breakpoint color in rule source window
SkipColor Skippoint color in the rule source window
CommentColor Comment color in the rule source window
KeyWordColor Color for key words in the rule source window
Font Font used in the window
FontSize Font size used in the window
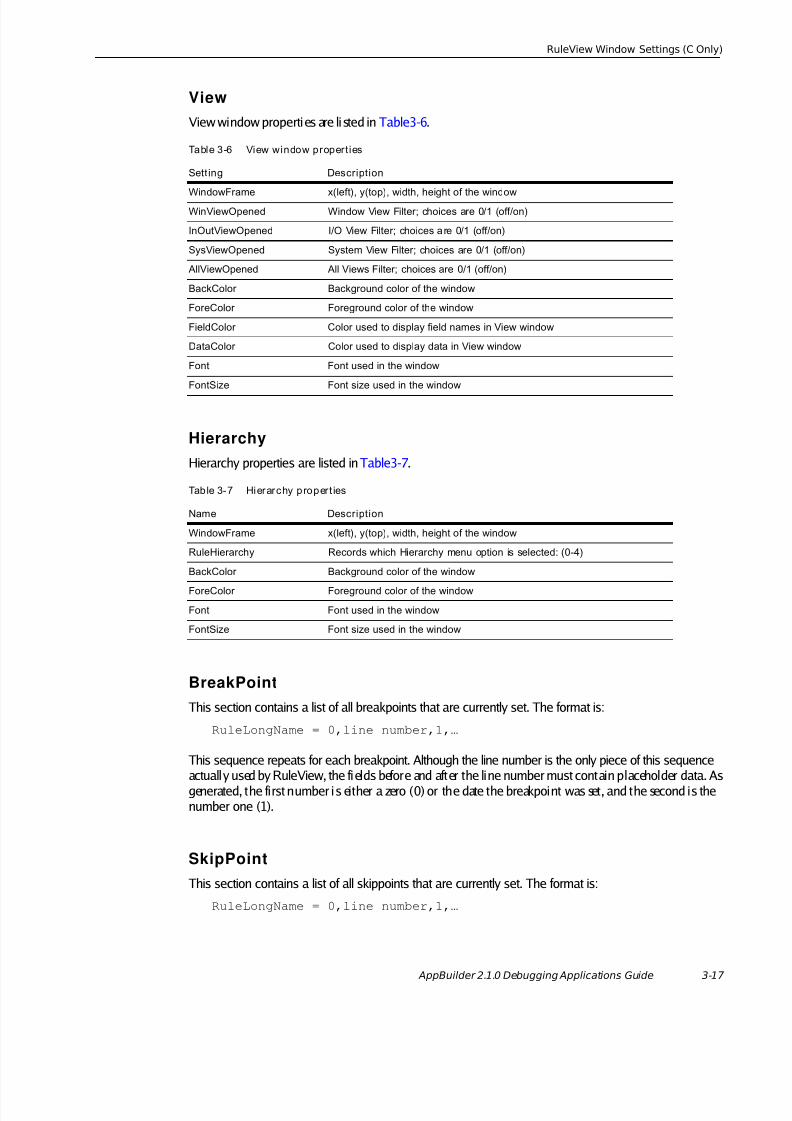
8/14/2019 App Builder Debugging Applications
http://slidepdf.com/reader/full/app-builder-debugging-applications 59/88
RuleView Window Settings (C Only)
AppBuilder 2.1.0 Debugging Applications Guide 3-17
ViewView window properties are li sted in Table3-6 .
HierarchyHierarchy properties are listed in Table3-7 .
BreakPointThis section contains a list of all breakpoints that are currently set. The format is:
RuleLongName = 0,line number,1,…
This sequence repeats for each breakpoint. Although the line number is the only piece of this sequenceactually used by RuleView, the fields before and after the line number must contain placeholder data. Asgenerated, the first number i s either a zero (0) or the date the breakpoint was set, and the second is thenumber one (1).
SkipPointThis section contains a list of all skippoints that are currently set. The format is:
RuleLongName = 0,line number,1,…
Table 3-6 View window properties
Sett ing Description
WindowFrame x(left), y(top), width, height of the windowWinViewOpened Window View Filter; choices are 0/1 (off/on)
InOutViewOpened I/O View Filter; choices a re 0/1 (off/on)
SysViewOpened System View Filter; choices are 0/1 (off/on)
AllViewOpened All Views Filter; choices are 0/1 (off/on)
BackColor Background color of the window
ForeColor Foreground color of the window
FieldColor Color used to display field names in View window
DataColor Color used to display data in View window
Font Font used in the window
FontSize Font size used in the window
Table 3-7 Hierarchy proper t ies
Name Description
WindowFrame x(left), y(top), width, height of the window
RuleHierarchy Records which Hierarchy menu option is selected: (0-4)
BackColor Background color of the window
ForeColor Foreground color of the window
Font Font used in the window
FontSize Font size used in the window
8/14/2019 App Builder Debugging Applications
http://slidepdf.com/reader/full/app-builder-debugging-applications 60/88
3-18 Debugging C Applications
RuleView Window Settings (C Only)
This sequence repeats for each skippoint. Although the line number is the only piece of this sequenceactually used by RuleView, the fields before and after the line number must contain placeholder data. Asgenerated, the first number i s either a zero (0) or the date the skippoint was set, and the second is thenumber one (1).

8/14/2019 App Builder Debugging Applications
http://slidepdf.com/reader/full/app-builder-debugging-applications 61/88
AppBuilder 2.1.0 Debugging Applications Guide 4-1
CHAPTER
4DEBUGGING DISTRIBUTED (REM OTE)APPLICATIONS
AppBuilder 2.1.0 Debugging Applications Guide
For distributed applications, you can run a version of RuleView that debugs remote services (or rules)from a client workstation without logging on to that remote machine. The command line utility thathandles this is the Distributed RuleView (DRV) debugger. This utility allows debugging of Java clientsand C clients that use a Departmental Server (C server). To understand more about the process ofremote debugging of the Departmental Server, read these:
• Debugging in a Distributed Application
• Configuring Distributed RuleView• Adding and Editi ng Breakpoints
To debug services for a distributed application, enter the commands at the DRV prompt in thecommand prompt window. You must specify a valid breakpoint to stop execution of the rule. Enter thestep or go command to begin execution. Refer to “Distributed RuleView Commands” for a list of theDRV commands.
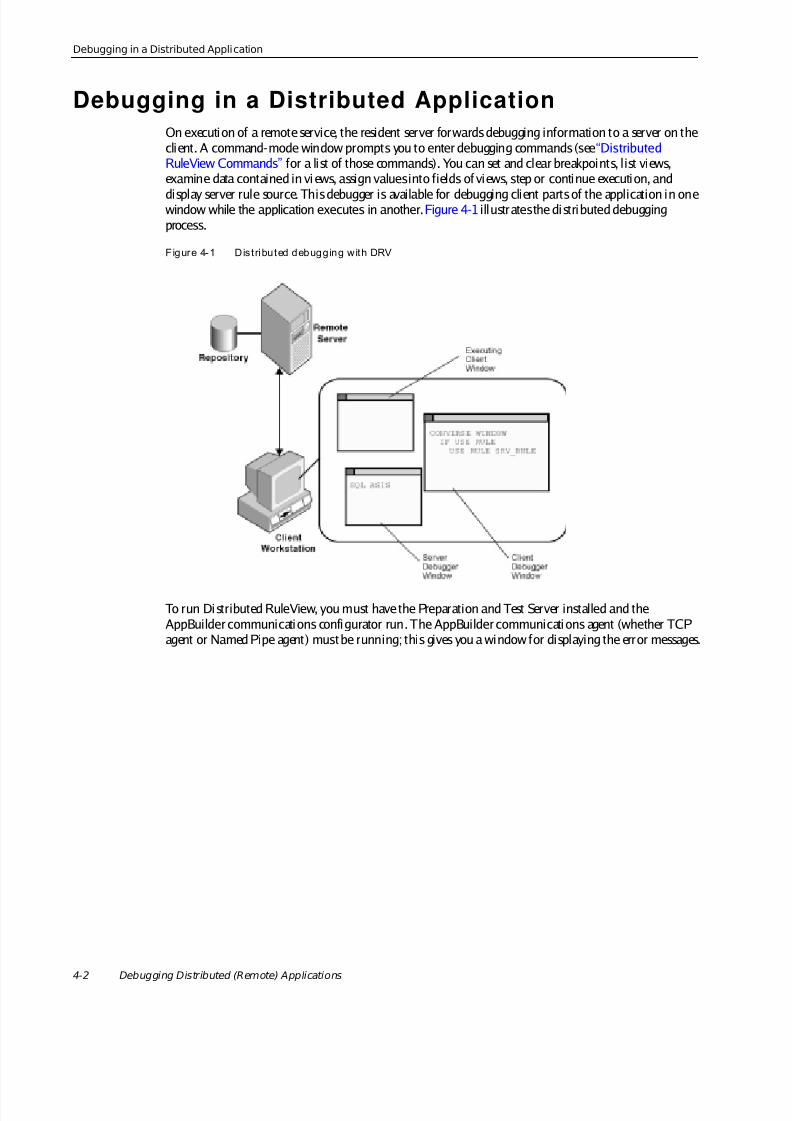
8/14/2019 App Builder Debugging Applications
http://slidepdf.com/reader/full/app-builder-debugging-applications 62/88
4-2 Debugging Distributed (Remote) Applications
Debugging in a Distributed Application
Debugging in a Distributed ApplicationOn execution of a remote service, the resident server forwards debugging information to a server on theclient. A command-mode window prompts you to enter debugging commands (see “DistributedRuleView Commands” for a list of those commands). You can set and clear breakpoints, list views,examine data contained in vi ews, assign values into fields of views, step or continue execution, and
display server rule source. This debugger is available for debugging client parts of the application in onewindow while the application executes in another. Figure 4-1 illustrates the distributed debuggingprocess.
Figure 4-1 Dis t ributed debugging with DRV
To run Distributed RuleView, you must have the Preparation and Test Server installed and theAppBuilder communications configurator run. The AppBuilder communicati ons agent (whether TCPagent or Named Pipe agent) must be running; this gives you a window for displaying the error messages.

8/14/2019 App Builder Debugging Applications
http://slidepdf.com/reader/full/app-builder-debugging-applications 63/88
Distributed RuleView Commands
AppBuilder 2.1.0 Debugging Applications Guide 4-3
Distributed RuleView Comm andsThe commands are li sted in Table4-1 .
Assigning Values to VariablesThe full form of the assign command is:
assign view_name {[ subscript ]}{ . subview_name [ subscript ]}*.field value
where view_name is the name of the view and the subview_name is the name of the view withinthat view; the field is the name of the field and value is the value to assign.
Table 4-1 DRV commands
Command Action performed
assign view_name field value Assign a value to a variable. See the full description below.
break line_number Set breakpoints at a specified line number. A breakpoint can be set only at an executable line.
cancel line_number Cancel breakpoints at specified line numbers.
display Display breakpoints.
help Display a list of available commands.You can also type a question mark (?) to display help.
go Execute to the next breakpoint.If you have not set breakpoints, the rule completes execution.
list [start_line [end_line]]
Display source code.If you do not specify the start line, the display begins with the
currently executing line. If you do not specify an end line, thedisplay lists ten lines. Lines on which you have set breakpointsare prepended with a B. The currently executing line is prefixed
with an arrow ( ->) .
print view_name Display the contents of a specified view.
step Single-step through source code.
trace If you are single-stepping through a rule, you step into asubordinate rule
viewList the views available to a rule.Because view names are case-sensitive, enter the view namein upper case in RuleView commands.
where Display the server rule stack.
8/14/2019 App Builder Debugging Applications
http://slidepdf.com/reader/full/app-builder-debugging-applications 64/88
4-4 Debugging Distributed (Remote) Applications
Configuring Distributed RuleView
Configuring Dist ributed RuleViewTo use the Distri buted RuleView debugger, follow these steps. (See your installation documentation forinformation on making network configuration modifications.)
1. Using the AppBuilder communications configurator, configure the network protocols for yourworkstation both as a cli ent and a DRV server. AppBuilder uses the dna.ini fi le to maintainnetwork connections between workstations.
The DRV server is the AppBuilder communications agent on the local machine. The system createsa minimized icon for the executing agent on the workstation. Maximize the agent to view theexecuting remote server rule.
2. Set the DRV_DEBUG vari able in the DRV section of the dna.ini file for the application clientmachine is set to Y for yes.
3. Set the STATIC_DATA_OPTIMIZE and DYNAMIC_DATA_OPTIMIZE variables in the DNA section of the dna.ini file in the remote server environment are both set to N for no.
4. Verify the DRV_SRC_DIR variable in the dna.ini on the application server machine is correctlyset. DRV transfers the rule source from the server to the directory specified on the client machine.
5. In the LU2 section of the dna.ini file is a variable, LU2_DLL , that identifies the terminalemulation DLL in use. Set the value and do not specify the DLL extension; i t is assumed.
Use the configurable parameter in the hps.ini file that contains an operational sett ing for theConstruction Workbench. In the installed directory ( C:\AppBuilder by default), the hps.ini fi lecontains, in the AE Runtime section, the following parameters can be set:
HPSRT_DEBUG_START=QUERY
The HPSRT_DEBUG_START values are summarized in Table4-2 .Table 4-2 Run Debug start values
Value Description
QUERY This is the default value. When set, AppBuilder asks you if you want to startRuleView each time you run an application.
TRUEWhen set, AppBuilder starts RuleView automatically each time you run anapplication.
FALSE When set, AppBuilder never starts RuleView when you run an application.
8/14/2019 App Builder Debugging Applications
http://slidepdf.com/reader/full/app-builder-debugging-applications 65/88
Adding and Editing Breakpoints
AppBuilder 2.1.0 Debugging Applications Guide 4-5
Adding and Editing Breakpoint sYou can set the breakpoints in a fi le called bkpts.txt in the Files subdirectory in the installati ondirectory. On one line, type in the short name of the rule; on the next line, type in the line numbers onwhich breakpoints are set. Separate numbers with a space. To set breakpoints for rules:
1. Create a file called brkpts.txt in the directory specifi ed in the DRV_SRC_DIR variable in theDRV section in the dna.ini file for the DRV server.
2. In the breakpoints file, enter:
• The system ID (in ALL CAPS)
• A return
• The line numbers in the rule source fi le on which you want to set a breakpoint
If you enter more than one line number, put a space between the numbers.
3. Enter all rules in which you want to set breakpoints in this file, except for breakpoints in line 1,which cause the rule to pause on the first executable line.
Breakpoints must be for valid lines or they are deleted.Example
For example, the following file sets breakpoints on lines 10 and 20 of the source code for the ruleRuleA, and a breakpoint on line 1 of the source code for rule RuleB:
RULEA10 20RULEB1

8/14/2019 App Builder Debugging Applications
http://slidepdf.com/reader/full/app-builder-debugging-applications 66/88
4-6 Debugging Distributed (Remote) Applications
Adding and Editing Breakpoints
8/14/2019 App Builder Debugging Applications
http://slidepdf.com/reader/full/app-builder-debugging-applications 67/88
AppBuilder 2.1.0 Debugging Applications Guide 5-1
CHAPTER
5DEBUGGING BATCH APPLICATION S
AppBuilder 2.1.0 Debugging Applications Guide
You use the batch version of RuleView when you want to debug a mainframe batch application. Thebatch debugger combines all of the AppBuilder CICS RuleView debugger functions with the addedpower of ISPF scrolling and unlimited panel display nesting. Invoke the debugger with the TE actionfrom the mainframe.
You can set or reset breakpoints to enter the debugger before and after a selected rule, component, orreport is called. You can set breakpoints before and after DB2 calls. You can display, change, save,
retrieve, and restore views, subviews, and fields. You can also browse any rule’s or component’s sourcecode.
This topic includes:
• Batch RuleView Commands and Function Keys
• Batch RuleView Panels
The primary debugger displays are:
• Breakpoint Display
• View Display
• Field Display
• Save Display
• Data Display
• Source Code Display

8/14/2019 App Builder Debugging Applications
http://slidepdf.com/reader/full/app-builder-debugging-applications 68/88
5-2 Debugging Batch Applications
Batch RuleView Commands and Function Keys
Batch RuleView Comm ands and Function KeysLike other ISPF applications, you control the debugger by entering commands on the command line.Table5-1 shows the commands in effect when HPSBATCH is selected with the optionNEWAPPL(HPSB), as it is in the supplied test method. Enter the ISPF PFSHOW or KEYS command todisplay the function-key (abbreviated as the letter F with the number of the key) definitions on the
panel.Table 5-1 Batch RuleView default function keys
Key Command Description
F3 END Returns to the previous display or continues if at top level.
F4 RETURN Exits the debugger and continues pr ocessin g to the next selected breakpoint.
F6 STOP Ends debug mode but continues processing. Implies a RETURN.
F7 UP Scrolls up. Same as ISPF edit and browse.
F8 DOWN Scrolls down. Same as ISPF edit and browse.
F10 SAVE Saves the view or field to a test data file on disk.
F11 DATA Retrieves or deletes from the test data file on disk.
F12 RESTORE Restores th e view or field to its values when first displayed.F13 INPUT Displays/modifies the input view of the current rule, component, or report.
F14 OUTPUT Displays/modifies the output view of the current rule, component, or report.
F15 LOCAL Displays the local view of the current rule, component, or report.
F17 SKIP Skips a call to this rule, component, or report. Implies a RETURN.
F18 REPEAT Repeats a call to this rule, component, or report. Implies a RETURN.
F21 TOGGLE Expands or contracts the display mode for a view.
F22 SOURCE Browses the source code of current rule or component.
F23 BREAK Sets and removes breakpoints for rules, components, or reports.
F24 CURSOR Positions the cursor at the command line.
CANCEL Abends processing immediately.

8/14/2019 App Builder Debugging Applications
http://slidepdf.com/reader/full/app-builder-debugging-applications 69/88
Batch RuleView Panels
AppBuilder 2.1.0 Debugging Applications Guide 5-3
Batch RuleView PanelsThe primary debugger displays are:
• Breakpoint Display
• View Display
• Field Display
• Save Display
• Data Display
• Source Code Display
You can use the commands listed in Table 5-1 from any of these panels. However, the data manipulationcommands (SAVE, DATA, RESTORE) do not apply to breakpoints, and TOGGLE applies only to views.These panels are stacked in the standard ISPF fashion and displayed again when you issue an ENDcommand.
A call t race message is written to the ISPF log fi le every time you enter the debugger, regardless ofwhether you set a breakpoint for the particular call. This message is identical to the status line displayedon the debugger panels.
POSITION CALL FROM RULENAME TO COMPNAME AT LINE XX
• POSITION is either BEFORE, AFTER, SKIPPED, or REPEATING
• RULENAME is the name of the calling rule (or report)
• COMPNAME is the name of the rule, component, or report being called
• XX is the line number of the USE or CONVERSE statement being executed
You can display the trace output with the ISPF Dialog Test browse log facility, which is option 7.5 of theprimary menu.

8/14/2019 App Builder Debugging Applications
http://slidepdf.com/reader/full/app-builder-debugging-applications 70/88
5-4 Debugging Batch Applications
Breakpoint Display
Breakpoint DisplayThe breakpoint selection panel is displayed the first time you enter the debugger, or in response to theBREAK command. A select field, rule, component, or report name and description are displayed oneach line. To set a breakpoint, tab to the entity you want to select and type Y over the default N next tothe entity’s name. To remove a breakpoint, leave the N next to the entity. The debugger is activated before
and after a selected rule, component, or report is called. Figure 5-1 is the breakpoint display from asimple applicati on.
Fi gu re 5-1 B reak po in t d is pl ay
BREAKPOINTS
ROW 1 OF 4COMMAND
===> SCROLL ===>PAGE
BEFORE CALL FROM HPSBATCH TO RDB2PLI_LONG_NAME AT LINE 0.
N CDB2PLJ_LONG_NAME CDB2PLJ
N CDB2PLI_LONG_NAME CDB2PLI
N RDB2PLJ_LONG_NAME RDB2PLJ
N RDB2PLI_LONG_NAME RDB2PLI
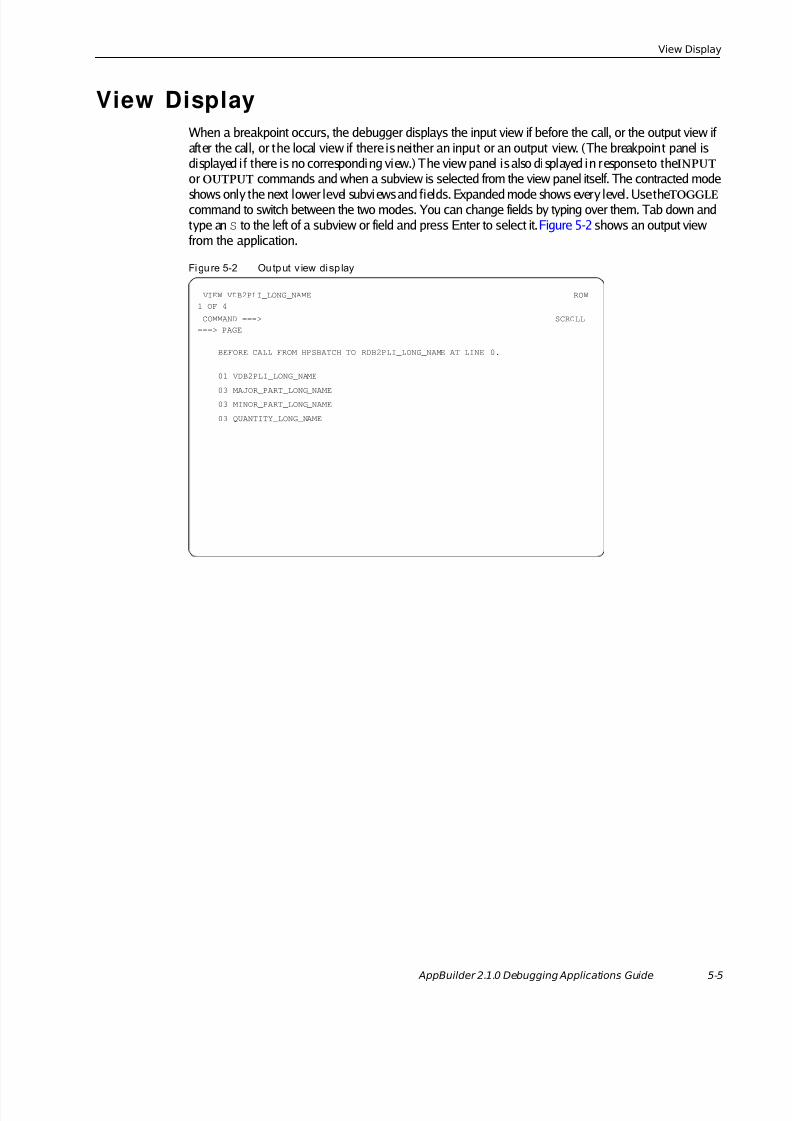
8/14/2019 App Builder Debugging Applications
http://slidepdf.com/reader/full/app-builder-debugging-applications 71/88
View Display
AppBuilder 2.1.0 Debugging Applications Guide 5-5
View DisplayWhen a breakpoint occurs, the debugger displays the input view if before the call, or the output view ifafter the call, or the local view if there is neither an input or an output view. (The breakpoint panel isdisplayed if there is no corresponding view.) The view panel is also displayed in response to the INPUT or OUTPUT commands and when a subview is selected from the view panel itself. The contracted mode
shows only the next lower level subviews and fields. Expanded mode shows every level. Use the TOGGLE command to switch between the two modes. You can change fields by typing over them. Tab down andtype an S to the left of a subview or field and press Enter to select it. Figure 5-2 shows an output viewfrom the application.
Fi gu re 5-2 Ou tp ut v iew di sp lay
VIEW VDB2PLI_LONG_NAME ROW1 OF 4
COMMAND ===> SCROLL===> PAGE
BEFORE CALL FROM HPSBATCH TO RDB2PLI_LONG_NAME AT LINE 0.
01 VDB2PLI_LONG_NAME
03 MAJOR_PART_LONG_NAME03 MINOR_PART_LONG_NAME
03 QUANTITY_LONG_NAME

8/14/2019 App Builder Debugging Applications
http://slidepdf.com/reader/full/app-builder-debugging-applications 72/88
5-6 Debugging Batch Applications
Field Display
Field DisplayWhen you select a field from a view display the field panel appears. This is most useful for fields that donot fit on one line. You can change the field data by typing over them. The same data manipulationcommands available for views and subviews (SAVE, DATA, and RESTORE) are available for fields.Figure 5-3 shows a display of a field from the view in Figure 5-2 .
Figure 5-3 Display of f ield from output view
FIELD MINOR_PART_LONG_NAME ROW1 OF 1
COMMAND
===> SCROLL ===>PAGE
BEFORE CALL FROM HPSBATCH TO RDB2PLI_LONG_NAME AT LINE 0.
0000
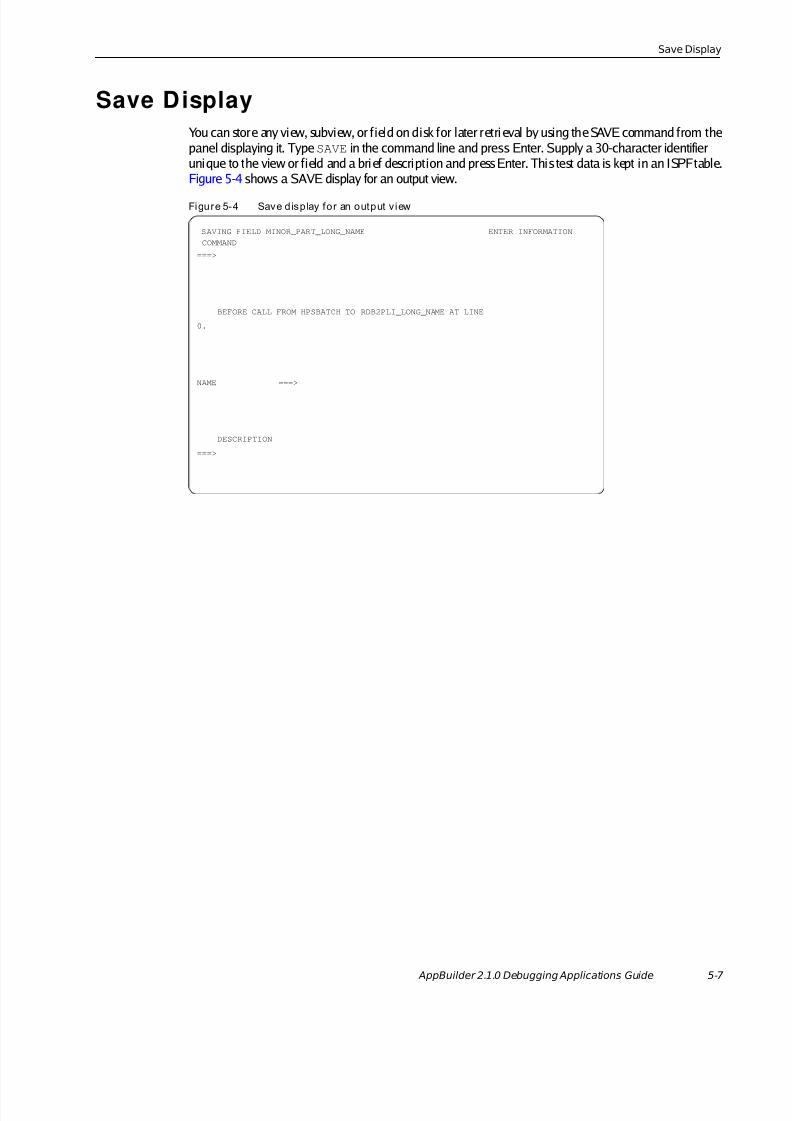
8/14/2019 App Builder Debugging Applications
http://slidepdf.com/reader/full/app-builder-debugging-applications 73/88
Save Display
AppBuilder 2.1.0 Debugging Applications Guide 5-7
Save DisplayYou can store any view, subview, or f ield on disk for later retri eval by using the SAVE command from thepanel displaying it. Type SAVE in the command line and press Enter. Supply a 30-character identifierunique to the view or field and a brief description and press Enter. This test data is kept in an ISPF table.Figure 5-4 shows a SAVE display for an output view.
Figure 5-4 Save d isp lay for an output v iew
SAVING FIELD MINOR_PART_LONG_NAME ENTER INFORMATIONCOMMAND
===>
BEFORE CALL FROM HPSBATCH TO RDB2PLI_LONG_NAME AT LINE
0.
NAME ===>
DESCRIPTION
===>
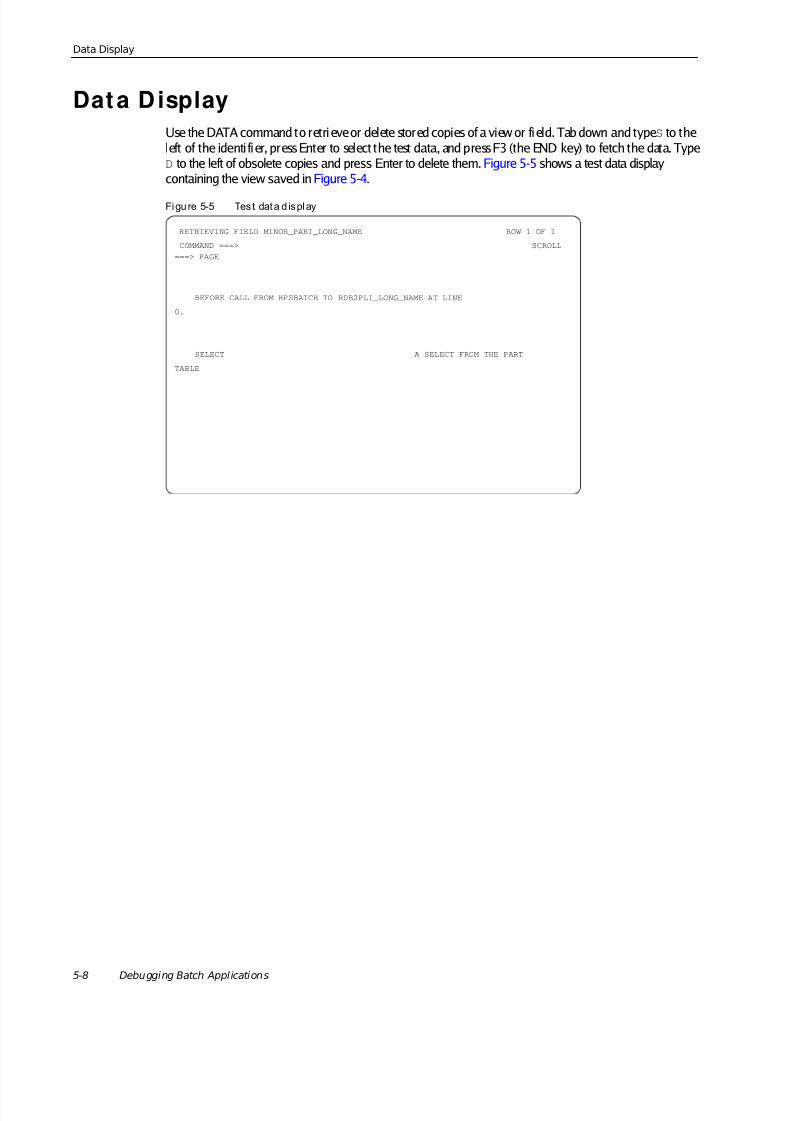
8/14/2019 App Builder Debugging Applications
http://slidepdf.com/reader/full/app-builder-debugging-applications 74/88
5-8 Debugging Batch Applications
Data Display
Dat a D isplayUse the DATA command to retri eve or delete stored copies of a view or fi eld. Tab down and type S to theleft of the identi fier, press Enter to select the test data, and press F3 (the END key) to fetch the data. TypeD to the left of obsolete copies and press Enter to delete them. Figure 5-5 shows a test data displaycontaining the view saved in Figure 5-4 .
Fi gu re 5-5 Tes t dat a d is pl ay
RETRIEVING FIELD MINOR_PART_LONG_NAME ROW 1 OF 1
COMMAND ===> SCROLL===> PAGE
BEFORE CALL FROM HPSBATCH TO RDB2PLI_LONG_NAME AT LINE
0.
SELECT A SELECT FROM THE PART
TABLE

8/14/2019 App Builder Debugging Applications
http://slidepdf.com/reader/full/app-builder-debugging-applications 75/88
Source Code Display
AppBuilder 2.1.0 Debugging Applications Guide 5-9
Source Code DisplayThe SOURCE command i s available from the breakpoint, vi ew, and field displays to examine the sourcecode of the current rule. The ISPF browse system service is used so that any of its subcommands, such asFIND, are active. You can also browse source for any other rule by typing BROWSE RULENAME on thecommand line. You can display any other data set by specifying BROWSE with no member name. ISPF
prompts for the full data set name. Figure 5-6 shows the source code display for our sample rule.Figure 5-6 Source code display for a sample rule
BROWSE -- HPSREP.USER1.RULELIB(RDB2PLI) ------------ LINE 00000000 COL 001 080
********************************* TOP OF DATA ********************************USE MODULE CDB2PLI_LONG_NAMEUSE MODULE CDB2PLJ_LONG_NAME
USE RULE RDB2PLJ_LONG_NAME******************************** BOTTOM OF DATA *******************************

8/14/2019 App Builder Debugging Applications
http://slidepdf.com/reader/full/app-builder-debugging-applications 76/88
5-10 Debugging Batch Applications
Source Code Display

8/14/2019 App Builder Debugging Applications
http://slidepdf.com/reader/full/app-builder-debugging-applications 77/88
AppBuilder 2.1.0 Debugging Applications Guide 6-1
CHAPTER
6DEBUGGING CICS AN D IM SAPPLICATIONS
AppBuilder 2.1.0 Debugging Applications Guide
Use the CICS version of RuleView when you want to debug an AppBuilder application in CICS on themainframe. Because the AppBuilder environment does not support the initiation of CICS RuleView,you must acquire a 3270 session and manually invoke CICS RuleView. Similarly, use the IMS version ofRuleView to debug an AppBuilder application in IMS on the mainframe.
The information about debugging mainframe applications with both CICS RuleView and IMS RuleVieware identical, with the exception of IMS transactions and variati ons in the Rule Selecti on List facili ty.Since RuleView is fundamentally the same for both CICS and IMS, we do not repeat the information foreach separately. Instead, in this section we simply refer to CICS RuleView and IMS RuleView genericallyas Mainframe RuleView and it is understood, depending on your context, whether it is CICSRuleViewor IMSRuleView.
With Mainframe RuleView, you interactively step through a rules process and examine the contents ofviews at any point. Mainframe RuleView lets you:
• Ini tiate the execution of a rule
• Break at the interface between a rule and a subordinate rule, window, or component
• Step into the logic of a rule
• Step over the logic of a component, window, or rule
• Step back to the beginning of a component, window, or rule• Examine and modify the contents of any field within a view
• Review the active rule’s source code
• Save any view data for future reference and reuse
Topics include:
• Mainframe RuleView Panels
• Mainframe RuleView Commands and Function Keys

8/14/2019 App Builder Debugging Applications
http://slidepdf.com/reader/full/app-builder-debugging-applications 78/88
6-2 Debugging CICS and IMS Applications
Mainframe RuleView Panels
The panels for mainframe RuleView include:
• Rule Selection List: HPR0
• Mainframe RuleView Breakpoint Selection
• Mainframe RuleView Source Code Display
• Mainframe RuleView View Display
• Mainframe RuleView Test Data Maintenance
• Mainframe RuleView Test Data Input
M ainframe RuleView PanelsWithin the Mainframe RuleView debugger, you can display six different Mainframe RuleView panels.The panels are:
• Rule Selection List: HPR0
• Mainframe RuleView Breakpoint Selection
• Mainframe RuleView Source Code Display
• Mainframe RuleView View Display
• Mainframe RuleView Test Data Maintenance
• Mainframe RuleView Test Data Input
M ainframe RuleView Comm ands and FunctionKeys
You can use function keys (abbreviated as the letter F followed by the key number) to jump from onepanel to another and to access standard functions. The functions of these keys, described in Table6-1 , are consistent across all the Mainframe RuleView panels, and you can access them when they aredisplayed at the bottom of the screen.
Table 6-1 Mainframe RuleView function keys
Key Command Description
F2 TEST Displays test data maintenance.
F3 EXIT Ends the debugger. Continue to test the rule without the debugger.
F4 NAME Toggles between name and system ID mode.
F5 SAVE Saves current data permanently as test data.
F6 HEX ON/ HEX OFF Toggles between charac ter mode and hexadecimal mode.
F7 BKWD Scrolls backward.
F8 FWD Scrolls forward.
F9 EXP/CNTRCT Expands or contracts the display mode for a view.
F10 PROCESS DATA Processes the test data.
F11 UNDO Restores all data to what it was when the panel was first displayed.
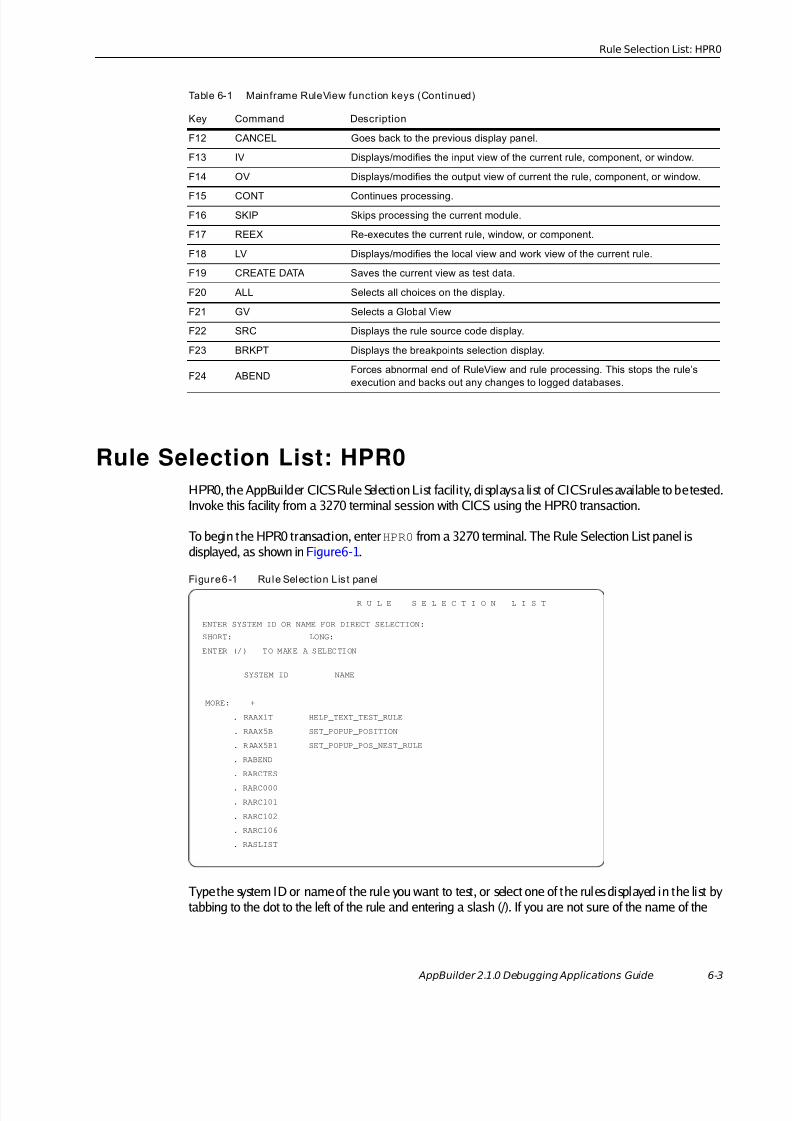
8/14/2019 App Builder Debugging Applications
http://slidepdf.com/reader/full/app-builder-debugging-applications 79/88
Rule Selection List: HPR0
AppBuilder 2.1.0 Debugging Applications Guide 6-3
Rule Selection List: HPR0HPR0, the AppBuilder CICS Rule Selection List facility, di splays a list of CICS rules available to be tested.Invoke this facility from a 3270 terminal session with CICS using the HPR0 transaction.
To begin the HPR0 transaction, enter HPR0 from a 3270 terminal. The Rule Selection List panel isdisplayed, as shown in Figure6-1 .
Figure6-1 Rule Selec t ion Lis t panel
Type the system ID or name of the rule you want to test, or select one of the rules displayed in the list bytabbing to the dot to the left of the rule and entering a slash (/). If you are not sure of the name of the
F12 CANCEL Goes back to the previous display panel.
F13 IV Displays/modifies the input view of the current rule, component, or window.
F14 OV Displays/modifies the output view of current the rule, component, or window.
F15 CONT Continues processing.F16 SKIP Skips processing the current module.
F17 REEX Re-executes the current rule, window, or component.
F18 LV Displays/modifies the local view and work view of the current rule.
F19 CREATE DATA Saves the current view as test data.
F20 ALL Selects all choices on the display.
F21 GV Selects a Global View
F22 SRC Displays the rule source code display.
F23 BRKPT Displays the breakpoints selection display.
F24 ABENDForces abnormal end of RuleView and rule processing. This stops the rule’sexecution and backs out any changes to logged databases.
Table 6-1 Mainframe RuleView function keys (Continued)
Key Command Description
R U L E S E L E C T I O N L I S T
ENTER SYSTEM ID OR NAME FOR DIRECT SELECTION:
SHORT: LONG:
ENTER (/) TO MAKE A SELECTION
SYSTEM ID NAME
MORE: +
. RAAX1T HELP_TEXT_TEST_RULE
. RAAX5B SET_POPUP_POSITION
. R AAX5B1 SET_POPUP_POS_NEST_RULE
. RABEND
. RARCTES
. RARC000
. RARC101
. RARC102
. RARC106
. RASLIST
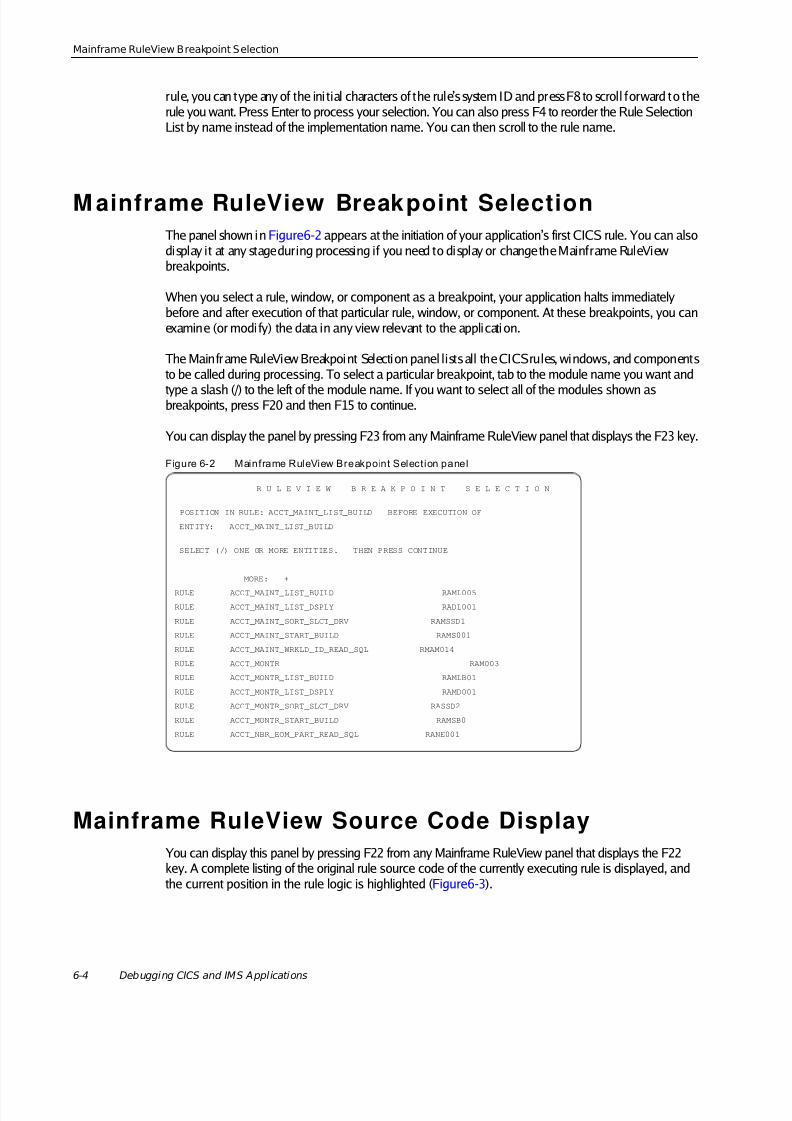
8/14/2019 App Builder Debugging Applications
http://slidepdf.com/reader/full/app-builder-debugging-applications 80/88
6-4 Debugging CICS and IMS Applications
Mainframe RuleView Breakpoint Selection
rule, you can type any of the ini tial characters of the rule’s system ID and press F8 to scroll forward to therule you want. Press Enter to process your selection. You can also press F4 to reorder the Rule SelectionList by name instead of the implementation name. You can then scroll to the rule name.
M ainframe RuleView Breakpoint SelectionThe panel shown in Figure6-2 appears at the initiation of your application’s first CICS rule. You can alsodisplay it at any stage during processing if you need to display or change the Mainframe RuleViewbreakpoints.
When you select a rule, window, or component as a breakpoint, your application halts immediatelybefore and after execution of that particular rule, window, or component. At these breakpoints, you canexamine (or modi fy) the data in any view relevant to the applicati on.
The Mainframe RuleView Breakpoint Selection panel lists all the CICS rules, windows, and componentsto be called during processing. To select a particular breakpoint, tab to the module name you want and
type a slash (/) to the left of the module name. If you want to select all of the modules shown asbreakpoints, press F20 and then F15 to continue.
You can display the panel by pressing F23 from any Mainframe RuleView panel that displays the F23 key.
Figure 6-2 Mainframe RuleView Breakpoint Selection panel
Mainframe RuleView Source Code DisplayYou can display this panel by pressing F22 from any Mainframe RuleView panel that displays the F22key. A complete listing of the original rule source code of the currently executing rule is displayed, andthe current position in the rule logic is highlighted ( Figure6-3 ).
R U L E V I E W B R E A K P O I N T S E L E C T I O N
POSITION IN RULE: ACCT_MAINT_LIST_BUILD BEFORE EXECUTION OF
ENTITY: ACCT_MAINT_LIST_BUILD
SELECT (/) ONE OR MORE ENTITIES. THEN PRESS CONTINUE
MORE: +
RULE ACCT_MAINT_LIST_BUILD RAML005
RULE ACCT_MAINT_LIST_DSPLY RADL001
RULE ACCT_MAINT_SORT_SLCT_DRV RAMSSD1
RULE ACCT_MAINT_START_BUILD RAMS001
RULE ACCT_MAINT_WRKLD_ID_READ_SQL RMAM014
RULE ACCT_MONTR RAM003
RULE ACCT_MONTR_LIST_BUILD RAMLB01
RULE ACCT_MONTR_LIST_DSPLY RAMD001
RULE ACCT_MONTR_SORT_SLCT_DRV RASSD2
RULE ACCT_MONTR_START_BUILD RAMSB0
RULE ACCT_NBR_EOM_PART_READ_SQL RANE001
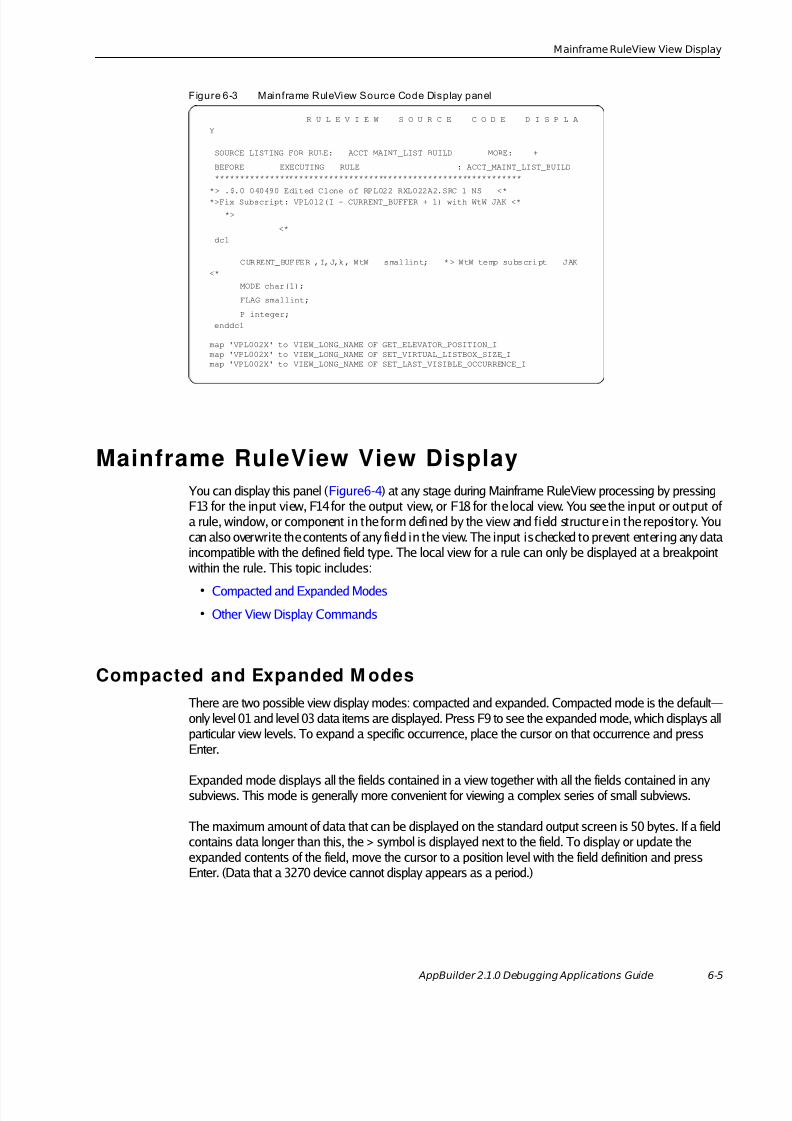
8/14/2019 App Builder Debugging Applications
http://slidepdf.com/reader/full/app-builder-debugging-applications 81/88
Mainframe RuleView View Display
AppBuilder 2.1.0 Debugging Applications Guide 6-5
Figure 6-3 Mainframe RuleView Source Code Display panel
Mainframe RuleView View DisplayYou can display this panel ( Figure6-4 ) at any stage during Mainframe RuleView processing by pressingF13 for the input view, F14 for the output view, or F18 for the local view. You see the input or output ofa rule, window, or component in the form defined by the view and field structure in the repository. Youcan also overwrite the contents of any field in the view. The input is checked to prevent entering any dataincompatible with the defined field type. The local view for a rule can only be displayed at a breakpointwithin the rule. This topic includes:
• Compacted and Expanded Modes• Other View Display Commands
Compacted and Expanded M odesThere are two possible view display modes: compacted and expanded. Compacted mode is the default—only level 01 and level 03 data items are displayed. Press F9 to see the expanded mode, which displays allparticular view levels. To expand a specific occurrence, place the cursor on that occurrence and pressEnter.
Expanded mode displays all the fields contained in a view together with all the fields contained in anysubviews. This mode is generally more convenient for viewing a complex series of small subviews.
The maximum amount of data that can be displayed on the standard output screen is 50 bytes. If a fieldcontains data longer than this, the > symbol is displayed next to the field. To display or update theexpanded contents of the field, move the cursor to a position level with the field definition and pressEnter. (Data that a 3270 device cannot display appears as a period.)
R U L E V I E W S O U R C E C O D E D I S P L AY
SOURCE LISTING FOR RULE: ACCT_MAINT_LIST_BUILD MORE: +
BEFORE EXECUTING RULE : ACCT_MAINT_LIST_BUILD**************************************************************
*> .$.0 040490 Edited Clone of RPL022 RXL022A2.SRC 1 NS <**>Fix Subscript: VPL012(I - CURRENT_BUFFER + 1) with WtW JAK <*
*>
<* dcl
CURRENT_BUFFER , I, J,k , WtW smal lin t; *> WtW temp subscript JAK<*
MODE char(1);
FLAG smallint;
P integer; enddcl
map 'VPL002X' to VIEW_LONG_NAME OF GET_ELEVATOR_POSITION_Imap 'VPL002X' to VIEW_LONG_NAME OF SET_VIRTUAL_LISTBOX_SIZE_Imap 'VPL002X' to VIEW_LONG_NAME OF SET_LAST_VISIBLE_OCCURRENCE_I

8/14/2019 App Builder Debugging Applications
http://slidepdf.com/reader/full/app-builder-debugging-applications 82/88
6-6 Debugging CICS and IMS Applications
Mainframe RuleView View Display
Figure 6-4 Mainframe RuleView View Display panel
R U L E V I E W D I S P L A Y
POSITION IN RULE: SQL_INS_HPS_OBJ_CLASS
ENTITY: SQL_INS_HPS_OBJ_CLASS WILL BE EXECUTED NEXT
VIEW: SQL_INS_HPS_OBJ_CLASS_I
LVL FIELD/VIEW NAME CONTENTS
MORE:01 SQL_INS_HPS_OBJ_CLASS_03 HPS_STND_OBJ_CLASS_D05 T_HPS_OBJ_TYPE05 N_HPS_OBJ_CLASS_NME05 T_HPS_OBJ_CLASS_ABBR
05 C_HPS_OBJ_CLASS_RANK +00000< 05
T_HPS_OBJ_CLASS_DESC
> 05 I_CREATE_BY
05 D_CREATE_DTE 00/00/0005 I_MAINT_BY
05 D_MAINT_DTE 00/00/00

8/14/2019 App Builder Debugging Applications
http://slidepdf.com/reader/full/app-builder-debugging-applications 83/88
Mainframe RuleView Test Data M aintenance
AppBuilder 2.1.0 Debugging Applications Guide 6-7
Other View Display Com mandsIf, after changing the contents of a view, you prefer to use the original contents of the view, you canrefresh the view contents by pressing F11 (Undo) . Thi s overwrites the view contents with the values thatwere current when the breakpoint was first reached (that is, before any changes).
Toggle between the input and output views by pressing F13 and F14 to compare them at any givenbreakpoint.
To change view display modes from compacted to expanded or vice versa, press F9. The display in bothcases is repositioned at the beginning of the view definition. The view display is initially in compactedmode.
M ainf rame RuleView Test Data M aintenanceThe Mainframe RuleView Test Data Maintenance panel ( Figure6-5 ) lets you save the current contents of
a view as test data, retrieve previously saved data for the current view, or delete previously stored testdata.
You can di splay the panel only by pressing F2 from the Mainframe RuleView Display panel ( Figure6-4 ).
Figure 6-5 Mainframe RuleView Test Data Maintenance panel
R U L E V I E W T E S T D A T A M A I N T E N A N C E
CURRENT POSITION BEFORE WPL012
VIEW: RENT12 RULE: CALC_RENTAL_FEE
TO PROCESS TEST DATA FOR CURRENT VIEW ENTER (/) TO RETRIEVE OR (-) TO DELETE
MORE: _ DATA0325 Test Data from March 24
_ DATA0326 Test Data from March 26 _ TESTGAIL Gails test data _ TEST9877 This is test data _ TRDC3002 SECOND TEST OF CALC_RENTAL_FEE _ TRDC3007 TEST SEVEN FOR CALC_RENTAL_FEE
END OF DATA
F 7=BKWD F8=FWD F10=PROCESS DATA F12=CANCEL F19=CREATE DATA
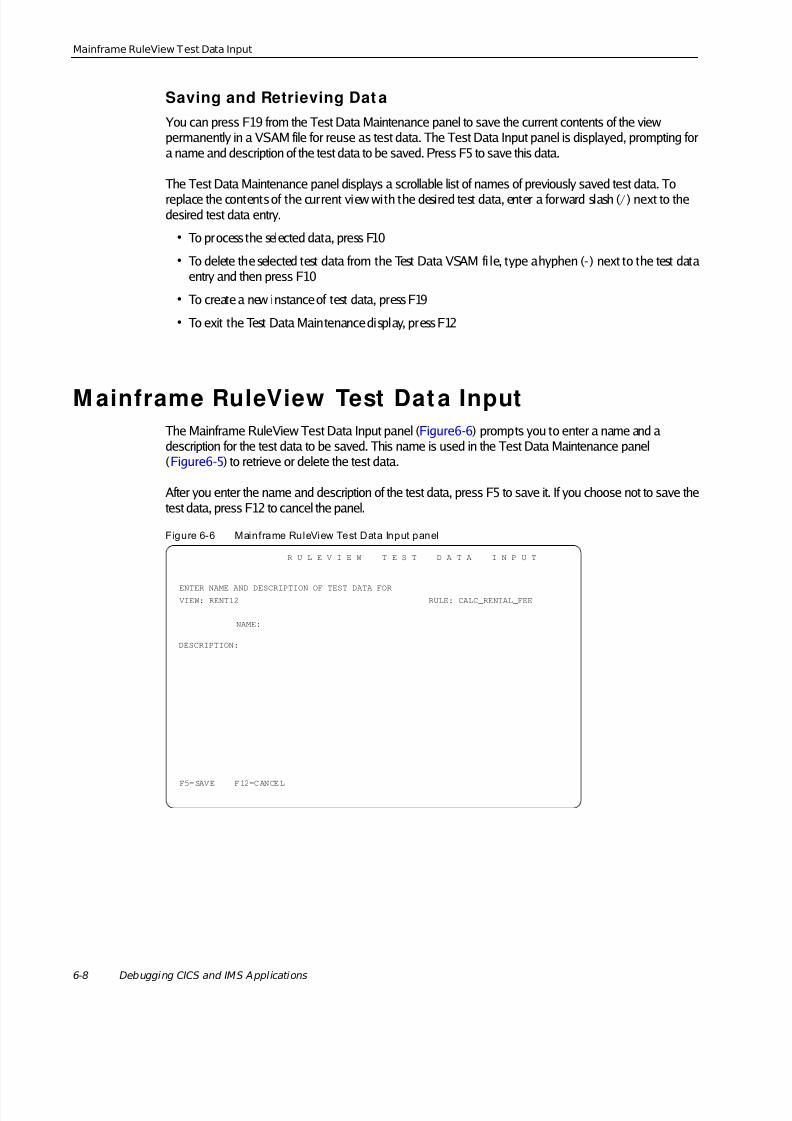
8/14/2019 App Builder Debugging Applications
http://slidepdf.com/reader/full/app-builder-debugging-applications 84/88
6-8 Debugging CICS and IMS Applications
Mainframe RuleView Test Data Input
Saving and Retrieving Dat aYou can press F19 from the Test Data Maintenance panel to save the current contents of the viewpermanently in a VSAM file for reuse as test data. The Test Data Input panel is displayed, prompting fora name and description of the test data to be saved. Press F5 to save this data.
The Test Data Maintenance panel displays a scrollable list of names of previously saved test data. Toreplace the contents of the current view with the desired test data, enter a forward slash ( / ) next to thedesired test data entry.
• To process the selected data, press F10
• To delete the selected test data from the Test Data VSAM fi le, type a hyphen (-) next to the test dataentry and then press F10
• To create a new instance of test data, press F19
• To exit the Test Data Maintenance display, press F12
M ainframe RuleView Test Dat a InputThe Mainframe RuleView Test Data Input panel ( Figure6-6 ) prompts you to enter a name and adescription for the test data to be saved. This name is used in the Test Data Maintenance panel(Figure6-5 ) to retrieve or delete the test data.
After you enter the name and description of the test data, press F5 to save it. If you choose not to save thetest data, press F12 to cancel the panel.
Figure 6-6 Mainframe RuleView Test Data Input panel
R U L E V I E W T E S T D A T A I N P U T
ENTER NAME AND DESCRIPTION OF TEST DATA FOR VIEW: RENT12 RULE: CALC_RENTAL_FEE
NAME:
DESCRIPTION:
F5=SAVE F12=CANCEL

8/14/2019 App Builder Debugging Applications
http://slidepdf.com/reader/full/app-builder-debugging-applications 85/88
AppBuilder 2.1.0 Debugging Applications Guide i
Index
INDEX
AppBuilder 2.1.0 De bugg ing Applications Guide
Aaction points 3-14
breakpoint 1-1, 2-15 , 3-7, 3-8, 3-11breakpoint, clear 3-13breakpoint, clear all 3-13breakpoint, color 3-16breakpoint, list of 3-17breakpoint, set 3-12from Debug menu 3-5restrictions 2-26 , 2-29, 3-14skippoint 1-1, 3-7, 3-15skippoint , clear all 3-15skippoint, color 3-16skippoint, li st of 3-17skippoint, set or clear 3-15watchpoint 1-1, 2-15, 3-8
agent
Named Pipe 4-2TCP 4-2All Data tab 2-11Appearance menu
debugger 2-8auxiliary debug files 2-3
Bbatch application debugging 5-1bkpts.txt fi le 4-5brackets in thread name 2-7brackets, i n thread name 2-7
breaking at exceptions 2-29breakpointbatch, mainframe 5-1, 5-3usage in batch RuleView 5-1, 5-3usage in CICS RuleView 6-4
breakpoints 1-1, 2-15 , 2-23, 2-24 , 3-7, 3-8, 3-11 , 3-13 , 4-2, 4-5
CICS, IMS 6-4clear 3-13clear all 3-13color 3-16definition 2-23 , 3-11list of 3-17restrictions 2-26 , 3-14set 2-24 , 3-12setting 4-5using 2-26 , 3-11 , 3-14
Breakpoints tab 2-23
Ccall stack 2-9
in RuleView 2-6CICS
RuleView usage 6-1transactions, HPR0 6-3
CICS breakpoints 6-4CICS RuleView debugger 5-1, 6-1Clear all panels (in RuleView) 2-13clear search 2-9Clear thi s panel (in RuleView) 2-13close applicati on (Alt+F4) 2-5, 2-16 , 3-3, 3-8compacted mode 6-5configuration
RuleView 3-3current location debugger command 2-18
Ddebug data in batch 5-7debug data in CICS, IMS 6-8debug environment 2-16 , 3-9debug files
directory 2-3
8/14/2019 App Builder Debugging Applications
http://slidepdf.com/reader/full/app-builder-debugging-applications 86/88
ii AppBuilder 2.1.0 Debugging Applications Guide
Debug menudebugger 2-8
DEBUG_START setting 1-2DEBUG_URL sett ing 2-3debugger
Appearance menu 2-8Debug menu 2-8Edit menu 2-8File menu 2-8Hierarchy menu 2-8overview (see RuleView) 1-1
debuggingapplication 1-1definition 1-1information to server 4-2rule 1-1
debugging databreakpoints 2-23Rule Data 2-19
watches 2-20watchpoints 2-26displaying
distributed RuleView message 4-2Distributed RuleView debugger
commands 4-3definition 4-1figure 4-2running 4-2
dna.ini file 3-10 , 4-4, 4-5
EEdit menu
debugger 2-8error
distr ibuted RuleView 4-2error/warnings tab 2-13exception
handling in debugger 2-29execution client 2-16 , 3-9execution pointer 3-7, 3-9exit application (Alt+F4) 2-5, 2-16 , 3-3, 3-8exiting
Java application 2-5exiting application 3-3exit ing RuleView 2-5expanded mode 6-5
Ffile
bkpts.txt (breakpoints) 4-5dna.ini (communications) 3-10 , 4-4, 4-5hps.ini 1-2, 3-2, 4-4ruleview.ini 2-3
File menudebugger 2-8
finding current location in debugger 2-18function keys
batch RuleView 5-2CICS Ruleview 6-2
function keys in batch 5-2functi on keys in CICS, IMS 6-2
HHierarchy menu
debugger 2-8HPR0 transaction 6-3hps.ini file 1-2, 3-2, 4-4HPSBATCH 5-2HPSRT_DEBUG_START 3-3HPSRT_DEBUG_START setting 1-2
IIMS
RuleView usage 6-1IMS breakpoints 6-4IMS RuleView debugger 6-1IMS transactions 6-1information tabs 2-13initialization settings (INI file) 2-2, 2-3interface settings, RuleView 2-3
J
Java Platform Debugger Architecture (JPDA) 2-1Java virtual machine (JVM) 2-5
Llook and feel 2-14
Mmainframe debugging 5-1, 6-1Mainframe RuleView 6-1message
distributed RuleView 4-2tab 2-13
multi -threaded See threads, RuleView.
NNamed Pipe agent 4-2NetEssential 4-2
configurator 4-2

8/14/2019 App Builder Debugging Applications
http://slidepdf.com/reader/full/app-builder-debugging-applications 87/88
Index iii
Ooutput panel 2-13
PPreparation and Test Server 4-2
Preparation optionRule debug 2-2, 3-2Preparation tab of Workbench Options 2-2, 3-2
Rremote service execution 4-2restrictions on action points 2-26, 2-29 , 3-14Rule Data tab 2-10 , 2-11 , 2-19, 2-21, 2-27 , 2-28Rule debug (option) 2-2, 3-2rule hierarchy 2-10Rule Selection List facility 6-3RuleView
breakpoints 3-11C applications 3-1call stack 2-9CICS 5-1, 6-1configuring 3-3debug option 2-2, 3-2debugger 1-1debugging C 3-9debugging Java 2-16definition 1-1Distributed (DRV) 4-1distr ibuted apps 2-16 , 3-9exiting C 3-3exiting Java 2-5Java applications 2-1Mainframe (CICS and I MS) 6-1mainframe batch (CICS) 5-1mainframe CICS or IMS 6-1menus 2-8remote machines 4-1rule hierarchy 2-10search 2-9skippoints 3-11 , 3-15starting CICS RuleView 6-1starting IMS RuleView 6-1status bar 2-14thread selector 2-9toolbar 2-9, 3-6user interface window (C) 3-4user interface window (Java) 2-6view display in batch 5-5view display in CICS, IMS 6-5
ruleview.ini 2-3Run Debug
start values 3-2, 4-4
SSave all panels (in RuleView) 2-13Save this panel (in RuleView) 2-13saving, retrieving debug data in batch 5-7saving, retrieving debug data in CICS, IMS RuleView 6-8search field (in debugger) 2-9
search windowclear search 2-9
serverpreparing and testing 4-2
settingDEBUG_START 1-2DEBUG_URL 2-3HPSRT_DEBUG_START 1-2
setting breakpoints 4-5sett ings, ruleview.ini 2-3skippoints 1-1, 3-7, 3-15
clear all 3-15color 3-16list of 3-17set or clear 3-15using 2-26 , 3-11 , 3-14
source codedisplay 5-9, 6-4
source code display in batch 5-9source code display in CICS, IMS 6-4statements
not use skippoints with 3-14status bar 2-14step
definition 3-10suspended mode (RuleView debugger) 2-25
TTCP agent 4-2Test Data Input panel 6-8Test Data Maintenance panel 6-7, 6-8testing
batch applications 5-1CICS applications 6-1displaying source code 5-9, 6-4
thread name 2-7thread selector 2-9
threadsin RuleView 2-7thread selector 2-9
toolbarRule RuleView 2-9, 3-6
trace file 3-10trace, following a 3-10tracing execution 3-10transactions
HPR0 6-3
8/14/2019 App Builder Debugging Applications
http://slidepdf.com/reader/full/app-builder-debugging-applications 88/88
Uunsuspended mode (RuleView debugger) 2-25user interface
call stack 2-9look and feel 2-14menus 2-8
rule hierarchy 2-10search 2-9status bar 2-14thread selector 2-9toolbar 2-9, 3-6window (C) 3-4window (Java) 2-6
user interface settings, RuleView 2-3
Vview display, batch RuleView 5-5view display, CICS, IMS RuleView 6-5
WWatches tab 2-10 , 2-11 , 2-20 , 2-21, 2-27watchpoints 1-1, 2-15 , 2-26 , 3-8
set 2-27Watchpoints tab 2-26window
RuleView (C) 3-4RuleView (Java) 2-6
Workbench OptionsPreparation 2-2, 3-2