app - treasury.gov.za performance plan/nt app... · the 2018/19 national treasury annual...
TRANSCRIPT

ANNUAL PERFORMANCE PLAN2018/19
APP


The 2018/19 National Treasury Annual Performance Plan
is compiled with the latest available information
from departmental and other sources.
Some of this information is unaudited or subject to revision.
For more information, please contact:
Communications Directorate,National Treasury | Private Bag X115 | Pretoria, 0001, South Africa
Tel: +27 12 315 5944 | Fax: +27 12 406 9055
This publication is available at www.treasury.gov.za
ISBN: 978-0-621-46180-0 | RP77/2018
ANNUAL PERFORMANCE PLAN2018/19
APP

CONTENTS
MINISTER’S FOREWORD .......................................... viDIRECTOR-GENERAL’S FOREWORD ......................viiiOFFICIAL SIGN OFF .................................................. xiACRONYMS AND ABBREVIATIONS ........................ xii
PART A: STRATEGIC OVERVIEW .................11. UPDATED SITUATIONAL ANALYSIS ................. 1 1.1 Performance Delivery Environment .................................. 1
1.2. Organisational Environment .................................................. 4
1.3. Revisions to Legislative and Other Mandates ............. 5
1.4. Strategic Outcome Oriented Goals
of the Institution ............................................................................ 5
1.5 VOTE 7: National Treasury Resource Plan ....................... 8
PART B: PROGRAMME AND SUB-PROGRAMME PLANS ....................... 222. PROGRAMME 1: ADMINISTRATION ..............22 2.1. Purpose .............................................................................................22
2.2. Strategic Objectives...................................................................22
2.3. Sub-Programme Overview ...................................................22
2.4. Strategic Plan Objective Annual
and Medium Term Targets .....................................................24
2.5. Programme Performance Indicators
and Annual Targets ....................................................................25
2.6. Programme Performance Indicator Quarterly
Targets for 2018/19 ....................................................................26
2.7. Expenditure Trends and Estimates ...................................27
2.8. Personnel Information .............................................................30
3. PROGRAMME 2: ECONOMIC POLICY, TAX, FINANCIAL REGULATION AND RESEARCH ..............................................31
3.1. Purpose .............................................................................................31
3.2. Strategic Objectives...................................................................31
3.3. Sub-Programmes ........................................................................31
3.4. Strategic Plan Objective Annual
and Medium Term Targets .....................................................33
3.5. Programme Performance Indicators
and Annual Targets 2018/19 ................................................34
3.6. Programme Performance Indicator
Quarterly Targets For 2018/19 .............................................37
3.7. Expenditure Trends and Estimates ...................................39
3.8. Personnel Information .............................................................41
4. PROGRAMME 3: PUBLIC FINANCE AND BUDGET MANAGEMENT .......................42
4.1. Purpose .............................................................................................42
4.2. Strategic Objectives...................................................................42
4.3. Sub-Programmes ........................................................................42
4.4. Strategic Plan Objective Annual
and Medium Term Targets .....................................................44
4.5. Programme Performance Indicators
and Annual Targets ....................................................................45
4.6. Programme Performance Indicator
Quarterly Targets for 2018/19 ..............................................52
4.7. Expenditure Trends and Estimates ...................................55
4.8. Personnel Information .............................................................57
5. PROGRAMME 4: ASSET AND LIABILITY MANAGEMENT ...............................................58
5.1. Purpose .............................................................................................58
5.2. Strategic Objectives...................................................................58
5.3. Sub-Programmes ........................................................................58
5.4. Strategic Plan Objective Annual
and Medium Term Targets .....................................................60
5.5. Programme Performance Indicators
and Annual Targets ....................................................................61
5.6. Programme Performance Indicator
Quarterly Targets For 2018/19 .............................................63
5.7. Expenditure Trends and Estimates ...................................64
ANNUAL PERFORMANCE PLAN2018/19
APP

5.8. Personnel Information .............................................................66
6. PROGRAMME 5: FINANCIAL ACCOUNTING AND SUPPLY CHAIN MANAGEMENT SYSTEMS .......67
6.1. Purpose .............................................................................................67
6.2. Strategic Objectives...................................................................67
6.3. Sub-Programmes ........................................................................69
6.4. Strategic Plan Objective Annual
and Medium Term Targets .....................................................70
6.5. Programme Performance Indicators
and Annual Targets ...................................................................72
6.6. Programme Performance Indicator
Quarterly Targets for 2018/19 ..............................................77
6.7. Expenditure Trends and Estimates ...................................80
6.8. Personnel Information .............................................................82
7. PROGRAMME 6: INTERNATIONAL FINANCIAL RELATIONS ..................................83
7.1. Purpose .............................................................................................83
7.2. Strategic Objectives...................................................................83
7.3. Sub-Programmes ........................................................................83
7.4. Strategic Plan Objective Annual
and Medium Term Targets .....................................................85
7.5. Programme Performance Indicators
and Annual Targets ....................................................................86
7.6. Programme Performance Indicator
Quarterly Targets for 2018/19 ..............................................87
7.7. Expenditure Trends and Estimates ...................................88
7.8. Personnel Information .............................................................90
8. PROGRAMME 7: CIVIL AND MILITARY PENSIONS, CONTRIBUTIONS TO FUNDS AND OTHER BENEFITS ...................................91
8.1. Purpose .............................................................................................91
8.2. Strategic Objectives...................................................................91
8.3. Sub-Programme Overview ...................................................91
8.4. Strategic Plan Objective Annual
and Medium Term Targets .....................................................92
8.5. Programme Performance Indicators
and Annual Targets ....................................................................93
8.6. Performance Indicator Quarterly Targets
for 2018/19 ......................................................................................94
8.7. Expenditure Trends and Estimates ...................................95
9. PROGRAMME 8: TECHNICAL AND MANAGEMENT SUPPORT AND DEVELOPMENT FINANCE ......................97
9.1. Purpose .............................................................................................97
9.2. Strategic Objectives...................................................................97
9.3. Sub-Programmes ........................................................................97
9.4 Strategic Plan Objective Annual
and Medium Term Targets ..................................................102
9.5. Programme Performance Indicators
and Annual Targets .................................................................103
9.6. Programme Performance Indicator
Quarterly Targets For 2018/19 ..........................................105
9.7. Expenditure Trends and Estimates ................................107
PART C: LINKS TO OTHER PLANS .......... 11110. LINKS TO LONG TERM INFRASTRUCTURE
AND OTHER CAPITAL PLANS .......................11111. CONDITIONAL GRANTS ...............................11112. PUBLIC-PRIVATE PARTNERSHIPS ................11113. PUBLIC ENTITIES REPORTING
TO THE MINISTER .........................................111
PART D: ANNEXURES ............................. 11314. ENDNOTES ....................................................113

vi
Nat
iona
l Tre
asur
y | A
nnua
l Per
form
ance
Pla
n | 2
018/
19
MINISTER’S FOREWORD2018/19 is an auspicious year in which we all, across the length and breadth of South Africa, in cities and villages urban towns and rural
farms, will celebrate the centenary of the birth of our late icon, founding father and first democratic President, Nelson Rolihlahla Mandela.
For this year of remembrance to have meaning, and given our current challenges on the national agenda, we must commit to deep
reflection and demonstration of the values, principles and ideals we have learned from President Mandela’s extraordinary life: humanity,
tolerance, selflessness, commitment to social justice, and building a society that empowers all who live in it. We should all ask ourselves
what role we will play in achieving these aims. What will we each - as institutions, as a collective, and as individuals - contribute?
Among other things, National Treasury carries the responsibility of funding public services that address the nation’s most urgent social
and economic needs, to ensure sustainable public finances, and to contribute to the National Development Plan Vision 2030, especially
with respect to inclusive growth and economic transformation.
Providing high quality public services with less public spending is a universal ambition, but especially so for South Africa given our
shared obligation to redress inequality, deepen democracy, accelerate economic prosperity and build an inclusive society. Accelerating
delivery on public service priorities such as health care and education, intensifying employment creation and poverty alleviation
efforts, as well as escalating quality infrastructure development, is imperative to the continued transformation of our country to
encompass both political emancipation and full economic participation. This is at a time when our economy is experiencing slow
growth, thus placing immense pressure on the resources available to finance public services, and threatening the affordability of
public expenditure. An important aspect of government’s strategy in dealing with these challenging times of competing demands
in a constrained fiscal environment is the increased emphasis on the alignment of performance measurement and departmental
budgeting, evidence based decision-making and measuring results in policy design and delivery. In so doing, the actual impacts and
public benefits of government’s actions will be discerned, allowing citizens to hold government to greater accountability of what is to
be achieved, as well as how and at what cost.
Various key economic indicators referred to in the Medium Term Budget Policy Statement (MTBPS), presented in October 2017, clearly
highlight some of the major challenges currently facing the South African economy. These include the economic growth rate that has
been projected to be 1.1 per cent in 2018, the consolidated budget deficit that is expected to be 3.9 per cent in 2018/19, and the gross
debt to GDP ratio that is projected to reach 59.7 per cent of GDP in 2020/21 and that will continue to climb unless fiscal consolidation
is intensified or economic growth improves, or both. Also of importance is the need to address the debt obligations of various state-
owned companies (SOCs) and to avert further downgrades by global credit ratings agencies. Strategies to address these challenges
NHLANHLA NENEMinister of Finance
APP

vii
Nat
iona
l Tre
asur
y | A
nnua
l Per
form
ance
Pla
n | 2
018/
19
are underway with progress being made in several areas. These include the establishment of the Budget Facility for Infrastructure, the
implementation of new procurement regulations, signing of the Financial Sector Regulation Act (Act No. 9 of 2017) into law and the
appointment of credible, capable boards, board chairpersons and chief executives to lead turnarounds at South African Airways (SAA)
and Eskom.
Vision 2030 requires that government, together with the social partners and society as a whole, makes tangible progress in driving
inclusive growth and economic transformation. Focus areas that will inform the work of all stakeholders, including National Treasury are:
• Ensuring that ownership, management and worker profiles reflect South African society
• Improving the sectoral composition of the economy so that it no longer reflects historical injustices and inequalities. Integrated
community development is central to this and requires strengthened cooperation between national government, provinces and
municipalities in areas such as housing, water, sanitation, electrification and public transport
• Developing productive economic activity in the townships and rural areas
• Creating a single economy that includes beneficiation streams with regional and global links
Of particular importance to the workings of National Treasury is the need for decisive action to maintain the integrity of the expenditure
ceiling and return public finances to sustainability.
It is evident that the South African government is seeking to improve the economic, political, and social well-being of its people.
Inclusive growth, poverty reduction and job creation remain key goals of economic policy. While the lives of millions of South Africans
have been greatly improved since 1994, there is still much to be done. Central to this is the ability to shape the future to respond
to the needs and aspirations of the people. To do so requires the establishment and implementation of shared programmes and
initiatives to develop the economy. Annual Performance Plans by departments such as the National Treasury provide important
elements in this process by establishing clear, measurable and time-bound targets for such programmes and a sound basis for
monitoring implementation.
National Treasury is a critical institution in our nation’s governance framework, and a key component of a capable and developmental
state. We are committed to National Treasury continuing to be a centre of excellence in government, thanks to the expertise,
commitment and integrity of its staff.

viii
Nat
iona
l Tre
asur
y | A
nnua
l Per
form
ance
Pla
n | 2
018/
19
DIRECTOR-GENERAL’S FOREWORDPublic sector performance planning, monitoring and evaluation efforts increasingly assist in improving and informing evidence based
policy decision-making that in turn contributes to the development and strengthening of public trust. By transparently and clearly
stating strategic objectives, performance indicators and targets, National Treasury’s Annual Performance Plan (APP) 2018/19 provides
all stakeholders with a valuable means of holding the department to account for the objectives it is mandated to achieve and the
resources spent in the course of their achievement.
As with other government departments, National Treasury has been subject to the severe budgetary constraints that have become
necessary in the process of reducing the costs of government and freeing up funds for prioritised areas of public service delivery,
primarily in respect of health, social development, education and job creation. Despite these constraints, National Treasury remains
steadfastly committed to the fulfilment of its mandate and to achieving its strategic aims and objectives. Achieving more results with
less resources and ensuring value for taxpayers’ monies are entrenched in guiding the department’s work programmes.
National Treasury APP 2018/19 focuses the work of the department in:
• Coordinating fiscal relations between national, provincial and local government, promoting sound budgetary planning at
provincial and local spheres of government, monitoring implementation and building capacity that will enable efficient and
effective management practices
• Monitoring the use of scarce public resources by national spending agencies and promoting the efficient and effective use of
these resources
• Developing the necessary Twin Peaks implementation regulations and a comprehensive prudential and market conduct
framework for new authorities
• Implementing savings and retirement policies, specifically the annuatisation resolution and full implementation of default
regulations for retirement funds
• Conducting relevant economic research that informs economic policy and frameworks
• Preparing and publishing the national budget, ensuring that resource allocations meet the priorities set by government while
maintaining the expenditure ceiling
• Exercising oversight over state-owned companies and enabling them to better achieve government’s policy objectives in a
financially and fiscally sustainable manner
DONDO MOGAJANEDirector-General
APP

ix
Nat
iona
l Tre
asur
y | A
nnua
l Per
form
ance
Pla
n | 2
018/
19
• Optimally managing public debt and funding of government’s borrowing requirements as well as government’s cash resources
• Through various monitoring mechanisms, investigating processes and capacity building initiatives to improve financial
management governance and compliance across all spheres and entities in government, giving effect to the PFMA and MFMA
• Further developing and implementing strategic procurement as well as modernising and automating government supply
chain processes
• Effectively administering and, in partnership with stakeholders, optimising the following programmes for impact results, namely
the Jobs Fund (employment creation facilitation programme), the municipal finance improvement programme (MFIP) and the
cities support programme (CSP)
The APP 2018/19 is an ambitious programme of work for National Treasury. The commitments made are cognisant of the challenging
times we face and borne out of a collective understanding of the responsibilities and obligations placed on all of us in public service
by the Constitution and the aspirations of the people of South Africa.


xi
Nat
iona
l Tre
asur
y | A
nnua
l Per
form
ance
Pla
n | 2
018/
19
Silindile Kubheka
Chief Financial Officer
Stadi Mngomezulu
Deputy Director-General: Corporate Services
Dondo Mogajane
Accounting Officer: National Treasury
Approved by:
Nhlanhla Nene, MP
Minister of Finance
OFFICIAL SIGN OFF
It is hereby certified that this Annual Performance Plan:
Was developed by the management of National Treasury
under the guidance of the Honourable Minister of Finance, Mr Nhlanhla Nene
Was prepared in line with the current Strategic Plan of National Treasury
Accurately reflects the performance targets that National Treasury
will endeavour to achieve given the resources made available in the budget for 2018/19.
ANNUAL PERFORMANCE PLAN2018/19
APP

xii
Nat
iona
l Tre
asur
y | A
nnua
l Per
form
ance
Pla
n | 2
018/
19
Acronym / Abbreviation Description
AENE Adjusted Estimates of National Expenditure
ALM Asset and Liability Management
APP Annual Performance Plan
ASB Accounting Standards Board
B-BBEE Broad-Based Black Economic Empowerment
BEPP Built Environment Performance Plan
bn Billion
BRICS Brazil-Russia-India-China-South Africa
CBDA Co-operative Banks Development Agency
CDS Capacity Development Strategy
COLA Cost-of-Living Adjustment
CSP Cities Support Programme
DBSA Development Bank of Southern Africa
DFIs Development Finance Institutions
DoRA Division of Revenue Act
DPSA Department of Public Service and Administration
ENE Estimates of National Expenditure
FAIS Ombud Ombud for Financial Service Providers
FFC Financial and Fiscal Commission
FIC Financial Intelligence Centre
FMCMM Financial Management Capability Maturity Model
FMG Financial Management Grant
FSB Financial Services Board
G20 Group of Twenty Finance Ministers and Central Bank Governors
G24 Intergovernmental Group of Twenty Four
GDP Gross Domestic Product
GEPF Government Employees Pension Fund
GPAA Government Pensions Administration Agency
GRAP Generally Recognised Accounting Practice
GTAC Government Technical Advisory Centre
HR Human Resources
IA Internal Audit
ICDG Integrated City Development Grant
ICT Information and Communications Technology
IDIP Infrastructure Delivery Improvement Programme
IDM Infrastructure Delivery Management
IDMS Infrastructure Delivery Management System
IFMS Integrated Financial Management System
IMF International Monetary Fund
IRBA Independent Regulatory Board of Auditors
ACRONYMS AND ABBREVIATIONS

xiii
Nat
iona
l Tre
asur
y | A
nnua
l Per
form
ance
Pla
n | 2
018/
19
Acronym / Abbreviation Description
IREP International and Regional Economic Policy
ISDG Infrastructure Skills Development Grant
KM Knowledge Management
Land Bank Land and Agricultural Development Bank
m Million
MFIP Municipal Finance Improvement Programme
MFMA Municipal Finance Management Act
MINCOMBUD Ministers’ Committee on the Budget
MOF Minister of Finance
MPAT Management Performance Assessment Tool
mSCOA Municipal Standard Chart of Accounts
MTBPS Medium Term Budget Policy Statement
MTEC Medium Term Expenditure Committee
MTEF Medium Term Expenditure Framework
MTSF Medium Term Strategic Framework
NCOP National Council of Provinces
NDP National Development Plan
NDPG Neighbourhood Development Partnership Grant
NRF National Revenue Fund
NT National Treasury
ODA Official Development Assistance
OPFA Office of the Pension Fund Adjudicator
OTO Office of the Tax Ombud
PFM Public Finance Management
PFMA Public Finance Management Act
PIC Public Investment Corporation
PPP Public-Private Partnership
RDP Reconstruction and Development Programme
SAA South African Airways
SACU Southern African Customs Union
SARS South African Revenue Service
SASRIA South African Special Risks Insurance Association
SCM Supply Chain Management
SITA State Information Technology Agency
SLA Service Level Agreement
SOC State-Owned Company
SOE State-Owned Entity
SSA State Security Agency
WBs Water Boards
WBG World Bank Group
ACRONYMS AND ABBREVIATIONS
PART A:STRATEGIC OVERVIEW
ANNUAL PERFORMANCE PLAN2018/19
APP

1
Nat
iona
l Tre
asur
y | A
nnua
l Per
form
ance
Pla
n | 2
018/
19
1. UPDATED SITUATIONAL ANALYSIS
1.1. Performance Delivery Environment
ECONOMIC ENVIRONMENT
In 2017, South Africa entered a technical recession when its gross domestic product (GDP) declined 0.6 per cent during the first quarter
of 2017 after having contracted by 0.3 per cent in the fourth quarter of 2016. This was the second technical recession experienced
in South Africa since 1994. By way of contrast, the world economy grew at a rate of 3.2 per cent in 2016. While this was the lowest
rate since 2009, it nevertheless substantially exceeded South Africa’s growth rate of 0.3 per cent. International Monetary Fund (IMF)
projections indicate global economic growth of 3.7 per cent in 2017 and 3.9 per cent in 2018. This outlook largely reflects a recovery
in demand and trade in Europe and Asia. Furthermore, growth in sub-Saharan Africa is projected to rise to 2.7 per cent in 2017 and 3.3
per cent in 2018, from 1.4 per cent in 2016.
The causes of the technical recession in South Africa were to be found in the contraction of economic activity in various sectors,
including manufacturing, mining, and construction. The situation was further exacerbated by a severe drought in the agricultural sector
and subdued investment levels in various sectors of the economy owing to uncertainty arising from weakened business confidence
and the risk of downgrades by various ratings agencies.
GDP growth in the South African economy improved to 2.8 per cent during the second quarter of 2017, thus averting a full recession.
Various signs of economic recovery have recently become evident, based on post-drought recovery in the agricultural sector,
improvements emerging in the mining and manufacturing sectors and expansion in household consumption. Nevertheless, as
communicated during the Medium Term Budget Policy Statement during October 2017, severe economic constraints continue to prevail.
South Africa will require strong economic growth in 2018 to reduce unemployment, which stood at 27.7 per cent at the end of the
third quarter of 2017, to alleviate poverty, address inequality and increase revenue for government to meet its development objectives.
THE PERCEPTIONS OF INVESTORS AND RATINGS AGENCIES
The sovereign credit risk ratings of South Africa’s foreign currency debt were downgraded by the major ratings agencies to sub-
investment grade during 2017. The implications of the downgrade on the economy of South Africa include:
• Higher borrowing costs for the government and state-owned companies (SOCs). This has resulted in additional revenue being
directed to debt servicing, thus reducing the funds available to government. With less resources available, there is pressure
on government’s ability to provide for programmes on social upliftment and infrastructure development and maintenance
Furthermore, for SOCs this increases the refinancing risk, thus placing pressure on the sovereign balance sheet
• Reduced demand for South African investments (bonds, equities and foreign direct investments) as perceptions of risk heighten
• A weakened Rand resulting in increased prices of imported goods and services, causing higher rates of inflation
South Africa has made progress in resolving electricity constraints, and in improving labour relations and the ease of doing business.
Recent developments in the global economy also present opportunities. These include growth in some of our major trading partners,
a recovery in commodity prices, and recent strong capital inflows into emerging markets. Creating policy certainty and increased
opportunities for investment, small business development and employment would improve South Africa’s economic outlook in the
medium and longer term. While the scrutiny of ratings agencies and investors is a natural outcome of borrowing by the state, it is
nevertheless important that this be balanced with the imperatives of South Africa’s development objectives.
PART A: STRATEGIC OVERVIEW

2
Nat
iona
l Tre
asur
y | A
nnua
l Per
form
ance
Pla
n | 2
018/
19
PART A: STRATEGIC OVERVIEW - Continued
RISING PUBLIC DEBT
Higher levels of economic growth are required to improve government revenues as a means of reducing the budget deficit and, in
so doing, prevent public debt levels from increasing further. Apart from ensuring policies that are in support of economic growth,
government has an important role to play in reducing its own costs to the fiscus. In this severely constrained fiscal environment,
government needs to do more with less.
Government is committed to maintaining the fiscal framework announced in the budget and the Medium Term Strategic Framework.
The 2017 budget reiterated the commitment to a measured, prudent course of fiscal consolidation to narrow the budget deficit and
stabilise debt. To achieve this, the 2017 budget proposed additional revenue measures of R28 billion in 2017/18 and expenditure
ceiling reductions of R10 billion in 2017/18 and R16 billion in 2018/19. A measured approach protects public finances and creates an
enabling environment for accelerated economic growth.
Significant spending pressures (e.g. the wage agreement and higher education funding shortfalls) were absorbed through
reprioritisation of the budget and the contingency reserve during 2017. As far as possible, government protected spending on front-
line services and shifted funds towards priority areas. Education, health and social grants are the highest growing areas of spending
after debt service costs.
Maintaining existing social spending required the raising of tax rates by government. This occurred primarily at the upper end of
the income spectrum, thereby strengthening the progressive nature of the tax system. Over the long term though, higher levels of
economic growth are required to bolster tax revenues and public expenditure.
Obtaining better value for public money will be a central objective over the period ahead. Procurement reforms are expected to realise
substantial savings. During 2017, National Treasury stepped up in-year monitoring of funds appropriated to departments and public
entities and this trend is set to continue in 2018.
RISK MANAGEMENT REGARDING THE CONTINGENT LIABILITIES OF STATE OWNED COMPANIES (SOCS)
Specific processes to improve governance and the financial strength of SOCs commenced in 2017. This included the plan to recapitalise
SOCs in distress.
Moves to strengthen governance in SAA by appointing permanent executives progressed significantly in 2017. This included appointing
an aviation expert as the Chief Restructuring Officer with effect from mid-October 2017. Furthermore, a new Chief Executive Officer
with considerable experience regarding the implementation of successful turnaround strategies in the private sector was appointed
with effect from 1 November 2017. A new SAA Chairperson and Board also took office during November 2017.
A R10 billion recapitalisation of SAA was announced in the 2018 MTBPS. This includes the R2.2 billion transferred on 30 June 2017 and
the R3 billion transferred on 29 September 2017. The remaining R4.8 billion was disbursed in December 2017.
Regarding the disposal of non-core assets by government to assist in covering the liabilities incurred by SOCs, National Treasury
crafted a draft framework in 2017. The detailed audit of non-strategic assets of SOCs, aimed at strengthening their balance sheets, will
commence once the framework for disposal of non-core assets has been approved by the relevant structures.
More generally, Cabinet resolved that government would need to finalise various unfinished policy discussions and urgently

3
Nat
iona
l Tre
asur
y | A
nnua
l Per
form
ance
Pla
n | 2
018/
19
PART A: STRATEGIC OVERVIEW- Continued
unlock investments in support of growth, job creation and economic transformation. Government must create policy certainty and
fast-track the following:
• The Mining Charter and the Mineral and Petroleum Resources Development Act
• Rollout of broadband, or high-speed internet, to all communities
• Allocation of telecommunications spectrum
• Conclusion of Independent Power Producer agreements
• Land and agrarian reform
CREATION OF THE BUDGET FACILITY FOR INFRASTRUCTURE
The Budget Facility for Infrastructure (BFI) is a reform of the budget process aimed at creating institutional procedures supporting the
commitment of fiscal resources to large-scale infrastructure projects and programmes.
The BFI was finalised in 2017 following a consultative process with key stakeholders. A call-for-proposals for large infrastructure projects
of national priority was also issued as part of the 2018/19 MTEC guidelines. The facility established specialised structures, procedures
and criteria to improve the rigour of budgeting for large infrastructure projects and programmes by ensuring that the full life cycle
costs of projects are explicitly considered in planning, adequately budgeting for and anticipating in future budgets. The facility provides
a single window and operating procedure for dealing with budget submissions for these projects.
Work has been undertaken by National Treasury, the Economic Development Department (Presidential Infrastructure Coordinating
Commission) and the Department of Planning Monitoring and Evaluation to put in place the structures, processes and criteria for the
appraisal and evaluation of these large projects.
PUBLIC SECTOR PROCUREMENT
Government is intensifying efforts to improve its procurement systems and leverage public procurement to promote economic
transformation imperatives. The aim of the draft Public Procurement Bill is to maximise the developmental impact of the more than
R500bn that government entities spend annually in procuring goods and services. Economic transformation will be at the centre of
procurement strategies, reporting and performance management. Preferential procurement will be used to grow credible productive
capacity rather than rent-seeking.
Preferential Procurement Regulations that took effect on 1 April 2017 provide policy instruments in promoting government’s
objective of an inclusive economy. These regulations have broadened the scope for black businesses to participate in government
procurement opportunities.
FINANCIAL SECTOR REGULATION
Various initiatives, in which National Treasury is taking the lead, are underway within this sector. These are aimed primarily at ensuring
that financial institutions treat their customers fairly, are able to meet their obligations to their customers and at ensuring that the
financial system is stable and capable of providing ongoing services that are vital to the healthy operation of the economy. The key
areas are the following:
• Implementation of the Twin Peaks Model (Financial Sector Regulation Act) - the Financial Sector Regulation (FSR) Bill was approved
by Parliament in June 2017 and signed into law by the President in August 2017. The focus is now on implementing the Act, which
creates a new system of financial regulation by establishing a Prudential Authority and a Financial Sector Conduct Authority and by
conferring powers on these entities. Significant effort will be required to manage the transition to this new regulatory architecture

4
Nat
iona
l Tre
asur
y | A
nnua
l Per
form
ance
Pla
n | 2
018/
19
PART A: STRATEGIC OVERVIEW - Continued
This will involve closing existing entities, including the Financial Services Board, and managing shifts in staff, resources and legal
responsibilities. The FSR Act is aimed at strengthening South Africa’s approach to consumer protection and market conduct in
financial services as well as ensuring a more resilient and stable financial system. Customer protection will be strengthened by the
Act, both through the creation of the new market conduct authority and through the creation of an Ombud Council tasked with
ensuring fair, effective and accessible complaint resolution platforms for financial customers
• Convening the Financial Sector Summit on transformation. Concerted steps are required to address all vestiges of structural
imbalances that remain from apartheid, not only in the financial sector but across the economy. The targets identified in
the Broad Based Black Economic Empowerment (BBBEE) policy framework set these out, and these were included in the
Financial Sector Code. However, it has become evident that the code had various shortcomings. A decision was accordingly
taken by the National Economic Development and Labour Council (NEDLAC) to hold a second Financial Sector Summit
during the first quarter of 2018 to review progress made from the initial summit in 2002 and to refocus the transformation
policy framework, approaches, implementation and impact. In preparation for the summit, National Treasury devised various
policy proposals. A draft policy on Financial Inclusion, encompassing transformation in support of a more inclusive financial
sector, was also finalised
• Introduction of micro-insurance. The Insurance Bill 2016, which was presented to Parliament in 2017, provides for a dedicated
micro-insurance licence category. The micro-insurance framework is part of a developmental framework that supports niche
insurers with lower prudential (capital) requirements as well as financial inclusion. It encourages formalisation by lowering
regulatory barriers to entry for participants seeking to enter the insurance market
• Amending legislation for Postbank licensing. National Treasury and the Department of Telecommunications and Postal Services
are finalising draft legislation to facilitate licensing of the Postbank. The proposals will be submitted to Cabinet shortly for
public consultation
1.2. Organisational Environment
As with government in general, National Treasury is working diligently on achieving more with less. This is very important given the
constrained fiscal environment in which we operate. A suite of measures has been instituted to reduce the costs to the department
in respect of compensation, goods and services, capital expenditure and transfers, and subsidies. Risk mitigation strategies have also
been put in place in each of the areas where cost reductions have been implemented to ensure continued delivery of services at
required levels. Despite these cost containment measures, National Treasury remains committed to achieving its mandate as set out
in the PFMA, namely to:
• Promote government’s fiscal policy framework
• Coordinate macroeconomic policy and intergovernmental financial relations
• Manage the budget preparation process
• Facilitate the Division of Revenue Act (DoRA), which provides for an equitable distribution of nationally raised revenue between
national, provincial and local government
• Monitor the implementation of provincial budgets
National Treasury needs to ensure that there is no compromise on delivery in its core areas as each of these is important for the
sustainable economic wellbeing of the country. Key focus areas over the medium term are as follows:
• Promoting economic policy coherence around the objectives of growth and jobs
• Addressing risks on the public sector balance sheet
• Executing a credible budget process that allocates resources sustainably to policy priorities and is in line with spending plans
• Exercising public finance management oversight responsibilities, including capacity building, that deliver value for money
• Making the financial sector serve South Africa better
• Building an effective institution that is a centre of excellence
• Implementing a strategic communications and outreach programme that addresses stakeholders’ needs

5
Nat
iona
l Tre
asur
y | A
nnua
l Per
form
ance
Pla
n | 2
018/
19
PART A: STRATEGIC OVERVIEW- Continued
1.3. Revisions to Legislative and Other Mandates
New legislation during the 2017/18 financial year which affects National Treasury is as follows:
• Appropriation Act, 2017
• Division of Revenue Act, 2017
• Financial Intelligence Centre Amendment Act, 2017
• Financial Sector Regulation Act (Act No. 1 of 2017)
• Insurance Act (still to be assented to)
• Adjustments Appropriation Act
• Division of Revenue Amendment Act (DoRA)
• Rates and Monetary Amounts and Amendments of Revenue Laws Amendment Act (Act No. 14 of 2017)
• Tax Administration Laws Amendment Bill (still to be assented to)
• Taxation Laws Amendment Bill (still to be assented to)
• (New) Treasury Regulations (final regulations still to be promulgated)
The process to consider the development of new policies or review of existing instruments will be conducted during 2018/19 in
respect of the following:
• Public Procurement Bill
• Financial Matters Laws Amendment Bill
• Financial Services Laws General Amendment Bill
• Municipal and Fiscal Powers and Functions Amendment Bill
• Conduct of Financial Institutions Bill
• National Payment System Amendment Bill
• Appropriation and Adjustments Appropriation Bills
• Division of Revenue and Divisions of Revenue Amendment Bills
• Rates and Monetary Amounts and Amendments of Revenue Laws Amendment Bill
• Tax Administration Laws Amendment Bill
• Taxation Laws Amendment Bill
1.4. Strategic Outcome Oriented Goals of the Institution
PROGRAMME 1: ADMINISTRATION
This programme ensures effective leadership, strategic management and administrative support to National Treasury through
continuous refinement of organisational strategy and structure in line with appropriate legislation and best practice.
PROGRAMME 2: ECONOMIC POLICY, TAX, FINANCIAL REGULATION AND RESEARCH
This programme aims to promote economic policy coherence around the objectives of growth and jobs and improve South
Africa’s macroeconomic and microeconomic framework by conducting ongoing analysis, research and policy advisory services. The
programme supports economic growth, employment and macroeconomic stability and retirement reform by:
• Developing tax policy proposals and supporting tax legislation for the annual budget
• Monitoring the collection of revenue through ongoing consultation with relevant stakeholders, and analysing the factors
determining the tax collection

6
Nat
iona
l Tre
asur
y | A
nnua
l Per
form
ance
Pla
n | 2
018/
19
PART A: STRATEGIC OVERVIEW - Continued
• Providing macroeconomic forecasts and scenario modelling
• Providing economic policy analysis, research, assessment and advice on macro and microeconomics, including government
policy proposals
PROGRAMME 3: PUBLIC FINANCE AND BUDGET MANAGEMENT
This programme aims to promote growth, social development and poverty reduction through sound fiscal and financial policies
and effective, efficient and appropriate allocation of public funds to address government’s policy priorities. It aims to achieve these
objectives by:
• Providing analysis and advice on fiscal policy and public finances, intergovernmental financial relations and expenditure planning
and priorities
• Managing the annual budget process and providing public finance management support
PROGRAMME 4: ASSET AND LIABILITY MANAGEMENT
The programme manages government’s annual funding programme in a manner that ensures prudent cash management and an
optimal portfolio of debt and other fiscal obligations. It also seeks to promote and enforce prudent financial management of state-
owned entities (SOEs) through financial analysis and oversight.
PROGRAMME 5: FINANCIAL ACCOUNTING AND SUPPLY CHAIN MANAGEMENT SYSTEMS
This programme is made up of two divisions: the Office of the Accountant-General and the Office of the Chief Procurement Officer.
This programme facilitates accountability, governance and oversight by promoting effective, efficient, economic and transparent
management of revenue, expenditure, assets, and liabilities across all spheres of government and public entities.
The Office of the Accountant-General also provides financial support through the Financial Management Grant (FMG) and technical
assistance in the form of specialist advisor placements to municipalities. This augments municipal own resources to implement the
reforms legislated in the Municipal Finance Management Act (MFMA). The grant further assists municipalities build institutional and
technical skills in all aspects of financial management including the appointment of suitably qualified finance officials, growing
the internship programme for graduates to be absorbed in municipalities, implementing budget reforms, improving supply chain
management, addressing shortcomings in revenue management, strictly implementing controls in expenditure management,
developing assets management plans that also address the repairs and maintenance of assets, producing accurate accounting records,
assisting in achieving auditing compliance and in producing auditing reports that are reliable and of quality, and supporting the
training of officials to meet the required minimum competencies.
The Office of the Chief Procurement Officer aims to:
• Modernise the state procurement system to be fair, equitable, transparent, competitive and cost effective
• Enable the efficient, economic, effective and transparent utilisation of financial and other resources, including state assets, for
improved service delivery
• Promote, support and enforce the transparent and effective management of state procurement and the sound stewardship of
government assets and resources

7
Nat
iona
l Tre
asur
y | A
nnua
l Per
form
ance
Pla
n | 2
018/
19
PART A: STRATEGIC OVERVIEW- Continued
PROGRAMME 6: INTERNATIONAL FINANCIAL RELATIONS
This programme manages South Africa’s interests in shaping regional and global policies that advance the economic, financial and
development objectives of the country and those of Africa as a whole.
PROGRAMME 7: CIVIL AND MILITARY PENSIONS, CONTRIBUTIONS TO FUNDS AND OTHER BENEFITS
This programme provides for the processing and payment of pensions to members and their dependents in terms of various statutes,
collective bargaining agreements and other commitments.
PROGRAMME 8: TECHNICAL AND MANAGEMENT SUPPORT AND DEVELOPMENT FINANCE
This programme provides advisory services, programme management and development finance support to improve public finance
management, support high-impact government initiatives, facilitate employment creation and strengthen infrastructure planning
and delivery.
PROGRAMME 9: REVENUE ADMINISTRATION
This programme comprises transfers made to the South African Revenue Service to undertake core tax administration activities and
maintain the information technology competencies that support these operations.
PROGRAMME 10: FINANCIAL INTELLIGENCE AND STATE SECURITY
This programme essentially comprises transfers made to the Financial Intelligence Centre to combat financial crimes, including money
laundering and terror-financing activities.

8
Nat
iona
l Tre
asur
y | A
nnua
l Per
form
ance
Pla
n | 2
018/
19
PART A: STRATEGIC OVERVIEW - Continued
1.5.
VO
TE 7
: Nat
iona
l Tre
asur
y Re
sour
ce P
lan
BUD
GET
SU
MM
ARY
1
R m
illio
n20
18/1
920
19/2
020
20/2
1
Tota
lCu
rren
tpa
ymen
tsTr
ansf
ers
and
subs
idie
sPa
ymen
ts fo
rca
pita
l ass
ets
Paym
ents
for
finan
cial
ass
ets
Tota
lTo
tal
MTE
F al
loca
tion
Adm
inis
trat
ion
484.
744
5.5
3.9
35.3
–
555.
859
0.7
Econ
omic
Pol
icy,
Tax
, Fin
anci
al R
egul
atio
n an
d Re
sear
ch14
1.0
106.
933
.20.
9 –
14
8.0
158.
1
Publ
ic F
inan
ce a
nd B
udge
t Man
agem
ent
290.
123
6.1
51.8
2.2
–
308.
933
0.5
Ass
et a
nd L
iabi
lity
Man
agem
ent
110.
410
9.9
–
0.5
–
111.
511
9.4
Fina
ncia
l Acc
ount
ing
and
Supp
ly C
hain
Man
agem
ent S
yste
ms
1 19
6.6
1 08
5.9
104.
36.
4 –
1
080.
71
144.
3
Inte
rnat
iona
l Fin
anci
al R
elat
ions
5 40
2.1
51.5
972.
80.
54
377.
35
745.
16
061.
4
Civ
il an
d M
ilita
ry P
ensi
ons,
Cont
ribut
ions
to F
unds
and
Oth
er
Bene
fits
5 16
3.8
68.9
5 09
4.9
–
–
5 57
4.5
5 88
1.2
Tech
nica
l Sup
port
and
Dev
elop
men
t Fin
ance
2 79
8.8
407.
82
391.
1 –
–
2
987.
83
726.
9
Reve
nue
Adm
inis
trat
ion
9 00
7.2
–
9 00
7.2
–
–
9 13
0.3
9 63
0.9
Fina
ncia
l Int
ellig
ence
and
Sta
te S
ecur
ity4
763.
5 –
4
763.
5 –
–
4
951.
15
223.
2
Subt
otal
29 3
58.4
2 51
2.5
22 4
22.8
45.8
4 37
7.3
30 5
93.7
32 8
66.5
1 Not
ing
that
tabl
es c
an b
e am
ende
d su
bjec
t to
the
final
isat
ion
of th
e 20
18 e
stim
ates
of n
atio
nal e
xpen
ditu
re (E
NE)

9
Nat
iona
l Tre
asur
y | A
nnua
l Per
form
ance
Pla
n | 2
018/
19
PART A: STRATEGIC OVERVIEW- Continued
R m
illio
n20
18/1
920
19/2
020
20/2
1
Tota
lCu
rren
tpa
ymen
tsTr
ansf
ers
and
subs
idie
sPa
ymen
ts fo
rca
pita
l ass
ets
Paym
ents
for
finan
cial
ass
ets
Tota
lTo
tal
Dire
ct c
harg
e ag
ains
t the
Nat
iona
l Rev
enue
Fun
d
Prov
inci
al e
quita
ble
shar
e47
0 28
6.5
–
470
286.
5 –
–
50
5 01
9.7
542
446.
9
Deb
t-se
rvic
e co
sts
180
124.
018
0 12
4.0
–
–
–
197
663.
621
3 85
9.0
Gen
eral
fuel
levy
sha
ring
with
met
ropo
litan
mun
icip
aliti
es12
468
.6 –
12
468
.6 –
–
13
166
.814
026
.9
Nat
iona
l Rev
enue
Fun
d pa
ymen
ts13
5.1
–
–
–
135.
1 –
–
Tota
l exp
endi
ture
est
imat
es69
2 37
2.5
182
636.
550
5 17
7.8
45.8
4 51
2.3
746
443.
780
3 19
9.3
Exec
utiv
e au
thor
ityM
inis
ter o
f Fin
ance
Acc
ount
ing
office
rD
irect
or G
ener
al o
f the
Nat
iona
l Tre
asur
y
Web
site
add
ress
ww
w.tr
easu
ry.g
ov.z
a
The
Estim
ates
of N
atio
nal E
xpen
ditu
re (E
NE)
e-p
ublic
atio
ns fo
r ind
ivid
ual v
otes
are
ava
ilabl
e on
ww
w.tr
easu
ry.g
ov.z
a. T
hese
pub
licat
ions
pro
vide
mor
e co
mpr
ehen
sive
cove
rage
of v
ote
spec
ific
info
rmat
ion,
pa
rtic
ular
ly a
bout
goo
ds a
nd se
rvic
es, t
rans
fers
and
subs
idie
s, pe
rson
nel, e
ntiti
es, d
onor
fund
ing,
pub
lic p
rivat
e pa
rtne
rshi
ps, c
ondi
tiona
l gra
nts t
o pr
ovin
ces a
nd m
unic
ipal
ities
, and
exp
endi
ture
info
rmat
ion
at th
e le
vel o
f ser
vice
del
iver
y, w
here
app
ropr
iate
.
BUD
GET
SU
MM
ARY
- CO
NTI
NU
ED

10
Nat
iona
l Tre
asur
y | A
nnua
l Per
form
ance
Pla
n | 2
018/
19
PART A: STRATEGIC OVERVIEW - Continued
EXPENDITURE ANALYSIS
Chapter 3 of the National Development Plan (NDP) details a vision for South Africa of building an inclusive economy that ensures
social equality. This vision is expressed specifically in terms of outcome 4 (decent employment through inclusive growth), outcome
8 (sustainable human settlements and improved quality of household life) and outcome 12 (an efficient, effective and development
oriented public service) of government’s 2014-2019 medium term strategic framework. These outcomes are closely aligned to the work
of National Treasury. The department’s continuous focus, therefore, remains on directing government spending towards programmes
that create jobs, improve and develop infrastructure, and eliminate poverty and inequality. To this end, National Treasury will continue
to improve efficiencies and prioritise essential sectors and services such as social protection for vulnerable members of society.
The department’s focus over the medium term will be on reviewing tax policy, managing future spending growth and fiscal risk,
managing government’s assets and liabilities, making government procurement more efficient, strengthening financial management
in government, strengthening the regulation of the financial sector, promoting regional and international cooperation, supporting
sustainable employment, and supporting the development of infrastructure and economically integrated cities and communities.
The department plans to transfer a total of R1.5 trillion over the medium term to provincial governments for the provincial equitable
share. To address the gap in the funding of welfare services provided through non-profit organisations and in programmes aimed
at preventing violence against women and children, Cabinet has approved increases of R201 million in 2018/19, R500 million
in 2019/20 and R527.5 million in 2020/21 in the provincial equitable share. Cabinet has also approved reductions of R1.4 billion in
2018/19, R1.6 billion in 2019/20 and R1.7 billion in 2020/21 in the provincial equitable share for provincial departments’ administration
programmes and transfers to provincial entities.
National Treasury is also responsible for servicing government’s debt and distributing the general fuel levy to metropolitan municipalities.
The department will spend a projected R183.1 billion in 2018/19, R203.3 billion in 2019/20 and R223.4 billion in 2020/21 to service
government’s debt. Cabinet has approved an increase in funding of R2.4 billion in 2018/19, R6 billion in 2019/20 and R15.2 billion in
2020/21 to cater for higher debt-service costs. Expenditure on the distribution of the general fuel levy to metropolitan municipalities
is projected at R12.5 billion in 2018/19, R13.2 billion in 2019/20 and R14 billion in 2020/21.
Cabinet has approved total reductions of R2.9 billion in 2018/19, R3.3 billion in 2019/20 and R3.4 billion in 2020/21 to the department’s
budget for purposes of fiscal consolidation. The department will adjust its operations mainly through optimising human resource
efficiencies and enhancing the organisational structure to align with these budget reductions, without negatively impacting
on performance.
REVIEWING TAX POLICY AND STRENGTHENING THE REGULATION OF THE FINANCIAL SECTOR
Over the medium term, the department aims to conclude proposals for tax policy amendments to meet government’s revenue
requirements and eliminate tax loopholes to improve fairness in the tax system. Recent amendments have included the introduction of
the health promotion levy, which discourages the consumption of sugary beverages, with a proposed starting date of 1 April 2018, and
publication of the draft Carbon Tax Bill for public comment and introduction in Parliament in 2018. The carbon tax aims to encourage
investments in low carbon, energy efficient alternatives and reduce emissions of greenhouse gases. Spending on implementing these
tax measures over the medium term is projected to be R30 million in 2018/19, R31 million in 2019/20 and R33.2 million in 2020/21 in
the Tax Policy sub-programme in the Economic Policy, Tax, Financial Regulation and Research programme.
The department also plans to implement the Financial Sector Regulation Act that creates a new system of financial regulation by
establishing a prudential authority and a financial sector conduct authority. The transition towards this new regulatory architecture

11
Nat
iona
l Tre
asur
y | A
nnua
l Per
form
ance
Pla
n | 2
018/
19
PART A: STRATEGIC OVERVIEW- Continued
involves closing down existing entities and managing shifts in legal responsibilities, and human and other resources. The Act aims
to preserve and enhance South Africa’s financial stability by conferring powers on the South African Reserve Bank and establishing
a committee to oversee financial stability. The Act also provides for the protection of financial customers through the creation of a
market conduct authority and ombud tasked with ensuring fair, effective and accessible platforms to resolve complaints. To streamline
regulations applicable to financial institutions, the market conduct unit also plans to develop a new law for the proportionate
regulation of the market conduct of all institutions in the financial sector. Spending on these activities is projected to be R24.9 million
in 2018/19, R26.3 million in 2019/20 and R28.3 million in 2020/21 in the Financial Sector Policy sub-programme in the Economic Policy,
Tax, Financial Regulation and Research programme.
MANAGING FUTURE SPENDING GROWTH AND FISCAL RISK
A combination of fiscal measures and economic interventions is required to grow the economy, address challenges facing
public finances and reduce long term risks. In this regard, over the medium term, National Treasury will ensure that government
departments adhere to spending limits, as considered during the national budget preparation process. Spending on related activities
is projected to be R290.1 million in 2018/19, R308.9 million in 2019/20 and R330.5 million in 2020/21 in the Public Finance and Budget
Management programme.
MANAGING GOVERNMENT’S ASSETS AND LIABILITIES
The department is responsible for overseeing state-owned enterprises and enabling them to meet government’s policy objectives
in a financially and fiscally sustainable manner. National Treasury compiles annual reviews of the corporate plans of all public entities
listed in schedules 2 and 3B of the PFMA, as well as selected entities listed in schedule 3A of the Act. In addition to assessing these
entities’ alignment with government’s priorities, their financial sustainability and their soundness of governance, the review aims to
identify potential risks and mitigate their possible effects. Similarly, the performance of public entities is evaluated through a review of
their annual reports. With the significant increase of contingent liabilities in government, over the medium term, the department will
develop frameworks to reduce the number of government guarantees issued to public entities, especially for operational purposes,
while improving the risk exposure from such guarantees.
Over the medium term, National Treasury will continue to finance government’s gross borrowing requirements in domestic and
international capital markets, taking into consideration a risk-sensitive approach to debt financing and the management of the debt
portfolio. Prudent cash management will be maintained to ensure that government remains liquid. Spending on these activities
is projected to be R110.4 million in 2018/19, R111.5 million in 2019/20 and R119.4 million in 2020/21 in the Asset and Liability
Management programme.
MAKING GOVERNMENT PROCUREMENT MORE EFFICIENT
The Office of the Chief Procurement Officer (OCPO) is tasked with ensuring efficient procurement practices in government. Over
the medium term, reforms in the procurement process are expected to ensure efficiencies and value for money, and minimise
opportunities to abuse the supply chain management system. The office will continue to implement cost containment measures
by applying strategic procurement principles, identifying opportunities for centrally arranged contracts, implementing preferential
procurement as a lever to support black economic empowerment, small business development and industrial development, and
strengthening measures to promote transparency and accountability.
In line with its function to ensure efficient procurement practices, the OCPO facilitates the arrangement of more than 70 transversal
contracts across different commodity groups with an estimated value of R62 billion to derive benefits out of economies of scale and

12
Nat
iona
l Tre
asur
y | A
nnua
l Per
form
ance
Pla
n | 2
018/
19
PART A: STRATEGIC OVERVIEW - Continued
value for money. Transversal contracts are arranged where multiple departments have a need for the same or similar products and
services and the focus of the OCPO has been structured into six main commodity groups namely Health and Medical Technology,
Vehicles Equipment and Services, Textiles, Perishables and Consumables, Information Communication Technologies, Property and
Leasing and Education.
Transversal contracts benefit departments by reducing the duplication of procurement processes and by assisting in the prevention
of inconsistencies in product standards and quality, price differentials, wastage and leakages. Transversal contracts also generate
savings for government through economies of scale. There are other important non-financial gains that will be achieved such as the
broader multiple socio-economic objectives of government, e.g. broad based black economic empowerment, local procurement,
small business empowerment, job creation, supplier development, etc. Savings have been realised from transversal contracts through
the application of strategic sourcing to certain identified strategic contracts. Centralisation of transversal contracts will continue to
provide leverage for cost savings in government spending as well as concentrated socio-economic empowerment interventions.
The Public Procurement Bill is intended to provide for consolidation of the fragmented procurement legislative environment to create
a flexible, agile and expanded scope of service delivery, economic empowerment, transparency and good governance. The bill is
scheduled to be gazetted for public comment in 2018/19.
Spending on activities related to government procurement processes is projected to be R191.2 million in 2018/19, R137.7 million in
2019/20 and R145.1 million in 2020/21 in the Programme Management for Financial Accounting and Supply Chain Management
Systems sub-programme in the Financial Accounting and Supply Chain Management System programme.
STRENGTHENING GOVERNMENT FINANCIAL MANAGEMENT
The Integrated Financial Management System (IFMS) is designed to enhance the productivity and effectiveness of government
departments by improving access to information, raising the quality of data, eliminating the duplication of systems and resources,
and curtailing manual processes. Spending on activities related to the IFMS is projected to be R350.1 million in 2018/19, R243 million
in 2019/20 and R256.4 million in 2020/21 in the Financial Systems sub-programme in the Financial Accounting and Supply Chain
Management System programme. The higher projected spending in 2018/19 is due to a once-off payment on the project.
Through the Local Government Financial Management Grant, the department promotes and supports financial management
reform and builds capacity in municipalities to improve the implementation of the MFMA. Funds disbursed through the grant assist
in strengthening the capacity of municipal budgets, treasury offices, internal audit units and audit committees; the appointing of
financial management interns and the provision of their training; investing in financial management systems; implementing reforms,
including the development of financial recovery plans; implementing consequence management processes; and attending to matters
arising from audit outcomes.
Municipalities use funds from the grant to prepare their annual financial statements towards the preparation of audit action plans, to
upskill and provide capacity to their internal audit units and audit committees, and to acquire and update their financial management
systems to comply with the municipal standard chart of accounts (mSCOA).
Over the medium term, funding from the grant is also expected to address current reforms in financial management, and new reforms
for addressing shortcomings identified in the financial management capability maturity model.
The grant receives allocations of R504.6 million in 2018/19, R532.8 million in 2019/20 and R561.7 million in 2020/21 through the Local
Government Financial Management Support sub-programme in the Technical Support and Development Finance programme.

13
Nat
iona
l Tre
asur
y | A
nnua
l Per
form
ance
Pla
n | 2
018/
19
PART A: STRATEGIC OVERVIEW- Continued
FACILITATING REGIONAL AND INTERNATIONAL COOPERATION
The New Development Bank was established in 2014 to strengthen cooperation among the Brazil-Russia-India-China-South Africa
(BRICS) group of countries and complement the efforts of multilateral and regional financial institutions for global development. As part
of the South African government’s capital contribution to the bank, the department transferred R5.8 billion in two capital instalments
in 2015/16 and 2016/17. A third transfer of R4.5 billion was made in 2017/18. A total of R14.3 billion has been allocated over the period
ahead for transfers to the bank in the International Development Funding Institutions sub-programme in the International Financial
Relations programme. US$1.5 billion has been made available to South Africa for development finance over the next two years.
Compensation to member countries of the Common Monetary Area for the use of the Rand as currency in Namibia, Lesotho and
Swaziland is projected to be R804.9 million in 2018/19, R849.9 million in 2019/20 and R896.7 million in 2020/21 in the African Integration
and Support sub-programme in the International Financial Relations programme.
SUPPORTING SUSTAINABLE EMPLOYMENT
The Jobs Fund was introduced in 2011 with a total operating budget of R9 billion to create a targeted 150 000 permanent jobs by
2023. Through the fund, the department supports innovative, partnership-based approaches to sustainable job creation; and facilitates
research into employment, income distribution and inclusive growth. As at 30 September 2017, 104 443 new permanent jobs had been
created by implementing 113 projects, and an additional 57 746 unemployed individuals had been placed in permanent employment.
In addition, 223 271 people have benefitted from work readiness and technical training interventions. Current estimates suggest that
the fund will exceed the target of 150 000 new permanent jobs created by 2023 as 70 per cent of the target has already been met.
R6.1 billion of the fund’s total budget has been spent to date in a portfolio of 117 approved employment generating initiatives, and an
additional R8.6 billion of matched funding has been committed from project partners.
Cabinet has approved a reduction of R570 million on transfers to the Jobs Fund between 2018/19 and 2020/21. The revised Jobs Fund
figures are thus R230 million in 2018/19, R195 million in 2019/20 and R145 million in 2020/21. The department’s spending on activities
related to the creation of sustainable employment is projected to be R3.1 billion over the medium term in the Employment Creation
Facilitation sub-programme in the Technical Support and Development Finance programme.
SUPPORTING INFRASTRUCTURE DEVELOPMENT AND ECONOMICALLY INTEGRATED CITIES AND COMMUNITIES
To promote the efficient use of urban spaces, the Integrated City Development Grant provides a financial incentive for metropolitan
municipalities to integrate and use infrastructure investment in a more focused way. For this purpose, 25 strategic integration zones have
been identified in South Africa’s eight metropolitan municipalities, and detailed planning is under way to implement catalytic integrated
development projects in these prioritised areas. The projects involve urban regeneration, integrated public transport networks and
integrated mixed-use developments. Funding from the grant supplements cities’ capital budgets and is used to leverage loan financing
and other investments from the private sector. Total transfers to the grant over the medium term are expected to amount to R931 million
in the Urban Development and Support sub-programme in the Technical Support and Development Finance programme.
The Infrastructure Delivery Improvement Programme (IDIP) supports provincial departments that deliver infrastructure, and aims to
improve the delivery of public sector infrastructure through institutionalising best practice and building capacity. An estimated 300
officials will be trained on the programme’s infrastructure delivery management system over the MTEF period. The programme has
a projected allocation of R295.1 million over the medium term in the Infrastructure Development Support sub-programme in the
Technical Support and Development Finance programme.

14
Nat
iona
l Tre
asur
y | A
nnua
l Per
form
ance
Pla
n | 2
018/
19
PART A: STRATEGIC OVERVIEW - Continued
The Neighbourhood Development Partnership Grant (NDPG) provides funding for neighbourhood development projects that aim to
improve the quality of life for residents in targeted areas, generally townships. Capital funding is reserved for projects that contribute
to spatial transformation. The grant assists metropolitan municipalities and secondary city municipalities in planning and developing
inclusive and productive cities. Such projects use catalytic infrastructure (transport, water, sewerage and energy infrastructure; and
community and government facilities) to attract third-party investment to township nodes in strategic integration zones. A two-stage
approval process for capital funding - first for project planning then for implementation - has been developed and implemented
since 2016/17 to access the grant. This funding process is intended to reduce the risk of contingent project liabilities that result in
slow spending due to factors such as procurement delays. Over the medium term, the grant will support an estimated 18 urban hub
precinct plans that will prioritise 60 catalytic infrastructure projects. Spending on the grant is projected to be R631.2 million in 2018/19,
R652.2 million in 2019/20 and R687.6 million in 2020/21 in the Urban Development and Support sub-programme in the Technical
Support and Development Finance programme.
The Infrastructure Skills Development Grant (ISDG) supports municipalities by recruiting and training unemployed graduates within
the built environment to get them professionally registered with the relevant statutory councils. The grant currently funds the training
of 502 graduates from various municipalities. Training is provided according to structured training plans as per the requirements of
the statutory councils. Graduates undergo intensive practical work for a period of three to four years, depending on the requirements
of the log books and experience reports that graduates must compile in order to meet the registration requirements of the various
statutory councils. Currently, 201 graduates have completed the training, of which 168 have been permanently appointed. The ISDG
was introduced in the 2011/12 financial year to expand and deepen the built environment skills pipeline in local government. Due
to the overwhelming demand from municipalities, the grant has exceeded the annual target of 400 graduates. To support this, the
grant is expected to disburse R141.5 million in 2018/19, R149.4 million in 2019/20 and R157.9 million in 2020/21 in the Infrastructure
Development Support sub-programme in the Technical Support and Development Finance programme.

15
Nat
iona
l Tre
asur
y | A
nnua
l Per
form
ance
Pla
n | 2
018/
19
PART A: STRATEGIC OVERVIEW- ContinuedEX
PEN
DIT
URE
TRE
ND
S
Prog
ram
me
Ann
ual
Budg
et
Adj
uste
d A
ppro
-pri
atio
n
Aud
ited
Out
com
e A
nnua
l Bu
dget
A
djus
ted
App
ro-p
riat
ion
Aud
ited
Out
com
e A
nnua
l Bu
dget
A
djus
ted
App
ro-p
riat
ion
Aud
ited
Out
com
e A
nnua
l Bu
dget
A
djus
ted
App
ro-p
riat
ion
Rev
ised
Es
timat
e Av
erag
e:O
utco
me
/Ann
ual
Budg
et(%
)
Aver
age:
Out
com
e/A
djus
ted
App
ro-p
riat
ion(
%)
R m
illio
n20
14/1
5 20
15/1
6 20
16/1
7 20
17/1
8 20
14/1
5 - 2
017/
18
Prog
ram
me
134
3.1
372.
436
2.5
366.
736
3.6
375.
641
2.7
467.
443
6.3
414.
343
9.1
439.
310
5.0%
98.2
%
Prog
ram
me
213
8.9
134.
412
4.3
133.
913
5.4
131.
314
6.1
150.
215
1.2
139.
616
4.0
163.
910
2.2%
97.7
%
Prog
ram
me
326
2.8
259.
924
5.3
257.
026
6.1
262.
628
7.0
294.
528
1.8
286.
130
3.0
303.
110
0.0%
97.3
%
Prog
ram
me
43
342.
13
343.
43
089.
43
116.
93
264.
93
264.
310
7.2
113.
111
0.1
102.
410
100
.310
100
.324
8.4%
98.5
%
Prog
ram
me
576
1.6
770.
073
1.5
751.
480
7.1
774.
584
9.9
1 21
6.8
1 20
9.9
1 08
7.9
1 07
9.1
868.
510
3.9%
92.5
%
Prog
ram
me
61
179.
81
199.
71
198.
71
247.
43
254.
93
546.
15
039.
14
978.
04
955.
85
836.
85
831.
45
789.
311
6.4%
101.
5%
Prog
ram
me
73
717.
83
717.
83
730.
93
962.
93
962.
93
967.
74
173.
24
462.
64
400.
24
835.
04
835.
04
835.
010
1.5%
99.7
%
Prog
ram
me
83
712.
23
099.
82
893.
33
143.
92
774.
62
472.
22
634.
72
612.
72
478.
42
873.
32
558.
52
558.
584
.1%
94.2
%
Prog
ram
me
99
440.
39
440.
39
440.
39
434.
49
334.
49
334.
410
009
.29
363.
79
363.
710
218
.210
168
.210
168
.298
.0%
100.
0%
Prog
ram
me
104
366.
34
366.
34
366.
34
542.
84
562.
14
562.
14
812.
54
812.
54
812.
55
005.
65
005.
65
005.
610
0.1%
100.
0%
Subt
otal
27
265
.026
703
.926
182
.526
957
.328
726
.128
690
.828
471
.428
471
.428
199
.830
799
.240
484
.340
231
.810
8.6%
99.1
%
Dire
ct c
harg
e ag
ains
t the
Nat
iona
l Re
venu
e Fu
nd
485
012.
548
4 90
7.8
486
435.
951
9 89
3.8
525
742.
652
6 63
6.1
569
787.
457
0 83
3.0
570
197.
161
5 85
6.8
616
714.
061
6 58
7.0
100.
4%10
0.1%
Prov
inci
al e
quita
ble
shar
e35
9 92
1.8
359
921.
835
9 92
1.8
382
673.
538
6 50
0.0
386
500.
041
0 69
8.6
410
698.
641
0 69
8.6
441
331.
144
1 33
1.1
441
331.
110
0.2%
100.
0%
Deb
t-se
rvic
e co
sts
114
900.
511
4 48
5.0
114
798.
412
6 44
0.4
127
902.
012
8 79
5.6
147
720.
014
7 68
9.2
146
496.
716
2 35
3.1
163
347.
916
3 15
5.4
100.
3%10
0.0%
Gen
eral
fuel
levy
sh
arin
g w
ith
met
ropo
litan
m
unic
ipal
ities
10 1
90.2
10 1
90.2
10 1
90.2
10 6
58.9
10 6
58.9
10 6
58.9
11 2
23.8
11 2
23.8
11 2
23.8
11 7
85.0
11 7
85.0
11 7
85.0
100.
0%10
0.0%
Nat
iona
l Rev
enue
Fu
nd p
aym
ents
–
310.
91
525.
512
1.0
681.
768
1.7
145.
01
221.
41
778.
038
7.6
250.
031
5.5
658.
0%17
4.5%
Tota
l 51
2 27
7.5
511
611.
851
2 61
8.4
546
851.
155
4 46
8.7
555
327.
059
8 25
8.8
599
304.
559
8 39
6.9
646
656.
065
7 19
8.4
656
818.
810
0.8%
100.
0%
Cha
nge
to 2
017
Budg
et e
stim
ate
10
542
.3

16
Nat
iona
l Tre
asur
y | A
nnua
l Per
form
ance
Pla
n | 2
018/
19
PART A: STRATEGIC OVERVIEW - Continued
EXPE
ND
ITU
RE T
REN
DS
- CO
NTI
NU
ED
Prog
ram
me
Ann
ual
Budg
et
Adj
uste
d A
ppro
-pri
atio
n
Aud
ited
Out
com
e A
nnua
l Bu
dget
A
djus
ted
App
ro-p
riat
ion
Aud
ited
Out
com
e A
nnua
l Bu
dget
A
djus
ted
App
ro-p
riat
ion
Aud
ited
Out
com
e A
nnua
l Bu
dget
A
djus
ted
App
ro-p
riat
ion
Rev
ised
Es
timat
e Av
erag
e:O
utco
me
/Ann
ual
Budg
et(%
)
Aver
age:
Out
com
e/A
djus
ted
App
ro-p
riat
ion(
%)
R m
illio
n20
14/1
5 20
15/1
6 20
16/1
7 20
17/1
8 20
14/1
5 - 2
017/
18
Econ
omic
cla
ssifi
catio
n
Curr
ent p
aym
ents
116
832.
711
6 30
4.8
116
328.
412
8 38
8.5
129
824.
513
0 62
1.5
149
812.
315
0 18
0.2
148
442.
116
4 68
9.2
165
692.
416
5 28
9.1
100.
2%99
.8%
Com
pens
atio
n of
em
ploy
ees
764.
968
9.0
671.
572
5.5
733.
473
2.7
817.
681
5.7
786.
479
9.3
823.
382
3.3
97.0
%98
.4%
Goo
ds a
nd s
ervi
ces
1 16
7.2
1 13
0.8
858.
51
222.
61
189.
11
093.
21
274.
81
675.
21
159.
01
536.
81
521.
21
310.
485
.0%
80.1
%
Inte
rest
and
rent
on
land
114
900.
511
4 48
5.0
114
798.
412
6 44
0.4
127
902.
012
8 79
5.6
147
720.
014
7 68
9.2
146
496.
716
2 35
3.1
163
347.
916
3 15
5.4
100.
3%10
0.0%
Tran
sfer
s and
su
bsid
ies
391
863.
039
1 33
6.9
391
368.
241
4 95
4.5
418
329.
041
8 14
4.3
444
111.
444
3 84
4.7
443
713.
147
6 69
4.5
476
362.
847
6 49
8.0
100.
1%10
0.0%
Prov
ince
s an
d m
unic
ipal
ities
371
511.
737
1 51
1.7
371
510.
939
4 76
7.6
398
594.
239
8 57
0.7
423
409.
042
3 40
9.0
423
376.
845
4 71
4.4
454
714.
445
4 71
4.4
100.
2%10
0.0%
Dep
artm
enta
l ag
enci
es a
nd
acco
unts
14 0
11.1
14 1
27.7
14 1
15.1
15 4
20.4
15 0
42.1
14 8
16.6
15 7
41.5
15 0
96.0
15 0
74.1
16 2
81.0
15 9
51.0
15 9
51.0
––
Hig
her e
duca
tion
inst
itutio
ns5.
85.
8 –
–
–
–
–
–
–
–
–
–
–
–
Fore
ign
gove
rnm
ents
an
d in
tern
atio
nal
orga
nisa
tions
828.
377
7.2
790.
585
4.1
777.
983
1.3
838.
092
5.5
907.
691
7.5
913.
31
048.
510
4.1%
105.
4%
Publ
ic c
orpo
ratio
ns
and
priv
ate
ente
rpris
es
1 84
4.5
1 25
2.2
1 27
4.5
11.4
11.4
11.4
12.0
12.0
12.0
12.6
10.6
10.6
69.6
%10
1.7%
Hou
seho
lds
3 66
1.6
3 66
2.2
3 67
7.1
3 90
0.9
3 90
3.5
3 91
4.3
4 11
1.0
4 40
2.2
4 34
2.5
4 76
9.0
4 77
3.5
4 77
3.5
101.
6%99
.8%

17
Nat
iona
l Tre
asur
y | A
nnua
l Per
form
ance
Pla
n | 2
018/
19
PART A: STRATEGIC OVERVIEW- ContinuedEX
PEN
DIT
URE
TRE
ND
S - C
ON
TIN
UED
Prog
ram
me
Ann
ual
Budg
et
Adj
uste
d A
ppro
-pri
atio
n
Aud
ited
Out
com
e A
nnua
l Bu
dget
A
djus
ted
App
ro-p
riat
ion
Aud
ited
Out
com
e A
nnua
l Bu
dget
A
djus
ted
App
ro-p
riat
ion
Aud
ited
Out
com
e A
nnua
l Bu
dget
A
djus
ted
App
ro-p
riat
ion
Rev
ised
Es
timat
e Av
erag
e:O
utco
me
/Ann
ual
Budg
et(%
)
Aver
age:
Out
com
e/A
djus
ted
App
ro-p
riat
ion(
%)
R m
illio
n20
14/1
5 20
15/1
6 20
16/1
7 20
17/1
8 20
14/1
5 - 2
017/
18
Paym
ents
for
capi
tal a
sset
s11
.419
.620
.116
.426
.133
.238
.056
.946
2.5
15.7
24.1
24.1
663.
2%42
6.1%
Build
ings
and
oth
er
fixed
str
uctu
res
–
–
–
–
0.4
–
–
0.2
–
–
–
–
––
Mac
hine
ry a
nd
equi
pmen
t11
.419
.620
.116
.425
.733
.237
.956
.746
.415
.719
.419
.414
6.4%
98.2
%
Soft
war
e an
d ot
her
inta
ngib
le a
sset
s –
–
–
–
–
–
0.
00.
041
6.1
–
4.7
4.7
1 40
2 74
6.7%
8 84
0.8%
Paym
ents
for
finan
cial
ass
ets
3 57
0.5
3 95
0.5
4 90
1.8
3 49
1.7
6 28
9.0
6 52
7.9
4 29
7.2
5 22
2.6
5 77
9.2
5 25
6.7
15 1
19.1
15 0
07.6
193.
9%10
5.3%
Tota
l 51
2 27
7.5
511
611.
851
2 61
8.4
546
851.
155
4 46
8.7
555
327.
059
8 25
8.8
599
304.
559
8 39
6.9
646
656.
065
7 19
8.4
656
818.
810
0.8%
100.
0%

18
Nat
iona
l Tre
asur
y | A
nnua
l Per
form
ance
Pla
n | 2
018/
19
PART A: STRATEGIC OVERVIEW - ContinuedEX
PEN
DIT
URE
EST
IMAT
ES
Vot
e ex
pend
iture
est
imat
es b
y pr
ogra
mm
e an
d ec
onom
ic c
lass
ifica
tion
Prog
ram
mes
1. A
dmin
istr
atio
n
2. E
cono
mic
Pol
icy,
Tax
, Fin
anci
al R
egul
atio
n an
d Re
sear
ch
3. P
ublic
Fin
ance
and
Bud
get M
anag
emen
t
4. A
sset
and
Lia
bilit
y M
anag
emen
t
5. F
inan
cial
Acc
ount
ing
and
Supp
ly C
hain
Man
agem
ent S
yste
ms
6. In
tern
atio
nal F
inan
cial
Rel
atio
ns
7. C
ivil
and
Mili
tary
Pen
sion
s, Co
ntrib
utio
ns to
Fun
ds a
nd O
ther
Ben
efits
8. T
echn
ical
Sup
port
and
Dev
elop
men
t Fin
ance
9. R
even
ue A
dmin
istr
atio
n
10. F
inan
cial
Inte
llige
nce
and
Stat
e Se
curit
y
Prog
ram
me
Revi
sed
estim
ate
Aver
age
grow
th ra
te (%
)Av
erag
e:
expe
nditu
re/ t
otal
(%)
Med
ium
term
exp
endi
ture
est
imat
eAv
erag
e gr
owth
ra
te (%
)Av
erag
e: e
xpen
ditu
re/
tota
l (%
)
R m
illio
n 2
017/
18
201
4/15
- 20
17/1
8 2
018/
19
201
9/20
2
020/
21
201
7/18
- 20
20/2
1
Prog
ram
me
143
9.3
5.7%
0.1%
484.
755
5.8
590.
710
.4%
0.1%
Prog
ram
me
216
3.9
6.9%
0.0%
141.
014
8.0
158.
1-1
.2%
0.0%
Prog
ram
me
330
3.1
5.3%
0.0%
290.
130
8.9
330.
52.
9%0.
0%
Prog
ram
me
410
100
.344
.6%
0.7%
110.
411
1.5
119.
4-7
7.2%
0.4%
Prog
ram
me
586
8.5
4.1%
0.2%
1 19
6.6
1 08
0.7
1 14
4.3
9.6%
0.1%
Prog
ram
me
65
789.
369
.0%
0.7%
5 40
2.1
5 74
5.1
6 06
1.4
1.5%
0.8%
Prog
ram
me
74
835.
09.
2%0.
7%5
163.
85
574.
55
881.
26.
7%0.
7%
Prog
ram
me
82
558.
5-6
.2%
0.4%
2 79
8.8
2 98
7.8
3 72
6.9
13.4
%0.
4%
Prog
ram
me
910
168
.22.
5%1.
6%9
007.
29
130.
39
630.
9-1
.8%
1.3%
Prog
ram
me
105
005.
64.
7%0.
8%4
763.
54
951.
15
223.
21.
4%0.
7%
Subt
otal
40
231
.814
.6%
5.3%
29 3
58.4
30 5
93.7
32 8
66.5
-6.5
%4.
6%
Dire
ct c
harg
e ag
ains
t the
N
atio
nal R
even
ue F
und
616
587.
08.
3%94
.7%
663
014.
171
5 85
0.0
770
332.
87.
7%95
.4%
Prov
inci
al e
quita
ble
shar
e44
1 33
1.1
7.0%
68.8
%47
0 28
6.5
505
019.
754
2 44
6.9
7.1%
67.6
%
Deb
t-se
rvic
e co
sts
163
155.
412
.5%
23.8
%18
0 12
4.0
197
663.
621
3 85
9.0
9.4%
26.0
%

PART A: STRATEGIC OVERVIEW- ContinuedEX
PEN
DIT
URE
EST
IMAT
ES -
CON
TIN
UED
Prog
ram
me
Revi
sed
estim
ate
Aver
age
grow
th ra
te (%
)Av
erag
e:
expe
nditu
re/ t
otal
(%)
Med
ium
term
exp
endi
ture
est
imat
eAv
erag
e gr
owth
ra
te (%
)Av
erag
e: e
xpen
ditu
re/
tota
l (%
)
R m
illio
n 2
017/
18
201
4/15
- 20
17/1
8 2
018/
19
201
9/20
2
020/
21
201
7/18
- 20
20/2
1
Gen
eral
fuel
levy
sha
ring
with
m
etro
polit
an m
unic
ipal
ities
11 7
85.0
5.0%
1.9%
12 4
68.6
13 1
66.8
14 0
26.9
6.0%
1.8%
Nat
iona
l Rev
enue
Fun
d pa
ymen
ts31
5.5
0.5%
0.2%
135.
1 –
–
-1
00.0
%0.
0%
Tota
l 65
6 81
8.8
8.7%
100.
0%69
2 37
2.5
746
443.
780
3 19
9.3
6.9%
100.
0%
Cha
nge
to 2
017
Budg
et e
stim
ate
(4 6
65.1
)(4
160
.5)
980.
2
Econ
omic
cla
ssifi
catio
n
Curr
ent p
aym
ents
165
289.
112
.4%
24.1
%18
2 63
6.5
200
195.
221
6 54
7.3
9.4%
26.4
%
Com
pens
atio
n of
em
ploy
ees
823.
36.
1%0.
1%80
7.8
869.
393
4.5
4.3%
0.1%
Goo
ds a
nd s
ervi
ces
1 31
0.4
5.0%
0.2%
1 70
4.7
1 66
2.3
1 75
3.7
10.2
%0.
2%
Inte
rest
and
rent
on
land
163
155.
412
.5%
23.8
%18
0 12
4.0
197
663.
621
3 85
9.0
9.4%
26.0
%
Tran
sfer
s an
d su
bsid
ies
476
498.
06.
8%74
.5%
505
177.
854
1 55
8.0
581
703.
86.
9%72
.6%
Prov
ince
s and
mun
icip
aliti
es45
4 71
4.4
7.0%
70.9
%48
4 29
6.6
519
799.
955
8 69
0.1
7.1%
69.6
%
Dep
artm
enta
l age
ncie
s an
d ac
coun
ts15
951
.04.
1%2.
6%14
796
.715
211
.316
106
.80.
3%2.
1%
Fore
ign
gove
rnm
ents
and
in
tern
atio
nal o
rgan
isat
ions
1 04
8.5
10.5
%0.
2%97
5.5
1 03
0.1
1 08
6.8
1.2%
0.1%
Publ
ic c
orpo
ratio
ns a
nd
priv
ate
ente
rpris
es10
.6-7
9.6%
0.1%
13.3
14.1
14.8
11.9
%0.
0%
Hou
seho
lds
4 77
3.5
9.2%
0.7%
5 09
5.8
5 50
2.7
5 80
5.2
6.7%
0.7%
Paym
ents
for c
apita
l ass
ets
24.1
7.2%
0.0%
45.8
32.5
34.6
12.7
%0.
0%
Mac
hine
ry a
nd e
quip
men
t19
.4-0
.4%
0.0%
34.6
18.0
18.7
-1.3
%0.
0%
Soft
war
e an
d ot
her
inta
ngib
le a
sset
s4.
7–
0.0%
11.3
14.5
15.9
49.8
%0.
0%
Paym
ents
for fi
nanc
ial a
sset
s15
007
.656
.0%
1.4%
4 51
2.3
4 65
7.9
4 91
3.7
-31.
1%1.
0%
Tota
l 65
6 81
8.8
8.7%
100.
0%69
2 37
2.5
746
443.
780
3 19
9.3
6.9%
100.
0%

20
Nat
iona
l Tre
asur
y | A
nnua
l Per
form
ance
Pla
n | 2
018/
19
PART A: STRATEGIC OVERVIEW - ContinuedPE
RSO
NN
EL IN
FORM
ATIO
N
Vote
per
sonn
el n
umbe
rs a
nd c
ost b
y sa
lary
leve
l and
pro
gram
me¹
Prog
ram
mes
1. A
dmin
istr
atio
n 2.
Eco
nom
ic P
olic
y, T
ax, F
inan
cial
Reg
ulat
ion
and
Rese
arch
3.
Pub
lic F
inan
ce a
nd B
udge
t Man
agem
ent
4. A
sset
and
Lia
bilit
y M
anag
emen
t 5.
Fin
anci
al A
ccou
ntin
g an
d Su
pply
Cha
in M
anag
emen
t Sys
tem
s 6.
Inte
rnat
iona
l Fin
anci
al R
elat
ions
7.
Civ
il an
d M
ilita
ry P
ensi
ons,
Cont
ribut
ions
to F
unds
and
Oth
er B
enefi
ts
8. T
echn
ical
Sup
port
and
Dev
elop
men
t Fin
ance
9.
Rev
enue
Adm
inis
trat
ion
10. F
inan
cial
Inte
llige
nce
and
Stat
e Se
curit
y
Num
ber o
f pos
ts e
stim
ated
for 3
1 M
arch
201
8N
umbe
r and
cos
t2 of
per
sonn
el p
osts
fille
d/pl
anne
d fo
r on
fund
ed e
stab
lishm
ent
Num
ber
Num
ber of
fund
edpo
sts
Num
ber o
f po
sts
addi
tiona
lto
the
esta
blis
hmen
t
Actu
alRe
vise
d es
timat
eM
ediu
m te
rm e
xpen
ditu
re e
stim
ate
Aver
age
grow
thra
te (%
)
Aver
age:
sa
lary
leve
l/to
tal (
%)
2016
/17
2017
/18
2018
/19
2019
/20
2020
/21
2017
/18
- 202
0/21
Nat
iona
l Tre
asur
yN
umbe
rCo
st
Uni
tco
stN
umbe
rCo
stU
nit
cost
Num
ber
Cost
Uni
tco
stN
umbe
rCo
stU
nit
cost
Num
ber
Cost
Uni
t co
st
Sala
ry le
vel
1 19
712
41
168
786.
40.
71
125
823.
30.
71
036
807.
80.
81
039
869.
30.
81
038
934.
50.
9-2
.6%
100.
0%
1 –
679
2380
15.1
0.2
7515
.40.
274
16.3
0.2
7618
.20.
276
19.8
0.3
0.4%
7.1%
7 –
1046
878
477
214.
00.
444
821
6.7
0.5
417
217.
00.
541
423
1.7
0.6
408
246.
00.
6-3
.1%
39.8
%
11 –
12
333
731
323
7.9
0.8
299
249.
00.
827
324
5.8
0.9
276
268.
41.
027
929
2.6
1.0
-2.3
%26
.6%
13 –
16
315
1629
631
5.8
1.1
301
338.
31.
127
032
4.6
1.2
271
346.
61.
327
337
1.4
1.4
-3.2
%26
.3%
Oth
er2
–
23.
61.
82
3.9
1.9
24.
12.
12
4.4
2.2
24.
72.
4 –
0.
2%
Prog
ram
me
1 19
712
41
168
786.
40.
71
125
823.
30.
71
036
807.
80.
81
039
869.
30.
81
038
934.
50.
9-2
.6%
100.
0%
Prog
ram
me
136
375
359
195.
40.
533
920
7.4
0.6
309
201.
90.
731
221
9.4
0.7
311
235.
60.
8-2
.8%
30.0
%
Prog
ram
me
210
51
9779
.70.
887
79.9
0.9
8178
.71.
079
82.2
1.0
8088
.41.
1-2
.8%
7.7%
Prog
ram
me
327
81
272
201.
90.
727
721
8.9
0.8
241
204.
10.
824
021
9.1
0.9
241
235.
71.
0-4
.5%
23.6
%
Prog
ram
me
410
77
109
77.0
0.7
104
78.5
0.8
9778
.70.
898
84.5
0.9
9991
.20.
9-1
.6%
9.4%
Prog
ram
me
530
439
294
200.
50.
728
320
8.2
0.7
268
208.
20.
826
822
3.8
0.8
265
240.
40.
9-2
.2%
25.6
%
Prog
ram
me
640
137
32.0
0.9
3530
.40.
940
36.2
0.9
4240
.41.
042
43.2
1.0
6.3%
3.8%
1. D
ata
has b
een
prov
ided
by
the
depa
rtm
ent a
nd m
ay n
ot n
eces
saril
y re
conc
ile w
ith o
ffici
al g
over
nmen
t per
sonn
el d
ata.
2. R
and
mill
ion.
ANNUAL PERFORMANCE PLAN2018/19

PART B: PROGRAMME AND
SUB-PROGRAMME PLANS
PERS
ON
NEL
INFO
RMAT
ION
Vote
per
sonn
el n
umbe
rs a
nd c
ost b
y sa
lary
leve
l and
pro
gram
me¹
Prog
ram
mes
1. A
dmin
istr
atio
n 2.
Eco
nom
ic P
olic
y, T
ax, F
inan
cial
Reg
ulat
ion
and
Rese
arch
3.
Pub
lic F
inan
ce a
nd B
udge
t Man
agem
ent
4. A
sset
and
Lia
bilit
y M
anag
emen
t 5.
Fin
anci
al A
ccou
ntin
g an
d Su
pply
Cha
in M
anag
emen
t Sys
tem
s 6.
Inte
rnat
iona
l Fin
anci
al R
elat
ions
7.
Civ
il an
d M
ilita
ry P
ensi
ons,
Cont
ribut
ions
to F
unds
and
Oth
er B
enefi
ts
8. T
echn
ical
Sup
port
and
Dev
elop
men
t Fin
ance
9.
Rev
enue
Adm
inis
trat
ion
10. F
inan
cial
Inte
llige
nce
and
Stat
e Se
curit
y
Num
ber o
f pos
ts e
stim
ated
for 3
1 M
arch
201
8N
umbe
r and
cos
t2 of
per
sonn
el p
osts
fille
d/pl
anne
d fo
r on
fund
ed e
stab
lishm
ent
Num
ber
Num
ber of
fund
edpo
sts
Num
ber o
f po
sts
addi
tiona
lto
the
esta
blis
hmen
t
Actu
alRe
vise
d es
timat
eM
ediu
m te
rm e
xpen
ditu
re e
stim
ate
Aver
age
grow
thra
te (%
)
Aver
age:
sa
lary
leve
l/to
tal (
%)
2016
/17
2017
/18
2018
/19
2019
/20
2020
/21
2017
/18
- 202
0/21
Nat
iona
l Tre
asur
yN
umbe
rCo
st
Uni
tco
stN
umbe
rCo
stU
nit
cost
Num
ber
Cost
Uni
tco
stN
umbe
rCo
stU
nit
cost
Num
ber
Cost
Uni
t co
st
Sala
ry le
vel
1 19
712
41
168
786.
40.
71
125
823.
30.
71
036
807.
80.
81
039
869.
30.
81
038
934.
50.
9-2
.6%
100.
0%
1 –
679
2380
15.1
0.2
7515
.40.
274
16.3
0.2
7618
.20.
276
19.8
0.3
0.4%
7.1%
7 –
1046
878
477
214.
00.
444
821
6.7
0.5
417
217.
00.
541
423
1.7
0.6
408
246.
00.
6-3
.1%
39.8
%
11 –
12
333
731
323
7.9
0.8
299
249.
00.
827
324
5.8
0.9
276
268.
41.
027
929
2.6
1.0
-2.3
%26
.6%
13 –
16
315
1629
631
5.8
1.1
301
338.
31.
127
032
4.6
1.2
271
346.
61.
327
337
1.4
1.4
-3.2
%26
.3%
Oth
er2
–
23.
61.
82
3.9
1.9
24.
12.
12
4.4
2.2
24.
72.
4 –
0.
2%
Prog
ram
me
1 19
712
41
168
786.
40.
71
125
823.
30.
71
036
807.
80.
81
039
869.
30.
81
038
934.
50.
9-2
.6%
100.
0%
Prog
ram
me
136
375
359
195.
40.
533
920
7.4
0.6
309
201.
90.
731
221
9.4
0.7
311
235.
60.
8-2
.8%
30.0
%
Prog
ram
me
210
51
9779
.70.
887
79.9
0.9
8178
.71.
079
82.2
1.0
8088
.41.
1-2
.8%
7.7%
Prog
ram
me
327
81
272
201.
90.
727
721
8.9
0.8
241
204.
10.
824
021
9.1
0.9
241
235.
71.
0-4
.5%
23.6
%
Prog
ram
me
410
77
109
77.0
0.7
104
78.5
0.8
9778
.70.
898
84.5
0.9
9991
.20.
9-1
.6%
9.4%
Prog
ram
me
530
439
294
200.
50.
728
320
8.2
0.7
268
208.
20.
826
822
3.8
0.8
265
240.
40.
9-2
.2%
25.6
%
Prog
ram
me
640
137
32.0
0.9
3530
.40.
940
36.2
0.9
4240
.41.
042
43.2
1.0
6.3%
3.8%
1. D
ata
has b
een
prov
ided
by
the
depa
rtm
ent a
nd m
ay n
ot n
eces
saril
y re
conc
ile w
ith o
ffici
al g
over
nmen
t per
sonn
el d
ata.
2. R
and
mill
ion.
ANNUAL PERFORMANCE PLAN2018/19
APP

22
Nat
iona
l Tre
asur
y | A
nnua
l Per
form
ance
Pla
n | 2
018/
19
2. PROGRAMME 1: ADMINISTRATION
2.1. Purpose
The programme ensures effective leadership, strategic management and administrative support to National Treasury through
continuous refinement of organisational strategy and structure in line with appropriate legislation and best practice.
2.2. Strategic Objectives
STRATEGIC OBJECTIVE(S) OBJECTIVE STATEMENT SUB-PROGRAMMES
SO 1.1 Provide integrated business solutions
To align support provided with the requirements of the department and its strategic and performance plans
Corporate Services
SO 1.2 Ensure good governance and sound control environment
To ensure good governance and a sound control environment for the department
Corporate Services
SO 1.3 Provide support for strategic and performance management across the organisation
To provide sound strategic direction and leadership to NT through facilitation of credible strategic plans, annual performance plans and reliable management of NT’s performance
Office of the Director-General
2.3. Sub-Programme Overview
OFFICE OF THE MINISTER AND DEPUTY MINISTER
The Minister of Finance provides strategic direction and leadership to National Treasury. Additionally, and with the support of the
Deputy Minister, the Minister of Finance is responsible for policy matters and departmental outcomes.
This sub-programme supports the Minister and Deputy Minister by providing executive and administrative services. The sub-
programme is responsible for the development of systems and mechanisms that deal with parliamentary questions and replies,
Cabinet matters, correspondence, submissions and memoranda.
OFFICE OF THE DIRECTOR-GENERAL
The Director-General supports the Minister of Finance in providing strategic direction and leadership to National Treasury. Additionally
the Director–General is responsible for departmental outputs and implementation as well as all responsibilities conferred by being the
department’s accounting officer.
MANAGEMENT
This sub-programme primarily provides administrative services to and reports directly to the Director-General.
It consists of the following support services:
Internal Audit (IA) contributes to the strengthening of National Treasury’s accountability and enhancing public stewardship by evaluating
and improving the adequacy and effectiveness of governance, risk management and control processes. The unit provides robust and
practical strategic advice and recommendations founded on aligning the business with best practice. By acting as a frame of reference,
the unit also supports the Office of the Accountant-General in providing guidance and support to internal audit functions in government.
PART B: PROGRAMME AND SUB-PROGRAMME PLANS

23
Nat
iona
l Tre
asur
y | A
nnua
l Per
form
ance
Pla
n | 2
018/
19
PART B: PROGRAMME AND SUB-PROGRAMME PLANS - Continued
Enterprise Risk Management improves organisational risk communication and knowledge sharing, developing a common risk language that
ensures that a risk management culture is embedded in National Treasury. The unit supports evidence based decision-making by reducing
uncertainty. This is realised by providing a holistic view of risk and the application of a robust risk management system. Fraud prevention
is an integral part of the strategy, operations and administration function. The unit ensures that National Treasury has a strategic risk profile
register that enables coordination and alignment of strategic initiatives across the department.
Strategic Planning, Monitoring and Evaluation is tasked with embedding planning into National Treasury including facilitating the
department’s short, medium and long term strategic planning processes and ensuring that plans are aligned to legislative mandates and
broader government imperatives. The unit develops and administers systems and processes that entrench proper monitoring, evaluation
and reporting on departmental performance delivery and facilitates the development and implementation of service delivery improvement.
Legal Services is responsible for providing a comprehensive legal advisory service to enable National Treasury to carry out its mandate
effectively within the law.
Legislation Services provides legislative services which include managing the National Treasury’s Legislative Programme, drafting or checking
draft fiscal and intergovernmental and financial sector regulation legislation, and commenting on other legislation as well as advising on
the interpretation of legislation.
Communication furthers National Treasury transparency imperatives by ensuring effective communication between National Treasury and
all stakeholders.
CORPORATE SERVICES
The Corporate Services division delivers and oversees shared services in alignment with National Treasury’s needs. It does this by proactively
identifying requirements, monitoring and maintaining service levels and setting standards aligned with compliance and best practices,
including reporting on delivery.
Human Resources (HR) Management ensures transactional and transformational HR support so that National Treasury can attract, develop and
retain the skills needed to deliver on the department’s mandate and objectives.
Financial Management administers compliance with all relevant financial statutes and regulations, the most important of which is the PFMA.
In ensuring compliance, the unit strives to attain a balance between achieving service excellence and maintaining administrative controls.
Information and Communication Technology (ICT) improves National Treasury’s operational efficiency, optimises costs, drives innovation and
accelerates the delivery of services. The unit provides long term planning and day-to-day support in respect of ICT-enabled delivery using ICT
services and systems.
Strategic Projects and Support is responsible for preserving National Treasury’s institutional memory and tangible knowledge and providing
management support to internal projects. Knowledge management deals with the conservation and pollination of organisational information
created within and in partnership with National Treasury. Records management focuses on the preservation of tangible knowledge so that it
can be accessed easily and be in compliance with the National Archives Act.
The Public Entities Oversight unit ensures that entities reporting to the Minister of Finance are compliant with relevant governance and reporting
requirements and reports progress made in this regard to the Minister of Finance.
Facilities and Security Management ensures continuous stringent physical and information security and provides, maintains and services
available facilities.

24
Nat
iona
l Tre
asur
y | A
nnua
l Per
form
ance
Pla
n | 2
018/
19
PART B: PROGRAMME AND SUB-PROGRAMME PLANS - Continued
2.4.
Str
ateg
ic P
lan
Obj
ectiv
e A
nnua
l and
Med
ium
Ter
m T
arge
ts
PERF
ORM
AN
CE
IND
ICAT
OR
AUD
ITED
/ACT
UA
L PE
RFO
RMA
NCE
ESTI
MAT
ED
PERF
ORM
AN
CEPL
AN
NED
PER
FORM
AN
CE
CURR
ENT
YEA
RM
EDIU
M T
ERM
TA
RGET
S (M
TEF)
2014
/15
2015
/16
2016
/17
2017
/18
2018
/19
2019
/20
2020
/21
2021
/22
2022
/23
2023
/24
Stra
tegi
c O
bjec
tive
1.1:
Pro
vide
inte
grat
ed b
usin
ess
solu
tions
1.1
% in
crea
se in
Yea
r on
Year
MPA
T to
tal s
core
##
#2%
1.5%
0.5%
0%0%
0%0%
Stra
tegi
c O
bjec
tive
1.2:
Ens
ure
good
gov
erna
nce
and
soun
d co
ntro
l env
ironm
ent.
1.2
Prod
uce
an A
udite
d A
nnua
l Rep
ort
##
#1
11
11
11
Stra
tegi
c O
bjec
tive
1.3:
Pro
vide
sup
port
for s
trat
egic
and
per
form
ance
man
agem
ent a
cros
s th
e or
gani
satio
n
1.3
Prod
uce
an A
PP#
##
11
11
11
1

25
Nat
iona
l Tre
asur
y | A
nnua
l Per
form
ance
Pla
n | 2
018/
19
PART B: PROGRAMME AND SUB-PROGRAMME PLANS - Continued2.
5. P
rogr
amm
e Pe
rfor
man
ce In
dica
tors
and
Ann
ual T
arge
ts1
PERF
ORM
AN
CE IN
DIC
ATO
RAU
DIT
ED/A
CTU
AL
PERF
ORM
AN
CEES
TIM
ATED
PE
RFO
RMA
NCE
PLA
NN
ED P
ERFO
RMA
NCE
CU
RREN
T YE
AR
MED
IUM
TER
M T
ARG
ETS
(MTE
F)
2014
/15
2015
/16
2016
/17
2017
/18
2018
/19
2019
/20
2020
/21
2021
/22
Stra
tegi
c O
bjec
tive
1.1:
Pro
vide
inte
grat
ed b
usin
ess
solu
tions
1.1.
1Pe
rcen
tage
com
plet
ion
of th
e bu
sine
ss
cont
inui
ty s
trat
egy
N/A
N/A
90%
of
Phas
e 2
30%
of P
hase
370
% o
f Pha
se 3
N/A
N/A
N/A
1.1.
2Pe
rcen
tage
sav
ed o
n th
e Ra
nd v
alue
bud
gete
d fo
r pap
er u
sage
, tra
vel a
nd s
trat
egic
sou
rcin
g#
##
1%1%
2%2%
2%
Stra
tegi
c O
bjec
tive
1.2:
Ens
ure
good
gov
erna
nce
and
soun
d co
ntro
l env
ironm
ent.
1.2.
1Pe
rcen
tage
com
plet
ion
of th
e ap
prov
ed ri
sk-
base
d IA
pla
nN
/AN
/A10
0%10
0%10
0%10
0%10
0%10
0%
1.2.
2N
umbe
r of q
uart
erly
risk
impl
emen
tatio
n as
sess
men
t rep
orts
pro
duce
d2
##
#4
44
44
1.2.
3N
umbe
r of q
uart
erly
repo
rts
on m
onito
red
perf
orm
ance
of e
ntiti
es re
port
ing
to M
OF2
N/A
N/A
404
44
44

26
Nat
iona
l Tre
asur
y | A
nnua
l Per
form
ance
Pla
n | 2
018/
19
PART B: PROGRAMME AND SUB-PROGRAMME PLANS - Continued
2.6.
Pro
gram
me
Perf
orm
ance
Indi
cato
r Qua
rter
ly T
arge
ts fo
r 201
8/19
PERF
ORM
AN
CE IN
DIC
ATO
R20
18/1
9AN
NU
AL
TARG
ETS
QU
ART
ER 1
QU
ART
ER 2
QU
ART
ER 3
QU
ART
ER 4
Stra
tegi
c O
bjec
tive
1.1:
Pro
vide
inte
grat
ed b
usin
ess
solu
tions
1.1.
1Pe
rcen
tage
com
plet
ion
of th
e bu
sine
ss c
ontin
uity
str
ateg
y70
% o
f Pha
se 3
25%
25%
10%
10%
1.1.
2Pe
rcen
tage
save
d on
the
Rand
val
ue b
udge
ted
for p
aper
usa
ge, t
rave
l and
stra
tegi
c so
urci
ng1%
N/A
N/A
N/A
1%
Stra
tegi
c O
bjec
tive
1.2:
Ens
ure
good
gov
erna
nce
and
a so
und
cont
rol e
nviro
nmen
t.
1.2.
1Pe
rcen
tage
com
plet
ion
of th
e ap
prov
ed ri
sk-b
ased
IA p
lan
100%
100%
100%
100%
100%
1.2.
2N
umbe
r of q
uart
erly
risk
impl
emen
tatio
n as
sess
men
t rep
orts
pro
duce
d4
1 1
1 1
1.2.
3N
umbe
r of q
uart
erly
repo
rts
on m
onito
red
perf
orm
ance
of e
ntiti
es re
port
ing
to M
OF
41
11
1

27
Nat
iona
l Tre
asur
y | A
nnua
l Per
form
ance
Pla
n | 2
018/
19
PART B: PROGRAMME AND SUB-PROGRAMME PLANS - Continued2.
7. E
xpen
ditu
re T
rend
s an
d Es
timat
es
Adm
inis
trat
ion
expe
nditu
re tr
ends
and
est
imat
es b
y su
b-pr
ogra
mm
e an
d ec
onom
ic c
lass
ifica
tion
Sub-
prog
ram
me
Aud
ited
outc
ome
Adj
uste
dap
prop
riat
ion
Aver
age
grow
th ra
te (%)
Aver
age:
ex
pend
iture
/ to
tal (
%)
Med
ium
term
ex
pend
iture
est
imat
eAv
erag
e gr
owth
ra
te (%
)
Aver
age:
ex
pend
iture
/ to
tal
R m
illio
n20
14/1
5 20
15/1
6 20
16/1
720
17/1
8 2
014/
15 -
2017
/18
2018
/19
2019
/20
202
0/21
2
017/
18 -
2020
/21
Min
istr
y3.
33.
63.
64.
913
.7%
1.0%
4.1
4.4
4.7
-0.8
%0.
9%
Dep
artm
enta
l Man
agem
ent
47.5
47.1
50.5
65.1
11.1
%13
.0%
60.0
66.7
70.0
2.4%
12.7
%
Corp
orat
e Se
rvic
es10
7.3
116.
515
4.9
127.
55.
9%31
.4%
147.
714
4.9
155.
66.
9%27
.8%
Ente
rpris
e W
ide
Risk
M
anag
emen
t22
.527
.526
.328
.88.
5%6.
5%30
.732
.734
.86.
6%6.
1%
Fina
ncia
l Adm
inis
trat
ion
38.6
38.7
37.9
39.9
1.1%
9.6%
40.2
85.2
90.5
31.3
%12
.4%
Lega
l Ser
vice
s16
.618
.722
.920
.57.
4%4.
9%20
.821
.923
.34.
3%4.
2%
Inte
rnal
Aud
it17
.120
.721
.823
.911
.8%
5.2%
25.6
27.8
29.9
7.7%
5.2%
Com
mun
icat
ions
10.1
10.2
8.6
14.2
12.0
%2.
7%11
.412
.112
.5-4
.2%
2.4%
Offi
ce A
ccom
mod
atio
n99
.592
.610
9.9
114.
34.
7%25
.8%
144.
215
9.9
169.
214
.0%
28.4
%
Tota
l 36
2.5
375.
643
6.3
439.
16.
6%10
0.0%
484.
755
5.8
590.
710
.4%
100.
0%
Cha
nge
to 2
017
Budg
et e
stim
ate
24
.828
.5(4
.3)
(4.6
)
Econ
omic
cla
ssifi
catio
n
Curr
ent p
aym
ents
345.
134
7.8
392.
642
4.4
7.1%
93.6
%44
5.5
529.
556
3.3
9.9%
94.8
%
Com
pens
atio
n of
em
ploy
ees
166.
418
2.4
195.
420
7.2
7.6%
46.6
%20
1.9
219.
423
5.6
4.4%
41.7
%
Goo
ds a
nd se
rvic
es17
8.7
165.
419
7.2
217.
36.
7%47
.0%
243.
631
0.1
327.
614
.7%
53.1
%
of w
hich
:
Com
pute
r ser
vice
s24
.918
.634
.932
.08.
8%6.
8%28
.727
.929
.2-3
.0%
5.7%
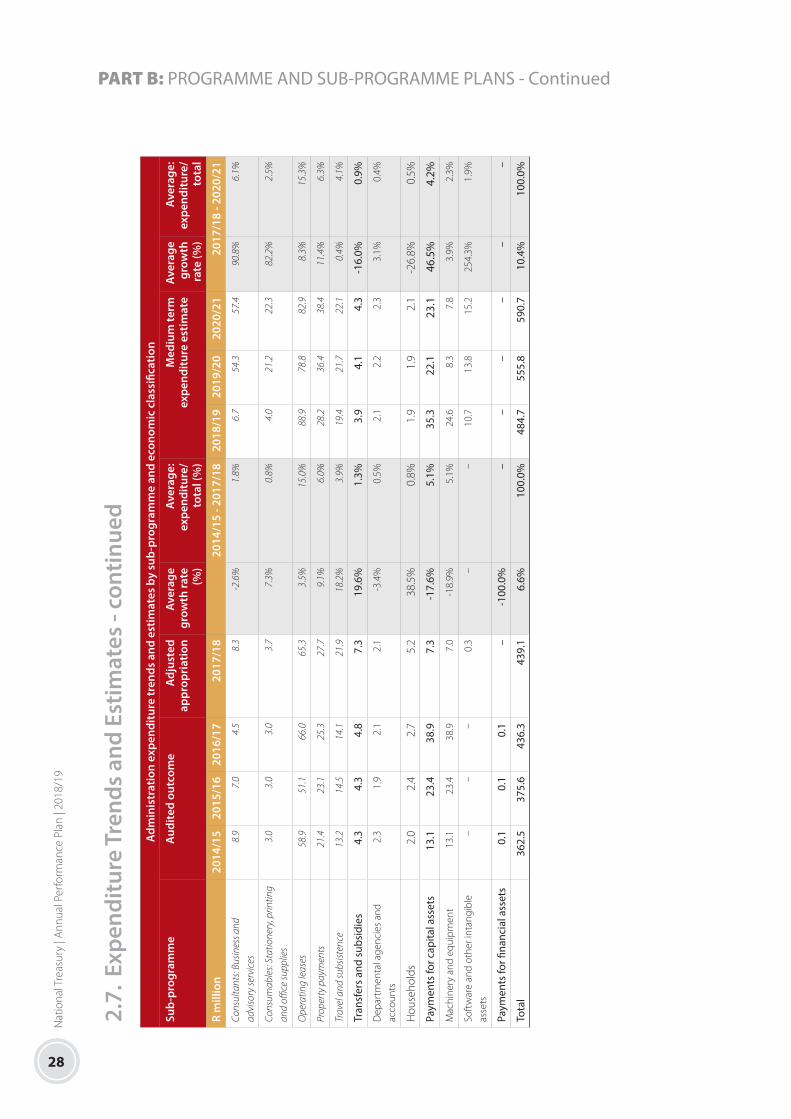
28
Nat
iona
l Tre
asur
y | A
nnua
l Per
form
ance
Pla
n | 2
018/
19
PART B: PROGRAMME AND SUB-PROGRAMME PLANS - Continued
2.7.
Exp
endi
ture
Tre
nds
and
Estim
ates
- co
ntin
ued
Adm
inis
trat
ion
expe
nditu
re tr
ends
and
est
imat
es b
y su
b-pr
ogra
mm
e an
d ec
onom
ic c
lass
ifica
tion
Sub-
prog
ram
me
Aud
ited
outc
ome
Adj
uste
dap
prop
riat
ion
Aver
age
grow
th ra
te (%)
Aver
age:
ex
pend
iture
/ to
tal (
%)
Med
ium
term
ex
pend
iture
est
imat
eAv
erag
e gr
owth
ra
te (%
)
Aver
age:
ex
pend
iture
/ to
tal
R m
illio
n20
14/1
5 20
15/1
6 20
16/1
720
17/1
8 2
014/
15 -
2017
/18
2018
/19
2019
/20
202
0/21
2
017/
18 -
2020
/21
Cons
ulta
nts:
Busin
ess a
nd
advi
sory
serv
ices
8.9
7.0
4.5
8.3
-2.6
%1.
8%6.
754
.357
.490
.8%
6.1%
Cons
umab
les:
Stat
ione
ry, p
rintin
g an
d offi
ce su
pplie
s3.
03.
03.
03.
77.
3%0.
8%4.
021
.222
.382
.2%
2.5%
Ope
ratin
g le
ases
58.9
51.1
66.0
65.3
3.5%
15.0
%88
.978
.882
.98.
3%15
.3%
Prop
erty
pay
men
ts21
.423
.125
.327
.79.
1%6.
0%28
.236
.438
.411
.4%
6.3%
Trav
el a
nd su
bsist
ence
13.2
14.5
14.1
21.9
18.2
%3.
9%19
.421
.722
.10.
4%4.
1%
Tran
sfer
s an
d su
bsid
ies
4.3
4.3
4.8
7.3
19.6
%1.
3%3.
94.
14.
3-1
6.0%
0.9%
Dep
artm
enta
l age
ncie
s an
d ac
coun
ts2.
31.
92.
12.
1-3
.4%
0.5%
2.1
2.2
2.3
3.1%
0.4%
Hou
seho
lds
2.0
2.4
2.7
5.2
38.5
%0.
8%1.
91.
92.
1-2
6.8%
0.5%
Paym
ents
for c
apita
l ass
ets
13.1
23.4
38.9
7.3
-17.
6%5.
1%35
.322
.123
.146
.5%
4.2%
Mac
hine
ry a
nd e
quip
men
t13
.123
.438
.97.
0-1
8.9%
5.1%
24.6
8.3
7.8
3.9%
2.3%
Soft
war
e an
d ot
her i
ntan
gibl
e as
sets
–
–
–
0.3
–
–
10.7
13.8
15.2
254.
3%1.
9%
Paym
ents
for fi
nanc
ial a
sset
s0.
10.
10.
1 –
-1
00.0
% –
–
–
–
–
–
Tota
l 36
2.5
375.
643
6.3
439.
16.
6%10
0.0%
484.
755
5.8
590.
710
.4%
100.
0%

29
Nat
iona
l Tre
asur
y | A
nnua
l Per
form
ance
Pla
n | 2
018/
19
PART B: PROGRAMME AND SUB-PROGRAMME PLANS - Continued2.
7. E
xpen
ditu
re T
rend
s an
d Es
timat
es -
cont
inue
dA
dmin
istr
atio
n ex
pend
iture
tren
ds a
nd e
stim
ates
by
sub-
prog
ram
me
and
econ
omic
cla
ssifi
catio
n
Sub-
prog
ram
me
Aud
ited
outc
ome
Adj
uste
dap
prop
riat
ion
Aver
age
grow
th ra
te (%)
Aver
age:
ex
pend
iture
/ to
tal (
%)
Med
ium
term
ex
pend
iture
est
imat
eAv
erag
e gr
owth
ra
te (%
)
Aver
age:
ex
pend
iture
/ to
tal
R m
illio
n20
14/1
5 20
15/1
6 20
16/1
720
17/1
8 2
014/
15 -
2017
/18
2018
/19
2019
/20
202
0/21
2
017/
18 -
2020
/21
Prop
ortio
n of
tota
l pr
ogra
mm
e ex
pend
iture
to v
ote
expe
nditu
re
1.4%
1.3%
1.5%
1.1%
–
–
1.7%
1.8%
1.8%
–
–
Det
ails
of t
rans
fers
and
sub
sidi
es
Hou
seho
lds
Soci
al b
enefi
ts
Curr
ent
0.3
0.8
1.2
3.3
125.
3%0.
3% –
–
–
-1
00.0
%0.
2%
Empl
oyee
soc
ial b
enefi
ts0.
30.
81.
23.
312
5.3%
0.3%
–
–
–
-100
.0%
0.2%
Hou
seho
lds
Oth
er tr
ansf
ers
to h
ouse
hold
s
Curr
ent
1.6
1.4
1.1
1.8
5.0%
0.4%
1.9
1.9
2.1
4.4%
0.4%
Burs
arie
s fo
r non
-em
ploy
ees
1.6
1.4
1.1
1.8
5.0%
0.4%
1.9
1.9
2.1
4.4%
0.4%
Dep
artm
enta
l age
ncie
s an
d ac
coun
ts
Dep
artm
enta
l age
ncie
s (n
on-b
usin
ess
entit
ies)
Curr
ent
2.3
1.9
2.1
2.1
-3.5
%0.
5%2.
02.
12.
33.
1%0.
4%
Fina
nce
and
Acc
ount
ing
Serv
ices
Sec
tor E
duca
tion
and
Trai
ning
Aut
horit
y
2.3
1.9
2.1
2.1
-3.5
%0.
5%2.
02.
12.
33.
1%0.
4%

30
Nat
iona
l Tre
asur
y | A
nnua
l Per
form
ance
Pla
n | 2
018/
19
PART B: PROGRAMME AND SUB-PROGRAMME PLANS - Continued
2.8.
Per
sonn
el In
form
atio
n
Num
ber o
f pos
ts e
stim
ated
for
31 M
arch
201
8A
dmin
istr
atio
n pe
rson
nel n
umbe
rs a
nd c
ost b
y sa
lary
leve
l¹N
umbe
r
Num
ber a
nd c
ost2
of p
erso
nnel
pos
ts fi
lled
/ pla
nned
for o
n fu
nded
est
ablis
hmen
t
Num
ber
of fu
nded
post
s
Num
ber o
f po
sts
addi
tiona
lto
the
esta
blis
hmen
t
Act
ual
Revi
sed
estim
ate
Med
ium
term
exp
endi
ture
est
imat
eAv
erag
egr
owth
rate
(%)
Aver
age:
sa
lary
leve
l/to
tal (
%)
2016
/17
2017
/18
2018
/19
2019
/20
2020
/21
2017
/18
- 202
0/21
Adm
inis
trat
ion
Num
ber
Cost
Uni
t co
st
Num
ber
Cost
Uni
tco
stN
umbe
rCo
stU
nit
cost
Num
ber
Cost
U
nit
cost
N
umbe
r Co
st
Uni
t co
st
Sala
ry
leve
l36
375
359
195.
40.
533
920
7.3
0.6
309
201.
80.
731
221
9.4
0.7
311
235.
40.
8-2
.8%
100.
0%
1 –
661
2265
11.5
0.2
5610
.60.
255
11.2
0.2
5512
.10.
254
12.7
0.2
-1.2
%17
.3%
7 –
1018
343
183
74.3
0.4
167
73.8
0.4
151
72.3
0.5
151
77.2
0.5
151
83.7
0.6
-3.3
%48
.8%
11 –
12
664
6152
.70.
963
60.1
1.0
5455
.81.
056
62.0
1.1
5767
.91.
2-3
.3%
18.1
%
13 –
16
516
4853
.21.
151
58.9
1.2
4758
.41.
248
63.7
1.3
4766
.41.
4-2
.7%
15.2
%
Oth
er2
–
23.
61.
82
3.9
1.9
24.
12.
12
4.4
2.2
24.
72.
4 –
0.
6%
1. D
ata
has b
een
prov
ided
by
the
depa
rtm
ent a
nd m
ay n
ot n
eces
saril
y re
conc
ile w
ith o
ffici
al g
over
nmen
t per
sonn
el d
ata.
2. R
and
mill
ion.

31
Nat
iona
l Tre
asur
y | A
nnua
l Per
form
ance
Pla
n | 2
018/
19
PART B: PROGRAMME AND SUB-PROGRAMME PLANS - Continued
3. PROGRAMME 2: ECONOMIC POLICY, TAX, FINANCIAL REGULATION AND RESEARCH
3.1. Purpose
Provide specialist policy research, analysis and advisory services in the areas of macroeconomics, microeconomics, the financial sector,
taxation and regulatory reform.
3.2. Strategic Objectives
STRATEGIC OBJECTIVE OBJECTIVE STATEMENT SUB-PROGRAMMES
SO 2.1 Build economic research capacity in academic research institutions with the objective of promoting relevant research
Promoting economic research capacity in academic/research institutions through funding research relevant to the public interest. The research function provides information on topics relating to macroeconomic stability, poverty alleviation, retirement reform and financial sector development
Research
SO 2.2 Provide policy advice on the financial sector
Providing policy advice on the financial sector in relation to the regulatory framework and supporting legislation. The objective for policy is to make the financial sector safer and to treat customers more fairly and better, and to be more inclusive and have integrity. This includes implementing regulatory reforms related to the Twin Peaks system, savings and retirement reform, and improving market conduct practices in the industry to ensure that it provides more appropriate financial products
Financial Sector Policy
SO 2.3 Provide advice and input into tax policy, frameworks and legislation
Providing tax policy advice, tax revenue analysis, tax revenue forecasting and drafting the annual tax legislation as a part of the budget. The programme is responsible for developing a tax administrative system that ensures sustainable growth of the economy and improved environmental sustainability
Tax Policy
SO 2.4 Provide input into economic policy, related frameworks and strategies
Providing advice on macro and microeconomic policy, macroeconomic projections and modelling, monetary policy framework and economic sector strategies
Economic Policy
3.3. Sub-Programmes
PROGRAMME MANAGEMENT FOR ECONOMIC POLICY, TAX, FINANCIAL REGULATION AND RESEARCH
This sub-programme provides overall programme management and policy advice to government relating to the promotion of
economic growth, employment, and microeconomic and macroeconomic stability.
RESEARCH
This sub-programme promotes economic research institutions by funding economic research in the public interest, and dedicated
economic research on behalf of National Treasury. This includes research into the promotion of macroeconomic stability, poverty
alleviation, social security and retirement reform and financial sector policy development. Most funding is assigned for long term
agreements with institutions and for ad hoc economic research related projects.

32
Nat
iona
l Tre
asur
y | A
nnua
l Per
form
ance
Pla
n | 2
018/
19
PART B: PROGRAMME AND SUB-PROGRAMME PLANS - Continued
FINANCIAL SECTOR POLICY
This sub-programme is responsible for developing policy on the regulation of the financial sector in South Africa, on broadening access
to financial services by all South Africans, and on improving the national savings rate through reforms to the legislative framework
governing the savings industry, including work being undertaken towards the implementation of retirement reform proposals.
TAX POLICY
This sub-programme is responsible for preparing tax and revenue proposals for the annual national budget, and for drafting the
necessary tax legislation to give effect to the proposals adopted. The unit also processes recommendations made by the Davis
Tax Committee to the Minister of Finance and provides advice to the Minister on such recommendations. The unit promotes an
effective, equitable and efficient tax policy framework and tax administrative system that ensures sustainable growth and delivery
on government’s mandate to address the needs of all South Africans. This includes providing tax proposals towards improved
environmental sustainability, reduction of inequality, and raising of revenue.
ECONOMIC POLICY
This sub-programme provides macroeconomic and microeconomic policy analysis, economic forecasts that inform the budget
and Medium Term Budget Policy Statement and scenario modeling. The sound policy advice on the economic environment assists
in promoting economic policy coherence in relation to the objectives of growth and jobs, and helps to improve South Africa’s
macroeconomic and microeconomic framework as policy advice is mainly focused on creating decent employment through inclusive
economic growth.

33
Nat
iona
l Tre
asur
y | A
nnua
l Per
form
ance
Pla
n | 2
018/
19
PART B: PROGRAMME AND SUB-PROGRAMME PLANS - Continued3.
4. S
trat
egic
Pla
n O
bjec
tive
Ann
ual a
nd M
ediu
m T
erm
Tar
gets
PERF
ORM
AN
CE IN
DIC
ATO
RAU
DIT
ED/A
CTU
AL
PERF
ORM
AN
CEES
TIM
ATED
PE
RFO
RMA
NCE
PLA
NN
ED
PERF
ORM
AN
CE
CURR
ENT
YEA
R
MED
IUM
TER
M T
ARG
ETS
(MTE
F)
2014
/15
2015
/16
2016
/17
2017
/18
2018
/19
2019
/20
2020
/21
2021
/22
2022
/23
2023
/24
Stra
tegi
c O
bjec
tive
2.1:
Bui
ld e
cono
mic
rese
arch
cap
acity
in a
cade
mic
rese
arch
inst
itutio
ns w
ith th
e ob
ject
ive
of p
rom
otin
g re
leva
nt re
sear
ch
2.1
Num
ber o
f res
earc
h in
stitu
tions
par
ticip
atin
g in
bu
ildin
g ec
onom
ic re
sear
ch c
apac
ity
##
#1
11
11
11
Stra
tegi
c O
bjec
tive
2.2:
Pro
vide
pol
icy
advi
ce o
n th
e fin
anci
al s
ecto
r
2.2
Num
ber o
f pol
icy
advi
ces
on th
e fin
anci
al s
ecto
r pr
ovid
ed#
##
11
11
11
1
Stra
tegi
c O
bjec
tive
2.3:
Pro
vide
adv
ice
and
inpu
t int
o ta
x po
licy,
fram
ewor
ks a
nd le
gisl
atio
n
2.3
Num
ber o
f pol
icy
advi
ces
into
tax
polic
y,
fram
ewor
ks a
nd le
gisl
atio
n pr
ovid
ed#
##
22
22
22
2
Stra
tegi
c O
bjec
tive
2.4:
Pro
vide
inpu
t int
o ec
onom
ic p
olic
y, re
late
d fr
amew
orks
and
str
ateg
ies
2.4
Num
ber o
f inp
uts
into
eco
nom
ic p
olic
y an
d fra
mew
orks
pro
vide
d#
##
5656
5656
5656
56

34
Nat
iona
l Tre
asur
y | A
nnua
l Per
form
ance
Pla
n | 2
018/
19
PART B: PROGRAMME AND SUB-PROGRAMME PLANS - Continued
3.5.
Pro
gram
me
Perf
orm
ance
Indi
cato
rs a
nd A
nnua
l Tar
gets
201
8/19
PERF
ORM
AN
CE
IND
ICAT
OR
AUD
ITED
/ACT
UA
L PE
RFO
RMA
NCE
ESTI
MAT
ED
PERF
ORM
AN
CEPL
AN
NED
PE
RFO
RMA
NCE
CU
RREN
T YE
AR
MED
IUM
TER
M T
ARG
ETS
(MTE
F)
2014
/15
2015
/16
2016
/17
2017
/18
2018
/19
2019
/20
2020
/21
2021
/22
Stra
tegi
c O
bjec
tive
2.1:
Bui
ld e
cono
mic
rese
arch
cap
acity
in a
cade
mic
rese
arch
inst
itutio
ns w
ith th
e ob
ject
ive
of p
rom
otin
g re
leva
nt re
sear
ch
2.1.
1N
umbe
r of p
aper
s pu
blis
hed
in
asso
ciat
ion
with
ac
adem
ic re
sear
ch
inst
itutio
ns4
9184
8080
5050
5050
Stra
tegi
c O
bjec
tive
2.2:
Pro
vide
pol
icy
advi
ce o
n th
e fin
anci
al s
ecto
r
2.2.
1Tw
in P
eaks
m
odel
legi
slat
ion
impl
emen
ted5
N/A
N/A
Prog
ress
was
mad
e bu
t not
com
plet
ed.
FSR
Bill
pass
ed in
N
atio
nal A
ssem
bly
on 6
Dec
embe
r 20
16. N
COP
delib
erat
ions
he
ld o
n 3
and
14
Febr
uary
201
7.
Publ
ic h
earin
gs h
eld
on 2
8 M
arch
201
7 w
ith N
T re
spon
se
on 2
9 M
arch
201
7.
Votin
g on
the
Bill
is a
ntic
ipat
ed o
n 3
May
201
7, a
fter
this
re
port
ing
perio
d.
Enac
tmen
t and
im
plem
enta
tion
of
legi
slat
ion
to e
stab
lish
Twin
Pea
ks re
gula
tory
sy
stem
, inc
ludi
ng
esta
blis
hmen
t of n
ew
regu
lato
ry a
utho
ritie
s
Dev
elop
men
t of T
win
Pe
aks
Impl
emen
tatio
n Re
gula
tions
as
wel
l as
a c
ompr
ehen
sive
pr
uden
tial a
nd m
arke
t co
nduc
t fra
mew
ork
for
new
aut
horit
ies
Dev
elop
men
t and
im
plem
enta
tion
of c
ompr
ehen
sive
pr
uden
tial a
nd m
arke
t co
nduc
t fra
mew
ork
for
new
aut
horit
ies
Dev
elop
men
t and
im
plem
enta
tion
of c
ompr
ehen
sive
pr
uden
tial a
nd
mar
ket c
ondu
ct
fram
ewor
k fo
r new
au
thor
ities
Dev
elop
men
t an
d im
plem
enta
tion
of m
arke
t co
nduc
t and
pr
uden
tial
fram
ewor
ks fo
r ne
w a
utho
ritie
s
2.2.
2Im
plem
ent s
avin
gs
and
retir
emen
t po
licie
s
N/A
N/A
2nd
draf
t Def
ault
Regu
latio
ns
for R
etire
men
t fu
nds
rele
ased
in
Dec
embe
r 201
6
Ach
ieve
con
sens
us o
n an
nuiti
satio
nIm
plem
enta
tion
of
annu
itisa
tion
reso
lutio
nM
onito
ring
of ta
x-fre
e sa
ving
s ac
coun
ts ta
ke
up
Dev
elop
men
t and
im
plem
enta
tion
of
gove
rnan
ce d
irect
ive
for r
etire
men
t fun
ds
Cons
olid
atio
n of
re
tirem
ent f
unds
Impl
emen
tatio
n of
de
faul
t reg
ulat
ions
for
retir
emen
t fun
ds
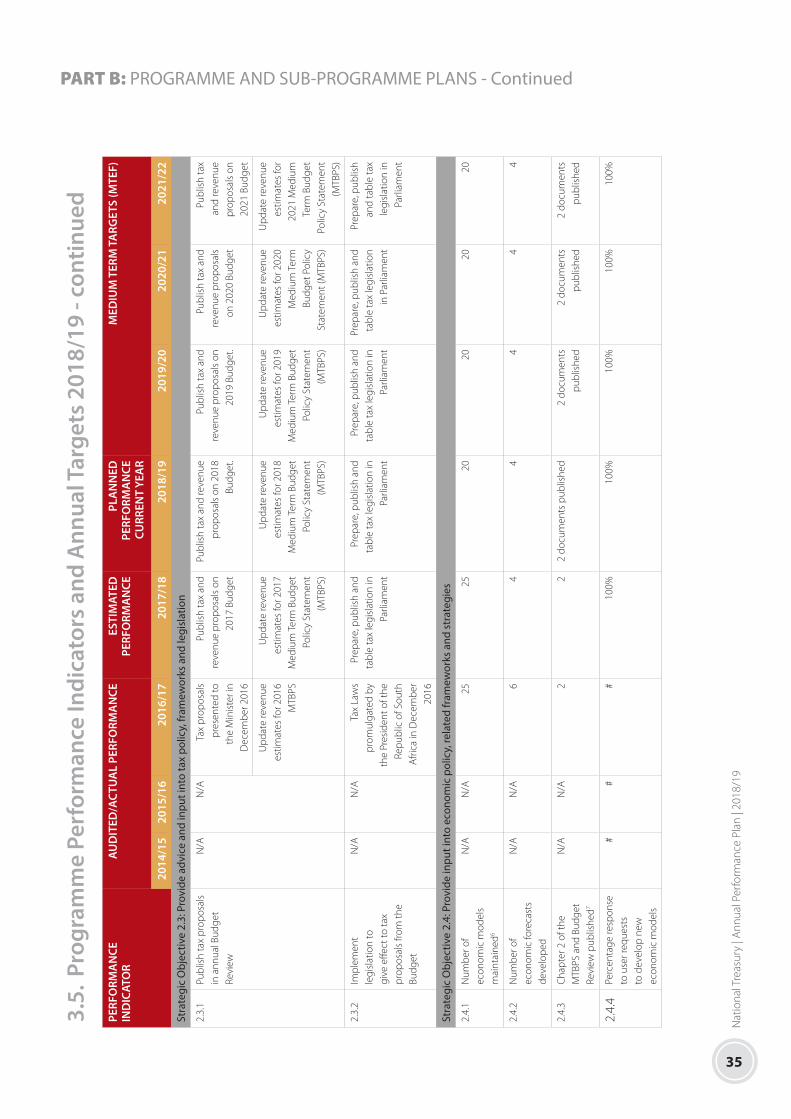
35
Nat
iona
l Tre
asur
y | A
nnua
l Per
form
ance
Pla
n | 2
018/
19
PART B: PROGRAMME AND SUB-PROGRAMME PLANS - Continued3.
5. P
rogr
amm
e Pe
rfor
man
ce In
dica
tors
and
Ann
ual T
arge
ts 2
018/
19 -
cont
inue
dPE
RFO
RMA
NCE
IN
DIC
ATO
RAU
DIT
ED/A
CTU
AL
PERF
ORM
AN
CEES
TIM
ATED
PE
RFO
RMA
NCE
PLA
NN
ED
PERF
ORM
AN
CE
CURR
ENT
YEA
R
MED
IUM
TER
M T
ARG
ETS
(MTE
F)
2014
/15
2015
/16
2016
/17
2017
/18
2018
/19
2019
/20
2020
/21
2021
/22
Stra
tegi
c O
bjec
tive
2.3:
Pro
vide
adv
ice
and
inpu
t int
o ta
x po
licy,
fram
ewor
ks a
nd le
gisl
atio
n
2.3.
1Pu
blis
h ta
x pr
opos
als
in a
nnua
l Bud
get
Revi
ew
N/A
N/A
Tax
prop
osal
s pr
esen
ted
to
the
Min
iste
r in
Dec
embe
r 201
6
Publ
ish
tax
and
reve
nue
prop
osal
s on
20
17 B
udge
t
Publ
ish
tax
and
reve
nue
prop
osal
s on
201
8 Bu
dget
.
Publ
ish
tax
and
reve
nue
prop
osal
s on
20
19 B
udge
t.
Publ
ish
tax
and
reve
nue
prop
osal
s on
202
0 Bu
dget
Publ
ish
tax
and
reve
nue
prop
osal
s on
20
21 B
udge
t
Upd
ate
reve
nue
estim
ates
for 2
016
MTB
PS
Upd
ate
reve
nue
estim
ates
for 2
017
Med
ium
Ter
m B
udge
t Po
licy
Stat
emen
t (M
TBPS
)
Upd
ate
reve
nue
estim
ates
for 2
018
Med
ium
Ter
m B
udge
t Po
licy
Stat
emen
t (M
TBPS
)
Upd
ate
reve
nue
estim
ates
for 2
019
Med
ium
Ter
m B
udge
t Po
licy
Stat
emen
t (M
TBPS
)
Upd
ate
reve
nue
estim
ates
for 2
020
Med
ium
Ter
m
Budg
et P
olic
y St
atem
ent (
MTB
PS)
Upd
ate
reve
nue
estim
ates
for
2021
Med
ium
Te
rm B
udge
t Po
licy
Stat
emen
t (M
TBPS
)
2.3.
2Im
plem
ent
legi
slat
ion
to
give
effe
ct to
tax
prop
osal
s fro
m th
e Bu
dget
N/A
N/A
Tax
Law
s pr
omul
gate
d by
th
e Pr
esid
ent o
f the
Re
publ
ic o
f Sou
th
Afri
ca in
Dec
embe
r 20
16
Prep
are,
pub
lish
and
tabl
e ta
x le
gisl
atio
n in
Pa
rliam
ent
Prep
are,
pub
lish
and
tabl
e ta
x le
gisl
atio
n in
Pa
rliam
ent
Prep
are,
pub
lish
and
tabl
e ta
x le
gisl
atio
n in
Pa
rliam
ent
Prep
are,
pub
lish
and
tabl
e ta
x le
gisl
atio
n in
Par
liam
ent
Prep
are,
pub
lish
and
tabl
e ta
x le
gisl
atio
n in
Pa
rliam
ent
Stra
tegi
c O
bjec
tive
2.4:
Pro
vide
inpu
t int
o ec
onom
ic p
olic
y, re
late
d fr
amew
orks
and
str
ateg
ies
2.4.
1N
umbe
r of
econ
omic
mod
els
mai
ntai
ned6
N/A
N/A
2525
20
20
20
20
2.4.
2N
umbe
r of
econ
omic
fore
cast
s de
velo
ped
N/A
N/A
64
44
44
2.4.
3C
hapt
er 2
of t
he
MTB
PS a
nd B
udge
t Re
view
pub
lishe
d7
N/A
N/A
22
2 do
cum
ents
pub
lishe
d 2
docu
men
ts
publ
ishe
d2
docu
men
ts
publ
ishe
d2
docu
men
ts
publ
ishe
d
2.4.
4Pe
rcen
tage
resp
onse
to
use
r req
uest
s to
dev
elop
new
ec
onom
ic m
odel
s
##
#10
0%10
0%10
0%10
0%10
0%

36
Nat
iona
l Tre
asur
y | A
nnua
l Per
form
ance
Pla
n | 2
018/
19
PART B: PROGRAMME AND SUB-PROGRAMME PLANS - Continued
3.5.
Pro
gram
me
Perf
orm
ance
Indi
cato
rs a
nd A
nnua
l Tar
gets
201
8/19
- co
ntin
ued
PERF
ORM
AN
CE
IND
ICAT
OR
AUD
ITED
/ACT
UA
L PE
RFO
RMA
NCE
ESTI
MAT
ED
PERF
ORM
AN
CEPL
AN
NED
PE
RFO
RMA
NCE
CU
RREN
T YE
AR
MED
IUM
TER
M T
ARG
ETS
(MTE
F)
2014
/15
2015
/16
2016
/17
2017
/18
2018
/19
2019
/20
2020
/21
2021
/22
2.4.
5Pe
rcen
tage
resp
onse
to
use
rs’ r
eque
sts
for
econ
omic
rese
arch
an
d po
licy
anal
ysis
, an
d as
sess
men
ts o
f go
vern
men
t pol
icy
prop
osal
s
##
#10
0%10
0%10
0%10
0%10
0%
2.4.
6Pe
rcen
tage
resp
onse
to
use
r req
uest
s fo
r po
licy
and
scen
ario
m
odel
ing
##
#10
0%10
0%10
0%10
0%10
0%
2.4.
7Pe
rcen
tage
resp
onse
to
use
r req
uest
s fo
r co
mm
enta
ries
on
econ
omic
dat
a
##
#10
0%10
0%10
0%10
0%10
0%

37
Nat
iona
l Tre
asur
y | A
nnua
l Per
form
ance
Pla
n | 2
018/
19
PART B: PROGRAMME AND SUB-PROGRAMME PLANS - Continued3.
6. P
rogr
amm
e Pe
rfor
man
ce In
dica
tor Q
uart
erly
Tar
gets
for 2
018/
19
PERF
ORM
AN
CE IN
DIC
ATO
R20
18/1
9A
NN
UA
L TA
RGET
SQ
UA
RTER
1Q
UA
RTER
2Q
UA
RTER
3Q
UA
RTER
4
Stra
tegi
c O
bjec
tive
2.1:
Bui
ld e
cono
mic
rese
arch
cap
acity
in a
cade
mic
rese
arch
inst
itutio
ns w
ith th
e ob
ject
ive
of p
rom
otin
g re
leva
nt re
sear
ch
2.1.
1N
umbe
r of p
aper
s pu
blis
hed
in a
ssoc
iatio
n w
ith a
cade
mic
re
sear
ch in
stitu
tions
50N
/AN
/AN
/A50
Stra
tegi
c O
bjec
tive
2.2:
Pro
vide
pol
icy
advi
ce o
n th
e fin
anci
al s
ecto
r
2.2.
1Tw
in P
eaks
mod
el le
gisl
atio
n im
plem
ente
d D
evel
opm
ent o
f Tw
in
Peak
s Im
plem
enta
tion
Regu
latio
ns a
s w
ell a
s a
com
preh
ensi
ve p
rude
ntia
l an
d m
arke
t con
duct
fra
mew
ork
for n
ew
auth
oriti
es
Dra
ft T
win
Pea
ks Im
plem
enta
tion
Regu
latio
ns p
rodu
ced
Twin
Pea
ks im
plem
enta
tion
Regu
latio
ns p
ublis
hed
Esta
blis
h FS
CA
N/A
Dra
ft a
com
preh
ensi
ve p
rude
ntia
l an
d m
arke
t con
duct
fram
ewor
k fo
r new
aut
horit
ies
Publ
ish
draf
ted
bills
Cons
ulta
tions
on
the
draf
t Bi
lls c
ondu
cted
Supp
ort C
OFI
Bill
thro
ugh
Parli
amen
tary
eng
agem
ent
proc
ess
2.2.
2Im
plem
ent s
avin
gs a
nd
retir
emen
t pol
icie
s Im
plem
enta
tion
of
annu
itisa
tion
reso
lutio
nN
/AD
raft
legi
slat
ion
on
annu
itisa
tion
reso
lutio
n pr
oduc
ed
N/A
Impl
emen
tatio
n of
the
NED
LAC
con
sens
us o
n an
nuiti
satio
n
Impl
emen
tatio
n of
def
ault
regu
latio
ns fo
r ret
irem
ent
fund
Stan
dard
s an
d gu
idel
ines
for
defa
ult r
egul
atio
ns fo
r ret
irem
ent
fund
s w
ith re
gula
tor d
evel
oped
N/A
N/A
Impl
emen
tatio
n of
def
ault
regu
latio
ns fo
r ret
irem
ent
fund
s
N/A
N/A
N/A
N/A
Prod
uce
a re
port
on
the
take
-up
of t
ax fr
ee s
avin
gs a
ccou
nts
Stra
tegi
c O
bjec
tive
2.3:
Pro
vide
adv
ice
and
inpu
t int
o ta
x po
licy,
fram
ewor
ks a
nd le
gisl
atio
n
2.3.
1Pu
blis
h ta
x pr
opos
als
in a
nnua
l bu
dget
revi
ewPu
blis
h ta
x an
d re
venu
e pr
opos
als
on 2
018
Budg
etN
/APu
blis
h re
venu
e fo
reca
sts
in
MTB
PSN
/APu
blis
h ta
x pr
opos
als
in 2
018
Budg
et
Upd
ate
reve
nue
estim
ates
fo
r 201
8 M
ediu
m T
erm
Bu
dget
Pol
icy
Stat
emen
t (M
TBPS
)

38
Nat
iona
l Tre
asur
y | A
nnua
l Per
form
ance
Pla
n | 2
018/
19
PART B: PROGRAMME AND SUB-PROGRAMME PLANS - Continued
3.6.
Pro
gram
me
Perf
orm
ance
Indi
cato
r Qua
rter
ly T
arge
ts fo
r 201
8/19
- co
ntin
ued
PERF
ORM
AN
CE IN
DIC
ATO
R20
18/1
9A
NN
UA
L TA
RGET
SQ
UA
RTER
1Q
UA
RTER
2Q
UA
RTER
3Q
UA
RTER
4
2.3.
2Im
plem
ent l
egis
latio
n to
giv
e eff
ect t
o ta
x pr
opos
als
from
th
e Bu
dget
8
Prep
are,
pub
lish
and
tabl
e ta
x le
gisl
atio
n in
Par
liam
ent
Prep
are
draf
t tax
legi
slat
ion
Publ
ish
draf
t tax
legi
slat
ion
for
publ
ic c
omm
ent
Tabl
e Ta
x Bi
lls in
Pa
rliam
ent f
or a
ppro
val b
y Pa
rliam
ent a
nd s
igna
ture
by
Pre
side
nt
Publ
ish
Tax
legi
slat
ion
in th
e G
over
nmen
t Gaz
ette
upo
n as
sent
by
the
Pres
iden
t
Stra
tegi
c O
bjec
tive
2.4:
Pro
vide
inpu
t int
o ec
onom
ic p
olic
y, re
late
d fr
amew
orks
and
str
ateg
ies
2.4.
1N
umbe
r of e
cono
mic
mod
els
mai
ntai
ned
205
55
5
2.4.
2N
umbe
r of e
cono
mic
fore
cast
s de
velo
ped
41
11
1
2.4.
3C
hapt
er 2
of t
he M
TBPS
and
Bu
dget
Rev
iew
pub
lishe
d2
docu
men
ts p
ublis
hed
N/A
N/A
1 do
cum
ent
1 do
cum
ent
2.4.
4Pe
rcen
tage
resp
onse
to u
ser
requ
ests
to d
evel
op n
ew
econ
omic
mod
els
100%
100%
100%
100%
100%
2.4.
5Pe
rcen
tage
resp
onse
to
user
s re
ques
ts fo
r eco
nom
ic
rese
arch
and
pol
icy
anal
ysis
, and
ass
essm
ents
of
gove
rnm
ent p
olic
y pr
opos
als
100%
100%
100%
100%
100%
2.4.
6Pe
rcen
tage
resp
onse
to
user
requ
ests
for p
olic
y an
d sc
enar
io m
odel
ing
100%
100%
100%
100%
100%
2.4.
7Pe
rcen
tage
resp
onse
to u
ser
requ
ests
for c
omm
enta
ries
on
econ
omic
dat
a
100%
100%
100%
100%
100%

39
Nat
iona
l Tre
asur
y | A
nnua
l Per
form
ance
Pla
n | 2
018/
19
PART B: PROGRAMME AND SUB-PROGRAMME PLANS - Continued3.
7. E
xpen
ditu
re T
rend
s an
d Es
timat
es
Econ
omic
Pol
icy,
Tax
, Fin
anci
al R
egul
atio
n an
d Re
sear
ch e
xpen
ditu
re tr
ends
and
est
imat
es b
y su
b-pr
ogra
mm
e an
d ec
onom
ic c
lass
ifica
tion
Sub-
prog
ram
me
Aud
ited
outc
ome
Adj
uste
dap
prop
riat
ion
Aver
age
grow
thra
te (%
)
Aver
age:
expe
n-di
ture
/to
tal (
%)
Med
ium
term
ex
pend
iture
estim
ate
Aver
age
grow
thra
te (%
)
Aver
age:
expe
n-di
ture
/to
tal (
%)
R m
illio
n 2
014/
15
201
5/16
20
16/1
7 2
017/
18
201
4/15
- 20
17/1
8 20
18/1
9 2
019/
20
202
0/21
2
017/
18 -
2020
/21
Prog
ram
me
Man
agem
ent f
or
Econ
omic
Pol
icy,
Tax
, Fin
anci
al
Regu
latio
n an
d Re
sear
ch
20.7
21.2
45.0
46.0
30.6
%23
.3%
39.2
41.4
43.9
-1.6
%27
.9%
Rese
arch
11.5
11.0
7.3
15.0
9.2%
7.8%
–
–
–
-100
.0%
2.5%
Fina
ncia
l Sec
tor P
olic
y28
.027
.624
.327
.2-0
.9%
18.8
%24
.926
.328
.31.
3%17
.5%
Tax
Polic
y21
.627
.630
.330
.312
.0%
19.2
%30
.031
.033
.23.
1%20
.4%
Econ
omic
Pol
icy
25.7
26.5
27.5
26.2
0.6%
18.6
%27
.028
.430
.65.
3%18
.3%
Coop
erat
ive
Bank
s D
evel
opm
ent
Age
ncy
16.8
17.3
16.9
19.3
4.6%
12.3
%19
.921
.022
.24.
7%13
.5%
Tota
l 12
4.3
131.
315
1.2
164.
09.
7%10
0.0%
141.
014
8.0
158.
1-1
.2%
100.
0%
Cha
nge
to 2
017
Budg
et e
stim
ate
24
.3(1
.5)
(1.4
)(1
.2)
Econ
omic
cla
ssifi
catio
n
Curr
ent p
aym
ents
96.3
102.
212
1.3
132.
811
.3%
79.3
%10
6.9
112.
112
0.2
-3.3
%77
.2%
Com
pens
atio
n of
em
ploy
ees
70.8
78.2
79.7
79.9
4.1%
54.1
%78
.782
.288
.43.
4%53
.9%
Goo
ds a
nd s
ervi
ces
25.5
24.0
41.7
52.9
27.5
%25
.2%
28.2
29.9
31.8
-15.
6%23
.4%
of w
hich
:
Com
mun
icat
ion
0.3
0.4
0.3
0.3
4.0%
0.2%
0.4
0.4
0.5
11.7
%0.
3%
Cons
ulta
nts:
Busin
ess a
nd a
dviso
ry
serv
ices
11.8
11.5
28.2
37.7
47.1
%15
.6%
13.7
14.7
15.5
-25.
6%13
.4%
Cons
umab
les:
Stat
ione
ry, p
rintin
g an
d offi
ce su
pplie
s1.
00.
51.
43.
244
.4%
1.1%
1.2
1.2
1.3
-25.
7%1.
1%
Trav
el a
nd su
bsist
ence
5.4
5.1
6.6
5.6
1.7%
4.0%
6.2
6.5
6.8
6.6%
4.1%
Trai
ning
and
dev
elop
men
t0.
70.
30.
50.
6-4
.7%
0.4%
0.7
0.8
0.9
14.2
%0.
5%
Ope
ratin
g pa
ymen
ts4.
04.
53.
33.
3-6
.1%
2.7%
4.4
4.6
5.0
14.0
%2.
8%
Tran
sfer
s an
d su
bsid
ies
27.7
28.8
29.2
30.2
3.0%
20.3
%33
.235
.137
.07.
0%22
.2%

40
Nat
iona
l Tre
asur
y | A
nnua
l Per
form
ance
Pla
n | 2
018/
19
PART B: PROGRAMME AND SUB-PROGRAMME PLANS - Continued
3.7.
Exp
endi
ture
Tre
nds
and
Estim
ates
- co
ntin
ued
Econ
omic
Pol
icy,
Tax
, Fin
anci
al R
egul
atio
n an
d Re
sear
ch e
xpen
ditu
re tr
ends
and
est
imat
es b
y su
b-pr
ogra
mm
e an
d ec
onom
ic c
lass
ifica
tion
Sub-
prog
ram
me
Aud
ited
outc
ome
Adj
uste
dap
prop
riat
ion
Aver
age
grow
thra
te (%
)
Aver
age:
expe
n-di
ture
/to
tal (
%)
Med
ium
term
ex
pend
iture
estim
ate
Aver
age
grow
thra
te (%
)
Aver
age:
expe
n-di
ture
/to
tal (
%)
R m
illio
n 2
014/
15
201
5/16
20
16/1
7 2
017/
18
201
4/15
- 20
17/1
8 20
18/1
9 2
019/
20
202
0/21
2
017/
18 -
2020
/21
Dep
artm
enta
l age
ncie
s an
d ac
coun
ts16
.817
.316
.919
.34.
6%12
.3%
19.9
21.0
22.2
4.7%
13.5
%
Publ
ic c
orpo
ratio
ns a
nd p
rivat
e en
terp
rises
10.8
11.4
12.0
10.6
-0.6
%7.
8%13
.314
.114
.811
.9%
8.6%
Hou
seho
lds
0.0
0.1
0.3
0.3
110.
2%0.
1% –
–
–
-1
00.0
%0.
1%
Paym
ents
for c
apita
l ass
ets
0.4
0.3
0.7
1.0
37.2
%0.
4%0.
90.
90.
9-3
.4%
0.6%
Mac
hine
ry a
nd e
quip
men
t0.
40.
30.
71.
037
.2%
0.4%
0.9
0.9
0.9
-3.4
%0.
6%
Paym
ents
for fi
nanc
ial a
sset
s0.
00.
00.
0 –
-1
00.0
% –
–
–
–
–
–
Tota
l 12
4.3
131.
315
1.2
164.
09.
7%10
0.0%
141.
014
8.0
158.
1-1
.2%
100.
0%
Prop
ortio
n of
tota
l pro
gram
me
expe
nditu
re to
vot
e ex
pend
iture
0.5%
0.5%
0.5%
0.4%
–
–
0.5%
0.5%
0.5%
–
–
Det
ails
of t
rans
fers
and
sub
sidi
es
Dep
artm
enta
l age
ncie
s an
d ac
coun
ts
Dep
artm
enta
l age
ncie
s (n
on-b
usin
ess
entit
ies)
Curr
ent
16.8
17.3
16.9
19.3
4.6%
12.3
%19
.921
.022
.24.
7%13
.5%
Coop
erat
ive
Bank
s D
evel
opm
ent
Age
ncy
16.8
17.3
16.9
19.3
4.6%
12.3
%19
.921
.022
.24.
7%13
.5%
Publ
ic c
orpo
ratio
ns a
nd p
rivat
e en
terp
rises
Publ
ic c
orpo
ratio
ns
Oth
er tr
ansf
ers
to p
ublic
cor
pora
tions
Curr
ent
10.8
11.4
12.0
10.6
-0.6
%7.
8%13
.314
.114
.811
.9%
8.6%
Econ
omic
Res
earc
h So
uthe
rn A
frica
10.8
11.4
12.0
10.6
-0.6
%7.
8%13
.314
.114
.811
.9%
8.6%

41
Nat
iona
l Tre
asur
y | A
nnua
l Per
form
ance
Pla
n | 2
018/
19
PART B: PROGRAMME AND SUB-PROGRAMME PLANS - Continued3.
8. P
erso
nnel
Info
rmat
ion
Num
ber o
f pos
ts e
stim
ated
fo
r 31
Mar
ch 2
018
Econ
omic
Pol
icy,
Tax
, Fin
anci
al R
egul
atio
n an
d Re
sear
ch p
erso
nnel
num
bers
and
cos
t by
sala
ry le
vel¹
Num
ber
Num
ber a
nd c
ost2
of p
erso
nnel
pos
ts fi
lled/
plan
ned
for o
n fu
nded
est
ablis
hmen
t
Num
ber o
ffu
nded
post
s
Num
ber
of p
osts
ad
ditio
nal
to th
e es
tabl
ishm
ent
Act
ual
Revi
sed
estim
ate
Med
ium
term
exp
endi
ture
est
imat
eAv
erag
egr
owth
rate
(%)
Aver
age:
sa
lary
leve
l/to
tal (
%)
2016
/17
2017
/18
2018
/19
2019
/20
2020
/21
2017
/18
- 202
0/21
Econ
omic
Pol
icy,
Tax
, Fi
nanc
ial R
egul
atio
n an
d Re
sear
ch
Num
ber
Cost
Uni
t co
st
Num
ber
Cost
Uni
t co
stN
umbe
rCo
stU
nit
cost
N
umbe
rCo
stU
nit
cost
N
umbe
rCo
stU
nit
cost
Sala
ry
leve
l10
51
9779
.70.
887
79.9
0.9
8178
.71.
079
82.2
1.0
8088
.41.
1-2
.8%
100.
0%
1 –
61
–
10.
30.
32
0.6
0.3
31.
00.
34
1.4
0.3
51.
90.
435
.7%
4.3%
7 –
1025
–
2714
.20.
522
12.6
0.6
2213
.60.
622
14.7
0.7
2215
.90.
7 –
26
.9%
11 –
12
29 –
29
21.8
0.8
1915
.40.
817
15.0
0.9
1413
.51.
013
13.1
1.0
-11.
9%19
.3%
13 –
16
501
4043
.41.
144
51.3
1.2
3949
.21.
339
52.6
1.3
4057
.61.
4-3
.1%
49.5
%
1. D
ata
has b
een
prov
ided
by
the
depa
rtm
ent a
nd m
ay n
ot n
eces
saril
y re
conc
ile w
ith o
ffici
al g
over
nmen
t per
sonn
el d
ata.
2. R
and
mill
ion.

42
Nat
iona
l Tre
asur
y | A
nnua
l Per
form
ance
Pla
n | 2
018/
19
PART B: PROGRAMME AND SUB-PROGRAMME PLANS - Continued
4. PROGRAMME 3: PUBLIC FINANCE AND BUDGET MANAGEMENT
4.1. Purpose
Provide analysis and advice on fiscal policy and public finances, intergovernmental financial relations, expenditure planning and
priorities. Manage government’s annual budget process and provide public finance management support.
4.2. Strategic Objectives
STRATEGIC OBJECTIVE OBJECTIVE STATEMENT SUB-PROGRAMMES
SO 3.1 Developing and implementing South Africa’s fiscal policy and related frameworks
Contribute to the South African economy by developing, ensuring Cabinet authorisation of and implementing South Africa’s fiscal policy and related frameworks
Public Finance and Budget Office
SO 3.2 Preparation of the national budget
Prepare a national budget that supports government’s long-term policy and strategic priorities, within a fiscal framework that will ensure sound and sustainable financial policies and the effective, efficient and appropriate allocation of public funds
SO 3.3 Publication of the national budget
Publish the Budget Review, Estimates of National Expenditure and MTBPS and appropriation legislation, containing relevant, accurate and clear financial information and selected indicators of service delivery and performance
SO 3.4 Monitoring and analysis of public expenditure and service delivery
Support improved monitoring and analysis of public expenditure and service delivery, and the appropriate use of public and private financial resources for social and economic development and infrastructure investment
SO 3.5 Coordinating international development cooperation
Effectively manage and coordinate official development assistance (ODA), which includes grants, concessionary loans and technical assistance
The Budget Office in collaboration with Public Finance, Asset and Liability Management (ALM), International and Regional Economic Policy (IREP)
SO 3.6 Coordinating intergovernmental relations
Effectively coordinate fiscal relations between the three spheres of government and promote sound financial planning, reporting and management
Intergovernmental Relations
4.3. Sub-Programmes
PUBLIC FINANCE AND BUDGET MANAGEMENT
Three divisions within National Treasury are jointly responsible for fulfilling the functions of this programme. They are the Budget Office,
Public Finance and Intergovernmental Relations.
BUDGET OFFICE
The Budget Office is responsible for providing fiscal policy advice by monitoring economic and fiscal trends and advising on policy
options and the budget framework. The Budget Office coordinates the national budgeting process which includes coordinating
resource allocation to meet priorities set by government. The Budget Office oversees expenditure planning, leads the budget reform
programme, coordinates international development cooperation, provides advice on public service remuneration and pension
arrangements and compiles public finance statistics.

43
Nat
iona
l Tre
asur
y | A
nnua
l Per
form
ance
Pla
n | 2
018/
19
PART B: PROGRAMME AND SUB-PROGRAMME PLANS - Continued
PUBLIC FINANCE
Public Finance provides financial and budgetary analysis, advises on policy and service delivery trends, and manages National Treasury’s
relations with other national departments as well as its own analytical work. The division monitors the use of scarce public resources by
national spending agencies, engaging where necessary with accounting officers and other officials to promote efficient and effective
use of these resources. Based on engagements with departments, the Public Finance team provides recommendations annually to the
Medium Term Expenditure Committee (MTEC).
INTERGOVERNMENTAL RELATIONS
Intergovernmental Relations coordinates fiscal relations between national, provincial and local government, promotes sound provincial
and municipal budgetary planning, monitors implementation through periodic reporting and assists in building capacity that enables
efficient and effective financial management practices. The division monitors the use of scarce public resources by provincial and local
government, regularly engaging with a range of stakeholders to promote efficient and effective use of these resources. It also provides
technical assistance to government departments to promote improved planning and management of infrastructure delivery.

44
Nat
iona
l Tre
asur
y | A
nnua
l Per
form
ance
Pla
n | 2
018/
19
PART B: PROGRAMME AND SUB-PROGRAMME PLANS - Continued
4.4.
Str
ateg
ic P
lan
Obj
ectiv
e A
nnua
l and
Med
ium
Term
Targ
ets
PERF
ORM
AN
CE
IND
ICAT
OR
AUD
ITED
/ACT
UA
L PE
RFO
RMA
NCE
ESTI
MAT
ED
PERF
ORM
AN
CE
PLA
NN
ED
PERF
ORM
AN
CE
CURR
ENT
YEA
R
MED
IUM
TER
M T
ARG
ETS
(MTE
F)
2014
/15
2015
/16
2016
/17
2017
/18
2018
/19
2019
/20
2020
/21
2021
/22
2022
/23
2023
/24
Stra
tegi
c O
bjec
tive
3.1:
Dev
elop
ing
and
impl
emen
ting
Sout
h A
fric
a’s fi
scal
pol
icy
and
rela
ted
fram
ewor
ks
3.1
Sout
h A
frica
’s fis
cal
polic
y an
d re
late
d fra
mew
orks
aut
horis
ed
##
#Ca
bine
t au
thor
isat
ion
Cabi
net
auth
oris
atio
nCa
bine
t au
thor
isat
ion
Cabi
net
auth
oris
atio
nCa
bine
t au
thor
isat
ion
Cabi
net
auth
oris
atio
nCa
bine
t au
thor
isat
ion
Stra
tegi
c O
bjec
tive
3.2:
Pre
para
tion
of th
e na
tiona
l bud
get
3.2
Num
ber o
f bud
gets
pr
oduc
ed#
##
11
11
11
1
Stra
tegi
c O
bjec
tive
3.3:
Pub
licat
ion
of th
e na
tiona
l bud
get
3.3
Num
ber o
f nat
iona
l bu
dget
s pu
blis
hed
##
#1
11
11
11
Stra
tegi
c O
bjec
tive
3.4:
Mon
itorin
g an
d an
alys
is o
f pub
lic e
xpen
ditu
re a
nd s
ervi
ce d
eliv
ery
3.4
Num
ber o
f ann
ual
expe
nditu
re re
port
s su
bmitt
ed to
the
Stan
ding
Com
mitt
ee o
n A
ppro
pria
tions
##
#16
04
44
44
4
Stra
tegi
c O
bjec
tive
3.5:
Coo
rdin
atin
g in
tern
atio
nal d
evel
opm
ent c
oope
ratio
n
3.5
Perc
enta
ge o
f O
DA
pro
gram
mes
co
ordi
nate
d
##
#10
0%10
0%10
0%10
0%10
0%10
0%10
0%
Stra
tegi
c O
bjec
tive
3.6:
Coo
rdin
atio
n of
inte
rgov
ernm
enta
l rel
atio
ns
3.6
Num
ber o
f leg
isla
tivel
y re
quire
d Bu
dget
Cou
ncil
and
Foru
m m
eetin
gs
held
9
##
#3
33
33
33

45
Nat
iona
l Tre
asur
y | A
nnua
l Per
form
ance
Pla
n | 2
018/
19
PART B: PROGRAMME AND SUB-PROGRAMME PLANS - Continued4.
5. P
rogr
amm
e Pe
rfor
man
ce In
dica
tors
and
Ann
ual T
arge
ts
PERF
ORM
AN
CE IN
DIC
ATO
RAU
DIT
ED/A
CTU
AL
PERF
ORM
AN
CEES
TIM
ATED
PE
RFO
RMA
NCE
PL
AN
NED
PE
RFO
RMA
NCE
CU
RREN
T YE
AR
MED
IUM
TER
M T
ARG
ETS
(MTE
F)
2014
/15
2015
/16
2016
/17
2017
/18
2018
/19
2019
/20
2020
/21
2021
/22
Stra
tegi
c O
bjec
tive
3.1:
Dev
elop
ing
and
impl
emen
ting
Sout
h A
fric
a’s fi
scal
pol
icy
and
rela
ted
fram
ewor
ks
3.1.
1M
aint
ain
the
expe
nditu
re c
eilin
g10
N/A
N/A
0=
0 o
r les
s th
an 0
for
each
yea
rLe
ss th
an o
r equ
al to
ex
pend
iture
cei
ling
anno
unce
d in
mai
n bu
dget
Less
than
or
equ
al to
ex
pend
iture
ce
iling
an
noun
ced
in
mai
n bu
dget
Less
than
or
equ
al to
ex
pend
iture
ce
iling
an
noun
ced
in
mai
n bu
dget
Less
than
or
equ
al to
ex
pend
iture
ce
iling
an
noun
ced
in
mai
n bu
dget
3.1.
2N
umbe
r of fi
scal
fra
mew
orks
pro
vide
dN
/AN
/A2
22
22
2
Stra
tegi
c O
bjec
tive
3.2:
Pre
para
tion
of th
e na
tiona
l bud
get
3.2.
1N
umbe
r of b
udge
t gu
idel
ines
issu
ed11
N/A
N/A
1 se
t of M
TEF
guid
elin
es is
sued
by
July
1 pr
ogra
mm
e sc
hedu
ling
MTE
C
mee
ting
draf
ted
by Ju
ly
1 A
djus
ted
Estim
ates
of
Nat
iona
l Ex
pend
iture
(AEN
E)
guid
elin
e is
sued
in
Aug
ust
1 EN
E gu
idel
ine
issu
ed in
Oct
ober
1 se
t of M
TEF
guid
elin
es
issu
ed b
y Ju
ly
1 pr
ogra
mm
e sc
hedu
ling
MTE
C
mee
ting
draf
ted
by Ju
ly
1 A
ENE
guid
elin
e is
sued
in
Aug
ust
1 EN
E gu
idel
ine
issu
ed
in O
ctob
er
1 se
t of M
TEF
guid
elin
es
issu
ed b
y Ju
ly
1 A
ENE
guid
elin
e is
sued
in
Aug
ust
1 EN
E gu
idel
ine
issu
ed
in O
ctob
er
1 se
t of M
TEF
guid
elin
es
issu
ed b
y Ju
ly
1 A
ENE
guid
elin
e is
sued
in
Aug
ust
1 EN
E gu
idel
ine
issu
ed in
O
ctob
er
1 se
t of M
TEF
guid
elin
es
issu
ed b
y Ju
ly
1 A
ENE
guid
elin
e is
sued
in
Aug
ust
1 EN
E G
uide
line
issu
ed in
O
ctob
er
1 se
t of M
TEF
guid
elin
es
issu
ed b
y Ju
ly
1 A
ENE
guid
elin
e is
sued
in
Aug
ust
1 EN
E gu
idel
ine
issu
ed in
O
ctob
er

46
Nat
iona
l Tre
asur
y | A
nnua
l Per
form
ance
Pla
n | 2
018/
19
PART B: PROGRAMME AND SUB-PROGRAMME PLANS - Continued
4.5.
Pro
gram
me
Perf
orm
ance
Indi
cato
rs a
nd A
nnua
l Tar
gets
- co
ntin
ued
PERF
ORM
AN
CE IN
DIC
ATO
RAU
DIT
ED/A
CTU
AL
PERF
ORM
AN
CEES
TIM
ATED
PE
RFO
RMA
NCE
PL
AN
NED
PE
RFO
RMA
NCE
CU
RREN
T YE
AR
MED
IUM
TER
M T
ARG
ETS
(MTE
F)
2014
/15
2015
/16
2016
/17
2017
/18
2018
/19
2019
/20
2020
/21
2021
/22
3.2.
2O
btai
n bu
dget
ex
pend
iture
al
loca
tion
dec
isio
ns
from
the
exec
utiv
e 12
13
N/A
N/A
Adj
ustm
ents
A
ppro
pria
tion
Bill,
20
16 ta
bled
in
Parli
amen
t on
26
Oct
ober
201
6
2016
Adj
uste
d Es
timat
es
of N
atio
nal
Expe
nditu
re ta
bled
in
Par
liam
ent o
n 26
O
ctob
er 2
016
2016
Med
ium
Te
rm B
udge
t Pol
icy
Stat
emen
t tab
led
in P
arlia
men
t on
26
Oct
ober
201
6
App
ropr
iatio
n Bi
ll,
2017
tabl
ed in
Pa
rliam
ent o
n 22
Fe
brua
ry 2
017
2017
Est
imat
es
of N
atio
nal
Expe
nditu
re ta
bled
in
Par
liam
ent o
n 22
Fe
brua
ry 2
017
2017
bud
get
revi
ew ta
bled
in
Parli
amen
t on
22
Febr
uary
201
7
Vario
us fu
ndin
g re
com
men
datio
ns to
th
e M
TEC
, the
Min
iste
rs’
Com
mitt
ee o
n th
e Bu
dget
(MIN
COM
BUD
) an
d Ca
bine
t with
in
budg
et c
alen
dar
timel
ines
1 Ca
bine
t end
orse
men
t of
nat
iona
l gov
ernm
ent
expe
nditu
re a
lloca
tions
by
end
of c
alen
dar y
ear
1 Ca
bine
t end
orse
men
t of
nat
iona
l gov
ernm
ent
expe
nditu
re a
lloca
tions
by
end
of c
alen
dar y
ear
1 Ca
bine
t en
dors
emen
t of
nat
iona
l go
vern
men
t ex
pend
iture
al
loca
tions
by
end
of c
alen
dar
year
1 Ca
bine
t en
dors
emen
t of
nat
iona
l go
vern
men
t ex
pend
iture
al
loca
tions
by
end
of c
alen
dar
year
1 Ca
bine
t en
dors
emen
t of
nat
iona
l go
vern
men
t ex
pend
iture
al
loca
tions
by
end
of c
alen
dar
year
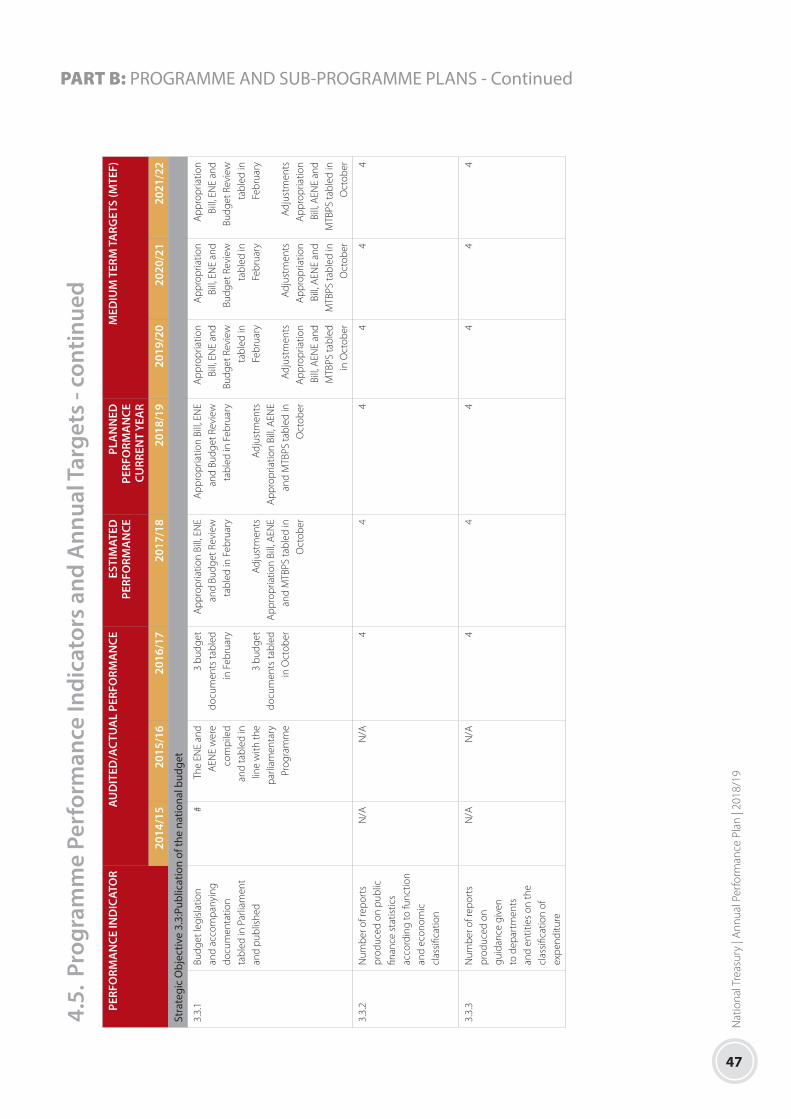
47
Nat
iona
l Tre
asur
y | A
nnua
l Per
form
ance
Pla
n | 2
018/
19
PART B: PROGRAMME AND SUB-PROGRAMME PLANS - Continued4.
5. P
rogr
amm
e Pe
rfor
man
ce In
dica
tors
and
Ann
ual T
arge
ts -
cont
inue
dPE
RFO
RMA
NCE
IND
ICAT
OR
AUD
ITED
/ACT
UA
L PE
RFO
RMA
NCE
ESTI
MAT
ED
PERF
ORM
AN
CE
PLA
NN
ED
PERF
ORM
AN
CE
CURR
ENT
YEA
R
MED
IUM
TER
M T
ARG
ETS
(MTE
F)
2014
/15
2015
/16
2016
/17
2017
/18
2018
/19
2019
/20
2020
/21
2021
/22
Stra
tegi
c O
bjec
tive
3.3:
Publ
icat
ion
of th
e na
tiona
l bud
get
3.3.
1Bu
dget
legi
slat
ion
and
acco
mpa
nyin
g do
cum
enta
tion
tabl
ed in
Par
liam
ent
and
publ
ishe
d
#Th
e EN
E an
d A
ENE
wer
e co
mpi
led
and
tabl
ed in
lin
e w
ith th
e pa
rliam
enta
ryPr
ogra
mm
e
3 bu
dget
do
cum
ents
tabl
ed
in F
ebru
ary
3 bu
dget
do
cum
ents
tabl
ed
in O
ctob
er
App
ropr
iatio
n Bi
ll, E
NE
and
Budg
et R
evie
w
tabl
ed in
Feb
ruar
y
Adj
ustm
ents
A
ppro
pria
tion
Bill,
AEN
E an
d M
TBPS
tabl
ed in
O
ctob
er
App
ropr
iatio
n Bi
ll, E
NE
and
Budg
et R
evie
w
tabl
ed in
Feb
ruar
y
Adj
ustm
ents
A
ppro
pria
tion
Bill,
AEN
E an
d M
TBPS
tabl
ed in
O
ctob
er
App
ropr
iatio
n Bi
ll, E
NE
and
Budg
et R
evie
w
tabl
ed in
Fe
brua
ry
Adj
ustm
ents
A
ppro
pria
tion
Bill,
AEN
E an
d M
TBPS
tabl
ed
in O
ctob
er
App
ropr
iatio
n Bi
ll, E
NE
and
Budg
et R
evie
w
tabl
ed in
Fe
brua
ry
Adj
ustm
ents
A
ppro
pria
tion
Bill,
AEN
E an
d M
TBPS
tabl
ed in
O
ctob
er
App
ropr
iatio
n Bi
ll, E
NE
and
Budg
et R
evie
w
tabl
ed in
Fe
brua
ry
Adj
ustm
ents
A
ppro
pria
tion
Bill,
AEN
E an
d M
TBPS
tabl
ed in
O
ctob
er
3.3.
2N
umbe
r of r
epor
ts
prod
uced
on
publ
ic
finan
ce s
tatis
tics
acco
rdin
g to
func
tion
and
econ
omic
cl
assi
ficat
ion
N/A
N/A
4 4
4 4
4 4
3.3.
3N
umbe
r of r
epor
ts
prod
uced
on
guid
ance
giv
en
to d
epar
tmen
ts
and
entit
ies
on th
e cl
assi
ficat
ion
of
expe
nditu
re
N/A
N/A
4 4
4 4
4 4

48
Nat
iona
l Tre
asur
y | A
nnua
l Per
form
ance
Pla
n | 2
018/
19
PART B: PROGRAMME AND SUB-PROGRAMME PLANS - Continued
4.5.
Pro
gram
me
Perf
orm
ance
Indi
cato
rs a
nd A
nnua
l Tar
gets
- co
ntin
ued
PERF
ORM
AN
CE IN
DIC
ATO
RAU
DIT
ED/A
CTU
AL
PERF
ORM
AN
CEES
TIM
ATED
PE
RFO
RMA
NCE
PL
AN
NED
PE
RFO
RMA
NCE
CU
RREN
T YE
AR
MED
IUM
TER
M T
ARG
ETS
(MTE
F)
2014
/15
2015
/16
2016
/17
2017
/18
2018
/19
2019
/20
2020
/21
2021
/22
Stra
tegi
c ob
ject
ive
3.4:
Mon
itorin
g an
d an
alys
is o
f pub
lic e
xpen
ditu
re a
nd s
ervi
ce d
eliv
ery
3.4.
1Pe
rcen
tage
resp
onse
s to
dep
artm
enta
l re
ques
ts fo
r PFM
A
and
TR a
ppro
vals
, se
ctor
al a
naly
sis
and
polic
y ad
vice
14
N/A
N/A
98.9
%
100%
100%
100%
100%
100%
3.4.
2Pe
rcen
tage
co
mm
ents
to C
abin
et
mem
os
##
##
100%
100%
100%
100%
3.4.
3N
umbe
r of I
YM
feed
back
repo
rts
to
depa
rtm
ents
15
N/A
N/A
277
540
540
540
540
540
3.4.
4N
umbe
r of q
uart
erly
ex
pend
iture
repo
rts
subm
itted
to th
e St
andi
ng C
omm
ittee
on
App
ropr
iatio
ns16
N/A
N/A
160
160
44
44
3.4.
5N
umbe
r of r
epor
ts
prod
uced
on
revi
ew
and
impl
emen
tatio
n of
the
COLA
cos
ting
mod
el
N/A
N/A
34
44
44

49
Nat
iona
l Tre
asur
y | A
nnua
l Per
form
ance
Pla
n | 2
018/
19
PART B: PROGRAMME AND SUB-PROGRAMME PLANS - Continued4.
5. P
rogr
amm
e Pe
rfor
man
ce In
dica
tors
and
Ann
ual T
arge
ts -
cont
inue
dPE
RFO
RMA
NCE
IND
ICAT
OR
AUD
ITED
/ACT
UA
L PE
RFO
RMA
NCE
ESTI
MAT
ED
PERF
ORM
AN
CE
PLA
NN
ED
PERF
ORM
AN
CE
CURR
ENT
YEA
R
MED
IUM
TER
M T
ARG
ETS
(MTE
F)
2014
/15
2015
/16
2016
/17
2017
/18
2018
/19
2019
/20
2020
/21
2021
/22
3.4.
6Pe
rcen
tage
re
spon
se to
re
ques
ts fo
r sup
port
on
gov
erna
nce
and
finan
cial
m
anag
emen
t m
onito
ring
and
com
plia
nce
syst
em
in p
ublic
ent
ities
pr
ovid
ed
N/A
N/A
100%
100%
100%
100%
100%
100%
3.4.
7Pe
rcen
tage
of
Budg
et F
acili
ty o
n In
frast
ruct
ure
(BFI
) pr
ojec
ts e
valu
ated
##
##
#10
0%10
0%10
0%
Stra
tegi
c O
bjec
tive
3.5:
Coo
rdin
atin
g in
tern
atio
nal d
evel
opm
ent c
oope
ratio
n
3.5.
1Pe
rcen
tage
alig
nmen
t of
dev
elop
men
t co
oper
atio
n to
go
vern
men
t pol
icy
and
prio
ritie
s
N/A
N/A
100%
100%
100%
100%
100%
100%
3.5.
2Pe
rcen
tage
m
anag
emen
t an
d co
ordi
natio
n of
dev
elop
men
t co
oper
atio
n in
Sou
th
Afri
ca
N/A
N/A
100%
100%
100%
100%
100%
100%
Stra
tegi
c O
bjec
tive
3.6:
Coo
rdin
atin
g in
terg
over
nmen
tal r
elat
ions
3.6.
1N
umbe
r of
Div
isio
n of
Rev
enue
and
D
ivis
ion
of R
even
ue
Am
endm
ent B
ills
publ
ishe
d an
nual
ly
N/A
N/A
32
22
22

50
Nat
iona
l Tre
asur
y | A
nnua
l Per
form
ance
Pla
n | 2
018/
19
PART B: PROGRAMME AND SUB-PROGRAMME PLANS - Continued
4.5.
Pro
gram
me
Perf
orm
ance
Indi
cato
rs a
nd A
nnua
l Tar
gets
- co
ntin
ued
PERF
ORM
AN
CE IN
DIC
ATO
RAU
DIT
ED/A
CTU
AL
PERF
ORM
AN
CEES
TIM
ATED
PE
RFO
RMA
NCE
PL
AN
NED
PE
RFO
RMA
NCE
CU
RREN
T YE
AR
MED
IUM
TER
M T
ARG
ETS
(MTE
F)
2014
/15
2015
/16
2016
/17
2017
/18
2018
/19
2019
/20
2020
/21
2021
/22
3.6.
2N
umbe
r of
refo
rms
intr
oduc
ed to
en
hanc
e pr
ovin
cial
an
d lo
cal g
over
nmen
t fis
cal f
ram
ewor
ks
N/A
N/A
42
22
22
3.6.
3N
umbe
r of p
lans
as
sess
ed to
sup
port
im
prov
emen
ts
in in
frast
ruct
ure
plan
ning
and
im
plem
enta
tion
in
prov
ince
s17
N/A
N/A
1836
3636
3636
3.6.
4N
umbe
r of b
uilt
envi
ronm
ent
perf
orm
ance
pla
ns
asse
ssed
to s
uppo
rt
impr
ovem
ent i
n th
e m
etro
polit
an
mun
icip
aliti
es18
N/A
N/A
88
88
88
3.6.
5N
umbe
r of c
apac
ity
build
ing
initi
ativ
es to
fa
cilit
ate
impr
oved
pl
anni
ng, b
udge
ting
and
finan
cial
m
anag
emen
t 19 2
0
N/A
N/A
3359
5050
5050
3.6.
6N
umbe
r of q
uart
erly
fin
anci
al re
port
s pu
blis
hed
21
N/A
N/A
44
88
88

51
Nat
iona
l Tre
asur
y | A
nnua
l Per
form
ance
Pla
n | 2
018/
19
PART B: PROGRAMME AND SUB-PROGRAMME PLANS - Continued4.
5. P
rogr
amm
e Pe
rfor
man
ce In
dica
tors
and
Ann
ual T
arge
ts -
cont
inue
dPE
RFO
RMA
NCE
IND
ICAT
OR
AUD
ITED
/ACT
UA
L PE
RFO
RMA
NCE
ESTI
MAT
ED
PERF
ORM
AN
CE
PLA
NN
ED
PERF
ORM
AN
CE
CURR
ENT
YEA
R
MED
IUM
TER
M T
ARG
ETS
(MTE
F)
2014
/15
2015
/16
2016
/17
2017
/18
2018
/19
2019
/20
2020
/21
2021
/22
3.6.
7N
umbe
r of
prov
inci
al a
nd
mun
icip
al b
udge
ting
benc
hmar
king
ex
erci
ses
held
to
impr
ove
prov
inci
al
and
mun
icip
al
budg
et c
redi
bilit
y,
com
posi
tion
and
achi
evab
ility
N/A
N/A
1835
3535
3535
3.6.
8N
umbe
r of a
nnua
l m
unic
ipal
rout
ine
repo
rts
publ
ishe
d 22
23
##
#10
66
66
3.6.
9N
umbe
r of
supp
ort i
nitia
tives
im
plem
ente
d in
pr
ovin
ces
##
#13
1313
1313
3.6.
10N
umbe
r of m
unic
ipal
bu
dget
ing
and
repo
rtin
g re
form
s im
plem
ente
d24
##
#3
33
22
3.6.
11N
umbe
r of p
rovi
ncia
l an
d m
unic
ipal
m
id-y
ear b
udge
t an
d ex
pend
iture
pe
rfor
man
ce
asse
ssm
ent r
epor
ts
prod
uced
##
#26
2626
2626

52
Nat
iona
l Tre
asur
y | A
nnua
l Per
form
ance
Pla
n | 2
018/
19
PART B: PROGRAMME AND SUB-PROGRAMME PLANS - Continued
4.6.
Pro
gram
me
Perf
orm
ance
Indi
cato
r Qua
rter
ly T
arge
ts fo
r 201
8/19
PERF
ORM
AN
CE IN
DIC
ATO
R20
18/1
9A
NN
UA
L TA
RGET
SQ
UA
RTER
1Q
UA
RTER
2Q
UA
RTER
3Q
UA
RTER
4
Stra
tegi
c O
bjec
tive
3.1:
Dev
elop
ing
and
impl
emen
ting
Sout
h A
fric
a’s fi
scal
pol
icy
and
rela
ted
fram
ewor
ks
3.1.
1M
aint
ain
the
expe
nditu
re c
eilin
gLe
ss th
an o
r equ
al to
exp
endi
ture
ce
iling
ann
ounc
ed in
mai
n bu
dget
.N
/AN
/ALe
ss th
an o
r equ
al
to e
xpen
ditu
re
ceili
ng a
nnou
nced
in
mai
n bu
dget
.
Less
than
or e
qual
to
exp
endi
ture
ce
iling
ann
ounc
ed
in m
ain
budg
et.
3.1.
2N
umbe
r of fi
scal
fram
ewor
ks p
rovi
ded
2N
/AN
/A1
1
Stra
tegi
c O
bjec
tive
3.2:
Pre
para
tion
of th
e na
tiona
l bud
get
3.2.
1N
umbe
r of b
udge
t gui
delin
es is
sued
1
set o
f MTE
F gu
idel
ines
issu
ed b
y Ju
ly.
1 A
ENE
guid
elin
e is
sued
in A
ugus
t
1 EN
E gu
idel
ine
issu
ed in
Oct
ober
N/A
1 se
t of M
TEF
guid
elin
es is
sued
by
July
1 A
ENE
guid
elin
e is
sued
in A
ugus
t
1 EN
E gu
idel
ine
issu
ed in
Oct
ober
N/A
3.2.
2O
btai
n bu
dget
exp
endi
ture
allo
catio
n de
cisi
ons
from
the
exec
utiv
e1
Cabi
net e
ndor
sem
ent o
f nat
iona
l go
vern
men
t exp
endi
ture
allo
catio
ns b
y en
d of
cal
enda
r yea
r
N/A
N/A
1 Ca
bine
t en
dors
emen
t of
nat
iona
l go
vern
men
t ex
pend
iture
al
loca
tions
by
end
of c
alen
dar y
ear
N/A

53
Nat
iona
l Tre
asur
y | A
nnua
l Per
form
ance
Pla
n | 2
018/
19
PART B: PROGRAMME AND SUB-PROGRAMME PLANS - Continued4.
6. P
rogr
amm
e Pe
rfor
man
ce In
dica
tor Q
uart
erly
Tar
gets
for 2
018/
19 -
cont
inue
dPE
RFO
RMA
NCE
IND
ICAT
OR
2018
/19
AN
NU
AL
TARG
ETS
QU
ART
ER 1
QU
ART
ER 2
QU
ART
ER 3
QU
ART
ER 4
Stra
tegi
c O
bjec
tive
3.3:
Pub
licat
ion
of th
e na
tiona
l bud
get
3.3.
1Bu
dget
legi
slat
ion
and
acco
mpa
nyin
g do
cum
enta
tion
tabl
ed
in P
arlia
men
t and
pub
lishe
d A
ppro
pria
tion
Bill,
EN
E an
d Bu
dget
Re
view
tabl
ed in
Feb
ruar
y
Adj
ustm
ents
App
ropr
iatio
n Bi
ll, A
ENE
and
MTB
PS ta
bled
in O
ctob
er
N/A
N/A
Adj
ustm
ents
A
ppro
pria
tion
Bill,
A
ENE
and
MTB
PS
tabl
ed in
Oct
ober
App
ropr
iatio
n Bi
ll,
ENE
and
Budg
et
Revi
ew ta
bled
in
Febr
uary
.
3.3.
2N
umbe
r of r
epor
ts p
rodu
ced
on p
ublic
fina
nce
stat
istic
s ac
cord
ing
to fu
nctio
n an
d ec
onom
ic c
lass
ifica
tion
41
11
1
3.3.
3N
umbe
r of r
epor
ts p
rodu
ced
on g
uida
nce
give
n to
de
part
men
ts a
nd e
ntiti
es o
n th
e cl
assi
ficat
ion
of e
xpen
ditu
re4
11
11
Stra
tegi
c O
bjec
tive
3.4:
Mon
itorin
g an
d an
alys
is o
f pub
lic e
xpen
ditu
re a
nd s
ervi
ce d
eliv
ery
3.4.
1Pe
rcen
tage
resp
onse
s to
dep
artm
enta
l req
uest
s fo
r PFM
A a
nd
TR a
ppro
vals
, sec
tora
l ana
lysi
s an
d po
licy
advi
ce10
0%10
0%10
0%10
0%10
0%
3.4.
2Pe
rcen
tage
com
men
ts to
Cab
inet
mem
os
100%
100%
100%
100%
100%
3.4.
3N
umbe
r of I
YM fe
edba
ck re
port
s to
dep
artm
ents
540
135
135
135
135
3.4.
4N
umbe
r of q
uart
erly
exp
endi
ture
repo
rts
subm
itted
to th
e St
andi
ng C
omm
ittee
on
App
ropr
iatio
ns4
11
11
3.4.
5N
umbe
r of r
epor
ts p
rodu
ced
on re
view
and
impl
emen
tatio
n of
the
COLA
cos
ting
mod
el4
11
11
3.4.
6Pe
rcen
tage
resp
onse
to re
ques
ts fo
r sup
port
on
gove
rnan
ce
and
finan
cial
man
agem
ent m
onito
ring
and
com
plia
nce
syst
em in
pub
lic e
ntiti
es p
rovi
ded
100%
100%
100%
100%
100%
3.4.
7Pe
rcen
tage
of B
udge
t Fac
ility
on
Infra
stru
ctur
e (B
FI) p
roje
cts
eval
uate
d10
0%10
0%10
0%10
0%10
0%
Stra
tegi
c O
bjec
tive
3.5:
Coo
rdin
atin
g in
tern
atio
nal d
evel
opm
ent c
oope
ratio
n
3.5.
1Pe
rcen
tage
alig
nmen
t of d
evel
opm
ent c
oope
ratio
n to
go
vern
men
t pol
icy
and
prio
ritie
s10
0%10
0%10
0%10
0%10
0%
3.5.
2Pe
rcen
tage
man
agem
ent a
nd c
oord
inat
ion
of d
evel
opm
ent
coop
erat
ion
in S
outh
Afri
ca10
0%10
0%10
0%10
0%10
0%

54
Nat
iona
l Tre
asur
y | A
nnua
l Per
form
ance
Pla
n | 2
018/
19
PART B: PROGRAMME AND SUB-PROGRAMME PLANS - Continued
4.6.
Pro
gram
me
Perf
orm
ance
Indi
cato
r Qua
rter
ly T
arge
ts fo
r 201
8/19
- co
ntin
ued
PERF
ORM
AN
CE IN
DIC
ATO
R20
18/1
9A
NN
UA
L TA
RGET
SQ
UA
RTER
1Q
UA
RTER
2Q
UA
RTER
3Q
UA
RTER
4
Stra
tegi
c O
bjec
tive
3.6:
Coo
rdin
atin
g in
terg
over
nmen
tal r
elat
ions
3.6.
1N
umbe
r of D
ivis
ion
of R
even
ue a
nd D
ivis
ion
of R
even
ue
Am
endm
ent B
ills
publ
ishe
d an
nual
ly2
N/A
N/A
11
3.6.
2N
umbe
r of r
efor
ms
intr
oduc
ed to
enh
ance
pro
vinc
ial a
nd lo
cal
gove
rnm
ent fi
scal
fram
ewor
ks2
N/A
N/A
N/A
2
3.6.
3N
umbe
r of p
lans
ass
esse
d to
sup
port
impr
ovem
ents
in
infra
stru
ctur
e pl
anni
ng a
nd im
plem
enta
tion
in p
rovi
nces
36N
/AN
/A36
N/A
3.6.
4N
umbe
r of b
uilt
envi
ronm
ent p
erfo
rman
ce p
lans
ass
esse
d to
su
ppor
t im
prov
emen
t in
the
met
ropo
litan
mun
icip
aliti
es
88
N/A
N/A
N/A
3.6.
5N
umbe
r of c
apac
ity b
uild
ing
initi
ativ
es to
faci
litat
e im
prov
ed
plan
ning
, bud
getin
g an
d fin
anci
al m
anag
emen
t50
209
912
3.6.
6N
umbe
r of q
uart
erly
fina
ncia
l rep
orts
pub
lishe
d 8
22
22
3.6.
7N
umbe
r of p
rovi
ncia
l and
mun
icip
al b
udge
ting
benc
hmar
king
ex
erci
ses
held
to im
prov
e pr
ovin
cial
and
mun
icip
al b
udge
t cr
edib
ility
, com
posi
tion
and
achi
evab
ility
3517
09
9
3.6.
8N
umbe
r of a
nnua
l mun
icip
al ro
utin
e re
port
s pu
blis
hed
61
04
1
3.6.
9N
umbe
r of s
uppo
rt in
itiat
ives
impl
emen
ted
in p
rovi
nces
13
N/A
N/A
49
3.6.
10N
umbe
r of m
unic
ipal
bud
getin
g an
d re
port
ing
refo
rms
impl
emen
ted
3N
/AN
/AN
/A3
3.6.
11N
umbe
r of p
rovi
ncia
l and
mun
icip
al m
id-y
ear b
udge
t and
ex
pend
iture
per
form
ance
ass
essm
ent r
epor
ts p
rodu
ced
260
90
17

55
Nat
iona
l Tre
asur
y | A
nnua
l Per
form
ance
Pla
n | 2
018/
19
PART B: PROGRAMME AND SUB-PROGRAMME PLANS - Continued4.
7. E
xpen
ditu
re T
rend
s an
d Es
timat
es
Publ
ic F
inan
ce a
nd B
udge
t Man
agem
ent e
xpen
ditu
re tr
ends
and
est
imat
es b
y su
b-pr
ogra
mm
e an
d ec
onom
ic c
lass
ifica
tion
Sub-
prog
ram
me
Aud
ited
outc
ome
Adj
uste
dap
prop
riat
ion
Aver
age
grow
thra
te (%
)
Aver
age:
expe
n-di
ture
/To
tal (
%)
Med
ium
term
exp
endi
ture
estim
ate
Aver
age
grow
thra
te (%
)
Aver
age:
xpen
-di
ture
/to
tal (
%)
R m
illio
n 2
014/
15
201
5/16
20
16/1
7 2
017/
18
201
4/15
- 20
17/1
8 2
018/
19
201
9/20
2
020/
21
201
7/18
- 20
20/2
1
Prog
ram
me
Man
agem
ent f
or P
ublic
Fi
nanc
e an
d Bu
dget
Man
agem
ent
20.6
17.9
21.4
24.1
5.3%
7.7%
26.6
27.9
29.9
7.4%
8.8%
Publ
ic F
inan
ce52
.359
.256
.663
.26.
5%21
.2%
57.6
61.4
65.7
1.3%
20.1
%
Budg
et O
ffice
and
Coo
rdin
atio
n53
.255
.457
.059
.63.
9%20
.6%
59.0
63.3
68.1
4.5%
20.3
%
Inte
rgov
ernm
enta
l Rel
atio
ns73
.889
.010
2.0
105.
512
.6%
33.9
%95
.010
1.7
109.
21.
2%33
.4%
Fina
ncia
l and
Fis
cal C
omm
issi
on45
.341
.244
.850
.63.
8%16
.7%
51.8
54.7
57.7
4.4%
17.4
%
Tota
l 24
5.3
262.
628
1.8
303.
07.
3%10
0.0%
290.
130
8.9
330.
52.
9%10
0.0%
Cha
nge
to 2
017
Budg
et e
stim
ate
16
.9(1
.1)
(1.5
)(1
.4)
Econ
omic
cla
ssifi
catio
n
Curr
ent p
aym
ents
198.
421
8.7
235.
025
0.3
8.0%
82.6
%23
6.1
252.
327
0.5
2.6%
81.9
%
Com
pens
atio
n of
em
ploy
ees
175.
119
2.3
201.
921
8.9
7.7%
72.1
%20
4.1
219.
123
5.7
2.5%
71.2
%
Goo
ds a
nd s
ervi
ces
23.3
26.4
33.1
31.4
10.4
%10
.4%
32.0
33.2
34.8
3.5%
10.7
%
of w
hich
:
Burs
arie
s: Em
ploy
ees
0.7
0.8
0.6
1.2
19.3
%0.
3%1.
61.
61.
47.
3%0.
5%
Cons
ulta
nts:
Busin
ess a
nd a
dviso
ry
serv
ices
4.4
6.8
14.2
8.6
24.7
%3.
1%8.
07.
98.
0-2
.2%
2.6%
Cons
umab
les:
Stat
ione
ry, p
rintin
g an
d offi
ce su
pplie
s5.
85.
72.
17.
16.
6%1.
9%7.
57.
98.
97.
9%2.
5%
Ope
ratin
g le
ases
0.6
0.6
0.9
1.0
18.8
%0.
3%1.
11.
11.
14.
2%0.
3%
Trav
el a
nd su
bsist
ence
7.9
7.8
8.3
9.2
5.2%
3.0%
9.5
10.0
10.4
4.5%
3.2%
Trai
ning
and
dev
elop
men
t0.
40.
20.
50.
827
.7%
0.2%
0.9
1.0
1.0
5.6%
0.3%
Tran
sfer
s an
d su
bsid
ies
45.5
42.7
45.2
51.0
3.9%
16.9
%51
.854
.757
.74.
2%17
.5%
Dep
artm
enta
l age
ncie
s an
d ac
coun
ts45
.341
.244
.850
.63.
8%16
.7%
51.8
54.7
57.7
4.4%
17.4
%
Hou
seho
lds
0.2
1.5
0.4
0.3
20.3
%0.
2% –
–
–
-1
00.0
% –
Paym
ents
for c
apita
l ass
ets
1.3
1.1
1.5
1.8
10.7
%0.
5%2.
22.
02.
38.
2%0.
7%

56
Nat
iona
l Tre
asur
y | A
nnua
l Per
form
ance
Pla
n | 2
018/
19
PART B: PROGRAMME AND SUB-PROGRAMME PLANS - Continued
4.7.
Exp
endi
ture
Tre
nds
and
Estim
ates
Publ
ic F
inan
ce a
nd B
udge
t Man
agem
ent e
xpen
ditu
re tr
ends
and
est
imat
es b
y su
b-pr
ogra
mm
e an
d ec
onom
ic c
lass
ifica
tion
Sub-
prog
ram
me
Aud
ited
outc
ome
Adj
uste
dap
prop
riat
ion
Aver
age
grow
thra
te (%
)
Aver
age:
expe
n-di
ture
/To
tal (
%)
Med
ium
term
exp
endi
ture
estim
ate
Aver
age
grow
thra
te (%
)
Aver
age:
xpen
-di
ture
/to
tal (
%)
R m
illio
n 2
014/
15
201
5/16
20
16/1
7 2
017/
18
201
4/15
- 20
17/1
8 2
018/
19
201
9/20
2
020/
21
201
7/18
- 20
20/2
1
Mac
hine
ry a
nd e
quip
men
t1.
31.
11.
51.
810
.7%
0.5%
2.2
2.0
2.3
8.2%
0.7%
Paym
ents
for fi
nanc
ial a
sset
s0.
00.
10.
0 –
-1
00.0
% –
–
–
–
–
–
Tota
l 24
5.3
262.
628
1.8
303.
07.
3%10
0.0%
290.
130
8.9
330.
52.
9%10
0.0%
Prop
ortio
n of
tota
l pro
gram
me
expe
nditu
re to
vot
e ex
pend
iture
0.9%
0.9%
1.0%
0.7%
–
–
1.0%
1.0%
1.0%
–
–
Det
ails
of t
rans
fers
and
sub
sidi
es
Hou
seho
lds
Soci
al b
enefi
ts
Curr
ent
0.0
1.4
0.1
0.1
8.7%
0.1%
–
–
–
-100
.0%
–
Empl
oyee
soc
ial b
enefi
ts0.
01.
40.
10.
18.
7%0.
1% –
–
–
-1
00.0
% –
Dep
artm
enta
l age
ncie
s an
d ac
coun
ts
Dep
artm
enta
l age
ncie
s (n
on-b
usin
ess
entit
ies)
Curr
ent
45.3
41.2
44.8
50.6
3.8%
16.7
%51
.854
.757
.74.
4%17
.4%
Fina
ncia
l and
Fis
cal C
omm
issi
on45
.341
.244
.850
.63.
8%16
.7%
51.8
54.7
57.7
4.4%
17.4
%

57
Nat
iona
l Tre
asur
y | A
nnua
l Per
form
ance
Pla
n | 2
018/
19
PART B: PROGRAMME AND SUB-PROGRAMME PLANS - Continued4.
8. P
erso
nnel
info
rmat
ion
Num
ber o
f pos
ts e
stim
ated
for 3
1 M
arch
201
8Pu
blic
Fin
ance
and
Bud
get M
anag
emen
t per
sonn
el n
umbe
rs a
nd c
ost b
y sa
lary
leve
l¹N
umbe
r
Num
ber a
nd c
ost2
of p
erso
nnel
pos
ts fi
lled
/ pla
nned
for o
n fu
nded
est
ablis
hmen
t
Num
ber o
ffu
nded
post
s
Num
ber o
f po
sts
addi
tiona
l to
the
esta
blis
hmen
t
Act
ual
Revi
sed
estim
ate
Med
ium
term
exp
endi
ture
est
imat
eAv
erag
egr
owth
rate
(%)
Aver
age:
sa
lary
leve
l/to
tal (
%)
2016
/17
2017
/18
2018
/19
2019
/20
2020
/21
2017
/18
- 202
0/21
Publ
ic F
inan
ce a
nd B
udge
t M
anag
emen
tN
umbe
rCo
stU
nit
cost
N
umbe
rCo
stU
nit
cost
N
umbe
rCo
stU
nit
cost
N
umbe
rCo
stU
nit
cost
N
umbe
rCo
stU
nit
cost
Sala
ry
leve
l27
81
272
201.
90.
727
721
8.9
0.8
241
204.
10.
824
021
9.1
0.9
241
235.
71.
0-4
.5%
100.
0%
1 –
63
12
0.4
0.2
51.
10.
25
1.2
0.2
51.
30.
36
1.6
0.3
6.3%
2.1%
7 –
1082
–
8536
.70.
483
38.6
0.5
7135
.50.
570
37.9
0.5
6940
.10.
6-6
.0%
29.3
%
11 –
12
106
–
9873
.20.
710
585
.40.
895
83.4
0.9
9590
.00.
996
98.2
1.0
-2.9
%39
.1%
13 –
16
87 –
87
91.6
1.1
8493
.81.
170
84.1
1.2
7089
.91.
370
95.7
1.4
-5.9
%29
.4%
1. D
ata
has b
een
prov
ided
by
the
depa
rtm
ent a
nd m
ay n
ot n
eces
saril
y re
conc
ile w
ith o
ffici
al g
over
nmen
t per
sonn
el d
ata.
2. R
and
mill
ion.
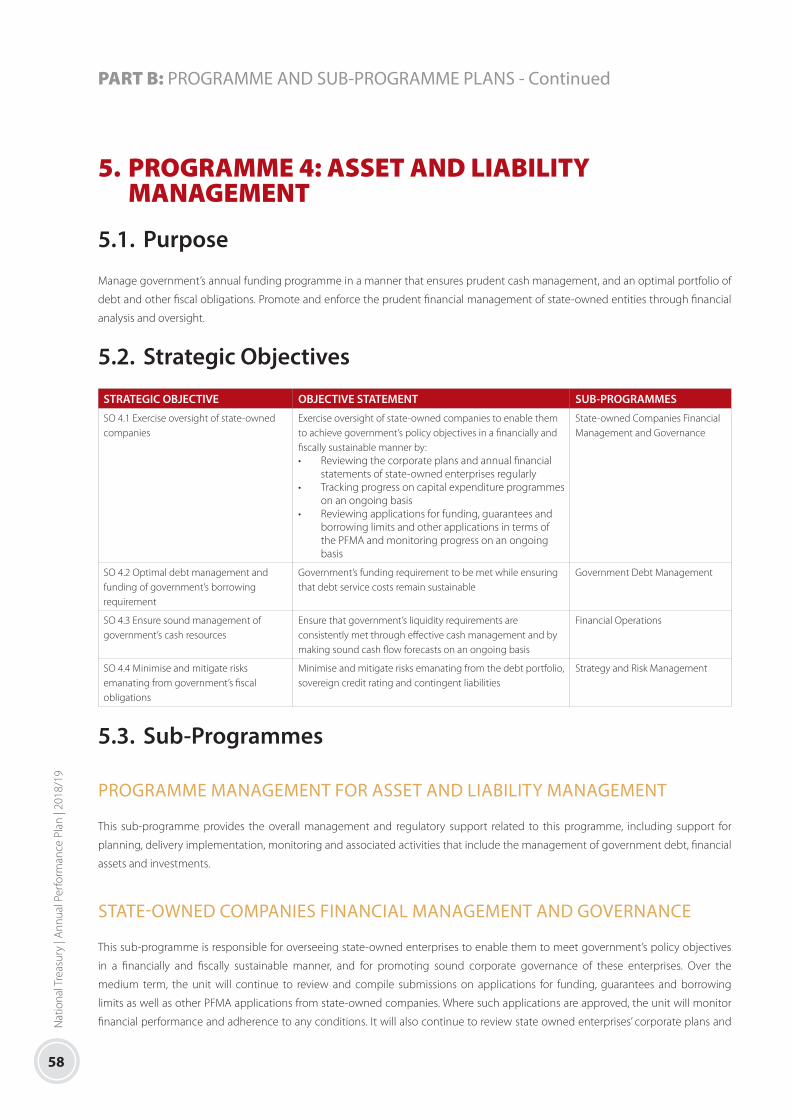
58
Nat
iona
l Tre
asur
y | A
nnua
l Per
form
ance
Pla
n | 2
018/
19
PART B: PROGRAMME AND SUB-PROGRAMME PLANS - Continued
5. PROGRAMME 4: ASSET AND LIABILITY MANAGEMENT
5.1. Purpose
Manage government’s annual funding programme in a manner that ensures prudent cash management, and an optimal portfolio of
debt and other fiscal obligations. Promote and enforce the prudent financial management of state-owned entities through financial
analysis and oversight.
5.2. Strategic Objectives
STRATEGIC OBJECTIVE OBJECTIVE STATEMENT SUB-PROGRAMMES
SO 4.1 Exercise oversight of state-owned companies
Exercise oversight of state-owned companies to enable them to achieve government’s policy objectives in a financially and fiscally sustainable manner by:• Reviewing the corporate plans and annual financial
statements of state-owned enterprises regularly• Tracking progress on capital expenditure programmes
on an ongoing basis• Reviewing applications for funding, guarantees and
borrowing limits and other applications in terms of the PFMA and monitoring progress on an ongoing basis
State-owned Companies Financial Management and Governance
SO 4.2 Optimal debt management and funding of government’s borrowing requirement
Government’s funding requirement to be met while ensuring that debt service costs remain sustainable
Government Debt Management
SO 4.3 Ensure sound management of government’s cash resources
Ensure that government’s liquidity requirements are consistently met through effective cash management and by making sound cash flow forecasts on an ongoing basis
Financial Operations
SO 4.4 Minimise and mitigate risks emanating from government’s fiscal obligations
Minimise and mitigate risks emanating from the debt portfolio, sovereign credit rating and contingent liabilities
Strategy and Risk Management
5.3. Sub-Programmes
PROGRAMME MANAGEMENT FOR ASSET AND LIABILITY MANAGEMENT
This sub-programme provides the overall management and regulatory support related to this programme, including support for
planning, delivery implementation, monitoring and associated activities that include the management of government debt, financial
assets and investments.
STATE-OWNED COMPANIES FINANCIAL MANAGEMENT AND GOVERNANCE
This sub-programme is responsible for overseeing state-owned enterprises to enable them to meet government’s policy objectives
in a financially and fiscally sustainable manner, and for promoting sound corporate governance of these enterprises. Over the
medium term, the unit will continue to review and compile submissions on applications for funding, guarantees and borrowing
limits as well as other PFMA applications from state-owned companies. Where such applications are approved, the unit will monitor
financial performance and adherence to any conditions. It will also continue to review state owned enterprises’ corporate plans and

59
Nat
iona
l Tre
asur
y | A
nnua
l Per
form
ance
Pla
n | 2
018/
19
PART B: PROGRAMME AND SUB-PROGRAMME PLANS - Continued
annual reports as they are received annually, and progress on the enterprises’ capital expenditure programmes will be monitored on
a quarterly basis. To strengthen regulatory compliance, the unit will report on compliance by major state-owned companies with the
PFMA, the Companies Act (2008), Treasury Regulations and the King III and IV Code on Corporate Governance.
GOVERNMENT DEBT MANAGEMENT
This sub-programme is responsible for government’s long term funding needs. It manages the funding of domestic and foreign debt,
contributes to the development of domestic financial markets, maintains sound investor relations, and ensures that debt servicing
costs remain sustainable.
FINANCIAL OPERATIONS
This sub-programme provides for government’s short term funding needs, invests government’s surplus cash, prudently manages
cash in all spheres of government, and ensures efficient accounting for debt, the supply of reliable systems, and the provision of high-
quality information.
STRATEGY AND RISK MANAGEMENT
This sub-programme develops and maintains a risk management framework for the debt and contingent liabilities of government and
monitors the implementation of strategies to ensure that risks remain within tolerance thresholds and that the risk of an adverse credit
rating outcome for the sovereign credit rating is mitigated.
FINANCIAL INVESTMENTS
This sub-programme provides for the transfer of funding to meet the needs of state-owned entities such as the re-capitalisation of the
Land and Agricultural Development Bank of South Africa, Postbank and the Development Bank of Southern Africa.

60
Nat
iona
l Tre
asur
y | A
nnua
l Per
form
ance
Pla
n | 2
018/
19
PART B: PROGRAMME AND SUB-PROGRAMME PLANS - Continued
5.4.
Str
ateg
ic P
lan
Obj
ectiv
e A
nnua
l and
Med
ium
Term
Targ
ets
PERF
ORM
AN
CE IN
DIC
ATO
RAU
DIT
ED/A
CTU
AL
PERF
ORM
AN
CEES
TIM
AED
PE
RFO
RMA
NCE
PLA
NN
ED
PERF
ORM
AN
CE
CURR
ENT
YEA
R
MED
IUM
TER
M T
ARG
ETS
(MTE
F)
2014
/15
2015
/16
2016
/17
2017
/18
2018
/19
2019
/20
2020
/21
2021
/22
2022
/23
2023
/24
Stra
tegi
c O
bjec
tive
4.1:
Exe
rcis
e ov
ersi
ght o
f sta
te-o
wne
d co
mpa
nies
4.1
Perc
enta
ge o
f ove
rsig
ht o
f sta
te-o
wne
d co
mpa
nies
repo
rts
##
#10
0%10
0%10
0%10
0%10
0%10
0%10
0%
Stra
tegi
c O
bjec
tive
4.2:
Opt
imal
deb
t man
agem
ent a
nd fu
ndin
g of
gov
ernm
ent b
orro
win
g re
quire
men
t
4.2
Perc
enta
ge o
f opt
imal
deb
t man
agem
ent
and
fund
ing
of g
over
nmen
t bor
row
ing
requ
irem
ents
met
25
##
#10
0%10
0%10
0%10
0%10
0%10
0%10
0%
Stra
tegi
c O
bjec
tive
4.3:
Ens
ure
soun
d m
anag
emen
t of g
over
nmen
t’s c
ash
reso
urce
s
4.3
Perc
enta
ge o
f gov
ernm
ent’s
liqu
idity
re
quire
men
ts m
et#
##
#10
0%10
0%10
0%10
0%10
0%10
0%
Stra
tegi
c O
bjec
tive
4.4:
Min
imis
e an
d m
itiga
te ri
sks
eman
atin
g fr
om g
over
nmen
t’s fi
scal
obl
igat
ions
4.4
Num
ber o
f rep
orts
on
the
man
agem
ent
of g
over
nmen
t’s c
ontin
gent
liab
ilitie
s an
d co
unte
rpar
ty ri
sk
##
##
66
66
66

61
Nat
iona
l Tre
asur
y | A
nnua
l Per
form
ance
Pla
n | 2
018/
19
PART B: PROGRAMME AND SUB-PROGRAMME PLANS - Continued5.
5. P
ogra
mm
e Pe
rfor
man
ce In
dica
tors
and
Ann
ual T
arge
ts
PERF
ORM
AN
CE IN
DIC
ATO
RAU
DIT
ED/A
CTU
AL
PERF
ORM
AN
CEES
TIM
ATED
PE
RFO
RMA
NCE
PLA
NN
ED
PERF
ORM
AN
CE
CURR
ENT
YEA
R
MED
IUM
TER
M T
ARG
ETS
(MTE
F)
2014
/15
2015
/16
2016
/17
2017
/18
2018
/19
2019
/20
2020
/21
2021
/22
Stra
tegi
c O
bjec
tive
4.1:
Exe
rcis
e ov
ersi
ght o
f sta
te-o
wne
d co
mpa
nies
4.1.
1Pe
rcen
tage
of c
ompl
ete
corp
orat
e pl
ans
rece
ived
from
Sch
edul
e 2
and
3B
publ
ic e
ntiti
es re
view
ed 26
N/A
N/A
32%
10
0%10
0%10
0%10
0%10
0%
4.1.
2Pe
rcen
tage
of a
nnua
l rep
orts
rece
ived
from
Sch
edul
e 2
and
3B p
ublic
en
titie
s re
view
ed27
N/A
N/A
53%
100%
100%
100%
100%
100%
4.1.
3Pe
rcen
tage
of c
ompl
ete
PFM
A S
ectio
n 54
(2),
52, 5
5 an
d 92
app
licat
ions
re
ceiv
ed fr
om S
ched
ule
2 an
d 3B
pub
lic e
ntiti
es re
view
ed28
N/A
N/A
100%
100%
100%
100%
100%
100%
4.1.
4Pe
rcen
tage
of c
ompl
ete
guar
ante
e ap
plic
atio
ns re
ceiv
ed fr
om S
ched
ule
2 an
d 3B
pub
lic e
ntiti
es re
view
ed29
N/A
N/A
100%
100%
100%
100%
100%
100%
4.1.
5Pe
rcen
tage
of r
ecei
ved
MFM
A s
ubm
issi
ons
rela
ting
to ta
riff a
djus
tmen
ts
rece
ived
from
Sch
edul
e 2
and
3B p
ublic
ent
ities
revi
ewed
30
N/A
N/A
100%
100%
100%
100%
100%
100%
4.1.
6Pe
rcen
tage
of c
ompl
ete
rem
uner
atio
n re
view
requ
ests
of e
xecu
tive
and
non-
exec
utiv
e di
rect
ors
rece
ived
from
Sch
edul
e 2
and
3B p
ublic
ent
ities
re
port
ing
to th
e M
inis
ter o
f Fin
ance
revi
ewed
31
##
110
0%10
0%10
0%10
0%10
0%
4.1.
7Pe
rcen
tage
of c
ompl
ete
boar
d ap
poin
tmen
ts re
com
men
datio
ns fr
om
Sche
dule
2 a
nd 3
B pu
blic
ent
ities
repo
rtin
g to
the
Min
iste
r of F
inan
ce
rece
ived
and
revi
ewed
32
##
110
0%10
0%10
0%10
0%10
0%
4.1.
8Pe
rcen
tage
of c
ompl
ete
revi
ew re
ques
ts o
f bor
row
ing
limit
appl
icat
ions
re
latin
g to
Sch
edul
e 2
and
3B p
ublic
ent
ities
revi
ewed
N
/AN
/A10
0%10
0%10
0%10
0%10
0%10
0%

62
Nat
iona
l Tre
asur
y | A
nnua
l Per
form
ance
Pla
n | 2
018/
19
PART B: PROGRAMME AND SUB-PROGRAMME PLANS - Continued
5.5.
Pog
ram
me
Perf
orm
ance
Indi
cato
rs a
nd A
nnua
l Tar
gets
- co
ntun
ued
PERF
ORM
AN
CE IN
DIC
ATO
RAU
DIT
ED/A
CTU
AL
PERF
ORM
AN
CEES
TIM
ATED
PE
RFO
RMA
NCE
PLA
NN
ED
PERF
ORM
AN
CE
CURR
ENT
YEA
R
MED
IUM
TER
M T
ARG
ETS
(MTE
F)
2014
/15
2015
/16
2016
/17
2017
/18
2018
/19
2019
/20
2020
/21
2021
/22
Stra
tegi
c O
bjec
tive
4.2:
Opt
imal
deb
t man
agem
ent a
nd fu
ndin
g of
gov
ernm
ent b
orro
win
g re
quire
men
t
4.2.
1 P
erce
ntag
e of
gov
ernm
ent’s
ann
ual
gros
s bo
rrow
ing
requ
irem
ent m
etN
/AN
/A10
0%10
0%10
0%10
0%10
0%10
0%
4.2.
2Pe
rcen
tage
of i
nter
est a
nd re
dem
ptio
ns m
etN
/AN
/A10
0%10
0%10
0%10
0%10
0%10
0%
Stra
tegi
c O
bjec
tive
4.3:
Ens
ure
soun
d m
anag
emen
t of g
over
nmen
t’s c
ash
reso
urce
s
4.3.
1Pe
rcen
tage
of g
over
nmen
t’s li
quid
ity re
quire
men
ts m
etN
/AN
/A10
0%10
0%10
0%10
0%10
0%10
0%
Stra
tegi
c O
bjec
tive
4.4:
Min
imis
e an
d m
itiga
te ri
sks
eman
atin
g fr
om g
over
nmen
t’s fi
scal
obl
igat
ions
4.4.
1Pe
rcen
tage
com
plia
nce
with
mar
ket a
nd re
finan
cing
risk
s be
nchm
arks
N/A
N/A
100%
100%
100%
100%
100%
100%
4.4.
2N
umbe
r of i
nter
actio
ns to
man
age
and
ensu
re e
ffect
ive
rela
tions
with
the
cred
it ra
ting
agen
cies
##
6N
/A8
88
8
4.4.
3N
umbe
r of r
epor
ts o
n th
e m
anag
emen
t of g
over
nmen
t’s c
ontin
gent
lia
bilit
ies
and
coun
terp
arty
risk
##
5N
/A6
66
6

63
Nat
iona
l Tre
asur
y | A
nnua
l Per
form
ance
Pla
n | 2
018/
19
PART B: PROGRAMME AND SUB-PROGRAMME PLANS - Continued5.
6. P
rogr
amm
e Pe
rfor
man
ce In
dica
tor Q
uart
erly
Tar
gets
for 2
018/
19
PERF
ORM
AN
CE IN
DIC
ATO
R20
18/1
9A
NN
UA
L TA
RGET
S
QU
ART
ER 1
QU
ART
ER 2
QU
ART
ER 3
QU
ART
ER 4
Stra
tegi
c O
bjec
tive
4.1:
Exe
rcis
e ov
ersi
ght o
f sta
te-o
wne
d co
mpa
nies
4.1.
1Pe
rcen
tage
of c
ompl
ete
corp
orat
e pl
ans
rece
ived
from
Sch
edul
e 2
and
3B p
ublic
ent
ities
re
view
ed
100%
100%
100%
N/A
N/A
4.1.
2Pe
rcen
tage
of a
nnua
l rep
orts
rece
ived
from
Sch
edul
e 2
and
3B p
ublic
ent
ities
revi
ewed
10
0%10
0%N
/A
100%
N/A
4.1.
3Pe
rcen
tage
of c
ompl
ete
PFM
A S
ectio
n 54
(2),
52, 5
5 an
d 92
app
licat
ions
rece
ived
from
Sc
hedu
le 2
and
3B
publ
ic e
ntiti
es re
view
ed
100%
100%
100%
100%
100%
4.1.
4Pe
rcen
tage
of c
ompl
ete
guar
ante
e ap
plic
atio
ns re
ceiv
ed fr
om S
ched
ule
2 an
d 3B
pub
lic
entit
ies
revi
ewed
100%
N/A
N/A
100%
N/A
4.1.
5Pe
rcen
tage
of r
ecei
ved
MFM
A s
ubm
issi
ons
rela
ting
to ta
riff a
djus
tmen
ts re
ceiv
ed fr
om
Sche
dule
2 a
nd 3
B pu
blic
ent
ities
revi
ewed
100%
N/A
N/A
N/A
100%
4.1.
6Pe
rcen
tage
of c
ompl
ete
rem
uner
atio
n re
view
requ
ests
of e
xecu
tive
and
non-
exec
utiv
e di
rect
ors
rece
ived
from
Sch
edul
e 2
and
3B p
ublic
ent
ities
repo
rtin
g to
the
Min
iste
r of F
inan
ce
revi
ewed
100%
100%
100%
100%
100%
4.1.
7Pe
rcen
tage
of c
ompl
ete
boar
d ap
poin
tmen
ts re
com
men
datio
ns fr
om S
ched
ule
2 an
d 3B
pu
blic
ent
ities
repo
rtin
g to
the
Min
iste
r of F
inan
ce re
ceiv
ed a
nd re
view
ed
100%
100%
100%
100%
100%
4.1.
8Pe
rcen
tage
of c
ompl
ete
revi
ew re
ques
ts o
f bor
row
ing
limit
appl
icat
ions
rela
ting
to S
ched
ule
2 an
d 3B
pub
lic e
ntiti
es re
view
ed10
0%10
0%10
0%10
0%10
0%
Stra
tegi
c O
bjec
tive
4.2:
Opt
imal
deb
t man
agem
ent a
nd fu
ndin
g of
gov
ernm
ent b
orro
win
g re
quire
men
t
4.2.
1Pe
rcen
tage
of g
over
nmen
t’s a
nnua
l gro
ss b
orro
win
g re
quire
men
t met
100%
100%
100%
100%
100%
4.2.
2Pe
rcen
tage
of i
nter
est a
nd re
dem
ptio
ns m
et10
0%10
0%10
0%10
0%10
0%
Stra
tegi
c O
bjec
tive
4.3:
Ens
ure
soun
d m
anag
emen
t of g
over
nmen
t’s c
ash
reso
urce
s
4.3.
1Pe
rcen
tage
of g
over
nmen
t’s li
quid
ity re
quire
men
ts m
et10
0%10
0%10
0%10
0%10
0%
Stra
tegi
c O
bjec
tive
4.4:
Min
imis
e an
d m
itiga
te ri
sks
eman
atin
g fr
om g
over
nmen
t’s fi
scal
obl
igat
ions
4.4.
1Pe
rcen
tage
com
plia
nce
with
mar
ket a
nd re
finan
cing
risk
s be
nchm
arks
100%
100%
100%
100%
100%
4.4.
2N
umbe
r of i
nter
actio
ns to
man
age
and
ensu
re e
ffect
ive
rela
tions
with
the
cred
it ra
ting
agen
cies
82
23
1
4.4.
3N
umbe
r of r
epor
ts o
n th
e m
anag
emen
t of g
over
nmen
t’s c
ontin
gent
liab
ilitie
s an
d co
unte
rpar
ty ri
sk6
12
21

64
Nat
iona
l Tre
asur
y | A
nnua
l Per
form
ance
Pla
n | 2
018/
19
PART B: PROGRAMME AND SUB-PROGRAMME PLANS - Continued
5.7.
Exp
endi
ture
Tre
nds
and
Estim
ates
Ass
et a
nd L
iabi
lity
Man
agem
ent e
xpen
ditu
re tr
ends
and
est
imat
es b
y su
b-pr
ogra
mm
e an
d ec
onom
ic c
lass
ifica
tion
Sub-
prog
ram
me
Aud
ited
outc
ome
Adj
uste
dap
prop
riat
ion
Aver
age
grow
thra
te (%
)
Aver
age:
expe
n-di
ture
/to
tal (
%)
Med
ium
term
exp
endi
ture
estim
ate
Aver
age
grow
thra
te (%
)
Aver
age:
expe
n-di
ture
/to
tal (
%)
R m
illio
n 2
014/
15
201
5/16
2
016/
17
201
7/18
2
014/
15 -
2017
/18
201
8/19
2
019/
20
202
0/21
2
017/
18 -
2020
/21
Prog
ram
me
Man
agem
ent f
or A
sset
an
d Li
abili
ty M
anag
emen
t12
.09.
224
.412
.51.
5%0.
4%20
.915
.717
.010
.8%
0.6%
Stat
e O
wne
d En
tity
Fina
ncia
l M
anag
emen
t and
Gov
erna
nce
29.2
30.8
33.5
10 0
35.1
600.
7%61
.1%
34.2
36.8
39.4
-84.
2%97
.2%
Gov
ernm
ent D
ebt M
anag
emen
t19
.319
.418
.818
.6-1
.2%
0.5%
19.4
20.8
22.3
6.1%
0.8%
Fina
ncia
l Ope
ratio
ns20
.021
.022
.522
.43.
9%0.
5%24
.325
.927
.67.
2%1.
0%
Stra
tegy
and
Ris
k M
anag
emen
t9.
09.
810
.911
.79.
3%0.
2%11
.612
.313
.24.
0%0.
5%
Fina
ncia
l Inv
estm
ents
3 00
0.0
3 17
4.0
–
–
-100
.0%
37.3
% –
–
–
–
–
Tota
l 3
089.
43
264.
311
0.1
10 1
00.3
48.4
%10
0.0%
110.
411
1.5
119.
4-7
7.2%
100.
0%
Cha
nge
to 2
017
Budg
et e
stim
ate
9
998.
0(2
9.0)
1.0
1.1
Econ
omic
cla
ssifi
catio
n
Curr
ent p
aym
ents
88.9
89.1
108.
996
.82.
9%2.
3%10
9.9
110.
811
8.6
7.0%
4.2%
Com
pens
atio
n of
em
ploy
ees
69.3
72.1
77.0
78.5
4.2%
1.8%
78.7
84.5
91.2
5.1%
3.2%
Goo
ds a
nd s
ervi
ces
19.6
17.1
31.9
18.3
-2.2
%0.
5%31
.226
.227
.414
.4%
1.0%
of w
hich
:
Audi
t cos
ts: E
xter
nal
0.5
0.5
0.6
0.7
6.6%
–
0.7
0.7
0.7
3.3%
–
Burs
arie
s: Em
ploy
ees
0.6
0.6
0.6
1.0
21.5
% –
1.
41.
31.
26.
3% –
Com
pute
r ser
vice
s9.
69.
513
.18.
1-5
.5%
0.2%
11.6
12.3
12.9
16.9
%0.
4%
Cons
ulta
nts:
Busin
ess a
nd a
dviso
ry
serv
ices
4.9
2.2
14.1
2.9
-16.
1%0.
1%11
.45.
65.
926
.8%
0.2%
Trav
el a
nd su
bsist
ence
1.7
2.3
2.1
3.3
24.7
%0.
1%3.
43.
63.
84.
8%0.
1%
Trai
ning
and
dev
elop
men
t0.
40.
40.
40.
717
.6%
–
0.8
0.8
0.8
5.0%
–
Tran
sfer
s an
d su
bsid
ies
0.2
0.9
0.5
0.2
-1.3
% –
–
–
–
-1
00.0
% –
Hou
seho
lds
0.2
0.9
0.5
0.2
-1.3
% –
–
–
–
-1
00.0
% –

65
Nat
iona
l Tre
asur
y | A
nnua
l Per
form
ance
Pla
n | 2
018/
19
PART B: PROGRAMME AND SUB-PROGRAMME PLANS - Continued5.
7. E
xpen
ditu
re T
rend
s an
d Es
timat
es -
cont
inue
dA
sset
and
Lia
bilit
y M
anag
emen
t exp
endi
ture
tren
ds a
nd e
stim
ates
by
sub-
prog
ram
me
and
econ
omic
cla
ssifi
catio
n
Sub-
prog
ram
me
Aud
ited
outc
ome
Adj
uste
dap
prop
riat
ion
Aver
age
grow
thra
te (%
)
Aver
age:
expe
n-di
ture
/to
tal (
%)
Med
ium
term
exp
endi
ture
estim
ate
Aver
age
grow
thra
te (%
)
Aver
age:
expe
n-di
ture
/to
tal (
%)
R m
illio
n 2
014/
15
201
5/16
2
016/
17
201
7/18
2
014/
15 -
2017
/18
201
8/19
2
019/
20
202
0/21
2
017/
18 -
2020
/21
Paym
ents
for c
apita
l ass
ets
0.3
0.2
0.7
3.3
132.
4% –
0.
50.
70.
8-3
8.1%
0.1%
Mac
hine
ry a
nd e
quip
men
t0.
30.
20.
70.
737
.3%
–
0.5
0.7
0.8
4.9%
–
Soft
war
e an
d ot
her i
ntan
gibl
e as
sets
–
–
–
2.6
–
–
–
–
–
-100
.0%
–
Paym
ents
for fi
nanc
ial a
sset
s3
000.
03
174.
0 –
10
000
.049
.4%
97.6
% –
–
–
-1
00.0
%95
.8%
Tota
l 3
089.
43
264.
311
0.1
10 1
00.3
48.4
%10
0.0%
110.
411
1.5
119.
4-7
7.2%
100.
0%
Prop
ortio
n of
tota
l pro
gram
me
expe
nditu
re to
vot
e ex
pend
iture
11.8
%11
.4%
0.4%
24.9
% –
–
0.
4%0.
4%0.
4% –
–
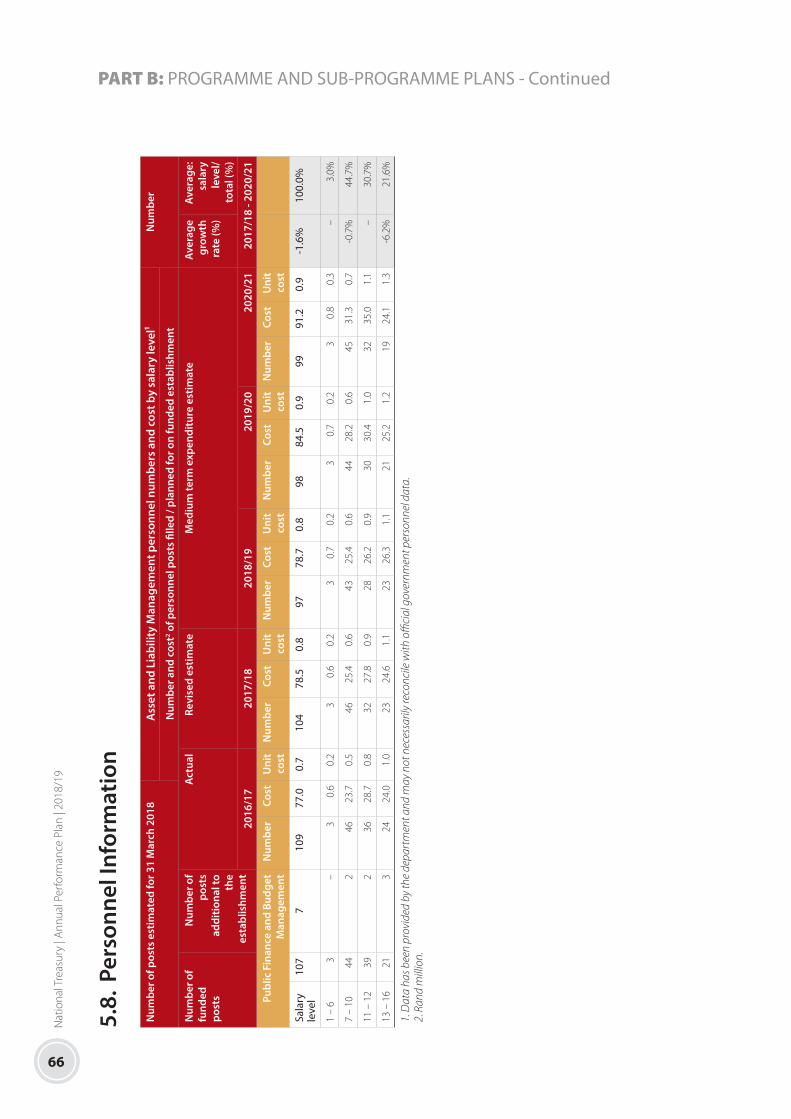
66
Nat
iona
l Tre
asur
y | A
nnua
l Per
form
ance
Pla
n | 2
018/
19
PART B: PROGRAMME AND SUB-PROGRAMME PLANS - Continued
5.8.
Per
sonn
el In
form
atio
n
Num
ber o
f pos
ts e
stim
ated
for 3
1 M
arch
201
8A
sset
and
Lia
bilit
y M
anag
emen
t per
sonn
el n
umbe
rs a
nd c
ost b
y sa
lary
leve
l¹N
umbe
r
Num
ber a
nd c
ost2 o
f per
sonn
el p
osts
fille
d / p
lann
ed fo
r on
fund
ed e
stab
lishm
ent
Num
ber o
ffu
nded
post
s
Num
ber o
f po
sts
addi
tiona
l to
the
esta
blis
hmen
t
Act
ual
Revi
sed
estim
ate
Med
ium
term
exp
endi
ture
est
imat
eAv
erag
egr
owth
rate
(%)
Aver
age:
sa
lary
leve
l/to
tal (
%)
2016
/17
2017
/18
2018
/19
2019
/20
2020
/21
2017
/18
- 202
0/21
Publ
ic F
inan
ce a
nd B
udge
t M
anag
emen
tN
umbe
rCo
stU
nit
cost
N
umbe
rCo
stU
nit
cost
N
umbe
rCo
stU
nit
cost
N
umbe
rCo
stU
nit
cost
N
umbe
rCo
stU
nit
cost
Sala
ry
leve
l10
77
109
77.0
0.7
104
78.5
0.8
9778
.70.
898
84.5
0.9
9991
.20.
9-1
.6%
100.
0%
1 –
63
–
30.
60.
23
0.6
0.2
30.
70.
23
0.7
0.2
30.
80.
3 –
3.
0%
7 –
1044
246
23.7
0.5
4625
.40.
643
25.4
0.6
4428
.20.
645
31.3
0.7
-0.7
%44
.7%
11 –
12
392
3628
.70.
832
27.8
0.9
2826
.20.
930
30.4
1.0
3235
.01.
1 –
30
.7%
13 –
16
213
2424
.01.
023
24.6
1.1
2326
.31.
121
25.2
1.2
1924
.11.
3-6
.2%
21.6
%
1. D
ata
has b
een
prov
ided
by
the
depa
rtm
ent a
nd m
ay n
ot n
eces
saril
y re
conc
ile w
ith o
ffici
al g
over
nmen
t per
sonn
el d
ata.
2. R
and
mill
ion.

67
Nat
iona
l Tre
asur
y | A
nnua
l Per
form
ance
Pla
n | 2
018/
19
PART B: PROGRAMME AND SUB-PROGRAMME PLANS - Continued
6. PROGRAMME 5: FINANCIAL ACCOUNTING AND SUPPLY CHAIN MANAGEMENT SYSTEMS
6.1. Purpose
Facilitate governance and accountability by promoting and enforcing the transparent, economic and effective management of
revenue, expenditure, assets, liabilities and supply chain processes in the public sector.
6.2. Strategic Objectives
STRATEGIC OBJECTIVE OBJECTIVE STATEMENT SUB-PROGRAMMES
SO 5.1 Improve financial management governance and compliance across all spheres and entities in government, giving effect to the PFMA and MFMA
Governance and compliance are continuously improved across all spheres of government by:• Maintaining and enhancing the
legislative framework• Enforcing compliance with public-
sector financial management legislation in each sphere of government
• Providing technical support services to address implementation challenges in financial management, IA and risk management
• Issuing frameworks, guidelines, circulars, treasury instructions and other tools to enable proper implementation of the legislation
• Monitoring and evaluating financial management, IA and risk management across government
• Facilitating and undertaking special investigations and performance audits to improve financial governance and compliance
Financial Management Policy and Compliance Improvement: Office of Accountant-General• Governance Monitoring and Compliance• Municipal Finance Management Act
Implementation• Internal Audit Support and Advisory Services• Risk Management Advisory Services• Technical Support Services• Specialised Audit Services
SO 5.2 Support and facilitate capacity development across all spheres of government in order to improve financial management execution
Research, develop and implement interventions that contribute to improved public finance management (PFM) capacity, capability, and performance in all three spheres of government, through institutional, organisational, individual, and stakeholder development. This includes providing capacity and support on policies relating to accounting and reporting and IA
Financial Reporting for National Accounts and Financial Management: Office of Accountant-General• Policy and Compliance Improvement• Capacity Building• Municipal Finance Improvement Programme• Specialised Audit Services• Internal Audit Support and Advisory Services• Technical Support Services• Accounting Support and Reporting

68
Nat
iona
l Tre
asur
y | A
nnua
l Per
form
ance
Pla
n | 2
018/
19
PART B: PROGRAMME AND SUB-PROGRAMME PLANS - Continued
STRATEGIC OBJECTIVE OBJECTIVE STATEMENT SUB-PROGRAMMES
SO 5.3 Manage existing financial systems and renew these as required to exercise comprehensive financial management
Maintain existing financial systems at a level of 98 per cent availability including the provision of reliable, efficient and effective support and user training over the medium term
Develop and implement the IFMS to replace ageing and fragmented financial, supply chain and HR management systems across national and provincial departments
Office of the Accountant-General• Financial Systems• Integrated Financial Management Systems
SO 5.4 Modernise SCM policies and procedures
Comprehensive review of SCM policies to ensure a simplified and modernised SCM environment in government, including the amendment of processes and procedures in line with the revised policies
Office of the Chief Procurement Officer
SO 5.5 Monitor and evaluate SCM performance
Exercise oversight on compliance with SCM policies, procedures, norms and standards through monitoring: • Published procurement plans• Published deviations and contract
expansions• Bid specifications and procurement
plans against SCM policies and procedures
• Bid evaluation and adjudication to ensure compliance with evaluation criteria/scoring
• Implementation of projects against contract specifications and conditions of tender
Office of the Chief Procurement Officer
SO5.6 Develop and implement strategic procurement
Conduct a collaborative and structured process of critically analysing government’s spend and utilise this information to make better business decisions about acquiring goods and services effectively and efficiently. Strategic procurement will help government to:• Optimise performance• Minimise costs• Improve access to business
opportunities in line with government broader socio-economic objectives
• Increase value per Rand spentThese objectives will be achieved through the publication and implementation of a strategic procurement framework, guidelines and tools • Achieve economies of scale by
collectively contracting for common goods and services
Office of the Chief Procurement Officer
SO5.7 Build and strengthen stakeholder relations
Provide an environment for SCM engagements and for support to stakeholders/clients
Office of the Chief Procurement Officer
SO 5.8 Modernise and automate SCM processes
Modernise ICT to improve SCM performance and reduce the amount of paper used in processing transactions
Office of the Chief Procurement Officer
69
Nat
iona
l Tre
asur
y | A
nnua
l Per
form
ance
Pla
n | 2
018/
19
PART B: PROGRAMME AND SUB-PROGRAMME PLANS - Continued
6.3. SUB-PROGRAMMES
PROGRAMME MANAGEMENT FOR FINANCIAL ACCOUNTING AND SUPPLY CHAIN SYSTEMS
This sub-programme supports planning, monitoring and coordinating deliverables of the programme plan.
OFFICE OF ACCOUNTANT-GENERAL
The purpose of this sub-programme is to facilitate accountability, governance and oversight by promoting transparent, economic,
efficient and effective management in respect of revenue, expenditure, assets and liabilities in the South African public sector through:
• Financial Systems: Maintain and improve existing financial management systems and develop and implement the
new IFMS. This will replace ageing and fragmented financial, supply chain and HR management systems within national and
provincial departments
• Financial Reporting for National Accounts: Provides support to all spheres of government in implementing financial reporting
frameworks and preparing consolidated financial statements. Responsibilities include monthly monitoring of state budgets and
expenditure reports in line with the PFMA
• Financial Management Policy and Compliance Improvement: Promotes financial management compliance with the PFMA and
MFMA through the development of supporting guides and frameworks, instructions and regulations, and provides implementation
support in the three spheres of government. It regulates financial management and accounting policies and sets the risk and IA
frameworks in the three spheres of government. It also provides technical and other support for institutional capacity building
relating to financial management and provides assistance with specialised performance audits and investigations of malpractice
across all spheres of government
OFFICE OF THE CHIEF PROCUREMENT OFFICER
The purpose of this sub-programme is to improve procurement systems in government, reduce wasteful expenditure and bring
about efficient and cost-effective procurement across government. The office aims to enable the efficient, economic, effective and
transparent use of financial and other resources, including state assets, for improved service delivery; and to promote, support and
enforce transparent and effective management of state procurement and sound stewardship of government assets and resources.

70
Nat
iona
l Tre
asur
y | A
nnua
l Per
form
ance
Pla
n | 2
018/
19
PART B: PROGRAMME AND SUB-PROGRAMME PLANS - Continued
6.4.
Str
ateg
ic P
lan
Obj
ectiv
e an
nual
And
Med
ium
Ter
m T
arge
ts
PERF
ORM
AN
CE
IND
ICAT
OR
AUD
ITED
/ACT
UA
L PE
RFO
RMA
NCE
ESTI
MAT
ED
PERF
ORM
AN
CEPL
AN
NED
PE
RFO
RMA
NCE
CU
RREN
T YE
AR
MED
IUM
TER
M T
ARG
ETS
(MTE
F)
2014
/15
2015
/16
2016
/17
2017
/18
2018
/19
2019
/20
2020
/21
2021
/22
2022
/23
2023
/24
Stra
tegi
c O
bjec
tive
5.1:
Impr
ove
finan
cial
man
agem
ent g
over
nanc
e an
d co
mpl
ianc
e ac
ross
all
sphe
res
and
entit
ies
in g
over
nmen
t, gi
ving
effe
ct to
the
PFM
A a
nd M
FMA
5.1
Perc
enta
ge
of fi
nanc
ial
man
agem
ent
regu
latio
ns,
inst
ruct
ions
, ci
rcul
ars,
polic
ies,
guid
elin
es a
nd
tool
s pu
blis
hed
##
#10
0%10
0%10
0%10
0%10
0%10
0%10
0%
Stra
tegi
c O
bjec
tive
5.2:
Sup
port
and
faci
litat
e ca
paci
ty d
evel
opm
ent a
cros
s al
l sph
eres
of g
over
nmen
t in
orde
r to
impr
ove
finan
cial
man
agem
ent e
xecu
tion
5.2
Perc
enta
ge o
f pl
anne
d ca
paci
ty
deve
lopm
ent
initi
ativ
es
impl
emen
ted
##
#10
0%10
0%10
0%10
0%10
0%10
0%10
0%
Stra
tegi
c O
bjec
tive
5.3:
Man
age
exis
ting
finan
cial
sys
tem
s an
d re
new
thes
e as
requ
ired
to e
xerc
ise
com
preh
ensi
ve fi
nanc
ial m
anag
emen
t
5.3
Perc
enta
ge
alig
nmen
t of
fina
ncia
l m
anag
emen
t sy
stem
s to
re
gula
tions
, po
licie
s an
d in
stru
ctio
ns
##
#10
0%10
0%10
0%10
0%10
0%10
0%10
0%
Stra
tegi
c O
bjec
tive
5.4:
Mod
erni
se S
CM p
olic
ies
and
proc
edur
es
5.4
Perc
enta
ge o
f re
vise
d SC
M
Proc
ess
and
Proc
edur
es
publ
ishe
d
##
#10
0%10
0%10
0%10
0%10
0%10
0%10
0%

71
Nat
iona
l Tre
asur
y | A
nnua
l Per
form
ance
Pla
n | 2
018/
19
PART B: PROGRAMME AND SUB-PROGRAMME PLANS - Continued6.
4. S
trat
egic
Pla
n O
bjec
tive
Ann
ual a
nd M
ediu
m T
erm
Tar
gets
- co
ntin
ued
PERF
ORM
AN
CE
IND
ICAT
OR
AUD
ITED
/ACT
UA
L PE
RFO
RMA
NCE
ESTI
MAT
ED
PERF
ORM
AN
CEPL
AN
NED
PE
RFO
RMA
NCE
CU
RREN
T YE
AR
MED
IUM
TER
M T
ARG
ETS
(MTE
F)
2014
/15
2015
/16
2016
/17
2017
/18
2018
/19
2019
/20
2020
/21
2021
/22
2022
/23
2023
/24
Stra
tegi
c O
bjec
tive
5.5:
Mon
itor a
nd e
valu
ate
SCM
per
form
ance
5.5
Perc
enta
ge o
f SC
M p
erfo
rman
ce
mon
itorin
g re
port
s pu
blis
hed
on th
e w
ebsi
te
##
#10
0%10
0%10
0%10
0%10
0%10
0%10
0%
Stra
tegi
c O
bjec
tive
5.6:
Dev
elop
and
impl
emen
t str
ateg
ic p
rocu
rem
ent
5.6
Stra
tegy
for
stra
tegi
c pr
ocur
emen
t im
plem
ente
d
##
#St
rate
gy fo
r st
rate
gic
proc
urem
ent
deve
lope
d
Stra
tegy
for
stra
tegi
c pr
ocur
emen
t ro
lled
out
Stra
tegy
up
date
dSt
rate
gy
upda
ted
Stra
tegy
up
date
dSt
rate
gy
upda
ted
Stra
tegy
up
date
d
Stra
tegi
c O
bjec
tive
5.7:
Bui
ld a
nd s
tren
gthe
n st
akeh
olde
r rel
atio
ns
5.7
Build
and
st
reng
then
st
akeh
olde
r re
latio
ns
##
#D
evel
op
stak
ehol
der
enga
gem
ent
mod
el
Impl
emen
t st
akeh
olde
r en
gage
men
t m
odel
Eval
uate
st
akeh
olde
r en
gage
men
t m
odel
Upd
ate
stak
ehol
der
enga
gem
ent
mod
el
Revi
ew
stak
ehol
der
enga
gem
ent
mod
el
Revi
ew
stak
ehol
der
enga
gem
ent
mod
el
Revi
ew
stak
ehol
der
enga
gem
ent
mod
el
Stra
tegi
c O
bjec
tive
5.8:
Mod
erni
se a
nd a
utom
ate
SCM
pro
cess
es
5.8
e-Pr
ocur
emen
t im
plem
ente
d#
##
Dev
elop
e-
Proc
urem
ent
e-Pr
ocur
emen
t –bu
sine
ss p
roce
sses
re
defin
ed
Upd
ate
e-pr
ocur
emen
t bu
sine
ss
proc
esse
s
Upd
ate
e-pr
ocur
emen
t bu
sine
ss
proc
esse
s
Furt
her
impr
ovem
ent o
f e-
proc
urem
ent
busi
ness
pr
oces
ses
Furt
her
impr
ovem
ent o
f e-
proc
urem
ent
busi
ness
pr
oces
ses
Furt
her
impr
ovem
ent o
f e-
proc
urem
ent
busi
ness
pr
oces
ses
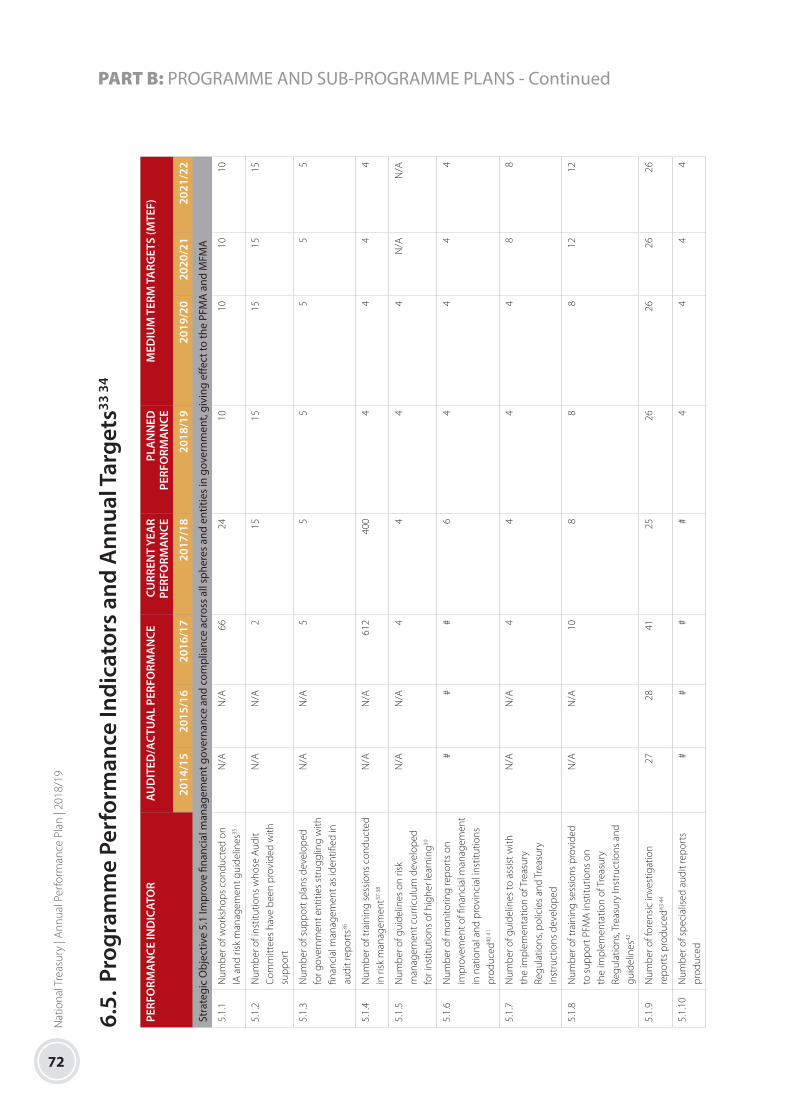
72
Nat
iona
l Tre
asur
y | A
nnua
l Per
form
ance
Pla
n | 2
018/
19
PART B: PROGRAMME AND SUB-PROGRAMME PLANS - Continued
6.5.
Pro
gram
me
Perf
orm
ance
Indi
cato
rs a
nd A
nnua
l Tar
gets
33 3
4
PERF
ORM
AN
CE IN
DIC
ATO
RAU
DIT
ED/A
CTU
AL
PERF
ORM
AN
CECU
RREN
T YE
AR
PERF
ORM
AN
CEPL
AN
NED
PE
RFO
RMA
NCE
M
EDIU
M T
ERM
TA
RGET
S (M
TEF)
2014
/15
2015
/16
2016
/17
2017
/18
2018
/19
2019
/20
2020
/21
2021
/22
Stra
tegi
c O
bjec
tive
5.1
Impr
ove
finan
cial
man
agem
ent g
over
nanc
e an
d co
mpl
ianc
e ac
ross
all
sphe
res
and
entit
ies
in g
over
nmen
t, gi
ving
effe
ct to
the
PFM
A a
nd M
FMA
5.1.
1N
umbe
r of w
orks
hops
con
duct
ed o
n IA
and
risk
man
agem
ent g
uide
lines
35
N/A
N/A
66
2410
1010
10
5.1.
2N
umbe
r of i
nstit
utio
ns w
hose
Aud
it Co
mm
ittee
s ha
ve b
een
prov
ided
with
su
ppor
t
N/A
N/A
2 15
1515
1515
5.1.
3N
umbe
r of s
uppo
rt p
lans
dev
elop
ed
for g
over
nmen
t ent
ities
str
uggl
ing
with
fin
anci
al m
anag
emen
t as
iden
tified
in
audi
t rep
orts
36
N/A
N/A
5 5
55
55
5.1.
4N
umbe
r of t
rain
ing
sess
ions
con
duct
ed
in ri
sk m
anag
emen
t37 3
8
N/A
N/A
612
400
44
44
5.1.
5N
umbe
r of g
uide
lines
on
risk
man
agem
ent c
urric
ulum
dev
elop
ed
for i
nstit
utio
ns o
f hig
her l
earn
ing39
N/A
N/A
44
44
N/A
N/A
5.1.
6N
umbe
r of m
onito
ring
repo
rts
on
impr
ovem
ent o
f fina
ncia
l man
agem
ent
in n
atio
nal a
nd p
rovi
ncia
l ins
titut
ions
pr
oduc
ed40
41
##
#6
44
44
5.1.
7N
umbe
r of g
uide
lines
to a
ssis
t with
th
e im
plem
enta
tion
of T
reas
ury
Regu
latio
ns, p
olic
ies
and
Trea
sury
In
stru
ctio
ns d
evel
oped
N/A
N/A
44
44
88
5.1.
8N
umbe
r of t
rain
ing
sess
ions
pro
vide
d to
sup
port
PFM
A in
stitu
tions
on
the
impl
emen
tatio
n of
Tre
asur
y Re
gula
tions
, Tre
asur
y In
stru
ctio
ns a
nd
guid
elin
es42
N/A
N/A
10
88
812
12
5.1.
9N
umbe
r of f
oren
sic
inve
stig
atio
n re
port
s pr
oduc
ed43
44
2728
4125
2626
2626
5.1.
10N
umbe
r of s
peci
alis
ed a
udit
repo
rts
prod
uced
##
##
44
44

73
Nat
iona
l Tre
asur
y | A
nnua
l Per
form
ance
Pla
n | 2
018/
19
PART B: PROGRAMME AND SUB-PROGRAMME PLANS - Continued6.
5. P
rogr
amm
e Pe
rfor
man
ce In
dica
tors
and
Ann
ual T
arge
ts- c
ontin
ued33
34
PERF
ORM
AN
CE IN
DIC
ATO
RAU
DIT
ED/A
CTU
AL
PERF
ORM
AN
CECU
RREN
T YE
AR
PERF
ORM
AN
CEPL
AN
NED
PE
RFO
RMA
NCE
M
EDIU
M T
ERM
TA
RGET
S (M
TEF)
2014
/15
2015
/16
2016
/17
2017
/18
2018
/19
2019
/20
2020
/21
2021
/22
5.1.
11N
umbe
r of c
rimin
al in
vest
igat
ion
case
s su
ppor
ted45
4844
7430
3030
3030
5.1.
12N
umbe
r of e
ngag
emen
ts h
eld
with
pu
blic
offi
cial
s to
add
ress
com
plia
nce
and
impl
emen
tatio
n of
regu
latio
ns,
inst
ruct
ions
and
gui
delin
es in
a
coor
dina
ted
and
cons
iste
nt m
anne
r
##
#2
22
22
5.1.
13Pe
rcen
tage
of fi
nanc
ial m
anag
emen
t gr
ant s
uppo
rt p
lans
revi
ewed
for
alig
nmen
t with
the
gran
t fra
mew
ork
for m
unic
ipal
ities
##
#10
0%10
0%10
0%10
0%10
0%
5.1.
14Pe
rcen
tage
of c
ompl
ete
requ
ests
to
dra
ft fi
nanc
ial r
ecov
ery
plan
s re
spon
ded
to w
ithin
90
days
of
rece
ipt46
47
##
#10
0%10
0%10
0%10
0%10
0%
5.1.
15Pe
rcen
tage
of r
eque
sts
to th
e M
FMA
he
lpde
sk re
spon
ded
to w
ithin
30
days
of
rece
ipt
##
#75
%75
%75
%75
%75
%
5.1.
16N
umbe
r of m
unic
ipal
ities
ass
iste
d in
add
ress
ing
gaps
as
iden
tified
by
FM
CM
M a
nd fi
nanc
ial i
ndic
ator
as
sess
men
ts
##
#3
55
55
5.1.
17N
umbe
r of m
unic
ipal
ities
with
the
high
est U
IFW
incu
rred
ann
ually
m
onito
red
to re
ctify
suc
h ex
pend
iture
in
term
s of
the
MFM
A
##
#10
1010
1010
5.1.
18N
umbe
r of m
onth
ly s
tate
men
t re
port
s of
act
ual r
even
ue a
nd a
ctua
l ex
pend
iture
for t
he N
atio
nal R
even
ue
Fund
(NRF
) pub
lishe
d48
N/A
N/A
12 re
port
s pu
blis
hed,
ea
ch o
n th
e la
st w
orki
ng
day
of e
very
m
onth
1212
1212
12

74
Nat
iona
l Tre
asur
y | A
nnua
l Per
form
ance
Pla
n | 2
018/
19
PART B: PROGRAMME AND SUB-PROGRAMME PLANS - Continued
6.5.
Pro
gram
me
Perf
orm
ance
Indi
cato
rs a
nd A
nnua
l Tar
gets
- con
tinue
d33 3
4
PERF
ORM
AN
CE IN
DIC
ATO
RAU
DIT
ED/A
CTU
AL
PERF
ORM
AN
CECU
RREN
T YE
AR
PERF
ORM
AN
CEPL
AN
NED
PE
RFO
RMA
NCE
M
EDIU
M T
ERM
TA
RGET
S (M
TEF)
2014
/15
2015
/16
2016
/17
2017
/18
2018
/19
2019
/20
2020
/21
2021
/22
5.1.
19Pe
rcen
tage
com
plia
nce
with
th
e ba
nkin
g se
rvic
es fo
r nat
iona
l go
vern
men
t: •
Dai
ly b
ank
reco
ncili
atio
n of
NRF
• El
ectr
onic
ver
ifica
tion
of
supp
lier b
anki
ng d
etai
ls w
ithin
fo
ur w
orki
ng d
ays49
N/A
N/A
100%
100%
95%
95%
95%
95%
5.1.
20N
umbe
r of c
onso
lidat
ed a
nnua
l fin
anci
al s
tate
men
ts fo
r nat
iona
l de
part
men
ts, p
ublic
ent
ities
and
Re
cons
truc
tion
and
Dev
elop
men
t Pr
ogra
mm
e (R
DP)
Fun
d ta
bled
on
31
Oct
ober
N/A
N/A
1 ta
blin
g of
co
nsol
idat
ed
finan
cial
st
atem
ents
22
22
2
5.1.
21Pe
rcen
tage
of c
omm
ents
pro
vide
d to
Sta
ndar
d Se
tter
s on
loca
l and
in
tern
atio
nal e
xpos
ure
draf
ts
##
##
100
%10
0 %
100
%10
0 %
5.1.
22N
umbe
r of M
odifi
ed C
ash
Stan
dard
pu
blis
hed
##
##
11
11
5.1.
23Pe
rcen
tage
resp
onse
s to
que
ries
logg
ed o
n th
e SC
OA
hel
pdes
k#
##
#10
0 %
100
%10
0 %
100
%
Stra
tegi
c O
bjec
tive
5.2:
Sup
port
and
faci
litat
e ca
paci
ty d
evel
opm
ent a
cros
s al
l sph
eres
of g
over
nmen
t in
orde
r to
impr
ove
finan
cial
man
agem
ent e
xecu
tion
5.2.
1N
umbe
r of t
rain
ing
sess
ions
con
duct
ed
in th
e pr
epar
atio
n of
pro
vinc
ial
cons
olid
ated
fina
ncia
l sta
tem
ents
, pr
ovin
cial
reve
nue
fund
sta
tem
ents
an
d im
plem
enta
tion
of G
ener
ally
Re
cogn
ised
Acc
ount
ing
Prac
tice
(GRA
P) s
tand
ards
50 5
1
N/A
N/A
477
250
44
44
5.2.
2Pe
rcen
tage
of t
he p
ublic
fina
ncia
l m
anag
emen
t edu
catio
n, tr
aini
ng a
nd
deve
lopm
ent i
mpl
emen
tatio
n pl
an
achi
eved
##
#10
0%10
0%10
0%10
0%10
0%
5.2.
3N
umbe
r of m
unic
ipal
offi
cial
s tr
aine
d in
fin
anci
al m
anag
emen
t com
pete
ncie
s1
034
1380
1080
1000
1 00
01
000
1000
1000

75
Nat
iona
l Tre
asur
y | A
nnua
l Per
form
ance
Pla
n | 2
018/
19
PART B: PROGRAMME AND SUB-PROGRAMME PLANS - Continued6.
5. P
rogr
amm
e Pe
rfor
man
ce In
dica
tors
and
Ann
ual T
arge
ts- c
ontin
ued33
34
PERF
ORM
AN
CE IN
DIC
ATO
RAU
DIT
ED/A
CTU
AL
PERF
ORM
AN
CECU
RREN
T YE
AR
PERF
ORM
AN
CEPL
AN
NED
PE
RFO
RMA
NCE
M
EDIU
M T
ERM
TA
RGET
S (M
TEF)
2014
/15
2015
/16
2016
/17
2017
/18
2018
/19
2019
/20
2020
/21
2021
/22
5.2.
4Pe
rcen
tage
of t
he p
ublic
fina
ncia
l m
anag
emen
t cap
acity
dev
elop
men
t st
rate
gy (C
DS)
impl
emen
tatio
n pl
an
achi
eved
N/A
N/A
100%
100%
100%
100%
100%
100%
5.2.
5Pe
rcen
tage
of q
ualif
ying
trai
nees
that
pa
rtic
ipat
e in
the
acad
emic
sup
port
pr
ogra
mm
e fo
r pro
spec
tive
char
tere
d ac
coun
tant
s
N/A
N/A
1710
0%10
0%10
0%10
0%10
0%
5.2.
6N
umbe
r of m
unic
ipal
ities
mon
itore
d to
co
mpl
y w
ith m
inim
um c
ompe
tenc
ies
regu
latio
ns fo
r fina
ncia
l man
agem
ent
##
#70
7070
7070
5.2.
7N
umbe
r of m
unic
ipal
ities
that
rece
ived
di
scla
imer
s an
d ad
vers
e op
inio
ns
prio
ritis
ed b
y N
T an
d PT
s su
ppor
ted
##
#10
3030
3030
Stra
tegi
c O
bjec
tive
5.3:
Man
age
exis
ting
finan
cial
sys
tem
s an
d re
new
thes
e as
requ
ired
to e
xerc
ise
com
preh
ensi
ve fi
nanc
ial m
anag
emen
t
5.3.
1Pe
rcen
tage
ava
ilabi
lity
of c
urre
nt
tran
sver
sal s
yste
ms52
99%
98%
99%
98%
98%
98%
98%
98%
5.3.
2Im
plem
enta
tion
of th
e IF
MS
II pl
an
##
##
Plan
ning
and
des
ign
com
plet
ed
Pilo
t site
pre
para
tion
for N
atio
nal T
reas
ury
and
DPS
A
Lead
site
im
plem
enta
tion
at
Wes
tern
Cap
e an
d Ea
ster
n Ca
pe
Nat
iona
l ro
ll-ou
tN
atio
nal r
oll-
out
Stra
tegi
c O
bjec
tive
5.4:
Mod
erni
se S
CM p
olic
ies
and
proc
edur
es
5.4.
1N
umbe
r of I
nstr
uctio
ns is
sued
in li
ne
with
pol
icy
inte
rven
tions
and
pro
pose
d de
sign
ated
pro
duct
s or
cat
egor
ies
to
enha
nce
SCM
pol
icy
N/A
N/A
229
63
35
Stra
tegi
c O
bjec
tive
5.5:
Mon
itor a
nd e
valu
ate
SCM
per
form
ance
5.5.
1Pe
rcen
tage
of d
epar
tmen
ts’/
entit
ies’
devi
atio
n/ex
pans
ion
requ
ests
re
view
ed53
N/A
N/A
100%
100%
100%
100%
100%
100%

76
Nat
iona
l Tre
asur
y | A
nnua
l Per
form
ance
Pla
n | 2
018/
19
PART B: PROGRAMME AND SUB-PROGRAMME PLANS - Continued
6.5.
Pro
gram
me
Perf
orm
ance
Indi
cato
rs a
nd A
nnua
l Tar
gets
- con
tinue
d33 3
4
PERF
ORM
AN
CE IN
DIC
ATO
RAU
DIT
ED/A
CTU
AL
PERF
ORM
AN
CECU
RREN
T YE
AR
PERF
ORM
AN
CEPL
AN
NED
PE
RFO
RMA
NCE
M
EDIU
M T
ERM
TA
RGET
S (M
TEF)
2014
/15
2015
/16
2016
/17
2017
/18
2018
/19
2019
/20
2020
/21
2021
/22
5.5.
2Pe
rcen
tage
of p
rocu
rem
ent p
lans
pu
blis
hed
on th
e e-
tend
er p
orta
lN
/AN
/A10
0%10
0%10
0%10
0%10
0%10
0%
5.5.
3Pe
rcen
tage
of b
ids
revi
ewed
to
ensu
re c
ompl
ianc
e w
ith n
orm
s an
d st
anda
rds54
N/A
N/A
100%
100%
100%
100%
100%
100%
5.5.
4Pe
rcen
tage
of p
roje
cts
insp
ecte
d to
ver
ify if
the
deliv
ery
of a
war
ded
cont
ract
s is
alig
ned
with
the
cont
ract
co
nditi
ons55
N/A
N/A
100%
100%
100%
100%
100%
100%
Stra
tegi
c O
bjec
tive
5.6:
Dev
elop
and
impl
emen
t str
ateg
ic p
rocu
rem
ent
5.6.
1Pe
rcen
tage
impl
emen
tatio
n of
the
stra
tegi
c so
urci
ng o
ppor
tuni
ties
plan
56
##
##
100%
100%
100%
100%
5.6.
2N
umbe
r of t
rans
vers
al te
rm c
ontr
acts
im
plem
ente
d57
1616
2817
2225
2815
Stra
tegi
c O
bjec
tive
5.7
Build
and
str
engt
hen
stak
ehol
der r
elat
ions
5.7.
1N
umbe
r of s
take
hold
er e
ngag
emen
ts
cond
ucte
d58
N/A
N/A
95%
95%
1616
1616
5.7.
2N
umbe
r of p
riorit
ised
dep
artm
ents
an
d en
titie
s su
ppor
ted
on s
uppl
y ch
ain
##
#8
1010
1010
Stra
tegi
c O
bjec
tive
5.8:
Mod
erni
se a
nd a
utom
ate
SCM
pro
cess
es
5.8.
1N
umbe
r of t
ende
rs a
dver
tised
on
an e
lect
roni
c te
nder
ing
plat
form
for
tran
sver
sal c
ontr
acts
59
##
#20
10 0
0050
0010
000
10 0
00
5.8.
2N
umbe
r of b
usin
ess
proc
esse
s de
fined
fo
r SC
M#
##
1112
415
015
00
5.8.
3N
umbe
r of m
unic
ipal
ities
sup
port
ed
in S
CM
and
con
trac
t man
agem
ent
audi
t find
ings
/opi
nion
s; m
onito
ring
corr
ectiv
e ac
tions
take
n by
non
-co
mpl
iant
mun
icip
aliti
es
##
##
Met
ros:
1D
istr
icts
: 10
Loca
l: 10
0
00
0

77
Nat
iona
l Tre
asur
y | A
nnua
l Per
form
ance
Pla
n | 2
018/
19
PART B: PROGRAMME AND SUB-PROGRAMME PLANS - Continued6.
6. P
rogr
amm
e Pe
rfor
man
ce In
dica
tor Q
uart
erly
Tar
gets
for 2
018/
19
PERF
ORM
AN
CE IN
DIC
ATO
R20
18/1
9 A
NN
UA
L TA
RGET
SQ
UA
RTER
1Q
UA
RTER
2Q
UA
RTER
3Q
UA
RTER
4
Stra
tegi
c O
bjec
tive
5.1:
Impr
ove
finan
cial
man
agem
ent g
over
nanc
e an
d co
mpl
ianc
e ac
ross
all
sphe
res
and
entit
ies
in g
over
nmen
t, gi
ving
effe
ct to
the
PFM
A a
nd M
FMA
5.1.
1N
umbe
r of w
orks
hops
con
duct
ed o
n IA
and
risk
man
agem
ent g
uide
lines
102
24
2
5.1.
2N
umbe
r of i
nstit
utio
ns w
hose
Aud
it Co
mm
ittee
s ha
ve b
een
prov
ided
with
su
ppor
t15
55
32
5.1.
3N
umbe
r of s
uppo
rt p
lans
dev
elop
ed fo
r gov
ernm
ent e
ntiti
es s
trug
glin
g w
ith
finan
cial
man
agem
ent a
s id
entifi
ed in
aud
it re
port
s5
5N
/AN
/AN
/A
5.1.
4N
umbe
r of t
rain
ing
sess
ions
con
duct
ed in
risk
man
agem
ent
41
11
1
5.1.
5N
umbe
r of g
uide
lines
on
risk
man
agem
ent c
urric
ulum
dev
elop
ed fo
r ins
titut
ions
of
hig
her l
earn
ing
41
11
1
5.1.
6N
umbe
r of m
onito
ring
repo
rts
on im
prov
emen
t of fi
nanc
ial m
anag
emen
t in
natio
nal a
nd p
rovi
ncia
l ins
titut
ions
pro
duce
d4
11
11
5.1.
7N
umbe
r of g
uide
lines
to a
ssis
t with
the
impl
emen
tatio
n of
Tre
asur
y Re
gula
tions
, po
licie
s an
d Tr
easu
ry In
stru
ctio
ns d
evel
oped
41
11
1
5.1.
8N
umbe
r of t
rain
ing
sess
ions
pro
vide
d to
sup
port
PFM
A in
stitu
tions
on
the
impl
emen
tatio
n of
Tre
asur
y Re
gula
tions
, Tre
asur
y In
stru
ctio
ns a
nd g
uide
lines
82
22
2
5.1.
9N
umbe
r of f
oren
sic
inve
stig
atio
n re
port
s pr
oduc
ed26
67
67
5.1.
10N
umbe
r of s
peci
alis
ed a
udit
repo
rts
prod
uced
41
11
1
5.1.
11N
umbe
r of c
rimin
al in
vest
igat
ion
case
s su
ppor
ted
30N
/A
N/A
N
/A
30
5.1.
12N
umbe
r of e
ngag
emen
ts h
eld
with
pub
lic o
ffici
als
to a
ddre
ss c
ompl
ianc
e an
d im
plem
enta
tion
of re
gula
tions
, ins
truc
tions
and
gui
delin
es in
a c
oord
inat
ed a
nd
cons
iste
nt m
anne
r
21
N/A
N/A
1
5.1.
13Pe
rcen
tage
of fi
nanc
ial m
anag
emen
t gra
nt s
uppo
rt p
lans
revi
ewed
for a
lignm
ent
with
the
gran
t fra
mew
ork
for m
unic
ipal
ities
10
0%N
/AN
/AN
/A10
0%
5.1.
14Pe
rcen
tage
of c
ompl
ete
requ
ests
to d
raft
fina
ncia
l rec
over
y pl
ans
resp
onde
d to
w
ithin
90
days
of r
ecei
pt
100%
100%
100%
100%
100%
5.1.
15Pe
rcen
tage
of r
eque
sts
to th
e M
FMA
hel
pdes
k re
spon
ded
to w
ithin
30
days
of
rece
ipt
75%
75%
75%
75%
75%
5.1.
16N
umbe
r of m
unic
ipal
ities
ass
iste
d in
add
ress
ing
gaps
as
iden
tified
by
FMC
MM
an
d fin
anci
al in
dica
tor a
sses
smen
ts5
N/A
N/A
N/A
5
5.1.
17N
umbe
r of m
unic
ipal
ities
with
the
high
est U
IFW
incu
rred
ann
ually
mon
itore
d to
re
ctify
suc
h ex
pend
iture
in te
rms
of th
e M
FMA
10N
/AN
/AN
/A10
5.1.
18N
umbe
r of m
onth
ly s
tate
men
t rep
orts
of a
ctua
l rev
enue
and
act
ual e
xpen
ditu
re
for t
he N
atio
nal R
even
ue F
und
(NRF
) pub
lishe
d 12
33
33

78
Nat
iona
l Tre
asur
y | A
nnua
l Per
form
ance
Pla
n | 2
018/
19
PART B: PROGRAMME AND SUB-PROGRAMME PLANS - Continued
6.6.
Pro
gram
me
Perf
orm
ance
Indi
cato
r Qua
rter
ly T
arge
ts fo
r 201
8/19
- co
ntin
ued
PERF
ORM
AN
CE IN
DIC
ATO
R20
18/1
9 A
NN
UA
L TA
RGET
SQ
UA
RTER
1Q
UA
RTER
2Q
UA
RTER
3Q
UA
RTER
4
5.1.
19Pe
rcen
tage
com
plia
nce
with
the
bank
ing
serv
ices
for n
atio
nal g
over
nmen
t: •
Dai
ly b
ank
reco
ncili
atio
n of
NRF
• El
ectr
onic
ver
ifica
tion
of s
uppl
ier b
anki
ng d
etai
ls w
ithin
four
w
orki
ng d
ays
95%
95%
95%
95%
95%
5.1.
20N
umbe
r of c
onso
lidat
ed a
nnua
l fina
ncia
l sta
tem
ents
for n
atio
nal d
epar
tmen
ts,
publ
ic e
ntiti
es a
nd R
econ
stru
ctio
n an
d D
evel
opm
ent P
rogr
amm
e (R
DP)
Fun
d ta
bled
on
31 O
ctob
er
2N
/AN
/A2
N/A
5.1.
21Pe
rcen
tage
of c
omm
ents
pro
vide
d to
Sta
ndar
d Se
tter
s on
loca
l and
inte
rnat
iona
l ex
posu
re d
raft
s10
0%10
0%10
0%10
0%10
0%
5.1.
22N
umbe
r of M
odifi
ed C
ash
Stan
dard
pub
lishe
d 1
N/A
N/A
N/A
1
5.1.
23Pe
rcen
tage
resp
onse
s to
que
ries
logg
ed o
n th
e SC
OA
hel
pdes
k10
0%10
0%10
0%10
0%10
0%
Stra
tegi
c O
bjec
tive
5.2:
Sup
port
and
faci
litat
e ca
paci
ty d
evel
opm
ent a
cros
s al
l sph
eres
of g
over
nmen
t in
orde
r to
impr
ove
finan
cial
man
agem
ent e
xecu
tion
5.2.
1N
umbe
r of t
rain
ing
sess
ions
con
duct
ed in
the
prep
arat
ion
of p
rovi
ncia
l co
nsol
idat
ed fi
nanc
ial s
tate
men
ts, p
rovi
ncia
l rev
enue
fund
sta
tem
ents
and
im
plem
enta
tion
of G
ener
ally
Rec
ogni
sed
Acc
ount
ing
Prac
tice
(GRA
P) s
tand
ards
41
11
1
5.2.
2Pe
rcen
tage
of t
he p
ublic
fina
ncia
l man
agem
ent e
duca
tion,
trai
ning
and
de
velo
pmen
t im
plem
enta
tion
plan
ach
ieve
d10
0%.
25%
25%
25%
25%
5.2.
3N
umbe
r of m
unic
ipal
offi
cial
s tr
aine
d in
fina
ncia
l man
agem
ent c
ompe
tenc
ies
1000
250
250
250
250
5.2.
4Pe
rcen
tage
of t
he p
ublic
fina
ncia
l man
agem
ent c
apac
ity d
evel
opm
ent s
trat
egy
(CD
S) im
plem
enta
tion
plan
ach
ieve
d10
0%25
%25
%25
%25
%
5.2.
5Pe
rcen
tage
of q
ualif
ying
trai
nees
that
par
ticip
ate
in th
e ac
adem
ic s
uppo
rt
prog
ram
me
for p
rosp
ectiv
e ch
arte
red
acco
unta
nts
100%
100%
100%
100%
100%
5.2.
6N
umbe
r of m
unic
ipal
ities
mon
itore
d to
com
ply
with
min
imum
com
pete
ncie
s re
gula
tions
for fi
nanc
ial m
anag
emen
t70
N/A
N/A
N/A
70
5.2.
7N
umbe
r of m
unic
ipal
ities
that
rece
ived
dis
clai
mer
s an
d ad
vers
e op
inio
ns
prio
ritis
ed b
y N
T an
d PT
s su
ppor
ted
30N
/AN
/AN
/A30
Stra
tegi
c O
bjec
tive
5.3:
Man
age
exis
ting
finan
cial
sys
tem
s an
d re
new
thes
e as
requ
ired
to e
xerc
ise
com
preh
ensi
ve fi
nanc
ial m
anag
emen
t
5.3.
1Pe
rcen
tage
ava
ilabi
lity
of c
urre
nt tr
ansv
ersa
l sys
tem
s98
%98
%98
%98
%98
%

79
Nat
iona
l Tre
asur
y | A
nnua
l Per
form
ance
Pla
n | 2
018/
19
PART B: PROGRAMME AND SUB-PROGRAMME PLANS - Continued6.
6. P
rogr
amm
e Pe
rfor
man
ce In
dica
tor Q
uart
erly
Tar
gets
for 2
018/
19 -
cont
inue
dPE
RFO
RMA
NCE
IND
ICAT
OR
2018
/19
AN
NU
AL
TARG
ETS
QU
ART
ER 1
QU
ART
ER 2
QU
ART
ER 3
QU
ART
ER 4
5.3.
2Im
plem
enta
tion
of th
e IF
MS
II pl
anPl
anni
ng a
nd d
esig
n co
mpl
eted
Arc
hite
ctur
e Bl
uepr
int a
nd
impl
emen
tatio
n st
rate
gy
deve
lope
d
Arc
hite
ctur
e ar
tifac
ts
appr
oved
Prog
ram
me
gove
rnan
ce
mod
el re
view
ed
N/A
Prep
are
pilo
t site
for N
atio
nal
Trea
sury
and
DPS
AIs
sue
RFP
for p
ilot
and
lead
site
s im
plem
enta
tion
SITA
-hos
ting
infra
stru
ctur
e se
cure
d
PMO
for p
ilot
and
lead
site
s im
plem
enta
tion
esta
blis
hed
Defi
ne
Busi
ness
M
odel
for t
he
CoE
(Cen
tre
of E
xcel
lenc
e)
Stra
tegi
c O
bjec
tive
5.4:
Mod
erni
se S
CM p
olic
ies
and
proc
edur
es
5.4.
1N
umbe
r of I
nstr
uctio
ns is
sued
in li
ne w
ith p
olic
y in
terv
entio
ns a
nd p
ropo
sed
desi
gnat
ed p
rodu
cts
or c
ateg
orie
s to
enh
ance
SC
M p
olic
y6
11
22
Stra
tegi
c O
bjec
tive
5.5:
Mon
itor a
nd e
valu
ate
SCM
per
form
ance
5.5.
1Pe
rcen
tage
of d
epar
tmen
ts’/e
ntiti
es’ d
evia
tion/
expa
nsio
n re
ques
ts re
view
ed10
0%10
0%10
0%10
0%10
0%
5.5.
2Pe
rcen
tage
of p
rocu
rem
ent p
lans
pub
lishe
d on
the
e-te
nder
por
tal
100%
100%
100%
100%
100%
5.5.
3Pe
rcen
tage
of b
ids
revi
ewed
to e
nsur
e co
mpl
ianc
e w
ith n
orm
s an
d st
anda
rds
100%
100%
100%
100%
100%
5.5.
4Pe
rcen
tage
of p
roje
cts
insp
ecte
d to
ver
ify if
the
deliv
ery
of a
war
ded
cont
ract
s is
al
igne
d w
ith th
e co
ntra
ct c
ondi
tions
100%
100%
100%
100%
100%
Stra
tegi
c O
bjec
tive
5.6:
Dev
elop
and
impl
emen
t str
ateg
ic p
rocu
rem
ent
5.6.
1Pe
rcen
tage
impl
emen
tatio
n of
the
stra
tegi
c so
urci
ng o
ppor
tuni
ties
plan
100%
100%
100%
100%
100%
5.6.
2N
umbe
r of t
rans
vers
al te
rm c
ontr
acts
impl
emen
ted
225
76
4
Stra
tegi
c O
bjec
tive
5.7:
Bui
ld a
nd s
tren
gthe
n st
akeh
olde
r rel
atio
ns
5.7.
1N
umbe
r of s
take
hold
er e
ngag
emen
ts c
ondu
cted
164
44
4
5.7.
2N
umbe
r of p
riorit
ised
dep
artm
ents
and
ent
ities
sup
port
ed o
n su
pply
cha
in10
N/A
N/A
N/A
10
Stra
tegi
c O
bjec
tive
5.8:
Mod
erni
se a
nd a
utom
ate
SCM
pro
cess
es
5.8.
1N
umbe
r of t
ende
rs a
dver
tised
on
an e
lect
roni
c te
nder
ing
plat
form
for t
rans
vers
al
cont
ract
s10
000
2500
2500
2500
2500
5.8.
2N
umbe
r of b
usin
ess
proc
esse
s de
fined
for S
CM
12
430
3034
30
5.8.
3N
umbe
r of m
unic
ipal
ities
sup
port
ed in
SC
M a
nd c
ontr
act m
anag
emen
t aud
it fin
ding
s/op
inio
ns; m
onito
ring
corr
ectiv
e ac
tions
take
n by
non
-com
plia
nt
mun
icip
aliti
es
Met
ros:
1D
istr
icts
: 10
Loca
l: 10
0
Met
ros:
0D
istr
icts
: 3Lo
cal:
25
Met
ros:
0D
istr
icts
: 3Lo
cal:
25
Met
ros:
1D
istr
icts
: 2Lo
cal:
25
Met
ros:
0D
istr
icts
: 2Lo
cal:
25

80
Nat
iona
l Tre
asur
y | A
nnua
l Per
form
ance
Pla
n | 2
018/
19
PART B: PROGRAMME AND SUB-PROGRAMME PLANS - Continued
6.7.
Exp
endi
ture
Tre
nds
and
Estim
ates
Fina
ncia
l Acc
ount
ing
and
Supp
ly C
hain
Man
agem
ent S
yste
ms
expe
nditu
re tr
ends
and
est
imat
es b
y su
b-pr
ogra
mm
e an
d ec
onom
ic c
lass
ifica
tion
Sub-
prog
ram
me
Aud
ited
outc
ome
Adj
uste
dap
prop
riat
ion
Aver
age
grow
thra
te (%
)
Aver
age:
Expe
n-di
ture
/To
tal (
%)
Med
ium
term
ex
pend
iture
estim
ate
Aver
age
grow
thra
te (%
)
Aver
age:
expe
n-di
ture
/to
tal (
%)
R m
illio
n 2
014/
15
201
5/16
2
016/
17
201
7/18
2
014/
15 -
2017
/18
201
8/19
2
019/
20
202
0/21
2
017/
18 -
2020
/21
Prog
ram
me
Man
agem
ent f
or
Fina
ncia
l Acc
ount
ing
and
Supp
ly
Cha
in M
anag
emen
t Sys
tem
s
15.2
24.7
60.2
99.9
87.5
%5.
3%19
6.5
143.
215
0.9
14.7
%13
.1%
Offi
ce o
f the
Chi
ef P
rocu
rem
ent
Offi
cer
38.6
55.3
67.5
74.7
24.6
%6.
2%70
.375
.780
.82.
6%6.
7%
Fina
ncia
l Sys
tem
s41
2.1
441.
079
7.4
634.
515
.5%
60.2
%64
2.1
556.
458
7.8
-2.5
%53
.8%
Fina
ncia
l Rep
ortin
g fo
r Nat
iona
l A
ccou
nts
86.4
83.0
85.1
99.2
4.7%
9.3%
101.
910
8.0
114.
74.
9%9.
4%
Fina
ncia
l Man
agem
ent P
olic
y an
d Co
mpl
ianc
e Im
prov
emen
t11
7.8
128.
512
0.3
124.
31.
8%12
.9%
137.
814
6.7
156.
68.
0%12
.6%
Aud
it St
atut
ory
Bodi
es61
.341
.979
.146
.3-8
.9%
6.0%
47.7
50.4
53.2
4.7%
4.4%
Serv
ice
Cha
rges
: Com
mer
cial
Ban
ks0.
10.
10.
30.
338
.8%
–
0.3
0.3
0.3
5.4%
–
Tota
l 73
1.5
774.
51
209.
91
079.
113
.8%
100.
0%1
196.
61
080.
71
144.
32.
0%10
0.0%
Cha
nge
to 2
017
Budg
et e
stim
ate
(8
.7)
(10.
6)(1
0.5)
(11.
4)
Econ
omic
cla
ssifi
catio
n
Curr
ent p
aym
ents
619.
868
2.9
668.
896
9.6
16.1
%77
.5%
1 08
5.9
964.
51
021.
81.
8%89
.8%
Com
pens
atio
n of
em
ploy
ees
158.
317
9.5
200.
520
8.1
9.5%
19.7
%20
8.2
223.
824
0.4
4.9%
19.6
%
Goo
ds a
nd s
ervi
ces
461.
550
3.4
468.
276
1.5
18.2
%57
.8%
877.
774
0.7
781.
40.
9%70
.2%
of w
hich
:
Audi
t cos
ts: E
xter
nal
6.5
3.9
3.8
7.5
4.8%
0.6%
5.4
5.7
6.0
-6.9
%0.
5%
Com
pute
r ser
vice
s38
4.6
338.
835
3.2
582.
214
.8%
43.7
%57
1.3
486.
551
4.8
-4.0
%47
.9%
Cons
ulta
nts:
Busin
ess a
nd
advi
sory
serv
ices
49.9
137.
488
.714
4.7
42.6
%11
.1%
267.
921
7.9
228.
816
.5%
19.1
%
Lega
l ser
vice
s0.
4 –
–
–
-1
00.0
% –
5.
01.
51.
0 –
0.
2%
Trav
el a
nd su
bsist
ence
7.2
4.2
7.6
10.1
11.9
%0.
8%11
.011
.011
.44.
1%1.
0%
Venu
es a
nd fa
cilit
ies
4.7
0.3
4.3
5.1
2.9%
0.4%
5.5
6.2
6.7
9.2%
0.5%

81
Nat
iona
l Tre
asur
y | A
nnua
l Per
form
ance
Pla
n | 2
018/
19
PART B: PROGRAMME AND SUB-PROGRAMME PLANS - Continued6.
7. E
xpen
ditu
re T
rend
s an
d Es
timat
es -
cont
inue
dFi
nanc
ial A
ccou
ntin
g an
d Su
pply
Cha
in M
anag
emen
t Sys
tem
s ex
pend
iture
tren
ds a
nd e
stim
ates
by
sub-
prog
ram
me
and
econ
omic
cla
ssifi
catio
n
Sub-
prog
ram
me
Aud
ited
outc
ome
Adj
uste
dap
prop
riat
ion
Aver
age
grow
thra
te (%
)
Aver
age:
Expe
n-di
ture
/To
tal (
%)
Med
ium
term
ex
pend
iture
estim
ate
Aver
age
grow
thra
te (%
)
Aver
age:
expe
n-di
ture
/to
tal (
%)
R m
illio
n 2
014/
15
201
5/16
2
016/
17
201
7/18
2
014/
15 -
2017
/18
201
8/19
2
019/
20
202
0/21
2
017/
18 -
2020
/21
Tran
sfer
s an
d su
bsid
ies
106.
583
.512
1.6
99.5
-2.2
%10
.8%
104.
311
0.2
116.
05.
3%9.
6%
Dep
artm
enta
l age
ncie
s an
d ac
coun
ts10
6.1
83.1
120.
699
.4-2
.2%
10.8
%10
2.7
108.
411
4.4
4.8%
9.4%
Hou
seho
lds
0.4
0.4
1.0
0.1
-29.
2%0.
1%1.
71.
81.
712
5.2%
0.1%
Paym
ents
for c
apita
l ass
ets
3.9
8.1
419.
510
.037
.1%
11.6
%6.
46.
16.
4-1
3.8%
0.6%
Mac
hine
ry a
nd e
quip
men
t3.
98.
13.
48.
328
.5%
0.6%
5.8
5.4
5.7
-11.
5%0.
6%
Soft
war
e an
d ot
her i
ntan
gibl
e as
sets
–
–
416.
11.
8 –
11
.0%
0.6
0.6
0.7
-27.
1%0.
1%
Paym
ents
for fi
nanc
ial a
sset
s1.
30.
00.
0 –
-1
00.0
% –
–
–
–
–
–
Tota
l 73
1.5
774.
51
209.
91
079.
113
.8%
100.
0%1
196.
61
080.
71
144.
32.
0%10
0.0%
Prop
ortio
n of
tota
l pro
gram
me
expe
nditu
re to
vot
e ex
pend
iture
2.8%
2.7%
4.3%
2.7%
–
–
4.1%
3.5%
3.5%
–
–
Det
ails
of t
rans
fers
and
sub
sidi
es
Hou
seho
lds
Soci
al b
enefi
ts
Curr
ent
0.3
0.1
0.6
0.0
-56.
6% –
1.
71.
81.
730
0.3%
0.1%
Empl
oyee
soc
ial b
enefi
ts0.
30.
10.
60.
0-5
6.6%
–
1.7
1.8
1.7
300.
3%0.
1%
Dep
artm
enta
l age
ncie
s an
d ac
coun
ts
Dep
artm
enta
l age
ncie
s (n
on-b
usin
ess
entit
ies)
Curr
ent
106.
183
.112
0.6
99.4
-2.2
%10
.8%
102.
710
8.4
114.
44.
8%9.
4%
Acc
ount
ing
Stan
dard
s Bo
ard
10.3
–
12.5
13.5
9.5%
1.0%
14.1
14.8
15.7
5.2%
1.3%
Inde
pend
ent R
egul
ator
y Bo
ard
for
Aud
itors
34.6
41.3
29.0
39.6
4.6%
3.8%
40.9
43.2
45.5
4.7%
3.8%
Aud
itor-
Gen
eral
of S
outh
Afri
ca61
.341
.979
.146
.3-8
.9%
6.0%
47.7
50.4
53.2
4.7%
4.4%
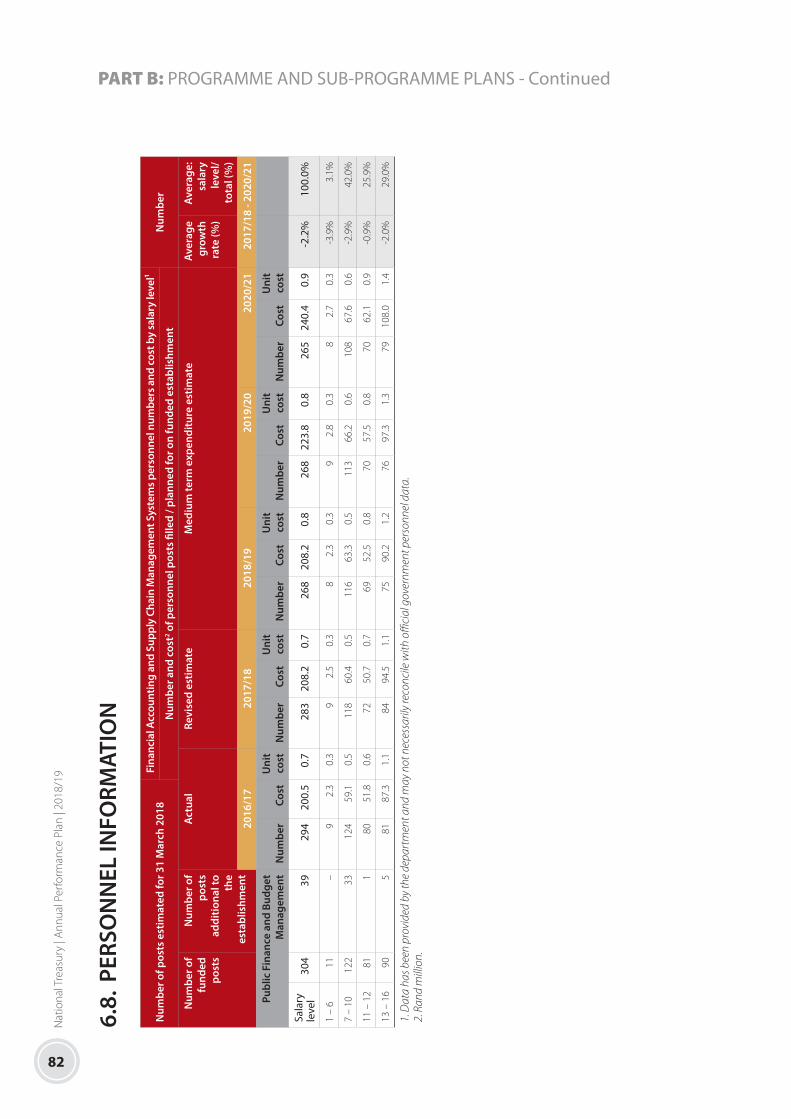
82
Nat
iona
l Tre
asur
y | A
nnua
l Per
form
ance
Pla
n | 2
018/
19
PART B: PROGRAMME AND SUB-PROGRAMME PLANS - Continued
6.8.
PER
SON
NEL
INFO
RMAT
ION
Num
ber o
f pos
ts e
stim
ated
for 3
1 M
arch
201
8Fi
nanc
ial A
ccou
ntin
g an
d Su
pply
Cha
in M
anag
emen
t Sys
tem
s per
sonn
el n
umbe
rs a
nd c
ost b
y sa
lary
leve
l¹N
umbe
rN
umbe
r and
cos
t2 of p
erso
nnel
pos
ts fi
lled
/ pla
nned
for o
n fu
nded
est
ablis
hmen
t
Num
ber o
ffu
nded
post
s
Num
ber o
f po
sts
addi
tiona
l to
the
esta
blis
hmen
t
Act
ual
Revi
sed
estim
ate
Med
ium
term
exp
endi
ture
est
imat
eAv
erag
egr
owth
rate
(%)
Aver
age:
sa
lary
leve
l/to
tal (
%)
2016
/17
2017
/18
2018
/19
2019
/20
2020
/21
2017
/18
- 202
0/21
Publ
ic F
inan
ce a
nd B
udge
t M
anag
emen
tN
umbe
rCo
stU
nit
cost
N
umbe
rCo
stU
nit
cost
N
umbe
rCo
stU
nit
cost
N
umbe
rCo
stU
nit
cost
N
umbe
rCo
stU
nit
cost
Sala
ry
leve
l30
439
294
200.
50.
728
320
8.2
0.7
268
208.
20.
826
822
3.8
0.8
265
240.
40.
9-2
.2%
100.
0%
1 –
611
–
92.
30.
39
2.5
0.3
82.
30.
39
2.8
0.3
82.
70.
3-3
.9%
3.1%
7 –
1012
233
124
59.1
0.5
118
60.4
0.5
116
63.3
0.5
113
66.2
0.6
108
67.6
0.6
-2.9
%42
.0%
11 –
12
811
8051
.80.
672
50.7
0.7
6952
.50.
870
57.5
0.8
7062
.10.
9-0
.9%
25.9
%
13 –
16
905
8187
.31.
184
94.5
1.1
7590
.21.
276
97.3
1.3
7910
8.0
1.4
-2.0
%29
.0%
1. D
ata
has b
een
prov
ided
by
the
depa
rtm
ent a
nd m
ay n
ot n
eces
saril
y re
conc
ile w
ith o
ffici
al g
over
nmen
t per
sonn
el d
ata.
2. R
and
mill
ion.

83
Nat
iona
l Tre
asur
y | A
nnua
l Per
form
ance
Pla
n | 2
018/
19
PART B: PROGRAMME AND SUB-PROGRAMME PLANS - Continued
7. PROGRAMME 6: INTERNATIONAL FINANCIAL RELATIONS
7.1. PURPOSE
Manage South Africa’s interests in shaping regional and global policies that advance the economic, financial and development
objectives of the country and Africa.
7.2. STRATEGIC OBJECTIVES
STRATEGIC OBJECTIVE OBJECTIVE STATEMENT SUB-PROGRAMMES
SO 6.1 Advance South Africa’s interests specifically, and those of Africa more generally, through regular strategic analysis, engagements and negotiations at regional and global financial and economic forums
Advance South Africa’s national economic interests specifically, and those of Africa generally by:• Assessing the content and context of
current policy debates and expanding awareness of them
• Managing the relationship between South Africa and selected public finance and development institutions, with particular focus on implementation of agreements
• International Economic Cooperation• African Integration and Support
SO 6.2 Increase Africa’s voice and South Africa’s influence in international institutions and forums
• Strengthen and expand South Africa’s engagement in key institutions and with partners at selected policy fora
• Increase capital participation (as appropriate) to more firmly anchor South Africa’s role
• Advancing governance reform• Pressing for improved effectiveness
in the delivery of institutional/organisational mandates
• African Integration and Support• International Development Funding
Institutions• International Projects
SO 6.3 Support an enabling environment for increased economic activity within Africa
Promote regional economic integration and strengthen economic links within Africa by:• Encouraging increased cooperation
and investment that support improved interconnectedness in the region
• Expanding bilateral engagements on issues of mutual interest
• African Integration and Support• International Projects • International Economic Cooperation
7.3. SUB-PROGRAMMES
PROGRAMME MANAGEMENT FOR INTERNATIONAL FINANCIAL RELATIONS
This sub-programme supports the planning, monitoring and delivering of the programme’s activities. The unit oversees South Africa’s
representation in international and regional financial institutions; manages bilateral and multilateral relationships on behalf of National
Treasury; and plans, implements and monitors programmes and activities within the divisional mandate.

84
Nat
iona
l Tre
asur
y | A
nnua
l Per
form
ance
Pla
n | 2
018/
19
PART B: PROGRAMME AND SUB-PROGRAMME PLANS - Continued
INTERNATIONAL ECONOMIC COOPERATION
This sub-programme focuses on improving South Africa’s participation in international and regional economic institutions. This entails
working through key economic institutions and fora such as the African Development Bank, the United Nations Economic Commission
for Africa, the New Partnership for Africa’s Development, the G20, the Brazil-Russia-India-China-South Africa (BRICS) group of countries
and the International Monetary Fund.
AFRICAN INTEGRATION AND SUPPORT
This sub-programme serves mainly as a vehicle to enable National Treasury to engage with Africa through the Southern African
Customs Union (SACU), the Southern African Development Co-operation (SADC) and the African Union (AU). Regional integration
in terms of growing trade, infrastructure investment and strengthening bilateral relations with key countries are the focus areas for
strengthening South Africa’s relations with SACU, SADC and Africa more broadly.
INTERNATIONAL DEVELOPMENT FUNDING INSTITUTIONS
This sub-programme provides for subscriptions and contributions to international development institutions and multilateral banks. It
transfers funds to the African Development Bank and African Development Fund for buying shares and subscriptions, and for accelerated
encashment schedules to support African development; and to the World Bank Group (WBG) group for providing concessional loans
and grants to low income countries and for contributing to general and selective increases in the authorised capital of the WBG.
INTERNATIONAL PROJECTS
This sub-programme transfers funds to international projects and interventions. It supports priorities such as building capacity and
providing medical support to disaster-hit and impoverished areas. To this end, National Treasury contributes to the Commonwealth
Fund for Technical Cooperation and the International Finance Facility for Immunisation. The facility transfers funds to the Global Alliance
for Vaccines and Immunization (GAVI), a public-private global health partnership aimed at supporting health care and providing
vaccines to reduce the number of vaccine-preventable deaths among children in low income countries.

85
Nat
iona
l Tre
asur
y | A
nnua
l Per
form
ance
Pla
n | 2
018/
19
PART B: PROGRAMME AND SUB-PROGRAMME PLANS - Continued7.
4. S
trat
egic
Pla
n O
bjec
tive
Ann
ual a
nd M
ediu
m T
erm
Tar
gets
PERF
ORM
AN
CE
IND
ICAT
OR
AUD
ITED
/ACT
UA
L PE
RFO
RMA
NCE
ESTI
MAT
ED
PERF
ORM
AN
CEPL
AN
NED
PE
RFO
RMA
NCE
CU
RREN
T YE
AR
MED
IUM
TER
M T
ARG
ETS
(MTE
F)
2014
/15
2015
/16
2016
/17
2017
/18
2018
/19
2019
/20
2020
/21
2021
/22
2022
/23
2023
/24
Stra
tegi
c O
bjec
tive
6.1:
Adv
ance
Sou
th A
fric
a’s in
tere
sts
spec
ifica
lly, a
nd th
ose
of A
fric
a m
ore
gene
rally
, thr
ough
regu
lar s
trat
egic
ana
lysi
s, en
gage
men
ts a
nd n
egot
iatio
ns a
t reg
iona
l an
d gl
obal
fina
ncia
l and
eco
nom
ic fo
rum
s
6.1
Num
ber o
f ini
tiativ
es
cond
ucte
d to
adv
ance
So
uth
Afri
ca’s
inte
rest
s sp
ecifi
cally
, and
th
ose
of A
frica
mor
e ge
nera
lly
##
#22
2222
2222
2222
Stra
tegi
c O
bjec
tive
6.2:
Incr
ease
Afr
ica’s
voi
ce a
nd S
outh
Afr
ica’s
influ
ence
in in
tern
atio
nal i
nstit
utio
ns a
nd fo
rum
s
6.2
Num
ber o
f str
ateg
ic
Min
iste
rial b
riefin
gs
aim
ed a
t gov
erna
nce
refo
rms
in in
tern
atio
nal
finan
cial
inst
itutio
ns
prov
ided
60
##
##
44
44
44
Stra
tegi
c O
bjec
tive
6.3
: Sup
port
an
enab
ling
envi
ronm
ent f
or in
crea
sed
econ
omic
act
ivity
with
in A
fric
a
6.3
Afri
can
stra
tegy
im
plem
ente
d#
##
Dra
ft A
frica
St
rate
gyA
ppro
ved
Afri
ca
Stra
tegy
Afri
ca S
trat
egy
impl
emen
ted
Afri
ca S
trat
egy
impl
emen
tatio
n m
onito
red
Afric
a St
rate
gy
impl
emen
tatio
n m
onito
red
Afric
a St
rate
gy
impl
emen
tatio
n m
onito
red
Afric
a St
rate
gy
impl
emen
tatio
n m
onito
red

86
Nat
iona
l Tre
asur
y | A
nnua
l Per
form
ance
Pla
n | 2
018/
19
PART B: PROGRAMME AND SUB-PROGRAMME PLANS - Continued
7.5.
Pro
gram
me
Perf
orm
ance
Indi
cato
rs a
nd A
nnua
l Tar
gets
PERF
ORM
AN
CE IN
DIC
ATO
RAU
DIT
ED/A
CTU
AL
PERF
ORM
AN
CEES
TIM
ATED
PE
RFO
RMA
NCE
PLA
NN
ED
PERF
ORM
AN
CE
CURR
ENT
YEA
R
MED
IUM
TER
M T
ARG
ETS
(MTE
F)
2014
/15
2015
/16
2016
/17
2017
/18
2018
/19
2019
/20
2020
/21
2021
/22
Stra
tegi
c O
bjec
tive
6.1:
Adv
ance
Sou
th A
fric
a’s in
tere
sts
spec
ifica
lly, a
nd th
ose
of A
fric
a m
ore
gene
rally
, thr
ough
regu
lar s
trat
egic
ana
lysi
s, en
gage
men
ts a
nd n
egot
iatio
ns a
t reg
iona
l an
d gl
obal
fina
ncia
l and
eco
nom
ic fo
rum
s
6.1.
1Pe
rcen
tage
of o
blig
atio
ns to
war
ds i
nter
natio
nal a
gree
men
ts m
et
mon
itore
dN
/AN
/A10
0%10
0%10
0%10
0%10
0%10
0%
6.1.
2Pe
rcen
tage
resp
onse
to c
usto
mer
requ
ests
on
man
dato
ry b
riefin
g no
tes
and
anal
ysis
##
#10
0%10
0%10
0%10
0%10
0%
6.1.
3Pe
rcen
tage
resp
onse
to c
usto
mer
requ
est o
n ad
-hoc
brie
fing
note
s an
d an
alys
is#
##
100%
100%
100%
100%
100%
Stra
tegi
c O
bjec
tive
6.2:
Incr
ease
Afr
ica’s
voi
ce a
nd S
outh
Afr
ica’s
influ
ence
in in
tern
atio
nal i
nstit
utio
ns a
nd fo
rum
s
6.2.
1N
umbe
r of i
nter
vent
ions
to in
crea
se S
outh
Afri
ca’s
pres
ence
with
in
inst
itutio
ns o
f par
ticul
ar s
trat
egic
val
ue61
N/A
N/A
31
11
11
6.2.
2Pe
rcen
tage
of i
nter
vent
ions
in p
ursu
it of
inst
itutio
nal r
efor
m
impl
emen
ted
N/A
N/A
910
0%10
0%10
0%10
0%10
0%
Stra
tegi
c O
bjec
tive
6.3:
Sup
port
an
enab
ling
envi
ronm
ent f
or in
crea
sed
econ
omic
act
ivity
with
in A
fric
a
6.3.
1N
umbe
r of i
nitia
tives
dev
elop
ed to
exp
and
rela
tions
with
key
st
rate
gic
part
ners
in A
frica
N/A
N/A
31
11
11
6.3.
2Pe
rcen
tage
of i
mpl
emen
ted
iden
tified
pro
ject
s an
d pl
ans
to
acce
lera
te re
gion
al in
tegr
atio
n re
view
ed62
N/A
N/A
100%
100%
100%
100%
100%
100%

87
Nat
iona
l Tre
asur
y | A
nnua
l Per
form
ance
Pla
n | 2
018/
19
PART B: PROGRAMME AND SUB-PROGRAMME PLANS - Continued7.
6. P
rogr
amm
e Pe
rfor
man
ce In
dica
tor Q
uart
erly
Tar
gets
For
201
8/19
PERF
ORM
AN
CE IN
DIC
ATO
R20
18/1
9 A
NN
UA
L TA
RGET
SQ
UA
RTER
1Q
UA
RTER
2Q
UA
RTER
3Q
UA
RTER
4
Stra
tegi
c O
bjec
tive
6.1:
Adv
ance
Sou
th A
fric
a’s in
tere
sts
spec
ifica
lly, a
nd th
ose
of A
fric
a m
ore
gene
rally
, thr
ough
regu
lar s
trat
egic
ana
lysi
s, en
gage
men
ts a
nd n
egot
iatio
ns a
t reg
iona
l an
d gl
obal
fina
ncia
l and
eco
nom
ic fo
rum
s
6.1.
1Pe
rcen
tage
of o
blig
atio
ns to
war
ds i
nter
natio
nal a
gree
men
ts m
et m
onito
red
100%
100%
100%
100%
100%
6.1.
2Pe
rcen
tage
resp
onse
to c
usto
mer
requ
ests
on
man
dato
ry b
riefin
g no
tes
and
anal
ysis
100%
100%
100%
100%
100%
6.1.
3Pe
rcen
tage
resp
onse
to c
usto
mer
requ
est o
n ad
-hoc
brie
fing
note
s an
d an
alys
is10
0%10
0%10
0%10
0%10
0%
Stra
tegi
c O
bjec
tive
6.2:
Incr
ease
Afr
ica’s
voi
ce a
nd S
outh
Afr
ica’s
influ
ence
in in
tern
atio
nal i
nstit
utio
ns a
nd fo
rum
s
6.2.
1N
umbe
r of i
nter
vent
ions
to in
crea
se S
outh
Afri
ca’s
pres
ence
with
in in
stitu
tions
of p
artic
ular
st
rate
gic
valu
e1
N/A
N/A
N/A
1
6.2.
2Pe
rcen
tage
of i
nter
vent
ions
in p
ursu
it of
inst
itutio
nal r
efor
m im
plem
ente
d10
0%10
0%10
0%10
0%10
0%
Stra
tegi
c O
bjec
tive
6.3:
Sup
port
an
enab
ling
envi
ronm
ent f
or in
crea
sed
econ
omic
act
ivity
with
in A
fric
a
6.3.
1N
umbe
r of i
nitia
tives
dev
elop
ed to
exp
and
rela
tions
with
key
str
ateg
ic p
artn
ers
in A
frica
1N
/AN
/AN
/A1
6.3.
2Pe
rcen
tage
of i
mpl
emen
ted
iden
tified
pro
ject
s an
d pl
ans
to a
ccel
erat
e re
gion
al in
tegr
atio
n re
view
ed10
0%10
0%10
0%10
0%10
0%

88
Nat
iona
l Tre
asur
y | A
nnua
l Per
form
ance
Pla
n | 2
018/
19
PART B: PROGRAMME AND SUB-PROGRAMME PLANS - Continued
7.7.
Exp
endi
ture
Tre
nds
and
Estim
ates
Inte
rnat
iona
l Fin
anci
al R
elat
ions
exp
endi
ture
tren
ds a
nd e
stim
ates
by
sub-
prog
ram
me
and
econ
omic
cla
ssifi
catio
n
Sub-
prog
ram
me
Aud
ited
outc
ome
Adj
uste
dap
prop
riat
ion
Aver
age
grow
thra
te (%
)
Aver
age:
expe
n-di
ture
/to
tal (
%)
Med
ium
term
exp
endi
ture
estim
ate
Aver
age
grow
thra
te (%
)
Aver
age:
expe
n-di
ture
/to
tal (
%)
R m
illio
n 2
014/
15
201
5/16
2
016/
17
201
7/18
2
014/
15 -
2017
/18
201
8/19
2
019/
20
202
0/21
2
017/
18 -
2020
/21
Prog
ram
me
Man
agem
ent f
or
Inte
rnat
iona
l Fin
anci
al R
elat
ions
8.3
14.5
10.0
9.1
3.1%
0.3%
12.3
13.9
14.3
16.2
%0.
2%
Inte
rnat
iona
l Eco
nom
ic C
oope
ratio
n27
.330
.438
.342
.515
.9%
0.9%
39.8
46.0
49.6
5.3%
0.8%
Afri
can
Inte
grat
ion
and
Supp
ort
588.
371
7.5
796.
776
0.0
8.9%
18.4
%81
6.8
862.
691
0.0
6.2%
14.5
%
Inte
rnat
iona
l Dev
elop
men
t Fun
ding
In
stitu
tions
557.
62
762.
74
091.
84
999.
210
7.7%
79.9
%4
513.
44
801.
65
065.
30.
4%84
.1%
Inte
rnat
iona
l Pro
ject
s17
.221
.019
.020
.56.
1%0.
5%19
.921
.022
.22.
6%0.
4%
Tota
l 1
198.
73
546.
14
955.
85
831.
469
.4%
100.
0%5
402.
15
745.
16
061.
41.
3%10
0.0%
Cha
nge
to 2
017
Budg
et e
stim
ate
(5
.4)
(509
.0)
(501
.3)
(529
.3)
Econ
omic
cla
ssifi
catio
n
Curr
ent p
aym
ents
35.4
44.7
47.2
50.9
12.9
%1.
1%51
.559
.162
.87.
2%1.
0%
Com
pens
atio
n of
em
ploy
ees
26.1
28.2
32.0
30.7
5.5%
0.8%
36.2
40.4
43.2
12.1
%0.
7%
Goo
ds a
nd s
ervi
ces
9.3
16.5
15.2
20.3
29.6
%0.
4%15
.418
.819
.6-1
.1%
0.3%
of w
hich
:
Burs
arie
s: Em
ploy
ees
0.1
0.1
0.2
0.6
93.3
% –
0.
70.
80.
89.
5% –
Com
mun
icat
ion
0.4
0.4
0.2
0.3
-6.9
% –
0.
50.
50.
517
.4%
–
Trav
el a
nd su
bsist
ence
6.9
10.4
9.3
9.4
10.5
%0.
2%10
.611
.912
.610
.4%
0.2%
Trai
ning
and
dev
elop
men
t0.
20.
00.
10.
210
.2%
–
0.3
0.3
0.3
11.7
% –
Ope
ratin
g pa
ymen
ts0.
20.
30.
41.
178
.4%
–
1.3
1.4
1.3
5.4%
–
Venu
es a
nd fa
cilit
ies
0.3
4.4
0.8
6.1
183.
9%0.
1%1.
02.
93.
0-2
1.2%
0.1%
Tran
sfer
s an
d su
bsid
ies
788.
382
9.2
906.
491
0.7
4.9%
22.1
%97
2.8
1 02
7.3
1 08
3.8
6.0%
17.3
%
Fore
ign
gove
rnm
ents
and
in
tern
atio
nal o
rgan
isat
ions
788.
382
9.2
906.
491
0.7
4.9%
22.1
%97
2.8
1 02
7.3
1 08
3.8
6.0%
17.3
%
Hou
seho
lds
0.0
0.0
0.0
0.0
-26.
9% –
–
–
–
-1
00.0
% –
Paym
ents
for c
apita
l ass
ets
0.1
0.2
1.1
0.6
72.5
% –
0.
50.
71.
119
.5%
–
Mac
hine
ry a
nd e
quip
men
t0.
10.
21.
10.
672
.5%
–
0.5
0.7
1.1
19.5
% –

89
Nat
iona
l Tre
asur
y | A
nnua
l Per
form
ance
Pla
n | 2
018/
19
PART B: PROGRAMME AND SUB-PROGRAMME PLANS - Continued7.
7. E
xpen
ditu
re T
rend
s an
d Es
timat
es -
cont
inue
dIn
tern
atio
nal F
inan
cial
Rel
atio
ns e
xpen
ditu
re tr
ends
and
est
imat
es b
y su
b-pr
ogra
mm
e an
d ec
onom
ic c
lass
ifica
tion
Sub-
prog
ram
me
Aud
ited
outc
ome
Adj
uste
dap
prop
riat
ion
Aver
age
grow
thra
te (%
)
Aver
age:
expe
n-di
ture
/to
tal (
%)
Med
ium
term
exp
endi
ture
estim
ate
Aver
age
grow
thra
te (%
)
Aver
age:
expe
n-di
ture
/to
tal (
%)
R m
illio
n 2
014/
15
201
5/16
2
016/
17
201
7/18
2
014/
15 -
2017
/18
201
8/19
2
019/
20
202
0/21
2
017/
18 -
2020
/21
Paym
ents
for fi
nanc
ial a
sset
s37
4.8
2 67
2.0
4 00
1.1
4 86
9.1
135.
1%76
.7%
4 37
7.3
4 65
7.9
4 91
3.7
0.3%
81.7
%
Tota
l 1
198.
73
546.
14
955.
85
831.
469
.4%
100.
0%5
402.
15
745.
16
061.
41.
3%10
0.0%
Prop
ortio
n of
tota
l pro
gram
me
expe
nditu
re to
vot
e ex
pend
iture
4.6%
12.4
%17
.6%
14.4
% –
–
18
.4%
18.8
%18
.4%
–
–
Det
ails
of t
rans
fers
and
sub
sidi
es
Fore
ign
gove
rnm
ents
and
inte
rnat
iona
l org
anis
atio
ns
Curr
ent
605.
573
8.6
815.
778
0.6
8.8%
18.9
%83
6.7
883.
693
2.2
6.1%
14.9
%
Com
mon
Mon
etar
y A
rea
Com
pens
atio
n58
1.6
712.
579
2.3
754.
99.
1%18
.3%
804.
984
9.9
896.
75.
9%14
.4%
Colla
bora
tive
Afri
ca B
udge
t Ref
orm
In
itiat
ive
4.4
1.8
2.4
2.5
-17.
1%0.
1%1.
71.
81.
9-8
.8%
–
Com
mon
wea
lth F
und
for T
echn
ical
Co
oper
atio
n5.
75.
55.
86.
12.
3%0.
1%6.
46.
87.
25.
4%0.
1%
Inte
rnat
iona
l Fin
ance
Fac
ility
for
Imm
unis
atio
n11
.515
.513
.214
.47.
9%0.
4%13
.414
.215
.01.
3%0.
2%
Afri
can
Inst
itute
for E
cono
mic
D
evel
opm
ent a
nd P
lann
ing
0.9
1.2
1.0
1.2
7.9%
–
1.4
1.4
1.5
9.3%
–
Afri
ca R
egio
nal T
echn
ical
Ass
ista
nce
Cent
re fo
r Sou
ther
n A
frica
0.4
1.0
1.0
1.4
60.3
% –
1.
21.
31.
4-2
.1%
–
Infra
stru
ctur
e Co
nsor
tium
for A
frica
1.0
1.0
–
–
-100
.0%
–
–
–
–
–
–
Afri
can
Risk
Cap
acity
–
–
–
–
–
–
7.7
8.1
8.6
–
0.1%
Capi
tal
182.
890
.790
.713
0.1
-10.
7%3.
2%13
6.1
143.
715
1.7
5.2%
2.4%
Afri
can
Dev
elop
men
t Fun
d92
.1 –
–
73
.5-7
.3%
1.1%
35.4
37.4
39.4
-18.
7%0.
8%
Wor
ld B
ank
Gro
up90
.790
.790
.756
.7-1
4.5%
2.1%
100.
710
6.4
112.
225
.6%
1.6%

90
Nat
iona
l Tre
asur
y | A
nnua
l Per
form
ance
Pla
n | 2
018/
19
PART B: PROGRAMME AND SUB-PROGRAMME PLANS - Continued
7.8.
Per
sonn
el In
form
atio
n
Num
ber o
f pos
ts e
stim
ated
for 3
1 M
arch
201
8In
tern
atio
nal F
inan
cial
Rel
atio
ns p
erso
nnel
num
bers
and
cos
t by
sala
ry le
vel¹
Num
ber
Num
ber a
nd c
ost2 o
f per
sonn
el p
osts
fille
d / p
lann
ed fo
r on
fund
ed e
stab
lishm
ent
Num
ber o
ffu
nded
post
s
Num
ber o
f po
sts
addi
tiona
l to
the
esta
blis
hmen
t
Act
ual
Revi
sed
estim
ate
Med
ium
term
exp
endi
ture
est
imat
eAv
erag
egr
owth
rate
(%)
Aver
age:
sa
lary
leve
l/to
tal (
%)
2016
/17
2017
/18
2018
/19
2019
/20
2020
/21
2017
/18
- 202
0/21
Publ
ic F
inan
ce a
nd B
udge
t M
anag
emen
tN
umbe
rCo
stU
nit
cost
N
umbe
rCo
stU
nit
cost
N
umbe
rCo
stU
nit
cost
N
umbe
rCo
stU
nit
cost
N
umbe
rCo
stU
nit
cost
Sala
ry
leve
l40
137
32.0
0.9
3530
.40.
940
36.2
0.9
4240
.41.
042
43.2
1.0
6.3%
100.
0%
7 –
1012
–
126.
00.
512
5.7
0.5
146.
90.
514
7.4
0.5
137.
40.
62.
7%33
.3%
11 –
12
12 –
9
9.7
1.1
89.
61.
210
12.9
1.3
1115
.01.
411
16.2
1.5
11.2
%25
.2%
13 –
16
161
1616
.41.
015
15.1
1.0
1616
.41.
017
17.9
1.1
1819
.61.
16.
3%41
.5%
1. D
ata
has b
een
prov
ided
by
the
depa
rtm
ent a
nd m
ay n
ot n
eces
saril
y re
conc
ile w
ith o
ffici
al g
over
nmen
t per
sonn
el d
ata.
2. R
and
mill
ion.

91
Nat
iona
l Tre
asur
y | A
nnua
l Per
form
ance
Pla
n | 2
018/
19
PART B: PROGRAMME AND SUB-PROGRAMME PLANS - Continued
8. PROGRAMME 7: CIVIL AND MILITARY PENSIONS, CONTRIBUTIONS TO FUNDS AND OTHER BENEFITS
8.1. Purpose
Provide for government’s pension and post-retirement medical benefit obligations to former employees of state departments and
bodies. Provide for similar benefits to retired members of the military.
8.2. Strategic Objectives
STRATEGIC OBJECTIVE OBJECTIVE STATEMENT SUB-PROGRAMMES
SO 7.1 Ensure good governance and a robust control environment for fund administration
Ensure effective administration of funds where funds paid to eligible applicants and recipients are accurate, punctual and cost effective as required by the applicable legislation
• Civil Pensions and Contributions to Funds
• Military Pensions • Other Benefits
SO 7.2 Provide an improved and integrated customer service experience
Improve customer service by ensuring that customer complaints are resolved within agreed timelines; build relationships with employer departments through good communication
• Civil Pensions and Contributions to Funds
• Military Pensions• Other Benefits
8.3. Sub-Programme Overview
CIVIL PENSIONS AND CONTRIBUTIONS TO FUNDS
This sub-programme, consisting of post-retirement medical benefits, injury on duty and special pensions, provides for medical
subsidies to retired civil servants and pension payments to injured and disabled civil servants, to the beneficiaries of deceased civil
servants and to former struggle veterans.
MILITARY PENSIONS
This sub-programme provides for the payment of military pension benefits and medical claims arising from injuries sustained during
various wars including the liberation wars. The payment includes pension payments and medical assistance including devices and
other related expenses in terms of the Military Pensions Act.
OTHER BENEFITS
This sub-programme processes the payment of benefits to former members of legislative assemblies. These include payments to
former members of the legislative assemblies of the former Venda, Transkei, Ciskei and Bophuthatswana governments; judges or their
widows in terms of the Judges’ Remuneration and Conditions of Employment Act (Act No. 88 of 1989); and former state presidents.

92
Nat
iona
l Tre
asur
y | A
nnua
l Per
form
ance
Pla
n | 2
018/
19
PART B: PROGRAMME AND SUB-PROGRAMME PLANS - Continued
8.4.
Str
ateg
ic P
lan
Obj
ectiv
e A
nnua
l and
Med
ium
Ter
m T
arge
ts
PERF
ORM
AN
CE IN
DIC
ATO
RAU
DIT
ED/A
CTU
AL
PERF
ORM
AN
CEES
TIM
ATED
PE
RFO
RMA
NCE
PLA
NN
ED P
ERFO
RMA
NCE
CU
RREN
T YE
AR
MED
IUM
TER
M T
ARG
ETS
(MTE
F)
2014
/15
2015
/16
2016
/17
2017
/18
2018
/19
2019
/20
2020
/21
2021
/22
2022
/23
2023
/24
Stra
tegi
c O
bjec
tive
7.1:
Ens
ure
good
gov
erna
nce
and
robu
st c
ontr
ol e
nviro
nmen
t for
fund
adm
inis
trat
ion
7.1
Impr
oved
aud
it ou
tcom
esN
/AN
/AN
/AN
o re
peat
find
ings
No
repe
at fi
ndin
gsN
o re
peat
fin
ding
sN
o re
peat
fin
ding
sN
o re
peat
fin
ding
sN
o re
peat
fin
ding
sN
o re
peat
fin
ding
s
Stra
tegi
c O
bjec
tive
7.2:
Pro
vide
an
impr
oved
and
inte
grat
ed c
usto
mer
ser
vice
exp
erie
nce
7.2
Perc
enta
ge o
f cus
tom
er
com
plai
nts
resp
onde
d to
N/A
N/A
N/A
100%
100%
100%
100%
100%
100%
100%

93
Nat
iona
l Tre
asur
y | A
nnua
l Per
form
ance
Pla
n | 2
018/
19
PART B: PROGRAMME AND SUB-PROGRAMME PLANS - Continued8.
5. P
rogr
amm
e Pe
rfor
man
ce In
dica
tors
and
Ann
ual T
arge
ts
PERF
ORM
AN
CE IN
DIC
ATO
RAU
DIT
ED/A
CTU
AL
PERF
ORM
AN
CEES
TIM
ATED
PE
RFO
RMA
NCE
CU
RREN
T YE
AR
PLA
NN
ED
PERF
ORM
AN
CE
CURR
ENT
YEA
R
MED
IUM
TER
M T
ARG
ETS
(MTE
F)
2014
/15
2015
/16
2016
/17
2017
/18
2018
/19
2019
/20
2020
/21
2021
/22
Stra
tegi
c O
bjec
tive
7.1:
Ens
ure
good
gov
erna
nce
and
robu
st c
ontr
ol e
nviro
nmen
t for
fund
adm
inis
trat
ion
7.1.
1Pe
rcen
tage
of b
enefi
ts v
alid
ated
for p
aym
ent p
aid
with
in li
able
dat
es92
%92
.5%
95%
95%
96%
96%
100%
100%
7.1.
2Pe
rcen
tage
com
plia
nce
with
SLA
bet
wee
n N
T an
d G
PAA
spe
cific
ally
Pr
ogra
mm
e 7
rela
ted
indi
cato
rs96
%97
.5%
83%
97%
97.5
%97
.5%
100%
100%
7.1.
3Pe
rcen
tage
inte
grity
of c
lient
dat
aN
/A68
.25%
100%
80%
85%
85%
90%
95%
Stra
tegi
c O
bjec
tive
7.2:
Pro
vide
an
impr
oved
and
inte
grat
ed c
usto
mer
ser
vice
exp
erie
nce
7.2.
1Pe
rcen
tage
of c
usto
mer
ser
vice
com
plai
nts
resp
onde
d to
with
in s
even
da
ys10
0%10
0%10
0%10
0%10
0%10
0%10
0%10
0%
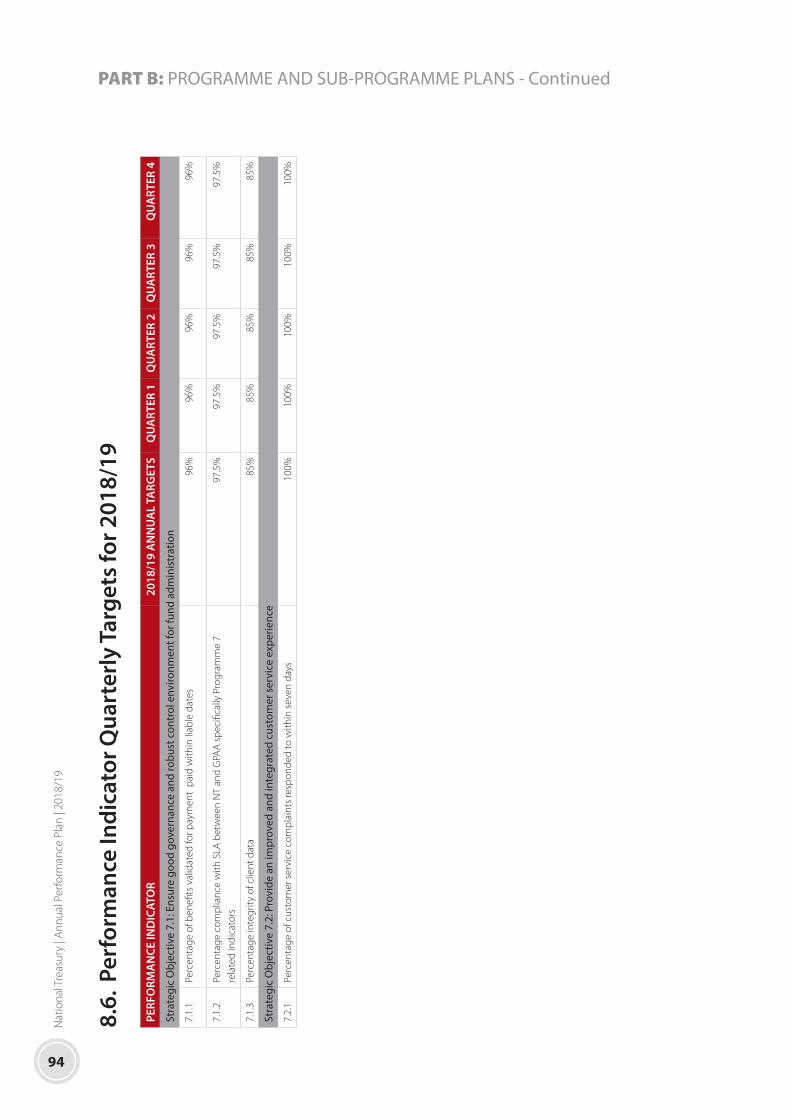
94
Nat
iona
l Tre
asur
y | A
nnua
l Per
form
ance
Pla
n | 2
018/
19
PART B: PROGRAMME AND SUB-PROGRAMME PLANS - Continued
8.6.
Per
form
ance
Indi
cato
r Qua
rter
ly T
arge
ts fo
r 201
8/19
PERF
ORM
AN
CE IN
DIC
ATO
R20
18/1
9 A
NN
UA
L TA
RGET
SQ
UA
RTER
1Q
UA
RTER
2Q
UA
RTER
3Q
UA
RTER
4
Stra
tegi
c O
bjec
tive
7.1:
Ens
ure
good
gov
erna
nce
and
robu
st c
ontr
ol e
nviro
nmen
t for
fund
adm
inis
trat
ion
7.1.
1Pe
rcen
tage
of b
enefi
ts v
alid
ated
for p
aym
ent
paid
with
in li
able
dat
es96
%96
%96
%96
%96
%
7.1.
2Pe
rcen
tage
com
plia
nce
with
SLA
bet
wee
n N
T an
d G
PAA
spe
cific
ally
Pro
gram
me
7 re
late
d in
dica
tors
97.5
%97
.5%
97.5
%97
.5%
97.5
%
7.1.
3Pe
rcen
tage
inte
grity
of c
lient
dat
a85
%85
%85
%85
%85
%
Stra
tegi
c O
bjec
tive
7.2:
Pro
vide
an
impr
oved
and
inte
grat
ed c
usto
mer
ser
vice
exp
erie
nce
7.2.
1Pe
rcen
tage
of c
usto
mer
ser
vice
com
plai
nts
resp
onde
d to
with
in s
even
day
s10
0%10
0%10
0%10
0%10
0%

95
Nat
iona
l Tre
asur
y | A
nnua
l Per
form
ance
Pla
n | 2
018/
19
PART B: PROGRAMME AND SUB-PROGRAMME PLANS - Continued8.
7. E
xpen
ditu
re T
rend
s an
d Es
timat
es
Civi
l and
Mili
tary
Pen
sion
s, C
ontr
ibut
ions
to F
unds
and
Oth
er B
enefi
ts e
xpen
ditu
re tr
ends
and
est
imat
es b
y su
b-pr
ogra
mm
e an
d ec
onom
ic c
lass
ifica
tion
Sub-
prog
ram
me
Aud
ited
outc
ome
Adj
uste
dap
prop
riat
ion
Aver
age
grow
thra
te (%
)
Aver
age:
expe
n-di
ture
/to
tal (
%)
Med
ium
term
exp
endi
ture
estim
ate
Aver
age
grow
thra
te (%
)
Aver
age:
expe
n-di
ture
/to
tal (
%)
R m
illio
n 2
014/
15
201
5/16
2
016/
17
201
7/18
2
014/
15 -
2017
/18
201
8/19
2
019/
20
202
0/21
2
017/
18 -
2020
/21
Gov
ernm
ent P
ensi
ons
Adm
inis
trat
ion
Age
ncy
54.4
56.6
61.3
65.2
6.2%
1.4%
68.9
72.7
76.7
5.6%
1.3%
Civ
il Pe
nsio
ns a
nd C
ontr
ibut
ions
to
Fund
s2
613.
93
156.
53
249.
23
825.
613
.5%
75.9
%4
145.
04
496.
84
743.
57.
4%80
.2%
Mili
tary
Pen
sion
s an
d O
ther
Ben
efits
1 06
2.6
754.
61
089.
794
4.2
-3.9
%22
.7%
950.
01
005.
01
061.
14.
0%18
.5%
Tota
l 3
730.
93
967.
74
400.
24
835.
09.
0%10
0.0%
5 16
3.8
5 57
4.5
5 88
1.2
6.7%
100.
0%
Cha
nge
to 2
017
Budg
et e
stim
ate
–
2.
93.
23.
5
Econ
omic
cla
ssifi
catio
n
Curr
ent p
aym
ents
54.4
56.6
61.3
65.2
6.2%
1.4%
68.9
72.7
76.7
5.6%
1.3%
Goo
ds a
nd s
ervi
ces
54.4
56.6
61.3
65.2
6.2%
1.4%
68.9
72.7
76.7
5.6%
1.3%
of w
hich
:
Cons
ulta
nts:
Busin
ess a
nd a
dviso
ry
serv
ices
54.4
56.6
61.3
65.2
6.2%
1.4%
68.9
72.7
76.7
5.6%
1.3%
Tran
sfer
s an
d su
bsid
ies
3 67
6.5
3 91
1.1
4 33
8.9
4 76
9.8
9.1%
98.6
%5
094.
95
501.
85
804.
56.
8%98
.7%
Fore
ign
gove
rnm
ents
and
in
tern
atio
nal o
rgan
isat
ions
2.3
2.1
1.2
2.6
3.9%
–
2.7
2.8
3.0
5.4%
0.1%
Hou
seho
lds
3 67
4.2
3 90
9.0
4 33
7.6
4 76
7.2
9.1%
98.5
%5
092.
25
498.
95
801.
56.
8%98
.6%
Paym
ents
for fi
nanc
ial a
sset
s0.
00.
0 –
–
-1
00.0
% –
–
–
–
–
–
Tota
l 3
730.
93
967.
74
400.
24
835.
09.
0%10
0.0%
5 16
3.8
5 57
4.5
5 88
1.2
6.7%
100.
0%
Prop
ortio
n of
tota
l pro
gram
me
expe
nditu
re to
vot
e ex
pend
iture
14.2
%13
.8%
15.6
%11
.9%
–
–
17.6
%18
.2%
17.9
% –
–
Det
ails
of t
rans
fers
and
sub
sidi
es
Hou
seho
lds
Soci
al b
enefi
ts
Curr
ent
3 67
4.2
3 90
9.0
4 33
7.6
4 76
7.2
9.1%
98.5
%5
092.
25
498.
95
801.
56.
8%98
.6%

96
Nat
iona
l Tre
asur
y | A
nnua
l Per
form
ance
Pla
n | 2
018/
19
PART B: PROGRAMME AND SUB-PROGRAMME PLANS - Continued
8.7.
Exp
endi
ture
Tre
nds
and
Estim
ates
- co
ntin
ued
Civi
l and
Mili
tary
Pen
sion
s, C
ontr
ibut
ions
to F
unds
and
Oth
er B
enefi
ts e
xpen
ditu
re tr
ends
and
est
imat
es b
y su
b-pr
ogra
mm
e an
d ec
onom
ic c
lass
ifica
tion
Sub-
prog
ram
me
Aud
ited
outc
ome
Adj
uste
dap
prop
riat
ion
Aver
age
grow
thra
te (%
)
Aver
age:
expe
n-di
ture
/to
tal (
%)
Med
ium
term
exp
endi
ture
estim
ate
Aver
age
grow
thra
te (%
)
Aver
age:
expe
n-di
ture
/to
tal (
%)
R m
illio
n 2
014/
15
201
5/16
2
016/
17
201
7/18
2
014/
15 -
2017
/18
201
8/19
2
019/
20
202
0/21
2
017/
18 -
2020
/21
Cont
ribut
ion
to p
rovi
dent
fund
s fo
r as
soci
ated
inst
itutio
ns
0.3
0.3
0.3
0.3
-2.2
% –
0.
30.
40.
48.
2% –
Oth
er b
enefi
ts70
.482
.592
.884
.36.
2%1.
9%98
.610
4.1
109.
89.
2%1.
8%
Inju
ry o
n du
ty52
6.4
514.
956
3.5
577.
23.
1%12
.9%
652.
368
8.8
726.
78.
0%12
.3%
Post
-Ret
irem
ent m
edic
al s
chem
e1
509.
42
107.
42
133.
52
401.
916
.7%
48.1
%2
613.
12
893.
33
064.
78.
5%51
.1%
Spec
ial p
ensi
ons
423.
543
9.8
447.
845
7.7
2.6%
10.4
%45
7.2
468.
048
0.0
1.6%
8.7%
Polit
ical
Offi
ce B
eare
rs P
ensi
on F
und
72.0
–
–
291.
259
.3%
2.1%
306.
132
3.2
341.
05.
4%5.
9%
Pens
ion
bene
fits:
Pres
iden
t of S
outh
A
frica
7.9
7.3
7.7
7.8
-0.3
%0.
2%11
.712
.914
.322
.3%
0.2%
Mili
tary
pen
sion
s: Ex
-ser
vice
men
11.7
2.9
2.3
3.4
-33.
6%0.
1%3.
02.
82.
6-8
.7%
0.1%
Sout
h A
frica
n ci
tizen
forc
e15
5.9
166.
217
5.5
180.
14.
9%4.
0%19
3.6
205.
321
7.1
6.4%
3.7%
Oth
er b
enefi
ts: E
x-se
rvic
emen
20.2
10.5
12.3
23.3
5.0%
0.4%
16.0
18.3
19.9
-5.1
%0.
4%
Non
-sta
tuto
ry fo
rces
874.
857
5.0
899.
673
7.3
-5.5
%18
.2%
737.
377
8.6
821.
43.
7%14
.3%
Post
-ret
irem
ent m
edic
al s
chem
e -
Parli
amen
tary
sta
ff1.
72.
22.
42.
615
.8%
0.1%
2.9
3.2
3.5
10.0
%0.
1%
Fore
ign
gove
rnm
ents
and
inte
rnat
iona
l org
anis
atio
ns
Curr
ent
2.3
2.1
1.2
2.6
3.9%
–
2.7
2.8
3.0
5.4%
0.1%
Uni
ted
King
dom
tax
2.3
2.1
1.2
2.6
3.9%
–
2.7
2.8
3.0
5.4%
0.1%

97
Nat
iona
l Tre
asur
y | A
nnua
l Per
form
ance
Pla
n | 2
018/
19
PART B: PROGRAMME AND SUB-PROGRAMME PLANS - Continued
9. PROGRAMME 8: TECHNICAL AND MANAGEMENT SUPPORT AND DEVELOPMENT FINANCE
9.1. Purpose
This programme provides advisory services, programme management and development finance support to improve public finance
management, support high-impact government initiatives, facilitate employment creation, and strengthen infrastructure planning
and delivery.
9.2. Strategic Objectives
STRATEGIC OBJECTIVE OBJECTIVE STATEMENT SUB-PROGRAMMES
SO 8.1 Establish the GTAC as a centre of excellence in public sector advisory services, transaction support, project management and public finance management
Build public sector capacity through diagnostic and advisory services and support for organisational development, specialised procurement, improved public finance management and programme and project implementation
• GTAC
SO 8.2 Local government financial management improvement
Strengthen public finance management capacity in municipalities and support provincial treasury oversight of local government financial management
• Financial Management Grant
SO 8.3 Promotion of urban integration and neighbourhood development
Promote public and private investment in city development, integrated urban networks and neighbourhood development initiatives
• Urban Development and Support• Neighbourhood Development
Partnership Grant• Integrated City Development Grant
SO 8.4 Facilitation of employment creation and inclusive growth
Promote innovative and partnership-based approaches to employment creation, work-seeker support and enterprise development
• Employment Creation Facilitation• Jobs Fund
SO 8.5 Improved infrastructure planning, management and skills development
Support infrastructure planning, implementation and skills development in provinces and municipalities
• Infrastructure Development Support• Infrastructure Skills Development Grant• Infrastructure Delivery Improvement
Programme
9.3. Sub-Programmes
GOVERNMENT TECHNICAL ADVISORY CENTRE (GTAC)
GTAC draws its mandate from the responsibility of National Treasury to promote transparency and the effective management of public
finances and to assist organs of state in building their capacity for efficient, effective and transparent financial management, as set
out in section 6 of the Public Finance Management Act (PFMA). GTAC was established as a government component in terms of
section 7A(4) of the Public Service Act (Act No. 103 of 1994) through Government Notice 261, Gazette 35194, of 30 March 2012.
GTAC is a component of National Treasury. GTAC’s financing streams include core funding from National Treasury, donor funding from
international partners, and cost recovery on the provision of services.
GTAC’s scheduled functions are:
• To render technical consulting services to centre-of-government departments and organs of state
• To provide specialised procurement support for high-impact government initiatives
• To provide advice on the feasibility of infrastructure projects

98
Nat
iona
l Tre
asur
y | A
nnua
l Per
form
ance
Pla
n | 2
018/
19
PART B: PROGRAMME AND SUB-PROGRAMME PLANS - Continued
• To provide knowledge management for projects undertaken
• Anything ancillary to the functions listed
In support of National Treasury and its functions as set out in the PFMA, GTAC’s responsibilities include the following:
• Advising on the feasibility and financing of major capital projects and the investment requirements of state-owned companies
• Supporting PPP transactions, in keeping with provisions of the PFMA and Treasury Regulations
• Undertaking expenditure and performance reviews for National Treasury and the DPME
• Providing support for budgetary and public finance management reform, enhancing accountability, transparency and effective
service delivery
• Advising on organisational development, strategic planning and operational improvements in public service delivery
• Providing support for infrastructure investment, economic development and social service delivery improvements, in line with
the NDP and the MTSF
GTAC’s long term strategic intent is to provide a centre of excellence in policy advice and public finance management, in partnership
with academic and research centres focused on public-sector management and training. In partnership with the Southern African
Labour and Development Research Unit at the University of Cape Town, GTAC supports a research programme on employment,
income distribution and inclusive growth and seeks to promote public discourse and understanding of public policy, social and
economic development and public finance management through publications, consultative forums and dialogue.
On behalf of National Treasury, GTAC administers the Employment Creation Facilitation Programme and the Municipal Finance
Improvement Programme, and contributes to the City Support and Infrastructure Delivery Improvement Programmes of the
Intergovernmental Relations division.
Within the context of the NDP and the MTSF, GTAC contributes to building a capable and development-oriented state while also
strengthening capacity to work with the private sector in promoting growth, employment, infrastructure investment and public
service delivery.
For the medium term period ahead, GTAC’s activities are organised as follows:
• Management Support Services: Strategy, management and communications, financial management, human capital management,
including human resources management and professional services procurement
• Transaction and Advisory Services: Public policy and finance advice, organisational development, planning and project management
services, advice and support to departments, municipalities and public entities on PPPs and high-impact procurement projects;
transaction and contract management support for large or complex procurement processes. Advice and support for infrastructure
and development finance, analysis of public expenditure and performance, environmental economics, state actuarial advice and
capital project appraisal
• Programme Management Services: Planning and administration of the Jobs Fund, monitoring and evaluation of projects and
support for employment-related research and planning, administration and monitoring of the MFIP III programme
LOCAL GOVERNMENT FINANCIAL MANAGEMENT SUPPORT
The Local Government Financial Management Support sub-programme has one component:
• The Municipal Finance Improvement Programme (MFIP), which provides technical assistance and support to National Treasury,
provincial treasuries and municipalities by placing long term advisors with experience and expertise in municipal financial
management to facilitate key reforms, improvements and skills transfer
The third phase of the MFIP (MFIP III) commenced in April 2017 and draws extensively on the experiences and lessons of the first two

99
Nat
iona
l Tre
asur
y | A
nnua
l Per
form
ance
Pla
n | 2
018/
19
PART B: PROGRAMME AND SUB-PROGRAMME PLANS - Continued
phases of the programme. The MFIP is administered by a Programme Management Unit (PMU) located functionally in the Office of the
Accountant-General and is led by the Head of the Programme Management (PMU). GTAC provides administrative support to the PMU.
Its responsibilities include assigning municipal finance specialists to assist national and provincial treasuries to improve their ability to
monitor and support municipalities, and placing long term advisors directly at municipalities, based on requests for assistance and
diagnostic assessment outcomes.
The main intended outcomes of the MFIP are improved financial management capacity, qualified finance officers, enhanced budget
and financial management practices, and improved financial health and audit outcomes. The MFIP is overseen by a steering committee
chaired by the Accountant-General and constituted by national and provincial programme stakeholders.
URBAN DEVELOPMENT AND SUPPORT
Urban Development and Support consists of two programmes:
The Neighbourhood Development Partnership Programme, which supports municipal planning and investment in targeted locations,
aimed at attracting and sustaining third-party capital investment and business development towards spatial and economic
transformation, with a focus on improving the quality of life and access to opportunities in under-served townships or settlements.
The Neighbourhood Development Partnership Grant (NDPG) was introduced in 2006 with an initial commitment of R10 billion to invest
in under-served residential neighborhoods and to leverage private sector development in these areas.
The NDP’s Urban Network Strategy targets urban hub precincts with secondary linkages to under-served residential areas and built
environment upgrade projects in urban or rural townships. The NDPG consists of two complementary components: a technical
assistance grant for municipal planning of potential capital projects within urban hubs across sectors and spheres, and a capital grant
for funding selected catalytic projects within urban hubs.
The programme aims to encourage complementary public and private investment in these targeted locations and in this way contribute
to the broader goal of livable, sustainable, resilient, efficient and integrated towns and cities. The Urban Network Strategy aims to
optimise the spatial impact of public infrastructure investment, fiscal and regulatory measures and coordinated urban management
in identified transit-oriented urban hubs. NDP projects in rural municipalities are supported in collaboration with the Department of
Rural Development and Land Reform.
The Cities Support Programme (CSP) aims to promote cities that are inclusive, productive and sustainable through accelerated and more
inclusive development in major urban areas. This is delivered by focusing on improvements to cities’ governance and built environment
planning, improved human settlements and public transport management, local economic development and environmental
sustainability as well as climate resilience. The CSP includes technical assistance, peer learning, collaborative reviews and development
finance support and is implemented through a partnership model that includes the Development Bank of Southern Africa, the World
Bank, SA Cities Network and GTAC.
The Integrated City Development Grant (ICDG) was introduced in 2013/14 and is a component of National Treasury’s broader Cities
Support Programme (CSP). The ICDG is intended as an incentive to metropolitan municipalities to strengthen planning and delivery
capacity and to target infrastructure spending to transform inefficient urban landscapes into more inclusive, productive and sustainable
spatial forms. Eligibility is restricted to municipalities with sound financial management and acceptable levels of capital expenditure
performance. To receive the first 2015/16 transfer of the ICDG, municipalities must approve and submit a Built Environment Performance
Plan (BEPP) that identifies catalytic projects and associated outcome targets for identified integration zones. Subsequent transfers will
be linked to progress reports on these projects.

100
Nat
iona
l Tre
asur
y | A
nnua
l Per
form
ance
Pla
n | 2
018/
19
PART B: PROGRAMME AND SUB-PROGRAMME PLANS - Continued
The NDPG is administered by the Neighbourhood Development Programme under the Intergovernmental Relations division, while
the CSP reports to the Provincial and Local Government Infrastructure units of the Intergovernmental Relations division.
EMPLOYMENT CREATION FACILITATION
The Employment Creation Facilitation sub-programme was introduced in 2011 to contribute to employment and inclusive growth by
supporting innovative approaches to job creation and enterprise development. The main component of the programme is the Jobs
Fund, a multi-year R9 billion investment which leverages complementary funding from public and private sector project partners.
It operates as a “challenge fund” and allocates matching grants following a competitive, open and transparent application process.
Project allocations are made by an independent investment committee.
As at 30 June 2016, the Jobs Fund had completed five funding rounds and approved 104 projects with a total grant value of R5.42
billion. Commitments by project partners amounted to a further R6.37 billion. The approved projects target the creation of 126 547 new
permanent jobs, 88 997 permanent placements in existing vacant jobs and 222 377 training opportunities. Enterprise development
and work-seeker support projects account for the bulk of project allocations and employment commitments.
A further call for proposals was initiated in November 2015 aimed at providing financial assistance for new and innovative initiatives
that had high potential for direct job creation in the short to medium term and/or were focused on reducing barriers to job creation.
These initiatives had to display the potential for triggering systemic change in the South African market, thus unlocking long term job
creation. Concept note applications for this round opened on 17 November 2015 and closed on 1 February 2016. To date, 21 projects
have been approved but the final outcome from this round is set to be confirmed by the Jobs Fund Investment Committee (IC) by the
end of the year. Once these have been confirmed, their contracted targets will be added to the current portfolio targets, which will
result in a possible new permanent job target of at least 140 000 and a permanent placement target of 98 000.
The Employment Facilitation sub-programme also supports a research project (REDI3x3), based at the Southern African Labour
and Development Research Unit at the University of Cape Town, and the www.econ3x3.org web forum which publishes accessible
policy-relevant research on employment, income distribution and inclusive growth.
INFRASTRUCTURE DEVELOPMENT SUPPORT
The Infrastructure Development Support sub-programme consists of two elements:
The Infrastructure Skills Development Grant (ISDG), which assists municipalities to provide built environment graduates with training and
support leading to professional registration.
The Infrastructure Delivery Improvement Programme (IDIP), which provides advisory and technical support to provincial departments of health,
education and public works, and to selected municipalities, to improve infrastructure planning, procurement and contract management.
Municipalities apply for funding from the ISDG through a business plan which demonstrates that they have suitable projects, and
training and mentoring capacity to support identified graduates in engineering, town planning, architecture, quantity surveying,
geographic information systems and project management on the “road-to-registration” with the relevant statutory councils. The
business plan must include an absorption strategy for successful candidates in the applicant municipality or in another municipality.
The key intended outcomes of the grant are to develop technical capacity in local government and increase the number of qualified
and professionally registered graduates in built environment disciplines. The grant is administered by the Provincial and Local
Government Infrastructure Unit of the Intergovernmental Relations division and its requirements are set out in the ISDG Guidelines
published by the unit.

101
Nat
iona
l Tre
asur
y | A
nnua
l Per
form
ance
Pla
n | 2
018/
19
PART B: PROGRAMME AND SUB-PROGRAMME PLANS - Continued
The Provincial and Local Government Infrastructure Unit is also responsible for the IDIP, through which experienced professional
advisors are assigned to provincial departments or municipalities to assist with developing infrastructure planning and project
management capacity. Currently in its third phase, the IDIP programme includes implementation support for the Infrastructure
Delivery Management System (IDMS) developed in partnership with the Construction Industry Development Board. The programme
is implemented in cooperation with the national departments of Basic Education, Health and Public Works.
GAUTRAIN LOAN
Programme 8 includes provision for the repayment of the R4.2 billion loan to Gauteng Province that was provided in 2009/10 to
contribute to the investment requirements of the Gautrain project. The final payment was made in April 2017.
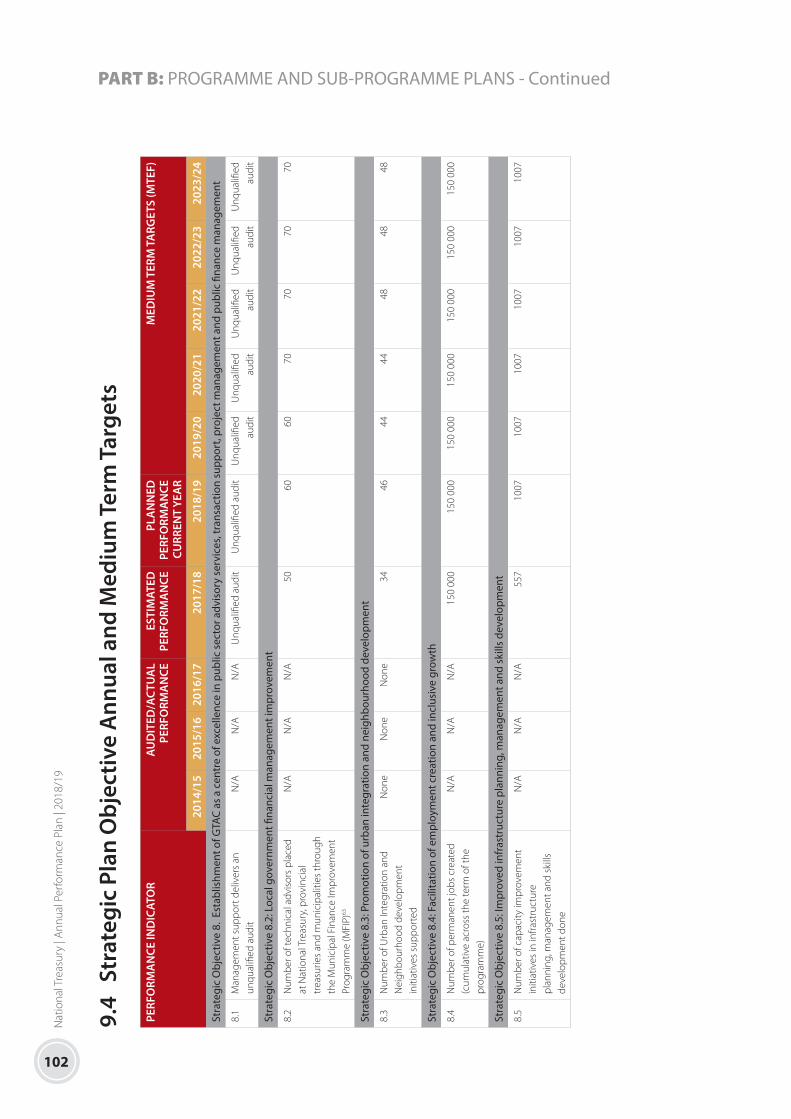
102
Nat
iona
l Tre
asur
y | A
nnua
l Per
form
ance
Pla
n | 2
018/
19
PART B: PROGRAMME AND SUB-PROGRAMME PLANS - Continued
9.4
Stra
tegi
c Pl
an O
bjec
tive
Ann
ual a
nd M
ediu
m T
erm
Tar
gets
PERF
ORM
AN
CE IN
DIC
ATO
RAU
DIT
ED/A
CTU
AL
PERF
ORM
AN
CEES
TIM
ATED
PE
RFO
RMA
NCE
PLA
NN
ED
PERF
ORM
AN
CE
CURR
ENT
YEA
R
MED
IUM
TER
M T
ARG
ETS
(MTE
F)
2014
/15
2015
/16
2016
/17
2017
/18
2018
/19
2019
/20
2020
/21
2021
/22
2022
/23
2023
/24
Stra
tegi
c O
bjec
tive
8. E
stab
lishm
ent o
f GTA
C as
a c
entr
e of
exc
elle
nce
in p
ublic
sec
tor a
dvis
ory
serv
ices
, tra
nsac
tion
supp
ort,
proj
ect m
anag
emen
t and
pub
lic fi
nanc
e m
anag
emen
t
8.1
Man
agem
ent s
uppo
rt d
eliv
ers
an
unqu
alifi
ed a
udit
N/A
N/A
N/A
Unq
ualifi
ed a
udit
Unq
ualifi
ed a
udit
Unq
ualifi
ed
audi
tU
nqua
lified
au
dit
Unq
ualifi
ed
audi
tU
nqua
lified
au
dit
Unq
ualifi
ed
audi
t
Stra
tegi
c O
bjec
tive
8.2:
Loc
al g
over
nmen
t fina
ncia
l man
agem
ent i
mpr
ovem
ent
8.2
Num
ber o
f tec
hnic
al a
dvis
ors
plac
ed
at N
atio
nal T
reas
ury,
pro
vinc
ial
trea
surie
s an
d m
unic
ipal
ities
thro
ugh
the
Mun
icip
al F
inan
ce Im
prov
emen
t Pr
ogra
mm
e (M
FIP)
63
N/A
N/A
N/A
5060
6070
7070
70
Stra
tegi
c O
bjec
tive
8.3:
Pro
mot
ion
of u
rban
inte
grat
ion
and
neig
hbou
rhoo
d de
velo
pmen
t
8.3
Num
ber o
f Urb
an In
tegr
atio
n an
d N
eigh
bour
hood
dev
elop
men
t in
itiat
ives
sup
port
ed
Non
eN
one
Non
e34
4644
4448
4848
Stra
tegi
c O
bjec
tive
8.4:
Fac
ilita
tion
of e
mpl
oym
ent c
reat
ion
and
incl
usiv
e gr
owth
8.4
Num
ber o
f per
man
ent j
obs
crea
ted
(cum
ulat
ive
acro
ss th
e te
rm o
f the
pr
ogra
mm
e)
N/A
N/A
N/A
150
000
150
000
150
000
150
000
150
000
150
000
150
000
Stra
tegi
c O
bjec
tive
8.5:
Impr
oved
infr
astr
uctu
re p
lann
ing,
man
agem
ent a
nd s
kills
dev
elop
men
t
8.5
Num
ber o
f cap
acity
impr
ovem
ent
initi
ativ
es in
infra
stru
ctur
e pl
anni
ng, m
anag
emen
t and
ski
lls
deve
lopm
ent d
one
N/A
N/A
N/A
557
1007
1007
1007
1007
1007
1007

103
Nat
iona
l Tre
asur
y | A
nnua
l Per
form
ance
Pla
n | 2
018/
19
PART B: PROGRAMME AND SUB-PROGRAMME PLANS - Continued9.
5. P
rogr
amm
e Pe
rfor
man
ce In
dica
tors
and
Ann
ual T
arge
ts
PERF
ORM
AN
CE IN
DIC
ATO
RAU
DIT
ED/A
CTU
AL
PERF
ORM
AN
CECU
RREN
T YE
AR
PERF
ORM
AN
CEPL
AN
NED
PE
RFO
RMA
NCE
M
EDIU
M T
ERM
TA
RGET
S (M
TEF)
2014
/15
2015
/16
2016
/17
2017
/18
2018
/19
2019
/20
2020
/21
2021
/22
Stra
tegi
c O
bjec
tive
8.1:
Est
ablis
hmen
t of G
TAC
as a
cen
tre
of e
xcel
lenc
e in
pub
lic s
ecto
r adv
isor
y se
rvic
es, t
rans
actio
n su
ppor
t, pr
ojec
t man
agem
ent a
nd p
ublic
fina
nce
man
agem
ent
8.1.
1N
umbe
r of G
TAC
mon
itorin
g re
port
s re
port
ing
on p
rogr
ess
prod
uced
N/A
N/A
44
44
44
8.1.
2N
umbe
r of t
echn
ical
adv
isor
y pr
ojec
ts s
uppo
rted
6493
135
8412
080
9010
010
0
8.1.
3N
umbe
r of t
rans
actio
n ad
viso
ry p
roje
cts
regi
ster
ed65
N/A
N/A
2515
1717
1717
8.1.
4N
umbe
r of c
apita
l pro
ject
app
rais
al re
port
s co
mpl
eted
N/A
N/A
55
55
55
8.1.
5N
umbe
r of p
erfo
rman
ce a
nd e
xpen
ditu
re re
view
s su
ppor
ted 6
6N
/AN
/A10
per
yea
r10
per
yea
r5
55
5
Stra
tegi
c O
bjec
tive
8.2:
Loc
al g
over
nmen
t fina
ncia
l man
agem
ent i
mpr
ovem
ent
8.2.
1N
umbe
r of t
echn
ical
adv
isor
s pl
aced
at N
atio
nal T
reas
ury,
pro
vinc
ial
trea
surie
s an
d m
unic
ipal
ities
thro
ugh
the
Mun
icip
al F
inan
ce
Impr
ovem
ent P
rogr
amm
e (M
FIP)
67
N/A
N/A
N/A
5060
6070
70
Stra
tegi
c O
bjec
tive
8.3:
Pro
mot
ion
of u
rban
inte
grat
ion
and
neig
hbor
hood
dev
elop
men
t
8.3.
1N
umbe
r of i
nves
tmen
t pla
ns c
ompl
eted
68N
/AN
/A4
44
22
2
8.3.
2N
umbe
r of c
atal
ytic
pro
ject
s ap
prov
ed
317
352
360
2020
2020
20
8.3.
3N
umbe
r of p
rogr
amm
es in
Inte
grat
ion
Zone
s id
entifi
ed fo
r pl
anni
ng69
1413
1212
1212
1214
8.3.
4N
umbe
r of p
rogr
amm
es in
Int
egra
tion
Zone
s un
der
impl
emen
tatio
n70
313
810
1010
1012
Stra
tegi
c O
bjec
tive
8.4:
Fac
ilita
tion
of e
mpl
oym
ent c
reat
ion
and
incl
usiv
e gr
owth
8.4.
1N
umbe
r of J
obs
Fund
pro
ject
s ap
prov
ed (c
umul
ativ
e ac
ross
the
term
of p
roje
ct)
8910
412
514
015
015
015
015
0
8.4.
2G
rant
fund
ing
appr
oved
(cum
ulat
ive
acro
ss th
e te
rm o
f pro
ject
)R4
661
mR5
499
m R
6 50
8mR7
000
mR7
880
mR7
880
mR7
880
mR7
880
m
8.4.
3M
atch
ed fu
ndin
g co
mm
itted
(cum
ulat
ive
acro
ss th
e te
rm o
f pro
ject
)R6
823
mR6
398
mR9
099
mR7
000
mR7
880
mR7
880
mR7
880
mR7
880
m
8.4.
4N
ew jo
bs c
ontr
acte
d (c
umul
ativ
e ac
ross
the
term
of p
roje
ct)
132
725
119
888
136
069
15
0 00
015
0 00
015
0 00
015
0 00
015
0 00
0
8.4.
5N
umbe
r of p
lace
men
ts c
ontr
acte
d (c
umul
ativ
e ac
ross
the
term
of
proj
ect)
84 5
1385
851
90 0
8710
0 00
010
5 00
010
5 00
0 10
5 00
010
5 00
0

104
Nat
iona
l Tre
asur
y | A
nnua
l Per
form
ance
Pla
n | 2
018/
19
PART B: PROGRAMME AND SUB-PROGRAMME PLANS - Continued
9.5.
Pro
gram
me
Perf
orm
ance
Indi
cato
rs a
nd A
nnua
l Tar
gets
- co
ntin
ued
PERF
ORM
AN
CE IN
DIC
ATO
RAU
DIT
ED/A
CTU
AL
PERF
ORM
AN
CECU
RREN
T YE
AR
PERF
ORM
AN
CEPL
AN
NED
PE
RFO
RMA
NCE
M
EDIU
M T
ERM
TA
RGET
S (M
TEF)
2014
/15
2015
/16
2016
/17
2017
/18
2018
/19
2019
/20
2020
/21
2021
/22
8.4.
6N
umbe
r of t
rain
ing
oppo
rtun
ities
con
trac
ted
(cum
ulat
ive
acro
ss th
e te
rm o
f pro
ject
)20
4 56
620
7 29
1 2
24 0
89 2
27 0
00 2
40 0
0024
0 00
024
0 00
024
0 00
0
8.4.
7Va
lue
of g
rant
fund
ing
disb
urse
d (c
umul
ativ
e ac
ross
the
term
of
proj
ect)
71
R2 5
42m
R 3
227m
R3 7
34m
R4 6
77m
R5
015m
R 5
915m
R6 8
65m
R7 8
80m
8.4.
8N
umbe
r of J
obs
Fund
eva
luat
ion
repo
rts
and
diss
emin
atio
n of
le
arni
ng c
ondu
cted
23
repo
rts
Mid
-ter
m
eval
uatio
n re
port
Port
folio
of
eval
uatio
n2
proj
ect
eval
uatio
n re
port
s2
proj
ect
eval
uatio
n re
port
s
2 pr
ojec
t ev
alua
tion
repo
rts
2 pr
ojec
t ev
alua
tion
repo
rts
1 ev
ent
1 le
arni
ng
even
t1
lear
ning
eve
nt1
lear
ning
eve
nt1
lear
ning
ev
ent
1 le
arni
ng
even
t1
lear
ning
ev
ent
Stra
tegi
c O
bjec
tive
8.5:
Impr
oved
infr
astr
uctu
re p
lann
ing,
man
agem
ent a
nd s
kills
dev
elop
men
t
8.5.
1Pe
rcen
tage
resp
onse
to p
rocu
re a
ppro
ved
Pro
fess
iona
l Ser
vice
Pr
ovid
ers
to a
ssis
t with
inst
itutio
nalis
ing
the
IDM
S72
##
#10
0%10
0%
100%
10
0%
100%
8.5.
2N
umbe
r of o
ffici
als
trai
ned
on th
e in
frast
ruct
ure
deliv
ery
man
agem
ent s
yste
m in
itiat
ives
73
340
183
160
100
500
500
500
500
8.5.
3N
umbe
r of g
radu
ates
in tr
aini
ng fo
r pro
fess
iona
l reg
istr
atio
n42
443
543
540
050
050
050
050
0
8.5.
4N
umbe
r of c
apac
ity im
prov
emen
t ini
tiativ
es u
nder
take
n to
sup
port
in
frast
ruct
ure
deliv
ery14
##
#9
77
77

105
Nat
iona
l Tre
asur
y | A
nnua
l Per
form
ance
Pla
n | 2
018/
19
PART B: PROGRAMME AND SUB-PROGRAMME PLANS - Continued9.
6. P
rogr
amm
e Pe
rfor
man
ce In
dica
tor Q
uart
erly
Tar
gets
for 2
018/
19
PERF
ORM
AN
CE IN
DIC
ATO
R20
18/1
9A
NN
UA
L TA
RGET
SQ
UA
RTER
1Q
UA
RTER
2Q
UA
RTER
3Q
UA
RTER
4
Stra
tegi
c O
bjec
tive
8.1:
Est
ablis
hmen
t of G
TAC
as a
cen
tre
of e
xcel
lenc
e in
pub
lic s
ecto
r adv
isor
y se
rvic
es, t
rans
actio
n su
ppor
t, pr
ojec
t man
agem
ent a
nd p
ublic
fina
nce
man
agem
ent
8.1.
1N
umbe
r of G
TAC
qua
rter
ly m
onito
ring
repo
rts
repo
rtin
g on
pro
gres
s pr
oduc
ed
41
11
1
8.1.
2N
umbe
r of t
echn
ical
adv
isor
y pr
ojec
ts s
uppo
rted
80N
/AN
/AN
/A80
8.1.
3N
umbe
r of t
rans
actio
n ad
viso
ry p
roje
cts
regi
ster
ed
17N
/AN
/AN
/A17
8.1.
4N
umbe
r of c
apita
l pro
ject
app
rais
al re
port
s co
mpl
eted
5N
/AN
/AN
/A5
8.1.
5N
umbe
r of p
erfo
rman
ce a
nd e
xpen
ditu
re re
view
s su
ppor
ted
5N
/AN
/AN
/A5
Stra
tegi
c O
bjec
tive
8.2:
Loc
al g
over
nmen
t fina
ncia
l man
agem
ent i
mpr
ovem
ent
8.2.
1N
umbe
r of t
echn
ical
adv
isor
s pl
aced
at N
atio
nal T
reas
ury,
pro
vinc
ial t
reas
urie
s an
d m
unic
ipal
ities
thro
ugh
the
Mun
icip
al F
inan
ce Im
prov
emen
t Pro
gram
me
(MFI
P)
6060
6060
60
Stra
tegi
c O
bjec
tive
8.3:
Pro
mot
ion
of u
rban
inte
grat
ion
and
neig
hbou
rhoo
d de
velo
pmen
t
8.3.
1N
umbe
r of I
nves
tmen
t pla
ns c
ompl
eted
4
11
11
8.3.
2N
umbe
r of c
atal
ytic
pro
ject
s ap
prov
ed
205
55
5
8.3.
3N
umbe
r of p
rogr
amm
es in
Inte
grat
ion
Zone
s id
entifi
ed fo
r pla
nnin
g12
04
62
8.3.
4N
umbe
r of p
rogr
amm
es in
Inte
grat
ion
Zone
s un
der i
mpl
emen
tatio
n10
46
00
Stra
tegi
c O
bjec
tive
8.4:
Fac
ilita
tion
of e
mpl
oym
ent c
reat
ion
and
incl
usiv
e gr
owth
8.4.
1N
umbe
r of J
obs
Fund
pro
ject
s ap
prov
ed (c
umul
ativ
e ac
ross
the
term
of t
he p
roje
ct)
150
N/A
N
/A
N/A
15
0
8.4.
2G
rant
fund
ing
appr
oved
(cum
ulat
ive
acro
ss th
e te
rm o
f the
pro
ject
)R7
880
mN
/A
N/A
N
/A
R7 8
80m
8.4.
3M
atch
ed fu
ndin
g co
mm
itted
(cum
ulat
ive
acro
ss th
e te
rm o
f pro
ject
)R7
880
mN
/A
N/A
N
/A
R7 8
80m
8.4.
4N
ew jo
bs c
ontr
acte
d (c
umul
ativ
e ac
ross
the
term
of p
roje
ct)
150
000
N/A
14
6 00
0 N
/A
150
000
8.4.
5N
umbe
r of p
lace
men
ts c
ontr
acte
d (c
umul
ativ
e ac
ross
the
term
of p
roje
ct)
105
000
N/A
10
2 00
0N
/A
105
000
8.4.
6N
umbe
r of t
rain
ing
oppo
rtun
ities
con
trac
ted
(cum
ulat
ive
acro
ss th
e te
rm o
f pro
ject
) 2
40 0
00N
/A
233
000
N/A
24
0 00
0
8.4.
7Va
lue
of g
rant
fund
ing
disb
urse
d (c
umul
ativ
e ac
ross
the
term
of p
roje
ct)
R5
015m
N/A
N
/A
N/A
R5
015
m
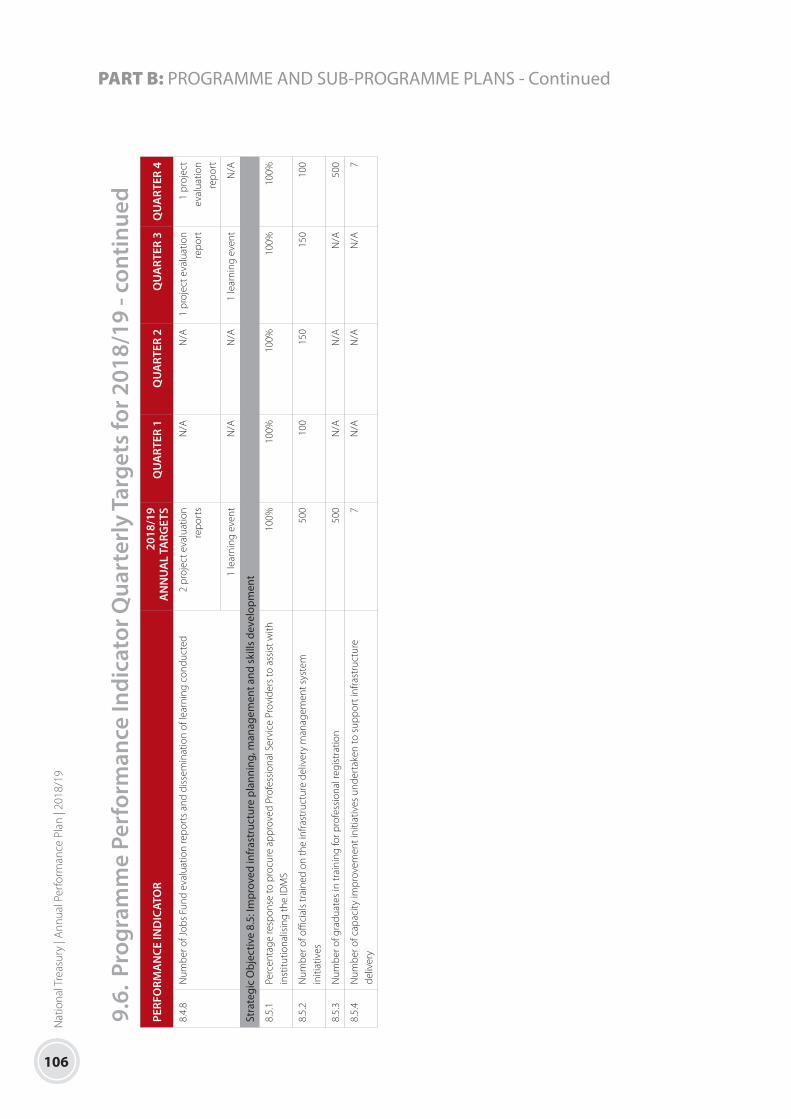
106
Nat
iona
l Tre
asur
y | A
nnua
l Per
form
ance
Pla
n | 2
018/
19
PART B: PROGRAMME AND SUB-PROGRAMME PLANS - Continued
9.6.
Pro
gram
me
Perf
orm
ance
Indi
cato
r Qua
rter
ly T
arge
ts fo
r 201
8/19
- co
ntin
ued
PERF
ORM
AN
CE IN
DIC
ATO
R20
18/1
9A
NN
UA
L TA
RGET
SQ
UA
RTER
1Q
UA
RTER
2Q
UA
RTER
3Q
UA
RTER
4
8.4.
8N
umbe
r of J
obs
Fund
eva
luat
ion
repo
rts
and
diss
emin
atio
n of
lear
ning
con
duct
ed2
proj
ect e
valu
atio
n re
port
sN
/A
N/A
1
proj
ect e
valu
atio
n re
port
1 pr
ojec
t ev
alua
tion
repo
rt
1 le
arni
ng e
vent
N/A
N
/A
1 le
arni
ng e
vent
N/A
Stra
tegi
c O
bjec
tive
8.5:
Impr
oved
infr
astr
uctu
re p
lann
ing,
man
agem
ent a
nd s
kills
dev
elop
men
t
8.5.
1Pe
rcen
tage
resp
onse
to p
rocu
re a
ppro
ved
Prof
essi
onal
Ser
vice
Pro
vide
rs to
ass
ist w
ith
inst
itutio
nalis
ing
the
IDM
S10
0%10
0%10
0%10
0%10
0%
8.5.
2N
umbe
r of o
ffici
als
trai
ned
on th
e in
frast
ruct
ure
deliv
ery
man
agem
ent s
yste
m
initi
ativ
es
500
100
150
150
100
8.5.
3N
umbe
r of g
radu
ates
in tr
aini
ng fo
r pro
fess
iona
l reg
istr
atio
n50
0N
/A
N/A
N
/A
500
8.5.
4N
umbe
r of c
apac
ity im
prov
emen
t ini
tiativ
es u
nder
take
n to
sup
port
infra
stru
ctur
e de
liver
y7
N/A
N
/A
N/A
7

107
Nat
iona
l Tre
asur
y | A
nnua
l Per
form
ance
Pla
n | 2
018/
19
PART B: PROGRAMME AND SUB-PROGRAMME PLANS - Continued9.
7. E
xpen
ditu
re T
rend
s an
d Es
timat
es
Tech
nica
l Sup
port
and
Dev
elop
men
t Fin
ance
exp
endi
ture
tren
ds a
nd e
stim
ates
by
subp
rogr
amm
e an
d ec
onom
ic c
lass
ifica
tion
Subp
rogr
amm
eA
udite
d ou
tcom
eA
djus
ted
appr
opri
atio
n
Aver
age
grow
thra
te (%
)
Aver
age:
Expe
nditu
re /
tota
l (%
)
Med
ium
-ter
m e
xpen
ditu
rees
timat
e
Aver
age
grow
thra
te (%
)
Aver
age:
Expe
nditu
re
/ tot
al (%
)
R m
illio
n 2
014/
15
2015
/16
2016
/17
201
7/18
2
014/
15 -
2017
/18
201
8/19
2
019/
20
2020
/21
201
7/18
- 20
20/2
1
Loca
l Gov
ernm
ent F
inan
cial
M
anag
emen
t Sup
port
547.
957
3.9
587.
962
7.8
4.6%
22.5
%64
5.5
681.
41
232.
925
.2%
26.4
%
Urb
an D
evel
opm
ent a
nd S
uppo
rt87
5.4
848.
387
3.9
983.
33.
9%34
.4%
924.
896
2.2
1 01
5.0
1.1%
32.2
%
Empl
oym
ent C
reat
ion
Faci
litat
ion
1 21
3.2
749.
569
8.2
610.
0-2
0.5%
31.4
%87
5.3
970.
51
084.
121
.1%
29.3
%
Gov
ernm
ent T
echn
ical
Adv
isor
y Ce
ntre
79.8
83.6
88.0
80.8
0.4%
3.2%
71.9
76.5
81.2
0.2%
2.6%
Infra
stru
ctur
e D
evel
opm
ent S
uppo
rt17
7.1
216.
923
0.4
256.
713
.2%
8.5%
281.
429
7.1
313.
86.
9%9.
5%
Tota
l 2
893.
32
472.
22
478.
42
558.
5-4
.0%
100.
0%2
798.
82
987.
83
726.
913
.4%
100.
0%
Cha
nge
to 2
017
Budg
et e
stim
ate
(3
14.8
)(4
31.5
)(4
22.2
)(3
85.0
)
Econ
omic
cla
ssifi
catio
n
Curr
ent p
aym
ents
91.7
283.
831
0.4
354.
457
.0%
10.0
%40
7.8
430.
645
4.3
8.6%
13.6
%
Com
pens
atio
n of
em
ploy
ees
5.4
–
–
–
-100
.0%
0.1%
–
–
–
–
–
Goo
ds a
nd s
ervi
ces
86.2
283.
831
0.4
354.
460
.2%
9.9%
407.
843
0.6
454.
38.
6%13
.6%
of w
hich
:
Adm
inist
rativ
e fe
es0.
5 –
–
–
-1
00.0
% –
–
–
–
–
–
Adve
rtisi
ng0.
1 –
–
–
-1
00.0
% –
–
–
–
–
–
Min
or a
sset
s0.
6 –
–
–
-1
00.0
% –
–
–
–
–
–
Cons
ulta
nts:
Busin
ess a
nd a
dviso
ry
serv
ices
83.0
283.
831
0.4
354.
462
.2%
9.9%
407.
843
0.6
454.
38.
6%13
.6%
Tran
sfer
s an
d su
bsid
ies
2 80
0.7
2 18
8.4
2 16
8.0
2 20
4.1
-7.7
%90
.0%
2 39
1.1
2 55
7.1
3 27
2.6
14.1
%86
.4%
Prov
ince
s an
d m
unic
ipal
ities
1 39
9.0
1 41
1.8
1 45
4.4
1 59
8.3
4.5%
56.4
%1
541.
51
613.
52
216.
311
.5%
57.7
%

108
Nat
iona
l Tre
asur
y | A
nnua
l Per
form
ance
Pla
n | 2
018/
19
PART B: PROGRAMME AND SUB-PROGRAMME PLANS - Continued
9.7.
Exp
endi
ture
Tre
nds
and
Estim
ates
- co
ntin
ued
Tech
nica
l Sup
port
and
Dev
elop
men
t Fin
ance
exp
endi
ture
tren
ds a
nd e
stim
ates
by
subp
rogr
amm
e an
d ec
onom
ic c
lass
ifica
tion
Subp
rogr
amm
eA
udite
d ou
tcom
eA
djus
ted
appr
opri
atio
n
Aver
age
grow
thra
te (%
)
Aver
age:
Expe
nditu
re /
tota
l (%
)
Med
ium
-ter
m e
xpen
ditu
rees
timat
e
Aver
age
grow
thra
te (%
)
Aver
age:
Expe
nditu
re
/ tot
al (%
)
R m
illio
n 2
014/
15
2015
/16
2016
/17
201
7/18
2
014/
15 -
2017
/18
201
8/19
2
019/
20
2020
/21
201
7/18
- 20
20/2
1
Dep
artm
enta
l age
ncie
s an
d ac
coun
ts13
8.1
776.
671
3.6
605.
863
.7%
21.5
%84
9.5
943.
61
056.
320
.4%
28.6
%
Publ
ic c
orpo
ratio
ns a
nd p
rivat
e en
terp
rises
1 26
3.7
–
–
–
-100
.0%
12.1
% –
–
–
–
–
Paym
ents
for c
apita
l ass
ets
1.0
–
–
–
-100
.0%
–
–
–
–
–
–
Mac
hine
ry a
nd e
quip
men
t1.
0 –
–
–
-1
00.0
% –
–
–
–
–
–
Tota
l 2
893.
32
472.
22
478.
42
558.
5-4
.0%
100.
0%2
798.
82
987.
83
726.
913
.4%
100.
0%
Prop
ortio
n of
tota
l pro
gram
me
expe
nditu
re to
vot
e ex
pend
iture
11.1
%8.
6%8.
8%6.
3% –
–
9.
5%9.
8%11
.3%
–
–
Det
ails
of t
rans
fers
and
sub
sidi
es
Dep
artm
enta
l age
ncie
s an
d ac
coun
ts
Dep
artm
enta
l age
ncie
s (n
on-b
usin
ess
entit
ies)
Curr
ent
137.
777
6.1
713.
660
5.0
63.8
%21
.5%
848.
894
2.8
1 05
5.4
20.4
%28
.6%
Gov
ernm
ent T
echn
ical
Adv
isor
y Ce
ntre
107.
777
6.1
713.
660
5.0
77.8
%21
.2%
848.
894
2.8
1 05
5.4
20.4
%28
.6%
Nei
ghbo
urho
od d
evel
opm
ent
part
ners
hip
gran
t (In
dire
ct)
30.0
–
–
–
-100
.0%
0.3%
–
–
–
–
–
Capi
tal
0.4
0.5
–
0.7
25.5
% –
0.
80.
80.
95.
6% –
Gov
ernm
ent T
echn
ical
Adv
isor
y Ce
ntre
0.
40.
5 –
0.
725
.5%
–
0.8
0.8
0.9
5.6%
–
Publ
ic c
orpo
ratio
ns a
nd p
rivat
e en
terp
rises
Publ
ic c
orpo
ratio
ns
Oth
er tr
ansf
ers
to p
ublic
cor
pora
tions
Curr
ent
1 26
3.7
–
–
–
-100
.0%
12.1
% –
–
–
–
–
Dev
elop
men
t Ban
k of
Sou
ther
n A
frica
1
164.
9 –
–
–
-1
00.0
%11
.2%
–
–
–
–
–
Mun
icip
al F
inan
ce Im
prov
emen
t Pr
ogra
mm
e 98
.8 –
–
–
-1
00.0
%0.
9% –
–
–
–
–

109
Nat
iona
l Tre
asur
y | A
nnua
l Per
form
ance
Pla
n | 2
018/
19
PART B: PROGRAMME AND SUB-PROGRAMME PLANS - Continued9.
7. E
xpen
ditu
re T
rend
s an
d Es
timat
es -
cont
inue
dTe
chni
cal S
uppo
rt a
nd D
evel
opm
ent F
inan
ce e
xpen
ditu
re tr
ends
and
est
imat
es b
y su
bpro
gram
me
and
econ
omic
cla
ssifi
catio
n
Subp
rogr
amm
eA
udite
d ou
tcom
eA
djus
ted
appr
opri
atio
n
Aver
age
grow
thra
te (%
)
Aver
age:
Expe
nditu
re /
tota
l (%
)
Med
ium
-ter
m e
xpen
ditu
rees
timat
e
Aver
age
grow
thra
te (%
)
Aver
age:
Expe
nditu
re
/ tot
al (%
)
R m
illio
n 2
014/
15
2015
/16
2016
/17
201
7/18
2
014/
15 -
2017
/18
201
8/19
2
019/
20
2020
/21
201
7/18
- 20
20/2
1
Prov
ince
s an
d m
unic
ipal
ities
Mun
icip
aliti
es
Mun
icip
al b
ank
acco
unts
Curr
ent
553.
657
7.0
595.
764
2.8
5.1%
22.8
%64
6.1
682.
21
234.
124
.3%
26.6
%
Loca
l gov
ernm
ent fi
nanc
ial
man
agem
ent g
rant
44
9.1
452.
546
5.3
502.
03.
8%18
.0%
504.
653
2.8
561.
73.
8%17
.4%
Infra
stru
ctur
e sk
ills
deve
lopm
ent
gran
t 10
4.4
124.
513
0.5
140.
810
.5%
4.8%
141.
514
9.4
157.
93.
9%4.
9%
Mun
icip
al re
stru
ctur
ing
gran
t –
–
–
–
–
–
–
–
51
4.4
–
4.3%
Capi
tal
845.
483
4.9
858.
795
5.5
4.2%
33.6
%89
5.5
931.
298
2.3
0.9%
31.2
%
Inte
grat
ed c
ity d
evel
opm
ent g
rant
25
5.0
251.
326
6.8
292.
14.
6%10
.2%
293.
631
0.1
327.
33.
9%10
.1%
Nei
ghbo
urho
od d
evel
opm
ent
part
ners
hip
gran
t 59
0.4
583.
659
1.9
663.
44.
0%23
.4%
601.
962
1.2
654.
9-0
.4%
21.1
%

PART C: LINKS TO OTHER PLANS
ANNUAL PERFORMANCE PLAN2018/19
APP

111
Nat
iona
l Tre
asur
y | A
nnua
l Per
form
ance
Pla
n | 2
018/
19
PART C: LINKS TO OTHER PLANS
10. LINKS TO LONG TERM INFRASTRUCTURE AND OTHER CAPITAL PLANSThe department does not have any long term infrastructure or capital projects or plans.
11. CONDITIONAL GRANTSNo changes to status of the conditional grants noting the possible effect of budget constraints.
• Local Government: Financial Management Grant
• Integrated City Development Grant
• Neigbourhood Development Partnership Grant
• Infrastructure Skills Development Grant
• Capital Grant
• Technical Assistance Grant
12. PUBLIC-PRIVATE PARTNERSHIPSThe department does not have any public-private partnerships.
13. PUBLIC ENTITIES REPORTING TO THE MINISTERThere are no significant changes to the status quo relating to the public entities overseen by National Treasury. Eighteen entities report
to the Minister of Finance through governance arrangements that give them autonomy but also enable them to align their strategies
with government policy. Eight of these entities - the South African Revenue Service (SARS), the Office of the Tax Ombud (OTO), the
Financial Intelligence Centre (FIC), the Accounting Standards Board (ASB), the Co-operative Banks Development Agency (CBDA), the
Financial and Fiscal Commission (FFC), Government Technical Advisory Centre (GTAC), and the Independent Regulatory Board for
Auditors (IRBA) – receive transfers from National Treasury.
The remaining ten are self-funded and generate their own revenue. These are the Financial Services Board (FSB), the Ombud for Financial
Service Providers (FAIS Ombud), the Office of the Pension Fund Adjudicator (OPFA), the Government Pensions Administration Agency
(GPAA), the Government Employees Pension Fund (GEPF), the Development Bank of Southern Africa (DBSA), the Public Investment
Corporation (PIC), the Land and Agricultural Development Bank of South Africa (Land Bank), South African Airways (SAA) and the South
African Special Risks Insurance Association (SASRIA). Each entity develops and reports on its own strategic and corporate plan.

PART D: ANNEXURES
ANNUAL PERFORMANCE PLAN2018/19
APP

113
Nat
iona
l Tre
asur
y | A
nnua
l Per
form
ance
Pla
n | 2
018/
19
PART D: ANNEXURES
14. ENDNOTES APPLICABLE TO ALL PROGRAMMES
# - The department has developed new indicators or revised its indicators and/or targets to strengthen compliance with the framework
of strategic plans, to align with outcomes performance reporting and/or to address findings by the Auditor-General. Please refer to
these end notes for information on actual amendments made and the published Annual Report for actual information reported on
similar indicators.
N/A – No target set for the period.
1 Arising out of the DPME review, the following performance indicators monitored in the previous financial year’s APP have been
reassigned to operational monitoring:
• Performance Indicator 1.1.2 “Percentage of knowledge management (KM) strategy implemented”.
• Performance Indicator 1.1.3 “Percentage of funded positions filled”.
• Performance Indicator 1.2.4 “Number of vetting forms completed by staff group, submitted to State Security Agency (SSA)”.
2 Performance indicator 1.2.2 “Number of quarterly risk implementation assessment reports produced” revised. Previously “Produce
approved annual strategic risk mitigation plan and quarterly risk implementation assessment reports”.
3 Performance indicator 1.2.3 “Number of quarterly reports on monitored performance of entities reporting to MOF” revised. Previously
“Number of entities reporting to MOF reviewed quarterly reports submitted for the Minister’s consideration”.
4 Performance Indicator 2.1.1 “Number of papers published in association with academic research institutions” targets reduced due to
a reduction in funding
5 Performance Indicator 2.2.1 “Twin Peaks model legislation implemented” revised. Previously “Enact Twin Peaks model legislation”.
6 Performance Indicator 2.4.1 “Number of economic models maintained” targets reduced due to reduced capacity.
7 Performance Indicator 2.4.3 “Chapter 2 of the MTBPS and Budget Review published” MTEF and Quarterly targets refined to include
descriptor “documents”.
8 Performance Indicator 2.3.2 “Implement legislation to give effect to tax proposals from the Budget” quarterly targets refined.
9 Performance Indicator 3.6 “Number of legislatively required Budget Council and Forum meetings held” revised. Previously “Number of
budget council meetings held”.
10 Performance Indicator 3.1.1 “Maintain the expenditure ceiling” revised. Previously “Difference between the expenditure tabled for the
MTEF years within the expenditure ceiling in the MTBPS and the expenditure ceiling tabled for the MTEF years in the February budget”.
11 Performance Indicator 3.2.1 “Number of budget guidelines issued” targets revised. The component “1 programme scheduling MTEC
meeting drafted by July” monitored in the previous financial year has been reassigned to operational monitoring.

114
Nat
iona
l Tre
asur
y | A
nnua
l Per
form
ance
Pla
n | 2
018/
19
PART D: ANNEXURES - Continued
12 Performance Indicator 3.2.2 “Obtain budget expenditure allocation decisions from the executive” revised. Previously “Budget decision
making processes coordinated and adherence to timelines for budget allocation recommendations based on departmental budget
submissions”.
13 Performance Indicator 3.2.2 “Obtain budget expenditure allocation decisions from the executive” targets revised. The component
“Various funding recommendations to the MTEC, the Ministers’ Committee on the Budget (MINCOMBUD) and Cabinet within budget
calendar timelines” has been reassigned to operational monitoring.
14 Performance Indicator 3.4.1 “Percentage replies to departmental requests for PFMA and TR approvals, sectoral analysis and policy
advice” revised. Previously “Percentage adherence to timelines for PFMA and Treasury Regulation approvals, sectoral analysis and policy
advice”.
15 Performance Indicator 3.4.3 “Number of In Year Monitoring (IYM) feedback reports to departments” revised. Previously “Number of
monthly expenditure feedback reports to department”.
16 Performance Indicator 3.4.4 “Number of quarterly expenditure reports submitted to the Standing Committee on Appropriations”
targets revised to enhance efficiency as previous individual reports submitted have now been replaced by a consolidated report.
17 Performance Indicator 3.6.3 “Number of plans assessed to support improvements in infrastructure planning and implementation in
provinces” revised. Previously “Number of plans assessed to support improvements in infrastructure planning in provinces”.
18 Performance Indicator 3.6.4 “Number of built environment performance plans assessed to support improvement in the metropolitan
municipalities” revised. Previously “Number of built environment performance plans assessed to support improvement in the built
environment”.
19 Performance Indicator 3.6.5 “Number of capacity building initiatives to facilitate improved planning, budgeting and financial
management” revised. Previously “Number of capacity building initiatives (workshops and courses) to facilitate improved planning,
budgeting and financial management”.
20 Performance Indicator 3.6.5 “Number of capacity building initiatives to facilitate improved planning, budgeting and financial
management” targets revised due to resource constraints.
21 Performance Indicator 3.6.6 “Number of quarterly financial reports published” revised. Previously “Number of quarterly financial
reports produced and published to comply with Section 32 of the PFMA”.
22 Performance Indicator 3.6.8 “Number of annual municipal routine reports published” revised. Previously “Number of reports published
in terms of MFMA and DoRA”.
23 Performance Indicator 3.6.8 “Number of annual municipal routine reports published” targets revised with reallocations to Performance
Indicator 3.6.6 “Number of quarterly financial reports published”.
24 Performance Indicator 3.6.10 “Number of municipal budgeting and reporting reforms implemented” targets revised as the municipal
Standard Chart of Accounts (mSCOA) will be concluded.
25 Performance Indicator 4.2 “Percentage of optimal debt management and funding of government borrowing requirements met”
revised. Previously “Optimal debt management and funding of government borrowing requirements met”.

115
Nat
iona
l Tre
asur
y | A
nnua
l Per
form
ance
Pla
n | 2
018/
19
PART D: ANNEXURES - Continued
26 Performance Indicator 4.1.1 “Percentage of complete corporate plans received from Schedule 2 and 3B public entities reviewed”
revised. Previously “Percentage of corporate plans of Schedule 2 and 3B SOCs, development finance institutions (DFIs) and waterboards
(WBs) received and reviewed within four months of receipt”.
27 Performance Indicator 4.1.2 “Percentage of annual reports received from Schedule 2 and 3B public entities reviewed” revised.
Previously “Percentage of annual reports of Schedule 2 and 3B SOCs, DFIs and WBs received and reviewed within four months of
receipt”.
28 Performance Indicator 4.1.3 “Percentage of complete PFMA Section 54(2), 52, 55 and 92 applications received from Schedule 2 and
3B public entities reviewed” revised. Previously “Percentage of complete PFMA Section 54(2), 52, 55 and 92 applications received from
Schedule 2 and 3B SOCs, DFIs and WBs reviewed within stipulated timeframes”.
29 Performance Indicator 4.1.4 “Percentage of complete guarantee applications received from Schedule 2 and 3B public entities
reviewed” revised. Previously “Percentage of complete guarantee applications received from Schedule 2 and 3B SOCs, DFIs and WBs
reviewed within stipulated timeframes”.
30 Performance Indicator 4.1.5 “Percentage of received MFMA submissions relating to tariff adjustments received from Schedule 2 and
3B public entities reviewed” revised. Previously “Percentage of MFMA submissions relating to tariff adjustments received from Schedule
2 and 3B SOCs and WBs reviewed within stipulated timeframes”.
31 Performance Indicator 4.1.6 “Percentage of complete remuneration review requests of executive and non-executive directors
received from Schedule 2 and 3B public entities reporting to the Minister of Finance reviewed” revised. Previously “Percentage of
reports on the review of Schedule 2 and 3B SOCs, DFIs and WB remuneration”.
32 Performance Indicator 4.1.7 “Percentage of complete board appointments recommendations from Schedule 2 and 3B public entities
reporting to the Minister of Finance received and reviewed” revised. Previously “Percentage of reports on the review of Schedule 2
Board composition”.
Performance Indicator “Percentage of annual reports and corporate plans received from Schedule 2 and 3B SOCs reporting to NT (SAA,
PIC, DBSA, Land Bank, Sasria) tabled in Parliament within the required timescale (30 September each year)” monitored in the previous
financial year has been removed as it is not within the ambit of National Treasury Programme 4 responsibilities.
Performance Indicator “Percentage of funding applications received from Schedule 2 and 3B SOCs, DFIs and WBs reviewed within
stipulated timeframes monitored in the previous financial year” has been removed as it is not within the Programme 4 ambit of control.
Performance Indicator “Percentage of reviews requested of legislation, policies and strategies impacting on Schedule 2 and 3B SOCs,
DFIs and WBs conducted within stipulated timeframes” monitored in the previous financial year has been reassigned to operational
monitoring.
Performance Indicator “Percentage completion of the NT Best Practice guidelines monitored” in the previous financial year has been
reassigned to operational monitoring.
33 Performance indicator 5.1.11 “FMCMM modules revised” removed pending the allocation of funding.

116
Nat
iona
l Tre
asur
y | A
nnua
l Per
form
ance
Pla
n | 2
018/
19
PART D: ANNEXURES - Continued
34 The following performance indicators monitored in the previous financial year APP have been reassigned to operational monitoring:
• “Number of assessments conducted of IA and state of readiness for quality assurance reviews and adoption of best practices to
assess compliance with PFMA, MFMA and international professional practice standards”.
• “Number of financial management assessment tools modules for local government either developed, updated or maintained”.
• “Percentage of bid specifications reviewed for alignment with policy and other applicable procurement instructions”.
• “Percentage of contracts awarded reviewed to verify if contract delivery is in line with the specifications”.
• “Number of procurement spend reports published”.
• “Number of departments enabled on a centralised electronic quotation system”.
• “Number of contract management solution developed and implemented”.
35 Performance Indicator 5.1.1 “Number of workshops presented on IA and risk management guidelines” revised. Previously “Number of
institutions workshopped on IA and risk management guidelines”.
36 Performance Indicator 5.1.3 “Number of support plans developed for government entities struggling with financial management as
identified in audit reports” revised. Previously “Number of support plans developed for government entities struggling at lower levels
of IA implementation as in the Financial Management Capability Maturity Model (FMCMM)”.
37 Performance Indicator 5.1.4 “Number of training sessions conducted in risk management” revised. Previously “Number of public
sector officials trained in risk management”.
38 Performance Indicator 5.1.4 “Number of training sessions conducted in risk management” targets aligned to revised performance
indicator.
39 Performance Indicator 5.1.5 “Number of guidelines on risk management curriculum developed for institutions of higher learning”
revised. Previously “Number institutions of higher learning workshopped on the risk management curriculum”.
40 Performance Indicator 5.1.6 “Number of monitoring reports on improvement of financial management in national and provincial
institutions produced” revised. Previously “Number of monitoring improvement of financial management in national and provincial
institutions reports produced”.
41 Performance Indicator 5.1.6 “Number of monitoring reports on improvement of financial management in national and provincial
institutions produced” targets revised to align with reporting cycle.
42 Performance Indicator 5.1.8 “Number of training sessions provided to support PFMA institutions on the implementation of Treasury
Regulations, Treasury Instructions and guidelines” revised. Previously “Number of information sessions provided to support PFMA
institutions on the implementation of Treasury Regulations, Treasury Instructions and guidelines”.
43 Performance Indicator 5.1.9 “Number of forensic investigations reports produced” revised. Previously “Number of forensic investigations
conducted and special performance audit reports produced”.
44 Performance Indicator 5.1.9 “Number of forensic investigations reports produced” targets amended and a component allocated to
new Performance Indicator 5.1.10 “Number of specialised audit reports produced”.
45 Performance Indicator 5.1.11 “Number of criminal investigation cases supported” revised. Previously “Number of cases referred and
advisory services provided to law enforcement agencies / anti-corruption task team for criminal investigation”.

117
Nat
iona
l Tre
asur
y | A
nnua
l Per
form
ance
Pla
n | 2
018/
19
PART D: ANNEXURES - Continued
46 Performance Indicator 5.1.14 “Percentage of complete requests to draft financial recovery plans responded to within 90 days of
receipt” revised. Previously “Number of days taken to respond to requests to draft financial recovery plans from receiving the request”.
47 Performance Indicator 5.1.14 “Percentage of complete requests to draft financial recovery plans responded to within 90 days of
receipt” targets revised to align with revised performance indicator.
The following Performance Indicators have migrated from Strategic Objective 5.2: “Support and facilitate capacity development
across all spheres of government in order to improve financial management execution” to Strategic Objective 5.1: “Improve financial
management governance and compliance across all spheres and entities in government, giving effect to the PFMA and MFMA to
better align with work stream clusters”:
• “Number of monthly statements reports of actual revenue and actual expenditure for the National Revenue Fund (NRF) published”.
• “Percentage compliance with the banking services for national government: Daily bank reconciliation of NRF Electronic verification
of supplier banking details within four working days”.
• “Number of consolidated annual financial statements for national departments, public entities and Reconstruction and
Development Programme (RDP) Fund tabled on 31 October”.
48 Performance Indicator 5.1.18 “Number of monthly statements reports of actual revenue and actual expenditure for the National
Revenue Fund (NRF) published” revised. Previously “Number of timely and accurate monthly statements reports of actual revenue and
actual expenditure published for the National Revenue Fund (NRF)”.
49 Performance Indicator 5.1.19 “Percentage compliance with the banking services for national government: Daily bank reconciliation of
NRF Electronic verification of supplier banking details within four working days” targets revised taking external IT related dependencies
into account.
50 Performance Indicator 5.2.1 “Number of training sessions conducted in the preparation of provincial consolidated financial
statements, provincial revenue fund statements and implementation of Generally Recognised Accounting Practice (GRAP) standards”
revised. Previously “Number of officials trained in the preparation of provincial consolidated financial statements, provincial revenue
fund statements and implementation of Generally Recognised Accounting Practices (GRAP) standards”.
51 Performance Indicator 5.2.1 “Number of training sessions conducted in the preparation of provincial consolidated financial
statements, provincial revenue fund statements and implementation of Generally Recognised Accounting Practice (GRAP) standards”
targets revised to align with amended Performance Indicator.
52 Performance Indicator 5.3.2 “Implementation of the IFMS II plan” replaces the following performance indicators monitored in the last
financial year:
• “Number of generic solution configuration templates completed”.
• “Number of IFMS comprehensive implementation strategies published”.
53 Performance Indicator 5.5.1 “Percentage of departments’/entities’ deviations/expansions requests reviewed” revised. Previously
“Percentage of departments’/entities’ quarterly performance information reports reviewed”.
54 Performance Indicator 5.5.3 “Percentage of bids reviewed to ensure compliance with norms and standards” replaces the following
performance indicators monitored in the last financial year:
• “Percentage of bid specifications reviewed for alignment with policy and other applicable procurement instructions”.
• “Percentage of bid evaluations and adjudications reviewed to ensure compliance with the criteria/scoring specified in
bidding documents”.
• “Percentage of contracts awarded reviewed to verify if contract delivery is in line with the specifications”.

118
Nat
iona
l Tre
asur
y | A
nnua
l Per
form
ance
Pla
n | 2
018/
19
PART D: ANNEXURES - Continued
55 Performance Indicator 5.5.4 “Percentage of projects inspected to verify if the delivery of awarded contracts is aligned with the
contract conditions” revised. Previously “Percentage of projects visited to verify if delivery of the awarded contracts is aligned with the
contract conditions”.
56 Performance Indicator 5.6.1 “Percentage implementation of the strategic sourcing opportunities plan” is a new indicator. The
following performance indicators monitored in the previous financial year’s APP have been consolidated into one strategic sourcing
opportunities plan which is dealt with under Performance Indicator 5.6.1:
• “Number of proposals for strategic sourcing opportunities”.
• “Number of sourcing strategies for identified commodities/procurement categories developed”.
• “Number of sourcing strategies for identified commodities/procurement categories implemented”.
• “Number of on boarding, monitoring and benefits tracking on sourcing strategies”.
57 Performance Indicator 5.6.2 “Number of transversal term contracts implemented” revised. Previously “Number of transversal term
contracts renewed per annum for National Procurement”.
58 Performance Indicator 5.7.1 “Number of stakeholder engagements conducted” revised. Previously “Percentage of external stakeholder
engagements held”.
59 Performance Indicator 5.8.1 “Number of tenders advertised on an electronic tendering platform for contracts” revised. Previously
“Number of tenders submitted on an electronic tendering platform for transversal contracts”.
60 Performance Indicator 6.2 “Number of strategic Ministerial briefings aimed at governance reforms in international financial institutions
provided” replaces the following performance indicator:
• “Secure the 3rd Chair for Sub-Sahara Africa in the IMF Board implemented”.
61 Performance Indicator 6.2.1 “Number of interventions to increase South Africa’s presence within institutions of particular strategic
value” targets decreased due to resource constraints.
62 Performance Indicator 6.3.2 “Percentage of implemented identified projects and plans to accelerate regional integration reviewed”
revised. Previously “Percentage of implementation of identified projects and plans to accelerate regional integration reviewed”.
63 Performance indicator 8.2 “Number of technical advisors placed at National Treasury, provincial treasuries and municipalities through
the Municipal Finance Improvement Programme (MFIP)” revised. Previously “Number of municipalities supported through Local
Government Financial management”.
64 Performance Indicator 8.1.2 “Number of technical advisory projects supported” targets have been revised to better align with user
demand for this service.
65 Performance Indicator 8.1.3 “Number of transaction advisory projects registered” targets have been revised to align with the planning
process of these multi-complex projects.
66 Performance Indicator 8.1.5 “Number of performance and expenditure reviews supported” revised. Previously “Number of performance
and expenditure reviews completed”.
Performance Indicator “Transfer of FMG funds to all municipalities monitored” in the previous financial year’s APP has been reassigned
to operational monitoring.

119
Nat
iona
l Tre
asur
y | A
nnua
l Per
form
ance
Pla
n | 2
018/
19
PART D: ANNEXURES - Continued
67 Performance Indicator 8.2.1 “Number of technical advisors placed at National Treasury, provincial treasuries and municipalities through
the Municipal Finance Improvement Programme (MFIP)” revised. Previously “Number of municipalities and provincial treasuries assisted
through MFIP II”.
68 Performance Indicator 8.3.1 “Number of investment plans completed” revised. Previously “Number of precinct plans completed”.
69 Performance Indicator 8.3.3 “Number of programmes in Integration Zones identified for planning” revised. Previously “Number of
integrated projects in Integration Zones identified for planning”.
70 Performance Indicator 8.3.4 “Number of programmes in Integration Zones under implementation” revised. Previously “Number of
integrated projects in Integration Zones under implementation”.
71 Performance Indicator 8.4.7 “Value of grant funding disbursed (cumulative across the term of project)” targets revised to align with
current contracting levels.
Performance Indicator “Number of employment, income distribution and inclusive growth research papers completed monitored” in
the previous financial year has been removed as programme ends in financial year 2017/18.
72 Performance Indicator 8.5.1 “Percentage response to procure approved Professional Service Providers to assist with institutionalising
the IDMS” revised. Previously “Percentage response to provincial and national request to procure Professional Service Providers to assist
with institutionalising the IDMS”.
73 Performance Indicator 8.5.2 “Number of officials trained on the infrastructure delivery management system initiatives” revised.
Previously “Number of officials trained on the infrastructure delivery management system initiatives (including IDMP, IDM Toolkit, IPM)”.
74 Performance Indicator 8.5.4 “Number of capacity improvement initiatives undertaken to support infrastructure delivery” targets
revised due to resource constraints.

NOTES:


Private Bag X115, Pretoria, 0001 | 40 Church Square, Pretoria, 0002
Tel +27 12 315 5944 | Fax +27 12 406 9055
Web: www.treasury.gov.za
ANNUAL PERFORMANCE PLAN2018/19
APP