appa selected financial and operating ratios of … · appa selected financial and operating ratios...
TRANSCRIPT

APPA Selected Financial and Operating Ratios of Public Power Systems, 2012 Data
Published November 2013
A_\ amike^M American Afm mWkWKSigSank Public Power
k^-Wm OTJ^k Association
1875 Connecticut Ave, N.W. Washington, D.C. 20009-5715 202/467-2900
www.pubIicpower.org

ABOUT THIS REPORT
This is the latest in the annual report series prepared by the American Public Power Association (APPA) on financial and operating ratios. Many of the ratios in this report were suggested by the APPA Performance Management Committee and its predecessor, the APPA Task Force on Performance Indicators.
The report was prepared by the APPA Statistical Analysis Department. See page 6 for information on where to direct comments or questions about this report.
Copyright © 2013 by the American Public Power Association All rights reserved. Published by the American Public Power Association 1875 Connecticut Ave, N.W., Suite 1200 Washington, D.C. 20009-5715
ii

TABLE OF CONTENTS
Page
I. Introduction 1
A. The Report Format 1
B. Utilities in the Report 3
C. Definitions, Data Sources and Computations 5
D. Factors Influencing Ratios 5
E. Comments or Questions about the Report 6
II. Summary Tables 7
A. Financial and Operating Ratios, by Customer Size Class 8
B. Financial and Operating Ratios, by Region 9
C. Financial and Operating Ratios, by Generation Class 10
III. Detailed Tables 11
1. Revenue per KWH 12
2. Debt to Total Assets 15
3. Operating Ratio 16
4. Current Ratio 17
5a. Times Interest Earned 18
5b. Debt Service Coverage 19
6. Net Income per Revenue Dollar 20
7. Uncollectible Accounts per Revenue Dollar 21

TABLE OF CONTENTS (CONT'D.)
Page
8. Retail Customers per Non-power-generation Employee 22
9. Total O&M Expense per KWH Sold 23
10. Total O&M Expense (Excluding Power Supply Expense) 24 per Retail Customer
11. Total Power Supply Expense per KWH Sold 25
12. Purchased Power Cost per KWH 26
13. Retail Customers per Meter Reader 27
14. Distribution O&M Expenses per Retail Customer 28
15. Distribution O&M Expenses per Circuit Mile 29
16. Customer Accounting, Customer Service and Sales 30 Expense per Retail Customer
17. Administrative and General Expenses per Retail 31 Customer
18. Labor Expense per Worker-hour 32
19. OSHA Incidence Rate (per 100 Employees) 33
20. Energy Loss Percentage 34
21. System Load Factor 35
Appendix A: APPA Performance Indicator Survey, 2012 36
Appendix B: Data Sources and Computational Procedures 39
Appendix C: Map of NERC Regions 43
Appendix D: Utilities Included in the Report 44
iv
SELECTED FINANCIAL AND OPERATING RATIOS
OF PUBLIC POWER SYSTEMS, 2012
I. Introduction
This report presents data for 21 categories of financial and operating ratios for 157 of the largest publicly owned electric utilities in the United States. The ratios can be a useful tool in assessing electric utility performance. However, they do not provide definitive information, nor should the level of any indicator be taken as the "correct" level of performance.
It is important that users be familiar with definitions of ratios and the variables that may affect them. Although the groupings ofthe ratios by customer size class, region and net power generation adjust for major variables, other factors may also influence the ratios. The financial and operating ratios provide a useful starting point for analyses and may be used to pinpoint areas in need of further investigation. The ratios should be analyzed in conjunction with other information and should not be the sole basis for broad conclusions.
A. The Report Format
Summary tables listing median values ofthe ratios are presented in Section II by customer size class, region and net power generation. Section III presents detailed breakdowns for each ratio with the number of utilities, means, medians and first and third quartile values. The information is provided by customer size, region and generation groupings. Definitions and descriptive information precede each set of tables. A copy ofthe APPA Performance Indicator Survey, 2012, as well as formulas, data sources, definitions of regions, and the utilities included in the report can be found in Appendices A, B, C and D.
Medians and number of responses for each ratio are presented in the following table for all customer size classes, regions and generation classes.
1

Financial Ratios Utilities Median
1. Revenue per KWH a. All Retail Customers 157 $0,087 b. Residential Customers 157 $0,099 c. Commercial Customers 157 $0,096 d. Industrial Customers 145 $0,072
2. Debt to Total Assets 156 0.340 3. Operating Ratio 157 0.872 4. Current Ratio 157 2.72 5a. Times Interest Earned 127 2.80 5b. Debt Service Coverage 126 3.09 6. Net Income per Revenue Dollar 157 $0,039 7. Uncollectible Accounts per Revenue Dollar 151 $0.0020
Operatinq Ratios
8. Retail Customer per Non-Power Generation Employee 156 330
9. Total O&M Expense per KWH Sold 156 $0,075 10. Total O&M Expense (Excluding Power
Supply Exp.) per Retail Customer 156 $432 11. Total Power Supply Expense per KWH Sold 156 $0,046 12. Purchased Power Cost per KWH 156 $0,055 13. Retail Customers per Meter Reader 134 6,205 14. Distribution O&M Expense per Retail Customer 146 $152 15. Distribution O&M Expense per Circuit Mile 141 $6,319 16. Customer Accounting, Service, and Sales
Expense per Retail Customer 146 $63 17. Administrative and General Expense per
Retail Customer 146 $155
Other Ratios
18. Labor Expense per Worker-Hour 150 $35.11 19. OSHA Incidence Rate (per 100 employees) 146 1.7 20. Energy Loss Percentage 150 3.73% 21. System Load Factor 152 55.7%
2

Utilities in the Report
The utilities included in this report are those that responded to APPA's Performance Indicator Survey, 2012. The survey was sent to all public power utilities whose sales to consumers account for approximately 50 percent or more of their total sales, and who also have retail sales or sales for resale of 150,000 megawatt-hours or more.
Joint action agencies are not included in the report, nor are utilities that are primarily wholesalers of electric power. For purposes of this report, wholesalers are defined as those utilities whose retail sales account for approximately 50 percent or less of their total sales.
Direct comparisons with the 2011 ratio report should not be made because the composition of utilities included for each ratio may have changed. Although 157 utilities are included in this report, not all ofthe utilities were incorporated into each ofthe ratios. Many utilities did not have, or did not provide information necessary for particular ratios. Also, data are excluded from calculations if there is reason to believe the information is incorrect, e.g., extreme values, etc.
The respondents are grouped into six customer size classes. Mean, median, and first and third quartile values are calculated for each of these classes. Means are weighted means -calculated by summing the values for all utilities, and then computing the ratio from these totals. Since large utilities heavily influence the mean value (particularly when there are only a small number of utilities in the sample), median values provide a better measure of the typical utility. The class size and number of responses in each class are shown in the chart below.
Number of R e s p o n s e s , by Customer Size C l a s s
More than 100,000 Customers
2,000 to 5,000 Customers
50,000 to 100,000 Customers
20,000 to 50,00! Customers
5,000 to 10,000 Customers
10,000 to 20,000 Customers
3

Utilities are grouped and ratios calculated based on geographic location. The five regions are based on combined NERC regions (see Appendix C). The regions and number of utilities in each are shown in the following chart.
Finally, respondents are grouped into categories based upon the percent of total power requirements generated by the utility. The classes range from "none" (or zero generation) to "50 to 100 percent" generation. The number of utilities in each category is shown in the chart below.
Number of R e s p o n s e s , by Generation
No generation
4

C. Definitions, Data Sources and Computations
Definitions of each ratio are found in Section III, "Detailed Tables," and information on data sources and computations are provided in Appendix B. The data in this report come from two sources: the Department of Energy, Energy Information Administration (EIA) report Form EIA-861; and the APPA Performance Indicators Survey, 2012.
D. Factors Influencing Ratios
Each of the ratios in this report may be influenced by a variety of economic, environmental and technical factors. Aggregating the data may mask significant differences. When making comparisons, users ofthe data should attempt to understand the various factors that might affect a particular ratio. A high or low value for a given ratio for an individual utility, relative to the median for a group, may be due to particular policies or situations faced by a utility, and may not be indicative of a performance problem.
The groupings in this report adjust for differences in utility size based on the number of customers served, regional variations, and differences in operations related to the proportion of power requirements generated by the utility. Factors that may influence the ratios include:
*Number and composition of customers served;
*Geographic location;
*Population density;
*Source of power supply (and physical, economic, or institutional barriers to acquiring alternative power supply);
*Amount of taxes, payments in lieu of taxes, contributions and free electricity or services that a utility makes to or receives from a local government;
*Number of contract employees used by a utility (e.g., consultants, contract labor for maintenance, tree trimming, etc.);
*Financial policies (e.g., proportion of major capital expenditures financed by long-term debt versus current revenue);
*Management policies (e.g., the extent to which a utility focuses on customer service or other programs);
*Regulatory policies that may affect public power systems in some states;
5

*Relatively small number of utilities reporting data on a particular ratio (e.g., small numbers of utilities frequently appear in the detailed breakdowns);
*Degree of precision ofthe data component, or
*Differences in utility reporting periods.
Ratios are calculated from fiscal year and calendar year data.
E. Comments or Questions about the Report
APPA members are encouraged to comment on the content and format of this report. Comments or questions should be directed to: Paul Zummo, Manager of Policy Research and Analyis ([email protected]), or at:
American Public Power Association 1875 Connecticut Ave, NW
Suite 1200 Washington, D.C. 20009-5715
202/467-2969
6

II. Summary Tables
The following tables present summary data on the 21 financial and operating ratios by customer size class (Table A), by region (Table B) and by generation class (Table C). These tables present median values for each ofthe ratios. Definitions and detailed data including means, medians and quartile values appear in Section III. Data sources and calculation procedures are found in Appendix B.
The average number of retail customers reported by each utility on the APPA Performance Indicators Survey determines customer size class. Responding utilities are grouped into five geographic regions: Northeast, Southeast, North Central/Plains, Southwest, and West. The regions correspond to combined regions of the North American Electric Reliability Council (NERC). See Appendix C for a detailed description ofthe regions.
Generation refers to the power a utility produces and is based upon the utility's net generation as a percent of total sources of energy as reported on the APPA Performance Indicators Survey.
7

Table A: 2012 Financial & Operating Ratios : Median Values by Customer Size Class
2,000 to 5,000 to 10,000 to 20,000 to 50,000 to More than 5,000 10,000 20,000 50,000 100,000 100,000
Ratio Customers Customers Customers Customers Customers Customers 1. Revenue per KWH
a. All Retail Customers $0,088 $0,083 $0,091 $0,087 $0,113 $0,090 b. Residential Customers $0,109 $0,095 $0,102 $0,097 $0,117 $0,099 c. Commercial Customers $0,104 $0,090 $0,099 $0,098 $0,111 $0,089 d. Industrial Customers $0,081 $0,072 $0,072 $0,072 $0,086 $0,063
2. Debt to Total Assets 0.187 0.233 0.351 0.296 0.508 0.549 3. Operating Ratio 0.953 0.914 0.879 0.859 0.751 0.769 4. Current Ratio 3.58 3.45 2.31 2.71 3.60 2.11 5a. Times Interest Earned 7.37 3.73 3.94 2.73 1.83 1.68 5b. Debt Service Coverage a 4.87 3.57 2.48 3.02 2.41 6. Net Income per Revenue Dollar $0,020 $0,048 $0,050 $0,043 $0,029 $0,038 7. Uncollectible Accounts per Revenue Dollar $0.0008 $0.0010 $0.0018 $0.0049 $0.0043 $0.0033 8. Retail Customer per Non-Power Generation
Employee 243 332 338 352 268 289 9. Total O&M Expense per KWH Sold $0,083 $0,075 $0,083 $0,073 $0,071 $0,057 10. Total O&M Expense (Excluding Power
Supply Exp.) per Retail Customer $761 $449 $417 $399 $420 $434 11. Total Power Supply Expense per KWH Sold $0,064 $0,062 $0,068 $0,056 $0,052 $0,045 12. Purchased Power Cost per KWH $0,055 $0,058 $0,064 $0,052 $0,048 $0,041 13. Retail Customers per Meter Reader 2,422 5,376 4,772 8,560 5,956 9,658 14. Distribution O&M Expense per Retail
5,956
Customer $306 $149 $158 $152 $143 $126 15. Distribution O&M Expense per Circuit Mile $14,122 $5,848 $6,139 $5,540 $9,372 $7,745 16. Customer Accounting, Service, and Sales
Expense per Retail Customer $71 $52 $57 $62 $78 $98 17. Administrative and General Expense per
Retail Customer $158 $150 $157 $153 $164 $140 18. Labor Expense per Worker-Hour $33.26 $33.29 $35.57 $34.96 $43.13 $39.86 19. OSHA Incidence Rate (per 100 employees) 4.0 0.0 2.3 1.7 1.7 1.9 20. Energy Loss Percentage 4.34% 3.81% 3.60% 3.77% 3.50% 3.74% 21. System Load Factor 56.1% 57.2% 54.4% 53.1% 55.6% 57.9%
8

Table B : 2012 Financial & Operating Ratios : Median Values by Region
Ratio Northeast Southeast North
Central/Plains Southwest West 1. Revenue per KWH
a. All Retail Customers $0,125 $0,094 $0,086 $0,086 $0,076 b. Residential Customers $0,128 $0,102 $0,103 $0,095 $0,084 c. Commercial Customers $0,132 $0,103 $0,096 $0,087 $0,076 d. Industrial Customers $0,118 $0,077 $0,076 $0,069 $0,058
2. Debt to Total Assets 0.248 0.358 0.231 0.381 0.410 3. Operating Ratio 0.855 0.902 0.901 0.816 0.824 4. Current Ratio 1.80 2.13 2.80 3.60 2.94 5a. Times Interest Earned 9.85 2.85 3.93 3.08 2.21 5b. Debt Service Coverage 3.31 3.18 4.13 2.88 2.54 6. Net Income per Revenue Dollar $0,074 $0,025 $0,040 $0,080 $0,042 7. Uncollectible Accounts per Revenue Dollar $0.0052 $0.0020 $0.0011 $0.0024 $0.0020 8. Retail Customer per Non-Power Generation
Employee 356 318 374 299 310 9. Total O&M Expense per KWH Sold $0,103 $0,085 $0,075 $0,070 $0,057 10. Total O&M Expense (Excluding Power
Supply Exp.) per Retail Customer $638 $375 $463 $431 $479 11. Total Power Supply Expense per KWH Sold $0,070 $0,074 $0,062 $0,055 $0,037 12. Purchased Power Cost per KWH $0,062 $0,070 $0,059 $0,051 $0,036 13. Retail Customers per Meter Reader 5,042 5,961 6,368 4,865 7,105 14. Distribution O&M Expense per Retail Customer $122 $140 $160 $170 $162 15. Distribution O&M Expense per Circuit Mile $8,916 $5,848 $7,093 $5,285 $6,232 16. Customer Accounting, Service, and Sales
Expense per Retail Customer $64 $54 $54 $60 $100 17. Administrative and General Expense per
Retail Customer $265 $131 $155 $150 $159 18. Labor Expense per Worker-Hour $41.91 $29.20 $33.85 $32.85 $42.81 19. OSHA Incidence Rate (per 100 employees) 1.3 1.5 1.8 0.8 2.0 20. Energy Loss Percentage 2.94% 3.80% 3.49% 4.25% 2.99% 21. System Load Factor 53.7% 54.6% 57.3% 55.3% 61.0%
9

Table C : 2012 Financial & Operating Ratios : Median Values by Power Generation Class*
more than No 0 but less 50 to
Ratio Generation than 10% 10 to 50% 100% 1. Revenue per KWH
a. All Retail Customers $0,089 $0,086 $0,083 $0,105 b. Residential Customers $0,098 $0,098 $0,096 $0,115 c. Commercial Customers $0,098 $0,095 $0,086 $0,103 d. Industrial Customers $0,076 $0,070 $0,073 $0,072
2. Debt to Total Assets 0.300 0.236 0.453 0.603 3. Operating Ratio 0.896 0.862 0.810 0.741 9. Total O&M Expense per KWH Sold $0,080 $0,074 $0,058 $0,067 11. Total Power Supply Expense per KWH Sold $0,069 $0,060 $0,047 $0,047 12. Purchased Power Cost per KWH $0,064 $0,055 $0,041 $0,042 17. Administrative and General Expense per
Retail Customer $150 $129 $198 $200 18. Labor Expense per Worker-Hour $33.51 $34.51 $38.64 $38.94 19. OSHA Incidence Rate (per 100 employees) 1.7 1.0 1.9 2.8 20. Energy Loss Percentage 3.91% 3.27% 3.09% 3.70%
* Only those ratios affected by power generation are included in this table
10

III. Detailed Tables
The following tables present a detailed breakdown of each ofthe 21 ratios. Each table includes a breakdown of the ratio by customer size class, and by customer size class and region. Some tables also include a breakdown by customer size and generation class. The numbers of responses are presented along with the mean, median and first and third quartile values of the ratio for each class.
11

Revenue per Kilowatt-hour
a. All retail customers - The ratio of total electric operating revenues from sales to ultimate customers to total kilowatt-hour sales. This ratio measures the amount of revenue received for each kilowatt-hour of electricity sold to all classes of customers, including residential, commercial, industrial, public street and highway lighting and other customers.
b. Residential customers - The ratio of residential revenues to residential sales. This ratio measures the amount of revenue received for each kilowatt-hour of electricity sold to residential customers.
c. Commercial customers - The ratio of commercial revenues to commercial sales. This ratio measures the amount of revenue received for each kilowatt-hour of electricity sold to commercial customers.
d. Industrial customers - The ratio of industrial revenues to industrial sales. This ratio measures the amount of revenues received for each kilowatt-hour of electricity sold to industrial customers.
The definitions of commercial and industrial customers may vary between utilities, with the resulting classification based on specific load characteristics or demand rather than on a popular definition of "commercial" or "industrial." Revenue and sales data include only full-service (bundled sales), thus data for customers who purchase power from an alternative supplier are excluded.
12

Table 1A. Revenue per KWH: All Retail Customers
Utilities
Mean
(weighted) 1st Quartile Median 3rd Quartile
Total 157 $0,089 $0,077 $0,087 $0,100
1. Customer Size Class
2,000 to 5,000 Customers 8 $0,090 a $0,088 a 5,000 to 10,000 Customers 33 0.078 0.076 0.083 0.093 10,000 to 20,000 Customers 41 0.088 0.080 0.091 0.099 20,000 to 50,000 Customers 47 0.083 0.072 0.087 0.107 50,000 to 100,000 Customers 11 0.105 0.092 0.113 0.120 More than 100,000 Customers 17 0.089 0.079 0.090 0.098
2. Region
Northeast 8 0.117 a 0.125 a Southeast 44 0.094 0.086 0.097 0.108
North Central/Plains 47 0.087 0.078 0.086 0.097 Southwest 19 0.087 0.079 0.086 0.093
West 39 0.084 0.064 0.076 0.090
3. Generation
No generation 79 0.088 0.078 0.089 0.099 more than 0 but less than 10% 36 0.089 0.077 0.086 0.098
10 to 50% 26 0.082 0.074 0.083 0.096 50 to 100% 16 0.093 0.086 0.105 0.119
a Quartiles are not calculated for fewer than 9 responses
Table 1B. Revenue per KWH: Residential Customers Mean
Utilities (weighted) 1st Quartile Median 3rd Quartile Total 157 $0,102 $0,090 $0,099 $0,114
1. Customer Size Class
2,000 to 5,000 Customers 8 $0,109 a $0,109 a 5,000 to 10,000 Customers 33 0.091 0.087 0.095 0.103 10,000 to 20,000 Customers 41 0.101 0.092 0.102 0.111 20,000 to 50,000 Customers 47 0.095 0.082 0.097 0.113 50,000 to 100,000 Customers 11 0.118 0.104 0.117 0.130 More than 100,000 Customers 17 0.102 0.089 0.099 0.108
2. Region
Northeast 8 0.120 a 0.128 a Southeast 44 0.107 0.097 0.102 0.112
North Central/Plains 47 0.102 0.091 0.103 0.112 Southwest 19 0.099 0.090 0.095 0.101
West 39 0.083 0.076 0.084 0.104
3. Generation
No generation 79 0.099 0.091 0.098 0.110 more than 0 but less than 10% 36 0.098 0.087 0.098 0.110
10 to 50% 26 0.092 0.085 0.096 0.111 50 to 100% 16 0.110 0.100 0.115 0.129
a Quartiles are not calculated for fewer than 9 responses
13

Table 1C. Revenue per KWH: Commercial Customers Mean
Utilities (weighted) 1st Quartile Median 3rd Quartile
Total 157 $0,094 $0,080 $0,096 $0,109
1. Customer Size Class
2,000 to 5,000 Customers 8 $0,094 a $0,104 a
5,000 to 10,000 Customers 33 0.089 0.085 0.090 0.102
10,000 to 20,000 Customers 41 0.097 0.085 0.099 0.108
20,000 to 50,000 Customers 47 0.095 0.072 0.098 0.111
50,000 to 100,000 Customers 11 0.105 0.091 0.111 0.119
More than 100,000 Customers 17 0.092 0.075 0.089 0.103
2. Region
Northeast 8 0.131 a 0.132 a
Southeast 44 0.105 0.097 0.103 0.111
North Central/Plains 47 0.091 0.085 0.096 0.105
Southwest 19 0.089 0.075 0.087 0.099
West 39 0.075 0.069 0.076 0.095
3. Generation
No generation 79 0.097 0.082 0.098 0.106
more than 0 but less than 10% 36 0.092 0.082 0.095 0.106
10 to 50% 26 0.083 0.071 0.086 0.102
50 to 100% 16 0.098 0.088 0.103 0.126
a Quartiles are not calculated for fewer than 9 responses
Table 1D. Revenue per KWH: Industrial Customers Mean
Utilities (weighted) 1st Quartile Median 3rd Quartile Total 145 $0,066 $0,061 $0,072 $0,085
1. Customer Size Class 2,000 to 5,000 Customers 8 $0,078 a $0,081 a 5,000 to 10,000 Customers 32 0.068 $0,067 0.072 $0,084 10,000 to 20,000 Customers 38 0.070 0.064 0.072 0.084 20,000 to 50,000 Customers 41 0.060 0.055 0.072 0.087
50,000 to 100,000 Customers 10 0.082 0.062 0.086 0.096 More than 100,000 Customers 16 0.066 0.059 0.063 0.078
2. Region Northeast 8 0.096 a 0.118 a Southeast 38 0.067 0.067 0.077 0.085
North Central/Plains 46 0.073 0.069 0.076 0.085 Southwest 15 0.065 0.066 0.069 0.076
West 38 0.062 0.048 0.058 0.078
3. Generation No generation 71 0.068 0.065 0.076 0.085
more than 0 but less than 10% 34 0.073 0.061 0.070 0.086 10 to 50% 26 0.066 0.057 0.073 0.082
50 to 100% 14 0.062 0.060 0.072 0.095 a Quartiles are not calculated for fewer than 9 responses
14

2. Debt to Total Assets
Definition: The ratio of long-term debt, plus current and accrued liabilities, to total assets and other debits. This ratio measures a utility's ability to meet its current and long-term liabilities based on the availability of assets.
Long-term debt includes bonds, advances from the municipality, other long-term debt, any unamortized premium on long-term debt and any unamortized discount on long-term debt. Current and accrued liabilities include warrants, notes and accounts payable, payables to the municipality, customer deposits, taxes accrued, interest accrued, and miscellaneous current and accrued liabilities. Total assets and other debits include utility plant, investments, current and accrued assets and deferred debits.
This ratio may be influenced by the extent to which its components include information applicable to the non-electric portion of the utility, if any (e.g., gas, water or other). In addition, the ratio may be influenced by a utility's financial policies.
Table 2. Debt to Total Assets
Mean Utilities (weighted) 1st Quartile Median 3rd Quartile
Total 156 0.579 0.131 0.340 0.494
1. Customer Size Class 2,000 to 5,000 Customers 8 0.199 a 0.187 a 5,000 to 10,000 Customers 33 0.290 0.123 0.233 0.394 10,000 to 20,000 Customers 41 0.354 0.129 0.351 0.416 20,000 to 50,000 Customers 46 0.385 0.123 0.296 0.545 50,000 to 100,000 Customers 11 0.915 0.352 0.508 0.978 More than 100,000 Customers 17 0.589 0.471 0.549 0.636
2. Region Northeast 8 0.343 a 0.248 a Southeast 43 0.633 0.252 0.358 0.511
North Central/Plains 47 0.472 0.089 0.231 0.427 Southwest 19 0.428 0.258 0.381 0.471
West 39 0.613 0.125 0.410 0.581
3. Generation No generation 78 0.440 0.157 0.300 0.438
more than 0 but less than 10% 36 0.341 0.086 0.236 0.417 10 to 50% 26 0.552 0.148 0.453 0.616
50 to 100% 16 0.703 0.392 0.603 0.771 a Quartiles are not calculated for fewer than 9 responses
15

3. Operating Ratio
Definition: The ratio of total electric operation and maintenance expenses to total electric operating revenues. This ratio measures the proportion of revenues received from electricity sales, rate adjustments and other electric activities required to cover the operation and maintenance costs associated with producing and selling electricity.
Operation and maintenance expenses include the costs of power production, purchased power, transmission, distribution, customer accounting, customer service, sales, and administrative and general expenses. This ratio may be influenced by the availability of alternative power options and the costs of purchased power.
Table 3. Operating Ratio Mean
Utilities (weighted) 1st Quartile Median 3rd Quartile Total 157 0.786 0.792 0.872 0.932
1. Customer Size Class 2,000 to 5,000 Customers 8 0.952 a 0.953 a 5,000 to 10,000 Customers 33 0.913 0.845 0.914 0.950 10,000 to 20,000 Customers 41 0.874 0.816 0.879 0.927 20,000 to 50,000 Customers 47 0.834 0.789 0.859 0.898 50,000 to 100,000 Customers 11 0.759 0.713 0.751 0.815 More than 100,000 Customers 17 0.758 0.689 0.769 0.879
2. Region Northeast 8 0.811 a 0.855 a Southeast 44 0.799 0.809 0.902 0.949
North Central/Plains 47 0.853 0.848 0.901 0.945 Southwest 19 0.790 0.764 0.816 0.856
West 39 0.750 0.737 0.824 0.879
3. Generation No generation 79 0.898 0.850 0.896 0.939
more than 0 but less than 10% 36 0.831 0.811 0.862 0.926 10 to 50% 26 0.765 0.705 0.810 0.897
50 to 100% 16 0.696 0.702 0.741 0.800 a Quartiles are not calculated for fewer than 9 responses
16
4. Current Ratio
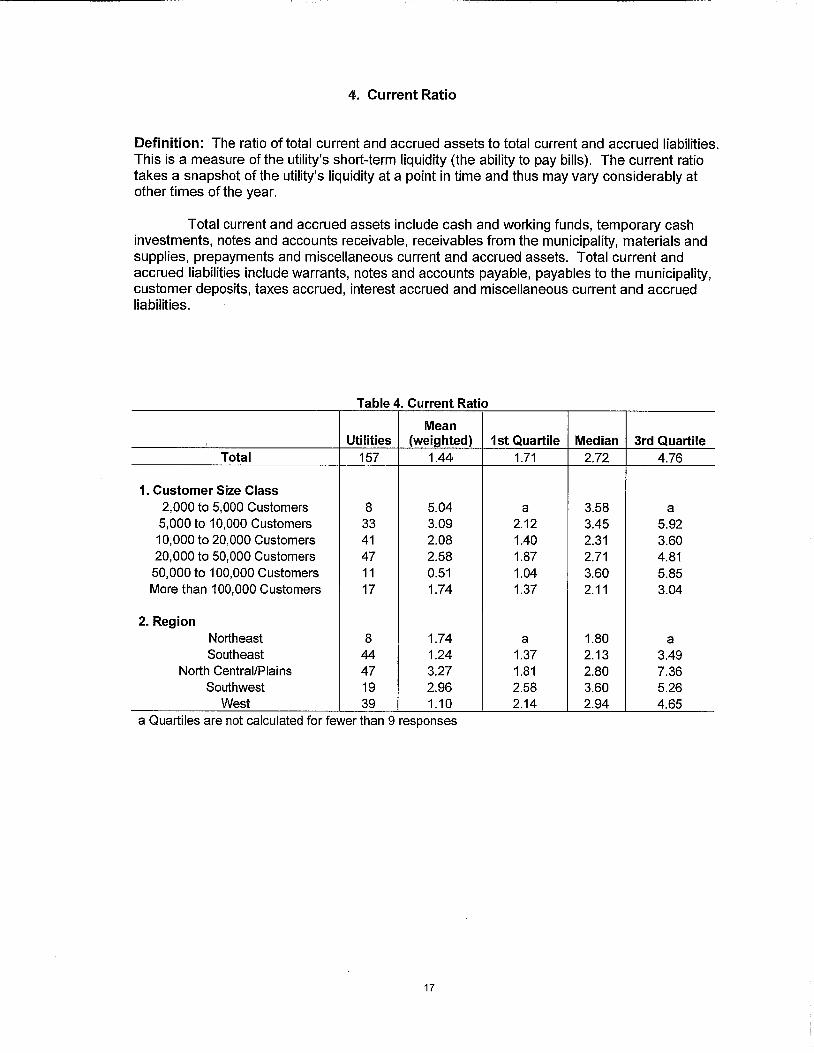
Definition: The ratio of total current and accrued assets to total current and accrued liabilities. This is a measure ofthe utility's short-term liquidity (the ability to pay bills). The current ratio takes a snapshot ofthe utility's liquidity at a point in time and thus may vary considerably at other times ofthe year.
Total current and accrued assets include cash and working funds, temporary cash investments, notes and accounts receivable, receivables from the municipality, materials and supplies, prepayments and miscellaneous current and accrued assets. Total current and accrued liabilities include warrants, notes and accounts payable, payables to the municipality, customer deposits, taxes accrued, interest accrued and miscellaneous current and accrued liabilities.
Table 4. Current Ratio
Mean Utilities (weighted) 1st Quartile Median 3rd Quartile
Total 157 1.44 1.71 2.72 4.76
1. Customer Size Class 2,000 to 5,000 Customers 8 5.04 a 3.58 a 5,000 to 10,000 Customers 33 3.09 2.12 3.45 5.92 10,000 to 20,000 Customers 41 2.08 1.40 2.31 3.60 20,000 to 50,000 Customers 47 2.58 1.87 2.71 4.81 50,000 to 100,000 Customers 11 0.51 1.04 3.60 5.85 More than 100,000 Customers 17 1.74 1.37 2.11 3.04
2. Region Northeast 8 1.74 a 1.80 a Southeast 44 1.24 1.37 2.13 3.49
North Central/Plains 47 3.27 1.81 2.80 7.36 Southwest 19 2.96 2.58 3.60 5.26
West 39 1.10 2.14 2.94 4.65 a Quartiles are not calculated for fewer than 9 responses
17
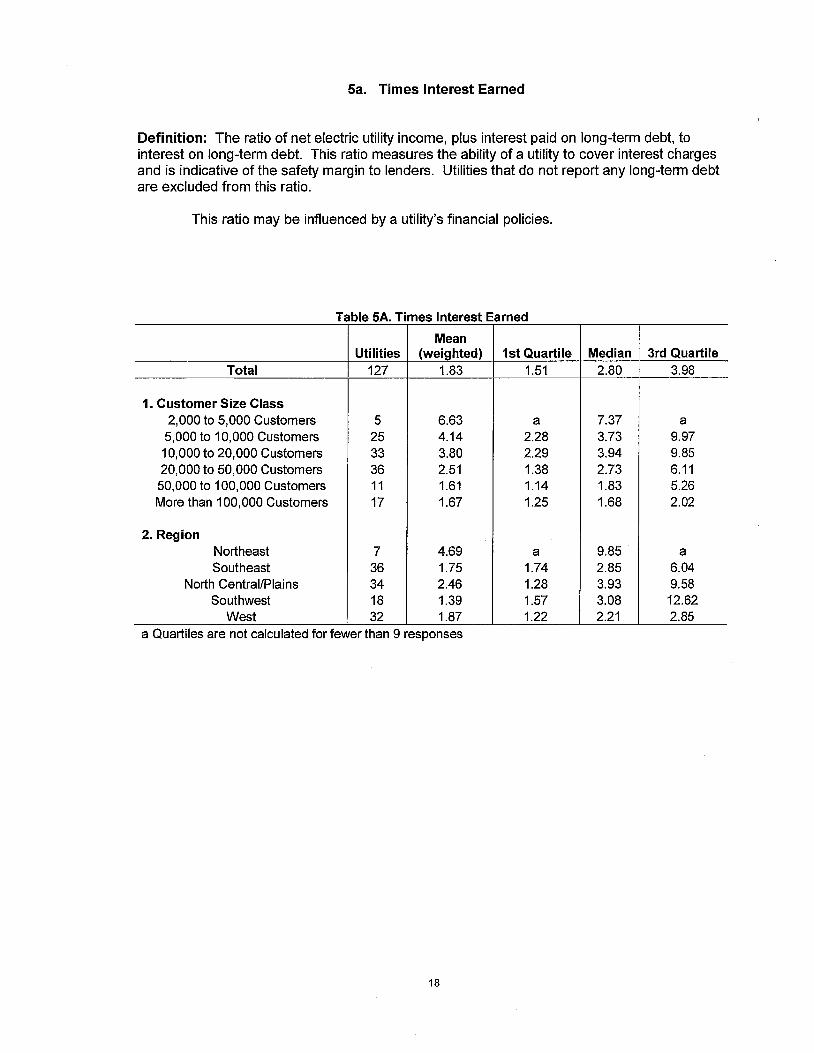
5a. Times Interest Earned
Definition: The ratio of net electric utility income, plus interest paid on long-term debt, to interest on long-term debt. This ratio measures the ability of a utility to cover interest charges and is indicative of the safety margin to lenders. Utilities that do not report any long-term debt are excluded from this ratio.
This ratio may be influenced by a utility's financial policies.
Table 5A. Times Interest Earned
Mean Utilities (weighted) 1st Quartile Median 3rd Quartile
Total 127 1.83 1.51 2.80 3.98
1. Customer Size Class 2,000 to 5,000 Customers 5 6.63 a 7.37 a 5,000 to 10,000 Customers 25 4.14 2.28 3.73 9.97 10,000 to 20,000 Customers 33 3.80 2.29 3.94 9.85 20,000 to 50,000 Customers 36 2.51 1.38 2.73 6.11 50,000 to 100,000 Customers 11 1.61 1.14 1.83 5.26 More than 100,000 Customers 17 1.67 1.25 1.68 2.02
2. Region Northeast 7 4.69 a 9.85 a Southeast 36 1.75 1.74 2.85 6.04
North Central/Plains 34 2.46 1.28 3.93 9.58 Southwest 18 1.39 1.57 3.08 12.62
West 32 1.87 1.22 2.21 2.85 a Quartiles are not calculated for fewer than 9 responses
18

5b. Debt Service Coverage
Definition: The ratio of net revenues available for debt service to total long-term debt service for the year. This ratio measures the utility's ability to meet its annual long-term debt obligation.
Net revenues available for debt service equal net electric utility operating income (operating revenues minus operating expenses) plus net electric utility non-operating income, plus depreciation. Debt service includes principle and interest payments on long-term debt.
This ratio may be influenced by a utility's financial policies.
Table 5b. Debt Service Coverage
Utilities Mean
(weighted) 1st Quartile Median 3rd Quartile Total 126 2.44 1.55 3.09 7.05
1. Customer Size Class 2,000 to 5,000 Customers 4 b a b a 5,000 to 10,000 Customers 26 4.53 2.30 4.87 20.70 10,000 to 20,000 Customers 32 3.15 2.41 3.57 7.46 20,000 to 50,000 Customers 36 2.39 1.38 2.48 4.70 50,000 to 100,000 Customers 11 2.00 1.44 3.02 4.48 More than 100,000 Customers 17 2.40 1.38 2.41 6.31
2. Region Northeast 8 0.94 a 3.31 a Southeast 36 2.61 1.40 3.18 5.94
North Central/Plains 32 4.38 2.17 4.13 15.03 Southwest 18 0.41 2.12 2.88 7.00
West 32 5.57 1.31 2.54 5.32 a Quartiles are not calculated for fewer than 9 responses b Means and Medians are not calculated for fewer than 5 responses
19

6. Net Income per Revenue Dollar
Definition: The ratio of net electric utility income to total electric operating revenues. This ratio measures the amount of income remaining, after accounting for operation and maintenance expenses, depreciation, taxes and tax equivalents, for every dollar received from sales of electricity.
The ratio may be influenced by the type and availability of power supply options and by the amount of taxes and tax equivalents that a utility transfers to the municipality or other governmental body. Financial policies and the amount of debt may also affect this ratio (e.g., how a utility finances capital investments).
Table 6. Net Income Per Revenue Dollar
Utilities Mean
(weighted) 1st Quartile Median 3rd Quartile Total 157 $0,048 $0,016 $0,039 $0,078
1. Customer Size Class 2,000 to 5,000 Customers 8 $0,052 a $0,020 a 5,000 to 10,000 Customers 33 0.048 $0,011 0.048 $0,087 10,000 to 20,000 Customers 41 0.063 0.024 0.050 0.082 20,000 to 50,000 Customers 47 0.043 0.009 0.031 0.072 50,000 to 100,000 Customers 11 0.040 0.001 0.029 0.056 More than 100,000 Customers 17 0.050 0.015 0.038 0.079
2. Region Northeast 8 0.072 a 0.074 a Southeast 44 0.042 0.016 0.025 0.046
North Central/Plains 47 0.049 0.018 0.040 0.083 Southwest 19 0.025 0.023 0.080 0.102
West 39 0.063 0.009 0.042 0.078 a Quartiles are not calculated for fewer than 9 responses
20
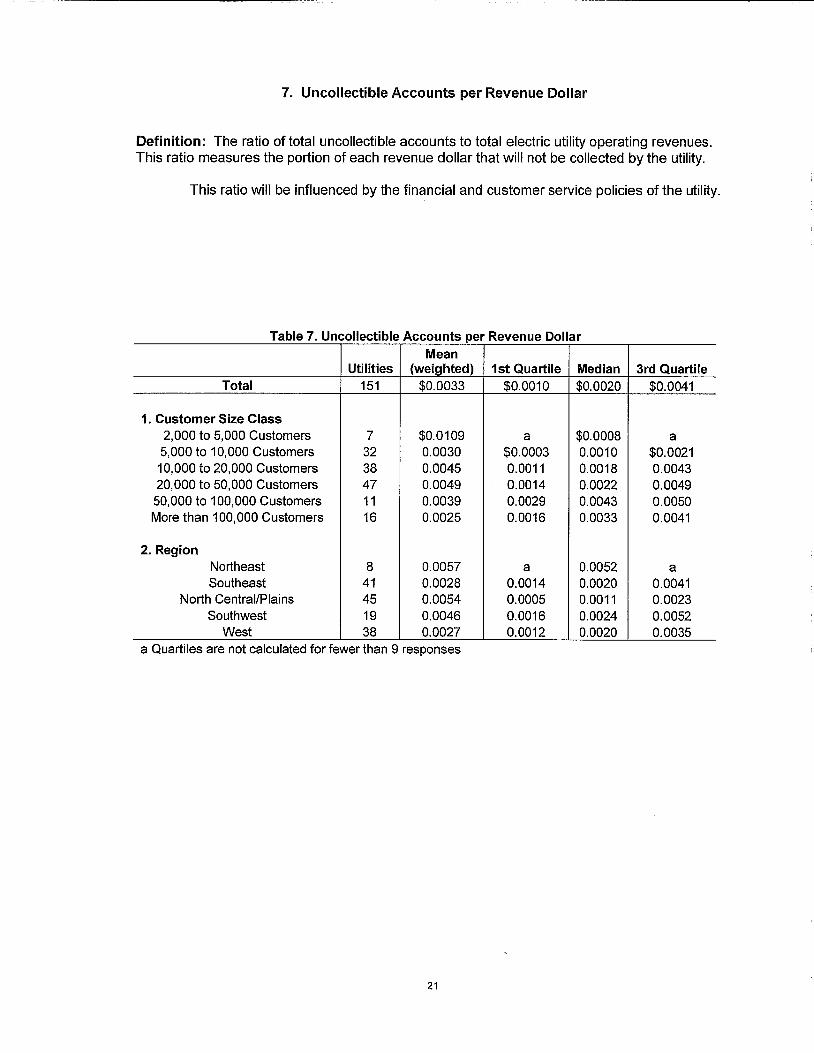
7. Uncollectible Accounts per Revenue Dollar
Definition: The ratio of total uncollectible accounts to total electric utility operating revenues. This ratio measures the portion of each revenue dollar that will not be collected by the utility.
This ratio will be influenced by the financial and customer service policies of the utility.
Table 7. Uncollectible Accounts per Revenue Dollar Mean
Utilities (weighted) 1st Quartile Median 3rd Quartile Total 151 $0.0033 $0.0010 $0.0020 $0.0041
1. Customer Size Class 2,000 to 5,000 Customers 7 $0.0109 a $0.0008 a 5,000 to 10,000 Customers 32 0.0030 $0.0003 0.0010 $0.0021 10,000 to 20,000 Customers 38 0.0045 0.0011 0.0018 0.0043 20,000 to 50,000 Customers 47 0.0049 0.0014 0.0022 0.0049 50,000 to 100,000 Customers 11 0.0039 0.0029 0.0043 0.0050 More than 100,000 Customers 16 0.0025 0.0016 0.0033 0.0041
2. Region Northeast 8 0.0057 a 0.0052 a Southeast 41 0.0028 0.0014 0.0020 0.0041
North Central/Plains 45 0.0054 0.0005 0.0011 0.0023 Southwest 19 0.0046 0.0016 0.0024 0.0052
West 38 0.0027 0.0012 0.0020 0.0035 a Quartiles are not calculated for fewer than 9 responses
21

8. Retail Customers per Non-power-generation Employee
Definition: The ratio of the average number of retail customers from all classes to the total number of full-time, part-time and contract employees not involved in the generation of power. This ratio measures the average number of customers served by each non-generation employee.
The ratio may be influenced by the mix of customers and by population density. It will be influenced by the extent that employees shared with other (non-electric) departments are not properly prorated, or that employees involved in resale transactions are included. Part-time employees are assumed to work half-time (i.e., two part-time employees are counted as one full-time employee). To the extent that this assumption is violated, the ratio will be biased. Contract employees include only those individuals performing regular utility work on an ongoing basis.
Table 8. Retail Customers per Non-power-generation Employee
Utilities Mean
(weighted) 1st Quartile Median 3rd Quartile Total 156 283 252 330 429
1. Customer Size Class 2,000 to 5,000 Customers 8 247 a 243 a 5,000 to 10,000 Customers 33 299 244 332 411 10,000 to 20,000 Customers 41 304 237 338 446 20,000 to 50,000 Customers 47 342 296 352 473 50,000 to 100,000 Customers 11 261 220 268 337 More than 100,000 Customers 16 268 257 289 388
2. Region Northeast 8 327 a 356 a Southeast 44 264 243 318 391
North Central/Plains 47 342 257 374 481 Southwest 19 247 207 299 349
West 38 301 270 310 458 a Quartiles are not calculated for fewer than 9 responses
22

9. Total Operation and Maintenance Expense per Kilowatt-hour Sold
Definition: The ratio of total electric utility operation and maintenance expenses, including the cost of generated and purchased power, to total kilowatt-hour sales to ultimate and resale customers. This ratio measures average total operation and maintenance expenses associated with each kilowatt-hour of electricity sold, either for resale or to ultimate customers.
Included in operation and maintenance costs are the expenses associated with power supply (generation and purchased power), transmission, distribution, customer accounting, customer services, sales, and administrative and general functions ofthe electric utility. Because power supply expenses typically comprise the largest component of total operation and maintenance expenses, this ratio may be influenced by the proportion of power generated by a utility and the availability of alternative power supplies. Kilowatt-hours of electricity produced but not sold, i.e., energy furnished without charge, energy used internally and energy losses are not included in the denominator.
Table 9. Total O&M Expense per KWH sold
Mean Utilities (weighted) 1st Quartile Median 3rd Quartile
Total 156 $0,063 $0,059 $0,075 $0,090
1. Customer Size Class 2,000 to 5,000 Customers 7 $0,079 a $0,083 a 5,000 to 10,000 Customers 33 0.072 $0,068 0.075 $0,089 10,000 to 20,000 Customers 41 0.075 0.064 0.083 0.091 20,000 to 50,000 Customers 47 0.064 0.055 0.073 0.094 50,000 to 100,000 Customers 11 0.071 0.064 0.071 0.086 More than 100,000 Customers 17 0.059 0.051 0.057 0.086
2. Region Northeast 8 0.096 a 0.103 a Southeast 43 0.070 0.077 0.085 0.096
North Central/Plains 47 0.069 0.067 0.075 0.089 Southwest 19 0.066 0.062 0.070 0.080
West 39 0.053 0.047 0.057 0.065
3. Generation No generation 78 0.073 0.069 0.080 0.092
more than 0 but less than 10% 36 0.069 0.062 0.074 0.090 10 to 50% 26 0.050 0.046 0.058 0.074
50 to 100% 16 0.059 0.057 0.067 0.085 a Quartiles are not calculated for fewer than 9 responses
23

10. Total Operation and Maintenance Expense (Excluding Power Supply Expense) per Retail Customer
Definition: The ratio of total electric utility operation and maintenance expenses, excluding all costs of power supply, to the total number of ultimate customers.
Operation and maintenance expenses include the costs of transmission, distribution, customer accounting, customer services, sales and administrative and general expenses. The costs of power supply (generation and purchased power) are excluded from the ratio. This ratio may be affected by population density and the mix of customers between various classes (residential, commercial, industrial or other). Also, the extent that a utility services a large number of resale customers will influence the ratio.
Table 10. Total O&M Expense (Excluding Power Supply Expense) per Retail Customer
Mean Utilities (weighted) 1st Quartile Median 3rd Quartile
Total 156 $497 $355 $432 $622
1. Customer Size Class 2,000 to 5,000 Customers 7 $807 a $761 a 5,000 to 10,000 Customers 33 $514 $359 $449 $576 10,000 to 20,000 Customers 41 495 338 417 595 20,000 to 50,000 Customers 47 454 328 399 561 50,000 to 100,000 Customers 11 492 354 420 652 More than 100,000 Customers 17 509 388 434 661
2. Region Northeast 8 655 a 638 a Southeast 43 412 301 375 454
North Central/Plains 47 519 375 463 640 Southwest 19 630 391 431 636
West 39 517 365 479 627 a Quartiles are not calculated for fewer than 9 responses
24

11. Total Power Supply Expense per Kilowatt-hour Sold
Definition: The ratio ofthe total costs of power supply to total sales to both ultimate and resale customers. This ratio measures all power supply costs, including generation and purchased power, associated with the sale of each kilowatt-hour of electricity.
The ratio includes operation and maintenance costs arising from all generation types, including steam, nuclear, hydraulic and other types of generation. Operation and maintenance expenses include the costs of fuel, labor, supervision, engineering, materials and supplies, and also include the costs of purchased power. The ratio may be influenced by the geographic location of the utility, the availability of alternative power supplies, the degree to which the utility can generate its own power, and access to transmission. The ratio does not include kilowatt-hours produced but not sold, i.e., energy used internally, energy furnished without charge, or energy losses.
Table 11. Total Power Supply Expense per KWH Sold
Mean Utilities (weighted) 1st Quartile Median 3rd Quartile
Total 156 $0,049 $0,046 $0,061 $0,072
1. Customer Size Class 2,000 to 5,000 Customers 7 $0,061 a $0,064 a 5,000 to 10,000 Customers 33 0.059 $0,057 0.062 $0,071 10,000 to 20,000 Customers 41 0.060 0.054 0.068 0.074 20,000 to 50,000 Customers 47 0.051 0.036 0.056 0.073 50,000 to 100,000 Customers 11 0.054 0.049 0.052 0.064 More than 100,000 Customers 17 0.046 0.039 0.045 0.062
2. Region Northeast 8 0.066 a 0.070 a Southeast 43 0.060 0.068 0.074 0.079
North Central/Plains 47 0.053 0.053 0.062 0.069 Southwest 19 0.047 0.044 0.055 0.062
West 39 0.037 0.032 0.037 0.053
3. Generation No generation 78 0.062 0.053 0.069 0.076
more than 0 but less than 10% 36 0.051 0.052 0.060 0.070 10 to 50% 26 0.034 0.031 0.047 0.058
50 to 100% 16 0.046 0.044 0.047 0.062 a Quartiles are not calculated for fewer than 9 responses
25

12. Purchased Power Cost per Kilowatt-hour
Definition: The ratio of the cost of purchased power to the amount of kilowatt-hours purchased. This ratio measures the purchased power component of power supply costs.
Purchased power includes purchases from investor-owned utilities, municipalities, cooperatives or other public authorities for subsequent distribution and sale to ultimate customers. It does not include power exchanges. Adjustments to the cost data were made in a small number of cases to eliminate power exchanges. The cost reflects the amount billed, including adjustments and other charges.
The ratio may be influenced by the geographic location ofthe utility, availability of alternative power supplies, access to transmission, and the type of purchase agreement, such as firm power, economy power or surplus sales.
Table 12. Purchased Power Cost per KWH Mean
Utilities (weighted) 1st Quartile Median 3rd Quartile Total 156 $0,051 $0,040 $0,055 $0,070
1. Customer Size Class 2,000 to 5,000 Customers 8 $0,051 a $0,055 a 5,000 to 10,000 Customers 33 0.055 $0,049 0.058 $0,069 10,000 to 20,000 Customers 41 0.059 0.050 0.064 0.073 20,000 to 50,000 Customers 46 0.048 0.034 0.052 0.068 50,000 to 100,000 Customers 11 0.057 0.037 0.048 0.089 More than 100,000 Customers 17 0.049 0.032 0.041 0.052
2. Region Northeast 7 0.062 a 0.062 a Southeast 44 0.063 0.063 0.070 0.075
North Central/Plains 47 0.057 0.049 0.059 0.068 Southwest 19 0.046 0.038 0.051 0.058
West 39 0.038 0.032 0.036 0.050
3. Generation No generation 79 0.059 0.050 0.064 0.072
more than 0 but less than 10% 36 0.048 0.048 0.055 0.067 10 to 50% 26 0.038 0.031 0.041 0.052
50 to 100% 15 0.045 0.035 0.042 0.050 a Quartiles are not calculated for fewer than 9 responses
26

13. Retail Customers per Meter Reader
Definition: The ratio of retail customers to the number of meter readers employed by the utility. This measures the average number of retail customers served by each meter reader.
The number of meter readers includes the total number of full-time meter readers plus half of all part-time meter readers. It is assumed that all part-time employees work half-time (i.e., one full-time employee is equivalent to two part-time employees). Population density, frequency of meter readings, and the technology or methods used to read meters will influence the ratio.
Table 13. Retail Customers per Meter Reader
Utilities Mean
(weighted) 1st Quartile Median 3rd Quartile Total 134 6,749 4,230 6,205 9,671
1. Customer Size Class 2,000 to 5,000 Customers 5 2,428 a 2,422 a 5,000 to 10,000 Customers 27 4,083 3,556 5,376 7,183 10,000 to 20,000 Customers 36 4,782 3,561 4,772 7,006 20,000 to 50,000 Customers 40 6,579 6,001 8,560 10,593 50,000 to 100,000 Customers 11 5,741 4,104 5,956 12,305 More than 100,000 Customers 15 8,118 6,920 9,658 12,097
2. Region Northeast 6 5,389 a 4,578 a Southeast 39 7,173 3,924 5,961 10,733
North Central/Plains 40 5,818 4,311 6,368 8,815 Southwest 17 5,285 3,715 4,865 5,891
West 32 7,706 5,863 7,105 10,544 a Quartiles are not calculated for fewer than 9 responses
27

14. Distribution Operation and Maintenance Expenses per Retail Customer
Definition: The ratio of total distribution operation and maintenance expenses to the total number of retail customers. This ratio measures the average distribution expense associated with delivering power to each retail customer.
Distribution costs include expenses associated with labor, supervision, engineering, materials and supplies used in the operation and maintenance ofthe distribution system. Population density and the mix of customer classes served by the utility will influence the ratio.
Those utilities that do not allocate expenses to all three categories of (1) distribution expense (2) customer accounting, customer service, and sales expense and (3) administrative and general expense are excluded from ratios 14 through 17 (Distribution Operation and Maintenance Expenses per Retail Customer; Distribution Operation and Maintenance Expenses per Circuit Mile; Customer Accounting, Customer Service and Sales Expenses per Retail Customer; and Administrative and General Expenses per Retail Customer).
Table 14. Distribution O&M Expenses per Retail Customer
Utilities Mean
(weighted) 1st Quartile Median 3rd Quartile Total 146 $145 $117 $152 $196
1. Customer Size Class 2,000 to 5,000 Customers 7 $373 a $306 a 5,000 to 10,000 Customers 30 214 $109 149 $215 10,000 to 20,000 Customers 39 180 124 158 212 20,000 to 50,000 Customers 42 165 113 152 187 50,000 to 100,000 Customers 11 158 132 143 180 More than 100,000 Customers 17 127 109 126 151
2. Region Northeast 8 124 a 122 a Southeast 40 131 112 140 180
North Central/Plains 42 168 117 160 222 Southwest 18 146 115 170 230
West 38 151 129 162 193 a Quartiles are not calculated for fewer than 9 responses
28

15. Distribution Operation and Maintenance Expenses per Circuit Mile
Definition: The ratio of total distribution operation and maintenance expenses to the total number of circuit miles of distribution line. This measures the total distribution costs associated with each circuit mile of distribution line used to deliver power to customers.
Distribution costs include expenses associated with labor, supervision, engineering, materials and supplies used in the operation and maintenance ofthe distribution system. The ratio will be affected by population density, the mix of customer classes served by the utility, the dispersion of customers within the utility's service territory, and the proportion of underground and overhead distribution lines.
Those utilities that do not allocate expenses to all three categories of (1) distribution expense (2) customer accounting, customer service, and sales expense and (3) administrative and general expense are excluded from ratios 14 through 17 (Distribution Operation and Maintenance Expenses per Retail Customer; Distribution Operation and Maintenance Expenses per Circuit Mile; Customer Accounting, Customer Service and Sales Expenses per Retail Customer; and Administrative and General Expenses per Retail Customer).
Table 15. Distribution O&M Expenses per Circuit Mile
Utilities Mean
(weighted) 1st Quartile Median 3rd Quartile Total 141 $5,704 $4,116 $6,319 $10,470
1. Customer Size Class 2,000 to 5,000 Customers 6 $8,871 a $14,122 a 5,000 to 10,000 Customers 29 3,132 $4,293 5,848 $6,984 10,000 to 20,000 Customers 37 5,112 3,776 6,139 10,774 20,000 to 50,000 Customers 41 4,341 3,938 5,540 11,925 50,000 to 100,000 Customers 11 8,612 6,580 9,372 13,783 More than 100,000 Customers 17 6,405 4,493 7,745 9,366
2. Region Northeast 7 8,419 a 8,916 a Southeast 39 6,206 3,929 5,848 9,369
North Central/Plains 41 6,011 4,585 7,093 10,774 Southwest 17 4,288 3,220 5,285 7,745
West 37 5,771 4,243 6,232 12,705 a Quartiles are not calculated for fewer than 9 responses
29

16. Customer Accounting, Customer Service and Sales Expenses per Retail Customer
Definition: The ratio of total customer accounting, service, and sales expenses to the total number of retail customers. This ratio measures the average expenses incurred by the utility in handling each customer's account. This includes the costs of obtaining and servicing all retail customers. Uncollectible accounts and meter reading expenses are included in this ratio.
The ratio includes the costs of labor, materials and other expenses associated with advertising, billing, collections, records, handling inquiries and complaints. It also includes the costs of promoting and providing customer service programs such as energy services or conservation programs. The ratio will be influenced by the degree to which the utility provides various energy services and other types of customer programs, and also by the mix of customer classes it serves.
Those utilities that do not allocate expenses to all three categories of (1) distribution expense (2) customer accounting, customer service, and sales expense and (3) administrative and general expense are excluded from ratios 14 through 17 (Distribution Operation and Maintenance Expenses per Retail Customer; Distribution Operation and Maintenance Expenses per Circuit Mile; Customer Accounting, Customer Service and Sales Expenses per Retail Customer; and Administrative and General Expenses per Retail Customer).
Table 16. Customer Accounting, Customer Service and Sales Expense per Retail Customer
Utilities Mean
(weighted) 1st Quartile Median 3rd Quartile Total 146 $110 $44 $63 $97
1. Customer Size Class 2,000 to 5,000 Customers 7 $84 a $71 a 5,000 to 10,000 Customers 30 59 $31 52 $74 10,000 to 20,000 Customers 39 63 39 57 81 20,000 to 50,000 Customers 42 86 45 62 107 50,000 to 100,000 Customers 11 81 59 78 100 More than 100,000 Customers 17 131 63 98 129
2. Region Northeast 8 86 a 64 a Southeast 40 74 41 54 79
North Central/Plains 42 80 38 54 76 Southwest 18 107 51 60 78
West 38 149 64 100 134 a Quartiles are not calculated for fewer than 9 responses
30
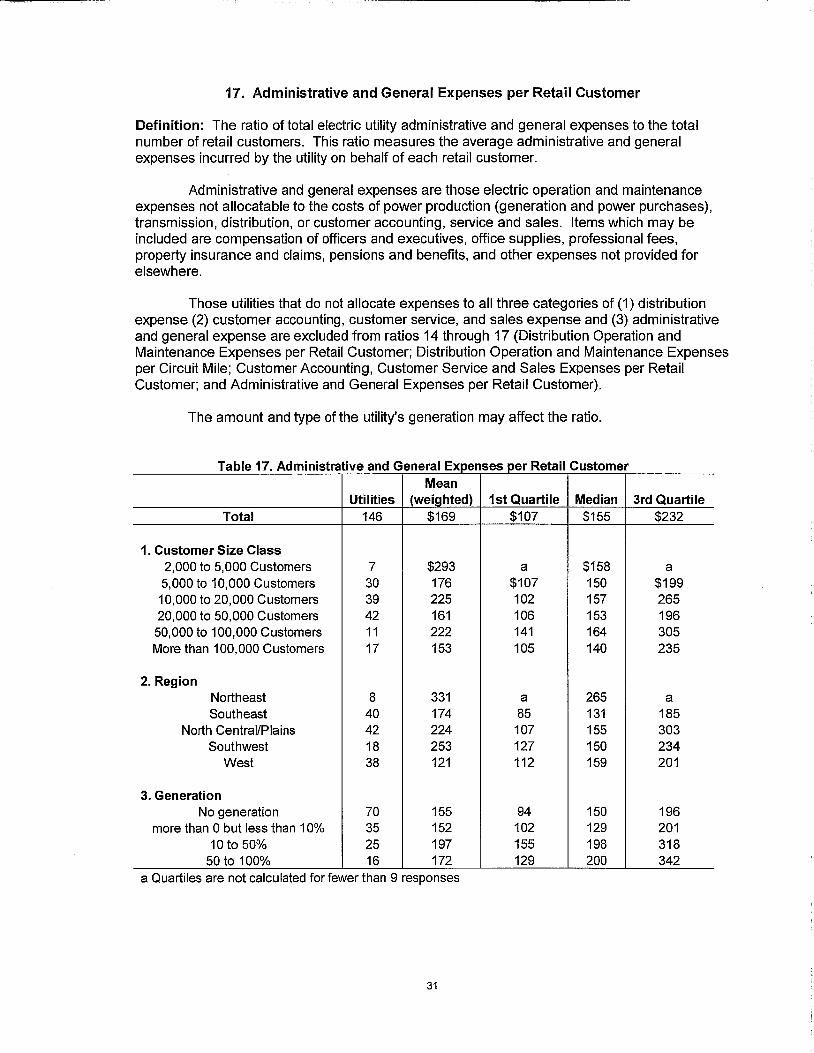
17. Administrative and General Expenses per Retail Customer
Definition: The ratio of total electric utility administrative and general expenses to the total number of retail customers. This ratio measures the average administrative and general expenses incurred by the utility on behalf of each retail customer.
Administrative and general expenses are those electric operation and maintenance expenses not allocatable to the costs of power production (generation and power purchases), transmission, distribution, or customer accounting, service and sales. Items which may be included are compensation of officers and executives, office supplies, professional fees, property insurance and claims, pensions and benefits, and other expenses not provided for elsewhere.
Those utilities that do not allocate expenses to all three categories of (1) distribution expense (2) customer accounting, customer service, and sales expense and (3) administrative and general expense are excluded from ratios 14 through 17 (Distribution Operation and Maintenance Expenses per Retail Customer; Distribution Operation and Maintenance Expenses per Circuit Mile; Customer Accounting, Customer Service and Sales Expenses per Retail Customer; and Administrative and General Expenses per Retail Customer).
The amount and type ofthe utility's generation may affect the ratio.
Table 17. Administrative and General Expenses per Retail Customer
Utilities Mean
(weighted) 1st Quartile Median 3rd Quartile Total 146 $169 $107 $155 $232
1. Customer Size Class 2,000 to 5,000 Customers 7 $293 a $158 a 5,000 to 10,000 Customers 30 176 $107 150 $199 10,000 to 20,000 Customers 39 225 102 157 265 20,000 to 50,000 Customers 42 161 106 153 196 50,000 to 100,000 Customers 11 222 141 164 305 More than 100,000 Customers 17 153 105 140 235
2. Region Northeast 8 331 a 265 a Southeast 40 174 85 131 185
North Central/Plains 42 224 107 155 303 Southwest 18 253 127 150 234
West 38 121 112 159 201
3. Generation No generation 70 155 94 150 196
more than 0 but less than 10% 35 152 102 129 201 10 to 50% 25 197 155 198 318
50 to 100% 16 172 129 200 342 a Quartiles are not calculated for fewer than 9 responses
31

18. Labor Expense per Worker-hour
Definition: The ratio of total annual earnings of full-time, part-time and contract labor employees to the total number of hours worked during the year by these employees. This ratio measures the actual cost of labor to the utility.
Total annual earnings include all payroll compensation received by full-time, part-time or contract employees, including straight-time pay, overtime pay, and payment for time not worked such as sick pay, vacation pay, holiday pay, or other payments. Fringe benefits, such as health care premiums paid by the employer, are excluded. Hours worked includes total productive hours spent at work, including both straight time and overtime hours worked. Hours paid but not worked, such as on holidays or other paid leave time, are not included. This is not the same as a wage rate, which is simply the earnings per hour. A wage rate generally includes hours not worked (such as vacation or sick pay), which this ratio does not.
Table 18. Labor Expense per Worker Hour
Utilities Mean
(weighted) 1st Quartile Median 3rd Quartile Total 150 $39.39 $30.07 $35.11 $40.68
1. Customer Size Class 2,000 to 5,000 Customers 8 $32.93 a $33.26 a 5,000 to 10,000 Customers 33 32.85 $30.18 33.29 $36.51 10,000 to 20,000 Customers 41 34.10 29.42 35.57 38.83 20,000 to 50,000 Customers 42 34.88 29.88 34.96 42.85 50,000 to 100,000 Customers 11 41.11 33.03 43.13 47.11 More than 100,000 Customers 15 41.19 35.09 39.86 46.10
2. Region Northeast 8 44.98 a 41.91 a Southeast 42 32.35 25.15 29.20 34.96
North Central/Plains 46 35.46 31.19 33.85 37.50 Southwest 19 45.91 30.47 32.85 37.25
West 35 45.41 38.79 42.81 46.85
3. Generation No generation 75 32.34 29.39 33.51 39.24
more than 0 but less than 10% 35 35.59 28.20 34.51 37.88 10 to 50% 24 49.83 33.65 38.64 42.94
50 to 100% 16 40.61 34.31 38.94 43.99 a Quartiles are not calculated for fewer than 9 responses
32

19. OSHA Incidence Rate (per 100 employees)
Definition: The ratio of lost workday cases during the year to the total worker-hours of exposure, per 100 employees. This ratio measures the proportion of employees subject to on-the-job injuries and illnesses over the course of the year.
Worker-hours of exposure are calculated by adding the total full-time and part-time annual hours worked. Contract workers' hours are included in the calculation only if the utility supervises the workers' day-to-day activities.
Lost workday cases are those which involve days away from work or days of restricted work activity because of non-fatal occupational illness or injury. Restricted work activity occurs when 1) an employee is assigned to another job on a temporary basis; 2) an employee works at a permanent job less than full time; or 3) the employee works at a permanent job but cannot perform all normal duties. This ratio will be influenced by management practices and policies, and by the proportion of employees involved in hazardous occupations.
Table 19. OSHA Incidence Rate
Mean Utilities (weighted) 1st Quartile Median 3rd Quartile
Total 146 2.9 0.0 1.7 3.7
1. Customer Size Class 2,000 to 5,000 Customers 7 6.1 a 4.0 a 5,000 to 10,000 Customers 32 2.2 0.0 0.0 3.1 10,000 to 20,000 Customers 39 3.1 0.9 2.3 4.7 20,000 to 50,000 Customers 41 3.0 0.0 1.7 5.3 50,000 to 100,000 Customers 11 2.2 0.7 1.7 2.4 More than 100,000 Customers 16 2.8 0.8 1.9 2.9
2. Region Northeast 8 3.4 a 1.3 a Southeast 40 3.8 0.0 1.5 5.1
North Central/Plains 43 3.5 0.0 1.8 4.7 Southwest 18 1.1 0.0 0.8 2.0
West 37 2.0 0.0 2.0 3.5
3. Generation No generation 73 5.8 0.0 1.7 5.3
more than 0 but less than 10% 33 3.7 0.0 1.0 2.8 10 to 50% 24 2.4 1.0 1.9 3.2
50 to 100% 16 1.1 0.6 1.5 2.8 a Quartiles are not calculated for fewer than 9 responses
33

20. Energy Loss Percentage
Definition: The ratio of total energy losses to total sources of energy. This ratio measures how much energy is lost in the utility's electrical system, and is an indicator ofthe efficiency ofthe electrical system. It represents the percentage of electrical energy that is bought or generated by the utility, but is not available to be sold to customers (or for the utility's own use).
Losses include both physical losses that occur in the distribution system and metering and billing losses. Generation, purchases, net exchanges and net wheeling are all included in total sources of energy.
Table 20. Energy Loss Percentage
Utilities Mean
(weighted) 1st Quartile Median 3rd Quartile Total 150 3.53% 2.66% 3.76% 4.56%
1. Customer Size Class 2,000 to 5,000 Customers 7 4.20% a 4.34% a 5,000 to 10,000 Customers 32 3.32 2.60% 3.81 4.31% 10,000 to 20,000 Customers 39 3.44 2.49 3.60 4.65 20,000 to 50,000 Customers 45 3.70 2.49 3.77 4.88 50,000 to 100,000 Customers 11 3.49 3.22 3.50 3.74 More than 100,000 Customers 16 3.51 3.15 3.74 4.51
2. Region Northeast 7 2.70 a 2.94 a Southeast 43 3.25 3.22 3.80 4.53
North Central/Plains 44 3.40 2.43 3.49 4.39 Southwest 18 4.63 3.85 4.25 5.24
West 38 3.26 2.24 2.99 4.65
3. Generation No generation 75 3.89 2.99 3.91 4.82
more than 0 but less than 10% 35 3.29 2.42 3.27 4.45 10 to 50% 24 3.44 2.12 3.09 3.77
50 to 100% 16 3.42 3.04 3.70 4.25 a Quartiles are not calculated for fewer than 9 responses
34

21. System Load Factor
Definition: The ratio of the system average load, total sales plus losses (MWh) divided by 8760 (hours), to system peak demand (typically a summer or winter peak measured during a particular hour at all delivery points and generator busses on a totalized basis).
System load factor is descriptive of the total system load characteristics. It tells system planners how much the overall system load varies diurnally and seasonally. It is a very broad indicator. It also provides financial planners with information about how to spread fixed costs across energy sales. This will give financial planners and rate designers information to support greater unbundling of fixed and variable costs-a goal of competitive rate design.
Table 21. System Load Factor
Utilities Mean
(weighted) 1st Quartile Median 3rd Quartile Total 152 58.5% 61.4% 55.7% 62.0%
1. Customer Size Class 2,000 to 5,000 Customers 8 58.0% a 56.1% a 5,000 to 10,000 Customers 33 60.6 53.7% 57.2% 62.5 10,000 to 20,000 Customers 39 56.4 51.2 54.4 59.0 20,000 to 50,000 Customers 47 59.5 49.8 53.1 64.7 50,000 to 100,000 Customers 10 58.5 53.5 55.6 61.2 More than 100,000 Customers 15 58.3 55.2 57.9 61.7
2. Region Northeast 8 52.3 a 53.7 a Southeast 44 55.8 51.2 54.6 58.2
North Central/Plains 45 58.6 52.7 57.3 61.7 Southwest 19 56.2 47.1 55.3 62.9
West 36 63.8 52.5 61.0 71.4 a Quartiles are not calculated for fewer than 9 responses
35
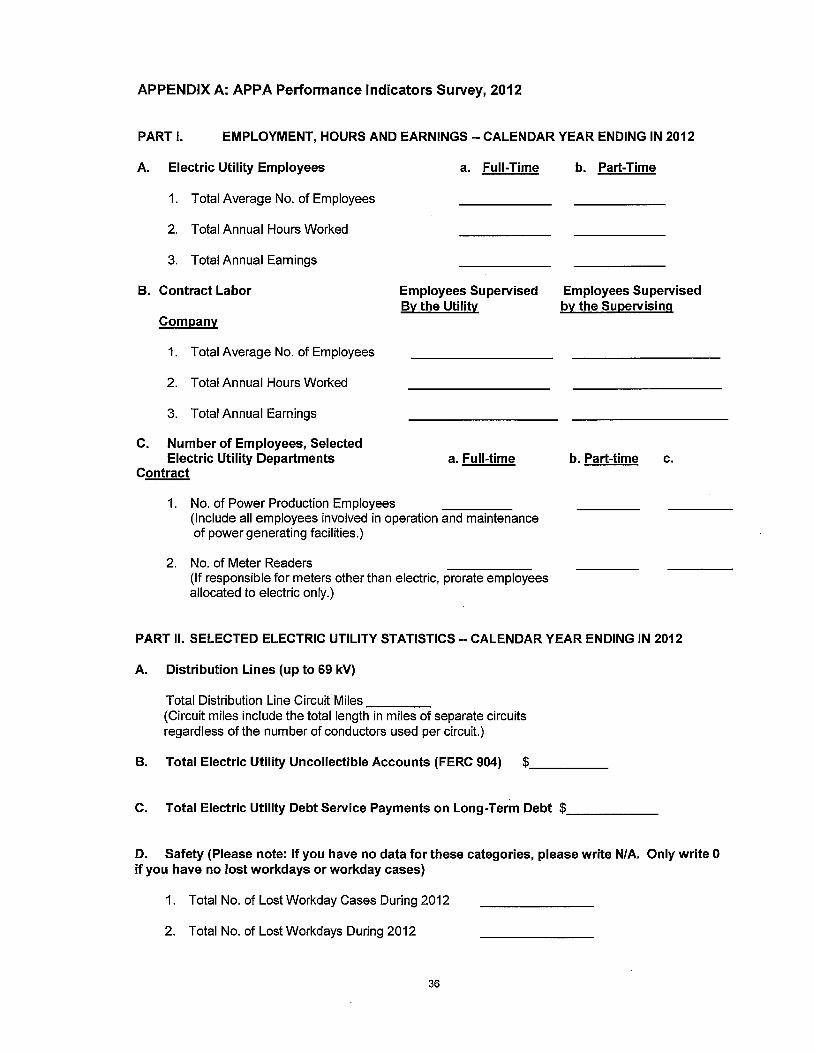
APPENDIX A: APPA Performance Indicators Survey, 2012
PART I. EMPLOYMENT, HOURS AND EARNINGS - CALENDAR YEAR ENDING IN 2012
A. Electric Utility Employees a. Full-Time b. Part-Time
1. Total Average No. of Employees
2. Total Annual Hours Worked
3. Total Annual Earnings
B. Contract Labor
Company
1. Total Average No. of Employees
2. Total Annual Hours Worked
3. Total Annual Earnings
C. Number of Employees, Selected Electric Utility Departments a. Full-time b. Part-time c.
Contract
1. No. of Power Production Employees (Include all employees involved in operation and maintenance of power generating facilities.)
2. No. of Meter Readers (If responsible for meters other than electric, prorate employees allocated to electric only.)
PART II. SELECTED ELECTRIC UTILITY STATISTICS - CALENDAR YEAR ENDING IN 2012
A. Distribution Lines (up to 69 kV)
Total Distribution Line Circuit Miles (Circuit miles include the total length in miles of separate circuits regardless ofthe number of conductors used per circuit.)
B. Total Electric Utility Uncollectible Accounts (FERC 904) $
C. Total Electric Utility Debt Service Payments on Long-Term Debt $
D. Safety (Please note: If you have no data for these categories, please write N/A. Only write 0 if you have no lost workdays or workday cases)
1. Total No. of Lost Workday Cases During 2012
2. Total No. of Lost Workdays During 2012
Employees Supervised Employees Supervised By the Utility by the Supervising
36

Part I!!. Financial Data
Special Instructions: In order to help you more accurately complete this section, we have included these checks to perform to ensure that accurate numbers are given.
Line 2 must be greater than line 5 Line 12 must be equal to or greater than line 11 Lines 12 through 16 must be equal to line 17 Remember that lines 12-17 include both operations AND maintenance Neither line 14, line 15, nor line 16 can be zero Report full dollar amounts, rounding to the nearest dollars.
Balance Sheet Report full numbers (NOT in OOP's)
Asset Side
1. Total Current and Accrued Assets
2. Total Assets and Other Debits
Liability Side
3. Long-Term Debt: Bonds
4. Long-Term Debt: Total Long-Term Debt
5. Total Current and Accrued Liabilities Selected Income Statement Items
6. Electric Operating Revenue (Must include only revenue
from sales to ultimate consumers and sales for resale)
7. Depreciation Expenses
8. Electric Income (Electric operating income and other Electric income 9. Interest payment on Long-Term Debt paid during fiscal year (Include the amount of interest on outstanding long-term debt issued or assumed by the utility)
10. Net Income (Electric Income Minus Deductions)
37
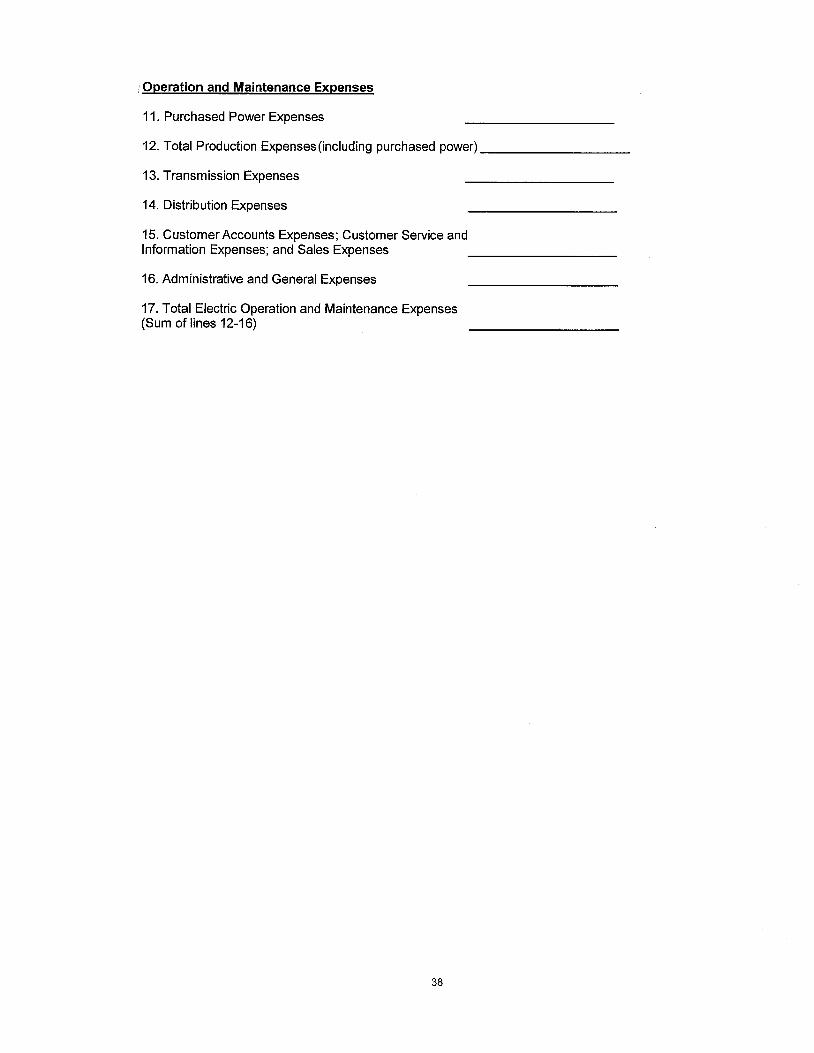
Operation and Maintenance Expenses
11. Purchased Power Expenses
12. Total Production Expenses (including purchased power)
13. Transmission Expenses
14. Distribution Expenses
15. Customer Accounts Expenses; Customer Service and Information Expenses; and Sales Expenses
16. Administrative and General Expenses
17. Total Electric Operation and Maintenance Expenses (Sum of lines 12-16)
38

APPENDIX B
DATA SOURCES AND COMPUTATIONAL PROCEDURES
The financial and operating ratios in this report are calculated using data from the APPA Performance Indicators Survey, 2011. The APPA Survey includes data on employees, hours worked, earnings, distribution lines, reliability, lost workdays, uncollectible accounts. It also includes financial data formerly reported on Form EIA-412, including balance sheet, income statement and operation and maintenance expense information, as well as data on revenues, kilowatt-hour sales and customers as reported on the U.S. Department of Energy, Energy Information Administration (EIA) Form EIA-861
The list below contains data sources and computational procedures for each of the ratios in the report. Definitions are found within the body of the report. All data are for 2011.
1. Revenue per kWh (Dollars)
a. All Retail Customers
EIA Form 861, Schedule 4. Part A. Total Revenue, (column e) EIA Form 861, Schedule 4, Part A, Total Megawatthours (column e)
b. Residential Customers
EIA Form 861. Schedule 4, Part A. Residential Revenue (column a)
EIA Form 861, Schedule 4, Part A, Residential Megawatthours (column a)
c. Commercial Customers
EIA Form 861, Schedule 4. Part A, Commercial Revenue (column b)
EIA Form 861, Schedule 4, Part A, Commercial Megawatthours (column b)
d. Industrial Customers
EIA Form 861. Schedule 4. Part A. Industrial Revenue (column c) EIA Form 861, Schedule 4, Part A, Industrial Megawatthours (column c)
2. Debt to Total Assets - (Long Term Debt + Current and Accrued Liabilities to Total Assets)
(APPA Survey, part III, line 4) + (APPA Survey, part III, line 5) APPA Survey, part III, line 2
3. Operating Ratio - (Total Electric O&M Expense to Total Electric Revenue)
APPA Survey, part III, line 17 APPA Survey, part III, line 6
39

4. Current Ratio - (Current & Accrued Assets to Current & Accrued Liabilities)
APPA Survey, part III, line 1 APPA Survey, part III, line 5
5a. Times Interest Earned - (Net Electric Utility Income + Interest on Long Term Debt to Interest on Long Term Debt)
(APPA Survey, part III, line 10) + (APPA Survey, part III, line 9) APPA Survey, part III, line 9
5b. Debt Service Coverage - (Electric Utility Income + Depreciation to Total Electric Utility Debt Service Payments on Long-term Debt)
(APPA Survey, part III, line 8) + (APPA Survey, part III, line 7) APPA Survey, Part II, Section C
6. Net Income per Revenue Dollar
APPA Survey, part III, line 10 APPA Survey, part III, line 6
7. Uncollectible accounts per Revenue Dollar
APPA Survey, Part II, Section B, Uncollectible Accounts APPA Survey, part III, line 6
8. Retail Customers per Non-power-generation Employee
EIA Form 861, Schedule 4, Part A Total number of customers (column e) Employees - Power Production Employees (APPA Survey, Part I)
Employees = Full Time + Part Time/2 + all contract employees (supervised by utility and supervised by contractor)
9. Total O & M Expense per kWh Sold
APPA Survey, part III, line 17 (EIA Form 861, Schedule 2, Part B, line 11 + line 12) *1000
10. Total O & M Expense (Excluding Power Supply Expense) per Retail Customer
(APPA Survey, part III, line 17) - (APPA Survey, part III, line 12) EIA Form 861, Schedule 4, Part A, Total number of customers (column e)
40

Total Power Supply Expense per kWh Sold
APPA Survey, part III, line 12 (EIA Form 861, Schedule 2, Part B, line 11 + line 12) *1000
Purchased Power Cost per kWh
APPA Survey, part III, line 11 (EIA Form 861, Schedule 2, Part B, line 2 ) * 1000
Retail Customers per Meter Reader
EIA Form 861, Schedule 4, part A, Total number of customers (column e) Meter Readers (from APPA Survey, Part I, Section C
(Number of Meter Readers = Full Time + Part Time/2 + Contract)
14. Distribution O & M Expenses per Retail Customer
APPA Survey, part III, line 14 EIA Form 861, Schedule 4, Part A, Total number of customers (column e)
15. Distribution O & M Expenses per Circuit Mile
APPA Survey, part III, line 14 APPA Survey, Part II, Section A, Total Distribution Line Circuit Miles
16. Customer Accounting, Customer Service and Sales Expense per Retail Customer
APPA Survey, part III, line 15 EIA Form 861, Schedule 4, Part A, Total number of customers (column e)
17. Administrative and General Expenses per Retail Customer
APPA Survey, part III, line 16 EIA Form 861, Schedule 4, Part A, Total number of customers (column e)
18. Labor Expense per Worker-hour
Total Labor Expense (APPA Survey, Part I) Total Hours Worked (APPA Survey, Part I)
Labor Expense = Full-Time Earnings + Part-time Earnings + Contractor Earnings Hours Worked = Full-Time Hours + Part-Time Hours + Contractor Hours (supervised by utility and supervised by contractor)
12.

19. OSHA Incidence Rate (per 100 employees)
(APPA Survey. Part II. Section D. Total Number of Lost Workday Cases) * 200,000 Number of Hours Worked (APPA Survey, Part I)
Hours Worked = Full Time Hours + Part Time Hours + Contract Hours (Supervised by utility only).
20. Energy Loss Percentage - Total Energy Losses to Total Sources of Energy
EIA Form 861. Schedule 2, Part B, line 15 EIA Form 861, Schedule 2, Part B, line 10
To express as a percent, multiply the result by 100.
21. System Load Factor - ((Total Sales + Total Energy Losses) / 8760 hrs./yr.) / Highest Hourly Peak Demand
EIA Form 861. Schedule 2 Part B (line 11 + line 12 + line 15) / 8760 (EIA Form 861, Schedule 2, Part A, line 6)
To express as a percent, multiply the result by 100.
42

APPENDIX C - REGIONAL DEFINITIONS
The regions used for this report correspond to regions of the North American Electric Reliability Council (NERC) as specified below.
"Region" Northeast
Southeast
Corresponding NERC Region(s) NPCC - Northeast Power Coordinating Council
SERC - Southeastern Electric Reliability Council FRCC - Florida Reliability Coordinating Council
North Central/ Plains*
MRO - Midwest Reliability Organization RFC - Reliability First Corporation
Southwest SPP - Southwest 3ower Pool TRE - Texas Reli bility Entity
West WECC-Western Electricity Coordinating Council ASCC - Alaska S} stems Coordinating Council
*: MAIN, ECAR, and MAAC joined to become the "Relis lility First" NERC region, effective January 2006. However, the Energy Information Administration continues to identify utilities by their former NERC regions. APPA uses the former regions in establishing regional breakdowns to be consistent with prior reports.
43

APPENDIX D
UTILITIES INCLUDED IN THE 2012 REPORT
ALABAMA Decatur Utilities Huntsville Utilities
ARIZONA Electrical District No. 2 Pinal County Navajo Tribal Utility Authority Salt River Project
ARKANSAS Conway Corporation Hope, City of Jonesboro, City of North Little Rock, City of Paragould Light & Water Commission
CALIFORNIA Alameda, City of Anaheim, City of Lodi, City of Palo Alto, City of Redding, City of Riverside, City of Turlock Irrigation District
COLORADO Fort Collins, City of Longmont, City of Loveland, City of
CONNECTICUT Norwich, City of
FLORIDA Fort Pierce Utilities Authority Gainesville Regional Utilities JEA Key West, City of Kissimmee Utility Authority Tallahassee, City of
GEORGIA Calhoun, City of Crisp County Power Commission Marietta, City of
IDAHO
Idaho Falls, City of
ILLINOIS Springfield City Water, Light & Power
St. Charles, City of
INDIANA Lawrenceburg Municipal Utilities Lebanon, City of
IOWA Ames, City of Cedar Falls, City of Muscatine Power & Water Waverly Municipal Electric Utility
KANSAS Kansas City, City of McPherson, City of
KENTUCKY Franklin, City of
MASSACHUSETTS Braintree, Town of Holyoke, City of North Attleborough, Town of Taunton, Town of Westfield, Town of
MICHIGAN Bay City, City of Coldwater Board of Public Utilities Grand Haven, City of Holland, City of Lansing, City of Traverse City Light & Power Zeeland Board of Public Works
MINNESOTA Alexandria, City of Austin, City of Brainerd Public Utilities East Grand Forks, City of Elk River, City of Fairmont Public Utilities Commission Grand Rapids Public Utilities Commission Marshall, City of Moorhead, City of New Ulm Public Utilities Commission Owatonna, City of Shakopee Public Utilities Commission Willmar Municipal Utilities Commission Worthington, City of
44

MISSOURI Independence, City of Poplar Bluff, City of Rolla, City of Springfield, City of
NEBRASKA Cedar-Knox Public Power District Lincoln Electric System Loup River Public Power District Northeast Nebraska Public Power District Perennial Public Power District Southern Public Power District
NEW MEXICO Farmington, City of Los Alamos County
NEW YORK Massena, Town of Plattsburgh, City of
NORTH CAROLINA Fayetteville Public Works Commission Gastonia, City of Greenville Utilities Commission Rocky Mount, City of Shelby, City of Smithfield, Town of
OHIO Cuyahoga Falls, City of Hamilton, City of Hudson, City of Jackson, City of Orrville, City of Piqua, City of Westerville, City of
OKLAHOMA Stillwater Utilities Authority
OREGON Canby Utility Board Central Lincoln People's Utility District Columbia River People's Utility District Eugene, City of Northern Wasco Count People's Utility District Springfield, City of Tillamook People's Utility District
SOUTH CAROLINA Easley Combined Utility System Greenwood, City of South Carolina Public Service Authority
SOUTH DAKOTA Brookings, City of Watertown Municipal Utilities
TENNESSEE Athens Utility Board Bristol, City of Brownsville, City of Chattanooga Electric Power Board Columbia Power System Cookeville, City of Covington, City of Erwin, Town of Fayetteville, City of Jackson Energy Authority LaFollette, City of Lawrenceburg, City of Memphis Light, Gas, and Water Division Morristown, City of Nashville Electric Service Pulaski, City of
TEXAS Austin Energy Bryan, City of College Station, City of Denton, City of Floresville, City of Georgetown, City of GEUS (Greenville) Kerrville Public Utility Board
UTAH Logan, City of Murray, City of Springville, City of St. George, City of
VIRGINIA Bristol Virginia Utilities Danville, City of Harrisonburg, City of Manassas, City of Martinsville, City of
WASHINGTON Centralia, City of PUD No 1 of Benton County PUD No 1 of Clallam County PUD No 1 of Clark County PUD No 1 of Cowlitz County PUD No 1 of Grays Harbor County PUD No 1 of Lewis County PUD No 1 of Okanogan County PUD No 1 of Snohomish County
45

WASHINGTON continued PUD No 3 of Mason County Seattle, City of Tacoma, City of
WISCONSIN Kaukauna, City of Marshfield, City of Menasha, City of Wisconsin Rapids W W & L Comm